wap tquickstart
TRANSCRIPT

© 2007-2014 SoftLogica Inc.
Load testing with WAPT: Quick Start Guide
This document describes step by step how to create a simple typical test for a web application, execute it and interpret the results. A brief insight is provided on the additional features available in WAPT Pro, extension modules and the x64 Load Engine.
Load testing with WAPT: Quick Start Guide
2
Creating a test scenario We will start with creating a test scenario. It includes all the general parameters of the test, such as the number of virtual users, type of load and test duration.
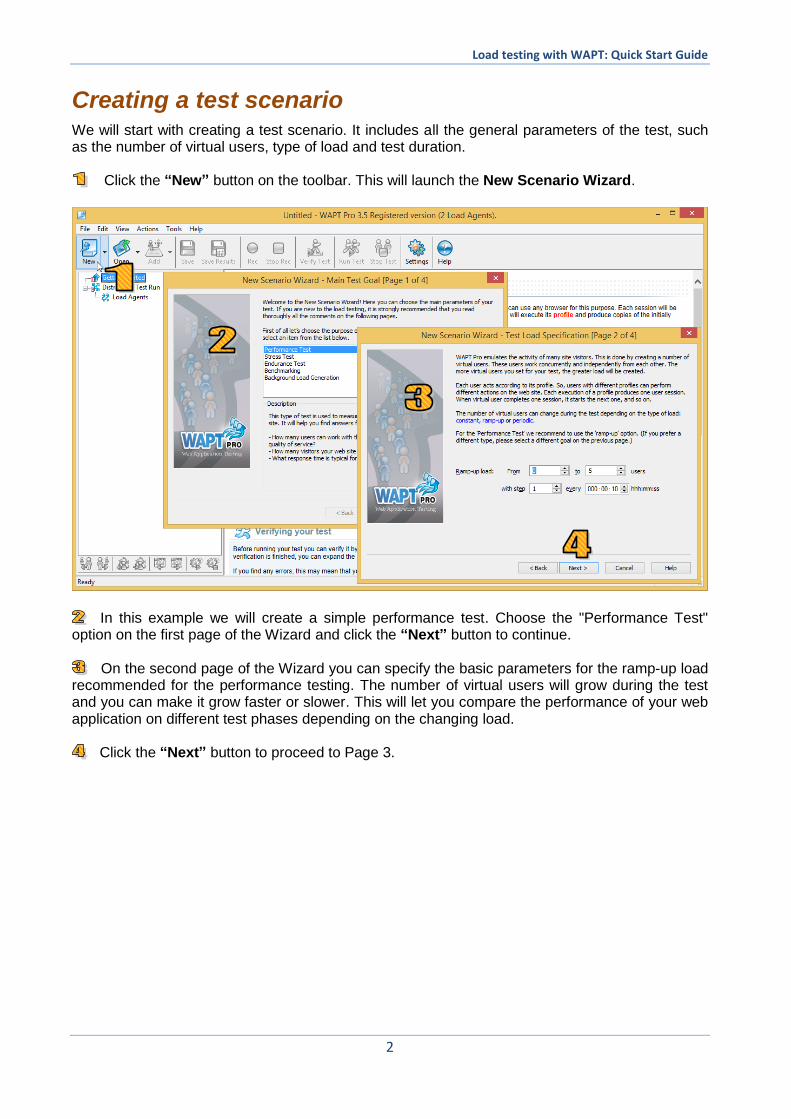
Click the “New” button on the toolbar. This will launch the New Scenario Wizard.
In this example we will create a simple performance test. Choose the "Performance Test" option on the first page of the Wizard and click the “Next” button to continue.
On the second page of the Wizard you can specify the basic parameters for the ramp-up load recommended for the performance testing. The number of virtual users will grow during the test and you can make it grow faster or slower. This will let you compare the performance of your web application on different test phases depending on the changing load.
Click the “Next” button to proceed to Page 3.
Load testing with WAPT: Quick Start Guide
3
Test duration options
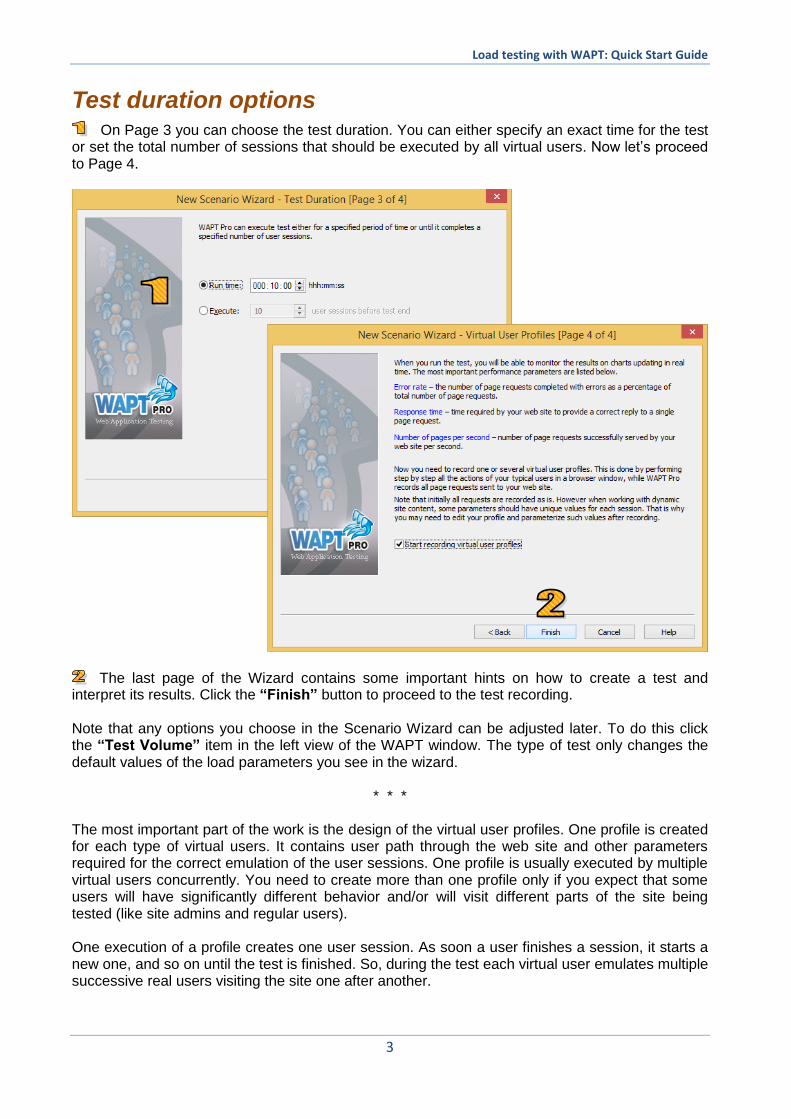
On Page 3 you can choose the test duration. You can either specify an exact time for the test or set the total number of sessions that should be executed by all virtual users. Now let’s proceed to Page 4.
The last page of the Wizard contains some important hints on how to create a test and
interpret its results. Click the “Finish” button to proceed to the test recording. Note that any options you choose in the Scenario Wizard can be adjusted later. To do this click the “Test Volume” item in the left view of the WAPT window. The type of test only changes the default values of the load parameters you see in the wizard.
* * * The most important part of the work is the design of the virtual user profiles. One profile is created for each type of virtual users. It contains user path through the web site and other parameters required for the correct emulation of the user sessions. One profile is usually executed by multiple virtual users concurrently. You need to create more than one profile only if you expect that some users will have significantly different behavior and/or will visit different parts of the site being tested (like site admins and regular users). One execution of a profile creates one user session. As soon a user finishes a session, it starts a new one, and so on until the test is finished. So, during the test each virtual user emulates multiple successive real users visiting the site one after another.
Load testing with WAPT: Quick Start Guide
4
Creating a virtual user profile Initially profiles are recorded with the help of a browser. You should simply perform step by step all the actions of the user that you want to emulate. WAPT will record everything in the form of HTTP requests. During the test WAPT will execute multiple copies of the recorded session by sending the same sequence of requests with modified parameters. This modification is also called “parameterization”. It is required because some parameters should have different values in each emulated user session.
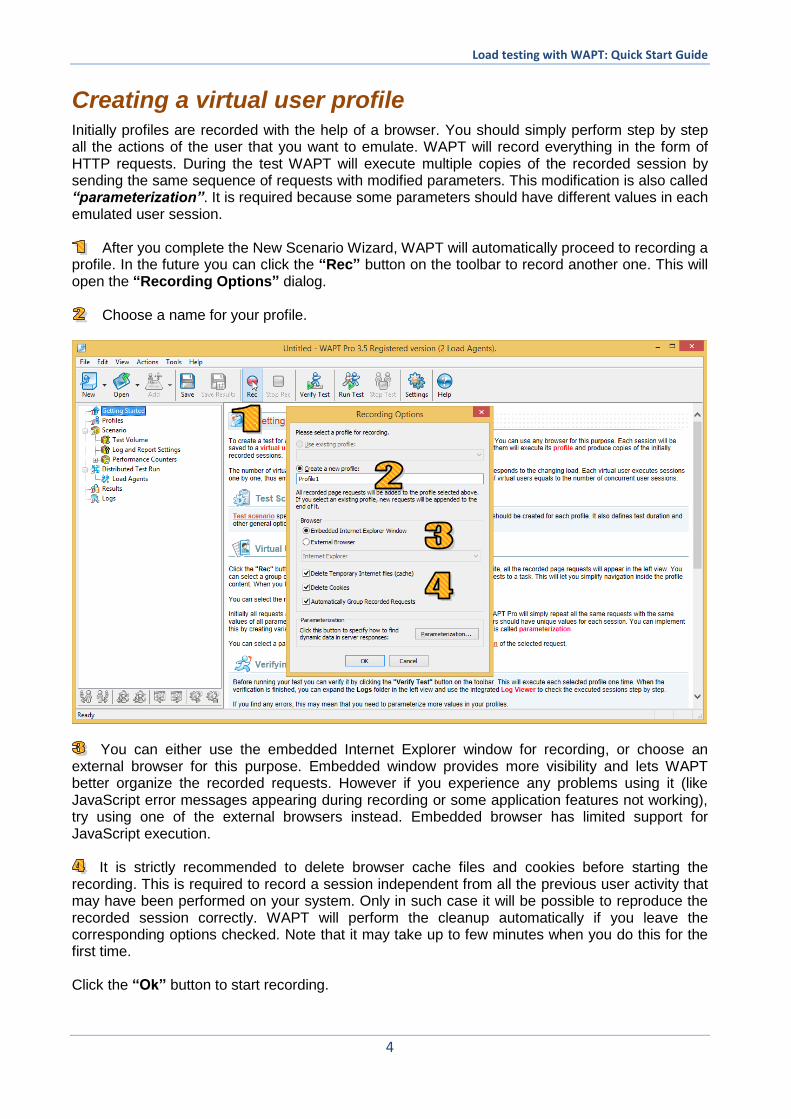
After you complete the New Scenario Wizard, WAPT will automatically proceed to recording a profile. In the future you can click the “Rec” button on the toolbar to record another one. This will open the “Recording Options” dialog.
Choose a name for your profile.
You can either use the embedded Internet Explorer window for recording, or choose an
external browser for this purpose. Embedded window provides more visibility and lets WAPT better organize the recorded requests. However if you experience any problems using it (like JavaScript error messages appearing during recording or some application features not working), try using one of the external browsers instead. Embedded browser has limited support for JavaScript execution.
It is strictly recommended to delete browser cache files and cookies before starting the recording. This is required to record a session independent from all the previous user activity that may have been performed on your system. Only in such case it will be possible to reproduce the recorded session correctly. WAPT will perform the cleanup automatically if you leave the corresponding options checked. Note that it may take up to few minutes when you do this for the first time. Click the “Ok” button to start recording.
Load testing with WAPT: Quick Start Guide
5
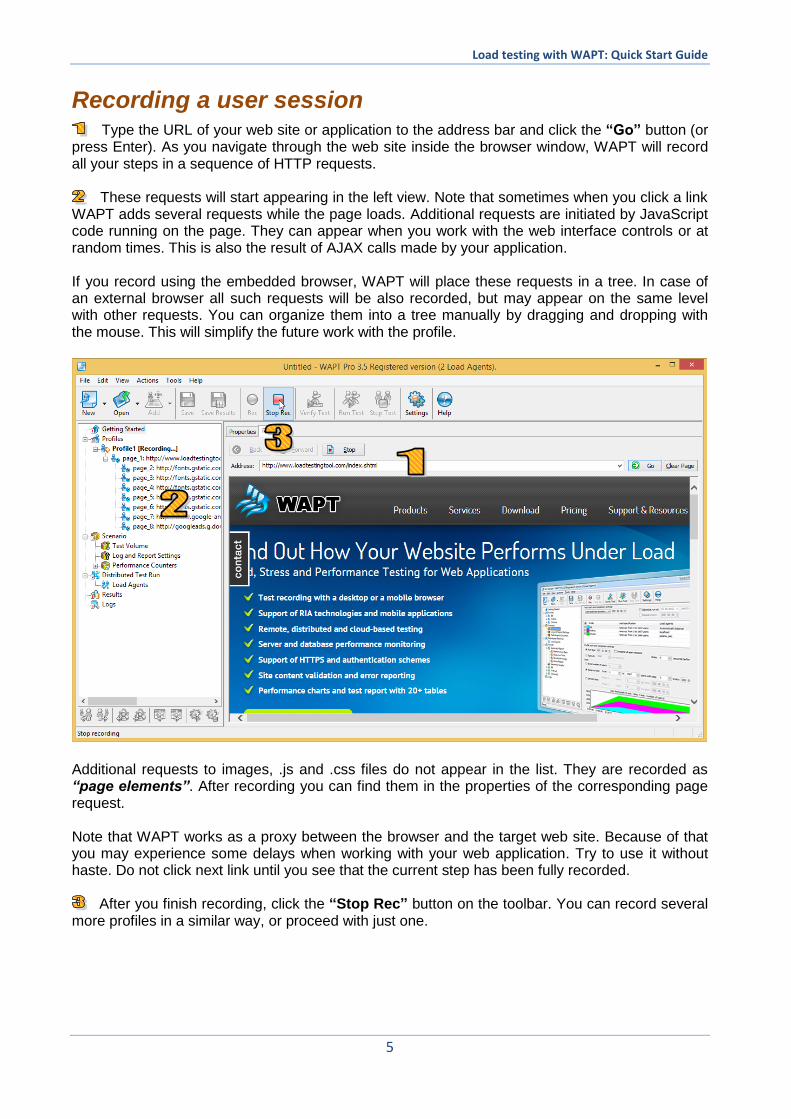
Recording a user session Type the URL of your web site or application to the address bar and click the “Go” button (or
press Enter). As you navigate through the web site inside the browser window, WAPT will record all your steps in a sequence of HTTP requests.
These requests will start appearing in the left view. Note that sometimes when you click a link WAPT adds several requests while the page loads. Additional requests are initiated by JavaScript code running on the page. They can appear when you work with the web interface controls or at random times. This is also the result of AJAX calls made by your application. If you record using the embedded browser, WAPT will place these requests in a tree. In case of an external browser all such requests will be also recorded, but may appear on the same level with other requests. You can organize them into a tree manually by dragging and dropping with the mouse. This will simplify the future work with the profile.
Additional requests to images, .js and .css files do not appear in the list. They are recorded as “page elements”. After recording you can find them in the properties of the corresponding page request. Note that WAPT works as a proxy between the browser and the target web site. Because of that you may experience some delays when working with your web application. Try to use it without haste. Do not click next link until you see that the current step has been fully recorded.
After you finish recording, click the “Stop Rec” button on the toolbar. You can record several
more profiles in a similar way, or proceed with just one.

Load testing with WAPT: Quick Start Guide
6
Properties of a request and its parameterization Select a request in the left view. The right view will contain two tabs. The “Properties” tab is
where you can view and edit the properties of the selected request.
The most important property is the list of parameters. These parameters deliver session-specific data from the client part of your web application to the server. For example, many applications send user name and password as parameters of the login request. There are no standard names and meanings for all parameters. Each web application can use its own custom ones to pass its specific data. The number of parameters, their names and values may be different for each request. Initially all parameters have static values that were used in the recorded session. However you can change this. For example, if you need each virtual user in your test to use a different name and password, you can do this with the help of special WAPT functions. This is called “Parameterization”. The understanding of this concept is very important for successful use of any load testing tool, including WAPT. To edit any parameter, select it in the list and click the “Edit” button to the right of the list (or just double-click the parameter line).
In the “Edit Parameter” dialog box you can specify how to calculate the value for the selected parameter. In the example shown on the screenshot above the value of the parameter is calculated with the help of the “Ordered List” function that takes one of three names from the list. You can specify longer list to have more samples, or provide a file with values instead. Other functions can generate random values, extract them from server responses and use variables assigned earlier.
Load testing with WAPT: Quick Start Guide
7
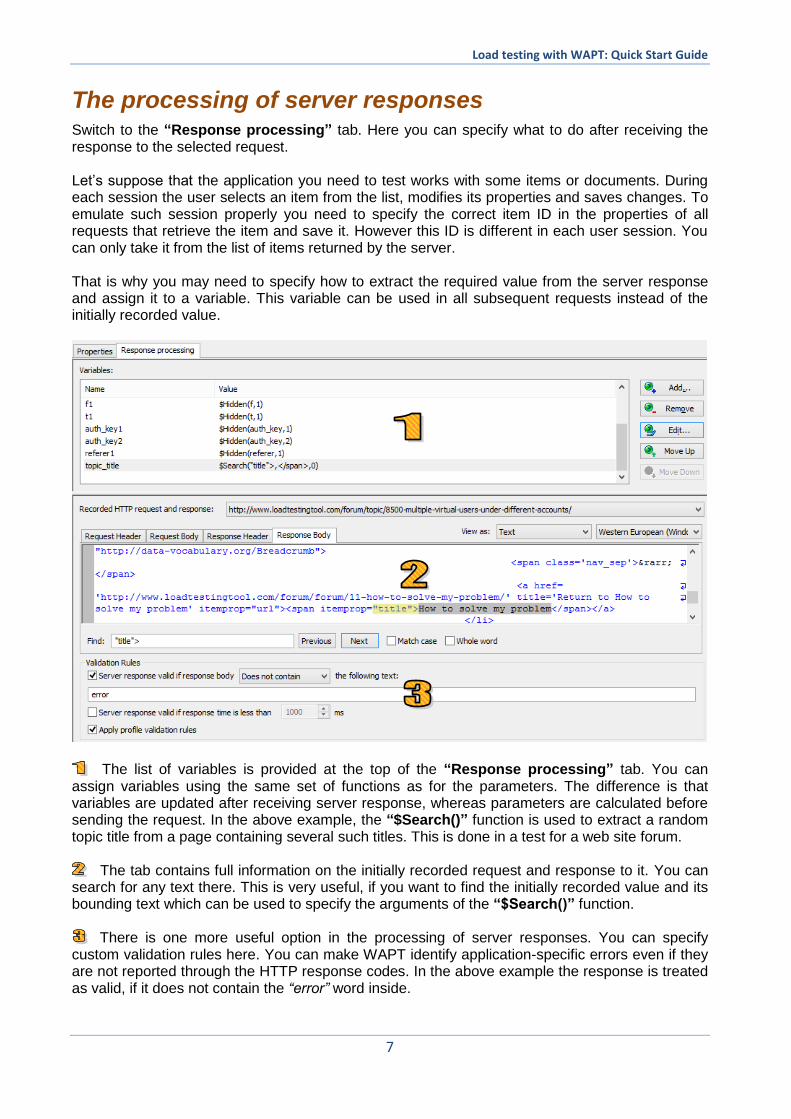
The processing of server responses Switch to the “Response processing” tab. Here you can specify what to do after receiving the response to the selected request. Let’s suppose that the application you need to test works with some items or documents. During each session the user selects an item from the list, modifies its properties and saves changes. To emulate such session properly you need to specify the correct item ID in the properties of all requests that retrieve the item and save it. However this ID is different in each user session. You can only take it from the list of items returned by the server. That is why you may need to specify how to extract the required value from the server response and assign it to a variable. This variable can be used in all subsequent requests instead of the initially recorded value.
The list of variables is provided at the top of the “Response processing” tab. You can assign variables using the same set of functions as for the parameters. The difference is that variables are updated after receiving server response, whereas parameters are calculated before sending the request. In the above example, the “$Search()” function is used to extract a random topic title from a page containing several such titles. This is done in a test for a web site forum.
The tab contains full information on the initially recorded request and response to it. You can
search for any text there. This is very useful, if you want to find the initially recorded value and its bounding text which can be used to specify the arguments of the “$Search()” function.
There is one more useful option in the processing of server responses. You can specify
custom validation rules here. You can make WAPT identify application-specific errors even if they are not reported through the HTTP response codes. In the above example the response is treated as valid, if it does not contain the “error” word inside.
Load testing with WAPT: Quick Start Guide
8
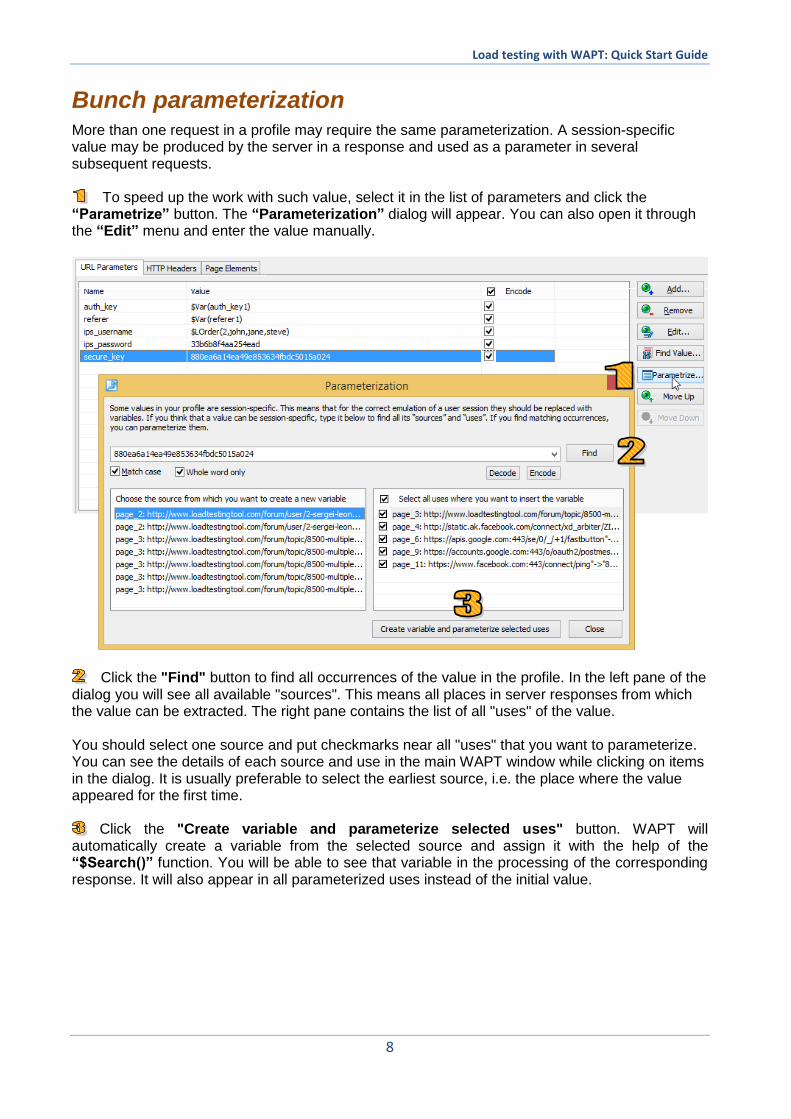
Bunch parameterization More than one request in a profile may require the same parameterization. A session-specific value may be produced by the server in a response and used as a parameter in several subsequent requests.
To speed up the work with such value, select it in the list of parameters and click the
“Parametrize” button. The “Parameterization” dialog will appear. You can also open it through the “Edit” menu and enter the value manually.
Click the "Find" button to find all occurrences of the value in the profile. In the left pane of the dialog you will see all available "sources". This means all places in server responses from which the value can be extracted. The right pane contains the list of all "uses" of the value. You should select one source and put checkmarks near all "uses" that you want to parameterize. You can see the details of each source and use in the main WAPT window while clicking on items in the dialog. It is usually preferable to select the earliest source, i.e. the place where the value appeared for the first time.
Click the "Create variable and parameterize selected uses" button. WAPT will automatically create a variable from the selected source and assign it with the help of the “$Search()” function. You will be able to see that variable in the processing of the corresponding response. It will also appear in all parameterized uses instead of the initial value.
Load testing with WAPT: Quick Start Guide
9
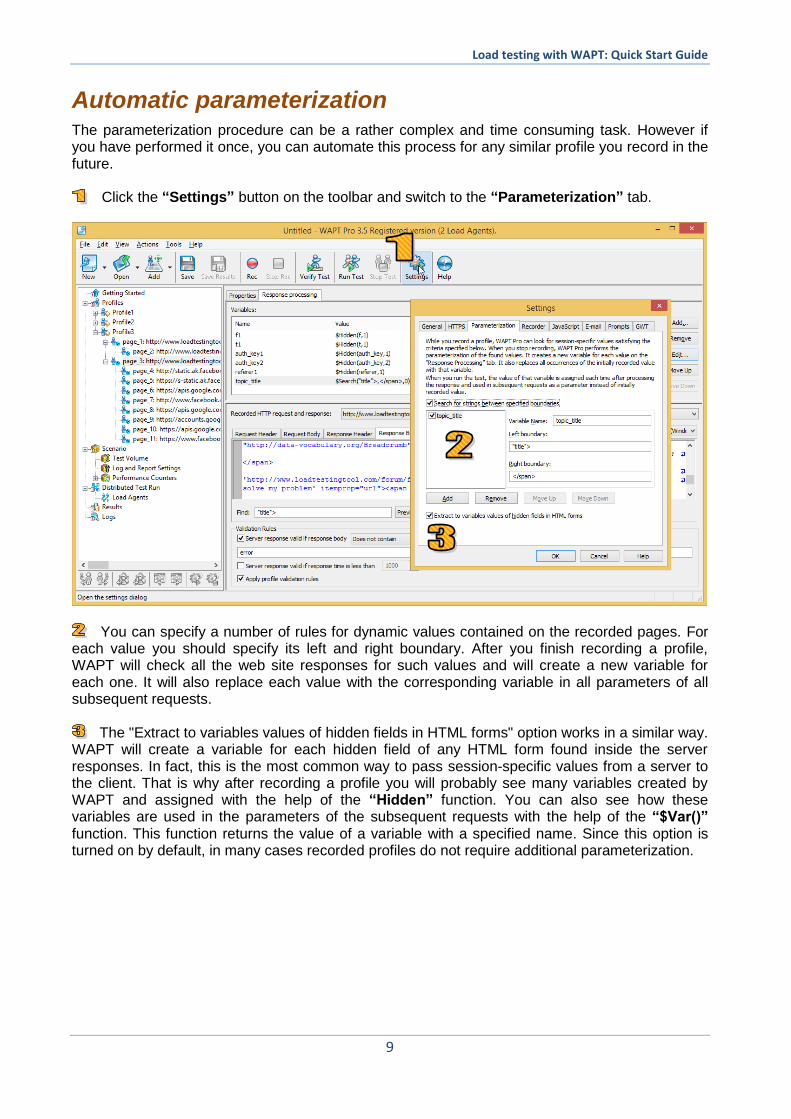
Automatic parameterization The parameterization procedure can be a rather complex and time consuming task. However if you have performed it once, you can automate this process for any similar profile you record in the future.
Click the “Settings” button on the toolbar and switch to the “Parameterization” tab.
You can specify a number of rules for dynamic values contained on the recorded pages. For
each value you should specify its left and right boundary. After you finish recording a profile, WAPT will check all the web site responses for such values and will create a new variable for each one. It will also replace each value with the corresponding variable in all parameters of all subsequent requests.
The "Extract to variables values of hidden fields in HTML forms" option works in a similar way.
WAPT will create a variable for each hidden field of any HTML form found inside the server responses. In fact, this is the most common way to pass session-specific values from a server to the client. That is why after recording a profile you will probably see many variables created by WAPT and assigned with the help of the “Hidden” function. You can also see how these variables are used in the parameters of the subsequent requests with the help of the “$Var()” function. This function returns the value of a variable with a specified name. Since this option is turned on by default, in many cases recorded profiles do not require additional parameterization.
Load testing with WAPT: Quick Start Guide
10
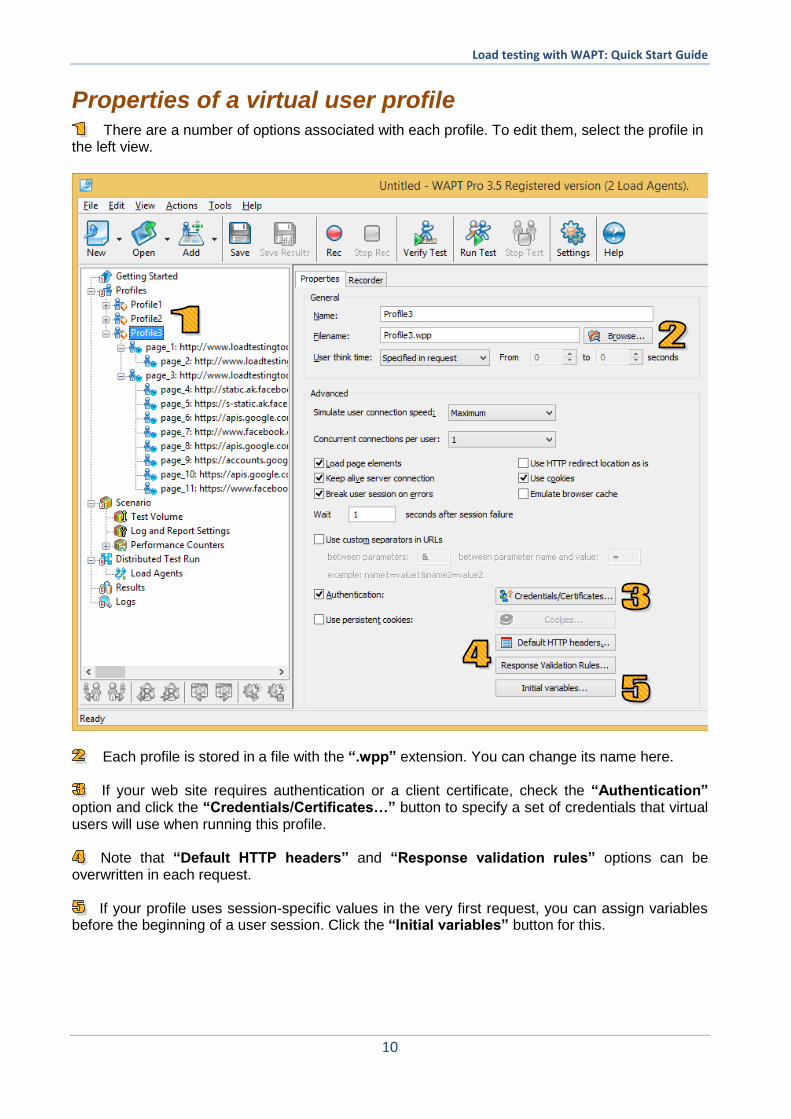
Properties of a virtual user profile There are a number of options associated with each profile. To edit them, select the profile in
the left view.
Each profile is stored in a file with the “.wpp” extension. You can change its name here.
If your web site requires authentication or a client certificate, check the “Authentication” option and click the “Credentials/Certificates…” button to specify a set of credentials that virtual users will use when running this profile.
Note that “Default HTTP headers” and “Response validation rules” options can be overwritten in each request.
If your profile uses session-specific values in the very first request, you can assign variables before the beginning of a user session. Click the “Initial variables” button for this.
Load testing with WAPT: Quick Start Guide
11
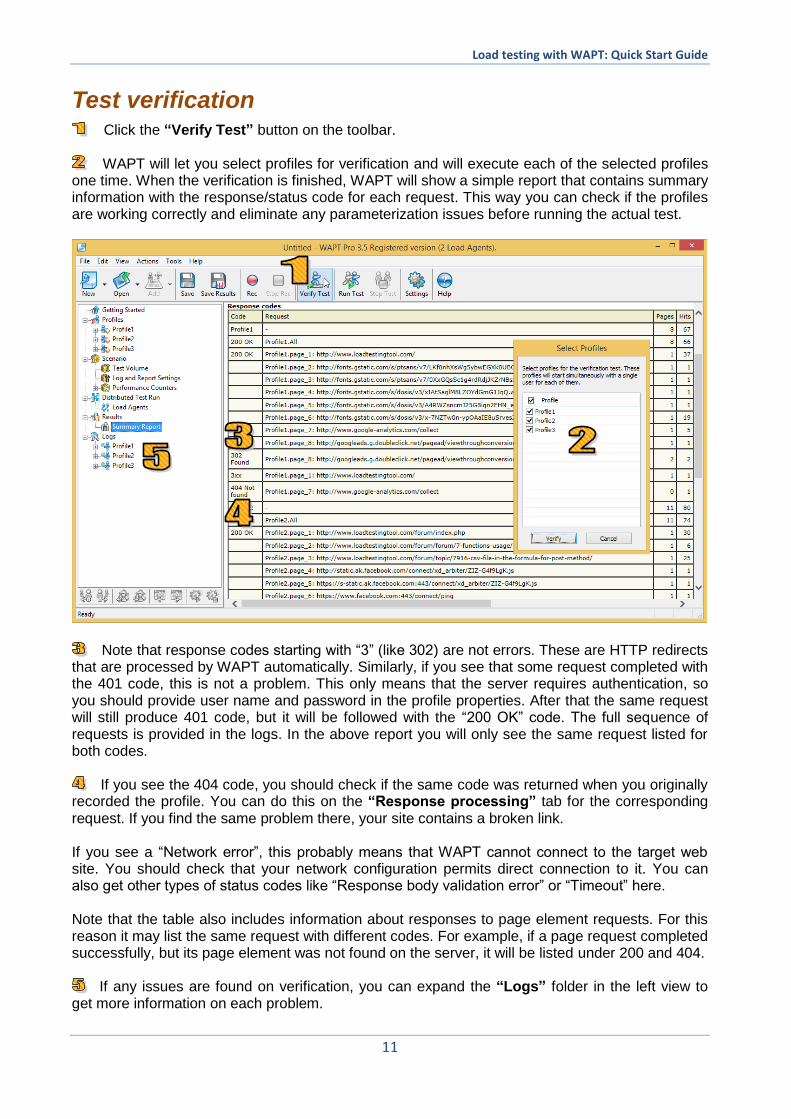
Test verification Click the “Verify Test” button on the toolbar.
WAPT will let you select profiles for verification and will execute each of the selected profiles
one time. When the verification is finished, WAPT will show a simple report that contains summary information with the response/status code for each request. This way you can check if the profiles are working correctly and eliminate any parameterization issues before running the actual test.
Note that response codes starting with “3” (like 302) are not errors. These are HTTP redirects that are processed by WAPT automatically. Similarly, if you see that some request completed with the 401 code, this is not a problem. This only means that the server requires authentication, so you should provide user name and password in the profile properties. After that the same request will still produce 401 code, but it will be followed with the “200 OK” code. The full sequence of requests is provided in the logs. In the above report you will only see the same request listed for both codes.
If you see the 404 code, you should check if the same code was returned when you originally
recorded the profile. You can do this on the “Response processing” tab for the corresponding request. If you find the same problem there, your site contains a broken link. If you see a “Network error”, this probably means that WAPT cannot connect to the target web site. You should check that your network configuration permits direct connection to it. You can also get other types of status codes like “Response body validation error” or “Timeout” here. Note that the table also includes information about responses to page element requests. For this reason it may list the same request with different codes. For example, if a page request completed successfully, but its page element was not found on the server, it will be listed under 200 and 404.
If any issues are found on verification, you can expand the “Logs” folder in the left view to get more information on each problem.
Load testing with WAPT: Quick Start Guide
12
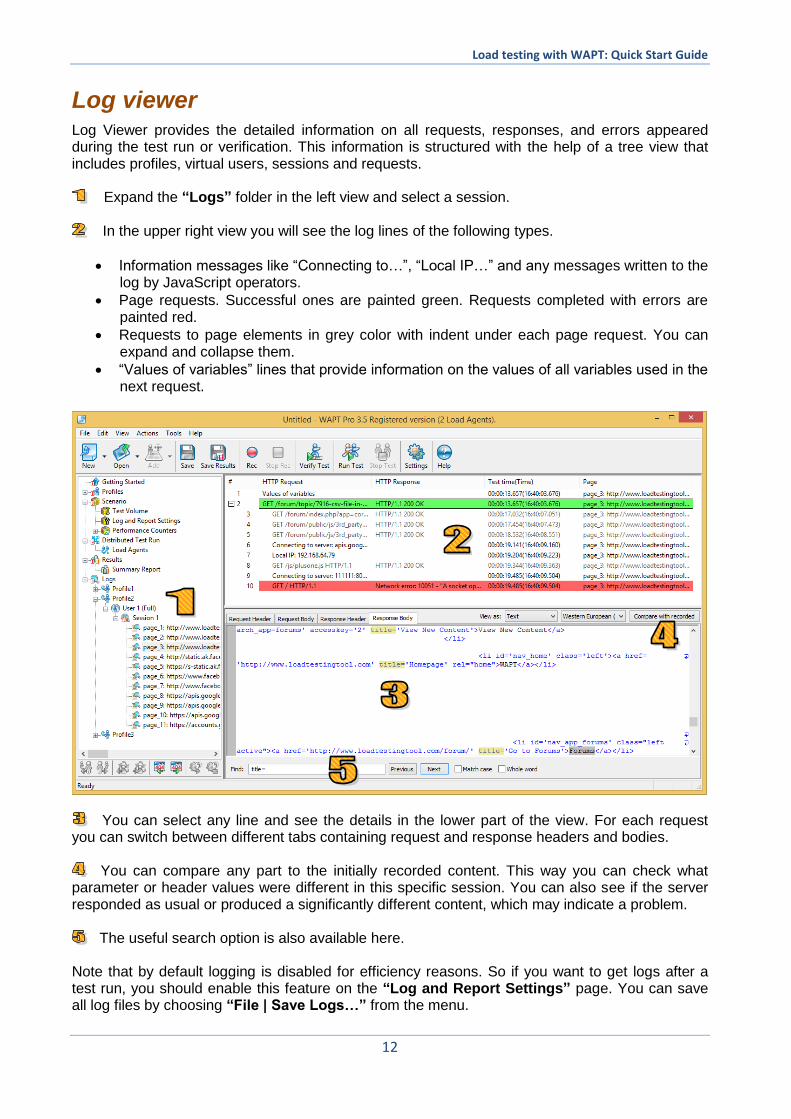
Log viewer Log Viewer provides the detailed information on all requests, responses, and errors appeared during the test run or verification. This information is structured with the help of a tree view that includes profiles, virtual users, sessions and requests.
Expand the “Logs” folder in the left view and select a session.
In the upper right view you will see the log lines of the following types.
Information messages like “Connecting to…”, “Local IP…” and any messages written to the log by JavaScript operators.
Page requests. Successful ones are painted green. Requests completed with errors are painted red.
Requests to page elements in grey color with indent under each page request. You can expand and collapse them.
“Values of variables” lines that provide information on the values of all variables used in the next request.
You can select any line and see the details in the lower part of the view. For each request
you can switch between different tabs containing request and response headers and bodies. You can compare any part to the initially recorded content. This way you can check what
parameter or header values were different in this specific session. You can also see if the server responded as usual or produced a significantly different content, which may indicate a problem.
The useful search option is also available here. Note that by default logging is disabled for efficiency reasons. So if you want to get logs after a test run, you should enable this feature on the “Log and Report Settings” page. You can save all log files by choosing “File | Save Logs…” from the menu.

Load testing with WAPT: Quick Start Guide
13
Test Volume
After you make sure that all your profiles are working correctly you can specify the load parameters for the actual test.
Select the “Test Volume” item in the left view inside the “Scenario” folder.
In the right view you can see the list of all your profiles. Check the ones you want to use in the test.
You can specify certain load options separately for each profile. Note that these options are
shown for the currently selected profile (highlighted with blue selection). If you want to edit options of a different one, select it in the list. In the above example, we have 3 profiles with different types of load (constant, growing and periodic). Second profile (with the rump-up load) is selected and its options are shown below the list.
The graph at the bottom of the page shows how the load will be distributed between profiles
during the test. Each profile is shown with a different color.
In the Pro version of the product you can also specify different load agents for different profiles. By default virtual users are allocated to agents automatically, which means that all agents execute all profiles.
Now we have finished designing our test, so we can save it. Click the “Save” button on the toolbar to save your test scenario to a file. All profiles will be also saved to separate files in the same folder. Keep all these files, if you want to open the same test in the future.
Load testing with WAPT: Quick Start Guide
14
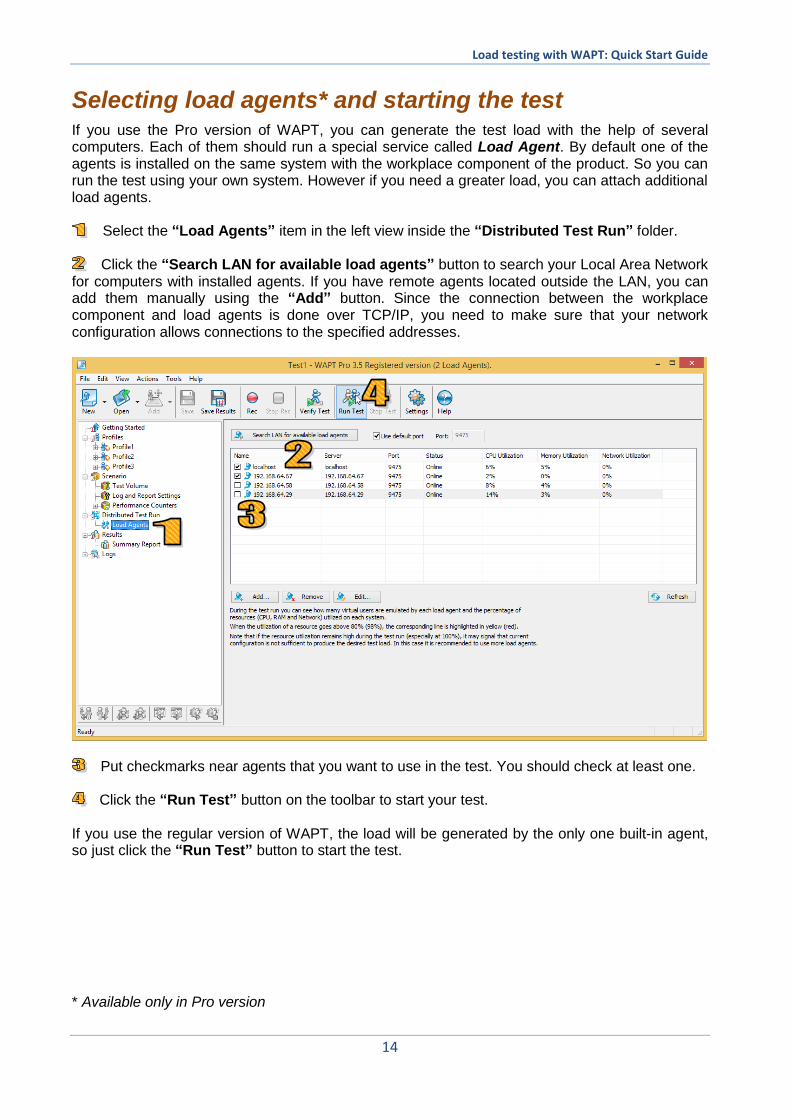
Selecting load agents* and starting the test
If you use the Pro version of WAPT, you can generate the test load with the help of several computers. Each of them should run a special service called Load Agent. By default one of the agents is installed on the same system with the workplace component of the product. So you can run the test using your own system. However if you need a greater load, you can attach additional load agents.
Select the “Load Agents” item in the left view inside the “Distributed Test Run” folder. Click the “Search LAN for available load agents” button to search your Local Area Network
for computers with installed agents. If you have remote agents located outside the LAN, you can add them manually using the “Add” button. Since the connection between the workplace component and load agents is done over TCP/IP, you need to make sure that your network configuration allows connections to the specified addresses.
Put checkmarks near agents that you want to use in the test. You should check at least one.
Click the “Run Test” button on the toolbar to start your test.
If you use the regular version of WAPT, the load will be generated by the only one built-in agent, so just click the “Run Test” button to start the test. * Available only in Pro version
Load testing with WAPT: Quick Start Guide
15
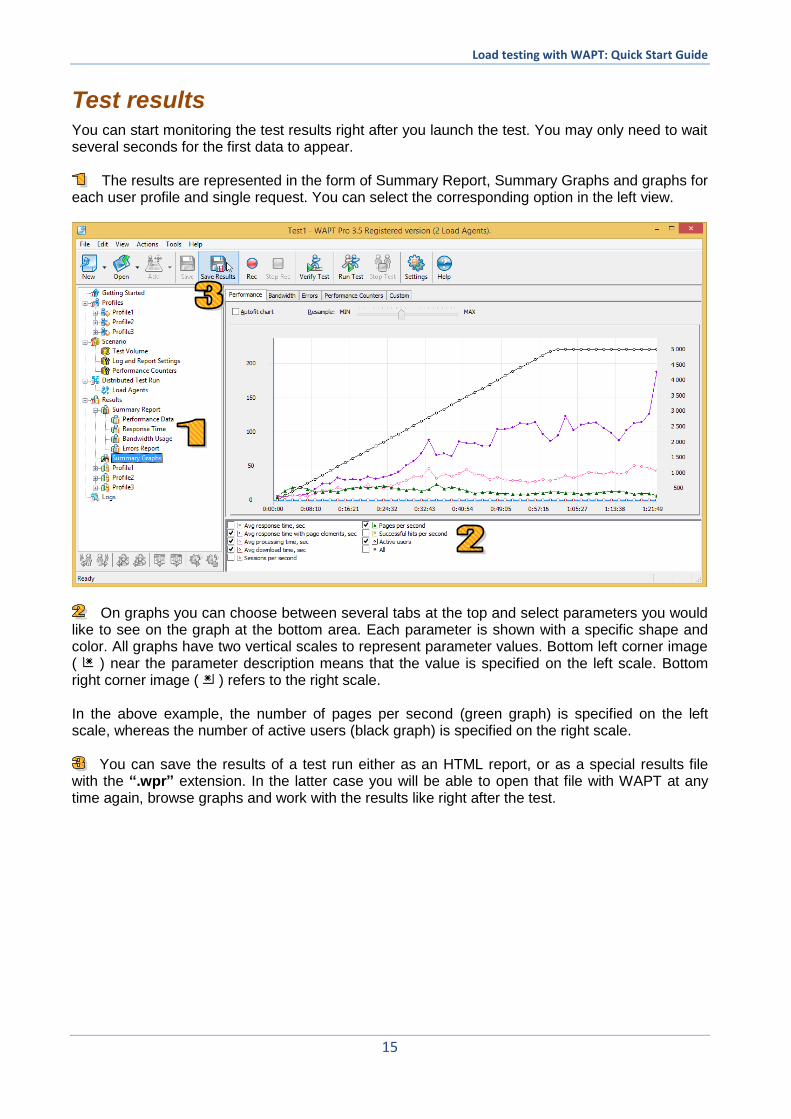
Test results You can start monitoring the test results right after you launch the test. You may only need to wait several seconds for the first data to appear.
The results are represented in the form of Summary Report, Summary Graphs and graphs for each user profile and single request. You can select the corresponding option in the left view.
On graphs you can choose between several tabs at the top and select parameters you would
like to see on the graph at the bottom area. Each parameter is shown with a specific shape and color. All graphs have two vertical scales to represent parameter values. Bottom left corner image ( ) near the parameter description means that the value is specified on the left scale. Bottom right corner image ( ) refers to the right scale. In the above example, the number of pages per second (green graph) is specified on the left scale, whereas the number of active users (black graph) is specified on the right scale.
You can save the results of a test run either as an HTML report, or as a special results file with the “.wpr” extension. In the latter case you will be able to open that file with WAPT at any time again, browse graphs and work with the results like right after the test.

Load testing with WAPT: Quick Start Guide
16
Extension Modules WAPT can test any web application that uses HTTP(s) protocol for client-server communication. It is not usually important which framework and technologies were used to create the application and what hardware and software is used to run its components. Still there are two situations in which you may benefit from using modules that provide extended support for some specific technologies. The following modules facilitate the test design process.
Module for ASP.net Testing
Modules for JSON Format With the help of these modules you will be able to create your tests faster and in a more convenient environment. Both modules are optional, but we recommend installing them in case your web application uses the corresponding technology. Some web technologies allow applications to pass data between the client and the server parts using complex technology-specific structures. To perform conversion of such structures to and from standard XML format, the following modules are required.
Module for Adobe Flash Testing
Module for Silverlight Testing
Module for GWT Testing With the help of these modules you will be able to parameterize any session-specific values appearing in the test of an application using the corresponding technology. It is very easy to find out if you need a specific module to test your web application. When you finish recording a test with WAPT, it will show you a warning message with recommendations.
Each of the modules is provided with a separate installation package, but the integration is very smooth. You only need to install the module to the same system where you run WAPT or WAPT Pro workplace.

Load testing with WAPT: Quick Start Guide
17
The use of JavaScript* You can insert execution of your JavaScript inside the user sessions. This may be necessary to calculate session-specific values in complex cases when this cannot be done with the help of the standard functions available in WAPT.
Select the request after which you want to insert a JavaScript code. Choose “Add | JavaScript” on the toolbar. The JavaScript operator will be added to the profile. Select it to edit the code in the right view. Initially the edit window contains a comment with a short instruction on how to use this feature.
In your code you can use functions defined in the WAPT Pro JavaScript library. Click the
“JavaScript Library” button to extend it by adding more files.
Click the “Check Syntax” button to check your code. The result will be displayed in the “Output” window. Note that JavaScript code can be used only to calculate values and assign results to some variables. You can use the assigned variables in subsequent requests. However you cannot initiate new requests directly from the code. There is another way to use JavaScript in your profiles. You can call functions defined in the JavaScript library directly when you specify how to calculate values for the request parameters and variables. You can do this with the help of a special internal function called “JavaScript”. It takes the actual name of the function you want to call as an argument.
* Available only in Pro version
Load testing with WAPT: Quick Start Guide
18
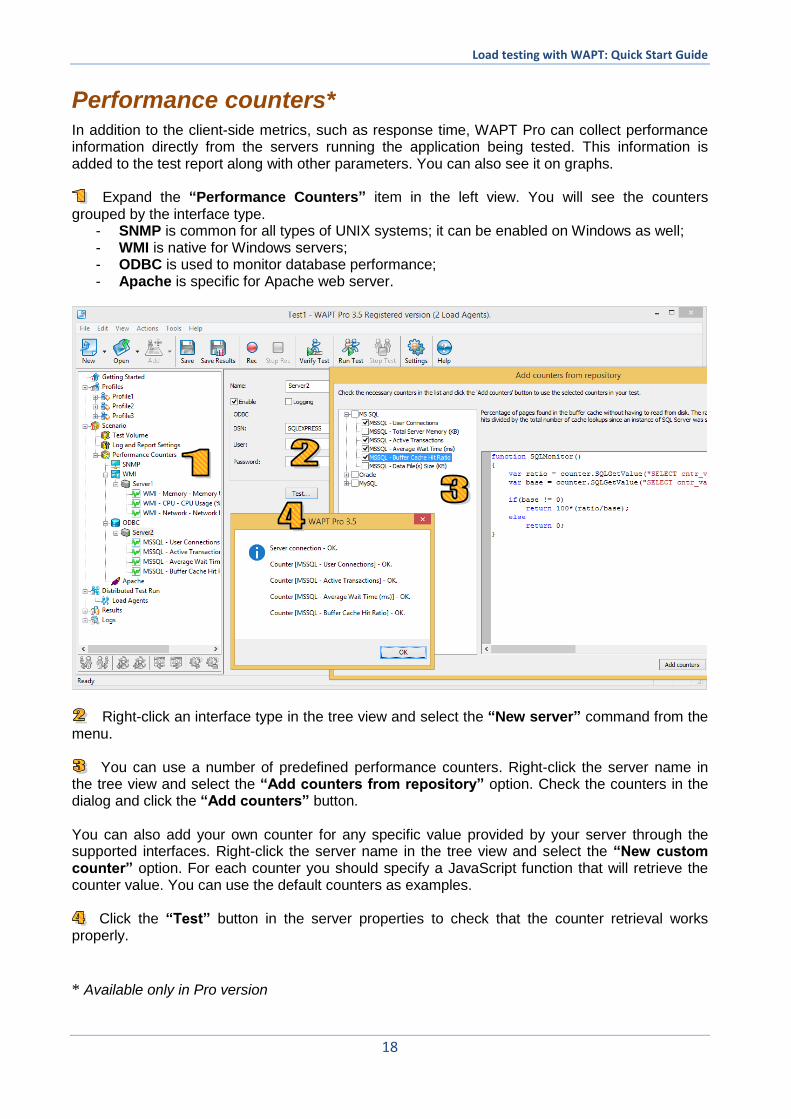
Performance counters* In addition to the client-side metrics, such as response time, WAPT Pro can collect performance information directly from the servers running the application being tested. This information is added to the test report along with other parameters. You can also see it on graphs.
Expand the “Performance Counters” item in the left view. You will see the counters
grouped by the interface type. - SNMP is common for all types of UNIX systems; it can be enabled on Windows as well; - WMI is native for Windows servers; - ODBC is used to monitor database performance; - Apache is specific for Apache web server.
Right-click an interface type in the tree view and select the “New server” command from the
menu. You can use a number of predefined performance counters. Right-click the server name in
the tree view and select the “Add counters from repository” option. Check the counters in the dialog and click the “Add counters” button. You can also add your own counter for any specific value provided by your server through the supported interfaces. Right-click the server name in the tree view and select the “New custom counter” option. For each counter you should specify a JavaScript function that will retrieve the counter value. You can use the default counters as examples.
Click the “Test” button in the server properties to check that the counter retrieval works properly.
* Available only in Pro version
Load testing with WAPT: Quick Start Guide
19
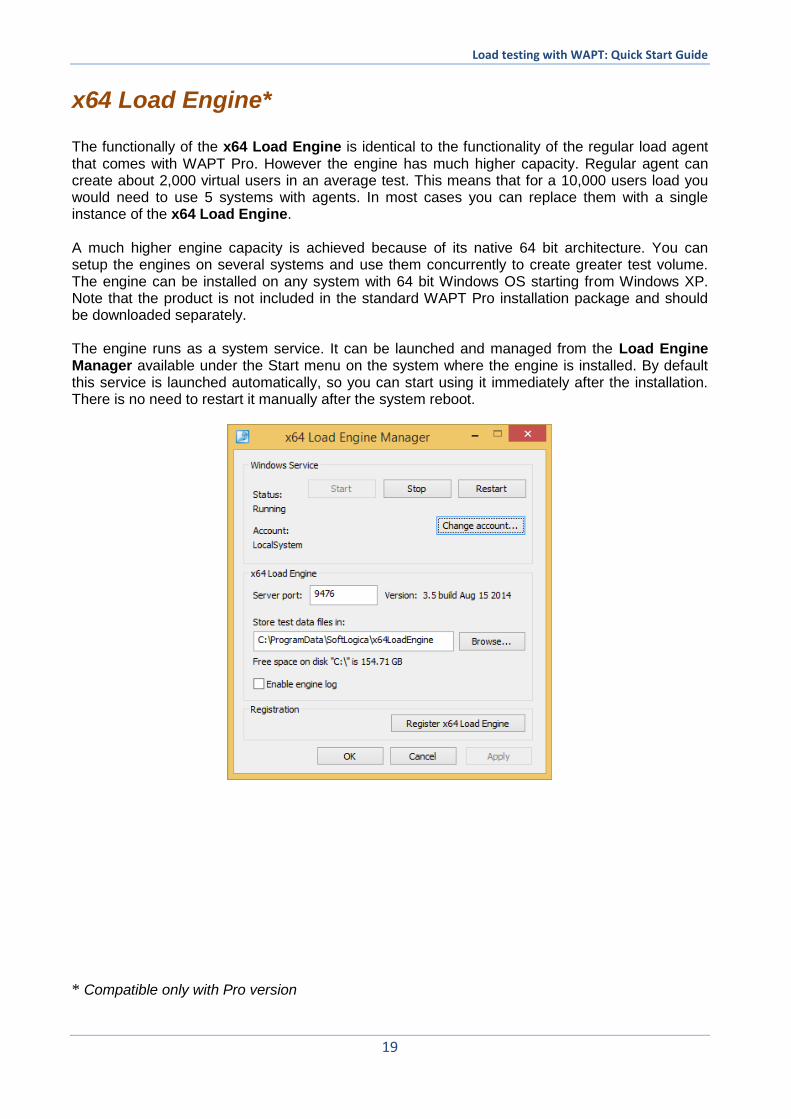
x64 Load Engine* The functionally of the x64 Load Engine is identical to the functionality of the regular load agent that comes with WAPT Pro. However the engine has much higher capacity. Regular agent can create about 2,000 virtual users in an average test. This means that for a 10,000 users load you would need to use 5 systems with agents. In most cases you can replace them with a single instance of the x64 Load Engine. A much higher engine capacity is achieved because of its native 64 bit architecture. You can setup the engines on several systems and use them concurrently to create greater test volume. The engine can be installed on any system with 64 bit Windows OS starting from Windows XP. Note that the product is not included in the standard WAPT Pro installation package and should be downloaded separately. The engine runs as a system service. It can be launched and managed from the Load Engine Manager available under the Start menu on the system where the engine is installed. By default this service is launched automatically, so you can start using it immediately after the installation. There is no need to restart it manually after the system reboot.
* Compatible only with Pro version