Атмосфера Земли медленно теряет кислород
TRANSCRIPT
deliver westward acceleration to the mean flow.Furthermore, the stronger tropical upwelling dur-ing Boreal winter slows down the QBO’s descent,allowingmore time for the extratropical waves toimpact during this particular phase.Of course, it is also possible that our current
numerical models can not properly represent theprocesses disrupting the QBO. To investigatethis, the foregoing RMS analysis thatwas appliedto the observational record was applied to his-torical global climatemodel runs so as to identifypossible analogous events (Fig. 4, A to C). Amongthe available models that produce a QBO inter-nally, only one rarely produced behavior similarto theobserveddisruption,with anexample shownin Fig. 4D. The extreme profiles resemble thoseobserved during 2016 with a thin layer of west-ward wind appearing within an otherwise east-ward QBO phase.What will happen next? The recent disruption
of the QBO is a rare event that occurs in thenorthern winter. The forecast initialized afterthe disruption (Fig. 3B) suggests that the QBOwill return to more regular phase progressionover the coming year. The westward jet thatsuddenly appeared in the lower stratosphere ispredicted to amplify in the summer of 2016 andprogress downwardwith time. Eastward flow thendescends from the 20-hPa level and dominatesthe lower stratospheric flow toward the end of2016, returning the QBO to its typical behavior.We then expect regular and predictable QBOcycling to continue from 2017, as occurs in theavailable climate models (Fig. 4D). Nonetheless,as the climatewarms in the future, climatemodelsthat simulate these events suggest that similar dis-ruptionswill occur up to three times every 100 yearsfor the more extreme of the standard climatechange scenarios. This is consistent with a pro-jected strengthening of the Brewer-Dobson cir-culation due to increasing stratospheric waveactivity (14) and the recently observed weakeningof the QBO amplitude in the lower stratosphere(21) under climate change. However, robustlymodeling how the QBO and its underlying pro-cesses and external influences will change inthe future remains elusive.There is a further outcome of the 2016 dis-
ruption of the QBO. After an eastward QBO atthe onset of the 2015–2016winter, theQBO at theonset of the coming winter of 2016–2017 wasexpected to be westward. The disruption of early2016 means that an eastward QBO phase is nowagain expected in the lower stratosphere. Becauseof the expected QBO influence on the Atlantic jetstream, this increases the risk of a strong jet,winter storms, and heavy rainfall over northernEurope in the coming winter (22, 23).Note added in proof: A similar finding was pub-
lished by Newman et al. (24) during the final re-vision period of the present study.
REFERENCES AND NOTES
1. R. A. Ebdon, Q. J. R. Meteorol. Soc. 86, 540–542 (1960).2. R. J. Reed, W. J. Campbell, L. A. Rasmussen, D. G. Rogers,
J. Geophys. Res. 66, 813–818 (1961).3. M. P. Baldwin et al., Rev. Geophys. 39, 179–229 (2001).4. J. M. Wallace, Rev. Geophys. 11, 191 (1973).
5. P. H. Haynes, Q. J. R. Meteorol. Soc. 124, 2645–2670 (1998).6. U. Niemeier et al., Atmos. Chem. Phys. 9, 9043–9057 (2009).7. J. R. Holton, H.-C. Tan, J. Atmos. Sci. 37, 2200–2208 (1980).8. J. A. Anstey, T. G. Shepherd, Q. J. R. Meteorol. Soc. 140, 1–21
(2014).9. J. Kidston et al., Nat. Geosci. 8, 433–440 (2015).10. A. A. Scaife et al., Geophys. Res. Lett. 41, 1752–1758 (2014).11. B. Naujokat, J. Atmos. Sci. 43, 1873–1877 (1986).12. R. S. Lindzen, J. R. Holton, J. Atmos. Sci. 25, 1095–1107 (1968).13. J. R. Holton, R. S. Lindzen, J. Atmos. Sci. 29, 1076–1080(1972).14. N. Butchart, Rev. Geophys. 52, 157–184 (2014).15. A. R. Plumb, R. C. Bell, Q. J. R. Meteorol. Soc. 108, 335–352
(1982).16. R. E. Dickinson, J. Atmos. Sci. 25, 984–1002 (1968).17. T. J. Dunkerton, Atmos.-Ocean 21, 55–68 (1983).18. K. Hamilton, A. Hertzog, F. Vial, G. Stenchikov, J. Atmos. Sci.
61, 383–402 (2004).19. J. S. Kinnersley, S. Pawson, J. Atmos. Sci. 53, 1937–1949 (1996).20. C. MacLachlan et al., Q. J. R. Meteorol. Soc. 141, 1072–1084
(2015).21. Y. Kawatani, K. Hamilton, Nature 497, 478–481 (2013).22. R. A. Ebdon, Aust. Meteorol. Mag. 104, 282–285 (1975).23. C. Huntingford et al., Nat. Clim. Change 4, 769–777 (2014).24. P. A. Newman, L. Coy, S. Pawson, L. R. Lait, Geophys. Res. Lett.
10.1002/2016GL070373 (2016).25. D. P. Dee et al., Q. J. R. Meteorol. Soc. 137, 553–597 (2011).26. D. G. Andrews, M. E. McIntyre, J. Atmos. Sci. 33, 2031–2048
(1976).27. NCAS British Atmospheric Data Centre, European Centre for
Medium-Range Weather Forecasts: ECMWF operationalanalysis: Assimilated Data (2006); http://catalogue.ceda.ac.uk/uuid/c46248046f6ce34fc7660a36d9b10a71.
28. E. P. Gerber et al., Bull. Am. Meteorol. Soc. 93, 845–859 (2012).
ACKNOWLEDGMENTS
We thank the European Centre for Medium-Range WeatherForecasts for providing ERA-Interim and Operational Analysis data(www.ecmwf.int/en/forecasts) and the Freie Universität Berlin forproviding radiosonde data (www.geo.fu-berlin.de/en/met/ag/strat/produkte/qbo). The CMIP5 data was obtained from theBritish Atmospheric Data Centre (browse.ceda.ac.uk/browse/badc/cmip5). A summary of data used in the study is listed intable S1. S.M.O. was supported by UK Natural Environment ResearchCouncil grants NE/M005828/1 and NE/P006779/1. A.A.S., J.R.K.,and N.B. were supported by the Joint UK Business, Energy andIndustrial Strategy/Defra Met Office Hadley Centre ClimateProgramme (GA01101). A.A.S. and J.R.K. were additionally supportedby the EU Seventh Framework Programme SPECS (Seasonal-to-decadal climate Prediction for the improvement of European ClimateServices) project. We acknowledge the scientific guidance of theWorld Climate Research Programme for helping motivate this work,coordinated under the framework of the Stratosphere-troposphereProcesses and their Role in Climate (SPARC) QBOi activity led byS.M.O., J.A.A., N.B., and K.H. The analysis of observations andreanalyses was performed by K.H., C.Z., S.M.O., J.A.A., and N.B.J.R.K. and A.A.S. provided the analysis of the seasonal forecasts, andV.S. identified analogous events in global climate model output.A.A.S. first alerted us to the disruption of the QBO in observationaldata. All authors were equally involved in the interpretation of theresults and preparation of the manuscript.
SUPPLEMENTARY MATERIALS
www.sciencemag.org/content/353/6306/1424/suppl/DC1Table S1
2 July 2016; accepted 29 August 201610.1126/science.aah4156
ATMOSPHERIC OXYGEN
A Pleistocene ice core record ofatmospheric O2 concentrationsD. A. Stolper,1* M. L. Bender,1,2 G. B. Dreyfus,1,3† Y. Yan,1 J. A. Higgins1
The history of atmospheric O2 partial pressures (PO2) is inextricably linked to thecoevolution of life and Earth’s biogeochemical cycles. Reconstructions of past PO2
rely on models and proxies but often markedly disagree. We present a record of PO2
reconstructed using O2/N2 ratios from ancient air trapped in ice. This recordindicates that PO2 declined by 7 per mil (0.7%) over the past 800,000 years, requiringthat O2 sinks were ~2% larger than sources. This decline is consistent with changesin burial and weathering fluxes of organic carbon and pyrite driven by eitherNeogene cooling or increasing Pleistocene erosion rates. The 800,000-year record ofsteady average carbon dioxide partial pressures (PCO2) but declining PO2 providesdistinctive evidence that a silicate weathering feedback stabilizes PCO2 on million-yeartime scales.
The importance of O2 to biological and geo-chemical processes has led to a long-standinginterest in reconstructing past atmosphericO2 partial pressures (PO2, reported at stan-dard temperature and pressure) (1–12). How-
ever, there is no consensus on the history ofPhanerozoic PO2, with reconstructions disagree-ing by as much as 0.2 atm, the present-day pres-sure of O2 in the atmosphere (e.g., 7, 10). Evenover thepastmillion years, it is not knownwhetheratmospheric O2 concentrations varied or whetherthe O2 cycle was in steady state (Fig. 1A). Knowl-edge of PO2 over the past million years couldprovide new insights into the O2 cycle on geologictime scales and serve as a test for models and
proxies of past PO2. Here we present a primaryrecord of PO2 over the past 800,000 years, recon-structed usingmeasuredO2/N2 ratios of ancient airtrapped in polar ice.O2/N2 ratios of this kind have been extensively
used to date ice cores on the basis of the corre-lation between O2/N2 and local summertime
SCIENCE sciencemag.org 23 SEPTEMBER 2016 • VOL 353 ISSUE 6306 1427
1Department of Geosciences, Princeton University, Princeton,NJ 08544, USA. 2Institute of Oceanology, Shanghai Jiao TongUniversity, Shanghai 200240, China. 3Laboratoire des Sciencesdu Climat et de l'Environnement, Gif-sur-Yvettte, France.*Corresponding author. Email: [email protected]†Present address: U.S. Department of Energy, Washington, DC20585, USA.
RESEARCH | REPORTS
on
Sept
embe
r 22
, 201
6ht
tp://
scie
nce.
scie
ncem
ag.o
rg/
Dow
nloa
ded
from
insolation (13–17). Despite being directly tied toatmospheric compositions,O2/N2 ratioshaveneverbefore been used to reconstruct past PO2. Landaiset al. (16) and Bazin et al. (17), while using O2/N2
ratios for ice core dating, noted a decline in O2/N2
values with time (i.e., toward the present). Theysuggested that this decline could be due to sec-ular changes in air entrapment processes, gasloss during core storage, or changes in atmosphericO2/N2, but they did not evaluate these hypotheses.Given the potential for O2/N2 ratios to directlyconstrain Pleistocene PO2, we present compiledO2/N2 measurements from multiple ice core re-cords and evaluate their geochemical implications.We compiled published O2/N2 ice core records
from Greenland [Greenland Ice Sheet Project 2(GISP2) (18)] and Antarctica [Vostok (13), DomeF (14), and Dome C (17); table S1], along withpreviously unpublished Antarctic Ar/N2 records[Vostok and Dome C; table S2]. The data weretreated as follows [see (19) for more details]. (i)Measured ratios were corrected for gravitationalfractionations and are reported using d notation
dO2=N2 ¼ 1000�½O2�=½N2�sample
½O2�=½N2�preanthropogenic atmosphere
−1
!ð1Þ
dAr=N2 ¼ 1000�½Ar�=½N2�sample
½Ar�=½N2�modern atmosphere
−1
!ð2Þ
where brackets denote concentrations. A decreaseindO2/N2of 1permil (‰) equates toa0.1%decrease
in PO2 relative to the preanthropogenic atmosphere(i.e., the modern atmosphere corrected for fossilfuel combustion). We define the preanthropogenicatmosphere as having dO2/N2 = 0‰ and dAr/N2 =0‰. (ii) Only analyses of bubble-free ice withclathrates were considered. (iii) The portions ofthe dO2/N2 and dAr/N2 signals linked to insola-tion (13–17) were removed (figs. S1 and S2). (iv)We corrected for differences in bubble close-offfractionations between ice cores and interlabo-ratory offsets by assuming that, in the absence ofsuch effects, trapped gases of a given age shareidentical atmospheric O2/N2 and Ar/N2 values(figs. S3 and S4).The fully corrected data are plotted versus ice
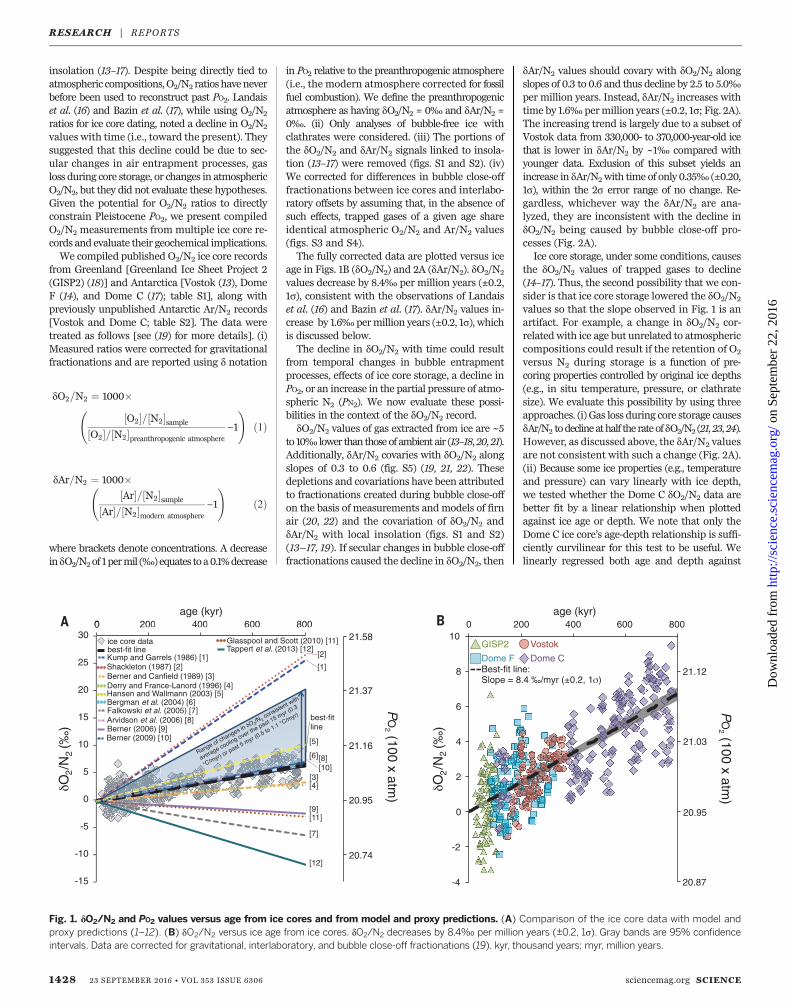
age in Figs. 1B (dO2/N2) and 2A (dAr/N2). dΟ2/N2
values decrease by 8.4‰ per million years (±0.2,1s), consistent with the observations of Landaiset al. (16) and Bazin et al. (17). dAr/N2 values in-crease by 1.6‰ permillion years (±0.2, 1s), whichis discussed below.The decline in dO2/N2 with time could result
from temporal changes in bubble entrapmentprocesses, effects of ice core storage, a decline inPO2, or an increase in the partial pressure of atmo-spheric N2 (PN2). We now evaluate these possi-bilities in the context of the dO2/N2 record.dO2/N2 values of gas extracted from ice are ~5
to 10‰ lower than thoseof ambient air (13–18,20,21).Additionally, dAr/N2 covaries with dO2/N2 alongslopes of 0.3 to 0.6 (fig. S5) (19, 21, 22). Thesedepletions and covariations have been attributedto fractionations created during bubble close-offon the basis of measurements andmodels of firnair (20, 22) and the covariation of dO2/N2 anddAr/N2 with local insolation (figs. S1 and S2)(13–17, 19). If secular changes in bubble close-offfractionations caused the decline in dO2/N2, then
dAr/N2 values should covary with dO2/N2 alongslopes of 0.3 to 0.6 and thus decline by 2.5 to 5.0‰per million years. Instead, dAr/N2 increases withtime by 1.6‰ permillion years (±0.2, 1s; Fig. 2A).The increasing trend is largely due to a subset ofVostok data from 330,000- to 370,000-year-old icethat is lower in dAr/N2 by ~1‰ compared withyounger data. Exclusion of this subset yields anincrease in dAr/N2with time of only 0.35‰ (±0.20,1s), within the 2s error range of no change. Re-gardless, whichever way the dAr/N2 are ana-lyzed, they are inconsistent with the decline indO2/N2 being caused by bubble close-off pro-cesses (Fig. 2A).Ice core storage, under some conditions, causes
the dO2/N2 values of trapped gases to decline(14–17). Thus, the second possibility that we con-sider is that ice core storage lowered the dO2/N2
values so that the slope observed in Fig. 1 is anartifact. For example, a change in dO2/N2 cor-relatedwith ice age but unrelated to atmosphericcompositions could result if the retention of O2
versus N2 during storage is a function of pre-coring properties controlled by original ice depths(e.g., in situ temperature, pressure, or clathratesize). We evaluate this possibility by using threeapproaches. (i) Gas loss during core storage causesdAr/N2 todeclineathalf the rateofdO2/N2 (21,23,24).However, as discussed above, the dAr/N2 valuesare not consistent with such a change (Fig. 2A).(ii) Because some ice properties (e.g., temperatureand pressure) can vary linearly with ice depth,we tested whether the Dome C dO2/N2 data arebetter fit by a linear relationship when plottedagainst ice age or depth. We note that only theDome C ice core’s age-depth relationship is suffi-ciently curvilinear for this test to be useful. Welinearly regressed both age and depth against
1428 23 SEPTEMBER 2016 • VOL 353 ISSUE 6306 sciencemag.org SCIENCE
O2/N
2 (‰
)
age (kyr)age (kyr)
-4
-2
0
2
4
6
8
10
-4
-2
0
2
4
6
8
100 600400200 800
Dome F
Vostok
Dome CBest-fit line:Slope = 8.4 ‰/myr (±0.2, 1 )
20.95
21.03
21.12
20.87
PO
2 (100 x atm)
GISP2
-15
-10
-5
0
5
10
15
20
25
300 200 400 600 800000 200200200 400400400 600600600 800800800
Glasspool and Scott (2010) [11]
Falkowski et al. (2005) [7]
ice core databest-fit lineKump and Garrels (1986) [1]Shackleton (1987) [2]Berner and Canfield (1989) [3]Derry and France-Lanord (1996) [4]
Tappert et al. (2013) [12]
Hansen and Wallmann (2003) [5]Bergman et al. (2004) [6]
Arvidson et al. (2006) [8]Berner (2006) [9]Berner (2009) [10]
20.95
21.16
21.37
20.74
PO
2 (100 x atm)
21.58
O2/N
2 (‰
)
[2]
[9]
[7]
[6]
best-fitline
[1]
[11]
[5]
[4]
[12]
[3]
[8][10]
Fig. 1. dO2/N2 and PO2 values versus age from ice cores and from model and proxy predictions. (A) Comparison of the ice core data with model andproxy predictions (1–12). (B) dO2/N2 versus ice age from ice cores. dO2/N2 decreases by 8.4‰ per million years (±0.2, 1s). Gray bands are 95% confidenceintervals. Data are corrected for gravitational, interlaboratory, and bubble close-off fractionations (19). kyr, thousand years; myr, million years.
RESEARCH | REPORTS
on
Sept
embe
r 22
, 201
6ht
tp://
scie
nce.
scie
ncem
ag.o
rg/
Dow
nloa
ded
from

dO2/N2 for ice older than ~400,000 years (i.e.,deeper than 2600 m) and extrapolated the fits toyounger ages and shallower depths. The extrap-olation for age (Fig. 2B) passes through the youngerdata, whereas the extrapolation for depth (Fig. 2C)misses the shallower data (by >4s). (iii) RepeatdO2/N2measurements of Vostok ice from the sameage interval (150,000 to 450,000 years ago) made10 years apart (13, 15) differ onaverage by6‰, withlonger storage leading to lower dO2/N2. Despitethis, regressing dO2/N2 against time yields statisti-cally identical (within 1s) slopes of dO2/N2 versusage for both data sets (fig. S6).Collectively, the data and tests presented above
provide no support for the observed decrease indO2/N2 over time being an artifact of either bubbleclose-off processes as they are currently under-stood or ice core storage. Consequently, we hy-pothesize and proceed with the interpretationthat the observed decline in dO2/N2 reflects changesin PO2 or PN2. Because N2 has a billion-year at-mospheric lifetime (25),we link thedecline indO2/N2
with time exclusively to a decline in PO2. Ourhypothesis is further supported by the observa-tion that data from all four ice cores individuallyexhibit the same general trends and magnitudesof decreasing dO2/N2 with time (table S3), eventhough each was drilled, stored, and analyzeddifferently.The question raised by this record is why PO2
has decreased by~7‰ over the past 800,000 years.Changes in PO2 require imbalances betweenO2 sources [dominantly modern sedimentaryorganic carbon (Corg) and pyrite burial] and sinks(dominantly ancient sedimentary Corg and pyriteoxidation) (26). Thus, a higher rate of oxidativeweathering relative to Corg and/or pyrite burialover the past million years couldhave caused the observed PO2 de-cline. The ~2-million-year (+1.5/–0.5 million years) (26) geologicalresidence time of O2, combinedwith the decline in dO2/N2 of8.4‰ per million years, indicatesthat O2 sinks were 1.7% larger thansources over the past 800,000 years(27). We now explore possible causesfor this drawdown, examining firstthe impact of changing erosion ratesand second the impact of globalcooling on PO2.Global erosion rates influence
the amount of rockweathered (con-suming O2) and sediment buried(releasing O2). These rates havebeen suggested to have increasedup to 100% in the Pleistocene rel-ative to the Pliocene (28) [thoughthis is debated (29)]. Thus, the pos-sibility exists that increased Pleisto-cene sedimentary erosion and burialrates affected PO2 levels. Indeed,Torres et al. (30) modeled that in-creasing erosion rates over the past15 million years enhanced oxida-tion of sedimentary pyrite rela-tive to burial so that PO2 declined
on average by 9 to 25‰ per million years. This issimilar to the decline given by the ice core record(8.4‰ per million years). We note that whetherincreasing erosion rates cause PO2 to decline(instead of increase) is unknown (31).Large increases (e.g., 100%) in Pleistocene ero-
sion rates, if they did occur, likely would haverequired processes that keep O2 sources and sinksbalanced within ~2% (the observed imbalance).Such processes could include the proposed PO2-dependent control of Corg burial fluxes on sedimen-tary phosphorus burial rates (32). Alternatively,sedimentary mineral surface area is known topositively correlate with total sedimentary Corg andpyrite content (33). Hedges and Kiel (33) pro-posed that the total eroded and total buriedmin-eral surface areas today are about equal. If thiswas true in the past, the conservation of erodedversus newly generated mineral surface area mayhave acted to balance Corg and pyrite weatheringand burial fluxes (and thus O2 fluxes), regardless ofglobal erosion rates (33).Alternatively, on the basis of 13C/12C and 18O/16O
records from sedimentary carbonates, Shackleton(2) proposed that PO2 declined over theNeogene asa result of oceanic cooling.He suggested the followingfeedback loop: Cooling increases O2 solubility. Thisraises dissolved O2 concentrations, which increasesthe volume of ocean sediment exposed to dissolvedO2 and thus also increases global aerobic Corgremineralization rates (33). On million-year timescales, Corg burial rates and, therefore, PO2 and O2
concentrations decline until seawater O2 concen-trations return to their initial (precooling) levels. Atthis new steady state, Corg burial rates have returnedto their original values, but PO2 is stabilized at alower value.
Shackleton’s hypothesis can be evaluated to firstorder in the context of the dO2/N2 data by usingrecords of past ocean temperature. Specifically,temperatures in the deep (>1000 m depth) oceanwere roughly constant from 24 to 14 million yearsago (34, 35). Assuming an O2 residence time of ~2million years and the hypothesis that changes inocean temperature modulate PO2, then O2 sourcesand sinkswould have been inbalance by 14millionyears ago. The oceans have cooled on average by0.3°C per million years over the past 14 millionyears and 0.5° to 1.1°C per million years over thepast 5million years (34, 35). Cooling of 0.3° to 1.1°Cper million years increases O2 solubility by ~7 to25‰ per million years (36). If dissolved O2 con-centrations remained constant (as this hypothesisrequires), such changes in O2 solubility necessitatea decline in PO2 of ~7 to 25‰ per million years.These rates bracket the rate of decline given by theice core record (8.4‰ per million years; Fig. 1A).We note that deep ocean cooling rates track aver-agemarine cooling rates, but not precisely, becausemodern deep waters form in and thus reflect thetemperatures of high latitudes. Regardless, thecritical point is that this simple calculation isconsistent with the ice core–derived dO2/N2
record and supports the hypothesis that globaltemperature stabilizes PO2 on geological timescales through feedbacks associated with Corg
burial rates.A drop in PO2 over the past 800,000 years due
solely to changes in Corg burial versus oxidationrates (regardless of the cause) requires positiveCO2 fluxes (~3 × 10¹¹ moles C per year) into theocean and atmosphere (19). However, ice corerecords of past carbon dioxide partial pressures(PCO2) show no obvious change in the mean over
SCIENCE sciencemag.org 23 SEPTEMBER 2016 • VOL 353 ISSUE 6306 1429
age (kyr) age (kyr)
-5-5
00
55
101000 200200 400400 600600 800800
-5
0
5
100 200 400 600 800
O2/N2, all Ar/N2, Vostok
Ar/N2, Dome C
best-fit O2/N2 line
Expected range of Ar/N2 trends if O2/N2 is controlled
by bubble close-off fractionations or gas loss
best-fit Ar/N2 line
-5
0
5
10100 450 800
-5-5-5
000
555
101010100100100 450450450 800800800
-10
-10
-5
0
5
101400 2300 3200
depth (m)
-10-10-10
-5-5-5-5
0000
5555
101010101400140014001400 2300230023002300 3200320032003200
-5
0
5
10100 450 800
O2/
N2
(‰)
O2/
N2
(‰)
(‰
)
Fig. 2. Evidence that the observed decline in dO2N2 with time does not originate from either secular changes inbubble close-off fractionations or ice core storage. (A) dAr/N2 and dO2/N2 versus ice age. Bubble close-off processesand gas loss would cause dAr/N2 and dO2/N2 to covary with slopes of 0.3 to 0.6. The observed dAr/N2 trend does notoverlap with these expected trends (orange wedge), indicating that such processes did not cause the decline in dO2/N2.(B) DomeC dO2/N2 versus ice age and (C) versus depth. Dotted lineswere fit to ice>400,000years old or >2600mdeep andextrapolated to younger ages or shallower depths. Extrapolations of the fits pass through the younger data (B) but miss thedeeper data [beyond 4s (C)], indicating depth-dependent glacial properties did not cause the decline in dO2/N2.Gray bandsare 95% confidence intervals. Data are corrected for gravitational, interlaboratory, and bubble close-off fractionations (19).
RESEARCH | REPORTS
on
Sept
embe
r 22
, 201
6ht
tp://
scie
nce.
scie
ncem
ag.o
rg/
Dow
nloa
ded
from
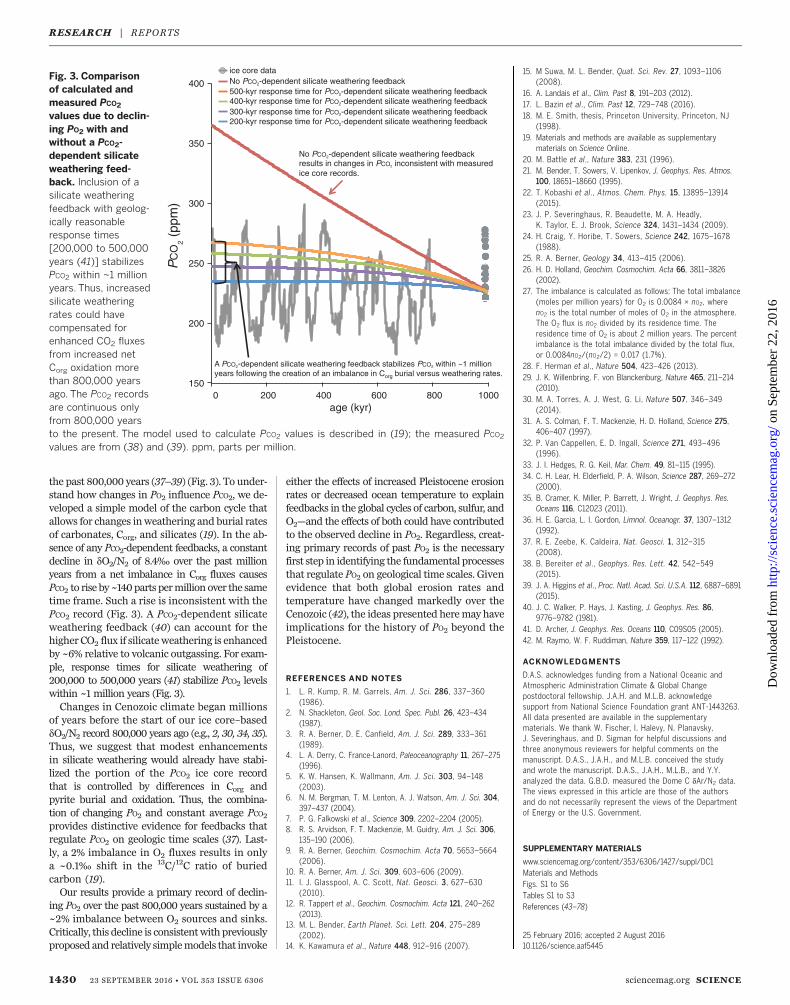
the past 800,000 years (37–39) (Fig. 3). To under-stand how changes in PO2 influence PCO2, we de-veloped a simple model of the carbon cycle thatallows for changes inweathering and burial ratesof carbonates, Corg, and silicates (19). In the ab-sence of any PCO2-dependent feedbacks, a constantdecline in dO2/N2 of 8.4‰ over the past millionyears from a net imbalance in Corg fluxes causesPCO2 to rise by~140parts permillion over the sametime frame. Such a rise is inconsistent with thePCO2 record (Fig. 3). A PCO2-dependent silicateweathering feedback (40) can account for thehigher CO2 flux if silicateweathering is enhancedby ~6% relative to volcanic outgassing. For exam-ple, response times for silicate weathering of200,000 to 500,000 years (41) stabilize PCO2 levelswithin ~1 million years (Fig. 3).Changes in Cenozoic climate began millions
of years before the start of our ice core–baseddO2/N2 record 800,000 years ago (e.g., 2, 30, 34, 35).Thus, we suggest that modest enhancementsin silicate weathering would already have stabi-lized the portion of the PCO2 ice core recordthat is controlled by differences in Corg andpyrite burial and oxidation. Thus, the combina-tion of changing PO2 and constant average PCO2provides distinctive evidence for feedbacks thatregulate PCO2 on geologic time scales (37). Last-ly, a 2% imbalance in O2 fluxes results in onlya ~0.1‰ shift in the 13C/12C ratio of buriedcarbon (19).Our results provide a primary record of declin-
ing PO2 over the past 800,000 years sustained by a~2% imbalance between O2 sources and sinks.Critically, this decline is consistentwith previouslyproposed and relatively simplemodels that invoke
either the effects of increased Pleistocene erosionrates or decreased ocean temperature to explainfeedbacks in the global cycles of carbon, sulfur, andO2—and the effects of both could have contributedto the observed decline in PO2. Regardless, creat-ing primary records of past PO2 is the necessaryfirst step in identifying the fundamental processesthat regulate PO2 on geological time scales. Givenevidence that both global erosion rates andtemperature have changed markedly over theCenozoic (42), the ideas presented heremay haveimplications for the history of PO2 beyond thePleistocene.
REFERENCES AND NOTES
1. L. R. Kump, R. M. Garrels, Am. J. Sci. 286, 337–360(1986).
2. N. Shackleton, Geol. Soc. Lond. Spec. Publ. 26, 423–434(1987).
3. R. A. Berner, D. E. Canfield, Am. J. Sci. 289, 333–361(1989).
4. L. A. Derry, C. France-Lanord, Paleoceanography 11, 267–275(1996).
5. K. W. Hansen, K. Wallmann, Am. J. Sci. 303, 94–148(2003).
6. N. M. Bergman, T. M. Lenton, A. J. Watson, Am. J. Sci. 304,397–437 (2004).
7. P. G. Falkowski et al., Science 309, 2202–2204 (2005).8. R. S. Arvidson, F. T. Mackenzie, M. Guidry, Am. J. Sci. 306,
135–190 (2006).9. R. A. Berner, Geochim. Cosmochim. Acta 70, 5653–5664
(2006).10. R. A. Berner, Am. J. Sci. 309, 603–606 (2009).11. I. J. Glasspool, A. C. Scott, Nat. Geosci. 3, 627–630
(2010).12. R. Tappert et al., Geochim. Cosmochim. Acta 121, 240–262
(2013).13. M. L. Bender, Earth Planet. Sci. Lett. 204, 275–289
(2002).14. K. Kawamura et al., Nature 448, 912–916 (2007).
15. M Suwa, M. L. Bender, Quat. Sci. Rev. 27, 1093–1106(2008).
16. A. Landais et al., Clim. Past 8, 191–203 (2012).17. L. Bazin et al., Clim. Past 12, 729–748 (2016).18. M. E. Smith, thesis, Princeton University, Princeton, NJ
(1998).19. Materials and methods are available as supplementary
materials on Science Online.20. M. Battle et al., Nature 383, 231 (1996).21. M. Bender, T. Sowers, V. Lipenkov, J. Geophys. Res. Atmos.
100, 18651–18660 (1995).22. T. Kobashi et al., Atmos. Chem. Phys. 15, 13895–13914
(2015).23. J. P. Severinghaus, R. Beaudette, M. A. Headly,
K. Taylor, E. J. Brook, Science 324, 1431–1434 (2009).24. H. Craig, Y. Horibe, T. Sowers, Science 242, 1675–1678
(1988).25. R. A. Berner, Geology 34, 413–415 (2006).26. H. D. Holland, Geochim. Cosmochim. Acta 66, 3811–3826
(2002).27. The imbalance is calculated as follows: The total imbalance
(moles per million years) for O2 is 0.0084 × nO2, wherenO2 is the total number of moles of O2 in the atmosphere.The O2 flux is nO2 divided by its residence time. Theresidence time of O2 is about 2 million years. The percentimbalance is the total imbalance divided by the total flux,or 0.0084nO2/(nO2/2) = 0.017 (1.7%).
28. F. Herman et al., Nature 504, 423–426 (2013).29. J. K. Willenbring, F. von Blanckenburg, Nature 465, 211–214
(2010).30. M. A. Torres, A. J. West, G. Li, Nature 507, 346–349
(2014).31. A. S. Colman, F. T. Mackenzie, H. D. Holland, Science 275,
406–407 (1997).32. P. Van Cappellen, E. D. Ingall, Science 271, 493–496
(1996).33. J. I. Hedges, R. G. Keil, Mar. Chem. 49, 81–115 (1995).34. C. H. Lear, H. Elderfield, P. A. Wilson, Science 287, 269–272
(2000).35. B. Cramer, K. Miller, P. Barrett, J. Wright, J. Geophys. Res.
Oceans 116, C12023 (2011).36. H. E. Garcia, L. I. Gordon, Limnol. Oceanogr. 37, 1307–1312
(1992).37. R. E. Zeebe, K. Caldeira, Nat. Geosci. 1, 312–315
(2008).38. B. Bereiter et al., Geophys. Res. Lett. 42, 542–549
(2015).39. J. A. Higgins et al., Proc. Natl. Acad. Sci. U.S.A. 112, 6887–6891
(2015).40. J. C. Walker, P. Hays, J. Kasting, J. Geophys. Res. 86,
9776–9782 (1981).41. D. Archer, J. Geophys. Res. Oceans 110, C09S05 (2005).42. M. Raymo, W. F. Ruddiman, Nature 359, 117–122 (1992).
ACKNOWLEDGMENTS
D.A.S. acknowledges funding from a National Oceanic andAtmospheric Administration Climate & Global Changepostdoctoral fellowship. J.A.H. and M.L.B. acknowledgesupport from National Science Foundation grant ANT-1443263.All data presented are available in the supplementarymaterials. We thank W. Fischer, I. Halevy, N. Planavsky,J. Severinghaus, and D. Sigman for helpful discussions andthree anonymous reviewers for helpful comments on themanuscript. D.A.S., J.A.H., and M.L.B. conceived the studyand wrote the manuscript. D.A.S., J.A.H., M.L.B., and Y.Y.analyzed the data. G.B.D. measured the Dome C dAr/N2 data.The views expressed in this article are those of the authorsand do not necessarily represent the views of the Departmentof Energy or the U.S. Government.
SUPPLEMENTARY MATERIALS
www.sciencemag.org/content/353/6306/1427/suppl/DC1Materials and MethodsFigs. S1 to S6Tables S1 to S3References (43–78)
25 February 2016; accepted 2 August 201610.1126/science.aaf5445
1430 23 SEPTEMBER 2016 • VOL 353 ISSUE 6306 sciencemag.org SCIENCE
Fig. 3. Comparisonof calculated andmeasured PCO2
values due to declin-ing PO2 with andwithout a PCO2-dependent silicateweathering feed-back. Inclusion of asilicate weatheringfeedback with geolog-ically reasonableresponse times[200,000 to 500,000years (41)] stabilizesPCO2 within ~1 millionyears. Thus, increasedsilicate weatheringrates could havecompensated forenhanced CO2 fluxesfrom increased netCorg oxidation morethan 800,000 yearsago. The PCO2 recordsare continuous onlyfrom 800,000 yearsto the present. The model used to calculate PCO2 values is described in (19); the measured PCO2
values are from (38) and (39). ppm, parts per million.
150150
200200
250250
300300
350350
400400
00 200200 400400 600600 800800 10001000150
200
250
300
350
400
0 200 400 600 800 1000age (kyr)
PC
O2 (
ppm
)
ice core dataNo PCO2-dependent silicate weathering feedback500-kyr response time for PCO2-dependent silicate weathering feedback400-kyr response time for PCO2-dependent silicate weathering feedback300-kyr response time for PCO2-dependent silicate weathering feedback200-kyr response time for PCO2-dependent silicate weathering feedback
No PCO2-dependent silicate weathering feedback results in changes in PCO2 inconsistent with measured ice core records.
A PCO2-dependent silicate weathering feedback stabilizes PCO2 within ~1 million years following the creation of an imbalance in Corg burial versus weathering rates.
RESEARCH | REPORTS
on
Sept
embe
r 22
, 201
6ht
tp://
scie
nce.
scie
ncem
ag.o
rg/
Dow
nloa
ded
from
(6306), 1427-1430. [doi: 10.1126/science.aaf5445]353Science Higgins (September 22, 2016) D. A. Stolper, M. L. Bender, G. B. Dreyfus, Y. Yan and J. A.
concentrations2A Pleistocene ice core record of atmospheric O
Editor's Summary
This copy is for your personal, non-commercial use only.
Article Tools
http://science.sciencemag.org/content/353/6306/1427article tools: Visit the online version of this article to access the personalization and
Permissionshttp://www.sciencemag.org/about/permissions.dtlObtain information about reproducing this article:
is a registered trademark of AAAS. ScienceAdvancement of Science; all rights reserved. The title Avenue NW, Washington, DC 20005. Copyright 2016 by the American Association for thein December, by the American Association for the Advancement of Science, 1200 New York
(print ISSN 0036-8075; online ISSN 1095-9203) is published weekly, except the last weekScience
on
Sept
embe
r 22
, 201
6ht
tp://
scie
nce.
scie
ncem
ag.o
rg/
Dow
nloa
ded
from