ثناثنا غترنا – 3102 واؼن يئاصحلإا ريرقتنا report 2013_q3.pdf ·...
TRANSCRIPT

SIO_BA_ADA_REC_RPT_002
GCC Statistics – Version 1 Confidential/Internal/Public 1 of 42
انرتغ انثانث – 3102انتقرير اإلحصائي نؼاو
انقطاع انذي وانخاص
Statistical Report 2013 – Quarter 3 Civil and Private Sectors
October 2013
Business Analytics and Actuarial Studies Department
Actuaries and Data Analytics Division
Warning
Not to be circulated or reproduced without appropriate authorization

Statistical Report 2013 - Q3 نثانثانرتغ ا – 3102انتقرير اإلحصائي نؼاو
SIO_BA_ADA_REC_RPT_002
GCC Statistics – Version 1 Confidential/Internal/Public 2 of 42
جذول انحتىيات
Page
No. Table of Contents
Summary Table 3 تيا إجاني
Chapter 1 : Civil Sector 4 انفصم األول: انقطاع انذي
Section 1: Contributors Statistics 5 ؤي ػهيهى: إحصائيات ان0انجزء
Section 2: Pensioners Statistics 11 إحصائيات أصحاب انؼاشات: 3انجزء
Section 3: Beneficiaries Statistics 17 انستحقيإحصائيات : 2انجزء
Chapter 2 : Private Sector 22 انفصم انثاي: انقطاع انخاص
Section 1: Contributors Statistics 23 ؤي ػهيهى: إحصائيات ان0انجزء
Section 2: Pensioners Statistics 30 إحصائيات أصحاب انؼاشات: 3انجزء
Section 3: Beneficiaries Statistics 36 انستحقيإحصائيات : 2انجزء
Terms of reference 46 فهرس انصطهحات

Statistical Report 2013 - Q3 نثانثانرتغ ا – 3102انتقرير اإلحصائي نؼاو
SIO_BA_ADA_REC_RPT_002
GCC Statistics – Version 1 Confidential/Internal/Public 3 of 42
CP0))Table Total Summaryبان إجمال جدول
و المستحقن والمتقاعدنوالخاص لقانون التقاعد المدن الخاضعنالموظفن بان إجمال بأعداد 3102 من عام الثالثالربع حتى
Total Number of Employees Subject to the Provision of Law, Pensioners and Beneficiaries as at Q3 2013
Civil & Private Sector/ و الخاص القطاع المدني
البان المجموع القطاع الخاص القطاع المدن
Item Civil Sector Private Sector Total
No. Contributors .1 566,730 512,940 53,790 . عدد المشتركين1
بحريني 1.1 53,790 83,930 137,720 1.1 Bah
غبر بحريني 1.2 429,010 429,010 1.2 Non-Bah
أصحاب المعاشات. عدد 2 األحياء
15,098 16,817 31,915 2. No. Alive Pensioners
أصحاب المعاشات . عدد 3 المتوفين
3,787 4,359 8,146 3. No. Deceased Pensioners
No. of Beneficiaries .4 15,090 7,699 7,391 . عدد المستحقين4

Statistical Report 2013 - Q3 نثانثانرتغ ا – 3102انتقرير اإلحصائي نؼاو
SIO_BA_ADA_REC_RPT_002
GCC Statistics – Version 1 Confidential/Internal/Public 4 of 42
:انقطاع انذي انثانثانفصم
Chapter 1 : Civil Sector

Statistical Report 2013 - Q3 نثانثانرتغ ا – 3102انتقرير اإلحصائي نؼاو
SIO_BA_ADA_REC_RPT_002
GCC Statistics – Version 1 Confidential/Internal/Public 5 of 42
Contents المحتوات
رقم الجدول
Table No Title موضوعه
رقم الصفحة
Page No
C1 ؤمن علهمبانات الم Contributors Data 5
C1.1 وظفين حسب الجنس و الجنسية الم عدد No of Employees by sex and Nationality
6
C1.2 مجموع و متوسط األجر الشهري للموظفين
لجنس و الجنسيةحسب اTotal & Average Monthly Salary of Employees by sex and Nationality
7
C1.3 حسب الفئة العمرية وظفينالمعدد No of Employees Classified by Age Group
8
C1.4 حسب الفئة العمرية متوسط األجر الشهري Average Monthly Salary of Employees Classified by Age Group
9
C1.5 الشهري األجرحسب وظفينالم عدد No of Employees Classified By Monthly Salary
10
انثانثانجزء ؤهي ػلن ف المطبع الوذإحظبئبد الو
Section C1 Contributors' Statistics in the Civil Sector
Statistical Report 2013 - Q3 نثانثانرتغ ا – 3102انتقرير اإلحصائي نؼاو
SIO_BA_ADA_REC_RPT_002
GCC Statistics – Version 1 Confidential/Internal/Public 6 of 42
Table( C1.1جدول )
3102 من عام الثالثالربع -3112خالل الفترة حسب الجنس والجنسة ؤمن علهمملخص بعدد الم
Number of Employees Subject to the Provision of Law Classified According to Gender and Nationality during 2009- Q3 2013
Sector Civil القطاع المدن /
سنةYear
Bahrainiبحرن /
معدل النمو المجموع إناث ذكور
Male Female Total GR
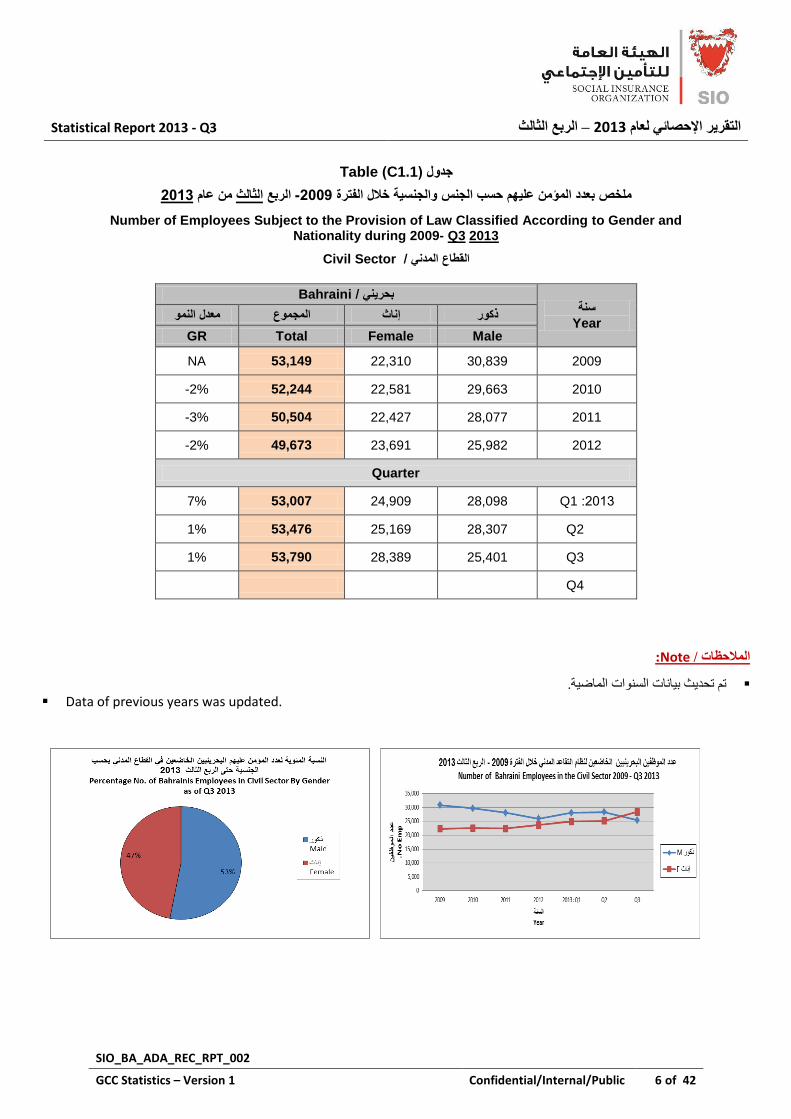
2009 30,839 22,310 53,149 NA
2010 29,663 22,581 52,244 -2%
2011 28,077 22,427 50,504 -3%
2012 25,982 23,691 49,673 -2%
Quarter
2013 :Q1 28,098 24,909 53,007 7%
Q2 28,307 25,169 53,476 1%
Q3 25,401 28,389 53,790 1%
Q4
:Noteانالحظات /
.رن رحذش ثببد الساد الوبضخ Data of previous years was updated.

Statistical Report 2013 - Q3 نثانثانرتغ ا – 3102انتقرير اإلحصائي نؼاو
SIO_BA_ADA_REC_RPT_002
GCC Statistics – Version 1 Confidential/Internal/Public 7 of 42
Table( C1.2جدول )
موظفن الخاضعن حسب الجنس والجنسة لل مجموع و متوسط الراتب الشهريملخص ب 3102 من عام الثالثالربع -3112خالل الفترة
Total & Average Monthly Salary of Employees Subject to the Provision of Law Classified According to Sex and Nationality during 2007- Q3 2013
Sector Civil القطاع المدن /
سنة Bahrainiالبحرن /
يجىع األجر انشهري
Total Monthly Salary
متوسط األجر الشهريAverage Monthly Salary
Year ذكورM إناثF المجموع معدل ل النمومعد المجموع Fإناث Mذكور النمو
Male Female Total GR Male Female Total GR
2009 20,286,513 15,066,604 35,353,117 NA 658 675 665 NA
2010 20,032,205 15,521,112 35,553,317 0.6% 675 687 681 2%
2011 21,721,243 17,551,837 39,273,080 10% 774 783 778 14%
2012 20,790,696 18,344,181 39,134,877 0% 800 774 788 1%
Quarter
2013 :Q1 22,200,448 19,259,099 41,459,547 6% 790 773 782 -0.7%
Q2 22,388,135 19,488,673 41,876,809 7% 791 774 783 -1%
Q3 22,655,569 19,659,611 42,315,180 8% 798 774 787 0%
Q4
:Noteانالحظات /
رلك ثسجت صبدح سجخ سارت هظف المطبع 1100ف ػبم % 01 للوؤهي ػلن الجحشي و هزسظ الشارت الششخ ثلؾ هؼذل
.1100% رمشجب ف أؿسطس 04الوذ ثومذاس The growth rate in the average salary for Bahrainis Employees has reached 10% in 2011 due to the 15%
approximate general increase in all government employees' salary.

Statistical Report 2013 - Q3 نثانثانرتغ ا – 3102انتقرير اإلحصائي نؼاو
SIO_BA_ADA_REC_RPT_002
GCC Statistics – Version 1 Confidential/Internal/Public 8 of 42
Table( C1.3جدول ) الجنس والجنسة و الفئة العمرة بحسب موزعنبعدد الموظفن الخاضعن بان
3102 من عام الثالثالربع حتى
Number of Employees Subject to the Provision Of Law Classified by Age group, Sex & Nationality as at Q3 2013
Civil Sectorالقطاع المدن /
الفئة العمرة Age Group
Bahraini / بحرن
المجموع إناث ذكور%
Male Female Total
< 20 109 61 170 0.3%
20-24 1,724 1,712 3,436 6% 25-29 3,575 4,613 8,188 15% 30-34 4,032 5,285 9,317 17% 35-39 4,276 4,692 8,968 17% 40-44 3,998 3,361 7,359 14% 45-49 4,522 2,715 7,237 13% 50-54 3,748 1,959 5,707 11% 55-59 1,766 843 2,609 5% 60-64 564 150 714 1% 65+ 75 10 85 0.2%
Total 28,389 25,401 53,790 100% /المجموع
:Note/ انالحظات
يهاي إموابل ػاذد الواظفي الجحاش %48ػبهاب شاولى ساجخ 44-30الؼذد األكجش هي الوظفي الخبضؼي رزشاح أػوابسن ثاي
.1102% ف الشثغ الضبلش هي 53%، الزكس 47بس الخبضؼي روضل اإل
هااي إمواابل ػااذد الوااظفي، ااؤ 6هظااو اان وضلااى حااال 3,408سااخ فاا كضش 44ثلااؾ ػااذد الوااظفي الاازي رجلااؾ أػواابسن %
سزحمى هؼبشب رمبػذب ف حبلخ ازب الخذهخ إرا هب رافش ششط ساد الخذهخ. Age wise employees between 30-44 years constitute 48% of total employees, females represent 47%
and males 53% at Q3 2013.
Number of employees with age 55 years and above equals to 3,408 and they constitute 6% of total employees. Those are entitled for a retirement pension in the event of ending their services subject to existence of years of service condition.

Statistical Report 2013 - Q3 نثانثانرتغ ا – 3102انتقرير اإلحصائي نؼاو
SIO_BA_ADA_REC_RPT_002
GCC Statistics – Version 1 Confidential/Internal/Public 9 of 42
Table( C1.4جدول ) الجنس والجنسة و الفئة العمرة بحسب موزعنالخاضعن البحرنن لموظفن ل متوسط الراتب الشهريببان
3102 من عام الثالثالربع حتى
Average Monthly Salary of Bahraini Civil Servant Subject to the Provision Of Law Classified by Age group, Sex & Nationality as at Q3 2013
Civil Sectorالقطاع المدن /
الفئة العمرة Age Group
Average Monthly Salary/ الشهري متوسط الراتب
Bahrainiبحرن /
المجموع إناث ذكور
Male Female Total
<20 353 351 352
20-24 420 432 426 25-29 557 572 566 30-34 648 689 671 35-39 727 797 764 40-44 812 897 851 45-49 896 985 930 50-54 1,007 1,038 1,018 55-59 1,190 1,127 1,170 60-64 1,519 1,282 1,469 65+ 1,943 1,408 1,880
Total 798 774 787 /المجموع
:Noteانالحظات /
يهي الوظفي الجحش 54دبسا( هي الفئخ الؼوشخ + 08771 ( 1102ضبلش هي ػبم ثلؾ أػل هزسظ سارت شش بخ الشثغ ال. The highest average monthly salary for Bahrainis (1,880 BD) is in the age group 65+.

Statistical Report 2013 - Q3 نثانثانرتغ ا – 3102انتقرير اإلحصائي نؼاو
SIO_BA_ADA_REC_RPT_002
GCC Statistics – Version 1 Confidential/Internal/Public 10 of 42
Table( C1.5جدول )
3102 من عام الثالثالربع هري حتى الش الراتبعدد الموظفن الخاضعن لنظام التقاعد المدن موزعن حسب
Number of Civil Servant Subject to the provision of Law Classified According to Monthly Salary as at Q3 2013
Civil Sectorالقطاع المدن /
الراتب األساس الشهري Number of Employeeعدد الموظفن /
Bahraini/ نبحرن
Monthly Basic Salary النسبة المجموع إناث ذكور
Male Female Total %
<200 9 4 13 0.02%
200-400 4,033 2,761 6,794 12.63%
400-600 8,862 6,437 15,299 28.44%
600-800 6,238 7,091 13,329 24.78%
800-1000 3,695 3,989 7,684 14.29%
1000-1200 1,877 2,505 4,382 8.15%
1200-1400 1,015 1,161 2,176 4.05%
1400-1600 602 525 1,127 2.10%
1600-1800 432 326 758 1.41%
1800-2000 383 206 589 1.09%
2000-2200 318 165 483 0.90%
2200-2400 203 80 283 0.53%
2400-2600 170 53 223 0.41%
2600-2800 132 29 161 0.30%
2800-3000 86 20 106 0.20%
3000-3200 60 15 75 0.14%
3200-3400 79 12 91 0.17%
3400-3600 29 6 35 0.07%
3600-3800 40 1 41 0.08%
3800-4000 38 3 41 0.08%
>4000 88 12 100 0.19%
Total 28,389 25,401 53,790 100%المجموع /
:Noteانالحظات /
28 حز بخ الشثغ الضبلش هي 58% الزكس 42دبسا، رشول اإلبس 511-311% هي إموبل ػذد الوظفي الخبضؼي رزشاح هشرجبرن ثي %
1102. 28% of total employees' average salaries between 600-400 BD, female constitute 42% and male 58% of them at the
end of Q3 2013.
Statistical Report 2013 - Q3 نثانثانرتغ ا – 3102انتقرير اإلحصائي نؼاو
SIO_BA_ADA_REC_RPT_002
GCC Statistics – Version 1 Confidential/Internal/Public 11 of 42
انثانثانجزء ف المطبع الوذ إحظبئبد أطحبة الوؼبشبد
Section C 3 Pensioners Statistics in the Civil Sector
Contents المحتوات
رقم الجدول
Table No
Title موضوعه
رقم الصفحة
Page No
C2 بانات أصحاب المعاشات األحاء Live Pensioners Data 11
C2.1 حسب المتوفين و عدد أصحاب المعاشات األحياء
الجنسNumber of Alive Pensioners & Dead Pensioners by Gender
12
C2.2 ألصحاب ومتوسط المعاش الشهري مجموع
حسب الجنسالمعاشات األحياء والمتوفين
Total & Average Monthly Pension of Alive and Dead Pensioners by Gender
13
C2.3 ومتوسط أصحاب المعاشات األحياء عدد
حسب الفئة العمرية المعاش الشهري
Number of Alive Pensioners & Average Monthly Pension by Age Group
15
C2.4 أصحاب المعاشات األحياء حسب المعاش عدد
الشهريNumber of Alive Pensioners by Monthly Pension
16

Statistical Report 2013 - Q3 نثانثانرتغ ا – 3102انتقرير اإلحصائي نؼاو
SIO_BA_ADA_REC_RPT_002
GCC Statistics – Version 1 Confidential/Internal/Public 12 of 42
Table( C2.1جدول )
3102 من عام الثالثالربع حسب الجنس حتى البحرنن و المتوفن أصحاب المعاشات األحاءملخص بعدد
Number of Bahraini Alive Pensioners & Dead Pensioners by Gender as at Q3 2013
Sector Civil القطاع المدن /
سنة عدد أصحاب المعاشات المتوفن عدد أصحاب المعاشات األحاء
انؼذد انكهيNumber of Alive Pensioners Number of Dead Pensioners
Year Grand معدل النمو المجموع Fإناث Mذكور معدل النمو المجموع Fإناث Mذكور
Total Male Female Total GR Male Female Total GR
2010 8,747 3,497 12,244 NA 3,000 281 3,281 NA 15,525
2011 9,235 3,848 13,083 7% 3,152 299 3,451 5% 16,534
2012 9,878 4,375 14,253 9% 3,337 323 3,660 6% 17,913
Quarter
2013 :Q1 10,028 4,539 14,567 2% 3,375 330 3,705 1% 18,272
Q2 10,193 4,648 14,841 4% 3,421 348 3,769 3% 18,610
Q3 10,336 4,762 15,098 6% 3,438 349 3,787 3% 18,885
Q4
Statistical Report 2013 - Q3 نثانثانرتغ ا – 3102انتقرير اإلحصائي نؼاو
SIO_BA_ADA_REC_RPT_002
GCC Statistics – Version 1 Confidential/Internal/Public 13 of 42
Table( C2.2جدول )
من الثالثحسب الجنس حتى الربع البحرنن ملخص بمجموع و متوسط المعاش الشهري ألصحاب المعاشات األحاء و المتوفن 3102عام
Total & Average Monthly Pension of Bahraini Alive and Dead Pensioners by Gender as at Q3 2013
Civil Sectorالقطاع المدن /
سنة
Total Monthly Pension يجىع انؼاش انشهري
انجىع أصحاب المعاشات المتوفن أصحاب المعاشات األحاء
Alive Pensioners Dead Pensioners انكهي
Year Grand معدل النمو المجموع Fإناث Mذكور معدل النمو المجموع Fإناث Mذكور
Total Male Female Total GR Male Female Total GR
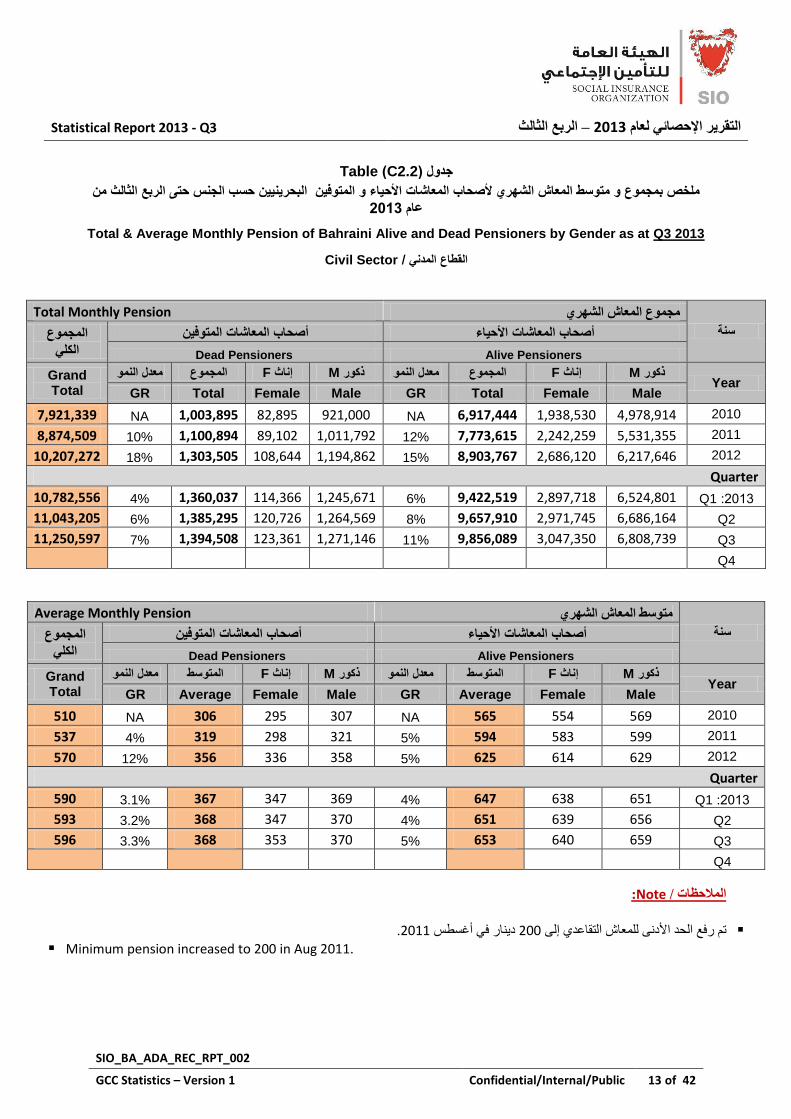
2010 4,978,914 1,938,530 6,917,444 NA 921,000 82,895 1,003,895 NA 7,921,339
2011 5,531,355 2,242,259 7,773,615 12% 1,011,792 89,102 1,100,894 10% 8,874,509
2012 6,217,646 2,686,120 8,903,767 15% 1,194,862 108,644 1,303,505 18% 10,207,272
Quarter
2013 :Q1 6,524,801 2,897,718 9,422,519 6% 1,245,671 114,366 1,360,037 4% 10,782,556
Q2 6,686,164 2,971,745 9,657,910 8% 1,264,569 120,726 1,385,295 6% 11,043,205
Q3 6,808,739 3,047,350 9,856,089 11% 1,271,146 123,361 1,394,508 7% 11,250,597
Q4
سنة
Average Monthly Pension يتىسط انؼاش انشهري
انجىع أصحاب المعاشات المتوفن أصحاب المعاشات األحاء
Alive Pensioners Dead Pensioners انكهي
Year Grand لنمومعدل ا المتوسط Fإناث Mذكور معدل النمو المتوسط Fإناث Mذكور
Total Male Female Average GR Male Female Average GR
2010 569 554 565 NA 307 295 306 NA 510
2011 599 583 594 5% 321 298 319 4% 537
2012 629 614 625 5% 358 336 356 12% 570
Quarter
2013 :Q1 651 638 647 4% 369 347 367 3.1% 590
Q2 656 639 651 4% 370 347 368 3.2% 593
Q3 659 640 653 5% 370 353 368 3.3% 596
Q4
:Noteانالحظات /
1100دبس ف أؿسطس 111رن سفغ الحذ األد للوؼبش الزمبػذ إل. Minimum pension increased to 200 in Aug 2011.

Statistical Report 2013 - Q3 نثانثانرتغ ا – 3102انتقرير اإلحصائي نؼاو
SIO_BA_ADA_REC_RPT_002
GCC Statistics – Version 1 Confidential/Internal/Public 14 of 42
Cont. Table( C2.2جدول )تابع

Statistical Report 2013 - Q3 نثانثانرتغ ا – 3102انتقرير اإلحصائي نؼاو
SIO_BA_ADA_REC_RPT_002
GCC Statistics – Version 1 Confidential/Internal/Public 15 of 42
Table( C2.3جدول )
الفئة العمرة بحسب موزعن و متوسط المعاش الشهري أصحاب المعاشات األحاءبعدد بان 3102 من عام الثالث الربع حتى الجنس و
Number of Alive Pensioners & Average Monthly Pension Classified by Age group & Sex as at Q3 2013
Sector Civil القطاع المدن /
الفئة العمرة Age Group
عدد أصحاب المعاشات األحاء Number of Alive Pensioners
متوسط المعاش الشهري
Average Monthly Pension
المجموع إناث ذكورالنسبة المئوة
المجموع إناث ذكور
Male Female Total % Male Female Total
25-29 10 2 12 0.08% 212 228 214
30-34 22 4 26 0.2% 225 203 221 35-39 94 20 114 1% 244 295 253 40-44 337 115 452 3% 296 410 325 45-49 775 447 1,222 8% 389 481 423 50-54 1,145 894 2,039 14% 494 521 506 55-59 2,135 1,523 3,658 24% 769 724 751 60-64 2,275 970 3,245 21% 798 731 778 65-69 1,553 454 2,007 13% 734 693 725 70-74 1,125 218 1,343 9% 636 585 628 75-79 502 73 575 4% 597 509 586 80-84 235 32 267 2% 582 453 566
85 + 128 10 138 1% 491 553 495
Total 10,336 4,762 15,098 100% 659 640 653 /المجموع
:Noteانالحظات /
طابحت هؼابش 2,547 ساخ حاش ثلاؾ ػاذدن 48-44أكجش ػذد هي أطحبة الوؼبشبد زوى إل الفئاخ الؼوشاخ الزا رزاشاح ثاي
ػبهب. 53-51%، رلب الفئخ الؼوشخ 47% الزكس 31رشول اإلبس هن
The highest number of pensioner (3,547) is in the age group 55-59, females represent 41% and males 57% of them at Q3 2013.
Statistical Report 2013 - Q3 نثانثانرتغ ا – 3102انتقرير اإلحصائي نؼاو
SIO_BA_ADA_REC_RPT_002
GCC Statistics – Version 1 Confidential/Internal/Public 16 of 42
Table( C2.4جدول ) بان بعدد أصحاب المعاشات األحاء موزعن حسب فئة المعاش الشهري
3102 من عام الثالثالربع حتى
Number of alive Pensioners Classified According to the Monthly Pension as at Q3 2013
Sector Civil القطاع المدن /
فئة المعاش الشهري Numberالعدد /
النسبة المئوة المجموع إناث ذكور
Monthly Pension Male Female Total %
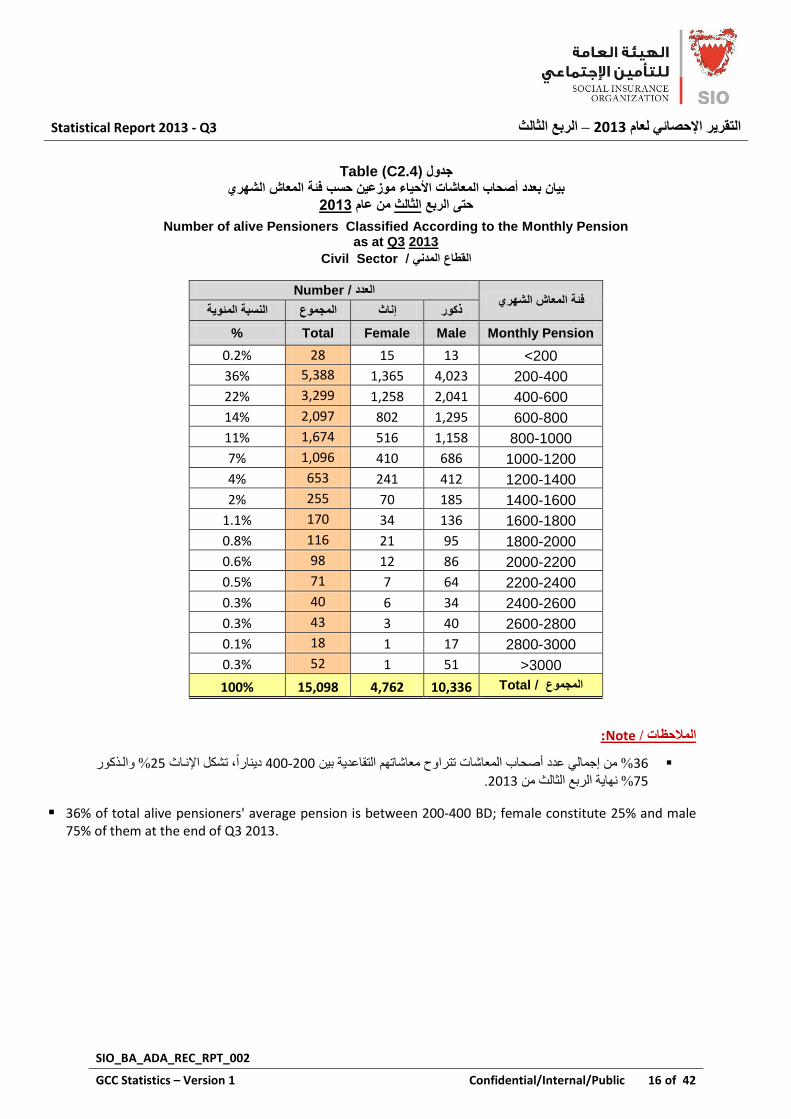
<200 13 15 28 0.2%
200-400 4,023 1,365 5,388 36%
400-600 2,041 1,258 3,299 22%
600-800 1,295 802 2,097 14%
800-1000 1,158 516 1,674 11%
1000-1200 686 410 1,096 7%
1200-1400 412 241 653 4%
1400-1600 185 70 255 2%
1600-1800 136 34 170 1.1%
1800-2000 95 21 116 0.8%
2000-2200 86 12 98 0.6%
2200-2400 64 7 71 0.5%
2400-2600 34 6 40 0.3%
2600-2800 40 3 43 0.3%
2800-3000 17 1 18 0.1%
>3000 51 1 52 0.3%
Total 10,336 4,762 15,098 100%المجموع /
:Noteانالحظات /
25 الازكس 14دبسا، رشول اإلابس 311-111% هي إموبل ػذد أطحبة الوؼبشبد رزشاح هؼبشبرن الزمبػذخ ثي %
.1102الشثغ الضبلش هي % بخ 64
36% of total alive pensioners' average pension is between 200-400 BD; female constitute 25% and male 75% of them at the end of Q3 2013.

Statistical Report 2013 - Q3 نثانثانرتغ ا – 3102انتقرير اإلحصائي نؼاو
SIO_BA_ADA_REC_RPT_002
GCC Statistics – Version 1 Confidential/Internal/Public 17 of 42
انثانثانجزء سزحمي ف المطبع الوذإحظبئبد أطحبة الو
Section C 3 Beneficiaries Statistics in the Civil Sector
Contents المحتوات
رقم الجدول
Table No
Title هموضوع
رقم الصفحة
Page No
Beneficiaries Data 17 بانات المستحقن 3
C3.1 متوسط المعاش مجموع و عدد المستحقين و
الشهري حسب الجنسNumber, Total & average Monthly Pension of Beneficiaries by Gender
18
C3.2 المستحقين حسب الفئة العمرية عدد Number of Beneficiaries Classified By Age Wise
20
C3.3 المستحقين حسب الراتب الشهري عدد Number of Beneficiaries Classified By Monthly Pension
21

Statistical Report 2013 - Q3 نثانثانرتغ ا – 3102انتقرير اإلحصائي نؼاو
SIO_BA_ADA_REC_RPT_002
GCC Statistics – Version 1 Confidential/Internal/Public 18 of 42
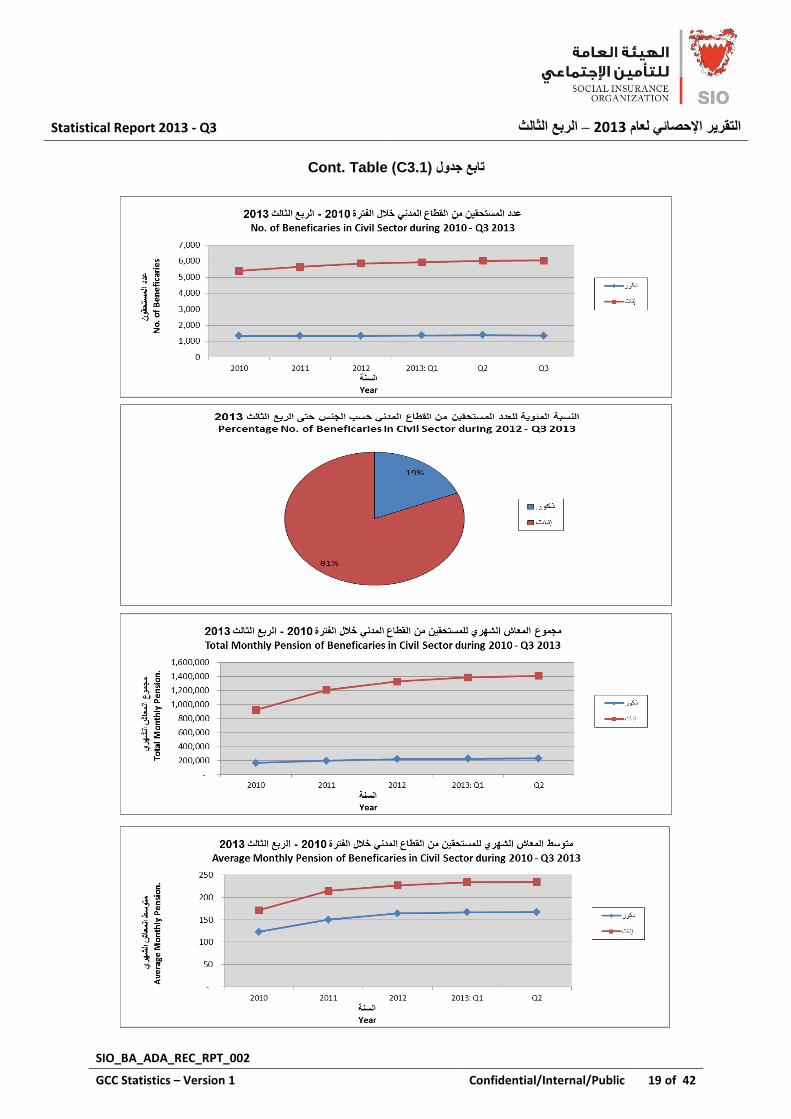
Table( C3.1جدول )
متوسط المعاش الشهري المنصرف لهم حسب الجنس حتى الربع مجموع و ملخص بعدد المستحقن عن المتوفن و 3102من عام الثالث
Number of Beneficiaries , Total & Average Monthly Pension by Gender as at Q3 2013
Civil Sectorالقطاع المدن /
سنةYear
المستحقنعدد Number of Beneficiaries
المعاش الشهري مجموع
Total Monthly Pension
المجموع إناث رذكو معدل النمو المجموع إناث ذكورمعدل النمو
Male Female Total GR Male Female Total GR
2010 1,338 5,394 6,732 NA 164,435 921,072 1,085,506 NA
2011 1,328 5,637 6,965 3% 198,952 1,208,659 1,407,611 30%
2012 1,341 5,860 7,201 3% 219,859 1,329,063 1,548,922 10%
Quarter
2013 :Q1 1,359 5,919 7,278 1.1% 226,336 1,385,272 1,611,608 4%
Q2 1,385 6,020 7,405 2.8% 231,572 1,409,211 1,640,782 6%
Q3 1,352 6,039 7,391 2.6% 255,731 1,617,704 1,873,435 21%
Q4 - - 0 -100.0% - - - -100%
سنةYear
عاش الشهريمتوسط الم
Average Monthly Pension
معدل النمو المجموع إناث ذكور
Male Female Total GR
2010 123 171 161 NA
2011 150 214 203 26%
2012 164 227 215 6%
Quarter
2013 :Q1 167 234 222 3%
Q2 167 234 222 3%
Q3 189 268 254 18%
Q4 - - - -
Statistical Report 2013 - Q3 نثانثانرتغ ا – 3102انتقرير اإلحصائي نؼاو
SIO_BA_ADA_REC_RPT_002
GCC Statistics – Version 1 Confidential/Internal/Public 19 of 42
Cont. Table( C3.1جدول )تابع
Statistical Report 2013 - Q3 نثانثانرتغ ا – 3102انتقرير اإلحصائي نؼاو
SIO_BA_ADA_REC_RPT_002
GCC Statistics – Version 1 Confidential/Internal/Public 20 of 42
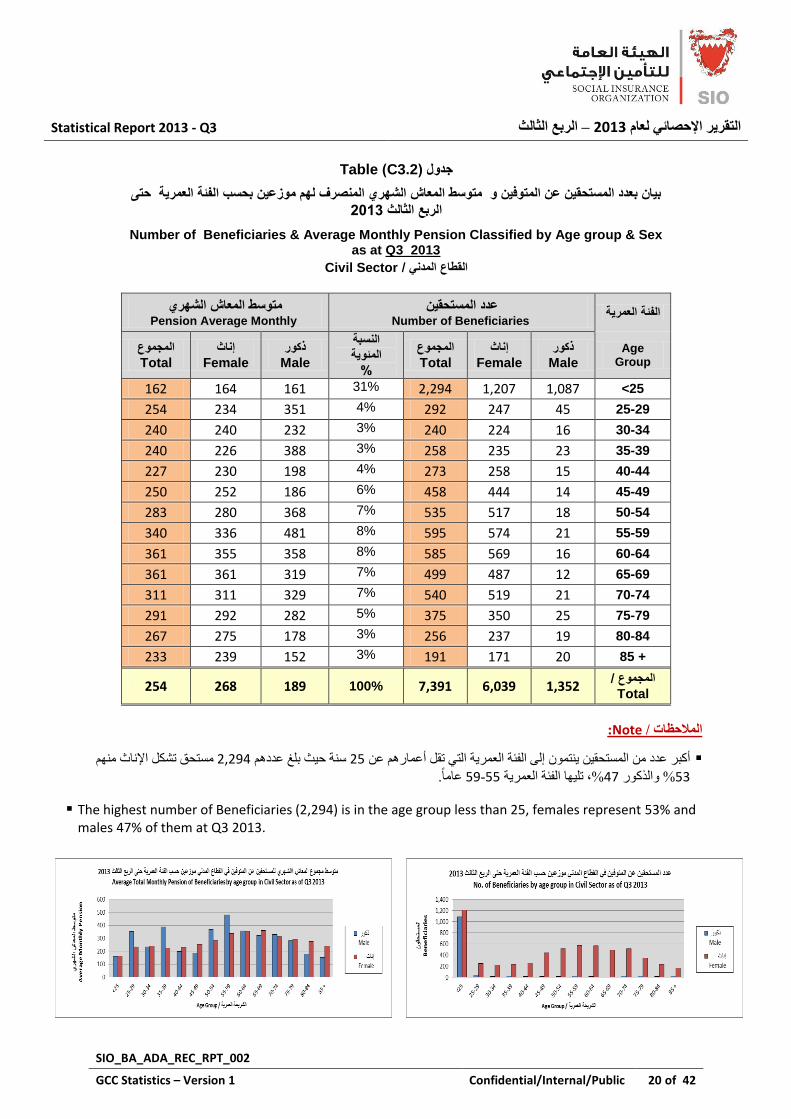
Table( C3.2جدول )
بان بعدد المستحقن عن المتوفن و متوسط المعاش الشهري المنصرف لهم موزعن بحسب الفئة العمرة حتى 3102 الثالثالربع
Number of Beneficiaries & Average Monthly Pension Classified by Age group & Sex as at Q3 2013
Civil Sectorالقطاع المدن /
الفئة العمرة المستحقن عدد
Number of Beneficiaries متوسط المعاش الشهري
Average Monthly Pension
Age Group
ذكورMale
إناثFemale
المجموعTotal
النسبة المئوة
%
ذكورMale
إناثFemale
المجموعTotal
<25 1,087 1,207 2,294 31% 161 164 162
25-29 45 247 292 4% 351 234 254
30-34 16 224 240 3% 232 240 240
35-39 23 235 258 3% 388 226 240
40-44 15 258 273 4% 198 230 227
45-49 14 444 458 6% 186 252 250
50-54 18 517 535 7% 368 280 283
55-59 21 574 595 8% 481 336 340
60-64 16 569 585 8% 358 355 361
65-69 12 487 499 7% 319 361 361
70-74 21 519 540 7% 329 311 311
75-79 25 350 375 5% 282 292 291
80-84 19 237 256 3% 178 275 267
85 + 20 171 191 3% 152 239 233
المجموع / Total
1,352 6,039 7,391 100% 189 268 254
:Noteانالحظات /
هسزحك رشول اإلبس هن 18183سخ حش ثلؾ ػذدن 14أكجش ػذد هي الوسزحمي زوى إل الفئخ الؼوشخ الز رمل أػوبسن ػي
ػبهب. 48-44%، رلب الفئخ الؼوشخ 36% الزكس 42
The highest number of Beneficiaries (2,294) is in the age group less than 25, females represent 53% and males 47% of them at Q3 2013.

Statistical Report 2013 - Q3 نثانثانرتغ ا – 3102انتقرير اإلحصائي نؼاو
SIO_BA_ADA_REC_RPT_002
GCC Statistics – Version 1 Confidential/Internal/Public 21 of 42
Table( C3.3جدول )
3102 الثالثبان بعدد المستحقن عن المتوفن موزعن حسب فئة المعاش الشهري حتى الربع
Number of Beneficiaries and Amount of Pensions Paid Classified According to the Monthly Pension as at Q3 2013
Civil Sectorالقطاع المدن /
فئة المعاش الشـــهري Monthly Pension
Numberالعدد /
النسبة المئوة المجموع إناث ذكور
Male Female Total %
<200 989 3,003 3,992 54%
200-400 244 2,187 2,431 33%
400-600 73 482 555 8%
600-800 24 191 215 3%
800-1000 8 84 92 1%
1000-1200 7 41 48 1%
1200-1400 4 17 21 0%
> 1400 3 34 37 1%
Total 1,352 6,039 7,391 100%المجموع /
:Noteانالحظات /
54 25% الازكس 75، رشاول اإلابس دابس 111هاي لالأالزمبػذاخ هؼبشابرن الوسازحمي هزساظ % هي إموبل ػاذد %
.1102الشثغ الضبلش هي بخ حز
44% of total Beneficiaries average pension less than 200, female constitute 75% and male 15% of them at the end of Q3 2013.
Statistical Report 2013 - Q3 نثانثانرتغ ا – 3102انتقرير اإلحصائي نؼاو
SIO_BA_ADA_REC_RPT_002
GCC Statistics – Version 1 Confidential/Internal/Public 22 of 42
:انقطاع انخاص انثانثانفصم
Chapter 2 : Private Sector

Statistical Report 2013 - Q3 نثانثانرتغ ا – 3102انتقرير اإلحصائي نؼاو
SIO_BA_ADA_REC_RPT_002
GCC Statistics – Version 1 Confidential/Internal/Public 23 of 42
Contents المحتوات
رقم الجدول
Table No Title موضوعه
رقم الصفحة
Page No
P1 ؤمن علهمبانات الم Contributors Data 23
P1.1 وظفين حسب الجنس و الجنسية الم عدد No of Employees by sex and Nationality
24
P1.2 مجموع و متوسط األجر الشهري للموظفين
حسب الجنس و الجنسيةTotal & Average Monthly Salary of Employees by sex and Nationality
25
P1.3 حسب الفئة العمرية وظفينالمعدد No of Employees Classified by Age Group
27
P1.4 حسب الفئة العمرية متوسط األجر الشهري Average Monthly Salary of Employees Classified by Age Group
28
P1.5 الشهري األجرحسب وظفينالم عدد No of Employees Classified By Monthly Salary
29
انثانثانجزء ؤهي ػلن ف المطبع الخبصإحظبئبد الو
Section P1 Contributors' Statistics in the Private Sector

Statistical Report 2013 - Q3 نثانثانرتغ ا – 3102انتقرير اإلحصائي نؼاو
SIO_BA_ADA_REC_RPT_002
GCC Statistics – Version 1 Confidential/Internal/Public 24 of 42
Table( P1.1جدول )
3102 من عام الثالثالربع حسب الجنس والجنسة حتى ؤمن علهمملخص بعدد الم
Number of Employees Subject to the Provision of Law Classified According to Gender and Nationality as at Q3 2013
Sector Private / خاصع الالقطا
سنةYear
Non-Bahrainiغر البحرن / Bahrainiالبحرن /
المجموع المجموع إناث ذكور
معدل النمو
معدل النمو المجموع إناث ذكور
Male Female Total GR Male Female Total GR Total
2008 55,732 23,612 79,344 NA 340,274 17,622 357,896 NA 437,240
2009 55,801 24,017 79,818 1% 356,076 19,197 375,273 5% 455,091
2010 56,996 24,491 81,487 2% 347,919 20,799 368,718 -2% 450,205
2011 56,269 24,068 80,337 -1% 348,387 21,927 370,314 0% 450,651
2012 57,982 24,703 82,685 3% 374,817 24,734 399,551 8% 482,236
Quarter
2013 :Q1 53,193 22,770 75,963 -8% 345,403 22,212 367,615 -8% 443,578
Q2 56,236 24,122 80,358 -3% 374,879 24,776 399,655 0% 480,013
Q3 58,753 25,177 83,930 2% 401,433 27,577 429,010 7% 512,940
Q4

Statistical Report 2013 - Q3 نثانثانرتغ ا – 3102انتقرير اإلحصائي نؼاو
SIO_BA_ADA_REC_RPT_002
GCC Statistics – Version 1 Confidential/Internal/Public 25 of 42
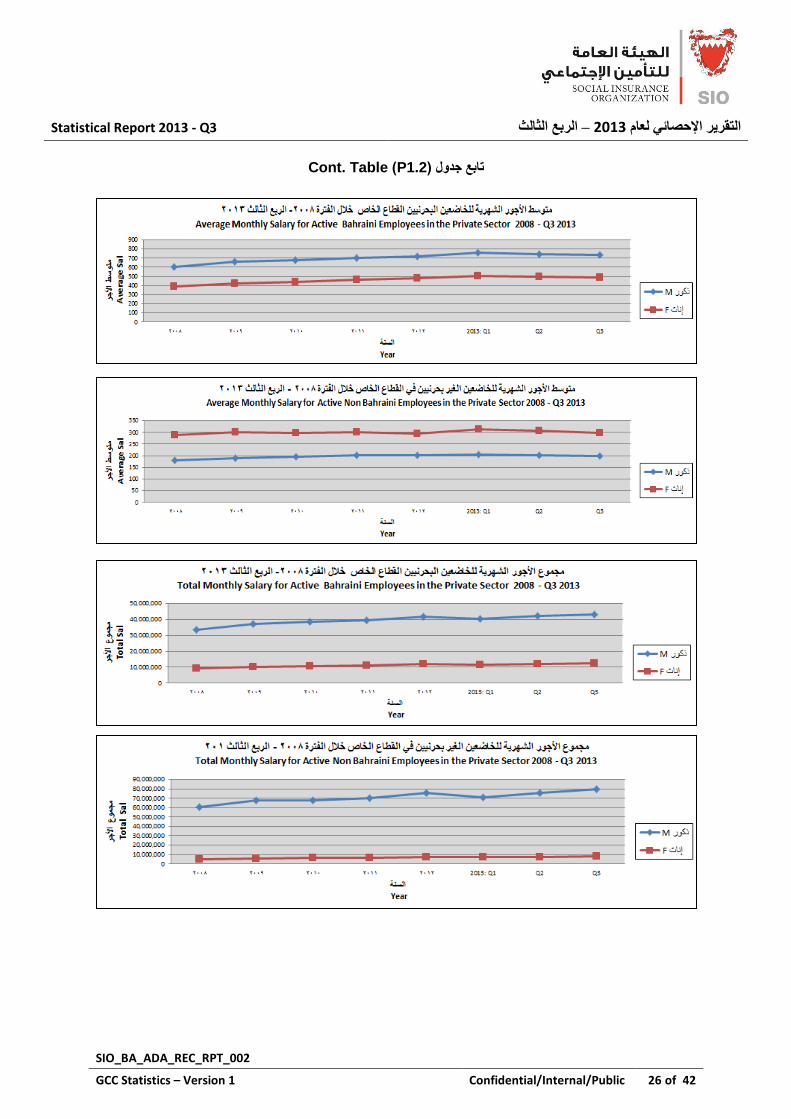
Table( P1.2جدول )
3102 من عام الثالثالربع موظفن الخاضعن حسب الجنس والجنسة حتى لل مجموع و متوسط الراتب الشهريملخص ب
Total & Average Monthly Salary of Employees Subject to the Provision of Law Classified According to Sex and Nationality as at Q3 2013
Sector Private / خاصالقطاع ال
سنةYear
Total Monthly Salary مجموع األجر الشهري
المجموع الكلGrand Total
Non-Bahrainiغر البحرن / Bahrainiالبحرن /
المجموع إناث ذكورمعدل النمو
المجموع إناث ذكورمعدل النمو
Male Female Total GR Male Female Total GR
2008 33,570,476 9,097,991 42,668,467 NA 60,979,254 5,067,741 66,046,994 NA 108,715,462
2009 37,032,465 10,151,369 47,183,834 11% 67,541,865 5,749,056 73,290,921 11% 120,474,756
2010 38,649,178 10,678,548 49,327,725 5% 68,088,841 6,196,388 74,285,229 1% 123,612,954
2011 39,694,423 11,100,975 50,795,398 3% 70,487,773 6,568,280 77,056,053 4% 127,851,451
2012 41,780,231 11,807,237 53,587,468 5% 75,760,374 7,293,414 83,053,788 8% 136,641,257
Quarter
2013 :Q1 40,536,525 11,396,122 54,003,933 0.8% 70,813,195 6,975,931 83,184,150 0% 137,188,082
Q2 42,042,230 11,961,703 54,003,933 0.8% 75,612,425 7,571,725 83,184,150 0% 137,188,082
Q3 43,070,887 12,357,408 55,428,295 3.4% 79,977,544 8,203,698 88,181,242 6% 143,609,537
Q4
سنةYear
Average Monthly Salary متوسط األجر الشهري
متوسط العامالTotal Aver.
Non-Bahrainiغر البحرن / Bahrainiالبحرن /
معدل النمو المجموع إناث ذكور معدل النمو المجموع إناث ذكور
Male Female Total GR Male Female Total GR
2008 602 385 538 NA 179 288 185 NA 249
2009 664 423 591 10% 190 299 195 6% 265
2010 678 436 605 2% 196 298 201 3% 275
2011 705 461 632 4% 202 300 208 3% 284
2012 721 478 648 3% 202 295 208 0% 283
Quarter
2013 :Q1 762 500 684 5.5% 205 314 212 1.8% 309
Q2 748 496 672 3.7% 202 306 208 0.1% 286
Q3 733 491 660 1.9% 199 297 206 -1.1% 280
Q4
Statistical Report 2013 - Q3 نثانثانرتغ ا – 3102انتقرير اإلحصائي نؼاو
SIO_BA_ADA_REC_RPT_002
GCC Statistics – Version 1 Confidential/Internal/Public 26 of 42
Cont. Table( P1.2جدول )تابع

Statistical Report 2013 - Q3 نثانثانرتغ ا – 3102انتقرير اإلحصائي نؼاو
SIO_BA_ADA_REC_RPT_002
GCC Statistics – Version 1 Confidential/Internal/Public 27 of 42
Table( P1.3جدول )
3102 من عام الثالث الربع الجنس والجنسة حتى و الفئة العمرة بحسب موزعنبعدد الموظفن الخاضعن بان
Number of Employees Subject to the Provision Of Law Classified by Age group, Sex & Nationality as at Q3 2013
Sector Private / خاصالقطاع ال
الفئة العمرة Age Group
Number of Employeeعدد الموظفن / عالمجمو
النسبة Non-Bahrainiغر بحرن / Bahrainiبحرن / المئوة
المجموع إناث ذكور المجموع إناث ذكورTotal %
Male Female Total Male Female Total
< 20 1,005 303 1,308 1,037 181 1,218 2,526 0.5% 20-24 9,294 3,368 12,662 27,222 2,971 30,193 42,855 8.4% 25-29 12,602 6,008 18,610 91,358 6,445 97,803 116,413 22.7% 30-34 10,773 5,288 16,061 92,826 6,409 99,235 115,296 22.5% 35-39 8,492 3,890 12,382 67,057 4,338 71,395 83,777 16.3% 40-44 5,588 2,518 8,106 51,658 3,074 54,732 62,838 12.3% 45-49 4,544 2,009 6,553 32,842 1,991 34,833 41,386 8.1% 50-54 3,456 1,193 4,649 20,953 1,289 22,242 26,891 5.2% 55-59 2,107 468 2,575 12,133 654 12,787 15,362 3.0% 60-64 640 105 745 3,513 192 3,705 4,450 0.9% 65+ 252 27 279 834 33 867 1,146 0.2%
Total 58,753 25,177 83,930 401,433 27,577 429,010 512,940 100%المجموع /
:Noteانالحظات /
يهاي إموابل ػاذد الواظفي الجحاش %60ى ساجخ ػبهاب شاول 28-11الؼذد األكجش هي الوظفي الخبضؼي رزاشاح أػوابسن ثاي
.1102% ف الشثغ الضبلش هي 69%، الزكس 31الخبضؼي روضل اإلبس هااي إمواابل ػااذد الوااظفي، ااؤ 4هظااو اان وضلااى حااال 3,599سااخ فاا كضش 44ثلااؾ ػااذد الوااظفي الاازي رجلااؾ أػواابسن %
ب الخذهخ إرا هب رافش ششط ساد الخذهخ.سزحمى هؼبشب رمبػذب ف حبلخ از Age wise employees between 20-39 years constitute 71% of total employees; females represent 31%
and males 69% at Q3 2013.
Number of employees with age 55 years and above equals to 3,599 and they constitute 4% of total employees. Those are entitled for a retirement pension in the event of ending their services subject to existence of years of service condition.

Statistical Report 2013 - Q3 نثانثانرتغ ا – 3102انتقرير اإلحصائي نؼاو
SIO_BA_ADA_REC_RPT_002
GCC Statistics – Version 1 Confidential/Internal/Public 28 of 42
Table( P1.4جدول ) الجنس والجنسة و الفئة العمرة بحسب موزعنف القطاع الخاص لموظفن الخاضعن ل متوسط الراتب الشهريببان
3102 من عام الثالثالربع حتى
Average Monthly Salary of Employees Subject to the Provision Of Law in the Private Sector Classified by Age group, Sex & Nationality as at Q3 2013
Sector Private / خاصالقطاع ال
ة الفئة العمرAge Group
المتوسط Average Monthly Salary/ الشهري متوسط الراتب Non-Bahrainiغر بحرن / Bahrainiبحرن / العام
Total المجموع إناث ذكور المجموع إناث ذكورAver. Male Female Total Male Female Total
<20 267 248 263 78 91 80 175
20-24 342 350 344 93 151 99 171 25-29 498 479 492 111 220 118 178 30-34 673 538 629 153 277 161 226 35-39 770 507 687 207 379 217 287 40-44 1,000 508 847 247 359 254 330 45-49 1,150 520 957 293 395 299 403 50-54 1,377 617 1,182 366 423 369 509 55-59 1,364 622 1,229 452 488 454 584 60-64 1,302 444 1,181 730 651 726 802 65+ 1,157 438 1,088 1,215 670 1,195 1,169
Total 733 491 660 199 297 206 280 /المجموع
:Noteانالحظات /
44الازي رزاشاح أػوابسن يهي الواظفي الجحاش دبسا( 08118 (1102ثلؾ أػل هزسظ سارت شش بخ الشثغ الضبلش هي ػبم-
سخ. 48 The highest average monthly salary for Bahrainis (1,218 BD) is in the age group 55-59.
Statistical Report 2013 - Q3 نثانثانرتغ ا – 3102انتقرير اإلحصائي نؼاو
SIO_BA_ADA_REC_RPT_002
GCC Statistics – Version 1 Confidential/Internal/Public 29 of 42
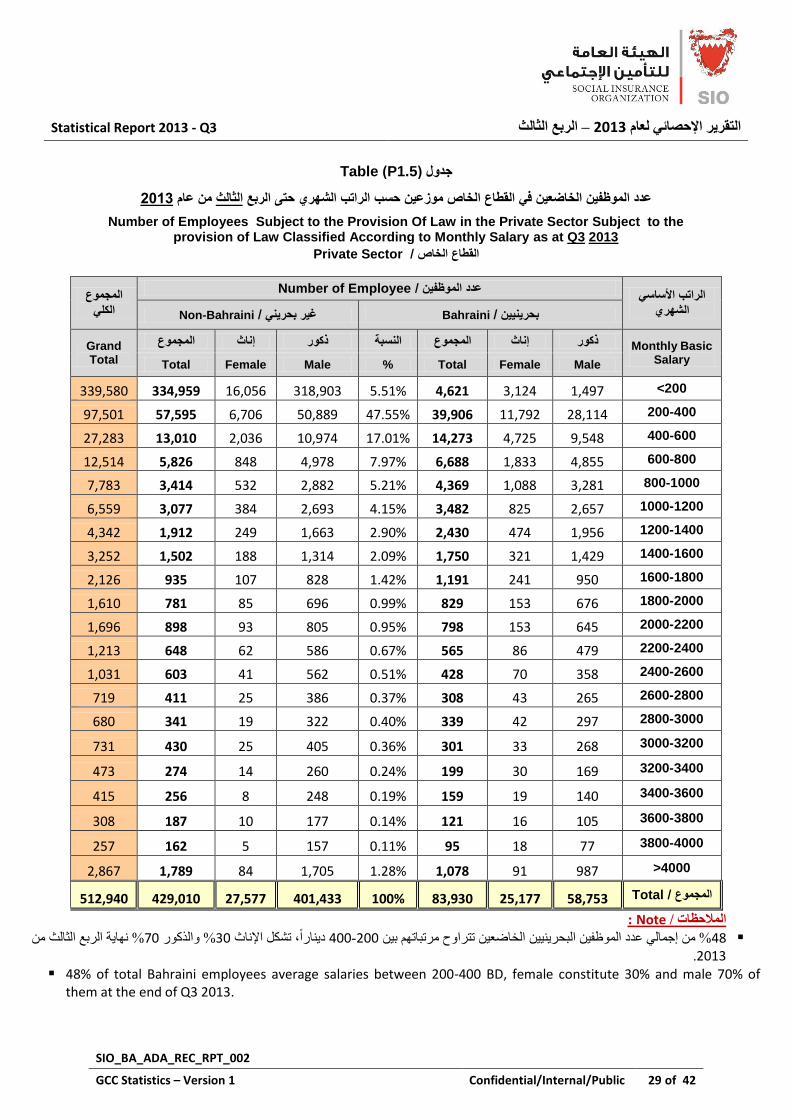
Table( P1.5جدول )
0231 من عام الثالثالربع الشهري حتى الراتبموزعن حسب خاصال ف القطاععدد الموظفن الخاضعن
Number of Employees Subject to the Provision Of Law in the Private Sector Subject to the provision of Law Classified According to Monthly Salary as at Q3 2013
Sector Private / خاصالقطاع ال
الراتب األساس الشهري
Number of Employeeعدد الموظفن / لمجموع ا
Non-Bahrainiغر بحرن / Bahraini/ نبحرن الكل
Monthly Basic Salary
Grand المجموع إناث ذكور النسبة المجموع إناث ذكورTotal Male Female Total % Male Female Total
<200 1,497 3,124 4,621 5.51% 318,903 16,056 334,959 339,580
200-400 28,114 11,792 39,906 47.55% 50,889 6,706 57,595 97,501
400-600 9,548 4,725 14,273 17.01% 10,974 2,036 13,010 27,283
600-800 4,855 1,833 6,688 7.97% 4,978 848 5,826 12,514
800-1000 3,281 1,088 4,369 5.21% 2,882 532 3,414 7,783
1000-1200 2,657 825 3,482 4.15% 2,693 384 3,077 6,559
1200-1400 1,956 474 2,430 2.90% 1,663 249 1,912 4,342
1400-1600 1,429 321 1,750 2.09% 1,314 188 1,502 3,252
1600-1800 950 241 1,191 1.42% 828 107 935 2,126
1800-2000 676 153 829 0.99% 696 85 781 1,610
2000-2200 645 153 798 0.95% 805 93 898 1,696
2200-2400 479 86 565 0.67% 586 62 648 1,213
2400-2600 358 70 428 0.51% 562 41 603 1,031
2600-2800 265 43 308 0.37% 386 25 411 719
2800-3000 297 42 339 0.40% 322 19 341 680
3000-3200 268 33 301 0.36% 405 25 430 731
3200-3400 169 30 199 0.24% 260 14 274 473
3400-3600 140 19 159 0.19% 248 8 256 415
3600-3800 105 16 121 0.14% 177 10 187 308
3800-4000 77 18 95 0.11% 157 5 162 257
>4000 987 91 1,078 1.28% 1,705 84 1,789 2,867
Total 58,753 25,177 83,930 100% 401,433 27,577 429,010 512,940المجموع /
: Noteانالحظات /
37بخ الشثغ الضبلش هي 61% الزكس 21دبسا، رشول اإلبس 311-111الخبضؼي رزشاح هشرجبرن ثي ي% هي إموبل ػذد الوظفي الجحش %
1102. 48% of total Bahraini employees average salaries between 200-400 BD, female constitute 30% and male 70% of
them at the end of Q3 2013.

Statistical Report 2013 - Q3 نثانثانرتغ ا – 3102انتقرير اإلحصائي نؼاو
SIO_BA_ADA_REC_RPT_002
GCC Statistics – Version 1 Confidential/Internal/Public 30 of 42
انثانثانجزء ف المطبع الخبص إحظبئبد أطحبة الوؼبشبد
Section 3 Pensioners Statistics in the Private Sector
Contents المحتوات
رقم الجدول
Table No
Title موضوعه
رقم الصفحة
Page No
P2.1 ت أصحاب المعاشات األحاءبانا Live Pensioners Data 30
P2.1 حسب المتوفين و عدد أصحاب المعاشات األحياء
الجنسNumber of Alive Pensioners & Dead Pensioners by Gender
31
P2.2 ألصحاب ومتوسط المعاش الشهري مجموع
حسب الجنسالمعاشات األحياء والمتوفين
Total & Average Monthly Pension of Alive and Dead Pensioners by Gender
32
P2.3 ومتوسط أصحاب المعاشات األحياء عدد
حسب الفئة العمرية المعاش الشهري
Number of Alive Pensioners & Average Monthly Pension by Age Group
34
P2.4 أصحاب المعاشات األحياء حسب المعاش عدد
الشهريNumber of Alive Pensioners by Monthly Pension
35
Statistical Report 2013 - Q3 نثانثانرتغ ا – 3102انتقرير اإلحصائي نؼاو
SIO_BA_ADA_REC_RPT_002
GCC Statistics – Version 1 Confidential/Internal/Public 31 of 42
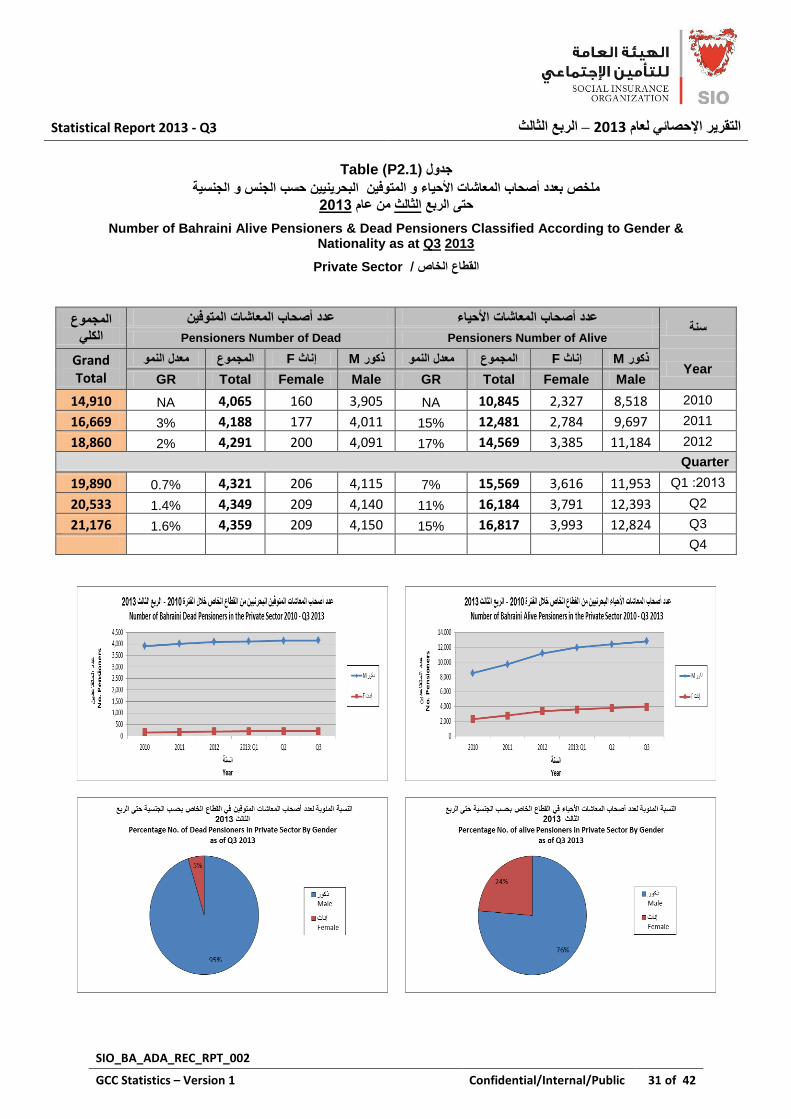
Table( P2.1جدول )
و الجنسة حسب الجنس البحرنن و المتوفن أصحاب المعاشات األحاءملخص بعدد 3102 من عام الثالثالربع حتى
Number of Bahraini Alive Pensioners & Dead Pensioners Classified According to Gender & Nationality as at Q3 2013
Sector Private / خاصالقطاع ال
سنةانجىع عدد أصحاب المعاشات المتوفن عدد أصحاب المعاشات األحاء
Number of Alive Pensioners Number of Dead Pensioners انكهي
Year Grand معدل النمو المجموع Fإناث Mذكور معدل النمو المجموع Fإناث Mذكور
Total Male Female Total GR Male Female Total GR
2010 8,518 2,327 10,845 NA 3,905 160 4,065 NA 14,910
2011 9,697 2,784 12,481 15% 4,011 177 4,188 3% 16,669
2012 11,184 3,385 14,569 17% 4,091 200 4,291 2% 18,860
Quarter
2013 :Q1 11,953 3,616 15,569 7% 4,115 206 4,321 0.7% 19,890
Q2 12,393 3,791 16,184 11% 4,140 209 4,349 1.4% 20,533
Q3 12,824 3,993 16,817 15% 4,150 209 4,359 1.6% 21,176
Q4

Statistical Report 2013 - Q3 نثانثانرتغ ا – 3102انتقرير اإلحصائي نؼاو
SIO_BA_ADA_REC_RPT_002
GCC Statistics – Version 1 Confidential/Internal/Public 32 of 42
Table( P2.2جدول )حسب الجنس حتى البحرنن مجموع ومتوسط المعاش الشهري ألصحاب المعاشات األحاء و المتوفن ملخص ب
3102من عام الثالثالربع Total and Average Monthly Pension of Bahraini alive and Dead Pensioners by
Gender as at Q3 2013
Private Sectorالقطاع خاص/
سنة
Total Monthly Pension انشهرييجىع انؼاش
انجىع أصحاب المعاشات المتوفن أصحاب المعاشات األحاء
Alive Pensioners Dead Pensioners انكهي
المجموع Fإناث Mذكور معدل النمو
المجموع Fإناث Mذكور معدل Grand النمو
Total Male Female Total GR Male Female Total GR
2010 5,595,292 1,015,612 6,610,904 NA 1,351,416 40,843 1,392,259 NA 8,003,163
2011 6,420,942 1,217,185 7,638,127 16% 1,400,934 46,252 1,447,187 4% 9,085,313
2012 7,471,810 1,455,513 8,927,323 17% 1,435,699 54,008 1,489,706 3% 10,417,029
Quarter
2013 :Q1 8,052,082 1,564,643 9,616,726 8% 1,446,525 56,889 1,503,414 1% 11,120,139
Q2 8,343,550 1,638,310 9,981,860 12% 1,456,019 58,053 1,514,072 2% 11,495,931
Q3 8,604,182 1,724,133 10,328,315 16% 1,460,505 58,053 1,518,558 2% 11,846,872
Q4
سنة
Average Monthly Pension ط انؼاش انشهرييتىس
أصحاب المعاشات المتوفن أصحاب المعاشات األحاء انتىسط انؼاو
Alive Pensioners Dead Pensioners
معدل النمو المجموع Fإناث Mذكور معدل النمو المجموع Fإناث Mذكور Average
Male Female Total GR Male Female Total GR
2010 657 436 610 NA 346 255 342 NA 537
2011 662 437 612 0% 349 261 346 1% 609
2012 668 430 613 0% 351 270 347 0.47% 699
Quarter
2013 :Q1 674 433 618 0.8% 352 276 348 0.22% 746
Q2 673 432 617 0.7% 352 278 348 0.28% 771
Q3 671 432 614 0.2% 352 278 348 0.35% 795
Q4
:Noteانالحظات /
1100دبس ف أؿسطس 111رن سفغ الحذ األد للوؼبش الزمبػذ إل.
Minimum pension increased to 200 in Aug 2011.

Statistical Report 2013 - Q3 نثانثانرتغ ا – 3102انتقرير اإلحصائي نؼاو
SIO_BA_ADA_REC_RPT_002
GCC Statistics – Version 1 Confidential/Internal/Public 33 of 42
Cont. Table( P2.2جدول )تابع

Statistical Report 2013 - Q3 نثانثانرتغ ا – 3102انتقرير اإلحصائي نؼاو
SIO_BA_ADA_REC_RPT_002
GCC Statistics – Version 1 Confidential/Internal/Public 34 of 42
Table( P2.3جدول )
الفئة العمرة بحسب موزعن البحرنن و متوسط المعاش الشهري أصحاب المعاشات األحاءبعدد بان 3102 من عام الثالث الربع حتى الجنس و
Number of Alive Pensioners & Average Monthly Pension Classified by Age group & Sex as at Q3 2013
Sector Private / خاصالقطاع ال
فئة العمرة الAge
group
متوسط المعاش الشهري عدد أصحاب المعاشات األحاء
Number of Alive Pensioners Average Monthly Pension
المتوسط Fإناث Mذكور ئوةالنسبة الم المجموع Fإناث Mذكور
Male Female Total % Male Female Average
<24 4 4 0.02% 359 359
25-29 21 3 24 0.1% 371 362 370
30-34 49 83 132 1% 362 325 339
35-39 251 560 811 5% 358 335 342
40-44 962 737 1,699 10% 389 365 378
45-49 1531 872 2,403 14% 501 405 466
50-54 2077 856 2,933 17.4% 662 488 611
55-59 2330 567 2,897 17.2% 818 530 762
60-64 2288 235 2,523 15% 820 545 795
65-69 1261 47 1,308 8% 800 573 792
70-74 891 18 909 5% 680 435 675
75-79 558 5 563 3% 556 447 555
80-84 382 7 389 2% 470 429 469
85 + 219 3 222 1% 379 193 377
المجموع / Total
12,824 3,993 16,817 100% 671 432 614
:Noteحظات / انال
طبحت 1,822سخ حش ثلؾ ػذدن 54-50زوى إل الفئخ الؼوشخ الز رزشاح ثي يالوؼبشبد الجحشأكجش ػذد هي أطحبة
ػبهب. 94-45%، رلب الفئخ الؼوشخ 60% الزكس 18هؼبش رشول اإلبس هن
The highest number of pensioner (2,822) is in the age group 50-54, females represent 19% and males 81% of them at Q3 2013.

Statistical Report 2013 - Q3 نثانثانرتغ ا – 3102انتقرير اإلحصائي نؼاو
SIO_BA_ADA_REC_RPT_002
GCC Statistics – Version 1 Confidential/Internal/Public 35 of 42
Table( P2.4جدول ) موزعن حسب فئة المعاش الشهري البحرنن بان بعدد أصحاب المعاشات األحاء
3102 من عام الثالثالربع حتى
Number of Bahraini alive Pensioners Classified According to the Paid Pension as at Q3 2013
Sector Private / خاصالقطاع ال
فئة المعاش الشهري Numberالعدد /
النسبة المئوة المجموع إناث ذكور
Monthly Pension Male Female Total %
<200 196 43 239 1%
200-400 4,956 2,882 7,838 47%
400-600 2,832 573 3,405 20%
600-800 1,657 238 1,895 11%
800-1000 1,172 122 1,294 8%
1000-1200 632 59 691 4%
1200-1400 399 33 432 3%
1400-1600 269 16 285 2%
1600-1800 203 7 210 1%
1800-2000 118 3 121 0.7%
2000-2200 86 2 88 0.5%
2200-2400 67 3 70 0.4%
2400-2600 45 3 48 0.3%
2600-2800 33 3 36 0.2%
2800-3000 54 4 58 0.3%
>3000 105 2 107 1%
Total 12,824 3,993 16,817 100%المجموع /
:Noteانالحظات /
36 الازكس 26دبسا، رشول اإلابس 311-111% هي إموبل ػذد أطحبة الوؼبشبد رزشاح هؼبشبرن الزمبػذخ ثي %
.1102الضبلش هي الشثغ % بخ 52
47% of total alive pensioners average pension is between 200-400 BD, female constitute 37% and male 63% of them at the end of Q3 2013.
Statistical Report 2013 - Q3 نثانثانرتغ ا – 3102انتقرير اإلحصائي نؼاو
SIO_BA_ADA_REC_RPT_002
GCC Statistics – Version 1 Confidential/Internal/Public 36 of 42
انثانثانجزء سزحمي ف المطبع الخبصإحظبئبد أطحبة الو
Section P 3 Beneficiaries Statistics in the Private Sector
Contents المحتوات
رقم الجدول
Table No
Title موضوعه
رقم الصفحة
Page No
Beneficiaries Data 36 بانات المستحقن 3
P3.1 متوسط المعاش مجموع و عدد المستحقين و
الشهري حسب الجنسNumber, Total & average Monthly Pension of Beneficiaries by Gender
37
P3.2 المستحقين حسب الفئة العمرية عدد Number of Beneficiaries Classified By Age Wise
39
P3.3 المستحقين حسب الراتب الشهري عدد Number of Beneficiaries Classified By Monthly Pension
40

Statistical Report 2013 - Q3 نثانثانرتغ ا – 3102انتقرير اإلحصائي نؼاو
SIO_BA_ADA_REC_RPT_002
GCC Statistics – Version 1 Confidential/Internal/Public 37 of 42
Table( P3.1جدول )
متوسط المعاش الشهري المنصرف لهم حسب الجنس حتى الربع مجموع ون المتوفن و ملخص بعدد المستحقن ع 3102من عام الثالث
Number of Beneficiaries, Total & Average Monthly Pension by Gender as at Q3 2013
Private Sectorالقطاع خاص/
سنةYear
المستحقنعدد Number of Beneficiaries
المعاش الشهري وعمجم
Total Monthly Pension
المجموع إناث ذكورمعدل النمو
معدل النمو المجموع إناث ذكور
Male Female Total GR Male Female Total GR
2010 6,578 267 6,845 NA 1,351,243 41,031 1,392,274 NA
2011 6,871 306 7,177 5% 1,400,692 46,440 1,447,132 3.9%
2012 7,125 364 7,489 4% 1,435,318 54,120 1,489,438 3%
Quarter
2013 :Q1 7,196 383 7,579 1% 1,446,381 57,002 1,503,383 0.9%
Q2 7,282 388 7,670 2% 1,456,242 58,165 1,514,407 1.7%
Q3 7,311 388 7,699 3% 1,460,728 58,165 1,518,893 2.0%
Q4
سنةYear
متوسط المعاش الشهري
Average Monthly Pension
معدل النمو المجموع إناث ذكور
Male Female Total GR
2010 205 154 203 NA
2011 204 152 202 -1%
2012 201 149 199 -1%
Quarter
2013 :Q1 201 149 198 -0.3%
Q2 200 150 197 -0.7%
Q3 200 150 197 -1%
Q4

Statistical Report 2013 - Q3 نثانثانرتغ ا – 3102انتقرير اإلحصائي نؼاو
SIO_BA_ADA_REC_RPT_002
GCC Statistics – Version 1 Confidential/Internal/Public 38 of 42
Cont. Table( P3.1جدول )تابع

Statistical Report 2013 - Q3 نثانثانرتغ ا – 3102انتقرير اإلحصائي نؼاو
SIO_BA_ADA_REC_RPT_002
GCC Statistics – Version 1 Confidential/Internal/Public 39 of 42
الفئة العمرة المستحقن عدد
Number of Beneficiaries متوسط المعاش الشهري
Average Monthly Pension
Age Group
ذكورMale
إناثFemale
المجموعTotal
النسبة المئوة
%
ذكورMale
إناثFemale
المجموعTotal
< 25 2,191 220 2,411 31% 156 157 156
25-29 240 12 252 3% 205 210 206
30-34 198 5 203 3% 197 141 196
35-39 285 6 291 4% 197 175 196
40-44 305 3 308 4% 199 221 199
45-49 474 5 479 6% 201 128 200
50-54 594 12 606 8% 221 273 222
55-59 634 22 656 9% 233 91 228
60-64 562 17 579 8% 249 103 244
65-69 547 23 570 7% 247 106 241
70-74 542 23 565 7% 220 123 216
75-79 389 19 408 5% 209 151 206
80-84 219 12 231 3% 195 173 194
85 + 131 9 140 2% 167 84 162
المجموع / Total
7,311 388 7,699 100% 200 150 197
:Noteحظات / انال
هسزحك رشول اإلبس هن 18300سخ حش ثلؾ ػذدن 14أكجش ػذد هي الوسزحمي زوى إل الفئخ الؼوشخ الز رمل أػوبسن ػي
.%80% الزكس 8
The highest number of Beneficiaries (2,300) is in the age group less than 25, females represent 9% and males 91% of them at Q3 2013.
Table( P3.2جدول )
بان بعدد المستحقن عن المتوفن و متوسط المعاش الشهري المنصرف لهم موزعن بحسب الفئة العمرة حتى 3102 الثالثالربع
Number of Beneficiaries & Average Monthly Pension Classified by Age group & Sex as at Q3 2013
Private Sectorالقطاع خاص/

Statistical Report 2013 - Q3 نثانثانرتغ ا – 3102انتقرير اإلحصائي نؼاو
SIO_BA_ADA_REC_RPT_002
GCC Statistics – Version 1 Confidential/Internal/Public 40 of 42
Table( P3.3جدول )
3102 الثالثبان بعدد المستحقن عن المتوفن موزعن حسب فئة المعاش الشهري حتى الربع
Number of Beneficiaries and Amount of Pensions Paid Classified According to the Monthly Pension as at Q3 2013
Private Sectorطاع خاص/ الق
فئة المعاش الشـــهري Monthly Pension
Numberالعدد /
النسبة المئوة المجموع إناث ذكور
Male Female Total %
<200 4,400 322 4,722 61%
200-400 2,398 57 2,455 32%
400-600 361 5 366 5%
600-800 95 1 96 1%
800-1000 39 1 40 0.5%
1000-1200 7 1 8 0.10%
1200-1400 2 2 0.03%
> 1400 9 1 10 0.13%
Total 7,311 388 7,699 100%المجموع /
:Noteانالحظات /
50 حزا % 82% الازكس 6، رشول اإلبس دبس 111هي أللالزمبػذخ هؼبشبرن الوسزحمي هزسظ % هي إموبل ػذد
.1102الشثغ الضبلش هي بخ
61% of total Beneficiaries average pension less than 200, female constitutes 7% and male 93% of them at the end of Q3 2013.

Statistical Report 2013 - Q3 نثانثانرتغ ا – 3102انتقرير اإلحصائي نؼاو
SIO_BA_ADA_REC_RPT_002
GCC Statistics – Version 1 Confidential/Internal/Public 41 of 42
فهرس انصطهحات
انتؼريف انصطهح
انؤي ػهيه
0864( لسخ 02المطبع الوذ : الوظو الخبضغ لظبم الزمبػذ الوذ سلن )
المطبع ال
0865( لسخ 13خبص: الؼبهل الز رسش ػل أحوبم لبى الز هي ا مزوبػ سلن )
انراتة
ؼ الشارت الز حظل ػل الوظو الخبضغ ألحوبم زا المبى المطبع الوذ :
.الشارت األسبس الشش دى أخ إضبفبد أخش رضن إل ثحست
ط للوؤهي ػل مذا ثظفخ دسخ أ هزظوخ همبثل ػول سا المطبع الخبص: كل هب ؼ
كبى ذفغ ثبلشش أ ثبألسجع أ ثبلم أ ثبلسبػخ أ ثبلمطؼخ أ ثبإلزبط.
يذة انخذية
رؼ األشش الوبهلخ الز لضبب الوظو ف خذهخ الحوهخ إل ثلؽ سي السزي ، رلك
ثلؽ سي الضبهخ ػششح أوب ألشة كبى هز خشا ثحذ هز ا لزحبق ثبلؼول الحوه أ ػذ
ششا، ؼزجش الشش مضا هي أص ػشش ششا هي السخ الوالدخ، 371ألظ لذس
ششا كبهال. شرؼزجش كسس الش
الوظو الز ازذ خذهز. انتقاػذ
انؼاش
لوسزحمي ػ.الوجلؾ الز ظشف ششب ثومت زا المبى للوزمبػذ أ ل
صاحة انؼاش
. الوزمبػذ الز رمشس ل هؼبش ثومت زا المبى
الشخض الز رمشس ل هؼبش ثسجت لشاثز هي طبحت الوؼبش. انستحق

Statistical Report 2013 - Q3 نثانثانرتغ ا – 3102انتقرير اإلحصائي نؼاو
SIO_BA_ADA_REC_RPT_002
GCC Statistics – Version 1 Confidential/Internal/Public 42 of 42
Terms of reference
Definition Term
Civil Sector: Employee subject to the provisions of law No. (13) for
year 1975.
Private Sector: Worker subject to the provisions of law No. (24) for
year 1976.
Employee
Civil Sector: Is salary received by the Employee who is subject to the
provisions of law No. (13) for year 1975, based on the basic monthly
salary without any other additions to it.
Private Sector: Salary will include allowances, bonuses and
commission of permanent and continuous nature.
Salary
Is the number of full months spent by the Employee at the Service
of the Government until reaching the age of sixty for men, and fifty
five for women. This is calculated from the date of joining
Government Service or from the date he reached the age of
eighteen , whichever date comes last and to a maximum of 480
months. The month is a part of twelve months of a Gregorian year.
Fractions of a month are considered as a full month.
The Service Period
Is the Employee who’s service has terminated. The Retired Person
Is the sum of money which is paid every month to the retired
person or those entitled for him in accordance with this Law. The Pension
Is the retired person for whom a pension has been decided in
accordance with this law. The Pensioner
Is the person for whom a pension has been decided because of his
family relationship with the Pensioner. The Entitled Person