19820305 - yonsei
TRANSCRIPT

1
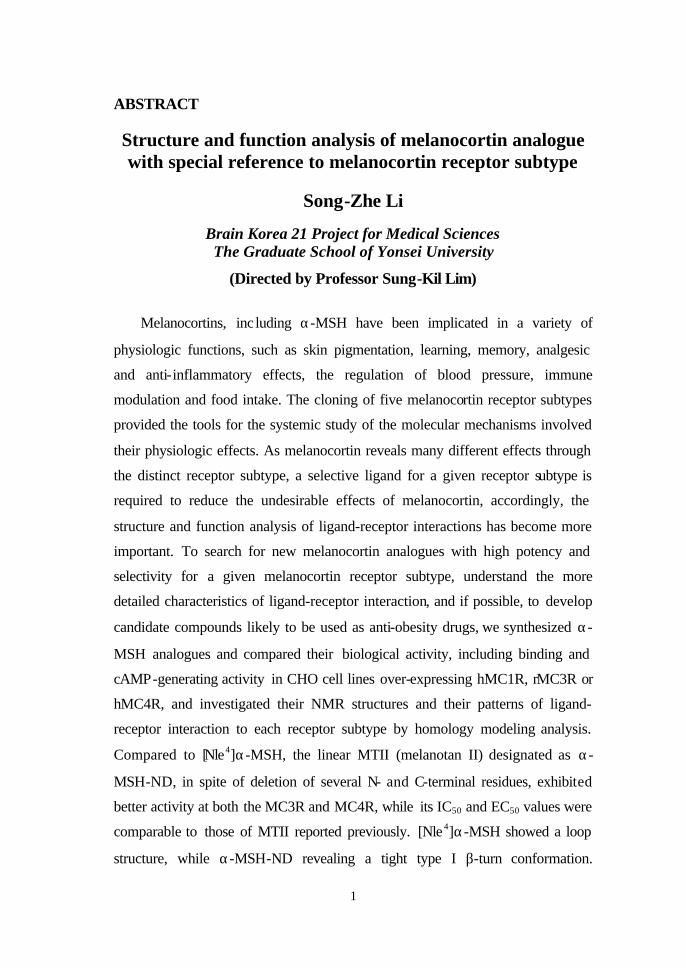
ABSTRACT
Structure and function analysis of melanocortin analogue with special reference to melanocortin receptor subtype
Song-Zhe Li
Brain Korea 21 Project for Medical Sciences The Graduate School of Yonsei University
(Directed by Professor Sung-Kil Lim)
Melanocortins, inc luding α-MSH have been implicated in a variety of
physiologic functions, such as skin pigmentation, learning, memory, analgesic
and anti-inflammatory effects, the regulation of blood pressure, immune
modulation and food intake. The cloning of five melanocortin receptor subtypes
provided the tools for the systemic study of the molecular mechanisms involved
their physiologic effects. As melanocortin reveals many different effects through
the distinct receptor subtype, a selective ligand for a given receptor subtype is
required to reduce the undesirable effects of melanocortin, accordingly, the
structure and function analysis of ligand-receptor interactions has become more
important. To search for new melanocortin analogues with high potency and
selectivity for a given melanocortin receptor subtype, understand the more
detailed characteristics of ligand-receptor interaction, and if possible, to develop
candidate compounds likely to be used as anti-obesity drugs, we synthesized α-
MSH analogues and compared their biological activity, including binding and
cAMP-generating activity in CHO cell lines over-expressing hMC1R, rMC3R or
hMC4R, and investigated their NMR structures and their patterns of ligand-
receptor interaction to each receptor subtype by homology modeling analysis.
Compared to [Nle4]α-MSH, the linear MTII (melanotan II) designated as α-
MSH-ND, in spite of deletion of several N- and C-terminal residues, exhibited
better activity at both the MC3R and MC4R, while its IC50 and EC50 values were
comparable to those of MTII reported previously. [Nle4]α-MSH showed a loop
structure, while α-MSH-ND revealing a tight type I β-turn conformation.
2
Substitution of the His6 residue of α-MSH-ND by Gln, Trp, Asn, Arg, Lys or Tyr,
with the exception of [Arg6]α-MSH-ND, most of the α-MSH-ND analogues
revealed lower activity than α-MSH-ND at all three receptors. Among the several
analogues examined, [Gln6]α-MSH-ND had about 10,000 times less biological
activity than α-MSH-ND at MC1R, whereas, the potencies of both oligopeptides
were comparable at MC3R or MC4R. [Gln6]α-MSH-ND exhibited a type I’ β-
turn that was very similar to the type I β-turn structure of α-MSH-ND, but a
remarkable structural difference was observed at the side chain orientations of the
6th and 7th residues of [Gln6]α-MSH-ND, which were mirror images of those of
α-MSH-ND. By homology modeling analysis, His6 of α-MSH-ND was found to
interact with the TM2 regions of all three receptors (Glu94 of MC1R, Glu94 of
MC3R, and Glu100 of MC4R), but [Gln6]α-MSH-ND did not. The phenyl ring of
the D-Phe7 residue of [Gln6]α-MSH-ND revealed interaction with the TM3
regions of MC3R and MC4R (Ser122 of MC3R or Ser127 of MC4R). In MC1R,
however, these serine residues corresponded to Val122, which contains two methyl
groups that induce steric hindrance with D-Phe7 of [Gln6]α-MSH-ND. This might
explain why the biological activity of [Gln6]α-MSH-ND at MC1R was
significantly lower than that at MC3R or MC4R. In the in vivo experiments, it
was found that intraperitoneal injection of α-MSH-ND (100nmole) gave rise to a
significant inhibition of food intake for up to 3 hours (P<0.05 or P<0.01). These
results suggest that a type I β-turn conformation comprising the residues of Asp5-
His6-(D-Phe)7-Arg8 is important, especially, the side chain orientations of 6th and
7th residues is critical for determination of potency and selectivity of
melanocortin analogues. MC1R-reluctance with the preservation of comparable
MC3R and MC4R selectivity could be achieved by modifying the D-Phe7
orientation of α-MSH-ND, while keeping the ‘type I β-turn’-like structure. In
addition, α-MSH-ND and its derivatives, especially those with high biological
activity at MC3R and/or MC4R, could directly inhibit food intake.
Key Words: melanocortin receptor; binding affinity; cAMP-generating activity; NMR; type I β-turn; homology modeling.
3
Structure and function analysis of melanocortin analogue with special reference to melanocortin receptor subtype
Song-Zhe Li
Brain Korea 21 Project for Medical Sciences The Graduate School of Yonsei University
(Directed by Professor Sung-Kil Lim)
I. INTRODUCTION
The peptide hormone precursor pro-opiomelanocortin (POMC) is post-
translationally cleaved to give rise to a variety of biologically active substances
called melanocortic peptides (melanocortins), inc luding α-, β-, and γ-melanocyte
stimulating hormones (MSH) and adrenocorticotropin(1). Melanocortins are
primarily known to for their role in the regulation of skin pigmentation(2), adrenal
steroid production(3). They also induce wide array of physiological effects. For
example, the melanocortins have been shown to affect memory, behavior,
inflammation, pyretic control, analgesia, blood pressure, nerve growth and
regeneration and weight homeostasis, and to influence events surrounding
parturition(4-9). The cloning of five different melanocortin receptors (MC1R-
MC5R)(10-14) during the years 1992-1994 started a new era in the research on the
melanocortin receptors and provided tools for systematic studies of the molecular
mechanisms exerting the above effects.
The melanocortin receptors show distinct distributions in the body(15,16). The
melnocortin MC1 receptor (MC1R) was first recognized as the peripheral MSH
receptor which is present in the melnocytes, where it regulates the pigmentation
of the skin in a variety of vertebrates(17). More recently, it has become known that
the MC1R is present in many cell types, including the periphery and CNS system,
such as melanoma cells(18), macrophage and monocytes(19,20), neutrophils(21),
endothelial cells(20), glioma cell and astrocytes(22), fibroblasts(23) and keratinocyte (24). The melanocortin MC2 receptor (MC2R) was recognized as the ACTH
4
receptor and participates in the regulation of steroid production in the adrenal
gland. The melanocortin MC3 receptor (MC3R) is found in the brain, and in
placenta, gut and heart tissue(12,25,26). The MC4 receptors (MC4R) has only been
found in the CNS, where it is expressed at distinct loci, including the cortex,
thalamus, hypothalamus, brain stem and spinal cord(13,27). The melanocortin MC5
receptor (MC5R) was found to have a wide distribution in the body. Although
the MC4R expression was not detectable in the periphery in detailed studies
covering 20 human organs(26), the MC4R was expressed in many peripheral
tissues of the chicken(28).
POMC gene expression is limited to ARC (arcuate) neurons that project to
areas that express melanocortin receptors and participate in energy homeostasis.
Since leptin receptors are expressed on POMC neurons, melanocortin neurons
appear to be a target of leptin action(29,30). MC3R and MC4R, unlike the other
subtypes, were found mainly at distinct loci in the central nervous system,
especially, the ventromedial nucleus of the hypothalamus (VMH) which is
considered most important in the regulation of feeding(25). Mutations of the
POMC gene in humans(31) or the MC4R gene in mice(32) have resulted in obesity,
while the overexpression of agouti or agouti-related protein has also induced
obesity in mice(33). Activation of the MC4R by α-MSH increases the energy
expenditure, decreases the food intake, and promotes sympathetic activity(6).
Recently, Chen et al found that MC3R-knockout mice have increased fat mass,
reduced lean mass and higher feed efficiency and demonstrated that MC3R also
serves non-redundant roles similar to MC4R in the regulation of energy
homeostasis(34). These findings, directly or indirectly, provided the evidences that
melanocortin is involved critically in the control of food intake and body weight
homeostasis via MC3R and MC4R. Therefore, MC3R- and/or MC4R-selective
substances have been listed as important one of the candidates in development of
anti-obesity drugs.
The natural melanocortic peptides (α-MSH, β-MSH, γ-MSH and ACTH) do
not clearly discriminate between the different melanocortin receptor subtypes,
with the exception that α-MSH is selective for the MC1R and ACTH for the
5
MC2R. A very useful linear peptide is [Nle 4, D-Phe7]α-MSH (Melanotan-I,
NDP-MSH) as it shows high affinity for the melanocortin receptors, and as it can
be labeled with iodine and used as radioligand. However, most (if not all) of
these linear or cyclic peptides (at least as far as they have been tested) seem not
to deviate from the potency order MC1R > MC3R > MC4R > MC5R.
Melanotan-II(MTII) is a cyclic MSH analogue synthesized quite long time ago(35).
It has recently been used in various functional studies as a non-selective
MC3R/MC4R agonist, whereas it is still quite potent at MC1R(16). Subsequently,
Hruby et al. synthesized a cyclic lactam peptide, SHU9119, which was claimed
to show selectivity and antagonistic activity at MC4R(36). However, Schiöth et al.
found that the compound to be essentially non-selective for the melanocortin
receptor subtypes(37). Thus the usefulness of SHU9119 as an experimental tool for
melanocortin receptor subtype classification seems to be limited(16). Until now,
most α-MSH analogues have preferably bound to the MC1R, MC3R and the
MC4R with high affinity. Development of melanocortin receptor antagonist and
selective melanocortin receptor active compounds especially for the MC3R and
MC4R is still an important task.
NDP-MSH with a seven-lactam-ring structure has been known as the most
potent melanocortin agonist(38). The substitution of Phe7 in α-MSH to D-Phe7
increased the receptor-binding and cAMP response, providing the insight that the
core structure of α-MSH analogues is critically important for ligand-receptor
interaction and selectivity(39). To search for new melanocortin analogues with
high potency and selectivity for a given melanocortin receptor subtype,
understand the more detailed characteristics of ligand-receptor interaction, and if
possible, to develop candidate compounds likely to be used as anti-obesity drugs,
we synthesized several new α-MSH analogues with D-Phe at the 7th position and
tested their biological activity in CHO cell lines stably transfected with hMC1R,
rMC3R or hMC4R, and their conformational features with NMR spectroscopy.
Furthermore, we evaluated the ligand-binding traits of the three melanocortin
receptor subtypes with homology modeling analysis. Finally, the synthetic
6
melanocortin analogue with the highest biological activity at MC3R and MC4R
was tested in vivo to evaluate if it has an inhibitory effect on food intake.
II. MATERIALS AND METHODS
1. Chemicals
All media and sera for cell cultivation were purchased from Gibco-BRL
(U.S.A.). NDP-MSH and other chemicals were purchased from Sigma (U.S.A.)
unless specified otherwise.
2. Preparation of α -MSH analogues
The peptides used in this study (except NDP-MSH) were synthesized at the
Korea Basic Science Institute (Seoul, Korea) by use of the solid phase approach
and purified by high performance liquid chromatography (HPLC). The peptide
sequences were assembled with a Milligen 9050(Fmoc Chemistry). The correct
molecular weights of the peptides were confirmed by mass spectrometry. For
deprotection, a reagent mixture (88% trifluoroacetic acid, 5% phenol, 2%
triisopropylsilane, 5% H2O; 2 hours) was used. The raw peptides formed were
purified by HPLC (Delta PAK 15µ C18 300Å 3.9mm×150mm column, detection
at 240nm).
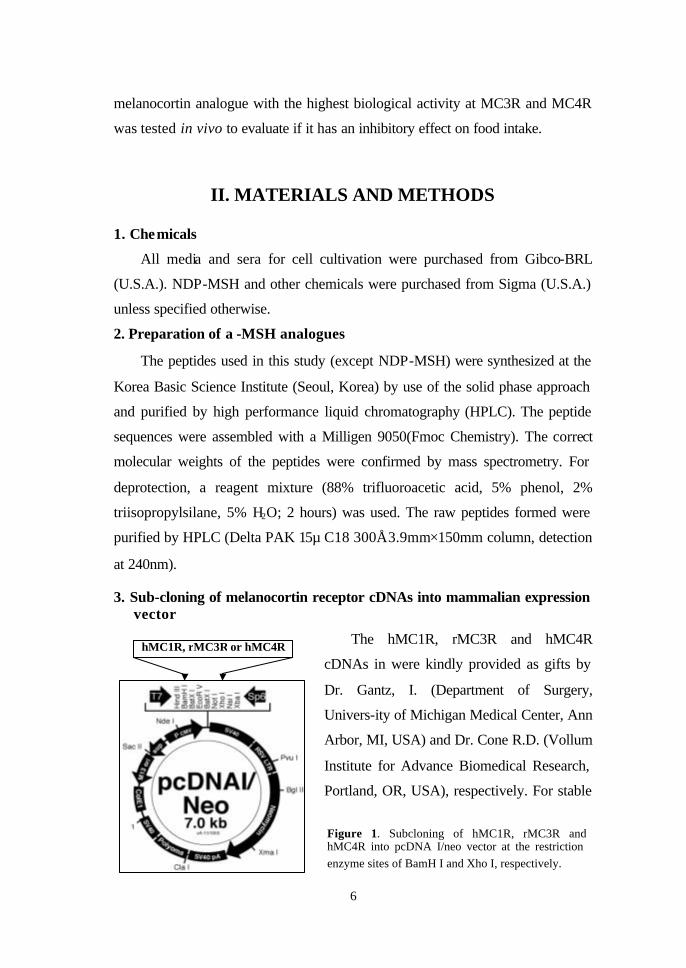
3. Sub-cloning of melanocortin receptor cDNAs into mammalian expression vector
The hMC1R, rMC3R and hMC4R
cDNAs in were kindly provided as gifts by
Dr. Gantz, I. (Department of Surgery,
Univers-ity of Michigan Medical Center, Ann
Arbor, MI, USA) and Dr. Cone R.D. (Vollum
Institute for Advance Biomedical Research,
Portland, OR, USA), respectively. For stable
hMC1R, rMC3R or hMC4R
Figure 1. Subcloning of hMC1R, rMC3R and hMC4R into pcDNA I/neo vector at the restriction enzyme sites of BamH I and Xho I, respectively.
7
transfection, each of these cDNAs was sub-cloned into the mammalian
expression vector pcDNA I/neo at the multi-cloning site, BamH I and Xho I, as
shown in Figure 1. And enough recombinant plasmid DNAs were prepared with
the Plasmid Purification Kit (Cat. No. 12143, QIAGEN GmbH, Germany).
4. Preparation of mammalian cell lines stably expressing the melanocortin receptor subtypes
CHO cells were maintained in a F-12 medium (with glutamine)
supplemented with 10% fetal bovine serum, 100 units/ml penicillin G sodium,
100 µg/ml streptomycin sulfate and 0.25 µg/ml amphotericin B. Cells were
incubated in a 100-mm culture dish at 37 °C in humidified air containing 5% CO2.
For transfections, the hMC1R, rMC3R and hMC4R cDNAs were cloned into the
expression vector pcDNA I/neo. Cells were generally at 50% confluence on the
day of transfection, which was carried out using the calcium phosphate method,
as described previously(40). Briefly, cells were fed with fresh complete culture
medium containing 20 mM HEPES and incubated in 95% air/5% CO2. After 3-4
hours, the medium was discarded and 5 ml of calcium phosphate-DNA
precipitate containing 25 µg DNA, 124 mM CaCl2, 140 mM NaCl, 25 mM
HEPES and 1.41 mM Na2HPO4 (pH 7.12) was added. The cells were then
incubated for 4 hours with 97% air/3% CO2, washed with phosphate buffered
saline (PBS, 137 mM NaCl, 2.68 mM KCl, 4.3 mM N2HPO4, and 1.47 mM
KH2PO4, at pH 7.12), and shocked with glycerol buffer (15% glycerol, 140 mM
NaCl, 25 mM HEPES and 1.41 mM Na2HPO4, at pH 7.12). Cells were washed
again with PBS, and incubated for an additional 36-48 hours in complete F-12
medium. Cells were then cultured in complete F-12 medium containing 0.5
mg/ml G418 (Geneticin; Life Technologies) until G418-resistant colonies were
generated. G418-resistant colonies were picked out and then sub-cultured for at
least 10-14 days. Finally, hMC1R-, rMC3R- and hMC4R-expressing cells were
identified by screening more than 15 colonies and confirmed by assaying NDP-
MSH-induced cyclic AMP accumulation.
5. Binding assay
Iodinated NDP-MSH, 125I(Iodotyrosyl2)-[Nle4, D-Phe7]α-MSH, was prepared
8
by the modified chloramine-T method, as described previously(40). 1 mCi(10 µl)
of Na125I (Amersham) was added to 5 µg of NDP-MSH in 100 µl of 200 mM
sodium phosphate buffer (pH 7.2). 20 µl of 2.8 mg/ml chloramine T solution in
200 mM sodium phosphate (pH 7.2) was then added and allowed to stand for 15
seconds, 50 µl of 3.6 mg/ml sodium metabisulfate was then added to stop the
reaction. The reaction mixture was diluted with 1 ml of 0.1% BSA solution
containing 0.1% trifluoroacetic acid and purified using a C18 Sep-Park cartridge
(Waters) and by Sephadex G25 Gel Filtration Chromatography. The purified
reagents were collected in 0.5 ml aliquots in Sigmacote-coated sterile glass tubes,
into which 100 µl of PBS buffer containing 0.1% bovine serum albumin had been
added in advance. For binding assays, the stably transfected CHO cells were
plated 48 hours before experiments in 24-well culture plates (Falcon Plastics) at a
density of 5×10⁴ per well until they were 90-95% confluent on the day of the
assay. Maintenance media was removed and the cells were washed twice with
washing buffer (50 mM Tris, 100 mM NaCl, 5 mM KCl, and 2 mM CaCl2, at pH
7.2), and then immediately incubated at 37°C for 2 hours with 0.25ml binding
buffer per well (50 mM Tris, 100 mM NaCl, 5 mM KCl, 2 mM CaCl2, 5% Hanks’
Balanced Salt Solution, and 0.5% Bovine Serum Albumin, at pH 7.2) containing
a constant concentration of [125I]NDP-MSH and appropriate concentrations of the
unlabeled competing ligand. After incubation, the plates were placed on ice for
15min, washed twice with 0.5 ml of ice-cold binding buffer, and detached from
the plates using 0.5 ml of 50 mM NaOH twice (final volume: 1ml). Radioactivity
was then determined (Workman automatic gamma counter) and data analyzed
with a software package suitable for radioligand binding data analysis (GraphPad
Prism Program). Nonspecific binding was determined by measuring the amount
of bound [125I]NDP-MSH remaining in the presence of 10-5 M unlabeled NDP-
MSH, while specific binding was calculated by subtracting the nonspecifically
bound radioactivity from total bound radioactivity. IC50 (nM) values were
reported as mean ± SE. All of the binding assays were performed in triplicate
wells and repeated twice.
9
6. Cyclic AMP assay
Intracellular cyclic AMP levels were determined using the method described
previously(40). CHO cells over-expressing MC1R, MC3R or MC4R were grown
to 90-95% confluence in 24-well plates. Cell culture media was exchanged with
complete F-12 medium containing 10% fetal bovine serum 3-4 hours, before
cells were treated with peptides. For assays, the media was removed and cells
washed with 0.5 ml of cAMP-generating medium (10% fetal bovine serum, 2 mM
IBMX, 0.1% bovine serum albumin, 20 mM HEPES, and 0.002% ascorbic acid
in F-12 Medium). 0.25 ml of cAMP-generating media containing various
concentrations of peptides was added and cells were incubated for 30 min at
37 °C. At the end of this incubation, media was completely discarded, and cells
were frozen at –70 °C for 30 minutes and thawed at room temperature for 15-20
minutes. This freezing-thawing process was then repeated twice. Cells were
detached from the plates with 1ml of 50 mM HCl solution per well, transferred to
a 1.5-ml Eppendorf tube, and centrifuged at 1900×g for 10 min. The supernatants
were diluted 50-fold with acetate buffer and cAMP concentrations were
measured using a cAMP 125I RIA Kit (Diasorin, USA), according to the assay
instructions. The mean values of the data so collected were fitted to a sigmoid
curve with a variable slope factor by non-linear regression in a GraphPad Prism.
EC50 (nM) values are described as mean ± SE. All of the cAMP assays were
performed in triplicate wells and repeated twice.
7. Solution structure analysis with NMR methods
Five α-MSH analogues, including [Nle 4]α-MSH, α-MSH-ND, [Gln6]α-
MSH-ND, [Gln6]α-MSH-ND(6-10) and [Lys6]α-MSH-ND were dissolved in
90% H2O/10% D2O or 99.99% D2O at pH value of 7.0 with 50mM sodium
phosphate buffer. NMR samples with D2O were prepared after lyophilization of
an H2O sample. The final sample concentrations for NMR measurements were
2mM in 0.5mL buffer solution.
NMR experiments were carried out at 10 °C on a Bruker DRX-500
spectrometer equipped with a triple resonance probe having x,y,z gradient coils.
10
NMR spectra were recorded at 10 °C. Two-dimensional total correlation
spectroscopy (TOCSY)(41) and two-dimensional nuclear Overhauser effect
spectroscopy (NOESY)(42) were performed. Two-dimensional rotating-frame
Overhauser effect spectroscopy (ROESY) spectra were also recorded in D2O
solution. Two-dimensional double -quantum-filtered (DQF) COSY spectra(43)
were collected in H2O to obtain a vicinal coupling constant. A series of one-
dimensional NMR measurements were accomplished to identify slowly
exchanging amide hydrogen resonance on a freshly prepared D2O solution after
lyophilization of a H2O sample. All NMR experiments were performed in the
phase-sensitive mode using the time proportional phase incrementation (TPPI)
(44,45). All NMR data were processed using nmrPipe/nmrDraw (Biosym/Molecular
Simulations, Inc.) or XWIN-NMR (Bruker Instruments) software. Processed data
were analyzed using Sparky 3.60 developed at UCSF on a Silicon Graphics
Indigo2 workstation
Finally, the hybrid distance geometry and dynamical simulated-annealing
protocol with the X-PLOR 3.81 program on a Silicon Graphics Indigo2
workstation were used for structure calculations. Distance geometry (DG)
substructures were generated using a subset of atoms and followed a refinement
protocol described by Lee et al(46). The target function for molecular dynamics
(MD) and energy minimization (EM) consisted of covalent structure, van der
Waals repulsion, NOE and torsion angle constraints.
8. Homology modeling analysis of receptor subtypes
Transmembrane regions of receptor molecules were determined from both
sequence alignment and topology prediction data of hMC1R, rMC3R and
hMC4R(47). The primary sequence alignment data were obtained from Haskell-
Luevane et al(48). The molecular topology prediction of receptors was performed
by Tosts method on EMBL protein-predict server and these data were aligned
with bovine rhodopsin sequence. The helical segments were constructed using
bovine rhodopsin coordinates previously reported(49) and further refined by
energy minimization procedure. The force field used for modeling calculations
11
was cvff in Discover Module of InsightII program (MSI Inc.) on SGI Indigo2
workstation. Three-dimensional structures of receptor molecules were completed
by replacement of helical segments of the bovine rhodopsin onto melanocortin
receptor sequences, followed by rearrangements of helix orientations based on
mutagenesis data of receptor molecules(50). The previous mutagenesis and
biochemical data also provided information about the relative side chain
orientations of amino acids in receptor molecule (51). The receptor-ligand complex
structures form MC1R, MC3R and MC4R were finally generated by ligand
docking procedure based on mutagenesis and NMR data.
9. Feeding assay
(1) Animals: 25~30 g male ICR mice were used for feeding assay. Mice
were maintained on a normal 12h/12h light/dark cycle with food and water ad
libitum before experiments.
(2) In vivo experiments: Before injection, animals were housed in metabolic
cages individually for at least 24 h, and then fasted with food deprivation from
18:00 to 8:00 to stimulate feeding during the daytime experimental period. They
were distributed into weight-matched control and experimental groups with 9
mice/group, and injected intraperitoneally with vehicle (saline, 100 µl each
mouse) and vehicle plus drug (α-MSH-ND, 100 nmole/100 µl in saline) as
indicated. Twelve-hour of feeding assay was performed. Briefly, the quantity of
food pellets in spill-free cup was pre-measured. Food remaining was removed
and weighted at the time internals indicated. Significance of drug effect at
individual time points was determined by two-way ANOVA.
III. RESULTS
We designed and synthesized a series of new linear melanocortin analogues
in which the structures are aligned with [Nle 4]α-MSH (Table 1). The hMC1R,
rMC3R and hMC4R DNAs were stably and independently expressed in CHO
cells for competitive receptor binding with [125I]NDP-MSH as a radioligand and
a cyclic AMP accumulation test following treatment with different ligands.
12
Table 1. Amino acid sequences of α-MSH analogues designed and tested in this study. All peptides have an acetyl-group on the N terminus and an amide group on the C terminus. The main substituted amino acid residues are shown in Italics
Position Peptides
1 2 3 4 5 6 7 8 9 10 11 12 13
[Nle4]α-MSH Ser Tyr Ser Nle Glu His Phe Arg Trp Gly Lys Pro Val α-MSH-ND Nle Asp His D-Phe Arg Trp Lys [Gln6]α-MSH-ND Nle Asp Gln D-Phe Arg Trp Lys [Asn6]α-MSH-ND Nle Asp Asn D-Phe Arg Trp Lys [Tyr6]α-MSH-ND Nle Asp Tyr D-Phe Arg Trp Lys [Trp6]α-MSH-ND Nle Asp Trp D-Phe Arg Trp Lys [Arg6]α-MSH-ND Nle Asp Arg D-Phe Arg Trp Lys [Lys6]α-MSH-ND Nle Asp Lys D-Phe Arg Trp Lys α-MSH-ND(6-10) His D-Phe Arg Trp Lys [Gln6]α-MSH-ND(6-10) Gln D-Phe Arg Trp Lys [Asn6]α-MSH-ND(6-10) Asn D-Phe Arg Trp Lys [Trp6]α-MSH-ND(6-10) Trp D-Phe Arg Trp Lys
1. Preparation of CHO cell lines stably expressing the different MC receptor subtypes
With stabe transfection by the calcium phosphate method, the cell lines
which were G418-resistant were selected by assay of NDP-MSH-induced cyclic
AMP accumulation. As shown in Figure 2, compared to the vehicle -treated group,
Figure 2. Screening the CHO cell colonies stably over-expressing MC1(A), MC3(B) and MC4(C) receptor subtypes, respectively .
0
5
10
15
20
25
30
35
cA
MP
Le
ve
ls(F
old
s o
f B
lan
k)
1 2 3 4 5 6 7 8 9 10 11 12 13 14 15 16 17 18 19 20 21 22 23 24
Colonies
Selection of MC1R-CHO Cell LineA
0
5
10
15
20
25
30
cA
MP
Le
ve
ls(F
old
s o
f B
lan
k)
1 2 3 4 5 6 7 8 9 10
Colonies
Selection of MC3R-CHO Cell Line
B
0
5
10
15
20
25
cA
MP
Le
ve
ls(F
old
s o
f B
lan
k)
1 2 3 4 5 6 7 8 9 10
Colonies
Selection of MC4R-CHO Cell LineC.
13
the 14th cell colony in MC1R, the 1st cell colony in MC3R and the 2nd cell colony
in MC4R, exhibited the most significant increase of intracellular cAMP levels,
respectively. The three cell lines were then used for subsequent experiments for
evaluating the biological activity of α-MSH analogues.
2. Comparative analysis of binding activity
As seen in Figure 3A, for MC1R,
the preferential order was shown with
[Nle4]α-MSH > α-MSH-ND. Their
IC50 values (nM) at MC1R were
0.166±0.028 and 0.769±0.486 (as seen
in Table 2). For MC3R, the preferential
order was shown as α-MSH-ND >
[Nle4]α-MSH, and forMC4R, the same
preferential order was obtained (Figure
3B and 3C). Compared with their
binding affinity for MC3R and MC4R,
the two analogues revealed the
preference to MC1R. In particular,
substitution of the 7th residue from Phe
to D-Phe induced the remarkably
potentiated selectivity for MC4R.
Although without the N-terminal three
amino acid residues, α-MSH-ND still
revealed a higher binding affinity than
[Nle4]α-MSH to MC3R and MC4R.
With the His6 residue of α-MSH-
ND being substituted by Gln, Trp, Asn,
Arg, Lys or Tyr, except [Arg6]α-MSH-
ND, the other analogues gave signifi-
cantly decreased binding affinities for
Figure 3. Competition curves of α-MSH analogues ([Nle4] α-MSH and α-MSH-ND) obtained in CHO cell lines stably transfected with MC1R( A), MC3R(B) and MC4R(C) using a fixed concentration of [125I]NDP -MSH and varying concentrations of the unlabeled competing peptides. Each experiment was performed in triplicate and repeated twice.
A
B
C
-14 -13 -12 -11 -10 -9 -8 -7 -6 -5 -40
20
40
60
80
100
[Nle4]α-MSH
α -MSH-ND
Ligand ( Log[M] )
125I-
ND
P-M
SH
Bo
un
d(
% T
ota
l )
-14 -13 -12 -11 -10 -9 -8 -7 -6 -5 -40
20
40
60
80
100
[Nle4]α-MSHα -MSH-ND
Ligand ( Log[M] )
125 I
-ND
P-M
SH
bo
un
d(
% t
ota
l )
-14 -13 -12 -11 -10 -9 -8 -7 -6 -5 -40
20
40
60
80
100
[Nle4]α -MSHα -MSH-ND
Ligand ( Log[M] )
125 I
-ND
P-M
SH
bo
un
d(
% t
ota
l )
14
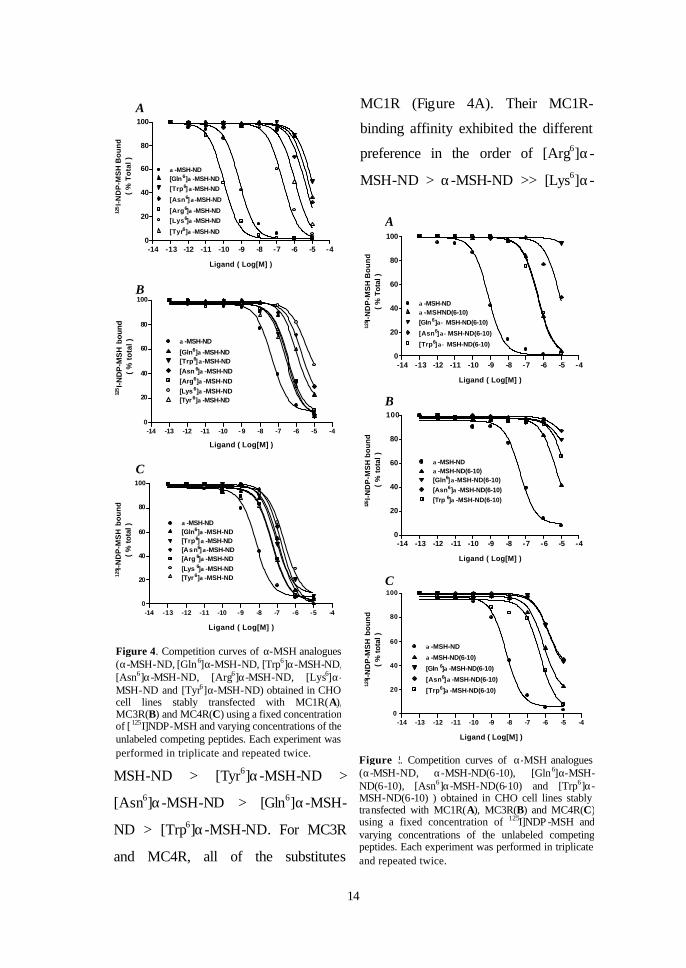
MC1R (Figure 4A). Their MC1R-
binding affinity exhibited the different
preference in the order of [Arg6]α-
MSH-ND > α-MSH-ND >> [Lys6]α-
MSH-ND > [Tyr6]α-MSH-ND >
[Asn6]α-MSH-ND > [Gln6]α-MSH-
ND > [Trp6]α-MSH-ND. For MC3R
and MC4R, all of the substitutes
Figure 4. Competition curves of α-MSH analogues (α-MSH-ND, [Gln6]α-MSH-ND, [Trp6]α-MSH-ND, [Asn6]α-MSH-ND, [Arg6]α-MSH-ND, [Lys6]α-MSH-ND and [Tyr6]α-MSH-ND) obtained in CHO cell lines stably transfected with MC1R(A), MC3R(B) and MC4R(C) using a fixed concentration of [ 125I]NDP-MSH and varying concentrations of the unlabeled competing peptides. Each experiment was performed in triplicate and repeated twice.
-14 -13 -12 -11 -10 -9 -8 -7 -6 -5 -40
20
40
60
80
100
α -MSH-ND[Gln6]α -MSH-ND
[Trp6]α-MSH-ND
[Asn6]α-MSH-ND
[Arg6]α -MSH-ND
[Lys6]α -MSH-ND
[Tyr6]α -MSH-ND
Ligand ( Log[M] )
125I-
ND
P-M
SH
Bo
un
d(
% T
ota
l )
A
B
C
-14 -13 -12 -11 -10 - 9 -8 -7 -6 -5 -40
20
40
60
80
100
α -MSH-ND
[Gln6]α -MSH-ND[Trp6]α-MSH-ND[Asn 6]α -MSH-ND[Arg6]α -MSH-ND[Lys6]α -MSH-ND[Tyr6]α -MSH-ND
Ligand ( Log[M] )
125I-
ND
P-M
SH
bo
un
d(
% t
ota
l )
-14 -13 -12 -11 -10 -9 -8 -7 -6 -5 -40
20
40
60
80
100
α -MSH-ND[Gln6]α -MSH-ND[Trp6]α -MSH-ND[Asn6]α-MSH-ND[Arg 6]α -MSH-ND[Lys 6]α -MSH-ND[Tyr 6]α -MSH-ND
Ligand ( Log[M] )
125 I-
ND
P-M
SH
bo
un
d(
% t
otal
)
Figure 5. Competition curves of α-MSH analogues (α-MSH-ND, α-MSH-ND(6-10), [Gln6]α-MSH-ND(6-10), [Asn6]α-MSH-ND(6-10) and [Trp6]α-MSH-ND(6-10) ) obtained in CHO cell lines stably transfected with MC1R(A), MC3R(B) and MC4R(C) using a fixed concentration of [125I]NDP -MSH and varying concentrations of the unlabeled competing peptides. Each experiment was performed in triplicate and repeated twice.
-14 -13 -12 -11 -10 -9 -8 -7 -6 -5 -40
20
40
60
80
100
α -MSH-NDα -MSH-ND(6-10)[Gln6]α-MSH-ND(6-10)
[Trp 6]α -MSH-ND(6-10)
[Asn6]α -MSH-ND(6-10)
Ligand ( Log[M] )
125 I
-ND
P-M
SH
bo
un
d(
% t
otal
)
A
B
C
-14 -13 -12 -11 -10 -9 -8 -7 -6 -5 -40
20
40
60
80
100
α -MSH-ND
α -MSH-ND(6-10)
[Gln 6]α -MSH-ND(6-10)
[Asn6]α -MSH-ND(6-10)
[Trp6]α -MSH-ND(6-10)
Ligand ( Log[M] )
125 I-
ND
P-M
SH
bo
un
d(
% t
otal
)
-14 -13 -12 -11 -10 -9 -8 -7 -6 -5 -40
20
40
60
80
100
α -MSH-NDα -MSH-ND(6-10)
[Gln6]α− MSH-ND(6-10)
[Asn6]α−MSH-ND(6-10)
[Trp6]α− MSH-ND(6-10)
Ligand ( Log[M] )
125 I-
ND
P-M
SH
Bo
un
d(
% T
otal
)
15
showed decreased binding affinities for both receptors (Figure 4B and 4C). Their
MC3R-binding activity exhibited a different preference in the order α-MSH-ND
> [Tyr6]α-MSH-ND > [Trp6]α-MSH-ND > [Arg6]α-MSH-ND > [Gln6]α-MSH-
ND > [Asn6]α-MSH-ND > [Lys6]α-MSH-ND with their IC50 values (nM) being
47.2±9.08, 219.3±31.585, 346.4±70.13, 361.5±57.73, 1074.0±120.01,
1998.0±363.34, 3340.0±877.05, respectively (Table 2). For MC4R, their
preferential order was similar to that observed in MC3R, being α-MSH-ND >
[Tyr6]α-MSH-ND > [Arg6]α-MSH-ND > [Trp6]α-MSH-ND > [Gln6]α-MSH-ND
> [Asn6]α-MSH-ND > [Lys6]α-MSH-ND. By comparing their binding affinity to
the three receptors, it could be found that, except Arg, replacements of His6 with
the other residues resulted in about 10,000 folds decrease in receptor-binding
affinities for MC1R, while still keeping certain binding activities at MC3R and
MC4R. With respect to [Gln6]α-MSH-ND, as shown in Figure 4, its binding
affinity were greatly weakened relative to α-MSH-ND for MC1R compared
those for MC3R and MC4R.
Table 2. IC50 Values (mean±SEM) of α-MSH analogues obtained from computer analysis of competition curves on stable transfected CHO Cells over-expressing MC1R, MC3R or MC4R
IC50(nM) Ligands
MC1R MC3R MC4R
[Nle4]α-MSH 0.166 ± 0.028 106.7 ± 32.25 238.3 ± 30.47
α-MSH-ND 0.769 ± 0.486 47.2 ± 9.08 6.7 ± 1.07 [Gln6]α-MSH-ND 5962.0 ± 730.9 1074.0 ± 120.01 112.0 ± 25.94
[Trp 6]α-MSH-ND 9605.0 ± 4060.0 346.4 ± 70.13 87.6 ± 30.47
[Asn6]α-MSH-ND 3709.0 ± 509.21 1998.0 ± 363.34 171. 2 ± 14.81 [Arg6]α-MSH-ND 0.101 ± 0.035 361.5 ± 57.73 57.4 ± 8.37
[Lys6]α-MSH-ND 216.30 ± 82.363 3340.0 ± 877.05 238.1 ± 40.63
[Tyr6]α-MSH-ND 1075.00 ± 408.654 219.30 ± 31.585 54.860 ± 10.580 α-MSH-ND(6-10) 501.700 ± 96.770 4730.0 ± 1180.93 827.0 ± 208.73
[Gln6]α-MSH-ND(6-10) 156700 ± 22148 7156.0 ± 5063.46 1297.0 ± 392.28
[Asn6]α-MSH-ND(6-10) 8070.00 ± 2087.26 6712.0 ± 4169.22 1304.0 ± 378.47 [Trp6]α-MSH-ND(6-10) 490.90 ± 109.59 23220 ± 18996 603.5 ± 163.9
The truncated peptides revealed lower affinities generally for the three
receptors (Figure 5). For MC1R, the order of their binding affinity was [Trp6]α-
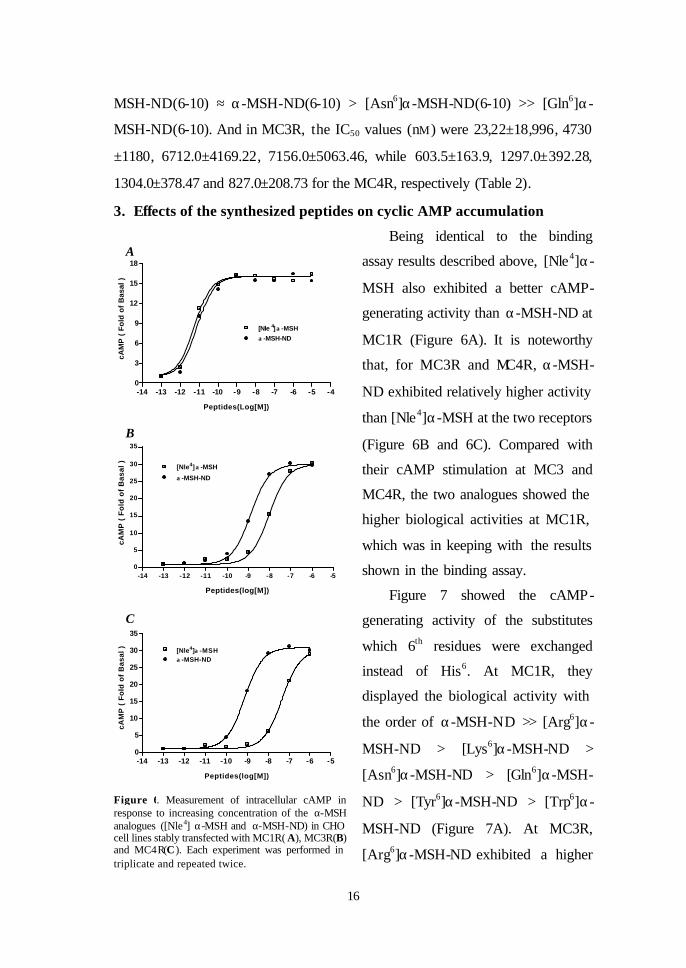
16
MSH-ND(6-10) ≈ α-MSH-ND(6-10) > [Asn6]α-MSH-ND(6-10) >> [Gln6]α-
MSH-ND(6-10). And in MC3R, the IC50 values (nM) were 23,22±18,996, 4730
±1180, 6712.0±4169.22, 7156.0±5063.46, while 603.5±163.9, 1297.0±392.28,
1304.0±378.47 and 827.0±208.73 for the MC4R, respectively (Table 2).
3. Effects of the synthesized peptides on cyclic AMP accumulation
Being identical to the binding
assay results described above, [Nle4]α-
MSH also exhibited a better cAMP-
generating activity than α-MSH-ND at
MC1R (Figure 6A). It is noteworthy
that, for MC3R and MC4R, α-MSH-
ND exhibited relatively higher activity
than [Nle4]α-MSH at the two receptors
(Figure 6B and 6C). Compared with
their cAMP stimulation at MC3 and
MC4R, the two analogues showed the
higher biological activities at MC1R,
which was in keeping with the results
shown in the binding assay.
Figure 7 showed the cAMP-
generating activity of the substitutes
which 6th residues were exchanged
instead of His6. At MC1R, they
displayed the biological activity with
the order of α-MSH-ND >> [Arg6]α-
MSH-ND > [Lys6]α-MSH-ND >
[Asn6]α-MSH-ND > [Gln6]α-MSH-
ND > [Tyr6]α-MSH-ND > [Trp6]α-
MSH-ND (Figure 7A). At MC3R,
[Arg6]α-MSH-ND exhibited a higher
-14 -13 -12 -11 -10 -9 -8 -7 -6 -5 -40
3
6
9
12
15
18
[Nle 4]α -MSH
α -MSH-ND
Peptides(Log[M])
cAM
P (
Fo
ld o
f B
asal
)
-14 -13 -12 -11 -10 -9 -8 -7 -6 -50
5
10
15
20
25
30
35
[Nle4]α -MSHα -MSH-ND
Peptides(log[M])
cAM
P (
Fo
ld o
f B
asal
)
-14 -13 -12 -11 -10 -9 -8 -7 -6 -50
5
10
15
20
25
30
35
[Nle4]α -MSH
α -MSH-ND
Peptides(log[M])
cAM
P (
Fo
ld o
f B
asal
)
Figure 6. Measurement of intracellular cAMP in response to increasing concentration of the α-MSH analogues ([Nle4] α-MSH and α-MSH-ND) in CHO cell lines stably transfected with MC1R( A), MC3R(B) and MC4R(C). Each experiment was performed in triplicate and repeated twice.
A
B
C
17
potency than α-MSH-ND, which was
different from the binding assay data
shown above, while still being lower
than α-MSH-ND at the MC4R (Figure
7C), which was also identical to the
receptor-binding results. Here, [Asn6]α-
MSH-ND and [Trp6]α-MSH-ND dis-
played the weakest cAMP generating
activity of all these peptides at MC3R,
-14 -13 -12 -11 -10 -9 -8 -7 -6 -50
5
10
15
20
25
30
35α -MSH-ND[Gln6]α -MSH-ND
[Trp6]α -MSH-ND
[Asn 6]α -MSH-ND
[Arg 6]α -MSH-ND
[Lys 6]α -MSH-ND[Τ yr6]α -MSH-ND
Peptides(log[M])
cAM
P (
Fo
ld o
f B
asal
)
-14 -13 -12 -11 -10 -9 -8 -7 -6 -50
5
10
15
20
25
30
35α -MSH-ND
[Gln6]α -MSH-ND
[Trp6]α -MSH-ND[Asn6]α -MSH-ND
[Arg 6]α -MSH-ND[Lys 6]α -MSH-ND[Tyr 6]α -MSH-ND
Peptides(log[M])
cAM
P (
Fo
ld o
f B
asal
)
-14 -13 -12 -11 -10 -9 -8 -7 -6 -5 -40
4
8
12
16
20α -MSH-ND[Gln6]α -MSH-ND[Trp 6] α -MSH-ND[Asn 6] α -MSH-ND
[ Arg6]α -MSH-ND[Lys6]-MSH-ND[Tyr6]-MSH-ND
Peptides(Log[M])
cAM
P (
Fo
ld o
f B
asal
)
Figure 7. Measurement of intracellular cAMP in response to increasing concentration of the α-MSH analogues (α-MSH-ND, [Gln6]α-MSH-ND, [Trp6]α-MSH-ND, [Asn6]α-MSH-ND, [Arg6]α-MSH-ND, [Lys6]α-MSH-ND and [Tyr6]α-MSH-ND) in CHO cell lines stably transfected with MC1R( A), MC3R(B) and MC4R(C). Each experiment was performed in triplicate and repeated twice.
A
B
C
-14 -13 -12 -11 -10 -9 -8 -7 -6 -5 -40
4
8
12
16
20
α -MSH-ND
α -MSH-ND(6-10)[Gln6]α -MSH-ND(6-10)
[Asn6]α -MSH-ND(6-10)[Trp6]α -MSH-ND(6-10)
Peptides( Log[M] )
cAM
P (
Fo
ld o
f B
asal
)
-14 -13 -12 -11 -10 -9 -8 -7 -6 -5 -40
5
10
15
20
25
30
35
α -MSH-ND
[Gln6]α -MSH-ND(6-10)[Asn 6]α -MSH-ND(6-10)
α -MSH-ND(6-10)[Trp 6]α -MSH-ND(6-10)
Peptides(log[M])
cAM
P(
Fo
ld o
f B
asal
)
-14 -13 -12 -11 -10 -9 -8 -7 -6 -5 -40
5
10
15
20
25
30
35
α -MSH-ND
[Gln6]α -MSH-ND(6-10)[Asn6]α -MSH-ND(6-10)
α -MSH-ND(6-10)[Trp 6]α MSH-ND(6-10)
Peptides(log[M])
cAM
P (
Fo
ld o
f B
asal
)
Figure 8. Measurement of intracellular cAMP in response to increasing concentration of the α-MSH analogues (α-MSH-ND, α-MSH-ND(6-10), [Gln6]α-MSH-ND(6-10), [Asn 6]α-MSH-ND(6-10) and [Trp6]α-MSH-ND(6-10) ) in CHO cell lines stably transfected with MC1R(A), MC3R(B) and MC4R(C). Each experiment was performed in triplicate and repeated twice.
A
B
C
18
while being incapable of generating the maximum cAMP response at the MC4R
like the other peptides (Figure 7B). The potency order of all these peptides was
[Arg6]α-MSH-ND > α-MSH-ND > [Gln6]α-MSH-ND > [Lys6]α-MSH-ND >
[Trp6]α-MSH-ND > [Asn6]α-MSH-ND at the MC3R (Figure 7B); and α-MSH-
ND > [Arg6]α-MSH-ND > [Gln6]α-MSH-ND > [Lys6]α-MSH-ND > [Tyr6]α-
MSH-ND > [Trp6]α-MSH-ND ≈ [Asn6]α-MSH-ND at MC4R (Figure 7C). With
comparing the potency of these analogues, substitution of His6 by other residues
induced the most significant decrease of the activity in MC1R.
Table 3. EC50 Values (mean±SEM) of MSH analogues obtained from computer analysis of dose-response curves on stable transfected CHO Cells over-expressing MC1R, MC3R or MC4R. The values underlined in Italics mean that their mature cAMP failed to reach the maximum stimulation as shown by other analogues; , The compounds did not show the visible effect on cAMP-generation even at the highest concentration (10-5M)
EC50(nM) Ligands
MC1R MC3R MC4R
[Nle4]α-MSH 0.00558 ± 0.00131 9.362 ± 1.932 46.040 ± 0.020 α-MSH-ND 0.00799 ± 0.00451 1.523 ± 0.707 0.780 ± 0.405 [Gln6]α-MSH-ND 96.62 ± 32.276 9.383 ± 4.620 7.880 ± 1.818 [Trp6]α-MSH-ND 387.9 ± 164.10 110.00 ± 35.701 0.812 ± 0.428 [Asn6]α-MSH-ND 16.77 ± 6.944 271.80 ± 21.948 0.799 ± 0.121 [Arg6]α-MSH-ND 1.765 ± 0.800 0.381 ± 0.157 4.858 ±0.949 [Lys6]α-MSH-ND 6.879 ± 2.650 29.560 ± 11.525 19.890 ± 4.024 [Tyr6]α-MSH-ND 178.8 ± 45.269 76.860 ±± 12.088 273.60 ± 259.668 α-MSH-ND(6-10) 104.30 ± 27.46 29.560 ± 5.260 40.050 ± 15.272 [Gln6]α-MSH-ND(6-10) 3352 ± 1519 6.181 ± 5.327 [Asn6]α-MSH-ND(6-10) 11640 ± 2910 5407.0 ± 2981.5 7.609 ± 6.133 [Trp6]α-MSH-ND(6-10) 1795 ± 189 184.80 ± 110.625
α-MSH-ND(6-10), as seen in Figure 8A, showed the significantly lower
activity than that of α-MSH-ND at MC1R. In MC3R and MC4R, α-MSH-ND(6-
10) gave a comparatively good cAMP response, especially at the MC3R (Figure
8B). Substitutions of His6 by Gln, Trp or Asn resulted in more decrease in their
ability to stimulate cAMP formation. In particular, His6/Asn6 exchange led almost
to a loss of all its biological activity at MC1R and MC4R (Figure 8A and 8C).
Furthermore, His6/Gln6 exchange gave rise to absolute loss of its activity at
MC3R and MC4R, while His6/Trp6 exchange almost resulted in complete
disappearing of the activity at MC1R and MC3R. The EC50 values of all the
19
analogues tested in this study are shown in Table 3.
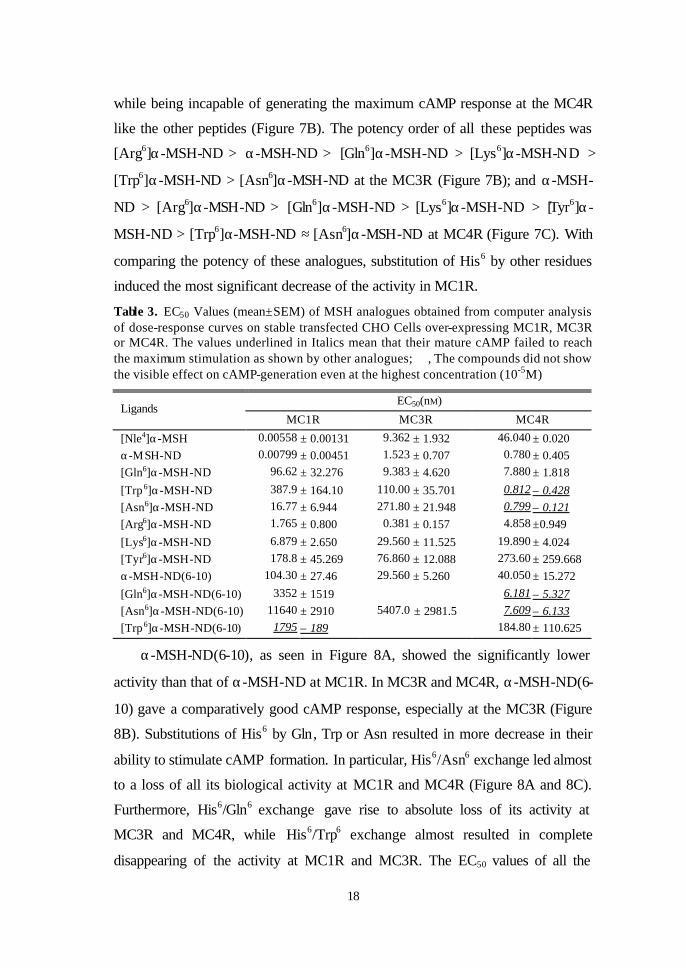
4. Solution structures of α -MSH analogues analyzed with NMR assay
Using the experimental constraints from NMR data, sixteen-thirty structures
of these α-MSH analogues were calculated by DG (distance geometry) followed
by SA (simulated-annealing) method. Most of the backbone conformations are
superimposed from Asp5 to Arg8. As shown in Figure 9, [Nle 4]α-MSH forms a
hair pin loop conformation, whereas α-MSH-ND, a linear form of MTII, prefers
a type I β-turn comprising residues Asp5-His6-(D-Phe)7-Arg8. In addition, the
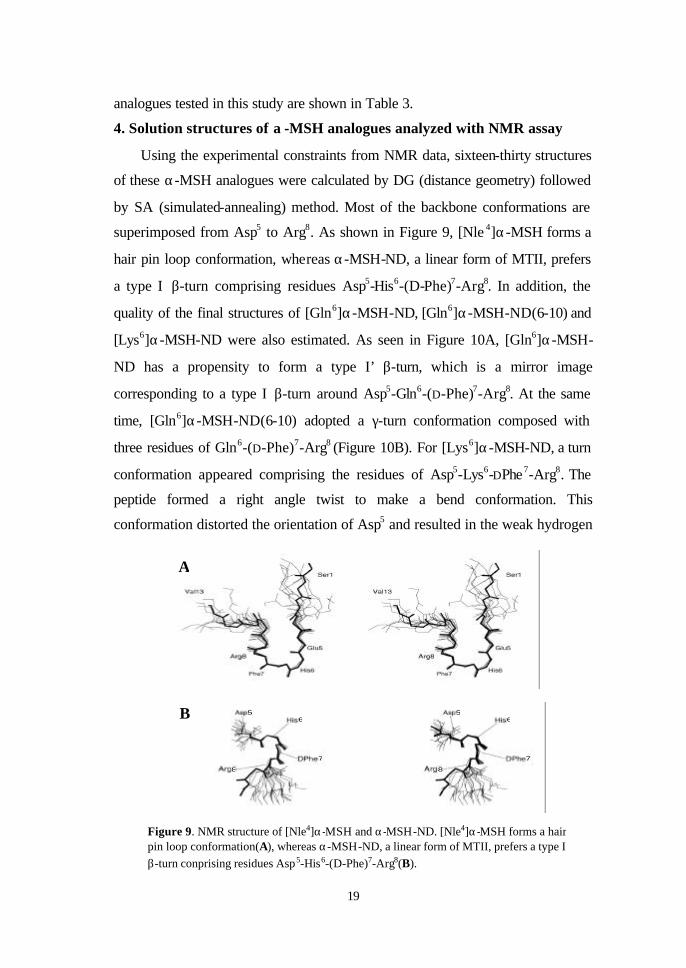
quality of the final structures of [Gln6]α-MSH-ND, [Gln6]α-MSH-ND(6-10) and
[Lys6]α-MSH-ND were also estimated. As seen in Figure 10A, [Gln6]α-MSH-
ND has a propensity to form a type I’ β-turn, which is a mirror image
corresponding to a type I β-turn around Asp5-Gln6-(D-Phe)7-Arg8. At the same
time, [Gln6]α-MSH-ND(6-10) adopted a γ-turn conformation composed with
three residues of Gln6-(D-Phe)7-Arg8 (Figure 10B). For [Lys6]α-MSH-ND, a turn
conformation appeared comprising the residues of Asp5-Lys6-DPhe7-Arg8. The
peptide formed a right angle twist to make a bend conformation. This
conformation distorted the orientation of Asp5 and resulted in the weak hydrogen
Figure 9. NMR structure of [Nle4]α-MSH and α-MSH-ND. [Nle4]α-MSH forms a hair pin loop conformation(A), whereas α-MSH-ND, a linear form of MTII, prefers a type I β-turn conprising residues Asp5-His6-(D-Phe)7-Arg8(B).
A
B 56
7
8
56
7
8
20
bond between the carbonyl oxygen of Asp5 and amide hydrogen of Arg8. This
resulted in the lack of inter residue NOEs (rotating-frame Overhauser effect) as
well as a stable hydrogen bond which are critical for β-turn formation. From hese
data, the REM (restraint-energy minimization) structure of [Lys6]α-MSH-ND
demonstrated a γ-turn conformation around Lys6-(D-Phe)7-Arg8 (Figure10C).
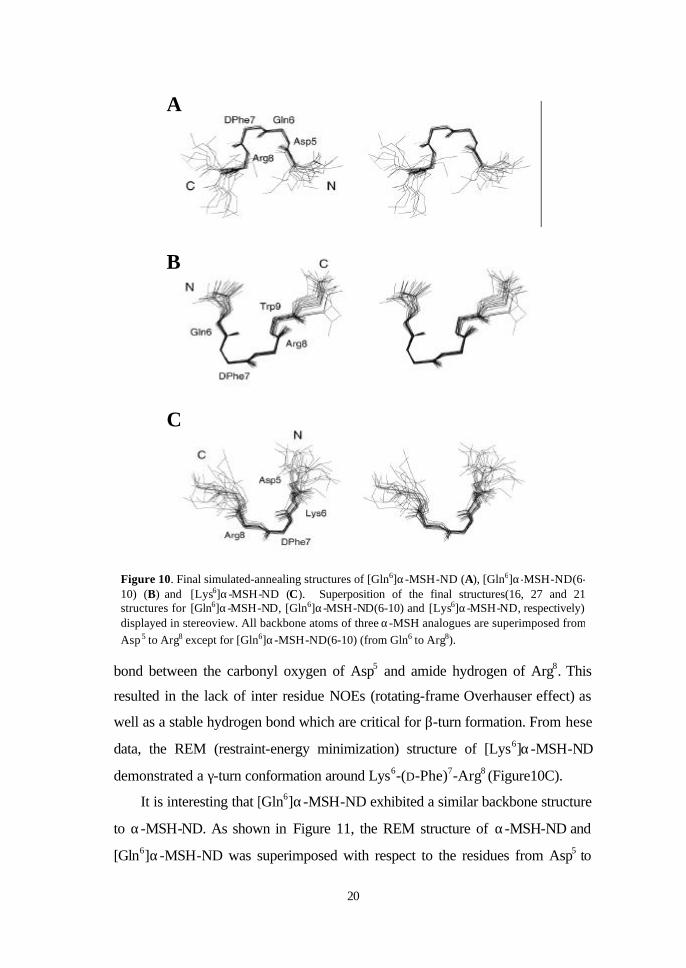
It is interesting that [Gln6]α-MSH-ND exhibited a similar backbone structure
to α-MSH-ND. As shown in Figure 11, the REM structure of α-MSH-ND and
[Gln6]α-MSH-ND was superimposed with respect to the residues from Asp5 to
A
B
C
Figure 10. Final simulated-annealing structures of [Gln6]α-MSH-ND (A), [Gln6]α-MSH-ND(6-10) (B) and [Lys6]α-MSH-ND (C). Superposition of the final structures(16, 27 and 21 structures for [Gln6]α-MSH-ND, [Gln6]α-MSH-ND(6-10) and [Lys6]α-MSH-ND, respectively) displayed in stereoview. All backbone atoms of three α-MSH analogues are superimposed from Asp 5 to Arg8 except for [Gln6]α-MSH-ND(6-10) (from Gln6 to Arg8).
21
Arg8 of α-MSH-ND. The solution structures of α-MSH-ND and [Gln6]α-MSH-
ND are aligned for primary sequences so that the corresponding residues of the
peptides are located in the same orientation. It was found that the side chains of
the center residues of the β-turn, His6 and D-Phe7 at α-MSH-ND or Gln6 and D-
Phe7 at [Gln6] α-MSH-ND, have the opposite direction, whereas, the orientations
of Arg8 and Trp9 are similar. This demonstrates that the 6th and 7th residues of
[Gln6]α-MSH-ND have a mirror image conformation relative to α-MSH-ND.
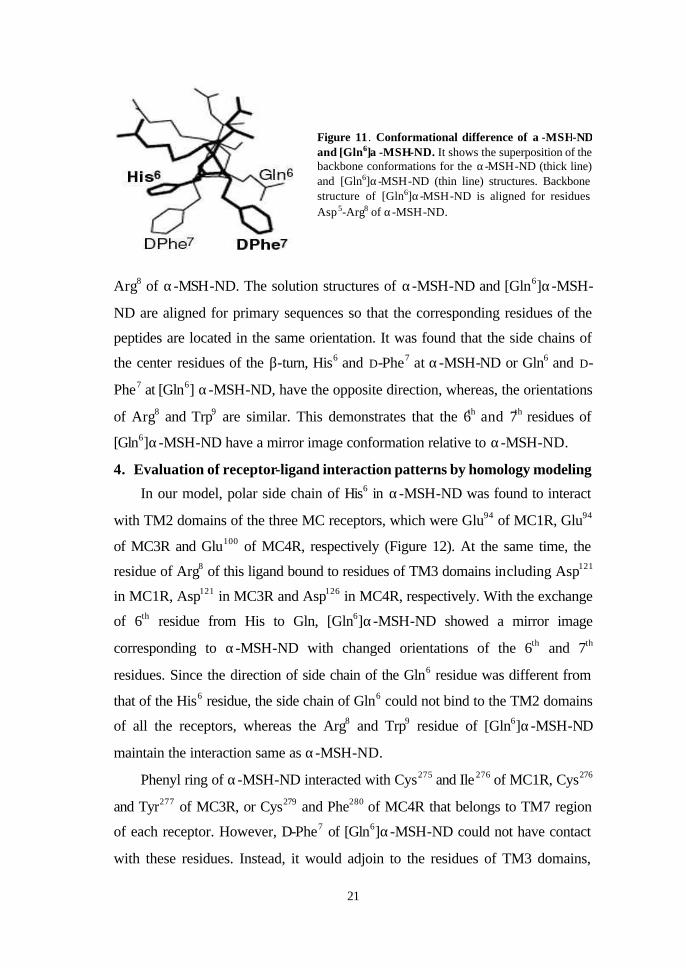
4. Evaluation of receptor-ligand interaction patterns by homology modeling
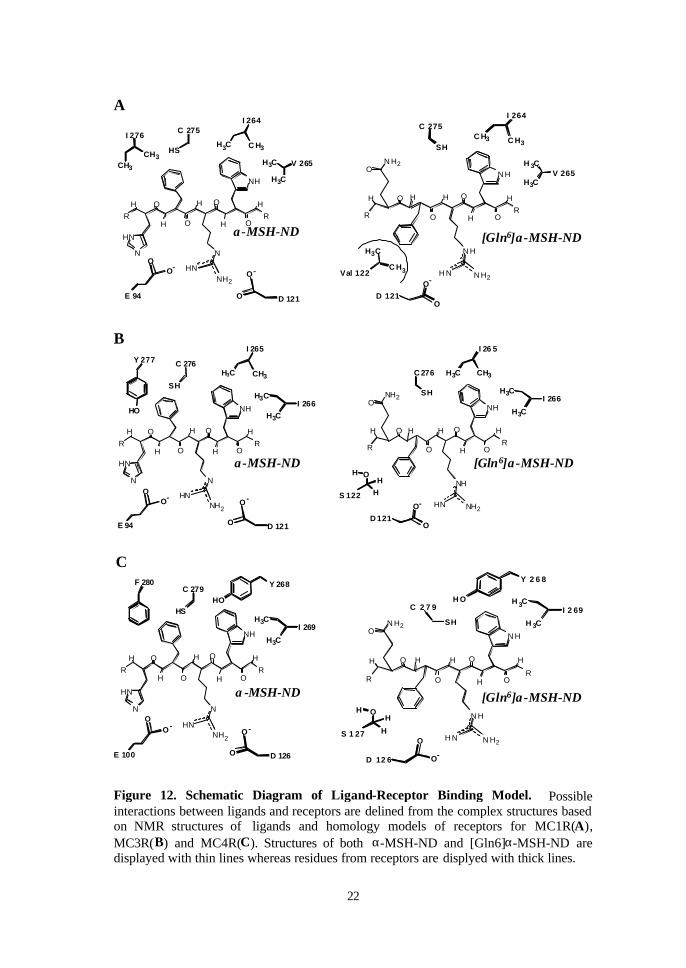
In our model, polar side chain of His6 in α-MSH-ND was found to interact
with TM2 domains of the three MC receptors, which were Glu94 of MC1R, Glu94
of MC3R and Glu100 of MC4R, respectively (Figure 12). At the same time, the
residue of Arg8 of this ligand bound to residues of TM3 domains including Asp121
in MC1R, Asp121 in MC3R and Asp126 in MC4R, respectively. With the exchange
of 6th residue from His to Gln, [Gln6]α-MSH-ND showed a mirror image
corresponding to α-MSH-ND with changed orientations of the 6th and 7th
residues. Since the direction of side chain of the Gln6 residue was different from
that of the His6 residue, the side chain of Gln6 could not bind to the TM2 domains
of all the receptors, whereas the Arg8 and Trp9 residue of [Gln6]α-MSH-ND
maintain the interaction same as α-MSH-ND.
Phenyl ring of α-MSH-ND interacted with Cys275 and Ile 276 of MC1R, Cys276
and Tyr277 of MC3R, or Cys279 and Phe280 of MC4R that belongs to TM7 region
of each receptor. However, D-Phe7 of [Gln6]α-MSH-ND could not have contact
with these residues. Instead, it would adjoin to the residues of TM3 domains,
Figure 11. Conformational difference of α -MSH-ND and [Gln6]α -MSH-ND. It shows the superposition of the backbone conformations for the α-MSH-ND (thick line) and [Gln6]α-MSH-ND (thin line) structures. Backbone structure of [Gln6]α-MSH-ND is aligned for residues Asp 5-Arg8 of α-MSH-ND.
22
Figure 12. Schematic Diagram of Ligand-Receptor Binding Model. Possibleinteractions between ligands and receptors are delined from the complex structures basedon NMR structures of ligands and homology models of receptors for MC1R(A),MC3R(B) and MC4R(C). Structures of both α-MSH-ND and [Gln6]α-MSH-ND aredisplayed with thin lines whereas residues from receptors are displyed with thick lines.
R
O
O
H
N H
H N
O
H OR
H
N H
N H2
HH
N H2O
OH
H
HS 1 27
H 3CI 2 69
H 3C
Y 2 6 8
O-
O
D 12 6
H O
SH
C 2 7 9
[Gln6]α-MSH-ND
R
H O
H O
H
N
HN
O
H OR
H
HN
N
NH
NH2
H3CI 269
H3C
Y 268
O -O
E 100
- O
O D 126
HO
F 280
HS
C 279
α-MSH-ND
C
A
[Gln6]α-MSH-ND
R
O
O
H
N H
H N
O
H OR
H
N H
C H3
I 264
C H3
H 3C
H3CV 265
O -
OD 121
N H2
HH
N H2O
Val 122
H3C
C H3
SH
C 275
α-MSH-NDR
H O
H O
H
N
HN
O
H OR
H
HN
N
NH
CH3
I 276H3C
I 264
C H3
H3C
H3C
V 265
O O
- O
OE 94 D 121
NH2
CH3HS
C 275
-
B
R
O
O
H
NH
HN
O
H OR
H
NH
NH2
HH
NH2O
H3CI 266
H3C
H3C
I 26 5
CH3
OH
H
HS 122O -
OD 121
SH
C 276
[Gln6]α-MSH-NDα-MSH-ND
R
H O
H O
H
N
HN
O
H OR
H
HN
N
NH
NH2
- O
O D 121
OO
E 94
SH
C 276
H3CI 266
H3C
H3C
I 265
CH3
Y 277
HO
-
23
Ser122 of MC3R or Ser127 of MC4R (Figure 12B and 12C). The residues with
polar side chain are oriented to the opposite direction of TM7 binding site. In
MC1R, these serine residues correspond to Val122 that contains the non-polar side
chain including two methyl groups (Figure 12A). It was noteworthy that the
important residues in the hydrophobic binding pockets of MC1R were different.
The Ile 276 residue of MC1R, which is involved in D-Phe7 binding site, was
changed to Tyr277 in MC3R and Phe280 in MC4R. On the other hand, the residues
of each receptor at Trp9 binding cavity lying in TM6 domains, Ile 264 of MC1R or
Ile265 of MC3R were replaced with Tyr268 in MC4R. Val265 in MC1R, the other
residue interacting with Trp9, was substituted with Ile 266 in MC3R and Ile 269 in
MC4R. Our models indicated that TM2, TM3, TM6 and TM7 segments of
receptors would participate in the formation of the binding pocket for the core
sequence of α-MSH analogues. These structures are well supported by the
mutagenesis studies clarifying that TM4 and TM5 are not involved in the binding
pocket(52).
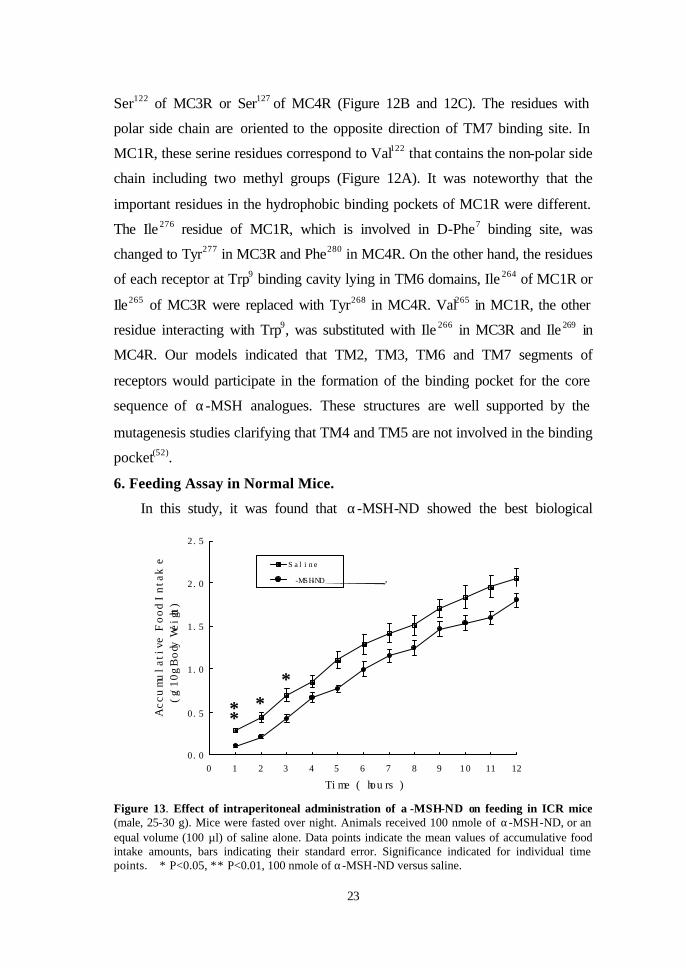
6. Feeding Assay in Normal Mice.
In this study, it was found that α-MSH-ND showed the best biological
Figure 13. Effect of intraperitoneal administration of α -MSH-ND on feeding in ICR mice(male, 25-30 g). Mice were fasted over night. Animals received 100 nmole of α-MSH-ND, or an equal volume (100 µl) of saline alone. Data points indicate the mean values of accumulative food intake amounts, bars indicating their standard error. Significance indicated for individual time points. ∗ P<0.05, ∗∗ P<0.01, 100 nmole of α-MSH-ND versus saline.
0.0
0.5
1.0
1.5
2.0
2.5
0 1 2 3 4 5 6 7 8 9 10 11 12
Time ( hours )
Acc
umul
ativ
e Food Inta
ke(g
/10g B
ody
Wei
ght
)
Saline
α-MSH-ND
∗ ∗
∗ ∗
24
activity of all synthetic melanocortin analogues. Therefore, the effect of α-MSH-
ND on food intake was studied in 20-30 g normal male ICR mice. Compared to
vehicle (saline)-injected mice, intraperitoneal injection of α-MSH-ND (100
nmole) caused a significant inhibition of feeding within the first one hour (P <
0.01, Figure 13). The inhibitory effect lasted for up to 3 hours after
administration (P < 0.05). After 3 hours, the food intake of α-MSH-ND-treated
group entered normal rates consuming.
IV. DISCUSSION
With the cloning of the melanocortin receptors, the molecular mechanisms
underlying a variety of effects have started to become elucidated. It is now clear
that most, if not all, of the effects of the melanocortin peptides are mediated via
specific subtypes of melanocortin receptors(16). Some of the new findings indicate
that melanocortin receptors may serve as targets for novel drugs. For instance,
MC3R and MC4R, unlike the other melanocortin subtypes, were found mainly at
distinct loci in the central nervous system, such as the ventromedia l nucleus of
the hypothalamus (VMH), which is considered most important in the regulation
of feeding behavior and lesions of the VMH, are associated with an increase in
body weight. Recent reports with knockout techniques(34,53,54) and i.c.v. injection
of the cyclic MSH analogues SHU9119 and MTII(6) linked the MC3R and MC4R
to feeding behavior and weight homeostasis.
All of the natural melanocortins contain the conserved core structure (i.e.,
His6-Phe7-Arg8-Trp9), and each of the core residues has been thought to exhibit
an important effect for biological activity(2,55-57). From this study, it was found
that, although being free of six N- and C-terminal amino acid residues, α-MSH-
ND (a linear form of MTII) revealed a higher binding affinity and cAMP-
generating activity at MC3R and MC4R. In contrast, [Nle4]α-MSH showed a
better potency at MC1R. In the NMR study, [Nle4]α-MSH revealed a loop
structure, while α-MSH-ND exhibiting a “type I β-turn” structure. These results
indicate that type I β-turn is important for augmenting biological activity in
25
MC3R and MC4R. Compared to [Nle 4]α-MSH, α-MSH-ND exhibited the
relatively weak potency at MC1R, which suggest that the N- and C-terminal
residues of [Nle 4]α-MSH are also important for enhancing the potency of ligands
to MC1R.
To further investigate the role of type I β-turn as well as the 6th residue in
activation of melanocortin receptors, we changed the His6 residue of α-MSH-ND
by Gln, Trp, Asn, Arg, Lys or Tyr and examined their biological activity.
Substitution of His6 residue of α-MSH-ND by Gln, Trp, Asn, Lys or Tyr resulted
in remarkable reduction of their biological activity. Compared to MC3R and
MC4R, most of the α-MSH analogues except [Arg6]α-MSH-ND exhibited more
significant decrease in their binding affinity to MC1R. With regard to cAMP-
generating activity, those analogues containing positive charged residue at the 6th
position, such as α-MSH-ND, [Arg6]α-MSH-ND and [Lys6]α-MSH-ND, showed
relatively high cAMP-generating activity at MC3R and MC4R. These results
suggest that, firstly, the 6th residue would play an important role in the activation
of the three receptor subtypes, and secondly, there could be some charge
interaction between the 6th residue of α-MSH-ND and the receptors even though
the effect is likely not critical for some subtypes. However, at all of the receptors,
[Lys6]α-MSH-ND showed a significantly lower binding affinity than [Arg6]α-
MSH-ND. From the NMR study, [Lys6]α-MSH-ND demonstrated a γ-turn like
conformation around Lys6-(D-Phe)7-Arg8. This suggests that, for the two
analogues, the different potencies were probably the result of the distinct size of
their sixth residues rather than the electrical charge.
Except the binding affinity of [Trp6]α-MSH-ND(6-10) for MC1R, truncation
of Nle4 and Asp5 of α-MSH-ND remarkably decreased the receptor-binding and
cAMP-generating activity at all receptors. [Gln6]α-MSH-ND(6-10) was almost
unable to activate all the receptors, even though it could bind to these receptors.
In the NMR study, although [Gln6]α-MSH-ND(6-10) is composed of only five
amino acid residues, it revealed a very stable structure, a tight γ-turn composed of
Gln6-(D-Phe)7-Arg8. Therefore, a plausible explanation for the remarkable loss of
26
the receptor-binding and cAMP-generating activity of the truncated analogues
might be that these short analogues could no longer maintain a stable classic type
I β-turn conformation. On the other hand, α-MSH-ND(6-10) was able to generate
the maximum stimulation of the receptors at the higher concentration, whereas,
[Gln6]α-MSH-ND(6-10) was almost completely incapable of stimulating both
receptors. This suggests that the degree of flexibility and ability of truncated
analogues for receptor activation might be partially dependent on the flexible free
N-terminal end of the 6th residue itself. In combination with the NMR results of
[Lys6]α-MSH-ND and [Gln6]α-MSH-ND(6-10), they also suggest that the more
the structure of an α-MSH-ND-derived analogue diverges from the type I β-turn,
the less its biological activity at these receptors.
However, a very interesting finding in this study is that, α-MSH-ND
revealed a tight type I β-turn conformation, while [Gln6]α-MSH-ND showing a
type I’ β-turn structure, a very similar structure to that of α-MSH-ND. Despite
this subtle difference in back bone structures between the two oligopeptides,
[Gln6]α-MSH-ND gave the significant lower biological activity than α-MSH-ND.
In particular, compared to MC3R and MC4R, [Gln6]α-MSH-ND exhibited an
approximate 10,000-fold less biological activity than α-MSH-ND at MC1R.
From the NMR analysis, it was found that the backbone structures of α-MSH-
ND and [Gln6]α-MSH-ND are very similar, whereas their side chain orientations
are quite different, and [Gln6]α-MSH-ND is a mirror image analogue of α-MSH-
ND. To define how such conformational differences result in such great
differences in the biological activity at MC1R, we compared their individual
binding patterns to these receptors. Molecular modeling analysis revealed that the
positively charged His6 residue of α-MSH-ND interacts with the negatively
charged glutamine residues in the TM2 regions of the three melanocortin
receptors, whereas Gln6 of [Gln6]α-MSH-ND does not. This indicated that the
changed side chain orientation of the latter and its lack of a charge interaction
with the TM2 regions are responsible for the significant loss of biological activity
at these receptors. Hydrophobic binding pockets in each receptor were composed
27
of diverse hydrophobic amino acids, which may also confer binding activity or
specificity. NMR analysis showed that the D-Phe7 residue of [Gln6]α-MSH-ND
orientated as the mirror image of the corresponding α-MSH-ND position. This
directional displacement changed the D-Phe7 binding sites of all receptors from
the hydrophobic binding domain of TM7 to TM3 regions as described in Figure
12. Therefore, the altered receptor-binding patterns of the D-Phe7 residues of
[Gln6]α-MSH-ND could also explain its decreased biological potency at all
receptors.
The TM2 regions of all the three receptor subtypes would not bind to
[Gln6]α-MSH-ND, as described above, because of the altered orientation of Gln6,
and the Arg8- and Trp9-binding sites of all three receptors did not exhibit obvious
changes from one another. Therefore, the changed D-Phe7 orientation in [Gln6]α-
MSH-ND was considered to be likely to be responsible for the significant
decrease in biological activity at MC1R, while such a change was tolerable to
MC3R and MC4R. As we expected, D-Phe7 of [Gln6]α-MSH-ND could not
contact the hydrophobic binding region of TM7, as observed in α-MSH-ND,
instead, it would adjoin to the residues of the TM3 domains in all of the three
receptors. Compared to the changed binding sites of MC3R (Ser122) and MC4R
(Ser127), it could be seen that, in MC1R, these serine residues correspond to Val122,
which contains two methyl groups. Since the phenyl ring of [Gln6]α-MSH-ND
coincidentally overlaps with these two bulky groups, we speculate that its
interaction with the valine residue of MC1R, instead of the serine residue of
MC3R or MC4R, induces steric hindrance with D-Phe7 of the ligand, and that
specifically the repulsion between these two residues results in the relatively low
affinity of [Gln6]α-MSH-ND to MC1R.
Among the synthetic α-MSH analogues, α-MSH-ND exhibited the most
potent biological activity of all the synthetic analogues at MC3R and MC4R,
which activity is comparable to that of a well known analogue, MTII (Ac-Nle-
cyclic[Asp-His-DPhe-Arg-Trp-Lys]-NH2)(58). MTII has been reported to inhibit
food intake in mice after administration intracerebroventricularly or
28
intraperitoneally at moderate dose(6). Therefore, α-MSH-ND was tested to
evaluate if it has inhibitory effect on food intake after intraperitoneal injection.
Administration of α-MSH-ND significantly inhibited food intake of mice within
3 hours. This indicates that melanocortic peptides is associated directly with
regulation of food intake, and that α-MSH analogues, especially those with high
biological activity at MC3R and MC4R, could directly inhibit food intake. It also
demonstrates indirectly that α-MSH-ND could penetrate the brain-blood barrier
and modulate the region of central nervous system devolved in food intake.
The melanocortin receptors belong to the G-protein coupled receptor family,
and all of them couple not only in the stimulatory fashion to cAMP, but also in
other signal transduction system, including IP3 pathway. In this study, the
biological activities of α-MSH analogues were evaluated only by radio-ligand
binding and cAMP-generation assays. To understand more detailed mechanisms
of how melanocortins exert their different physiologic effects, further in vitro and
in vivo studies of melanocortin analogues are required to investigate how they
influence the other signal transduction pathway and what physiological effects
they could bring on after acting on different melanocortin receptor subtypes.
V. CONCLUSION
Taken together, the results obtained in this study suggest that type I β-turn
conformation comprising the residues of Asp5-His6-(D-Phe)7-Arg8 is important,
and the side chain orientations of 6th and 7th residues is critical for determination
of potency and selectivity of melanocortin analogues. In addition, we
demonstrated that minimization of MC1R with the preservation of comparable
MC3R and MC4R selectivity could be achieved by modifying the D-Phe7
orientation of α-MSH-ND, while keeping the ‘type I β-turn’-like structure.
29
REFERENCES
1. De Wied D, Jolles J. Neuropeptides derived from pro-opiomelanocortin: Behavioral, physio logical and neurochemical effects. Physiol Rev 1982; 62: 976-1059.
2. Eberle AN. The Melanotropin: Chemistry, Physiology and Mechanisms of Action. Karger, Basle; 1988; pp: 149-319.
3. Simpson ER, Waterman MR. Regulation of the synthesis of steroidogenic enzymes in adrenal cortical cells by ACTH. Ann Rev Physiol 1988; 50: 427-440.
4. Ceriani G, Macalus A, Catania A, Lipton JM. Central neurogenic antiinflammatory action of α-MSH. Neuroendocrinol 1994; 59: 138-143.
5. Van Bergen P, Janssen PM, Hoogerhout P, De Wildt DJ, Versteeg DH. Cardiovascular effects of γ-MSH/ACTH-like peptides: structure-activity relationship. Eur J Pharmacol 1995; 294: 795-803.
6. Fan W, Boston BA, Kesterson RA, Hruby VJ, Cone RD. Role of melanocortinergic neurons in feeding and the agouti obesity syndrome. Nature 1997; 385: 165-168.
7. Contreras PC, Takemori AE. Antagonism of morphine-induced analgesia, tolerance and dependence by α-MSH. J Pharmacol Exp Ther 1984; 229: 21-26.
8. Smith EM, Hughes TK, Hashemi F, Stefano GB. Immunosuppressive effects of corticotropin and melanotropin and their possible significance in human immunodeficiency virus infection. Proc Natl Acad Sci USA 1992; 89: 782-786.
9. O’Donahue TL, Dorsa DM. The opiomelanotropinergic neuronal and endocrine systems. Peptides 1982; 3: 353-395.
10. Chhajlani V, Muceniece R, Wikberg JES. Molecular cloning and expression of the human melanocyte stimulating hormone receptor. Biochem Biophys Res Commun 1993; 195: 866-873.
11. Chhajlani V, Wikberg JES. The cloning of a family of genes that encode the melanocortin receptors. FEBS Lett 1992; 309: 417-420.
12. Gantz I, Konda Y, Tashiro T, Shimoto Y, Miwa H, Munzert G, et al. Molecular cloning of a novel melanocortin receptor. J Biol Chem 1993; 268: 8246-8250.
13. Gantz I, Miwa H, Konda Y, Shimoto Y, Tashiro T, Watson SJ, et al. Molecular cloning, expression and gene localization of a fourth melanocortin receptor. J Biol Chem 1993; 268: 15174-15179.
14. Mountjoy KG, Robbins LS, Mortrud TT, Cone RD. The cloning of a family
30
of genes that encode the melanocortin receptors. Science 1992; 257: 1248-1251.
15. Mountjoy KG, Wong J. Obesity, diabetes and functions for pro-opiomelanocortin-derived peptides. Mol Cell Endocrinol 1997; 128: 171-177.
16. Wikberg JES. Melanocortin receptors: perspectives for novel drugs. Eur J Pharmacol 1999; 375: 295-310.
17. Cone RD, Lu D, Koppula S, Vage DI, Klungland H, Boston B, et al. The melanocortin receptors: agonists, antagonists, and the hormonal control of pigmentation. Recent Prog Horm Res 1996; 51: 287-317.
18. Xia Y, Skoog V, Muceniece R, Chhajlani V, Wikberg JES. Polyclonal antibodies against human melanocortin MC1 receptor: preliminary immunohistochemical localisation of melanocortin MC1 receptor to malignant melanoma cells. Eur J Pharmacol 1995; 288: 277-283.
19. Star RA, Rajora N, Huang J, Stock RC, Catania A, Lipton JM. Evidence of autocrine modulation of macrophage nitric oxide synthase by α-melanocyte-stimulating hormone. Pro Natl Acad Sci USA 1995; 92: 8016-8020.
20. Hartmeyer M, Scholzen T, Becher E, Bhardwaj RS, Schwartz T, Luger TA. Human dermal microvascular endothelial cells express the melanocortin receptor type 1 and produce levels of IL-8 upon stimulation with alpha-melanocyte-stimulating hormone. J Immunol 1997; 159: 1930-1397.
21. Catania A, Rajora A., Capsoni F, Minonzio F, Star RA, Lipton JM. The neuropeptide α-MSH has specific receptors on neutrophils and reduces chemotaxis in vitro. Peptides 1996; 17: 675-679.
22. Wong KY, Rajora,N, Boccoli G, Lipton JM. A potential mechanism of local anti-inflammatory action of alpha-melanocyte-stimulating hormone within the brain: modulation of tumor necrosis factor-alpha production by human astrocytic cells. Neuroimmunomodulation 1997; 4: 37-41.
23. Boston BA, Cone RD. Characterization of melanocortin receptor subtype expression in murine adipose tissues and in the 3T3-L1 cell line. Endocrinology 1996; 137: 2043-2050.
24. Luger TA, Scholzen T, Grabbe S. The role of alpha-melanocyte-stimulating hormone in cutaneous biology. J Invest Dermatol Symp Proc 1997; 2: 87-93.
25. Roselli-Rehfuss L, Mountjoy KG, Robbins LS, Mortrud MT, Low MJ, Tatro JB, et al. Identification of a receptor for γ-melanotropin and other proopiomelanocortin peptides in the hypothalamus and limbic system. Proc Natl Acad Sci USA 1993; 90: 8856-8860.
26. Chhajlani V. Distrubution of cDNA for melanocortin receptor subtypes in
31
human tissues. Biochem. Mol Biol Int 1996; 38: 73-80.
27. Mountjoy KG, Mortrud MT, Low MJ, Simerly RB, Cone RD. Localization of the melanocortin-4 receptor (MC4-R) in neuroendocrine and autonomic control circuits in the brain. Mol Endocrinol 1994; 8: 1298-1308.
28. Takeuchi S, Takahashi S. Melanocortin receptor genes in the chicken-tissue distributions. Gen Comp Endocrinol 1998; 112: 220-231.
29. Woods SC, Seeley RJ, Porte JRD, Schwartz MW. Signals that regulated food intake and energy homeostasis. Science 1998; 280: 1378-1383.
30. Campfield LA, Smith FJ, Burn P. Strategies and potential molecular targets for obesity treatment. Science 1998: 280: 1383-1387.
31. Krude H, Bieberann H, Luck W, Hom R, Brabant G, Gruters A. Severe early-onset obesity, adrenal insufficiency and red hair pigmentation caused by POMC mutation in humans. Nature Genetics 1998; 19(2): 155-157.
32. Huszar D, Lynch CA, Fairchild-Huntress V, Dunmore JH, Fang Q, Berkemeier LR, et al. Targeted disruption of the melanocortin-4 receptor results in obesity in mice. Cell 1997; 88: 131-141.
33. Bultman SJ, Michaud EJ, Woychik RP. Molecular characterization of the mouse agouti locus. Cell 1992; 71(7): 1195-1204.
34. Chen AS, Marsh DJ, Trumbauer ME, Frazier EG, Guan XM, Yu H, et al. Inactivation of the mouse melanocortin-3 receptor results in increased fat mass and reduced lean body mass. Nature Genetics 2000; 26: 97-102.
35. Hadley ME, Marwan MM, Al-Obeidi F, Hruby VJ, Castrucci AM. Linear and cyclic alpha-melanotropin(4-10)-fragment analogues that exhibit superpotency and residual activity. Pigment Cell Res 1989; 2: 478-484.
36. Hruby VJ, Lu D, Sharma SD, Castrucci A DeL, Kesterson RA, Al-Obeidi FA, et al. Cyclic lactam α-melanotropin analogues of Ac-Nle4-cyclo[Asp5, D-Phe7, Lys10]α-melanocyte-stimulating hormone-(4-10)-NH2 with bulky aromtic amino acids at position 7 show high antagoinst potency and selectivity at specific melanocortin receptors. J Med Chem 1995; 38: 3454-3461.
37. Schiöth HB, Muceniece R, Mutulis F, Prusis P, Lindeberg G, Sharma SD, et al. Selectivity of cyclic [D-Nal7] and [D-Phe7] substituted MSH analogues for the melanocortin receptor subtypes. Peptides 1997; 18(7): 1009-1013.
38. Sawyer TK, Sanfilippo PJ, Hruby VJ, Engel MH, Heward CB, Burnett JB, et al. 4-Norleucine, 7-D-pheylalanine-α-melanocyte-stimulating hormone: a highly potent alpha-melanotrophin with ultralong biological activity. Proc Natl Acad Sci USA 1980; 77(10): 5754-5758.
39. Schiöth HB, Muceniece R, Wikberg JE. Selectivity of [Phe-17], [Ala 6] and [D-Ala4, Gln5, Tyr6] substituted ACTH(4-10) analogues for the melanocortin receptors. Peptides 1997; 18(5): 761-763.
32
40. Li SZ, Lee JH, Lee W, Yoon CJ, Baik JH, Lim SK. Type I β-turn is important for biological activity of the melanocyte-stimulating hormone analogues. Eur J Biochem 1999; 265: 430-440.
41. Davis DG, Bax A. Assignment of complex 1H NMR spectra via two-dimensional homonuclear Hartmann-Hahn spectroscopy. J Am Chem Soc 1985; 107: 2820-2821.
42. Jeener J, Meier BH, Bachman P, Ernst RR. Investigation of exchange processes by two-dimensional NMR spectroscoopy. J Chem Phys 1979; 71: 4546-4553.
43. Rance M, Sorensen OW, Bodenhausen G, Wagner G, Ernst RR, Wuthrich K. Improved spectral resolution in COSY 1H-NMR spectra of proteins via double quantum filtering. Biochem Biophs Res Commun 1983; 117: 479-485.
44. Marion D, Wuthrich K. Application of phase sensitive two-dimensional correlated spectroscopy (COSY) for measurements of 1H-1H spin-spin coupling constants in proteins. Biochem Biophs Res Commun 1983; 113: 967-974.
45. Otting G, Widmer H, Wagner G, Wuthrich K. Origin of t1 and t2 ridges in 2D NMR spectra and procedures for suppression. J Magn Reson 1986; 66: 187-193.
46. Lee W, Moore CH, Watt DD, Krishna NR. Solution structure of the variant-3 neurotoxin from Centruroides sculpturatus Ewing. Eur J Biochem 1994; 218: 89-95.
47. Adan RAH, Gispen WH. Bran melanocoritin receptors: from cloning to function. Peptides. 1997; 18: 1279-1287.
48. Haskell-Luevano C, Hendrata S, North C, Sawyer TK, Hadley ME, Hruby VJ, et al. Discovery of prototype peptidomimetic agonists at the human melanocortin receptors MC1R and MC4R. J Med Chem 1997; 40: 2123-2129.
49. Baldwin JM, Schertler FXG, Unger VM. An alpha-carbon template for the transmembrane helices in the rhodopsin family of G-protein-coupled receptors. J Mol Biol 1997; 272: 144-164.
50. Prusis P, Frandberg,PA, Muceniece R, Kalvinsh I. A three dimensional model for the interaction of MSH with the melanocortin-1 receptor. Biochem Biophy Res Comm 1995; 210: 205-210.
51. Yang YK, Dickinson C, Haskell-Luvano C, Gantz I. Molecular basis for the interaction of [Nle 4, D-Phe7]melanocyte-stimulating hormone with the human melanocortin-1 receptor. J Biol Chem 1997; 272: 23000-23010.
52. Schiöth HB, Muceniece R, Szardenings M, Prusis P, Wikberg JES. Evidence indicating that the TM4, EL2 and TM5 of the melanocortin 3 receptor do
33
not participate in ligand binding. Biochem Biophys Res Commun 1996; 229: 687-692.
53. Kask A, Rago L, Korrovits P, Wikberg JE, Schiöth HB. Evidence that orexigenic effects of melanocortin 4 receptor antagonist HS014 are mediated by neuropeptide Y. Biochem Biophys Res Commun 1998; 248(2): 245-249.
54. Kesterson RA, Huszar D, Lynch CA, Simerly RB, Cone RD. Induction of neuropeptide Y gene expression in the dorsal medial hypothalamic nucleus in two models of the agouti obesity syndrome. Mol Endocrinol 1997; 11(5): 630-637.
55. Schiöth HB, Muceniece R, Wikberg JES, Chhajlani V. Characterization of melanocortin receptor subtypes by radioligand binding analysis. Eur J Pharmcol 1995; 288(3): 311-317.
56. Schiöth HB, Muceniece R, Wikberg JE. Characterization of the melanocortin 4 receptor by radioligand binding. Pharmacol Toxicol 1996; 79(3): 161-165.
57. Schiöth HB, Muceniece R, Larsson M, Mutulis F, Szardenings M, Prusis P, et al. Binding of cyclic and linear MSH core peptides to the melanocortin receptor subtypes. Eur J Pharmcol 1997; 319: 369-373.
58. Al-Obeidi RAH, Hadley ME, Pettitt BM, Hruby VJ. Design of a new class of superpotent cyclic α-melanotropin based on quenched dynamic simulation. J Am Chem Soc 1989; 111: 3413-3416.

34
국문요약
멜라노코틴 유도체의 구조 및 기능에 관한 연구
멜라노코틴(melanocortin)은 색소침착, 부신피질 스테로이드 생합성,
기억, 혈압 및 체중 등의 조절에 관여하는 것으로 알려졌으며 , 다섯 가
지 멜라노코틴 수용체의 클로닝(cloning)은 멜라노코틴의 작용 기전을
연구 하는데 새로운 장을 열어주었다. MC3R 및 MC4R 효현제(agonist)
는 현재 개발되고 있는 가장 중요한 비만치료제 후보물질중의 하나다.
그러나 특정 멜라노코틴 수용체 아형, 특히 MC3R 와 MC4R 에 대한
활성도가 크고 선택성(selectivity)이 높은 효현제는 아직 개발 되지 못
하였다. 이에 연구자 등은 특정 멜라노코틴 수용체 아형에 대한 높은
역가(potency)와 선택성을 가진 유도체를 탐색하고, 멜라노코틴 및 그
수용체간의 상호작용의 특징을 보다 구체적으로 조사하고, 또 비만치
료제로 쓰일 수 있는 후보 물질을 탐색하기 위하여 본 연구를 수행하
였다. 먼저 hMC1R, rMC3R 및 hMC4R cDNA 를 CHO 세포에 영구적으로
도입(stable transfection) 시켜서 각 멜라노코틴 수용체 아형을 과 표현하
는 세포주를 만들었다. 여러 가지 멜라노코틴 유도체를 합성한 후 각
멜라노코틴 수용체 아형에 대한 활성도를 radioligand-binding assay 및
cAMP-generating assay 방법으로 측정하였으며, 유도체들의 구조 및 유
도체-수용체간의 결합 및 활성화 기전을 규명하기 위해서 NMR 과
homology modeling 방법을 도입 분석하였다. MC3R 및 MC4R 에서 α-
MSH-ND 는 [Nle4]α-MSH 에 비해 높은 활성도를 보였다. NMR 분석결
과 α-MSH-ND 는 Type I β-turn 구조를 보인 반면에 [Nle4]α-MSH 는 헤
어핀 루프(hairpin loop) 구조를 보였다. α-MSH-ND 의 6번째 His 을 다른
아미노산들로 치환할 때 [Arg6]α-MSH-ND 를 제외하고는 세 가지 멜라
노코틴 수용체 아형 모두에서 활성도가 현저하게 감소되었다. 한편
NMR 구조연구에서는 [Gln6]α-MSH-ND 는 Type I’ β-turn 구조를 [Lys6]α-

35
MSH-ND 및 [Gln6]α-MSH-ND(6-10)는 γ-turn 구조를 보였다. 흥미롭게도
[Gln6]α-MSH-ND 의 활성도는 α-MSH-ND 에 비해 MC3R 및 MC4R 에
대하여 약간 떨어지는 반면에 MC1R 에서 10,000 배 정도 감소되었다.
Homology modeling 분석결과 유도체의 6 번째 아미노산기가 His 에서
Gln 로 치환함으로 6 번째 및 7 번째 아미노산기의 측쇄 방향(side chain
orientation)이 α-MSH-ND 의 것과 서로 반대 방향으로 위치하는 것을
관찰 하였다. 따라서 수용체 결합부위(binding pocket)에 대한 유도체의
결합양상이 바뀐 것이 세 수용체 모두에서 두 유도체 활성도의 현저한
차이를 나타나는 원인인 것으로 사료된다. [Gln6]α-MSH-ND 의 7 번째
아미노산기 D-Phe 의 phenyl ring 이 MC3R 및 MC4R 의 TM3 부위의
Ser122 및 Ser127과 각각 결합하는 반면에 MC1R 에서 유도체의 D-Phe 과
결합하는 부위가 두개 큰 methyl group 를 가지고 있는 Val122 로 바뀌었
다. 따라서 [Gln6]α-MSH-ND 와 MC1R의 결합은 MC3R 및 MC4R에 결
합하는 것보다 더 어려운 것으로 사료되었다. 한편 In vivo 실험에서
MC3R 및 MC4R 에 대한 활성도가 가장 높은 유도체인 α-MSH-ND 를
정상 수컷 ICR 백서 복강내에 투여한 결과 연속 3 시간동안의 식이섭
취(food intake)가 현저하게 억제되는 것은 관찰 하였다. 결론적으로 멜
라노코틴의 핵심 아미노산기(core residue)인 His6-(D-Phe)7-Arg8-Trp9 의
His6 중심으로 한 type I β-turn 구조가 멜라노코틴 유도체의 활성도를
결정하는데 매우 중요한 것으로 사료되며 6 번째 및 7 번째 아미노산기
의 측쇄 방향도 멜라노코틴의 활성도를 결정하는데 중요하다는 것을
알 수 있었다.
핵심되는말: 멜라노코틴 수용체, binding affinity, cAMP-generating activity,
핵자기 공명, type I β-turn, homology modeling