2010 cafr minnesota
TRANSCRIPT
8/6/2019 2010 CAFR Minnesota
http://slidepdf.com/reader/full/2010-cafr-minnesota 1/265
State of Minnesota
Comprehensive Annual
Financial Report
For the Year Ended June 30, 2010
8/6/2019 2010 CAFR Minnesota
http://slidepdf.com/reader/full/2010-cafr-minnesota 2/265
Minnesota State is defined by its connection with the Mississippi River.Headwaters for the mighty river are located in Itasca State Park. Flowing
through Minneapolis, the state's largest city, and Saint Paul, the state'scapital, it continues to Lake Pepin, the birthplace of water skiing and home tohundreds of bald eagles and other water fowl. Distinctive bridges spanning the
river connect us with the eastern half of the nation and its stream carries ournatural resources to the Gulf Coast.
Credits and permission
a.
b. c.
d. e.f.
A. Mark Evans - http://www.flickr.com/photos/chimothy27/1699271163/in/photostream/ B. SusanLesch - Creative Commons -http://creativecommons.org/licenses/by-sa/3.0/ C. Permission given - Gus GaspardoD. Donald Rowan, Minneapolis MNE. Donald Rowan, Minneapolis MNF. Mike Peters, Albuquerque NM, http://www.flickr.com/mail/72157624905615192
8/6/2019 2010 CAFR Minnesota
http://slidepdf.com/reader/full/2010-cafr-minnesota 3/265
State of Minnesota
Prepared by Minnesota
Management and Budget
Steve Sviggum,
Commissioner
400 Centennial Office Building
658 Cedar Street
Saint Paul, Minnesota 55155
Comprehensive
Annual Financial
ReportFor the Year Ended June 30, 2010
8/6/2019 2010 CAFR Minnesota
http://slidepdf.com/reader/full/2010-cafr-minnesota 4/265
State of Minnesota
2010Comprehensive
AnnualFinancial Report
The State of Minnesota Comprehensive Annual
Financial Report can be made available inalternative formats upon request, to ensure that itis accessible to people with disabilities. Toobtain this document in an alternate format,contact:
Minnesota Management and Budget400 Centennial Office Building658 Cedar StreetSaint Paul, Minnesota 55155-1489651-201-8000
The Minnesota Relay service phone number is1-800-627-3529.
The State of Minnesota Comprehensive AnnualFinancial Report is available at the followingwebsite:http://www.mmb.state.mn.us/
8/6/2019 2010 CAFR Minnesota
http://slidepdf.com/reader/full/2010-cafr-minnesota 5/265
State of Minnesota
2010 Comprehensive Annual Financial Report
Table of Contents
iii
Introduction
PageTransmittal Letter from the Commissioner of Minnesota Management and Budget ................................................ viiCertificate of Achievement ......................................................................................................................................... xiState Organization Chart .......................................................................................................................................... xiiState Principal Officials............................................................................................................................................. xiii
Financial Section
Independent Auditor's Report ......................................................................................................................................... 2Management’s Discussion and Analysis ........................................................................................................................ 5
Basic Financial StatementsGovernment-wide Financial Statements
Statement of Net Assets ....................................................................................................................................... 24Statement of Activities .......................................................................................................................................... 26
Fund Financial StatementsGovernmental Fund Financial Statements ............................................................................................................ 31
Balance Sheet ................................................................................................................................................... 32Reconciliation of the Government Funds Balance Sheet to the Statement of Net Assets ................................. 33Statement of Revenues, Expenditures and Changes in Fund Balances ........................................................... 34Reconciliation of the Statement of Revenues, Expenditures and Changes in Fund Balances of
Governmental Funds to the Statement of Activities ....................................................................................... 35Statement of Revenues, Expenditures and Changes in Fund Balances - Budget to Actual -
Budgetary Basis General Fund ...................................................................................................................... 36Proprietary Fund Financial Statements ................................................................................................................. 37
Statement of Net Assets .................................................................................................................................... 38Statement of Revenues, Expenses and Changes in Net Assets ....................................................................... 39
Statement of Cash Flows .................................................................................................................................. 40Fiduciary Fund Financial Statements .................................................................................................................... 43
Statement of Net Assets .................................................................................................................................... 44Statement of Changes in Net Assets ................................................................................................................. 45
Component Unit Financial Statements .................................................................................................................. 47Statement of Net Assets .................................................................................................................................... 48Statement of Activities ....................................................................................................................................... 49
Index of Notes to the Financial Statements........................................................................................................... 51Notes to the Financial Statements ........................................................................................................................ 53
Required Supplementary InformationModified Approach for Infrastructure ...................................................................................................................... 139Actuarial Measures of Pension Funding Progress .................................................................................................. 142Actuarial Measures of Other Postemployment Benefits Funding Progress ............................................................ 144Public Employees Insurance Program Development Information ........................................................................... 145
Combining and Individual Fund Statements - Nonmajor FundsNonmajor Special Revenue, Debt Service, Permanent and Capital Projects Funds ........................................... 149
Combining Balance Sheet ............................................................................................................................... 150Combining Statement of Revenues, Expenditures and Changes in Fund Balances ....................................... 151
Nonmajor Special Revenue Funds ..................................................................................................................... 152Combining Balance Sheet ............................................................................................................................... 154Combining Statement of Revenues, Expenditures and Changes in Fund Balances ....................................... 158Combining Schedule of Revenues, Expenditures and Changes in Fund Balances - Budget to Actual -
Budgetary Basis ........................................................................................................................................... 162Note to Nonmajor Appropriated Special Revenue Funds Combining Schedule of Revenues,
Expenditures and Changes in Fund Balances - Budget and Actual - Budgetary Basis ........................... 167
8/6/2019 2010 CAFR Minnesota
http://slidepdf.com/reader/full/2010-cafr-minnesota 6/265
iv
Financial Section (continued)
Nonmajor Capital Projects Funds ....................................................................................................................... 169Combining Balance Sheet ............................................................................................................................... 170Combining Statement of Revenues, Expenditures and Changes in Fund Balances ....................................... 171
Nonmajor Enterprise Funds ................................................................................................................................ 173Combining Statement of Net Assets ................................................................................................................ 174Combining Statement of Revenues, Expenses and Changes in Net Assets ................................................... 176
Combining Statement of Cash Flows .............................................................................................................. 178Internal Service Funds ........................................................................................................................................ 181
Combining Statement of Net Assets ................................................................................................................ 182Combining Statement of Revenues, Expenses and Changes in Net Assets ................................................... 184Combining Statement of Cash Flows .............................................................................................................. 186
Pension Trust Funds ........................................................................................................................................... 188Combining Statement of Net Assets ................................................................................................................ 190Combining Statement of Changes in Net Assets............................................................................................. 194
Investment Trust Fund ........................................................................................................................................ 199Combining Statement of Plan Net Assets........................................................................................................ 200Combining Statement of Changes in Plan Net Assets .................................................................................... 201
Agency Fund ....................................................................................................................................................... 203Statement of Changes in Assets and Liabilities ............................................................................................... 204
Nonmajor Component Unit Funds ....................................................................................................................... 205Combining Statement of Net Assets ................................................................................................................ 206
Combining Statement of Activities ................................................................................................................... 208Nonmajor Component Units Not Issuing Separately Audited Financial Statements
Combining Statement of Revenues, Expenses and Changes in Net Assets ................................................... 210Combining Statement of Cash Flows .............................................................................................................. 211
General Obligation Debt ScheduleGeneral Obligation Bonds Authorized, Issued and Unissued ................................................................................. 214
Statistical Section
Index of Statistical Section ..................................................................................................................................... 219Financial Trends
Schedule 1 - Net Assets by Component ............................................................................................................. 220Schedule 2 - Changes in Net Assets .................................................................................................................. 222Schedule 3 - Fund Balances – Governmental Funds .......................................................................................... 226Schedule 4 - Changes in Fund Balances – Governmental Funds ....................................................................... 230
Revenue CapacitySchedule 5 - Revenue Base ............................................................................................................................... 232Schedule 6 - Revenue Rates .............................................................................................................................. 234Schedule 7 - Principal Tax Payers ...................................................................................................................... 237
Debt CapacitySchedule 8 - Ratios of Outstanding and General Bonded Debt .......................................................................... 238Schedule 9 - Pledged Revenue Coverage .......................................................................................................... 240
Economic and Demographic InformationSchedule 10 - Demographic and Economic Statistics ......................................................................................... 245Schedule 11 - Principal Employers ..................................................................................................................... 245
Operating InformationSchedule 12 - Full-Time Equivalent State Employees by Function ..................................................................... 246Schedule 13 - Operating and Capital Asset Indicators by Function .................................................................... 248
8/6/2019 2010 CAFR Minnesota
http://slidepdf.com/reader/full/2010-cafr-minnesota 7/265
v
State of Minnesota
2010
Comprehensive
Annual
Financial Report
Introduction

8/6/2019 2010 CAFR Minnesota
http://slidepdf.com/reader/full/2010-cafr-minnesota 8/265
MINNESOTA
Headwaters of the mighty Mississippi
vi
8/6/2019 2010 CAFR Minnesota
http://slidepdf.com/reader/full/2010-cafr-minnesota 9/265
State of Minnesota
2010 Comprehensive Annual Financial Report
Transmittal Letter from the Commissioner of Minnesota
Management and Budget
AN EQUAL OPPORTUNITY EMPLOYER
vii
December 20, 2010
The Honorable Tim Pawlenty, Governor
Members of the Legislature
In accordance with Minnesota Statutes, Section 16A.50, Minnesota Management and Budget is pleasedto submit the Comprehensive Annual Financial Report (CAFR) for the state of Minnesota for the fiscal
year ended June 30, 2010. This report includes the financial statements for the state, and the disclosuresnecessary to accurately present the financial condition and results of operations for the year then ended.The report has been prepared in accordance with generally accepted accounting principles (GAAP) for governmental units.
The report is divided into three sections:
Introduction Section – Includes this letter of transmittal, the certificate of achievement, the state’s organization chart, and the list of principal officials.
Financial Section – Includes the auditor’s opinion, the management’s discussion and analysis, thebasic financial statements, the combining and individual fund statements for nonmajor funds, and thegeneral obligation debt schedule. The Notes to the Financial Statements, in the basic financial
statements, are necessary for an understanding of the information included in the statements. Thenotes include the Summary of Significant Accounting Policies and other necessary disclosure of matters relating to the financial position of the state.
Statistical Section – Includes mainly trend data and nonfinancial information useful in assessing agovernment’s financial condition.
Management assumes full responsibility for the completeness and reliability of the information containedin this report, based on a comprehensive framework of internal control that it has established for thispurpose. Because the cost of internal control should not exceed anticipated benefits, the objective is toprovide reasonable, rather than absolute, assurance that the financial statements are free of any materialmisstatements.
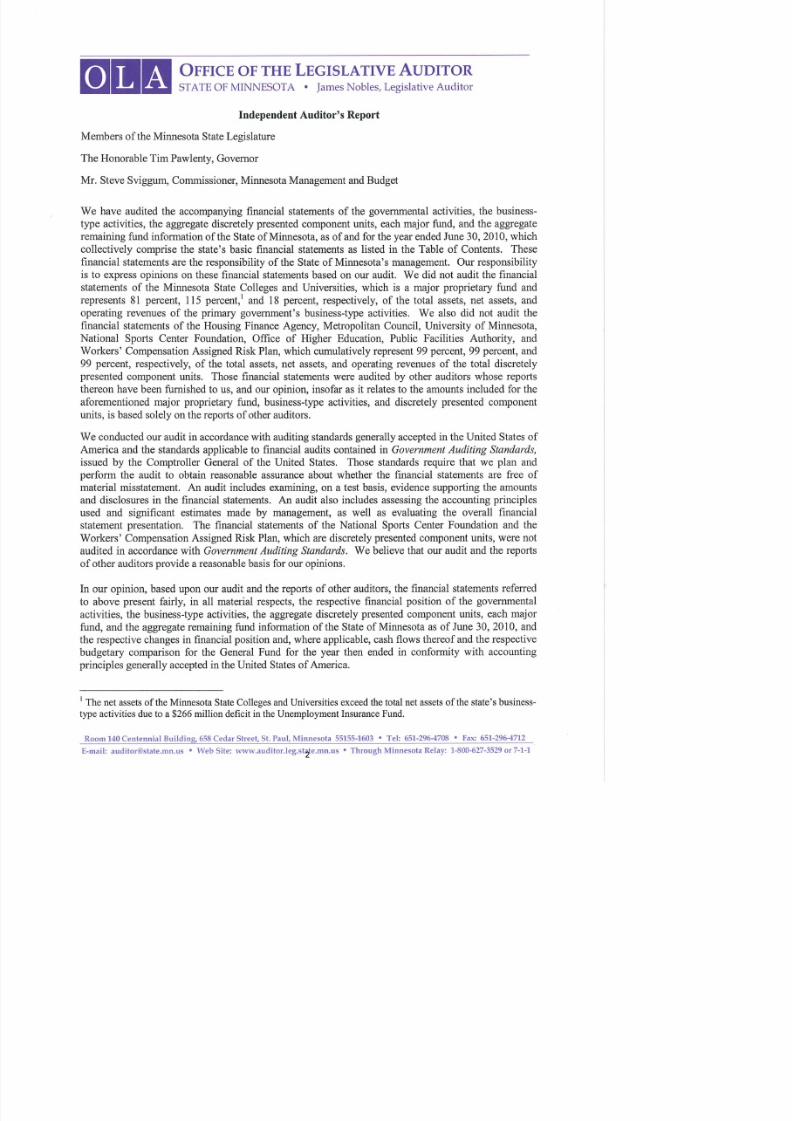
The independent Office of the Legislative Auditor has issued an unqualified (clean) opinion on the state of Minnesota’s financial statements for the year ended June 30, 2010. The independent auditor’s report islocated at the front of the financial section of this report.
As a part of the audit of these financial statements, the Office of the Legislative Auditor is conducting asingle audit of federal programs. This audit meets the requirements of the federal Single Audit Act and isdesigned to meet the special needs of federal grantor agencies. The standards governing Single Auditengagements require the independent auditor to report not only on the fair presentation of the financialstatements, but also on the state’s internal controls and legal requirements involving the administration of federal awards for the year ended June 30, 2010. The supplementary report, "Financial and ComplianceReport on Federally Assisted Programs" will be available in March 2011.
400 Centennial Building658 Cedar Street
St. Paul, Minnesota 55155Voice: (651) 201-8000
Fax: (651) 296-8685TTY: 1-800-627-3529
8/6/2019 2010 CAFR Minnesota
http://slidepdf.com/reader/full/2010-cafr-minnesota 10/265
viii
Management’s discussion and analysis (MD&A) immediately follows the independent auditor’s report andprovides a narrative introduction, overview, and analysis of the basic financial statements. MD&A isdesigned to complement this letter of transmittal and should be read in conjunction with it.
Financial Reporting Entity and Responsibilities
The financial reporting entity consists of all the funds of the primary government, as well as its componentunits. Component units are legally separate organizations for which the state is financially accountable.Financial accountability is defined as appointment of a voting majority of the component unit's governingbody, and either (a) the ability of the state to impose its will, or (b) the potential for the organization toprovide financial benefits to, or impose financial burdens on, the primary government; the organization isfiscally dependent on the primary government; or the nature and relationship between the primarygovernment and the organization is such that exclusion would cause the reporting entity’s financialstatements to be misleading or incomplete.
The Housing Finance Agency, Metropolitan Council, University of Minnesota, Agricultural and EconomicDevelopment Board, National Sports Center Foundation, Office of Higher Education, Public FacilitiesAuthority, Rural Finance Authority, and Workers’ Compensation Assigned Risk Plan are component unitsreported discretely. The state has either the ability to impose its will over these agencies or providessubstantial funding.
Minnesota Management and Budget is responsible for the Minnesota Accounting and ProcurementSystem (MAPS) and the information warehouse from which these financial statements were prepared.MAPS is maintained primarily on a budgetary basis of accounting. However, certain accrual informationis recorded in MAPS. The budgetary basis recognizes revenues and expenditures essentially on a cashbasis, except that encumbrances at year-end are considered expenditures. Since this budgetary basisdiffers from GAAP, adjustments to accounting data are necessary to provide financial statements inaccordance with GAAP. These disparate bases result in budgetary fund balances, which often differ significantly from those calculated under GAAP.
Minnesota Management and Budget is also responsible for designing and applying the state's system of internal accounting controls. These controls provide reasonable assurance that the state's assets areprotected against loss and that the accounting records from which the financial statements are prepared
are reliable. The concept of reasonable assurance recognizes that the cost of control should not exceedthe benefit derived.
Budget Process - The state's fiscal period is a biennium. The Governor's biennial budget is presented tothe legislature in January, or February after a gubernatorial transition, of odd numbered years for theupcoming biennium. The state constitution and statutes require a balanced budget for the biennium.Specific legislative appropriations are required for several funds. These funds include the General, TrunkHighway, Highway User Tax Distribution, State Airports, Petroleum Tank Cleanup, Natural Resources,Game and Fish, Environmental and Remediation, Heritage, Special Compensation, Health Care Access,and Workforce Development funds.
Budgetary control is provided primarily through the accounting system. Appropriations are established inthe accounting system at the amounts provided in the appropriation laws. The accounting system does
not permit expenditures in excess of these amounts.
Implementation of New Accounting Standards
During the current year, the state implemented seven new Generally Accepted Accounting Principles(GAAP), including GASB Statement No. 54, “Fund Balance Reporting and Governmental Fund TypeDefinitions.” This statement enhances the usefulness of fund balance information by providing clearer fund balance classifications that can be more consistently applied. It establishes fund balanceclassifications that comprise a hierarchy based primarily on the extent to which a government is bound toobserve constraints imposed upon the use of the resources reported in governmental funds. This
8/6/2019 2010 CAFR Minnesota
http://slidepdf.com/reader/full/2010-cafr-minnesota 11/265
ix
statement also clarifies existing governmental fund type definitions, which resulted in changes to thestate’s fund structure. These changes primarily related to several special revenue funds no longer meeting the GAAP definition of a special revenue fund which are now being reported in the General Fundfor GAAP purposes.
Economic Condition and Outlook
Minnesota appears to be recovering from the Great Recession more rapidly than much of the rest of thenation. The state’s June 2010 unemployment rate was 6.8 percent, eighth lowest among states, and 1.6percentage points below the 8.4 percent rate observed a year earlier. Minnesota’s unemployment ratewas also 2.7 percentage points less than the national rate of 9.5 percent. Payroll employment inMinnesota began to grow in September 2009 and by the end of the fiscal year 2010, Minnesota hadadded 9,000 jobs over June 2009. Nationally, employment in June 2010 was 0.2 percent less than year earlier levels; in Minnesota, employment was up 0.3 percent. The growth in jobs, however, does notmean that employment in the state has recovered to its pre-recession peak. Minnesota lost nearly154,000 jobs between December 2007 and September 2009. By the close of fiscal year 2010, Minnesotaemployment had grown by 34,000, leaving 120,000 fewer jobs in the state than at the end of calendar 2007.
Minnesota’s employment turnaround was limited to service sector jobs. Manufacturing employmentremained at year earlier levels and construction jobs continued to decline an additional 7,000 jobs fromthe end of fiscal 2009. Construction employment in Minnesota has fallen by nearly 28 percent since thestart of the recession, and by more than one-third from its pre-recession high. Health care, leisure andhospitality, and business and professional services were the sectors with the greatest employment growthduring the past fiscal year.
Personal income in Minnesota grew by 2.7 percent between the end of fiscal year 2009 and the end of fiscal year 2010, 0.5 percentage points faster than the national growth rate of 2.2 percent. Minnesotawages also grew faster than the U.S. average over the past year. At the close of the fiscal year 2010,Minnesota wages were $123.6 billion, 1.9 percent more than at the close of the 2009 fiscal year. Over that same period, U.S. wages grew less than one half as fast, up by 0.8 percent.
The outlook for Minnesota in fiscal year 2011 is very similar to the national outlook. In Minnesota,
employment is expected to increase by 16,000 jobs, 0.6 percent, in fiscal year 2011. Nationally,employment growth of 0.7 percent is projected. Minnesota wages are projected to grow by 3.4 percent infiscal year 2011 and personal income by 3.5 percent compared to national average of 2.9 and 3.1,respectively. Manufacturing employment is projected to add 6,000 jobs, while construction is projected todecline an additional 3,000 jobs. Employment is forecasted to grow the most in the health care servicessector, where an additional 12,000 jobs are expected to be added in fiscal year 2011.
General Fund Condition
The 2010-2011 enacted biennial budget decreased General Fund spending on a budgetary basis by 9.8percent compared to the 2008-2009 biennium. Two significant factors reduced 2010-2011 biennialspending on a one-time basis: funding received through the federal American Recovery and
Reinvestment Act (ARRA) and the K-12 payment deferral. Without the impact of moving General Fundexpenditures to the Federal Fund (special revenue fund) through ARRA grants and the K-12 paymentshifts, the 2010-2011 biennial budget would have increased by 1.4 percent relative to the 2008-2009biennial budget. The total General Fund impact of ARRA grants in fiscal years 2009-2011 was $2.7billion. The total impact of the K-12 payment shifts in the 2010-2011 biennium was $1.9 billion.
Minnesota budgets and manages its financial affairs on a budgetary basis, which primarily uses a cashbasis of accounting. Revenues are recorded when received and expenditures are recorded when thepayments are made with the exception that, at year-end, encumbered amounts are included in theexpenditures of the year appropriated for budgetary reporting. GAAP requires that the modified accrualbasis of accounting be used to prepare governmental fund statements. The modified accrual basis of
8/6/2019 2010 CAFR Minnesota
http://slidepdf.com/reader/full/2010-cafr-minnesota 12/265
x
accounting recognizes revenues when they become both measurable and available to finance operationsof the fiscal year or liquidate liabilities existing at fiscal year end. Expenditures are recognized when aliability occurs.
On a budgetary basis, the state’s General Fund ended fiscal year 2010 with an undesignated fundbalance of $75 million. On a GAAP basis, the General Fund reported a deficit of $886 million, a decreaseof $961 million from the budgetary General Fund balance. The difference between the budgetary and
GAAP fund balance results from two primary reasons. First, on a GAAP basis, the accruals of revenueand expenditures are required to be reported under the modified accrual basis of accounting. Second, asa result of implementing GASB Statement No. 54, several funds are included in the GAAP fund balancewhich are not included in the budgetary fund balance. These additional funds reported a fund balance of $860 million. The difference between the GAAP basis and budgetary basis General Fund fund balance,excluding these additional funds not reported in the budgetary fund balance, was $1.8 billion. For detailsof the budget to GAAP differences, see Note 18 – Budgetary Basis vs. GAAP in the Notes to theFinancial Statements.
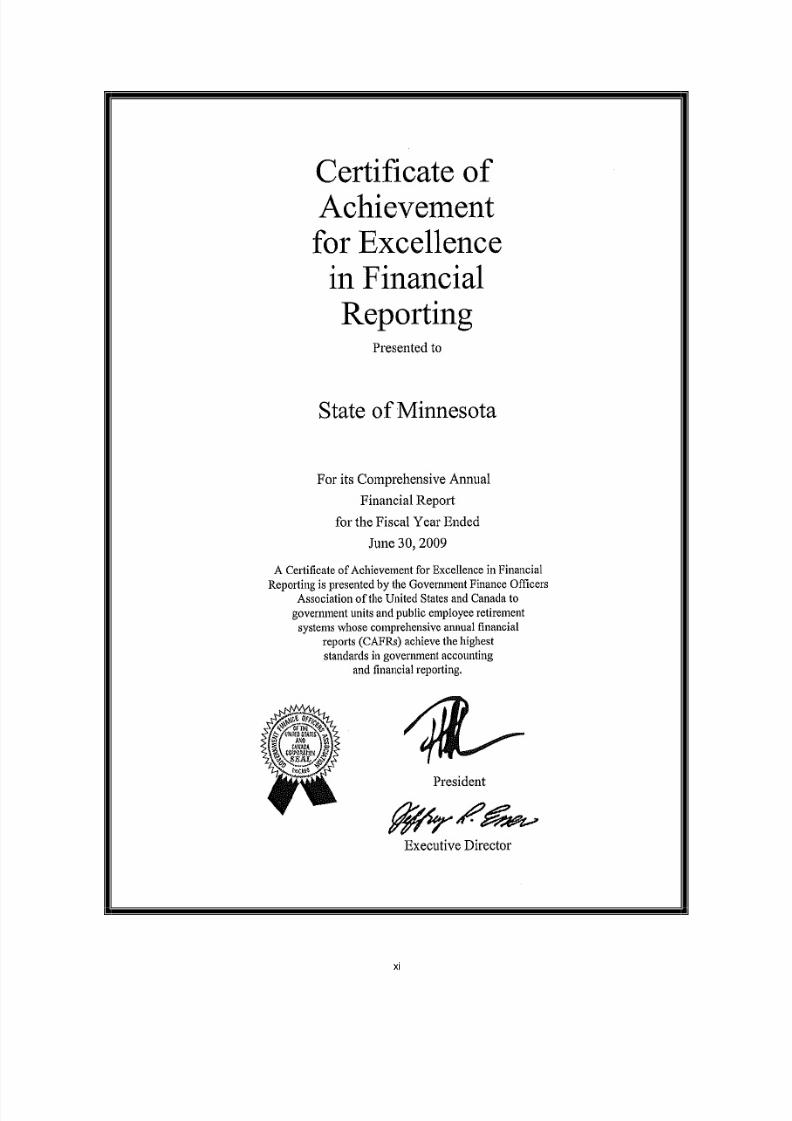
Certificate of Achievement
The Government Finance Officers Association of the United States and Canada (GFOA) awarded aCertificate of Achievement for Excellence in Financial Reporting to the state of Minnesota for itscomprehensive annual financial report for the fiscal year ended June 30, 2009. This was the twenty-fifthconsecutive year that the state has received this prestigious award. To be awarded a Certificate of Achievement, a government must publish an easily readable and efficiently organized comprehensiveannual financial report. This report must satisfy both generally accepted accounting principles andapplicable legal requirements.
A Certificate of Achievement is valid for a period of one year only. We believe that our currentcomprehensive annual financial report continues to meet the Certificate of Achievement Program’srequirements and we are submitting it to the GFOA to determine its eligibility for another certificate.
Acknowledgments
Although Minnesota Management and Budget accepts final responsibility for this report, staff in manyother state agencies and component units provided much of the data. Assistance from theseorganizations ranged from providing necessary data to actual preparation of financial statements. Iappreciate the dedication of the people in Minnesota Management and Budget and in other agencies whohelped in the preparation of this report, without whose efforts this report would not have been possible.
Sincerely,
Steve Sviggum
Commissioner
8/6/2019 2010 CAFR Minnesota
http://slidepdf.com/reader/full/2010-cafr-minnesota 13/265
xi
8/6/2019 2010 CAFR Minnesota
http://slidepdf.com/reader/full/2010-cafr-minnesota 14/265
State of Minnesota
2010 Comprehensive Annual Financial Report
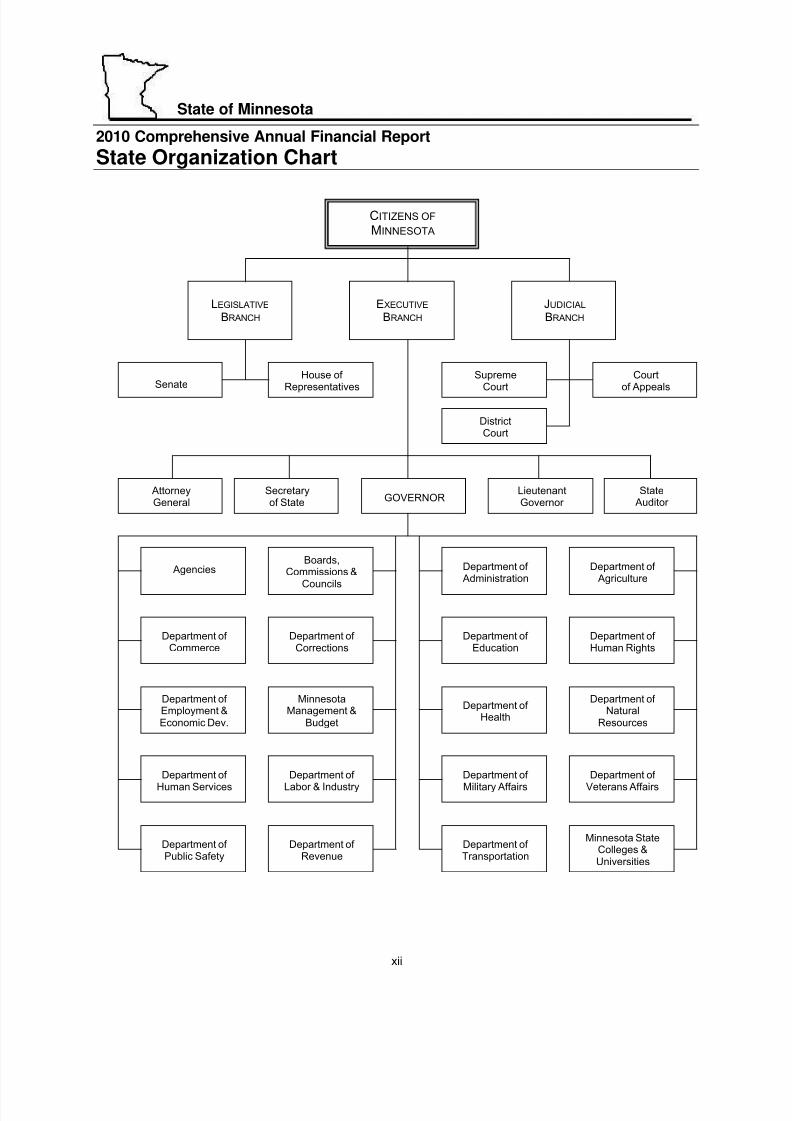
State Organization Chart
xii
CITIZENS OF MINNESOTA
LEGISLATIVE BRANCH
House of Representatives
EXECUTIVE BRANCH
Senate
DistrictCourt
SupremeCourt
Courtof Appeals
AttorneyGeneral
Secretaryof State GOVERNOR
LieutenantGovernor
StateAuditor
AgenciesBoards,
Commissions &
Councils
Department of Administration
Department of Agriculture
Department of Commerce
Department of Corrections
Department of Employment &Economic Dev.
Minnesota Management &
Budget
Department of Health
Department of Human Rights
Department of
Human Services
Department of
Labor & Industry
Department of
Military Affairs
Department of Natural
Resources
Department of Public Safety
Department of Revenue
Minnesota StateColleges &Universities
Department of Education
Department of Transportation
Department of
Veterans Affairs
JUDICIAL BRANCH
8/6/2019 2010 CAFR Minnesota
http://slidepdf.com/reader/full/2010-cafr-minnesota 15/265
State of Minnesota
2010 Comprehensive Annual Financial Report
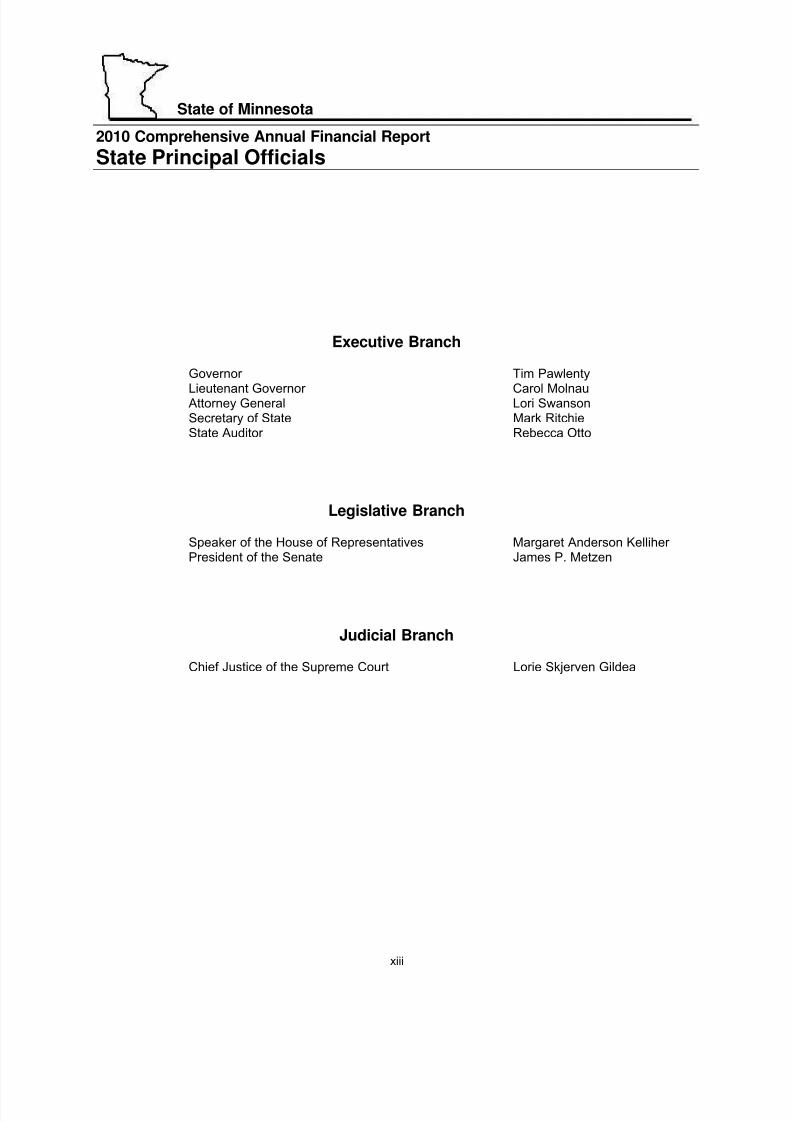
State Principal Officials
xiii
Executive Branch
Governor Tim Pawlenty
Lieutenant Governor Carol MolnauAttorney General Lori SwansonSecretary of State Mark RitchieState Auditor Rebecca Otto
Legislative Branch
Speaker of the House of Representatives Margaret Anderson Kelliher President of the Senate James P. Metzen
Judicial Branch
Chief Justice of the Supreme Court Lorie Skjerven Gildea

8/6/2019 2010 CAFR Minnesota
http://slidepdf.com/reader/full/2010-cafr-minnesota 16/265
MINNESOTA
Headwaters of the mighty Mississippi
xiv
8/6/2019 2010 CAFR Minnesota
http://slidepdf.com/reader/full/2010-cafr-minnesota 17/265
State of Minnesota
2010
Comprehensive
Annual
Financial Report
Financial
Section
1
8/6/2019 2010 CAFR Minnesota
http://slidepdf.com/reader/full/2010-cafr-minnesota 18/265
2
8/6/2019 2010 CAFR Minnesota
http://slidepdf.com/reader/full/2010-cafr-minnesota 19/265
3

8/6/2019 2010 CAFR Minnesota
http://slidepdf.com/reader/full/2010-cafr-minnesota 20/265
MINNESOTA
Headwaters of the mighty Mississippi
4
8/6/2019 2010 CAFR Minnesota
http://slidepdf.com/reader/full/2010-cafr-minnesota 21/265
State of Minnesota
2010 Comprehensive Annual Financial Report
Management’s Discussion and Analysis
Introduction
The following discussion and analysis of the state of Minnesota (state) financial performance provides anoverview of the state’s financial activities for the fiscal year ended June 30, 2010, and identifies changesin the financial position of the state, which occurred during the fiscal year. This section should be read inconjunction with the preceding transmittal letter and the state’s financial statements and notes to t hefinancial statements, which follow.
Overview of the Financial Statements
The focus of Minnesota’s financial reporting is on the state as a whole, and on the individual funds that
are considered to be major. This reporting focus presents a more comprehensive view of Minnesota’sfinancial activities and financial position, and makes the comparison of Minnesota’s government to other governments easier.
The financial section of this annual report has four parts:
Management’s Discussion and Analysis (MD&A)
Basic Financial Statements
Required Supplementary Information
Combining and Individual Fund Statements – Nonmajor Funds
The report also includes statistical and economic information, which generally provides a ten-year historyof various indicators.
The basic financial statements include government-wide financial statements, fund financial statements,and notes to the financial statements that provide more detailed information to the users of the financialstatements.
Government-wide Financial Statements
The government-wide financial statements provide an overall view of the state’s operations in a manner similar to a private-sector business. Government-wide financial statements consist of the statement of net assets and the statement of activities that are prepared using the economic resources measurementfocus and the accrual basis of accounting. All current year revenues and expenses are included in thestatements regardless of whether the related cash has been received or paid. Revenues and expensesare reported in the statement of activities for some items that will not result in cash flows until future fiscalperiods (e.g., uncollected taxes, accounts receivable, and earned but unused vacation leave). Thisreporting method produces a view of financial activities and position similar to that presented by mostprivate-sector companies. The statements provide both short-term and long-term information about thestate’s financial position, which assists readers in assessing the state’s economic condition at the end of the fiscal year.
The government-wide financial statements are located immediately following this discussion and analysis.
5
8/6/2019 2010 CAFR Minnesota
http://slidepdf.com/reader/full/2010-cafr-minnesota 22/265
The statement of net assets presents all of the state’s financial resources along with capital assets andlong-term obligations. The statement includes all assets and liabilities of the state. Net assets is thedifference between assets and liabilities and is one method to measure the state’s financial condition.
An increase or decrease in the state’s net assets from one year to the next indicates whether thefinancial position of the state is improving or deteriorating.
Other indicators of the state’s financial condition include the condition of its infrastructure and
economic events and trends that affect future revenues and expenses.
The statement of activities presents the changes in net assets and reports on the gross and net cost of various activities carried out by the state (governmental, business-type, and component units). Thesecosts are paid by general taxes and other revenues generated by the state. This statement summarizesthe cost of providing specific services by the government, and includes all current year revenues andexpenses.
The statement of net assets and the statement of activities segregate the activities of the state into threetypes:
Governmental Activities
The governmental activities of the state include most basic services such as environmental resources,general government, transportation, education, health and human services, and public safety. Most of the costs of these activities are financed by taxes, fees, and federal grants.
Business-type Activities
The business-type activities of the state normally are intended to recover all, or a significant portion of,their costs through user fees and charges to external users of goods and services. The operations of theUnemployment Insurance Fund, the State Colleges and Universities, and the Lottery are examples of business-type activities.
Discretely Presented Component Units
Component units are legally separate organizations for which the state is financially accountable, or thenature and significance of the unit’s relationship with the state is such that exclusion of the unit wouldcause the state’s financial statements to be misleading or incomplete. Financial accountability is definedas the appointment of a voting majority of the component unit governing body, and either a) the ability of the state to impose its will, or b) the potential for the organization to provide financial benefits to, or impose financial burdens on, the primary government.
The state’s nine component units are reported in two categories: major and nonmajor. Thiscategorization is based on the relative size of an individual component unit’s assets, liabilities, revenues,and expenses in relation to the total of all component units and the primary government.
The state’s three discretely presented major component units are:
Housing Finance Agency
Metropolitan Council
University of Minnesota
6
8/6/2019 2010 CAFR Minnesota
http://slidepdf.com/reader/full/2010-cafr-minnesota 23/265
The state’s six nonmajor component units are combined into a single column for reporting in the fundfinancial statements. These nonmajor component units are:
Agricultural and Economic Development Board
National Sports Center Foundation
Office of Higher Education
Public Facilities Authority
Rural Finance Authority
Workers’ Compensation Assigned Risk Plan
State Fund and Component Unit Financial Statements
A fund is a grouping of related self-balancing accounts used to maintain control over resources that havebeen segregated for specific activities or objectives. The state of Minnesota, like other state and localgovernments, uses fund accounting to ensure and demonstrate compliance with finance-related legal
requirements.
Fund financial statements present financial information in a format familiar to experienced users of governmental financial statements and reports. The fund financial statements focus on individual parts of the state, reporting the state’s operations in more detail than in the government-wide statements. Fundfinancial statements focus on the most significant funds within the state.
The state’s funds are divided into three categories:
Governmental Funds
Governmental funds record most of the basic services provided by the state and account for essentiallythe same functions as reported in the governmental activities in the government-wide financialstatements. Unlike the government-wide financial statements, the fund financial statements focus on how
money flows in and out of the funds during a fiscal year and spendable resources available at the end of the fiscal year.
Governmental funds are accounted for using the modified accrual basis of accounting, which recognizesrevenues when they are available and measurable. Expenditures are generally recognized in theaccounting period when the fund liability is incurred, if measurable. This approach is known as the flow of current financial resources measurement focus. These statements provide a detailed short-term view of the state’s finances that assists in determining whether there are more or less resources available andwhether these financial resources will be adequate to meet the current needs of the state. Governmentalfunds include the General, special revenue, capital project, Debt Service, and Permanent funds.
The focus of governmental funds is narrower than that of the government-wide financial statements. It isuseful to compare the information presented for governmental funds with similar information presented for
governmental activities in the government-wide financial statements. By comparing this financialinformation, readers may better understand the long-term impact of the state’s short-term financingdecisions.
The basic financial statements include a reconciliation of governmental funds to governmental activities.These reconciliations follow the governmental funds balance sheet and the governmental fundsstatement of revenues, expenditures, and changes in fund balances.
The state maintained 29 individual governmental funds. However, six of these funds were either movedto the General Fund or combined into another fund and one fund was split and a portion of the activitywas moved to the General Fund as a result of implementing Governmental Accounting Standards Board
7
8/6/2019 2010 CAFR Minnesota
http://slidepdf.com/reader/full/2010-cafr-minnesota 24/265
(GASB) Statement No. 54, “Fund Balance Reporting and Governmental Fund Type Definitions.” Information is presented separately in the governmental funds balance sheet and in the governmentalfunds statement of revenues, expenditures, and changes in fund balances for the General and Federalfunds, which are reported as major funds. Information from the remaining funds is combined into asingle, aggregated column. Individual fund data for each of these nonmajor governmental funds isprovided in the form of combining statements included in this report.
The state adopts a biennial budget with annual appropriations for the majority of the activity reported inthe General Fund. A budgetary comparison statement has been provided for the General Fund activitywith appropriations included in the biennial budget to demonstrate compliance with this budget.
Proprietary Funds
When the state charges customers for the services it provides, whether to outside customers or to other agencies within the state, these services are generally reported in proprietary funds. Proprietary funds(enterprise and internal service) utilize accrual accounting which is the same method used by private-sector businesses. Proprietary fund financial statements provide the same type of information as thegovernment-wide financial statements, only in more detail.
Enterprise funds, a type of proprietary fund, are used to report activities that provide goods and services
to outside (non-government) customers, including the general public. Internal service funds are anaccounting device used to accumulate and allocate costs internally for goods and services provided byone program of the state to another. Because the activities reported by internal service fundspredominantly benefit governmental functions rather than business-type functions, the internal servicefunds have been included within governmental activities in the government-wide financial statements.
The state maintains 17 individual proprietary funds. The State Colleges and Universities andUnemployment Insurance funds, both of which are considered major funds, are presented separately inthe proprietary funds statement of net assets and in the proprietary funds statement of revenues, expenses, and changes in net assets . Information from the 8 nonmajor enterprise funds and the 7internal service funds are combined into two separate aggregated columns. Individual fund data for eachof these nonmajor proprietary funds is provided in the form of combining statements presented in thisreport.
Fiduciary Funds
Fiduciary funds are used to report activities when the state acts as a trustee or fiduciary to hold resourcesfor the benefit of parties outside the state. The accrual basis of accounting is used for fiduciary funds andis similar to the accounting used for proprietary funds. The government-wide statements excludefiduciary fund activities and balances because these assets are restricted in purpose and cannot be usedby the state to finance its operations. The state must assure that the assets reported in fiduciary fundsare used for their intended purposes.
The state maintains 21 individual fiduciary funds. The state’s fiduciary funds are the pension trust funds,the investment trust funds (which account for the transactions, assets, liabilities, and fund equity of theexternal investment pools), and the Agency Fund (which accounts for the assets held for distribution bythe state as an agent for other governmental units, other organizations, or individuals). Individual fund
detail is included in the combining financial statements included in this report.
Component Units
Component units are legally separate organizations for which the state is financially accountable. Thegovernment-wide financial statements present information for the component units in a single column onthe statement of net assets. Also, some information on the statement of changes in net assets isaggregated for component units. The component units’ statements of net assets and statement of changes in net assets provide detail for each major component unit and aggregate the detail for nonmajor component units. Individual nonmajor component unit detail can be found in the combining financialstatements included in this report.
8
8/6/2019 2010 CAFR Minnesota
http://slidepdf.com/reader/full/2010-cafr-minnesota 25/265
Notes to the Financial Statements
The notes provide additional narrative and financial information that is essential to a full understanding of the data provided in the government-wide financial statements and the fund financial statements. Thenotes to the financial statements are located immediately following component unit financial statements.
Required Supplementary Information
The basic financial statements are followed by a section of required supplementary information thatfurther explains and supports the information in the financial statements. This section includesmaintenance data regarding certain portions of the state’s infrastructure, actuarial measures of pensionand other postemployment benefits funding progress, and public employees insurance programdevelopment information.
Other Supplementary Information
Other supplementary information includes combining financial statements for nonmajor governmental,proprietary, and fiduciary funds and nonmajor discretely presented component units. These funds areadded together by fund type and presented in single columns in the basic financial statements.
Financial Highlights
Change in Accounting Principles and Prior Period Adjustments
The state implemented GASB Statement No. 54, “Fund Balance Reporting and Governmental FundType Definitions” and GASB Statement No. 51, “Accounting and Financial Reporting for IntangibleAssets.” The fiscal year 2009 Statement of Net Assets, and Changes in Net Assets have beenrestated to reflect these changes for comparison purposes.
The state also restated fiscal year 2009 to reflect prior period adjustments related to capital assets.See Capital Asset section for further discussion.
Government-wide
The assets of the state exceeded liabilities at June 30, 2010, by $10.9 billion (presented as net assets ). Of this amount, a deficit of $2.9 billion was reported as unrestricted net assets . Unrestrictednet assets represent the amount available to the state to meet ongoing obligations to citizens andcreditors. However, many of the resources have internally imposed designations, such as statestatutory language, which limit resource use. These assets are not reported as restricted net assetsbecause the limitations are imposed internally by the state, not externally imposed by sources suchas creditors or the constitution. For discussion on the variances from prior year, see the Government-wide Financial Analysis section.
The state’s total net assets decreased by $1.2 billion (9.9 percent) during fiscal year 2010. Netassets of governmental activities decreased by $761 million (7.5 percent), while net assets of the
business-type activities showed a decrease of $439 million (22.6 percent). For discussion on thevariances from prior year, see the Government-wide Financial Analysis section.
Fund Level
At the end of the current fiscal year, governmental funds reported a combined ending fund balance of $2.8 billion, a decrease of $774 million compared to the prior year. Included in the ending fundbalance is a General Fund unassigned deficit of $1.5 billion. For discussion on the variances fromprior year, see the State Funds Financial Analysis section.
9
8/6/2019 2010 CAFR Minnesota
http://slidepdf.com/reader/full/2010-cafr-minnesota 26/265
Long-Term Debt
The state’s total long-term liabilities increased by $1.2 billion (17.5 percent) during the current fiscalyear. The increase is partially due to an increase in loans for the Unemployment Insurance Fund(enterprise fund) due to a cash advance from the U.S. Treasury for unemployment benefit payments.In addition, the state issued general obligation bonds for trunk highway projects and other variousstate purposes, revenue bonds for a statewide 911 emergency response communication system, and
Certificates of Participation for the statewide accounting and procurement system and an integratedtax system.
Government-wide Financial Analysis
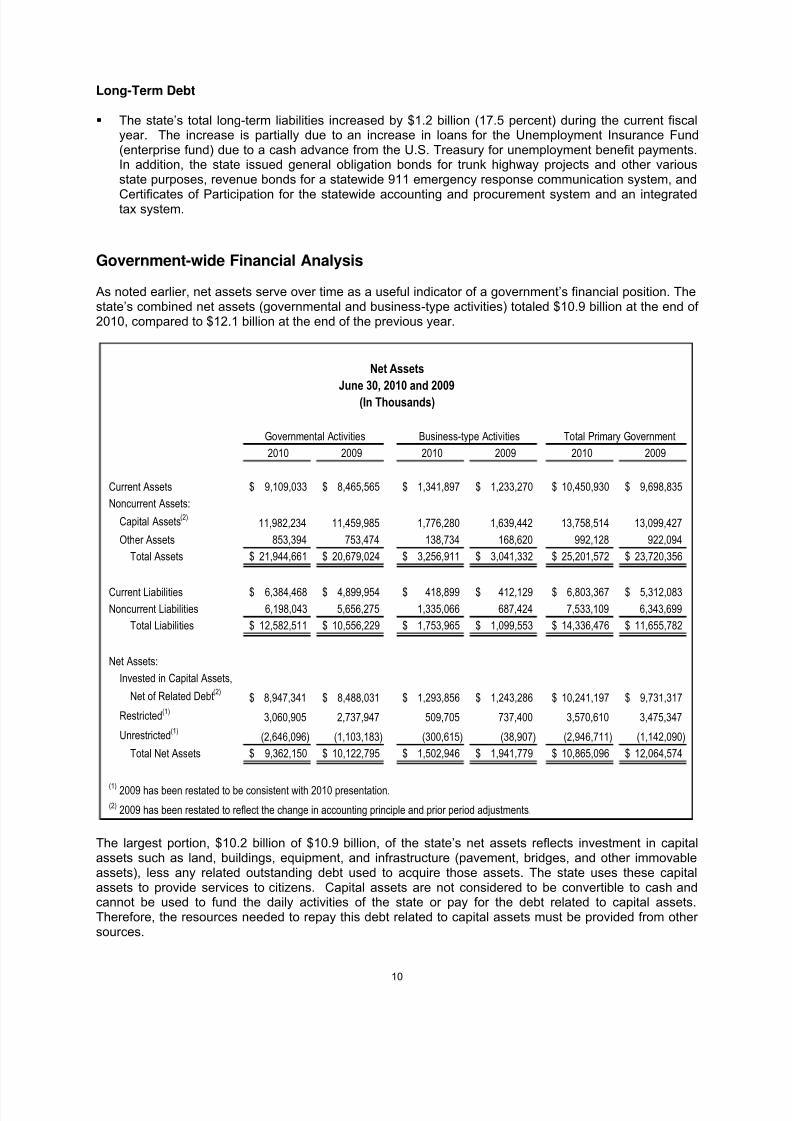
As noted earlier, net assets serve over time as a useful indicator of a government’s financial position. Thestate’s combined net assets (governmental and business-type activities) totaled $10.9 billion at the end of 2010, compared to $12.1 billion at the end of the previous year.
2010 2009 2010 2009 2010 2009
Current Assets 9,109,033$ 8,465,565$ 1,341,897$ 1,233,270$ 10,450,930$ 9,698,835$
Noncurrent Assets:
Capital Assets(2)11,982,234 11,459,985 1,776,280 1,639,442 13,758,514 13,099,427
Other Assets 853,394 753,474 138,734 168,620 992,128 922,094
Total Assets 21,944,661$ 20,679,024$ 3,256,911$ 3,041,332$ 25,201,572$ 23,720,356$
Current Liabilities 6,384,468$ 4,899,954$ 418,899$ 412,129$ 6,803,367$ 5,312,083$
Noncurrent Liabilities 6,198,043 5,656,275 1,335,066 687,424 7,533,109 6,343,699
Total Liabilities 12,582,511$ 10,556,229$ 1,753,965$ 1,099,553$ 14,336,476$ 11,655,782$
Net Assets:
Invested in Capital Assets,
Net of Related Debt(2)
8,947,341$ 8,488,031$ 1,293,856$ 1,243,286$ 10,241,197$ 9,731,317$
Restricted(1)3,060,905 2,737,947 509,705 737,400 3,570,610 3,475,347
Unrestricted(1)(2,646,096) (1,103,183) (300,615) (38,907) (2,946,711) (1,142,090)
Total Net Assets 9,362,150$ 10,122,795$ 1,502,946$ 1,941,779$ 10,865,096$ 12,064,574$
(1) 2009 has been restated to be consistent with 2010 presentation.(2) 2009 has been restated to reflect the change in accounting principle and prior period adjustments.
Net Assets
June 30, 2010 and 2009
(In Thousands)
Governmental Activities Business-type Activities Total Primary Government
The largest portion, $10.2 billion of $10.9 billion, of the state’s net assets reflects investment in capitalassets such as land, buildings, equipment, and infrastructure (pavement, bridges, and other immovableassets), less any related outstanding debt used to acquire those assets. The state uses these capitalassets to provide services to citizens. Capital assets are not considered to be convertible to cash andcannot be used to fund the daily activities of the state or pay for the debt related to capital assets.Therefore, the resources needed to repay this debt related to capital assets must be provided from other sources.
10
8/6/2019 2010 CAFR Minnesota
http://slidepdf.com/reader/full/2010-cafr-minnesota 27/265
Approximately $3.6 billion of the state’s net assets represent resources subject to external restrictions,constitutional provisions, or enabling legislation, which restricts how these assets may be used.Additional infor mation on the state’s net asset restrictions is located in Note 16 – Equity in the notes to thefinancial statements.
The remaining net assets balance represents a deficit in unrestricted net assets of $2.9 billion. Thisdeficit does not mean that the state lacks resources to pay its bills in the near future. This deficit reflects
primarily two significant factors. First, the state, similar to other states, issues general obligation bondsand distributes the proceeds to component units and local units of government. These proceeds areused to finance the purchase or construction of capital assets. These entities record the capital assets intheir statements of net assets; however, the state is responsible for the repayment of the debt. Thispractice allows the state to promote improved financial management by reducing bond issuance costsand obtaining more favorable financing arrangements. Second, the state reports the majority of thenoncapital portion of net assets for most of its governmental activities’ special revenue, debt service, andpermanent funds as restricted.
The state’s combined net assets for governmental and business -type activities decreased $1.2 billion (9.9percent) over the course of this fiscal year. This resulted from a $761 million (7.5 percent) decrease innet assets of governmental activities, and a $439 million (22.6 percent) decrease in net assets of business-type activities.
11
8/6/2019 2010 CAFR Minnesota
http://slidepdf.com/reader/full/2010-cafr-minnesota 28/265
2010 2009 2010 2009 2010 2009
Revenues:
Program Revenues:Charges for Services (1) 1,231,253$ 1,189,748$ 2,489,629$ 2,263,061$ 3,720,882$ 3,452,809$
Operating Grants and
Contributions (1) 10,164,213 7,754,986 1,958,195 953,318 12,122,408 8,708,304
Capital Grants 206,292 272,736 1,554 4,262 207,846 276,998
General Revenues:
Individual Income Taxes 6,792,510 7,203,337 - - 6,792,510 7,203,337
Corporate Income Taxes 539,534 741,049 - - 539,534 741,049
Sales Taxes 4,379,236 4,338,748 - - 4,379,236 4,338,748
Property Taxes 746,685 733,899 - - 746,685 733,899
Motor Vehicle Taxes 997,214 955,785 - - 997,214 955,785
Fuel Taxes 826,574 758,271 - - 826,574 758,271
Other Taxes 2,224,237 2,206,648 - - 2,224,237 2,206,648
Tobacco Settlement 157,924 176,140 - - 157,924 176,140 Investment/Interest Income 21,242 57,790 8,483 32,306 29,725 90,096
Other Revenues 145,608 95,316 - 630 145,608 95,946
Total Revenues 28,432,522$ 26,484,453$ 4,457,861$ 3,253,577$ 32,890,383$ 29,738,030$
Expenses:
Public Safety and Corrections 958,915$ 944,400$ -$ -$ 958,915$ 944,400$
Transportation(1) 2,468,573 2,064,729 - - 2,468,573 2,064,729
Agricultural, Environmental and
Energy Resources(1) 950,738 828,255 - - 950,738 828,255
Economic and Workforce
Development 715,085 695,314 - - 715,085 695,314
General Education 8,042,744 7,811,723 - - 8,042,744 7,811,723
Higher Education 981,859 912,011 - - 981,859 912,011
Health and Human Services 11,949,235 11,248,700 - - 11,949,235 11,248,700
General Government 762,238 800,123 - - 762,238 800,123
Intergovernmental Aid 1,558,453 1,435,897 - - 1,558,453 1,435,897
Interest 261,802 210,435 - - 261,802 210,435
State Colleges and Universities - - 1,802,527 1,743,609 1,802,527 1,743,609
Unemployment Insurance - - 3,038,557 1,865,939 3,038,557 1,865,939
Lottery - - 377,025 363,832 377,025 363,832
Other - - 222,110 209,070 222,110 209,070
Total Expenses 28,649,642$ 26,951,587$ 5,440,219$ 4,182,450$ 34,089,861$ 31,134,037$
Excess (Deficiency) Before
Transfers (217,120)$ (467,134)$ (982,358)$ (928,873)$ (1,199,478)$ (1,396,007)$
Transfers (543,525) (610,880) 543,525 610,880 - -
Change in Net Assets (760,645)$ (1,078,014)$ (438,833)$ (317,993)$ (1,199,478)$ (1,396,007)$
Net Assets, Beginning(1) 10,122,795$ 11,200,809$ 1,941,779$ 2,259,772$ 12,064,574$ 13,460,581$
Net Assets, Ending 9,362,150$ 10,122,795$ 1,502,946$ 1,941,779$ 10,865,096$ 12,064,574$
(1)2009 has been restated to be consistent with 2010 presentation.
Changes in Net Assets
Fiscal Years Ended June 30, 2010 and 2009
(In Thousands)
Governmental Activities Business-type Activities Total Primary Government
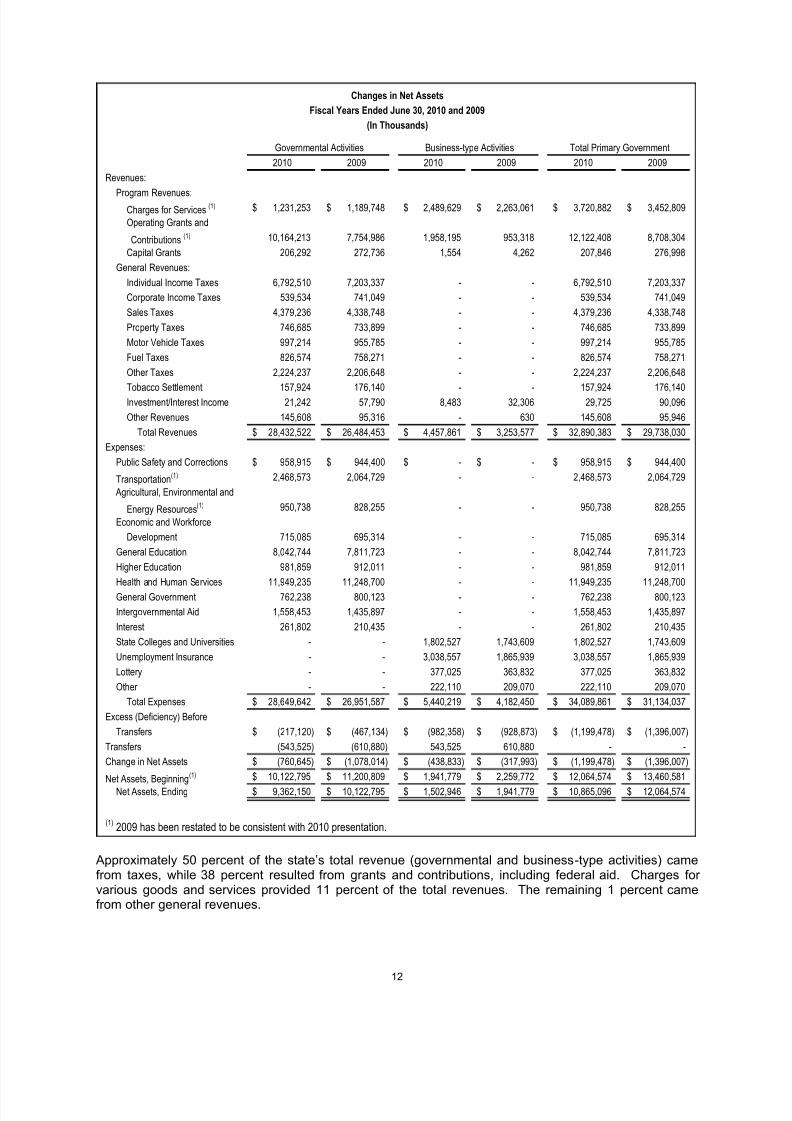
Approximately 50 percent of the state’s total revenue (governmental and business -type activities) camefrom taxes, while 38 percent resulted from grants and contributions, including federal aid. Charges for various goods and services provided 11 percent of the total revenues. The remaining 1 percent camefrom other general revenues.
12
8/6/2019 2010 CAFR Minnesota
http://slidepdf.com/reader/full/2010-cafr-minnesota 29/265
The state’s expenses cover a range of services. The largest expenses were for general education, andhealth and human services.
Governmental Activities
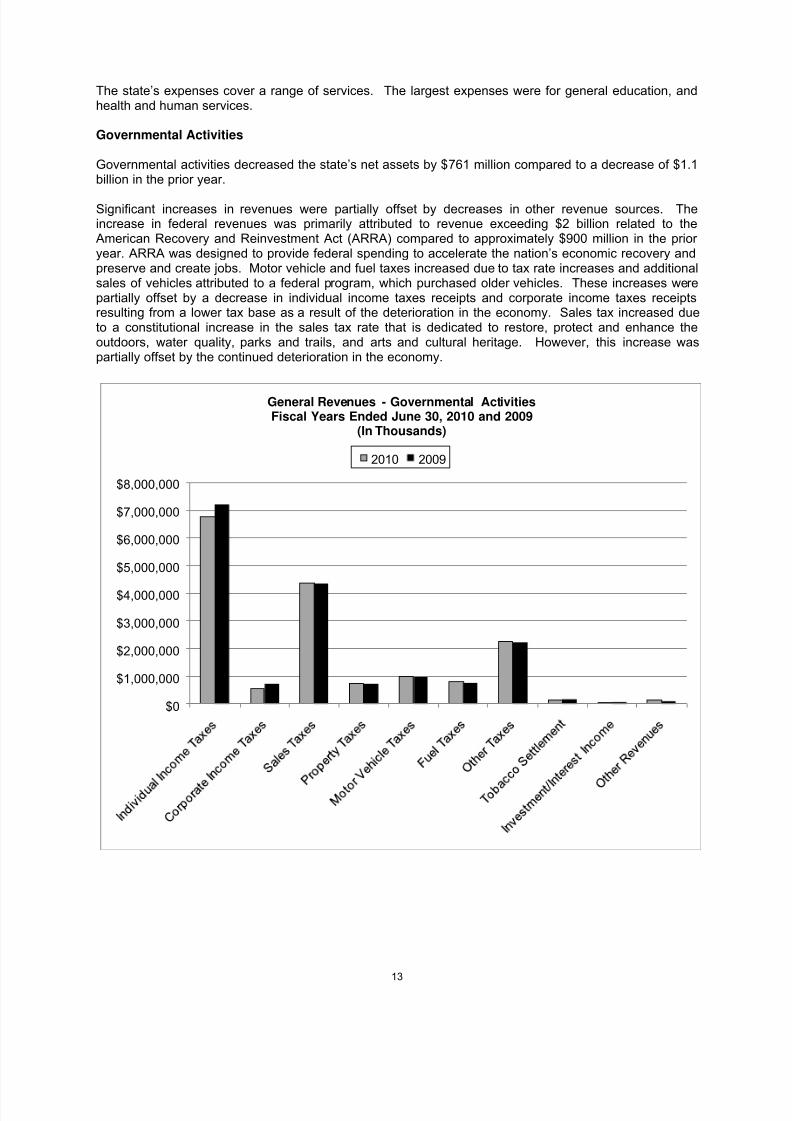
Governmental activities decreased the state’s net assets by $761 million compared to a decrease of $1.1billion in the prior year.
Significant increases in revenues were partially offset by decreases in other revenue sources. Theincrease in federal revenues was primarily attributed to revenue exceeding $2 billion related to theAmerican Recovery and Reinvestment Act (ARRA) compared to approximately $900 million in the prior year. ARRA was designed to provide federal spending to accelerate the nation’s economic recovery andpreserve and create jobs. Motor vehicle and fuel taxes increased due to tax rate increases and additionalsales of vehicles attributed to a federal program, which purchased older vehicles. These increases werepartially offset by a decrease in individual income taxes receipts and corporate income taxes receiptsresulting from a lower tax base as a result of the deterioration in the economy. Sales tax increased dueto a constitutional increase in the sales tax rate that is dedicated to restore, protect and enhance theoutdoors, water quality, parks and trails, and arts and cultural heritage. However, this increase waspartially offset by the continued deterioration in the economy.
$0
$1,000,000
$2,000,000
$3,000,000
$4,000,000
$5,000,000
$6,000,000
$7,000,000
$8,000,000
General Revenues - Governmental ActivitiesFiscal Years Ended June 30, 2010 and 2009
(In Thousands)
2010 2009
13
8/6/2019 2010 CAFR Minnesota
http://slidepdf.com/reader/full/2010-cafr-minnesota 30/265
$-
$2,000,000
$4,000,000
$6,000,000
$8,000,000
$10,000,000
$12,000,000
$14,000,000
Functional Expenses - Governmental ActivitiesFiscal Year Ended June 30, 2010 and 2009
(In Thousands)
2010 2009
(1) 2009 has been restated to be consistent with 2010 presentation.
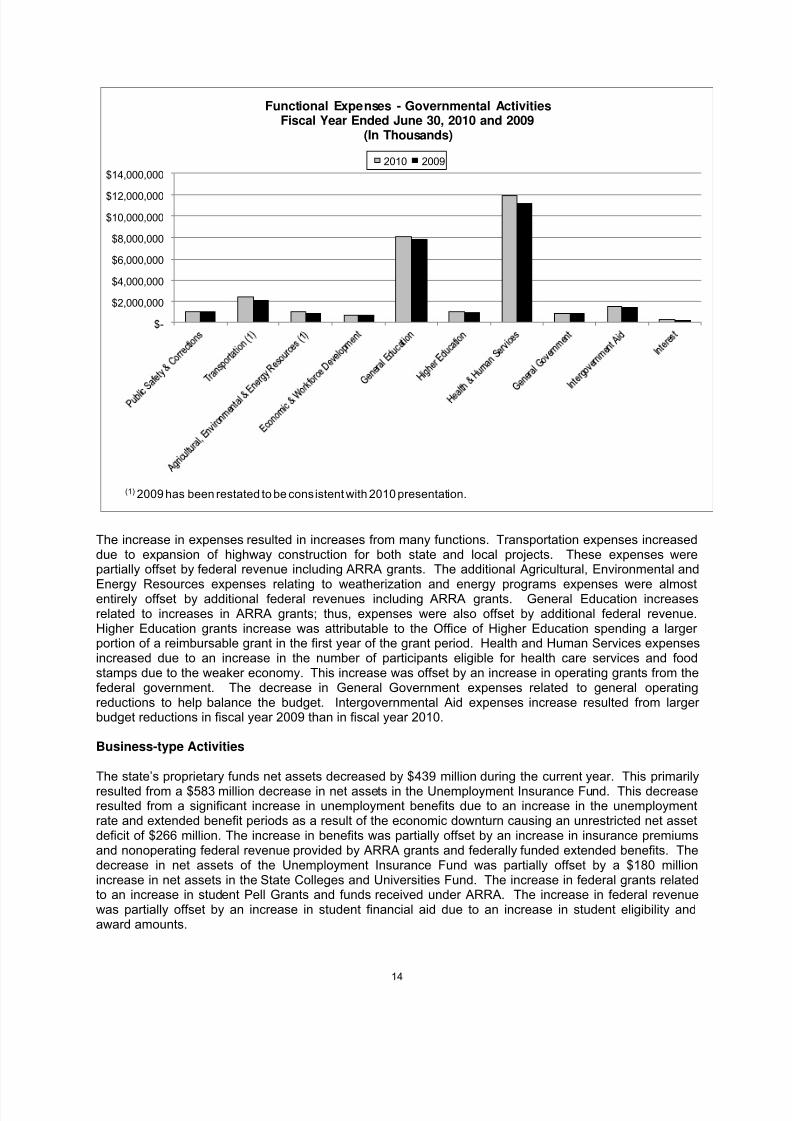
The increase in expenses resulted in increases from many functions. Transportation expenses increaseddue to expansion of highway construction for both state and local projects. These expenses werepartially offset by federal revenue including ARRA grants. The additional Agricultural, Environmental and
Energy Resources expenses relating to weatherization and energy programs expenses were almostentirely offset by additional federal revenues including ARRA grants. General Education increasesrelated to increases in ARRA grants; thus, expenses were also offset by additional federal revenue.Higher Education grants increase was attributable to the Office of Higher Education spending a larger portion of a reimbursable grant in the first year of the grant period. Health and Human Services expensesincreased due to an increase in the number of participants eligible for health care services and foodstamps due to the weaker economy. This increase was offset by an increase in operating grants from thefederal government. The decrease in General Government expenses related to general operatingreductions to help balance the budget. Intergovernmental Aid expenses increase resulted from larger budget reductions in fiscal year 2009 than in fiscal year 2010.
Business-type Activities
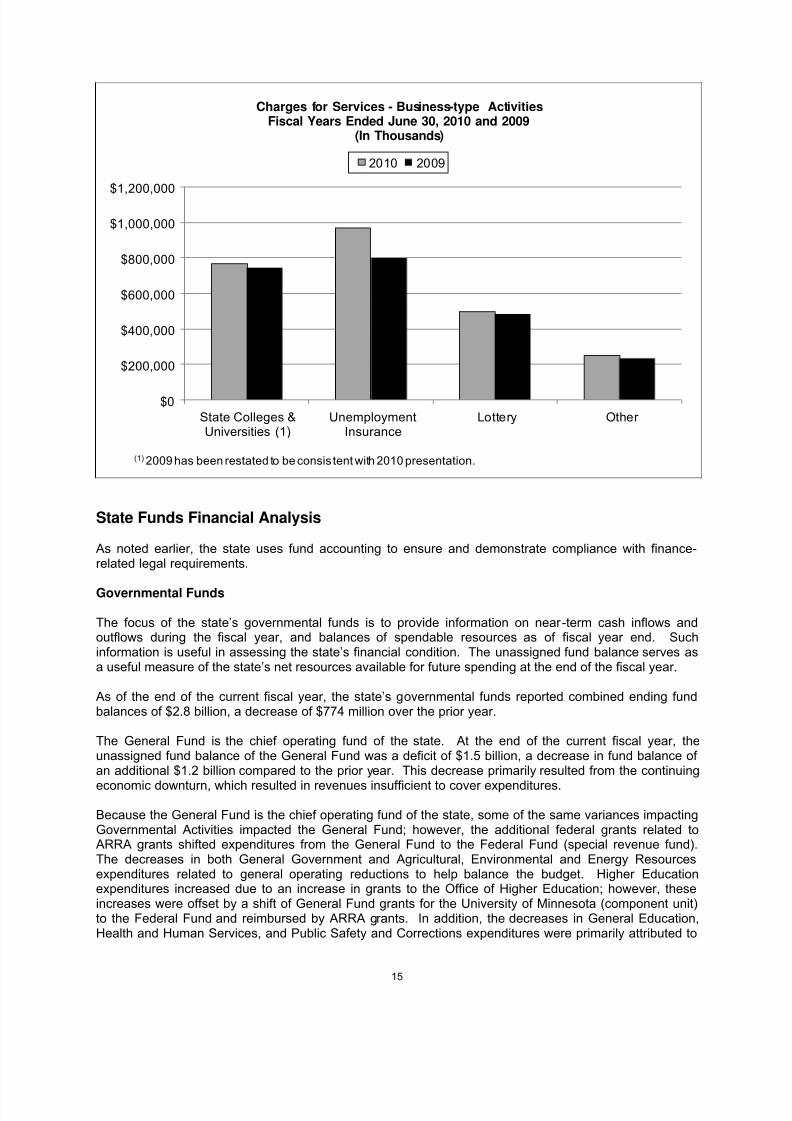
The state’s proprietary funds net assets decreased by $439 million during the current year. This primarilyresulted from a $583 million decrease in net assets in the Unemployment Insurance Fund. This decreaseresulted from a significant increase in unemployment benefits due to an increase in the unemploymentrate and extended benefit periods as a result of the economic downturn causing an unrestricted net assetdeficit of $266 million. The increase in benefits was partially offset by an increase in insurance premiumsand nonoperating federal revenue provided by ARRA grants and federally funded extended benefits. Thedecrease in net assets of the Unemployment Insurance Fund was partially offset by a $180 millionincrease in net assets in the State Colleges and Universities Fund. The increase in federal grants relatedto an increase in student Pell Grants and funds received under ARRA. The increase in federal revenuewas partially offset by an increase in student financial aid due to an increase in student eligibility andaward amounts.
14
8/6/2019 2010 CAFR Minnesota
http://slidepdf.com/reader/full/2010-cafr-minnesota 31/265
$0
$200,000
$400,000
$600,000
$800,000
$1,000,000
$1,200,000
State Colleges &Universities (1)
UnemploymentInsurance
Lottery Other
Charges for Services - Business-type ActivitiesFiscal Years Ended June 30, 2010 and 2009
(In Thousands)
2010 2009
(1) 2009 has been restated to be consis tent with 2010 presentation.
State Funds Financial Analysis
As noted earlier, the state uses fund accounting to ensure and demonstrate compliance with finance-related legal requirements.
Governmental Funds
The focus of the state’s governmental funds is to provide information on near -term cash inflows andoutflows during the fiscal year, and balances of spendable resources as of fiscal year end. Suchinformation is useful in assessing the state’s financial condition. The unassigned fund balance serves asa useful measure of the state’s net resources available for future spending at the end of the fiscal year.
As of the end of the current fiscal year, the state’s governmental funds reported combined ending fundbalances of $2.8 billion, a decrease of $774 million over the prior year.
The General Fund is the chief operating fund of the state. At the end of the current fiscal year, theunassigned fund balance of the General Fund was a deficit of $1.5 billion, a decrease in fund balance of an additional $1.2 billion compared to the prior year. This decrease primarily resulted from the continuing
economic downturn, which resulted in revenues insufficient to cover expenditures.
Because the General Fund is the chief operating fund of the state, some of the same variances impactingGovernmental Activities impacted the General Fund; however, the additional federal grants related toARRA grants shifted expenditures from the General Fund to the Federal Fund (special revenue fund).The decreases in both General Government and Agricultural, Environmental and Energy Resourcesexpenditures related to general operating reductions to help balance the budget. Higher Educationexpenditures increased due to an increase in grants to the Office of Higher Education; however, theseincreases were offset by a shift of General Fund grants for the University of Minnesota (component unit)to the Federal Fund and reimbursed by ARRA grants. In addition, the decreases in General Education,Health and Human Services, and Public Safety and Corrections expenditures were primarily attributed to
15
8/6/2019 2010 CAFR Minnesota
http://slidepdf.com/reader/full/2010-cafr-minnesota 32/265
shifts of General Fund expenditures to the Federal Fund and reimbursed by ARRA grants.Intergovernmental Aid expenditure increases resulted from larger budget reductions in fiscal year 2009than in fiscal year 2010.
Proprietary Funds
The statements for proprietary funds provide the same type of information found in the government-wide
financial statements, but in more detail.
The state’s proprietary fund’s net assets decreased by $439 million during the current year. This primarilyresulted from a $583 million decrease in net assets in the Unemployment Insurance Fund, which wasoffset by an increase of $180 million in net assets of the State Colleges and Universities Fund. For further discussion, see the Government-wide Financial Analysis – Business-type Activities section.
General Fund Budgetary Highlights
General Fund Budgetary Highlights
Several significant economic forecast and budget actions occurred prior to and during fiscal year 2010.
These are material to understanding changes in the General Fund balance that occurred in fiscal year 2010. Both the Minnesota State Constitution (Article XI, sections 5 and 6) and Minnesota Statues,Section 16A.152, require that the budget be balanced for the biennium. The following includes actionstaken by the Minnesota Legislature and the Governor affecting fiscal year 2010.
Actions Establishing the Fiscal Year 2010 Budget
The February 2009 forecast set the baseline for the development of the 2010-2011 biennial budget. Thisforecast included a projected deficit of $4.57 billion for the 2010-2011 biennium, with $2.29 billion of thatdeficit projected in fiscal year 2010. The February 2009 forecast included recognition of the recentlypassed American Recovery and Reinvestment Act (ARRA), which at that time provided $1.359 billion inrelief to the General Fund for the 2009-2011 biennium by moving additional Medicaid expenditures to theFederal Fund (special revenue fund).
The 2009 Legislature took action to close the budget gap for the 2010-2011 biennium and passed bills,which the Governor signed, narrowing the projected deficit to $2.7 billion for the biennium ($1.3 billion for 2010). This Legislative action included moving an additional $816 million in spending from the GeneralFund to the Federal Fund in recognition of the State Fiscal Stabilization Funds received through ARRAgrants in fiscal years 2009-2011. The Legislature took additional action during the legislative session,which the Governor vetoed, that would have raised additional revenues to close the remaining budgetgap. As a result, the Legislature adjourned with the $2.7 billion gap remaining for the 2010-2011biennium.
Budget Actions during Fiscal Year 2010
In July of 2009, the Governor took action through the unallotment authority in Minnesota Statute 16A.152to close the remaining budget gap for the 2010-2011 biennium. The Governor implemented K-12
payment deferrals totaling $1.7 billion, and unallotments and administrative actions totaling an additional$1 billion for a total of $2.7 billion.
At the beginning of the 2010 legislative session, the February 2010 forecast for 2010-2011 bienniumincluded a deficit of $994 million. The deficit projection was based on the legislatively enacted 2010-2011biennial budget and the Governor’s subsequent executive actions. In May 2010, the Minnesota StateSupreme Court ruled that the Governor’s use of unallotment in July 2009 exceeded the Governor’sauthority. While certain administrative actions were upheld, the unallotments were reversed and the sizeof the deficit grew from $994 million to $3.4 billion.
16
8/6/2019 2010 CAFR Minnesota
http://slidepdf.com/reader/full/2010-cafr-minnesota 33/265
At the end of the 2010 legislative session, the $3.4 billion deficit was solved largely through one-timemeans, leaving a General Fund budgetary balance of $5.6 million. Most of the Governor’s originalunallotments were adopted by the Legislature on a one-time basis. The one-time nature of the 2010-2011 biennium actions, and the scheduled repayment of K-12 shifts and payment delays in thesubsequent biennium, resulted in a projected budget shortfall in the 2012-2013 biennium of $5.8 billion.
Budget and GAAP Based Financial Outlook
Minnesota budgets and manages its financial affairs on a budgetary basis, which primarily uses a cashbasis of accounting. Revenues are recorded when received and expenditures are recorded when thepayments are made with the exception that, at year-end, encumbered amounts are included in theexpenditures of the year appropriated for budgetary reporting. GAAP requires that the modified accrualbasis of accounting be used to prepare governmental fund statements. The modified accrual basis of accounting recognizes revenues when they become both measurable and available to finance operationsof the fiscal year or liquidate liabilities existing at fiscal year end. Expenditures are recognized when aliability occurs.
On a budgetary basis, the state’s General Fund ended fiscal year 2010 with a balance of $74.6 millionand for the 2010-2011 biennium, the General Fund is balanced on a budgetary basis. However, it is likelythat the state’s General Fund will continue to show deficits on a GAAP basis over the 2010-2011biennium.
On December 2, 2010, Minnesota Management and Budget released the forecast for the 2010-2011 andthe 2012-2013 bienniums. Based on the forecast, the state’s financial outlook has remained consistentsince the end of legislative session and the General Fund is projected to end the 2010-2011 bienniumwith a surplus of $399 million. However, the 2012-2013 biennium is projecting a deficit of $6.2 billion.Both state statutes and the state constitution require a balanced budget for the biennium.
Capital Asset and Debt Administration
Capital Assets
The state’s investment in capital assets for governmental and business-type activities as of June 30,
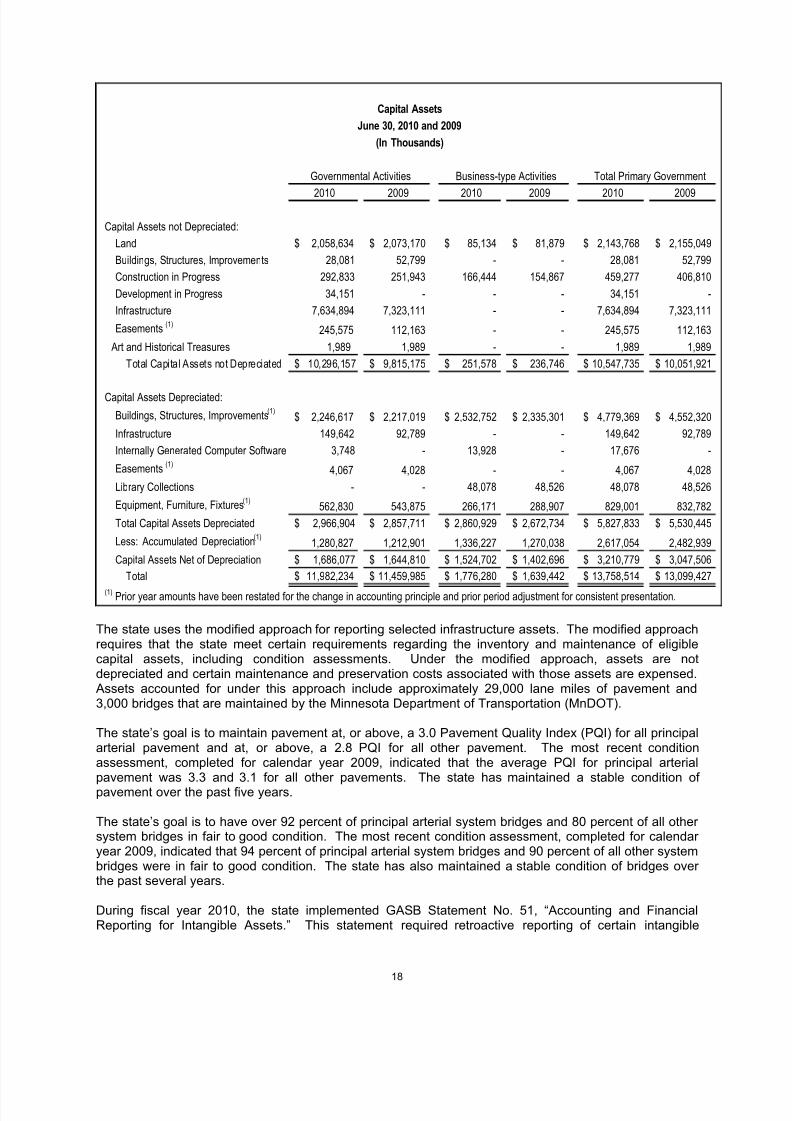
2010, was $16.4 billion, less accumulated depreciation of $2.6 billion, resulting in a net book value of $13.8 billion. This investment in capital assets includes land, buildings, construction and development inprogress, infrastructure, easements, art and historical treasures and equipment. Infrastructure assets arelong-lived capital assets, such as pavement, bridges, tunnels, drainage systems, lighting systems, andsimilar items that are normally stationary in nature.
17
8/6/2019 2010 CAFR Minnesota
http://slidepdf.com/reader/full/2010-cafr-minnesota 34/265
2010 2009 2010 2009 2010 2009
Capital Assets not Depreciated:
Land 2,058,634$ 2,073,170$ 85,134$ 81,879$ 2,143,768$ 2,155,049$
Buildings, Structures, Improvements 28,081 52,799 - - 28,081 52,799
Construction in Progress 292,833 251,943 166,444 154,867 459,277 406,810
Development in Progress 34,151 - - - 34,151 -
Infrastructure 7,634,894 7,323,111 - - 7,634,894 7,323,111
Easements (1)245,575 112,163 - - 245,575 112,163
Art and Historical Treasures 1,989 1,989 - - 1,989 1,989
Total Capital Assets not Depreciated 10,296,157$ 9,815,175$ 251,578$ 236,746$ 10,547,735$ 10,051,921$
Capital Assets Depreciated:
Buildings, Structures, Improvements(1)
2,246,617$ 2,217,019$ 2,532,752$ 2,335,301$ 4,779,369$ 4,552,320$
Infrastructure 149,642 92,789 - - 149,642 92,789
Internally Generated Computer Software 3,748 - 13,928 - 17,676 -
Easements(1)
4,067 4,028 - - 4,067 4,028
Library Collections - - 48,078 48,526 48,078 48,526
Equipment, Furniture, Fixtures(1)562,830 543,875 266,171 288,907 829,001 832,782
Total Capital Assets Depreciated 2,966,904$ 2,857,711$ 2,860,929$ 2,672,734$ 5,827,833$ 5,530,445$
Less: Accumulated Depreciation(1)
1,280,827 1,212,901 1,336,227 1,270,038 2,617,054 2,482,939
Capital Assets Net of Depreciation 1,686,077$ 1,644,810$ 1,524,702$ 1,402,696$ 3,210,779$ 3,047,506$
Total 11,982,234$ 11,459,985$ 1,776,280$ 1,639,442$ 13,758,514$ 13,099,427$
(1) Prior year amounts have been restated for the change in accounting principle and prior period adjustment for consistent presentation.
Capital Assets
June 30, 2010 and 2009
(In Thousands)
Governmental Activities Business-type Activities Total Primary Government
The state uses the modified approach for reporting selected infrastructure assets. The modified approachrequires that the state meet certain requirements regarding the inventory and maintenance of eligiblecapital assets, including condition assessments. Under the modified approach, assets are notdepreciated and certain maintenance and preservation costs associated with those assets are expensed.Assets accounted for under this approach include approximately 29,000 lane miles of pavement and3,000 bridges that are maintained by the Minnesota Department of Transportation (MnDOT).
The state’s goal is to maintain pavement at, or above, a 3.0 Pavement Quality Index (PQI) for all principalarterial pavement and at, or above, a 2.8 PQI for all other pavement. The most recent conditionassessment, completed for calendar year 2009, indicated that the average PQI for principal arterialpavement was 3.3 and 3.1 for all other pavements. The state has maintained a stable condition of pavement over the past five years.
The state’s goal is to have over 92 percent of principal arterial system bridges and 80 percent of all other system bridges in fair to good condition. The most recent condition assessment, completed for calendar year 2009, indicated that 94 percent of principal arterial system bridges and 90 percent of all other systembridges were in fair to good condition. The state has also maintained a stable condition of bridges over the past several years.
During fiscal year 2010, the state implemented GASB Statement No. 51, “Accounting and FinancialReporting for Intangible Assets.” This statement required retroactive reporting of certain intangible
18

8/6/2019 2010 CAFR Minnesota
http://slidepdf.com/reader/full/2010-cafr-minnesota 35/265
assets. As a result, the state’s beginning balances for nondepreciable easements and depreciableeasements increased by $112.2 million and $4.0 million, net of $374 thousand accumulated depreciation,respectively. This resulted in a net change in accounting principle of $115,8 million.
Prior Period Adjustment Governmental Activities: During fiscal year 2010, depreciable buildings andequipment cost increased by $74.3 million, net of $41.9 million accumulated depreciation and $126.8million, net of $72.0 million accumulated depreciation, respectively. This was primarily due to additional
capital assets identified by the Minnesota Department of Transportation partly as a result of changingcapitalization thresholds in preparation for converting capital assets into the new statewide accountingsystem. This resulted in a net prior period adjustment of $87.2 million.
Prior Period Adjustment Business-type Activities: During fiscal year 2010, building cost in the 911Services Fund (enterprise fund) increased by $49.2 million, net of $5.6 million accumulated depreciation,as a result of recording towers owned by the Minnesota Department of Transportation. This resulted in anet prior period adjustment of $43.6 million.
During the current year, the state placed additional emphasis on bridge maintenance and repair that wasnot included in the original budget. In addition, there was a shift between costs associated with newroads to a greater focus on improvements to current infrastructure compared to the amounts originallybudgeted.
Additional information on the state’s capital assets and infrastructure under the modified approach isincluded in Note 6 – Capital Assets of the notes to the financial statements and in the requiredsupplementary information, respectively.
Debt Administration
The authority of the state to incur debt is described in Article XI, Sections 5 and 7, of the state’sconstitution. General obligation bonds, issued by the state, are backed by the full faith, credit, and taxingpowers of the state.
The state’s general obligation bonds are rated as f ollows:
Aa1 by Moody’s Investors Service
AAA by Standard & Poors
AAA by Fitch Ratings
The state also issues revenue bonds, which are payable solely from rentals, revenues, and other income,and charges and monies that were pledged for repayment.
The Certificates of Participation were issued by the state to finance the statewide systems and integratedtax system.
19
8/6/2019 2010 CAFR Minnesota
http://slidepdf.com/reader/full/2010-cafr-minnesota 36/265
2010 2009 2010 2009 2010 2009
General Obligation 5,103,210$ 4,667,902$ 250,353$ 241,946$ 5,353,563$ 4,909,848$
Revenue 12,900 13,715 320,779 278,246 333,679 291,961
Certificate of Participation 80,649 - - - 80,649 -
Total 5,196,759$ 4,681,617$ 571,132$ 520,192$ 5,767,891$ 5,201,809$
Governmental Activities Business-type Activities Total Primary Government
Outstanding Bonded Debt and Unamortized Premium
June 30, 2010 and 2009
(In Thousands)
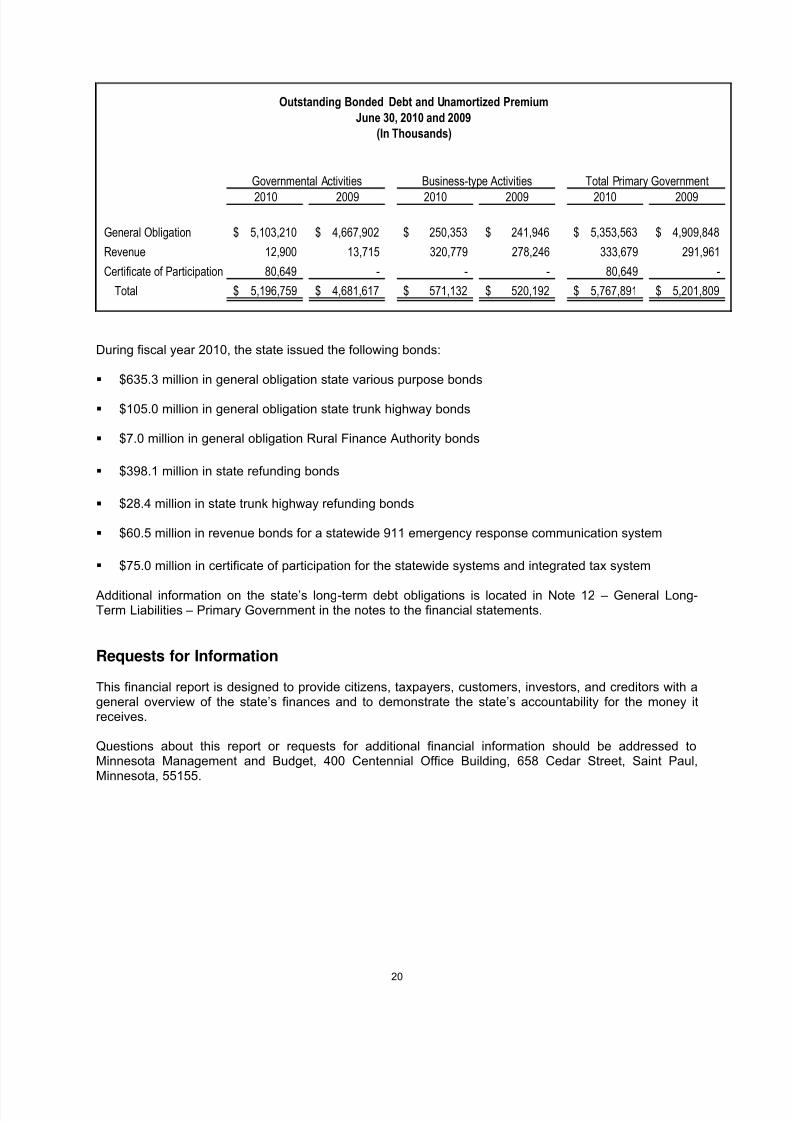
During fiscal year 2010, the state issued the following bonds:
$635.3 million in general obligation state various purpose bonds
$105.0 million in general obligation state trunk highway bonds
$7.0 million in general obligation Rural Finance Authority bonds
$398.1 million in state refunding bonds
$28.4 million in state trunk highway refunding bonds
$60.5 million in revenue bonds for a statewide 911 emergency response communication system
$75.0 million in certificate of participation for the statewide systems and integrated tax system
Additional information on the state’s long-term debt obligations is located in Note 12 – General Long-Term Liabilities – Primary Government in the notes to the financial statements.
Requests for Information
This financial report is designed to provide citizens, taxpayers, customers, investors, and creditors with ageneral overview of the state’s finances and to demonstrate the state’s accountability for the money itreceives.
Questions about this report or requests for additional financial information should be addressed toMinnesota Management and Budget, 400 Centennial Office Building, 658 Cedar Street, Saint Paul,Minnesota, 55155.
20
8/6/2019 2010 CAFR Minnesota
http://slidepdf.com/reader/full/2010-cafr-minnesota 37/265
State of Minnesota
2010
Comprehensive
Annual
Financial Report
Basic Financial Statements
21

8/6/2019 2010 CAFR Minnesota
http://slidepdf.com/reader/full/2010-cafr-minnesota 38/265
MINNESOTA
Headwaters of the mighty Mississippi
22
8/6/2019 2010 CAFR Minnesota
http://slidepdf.com/reader/full/2010-cafr-minnesota 39/265
State of Minnesota
2010
Comprehensive
Annual
Financial Report
Government-wide
Financial
Statements
23
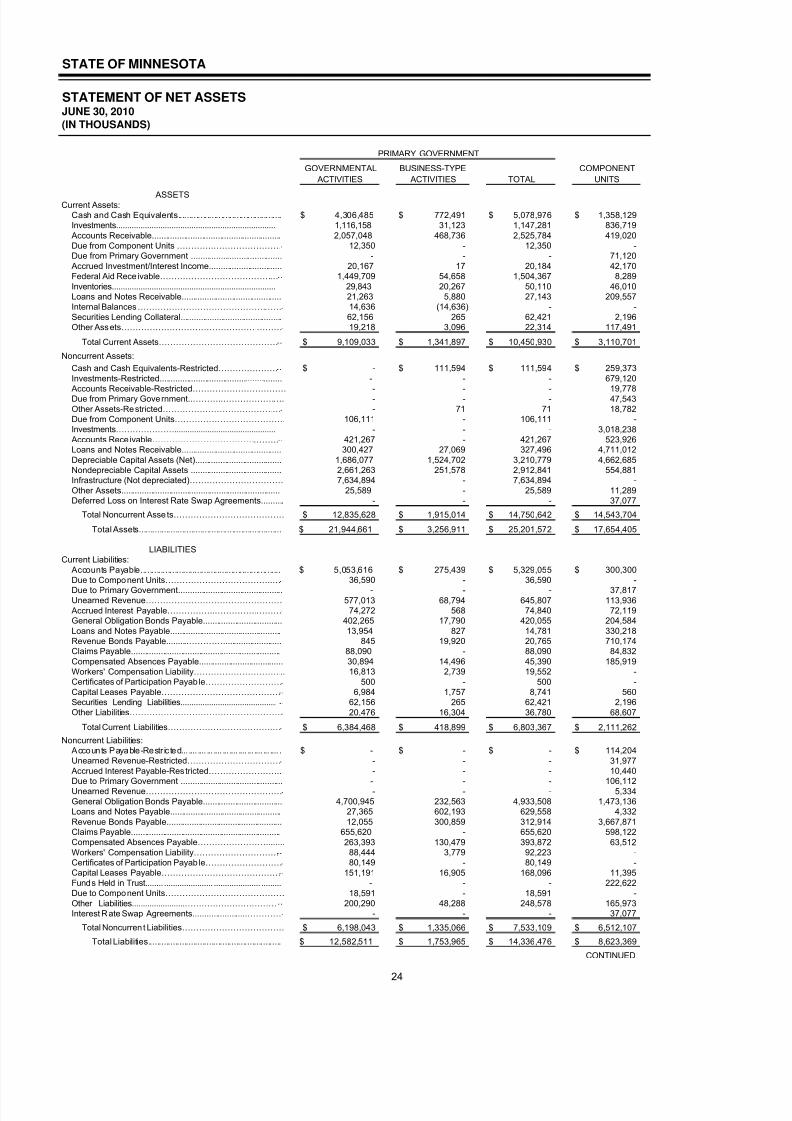
8/6/2019 2010 CAFR Minnesota
http://slidepdf.com/reader/full/2010-cafr-minnesota 40/265
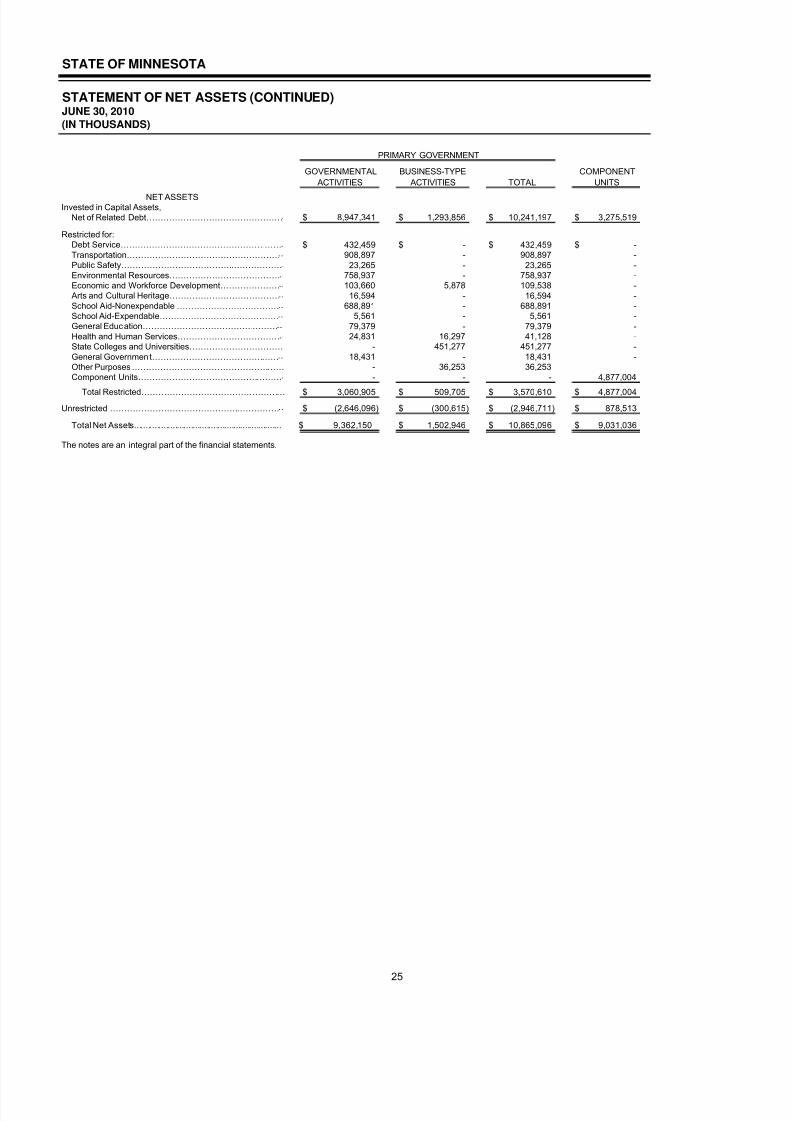
8/6/2019 2010 CAFR Minnesota
http://slidepdf.com/reader/full/2010-cafr-minnesota 41/265
STATE OF MINNESOTA
STATEMENT OF NET ASSETS (CONTINUED)JUNE 30, 2010
(IN THOUSANDS)
Invested in Capital Assets,
Net of Related Debt………………………………………… $ 8,947,341 $ 1,293,856 $ 10,241,197 $ 3,275,519
Restricted for:Debt Service………………………………………………… $ 432,459 $ - $ 432,459 $ - Transportation……………………………………………… 908,897 - 908,897 - Public Safety………………………………………………… 23,265 - 23,265 - Environmental Resources………………………………… 758,937 - 758,937 - Economic and Workforce Development………………… 103,660 5,878 109,538 - Arts and Cultural Heritage………………………………… 16,594 - 16,594 - School Aid-Nonexpendable ……………………………… 688,891 - 688,891 - School Aid-Expendable…………………………………… 5,561 - 5,561 - General Education………………………………………… 79,379 - 79,379 - Health and Human Services……………………………… 24,831 16,297 41,128 - State Colleges and Universities…………………………… - 451,277 451,277 - General Government……………………………………… 18,431 - 18,431 - Other Purposes……………………………………………… - 36,253 36,253 Component Units…………………………………………… - - - 4,877,004
Total Restricted…………………………………………… $ 3,060,905 $ 509,705 $ 3,570,610 $ 4,877,004
Unrestricted …………………………………………………… $ (2,646,096) $ (300,615) $ (2,946,711) $ 878,513
Total Net Assets................................................................. $ 9,362,150 $ 1,502,946 $ 10,865,096 $ 9,031,036
The notes are an integral part of the financial statements.
TOTAL
COMPONENT
UNITS
PRIMARY GOVERNMENT
NET ASSETS
GOVERNMENTAL
ACTIVITIES
BUSINESS-TYPE
ACTIVITIES
25
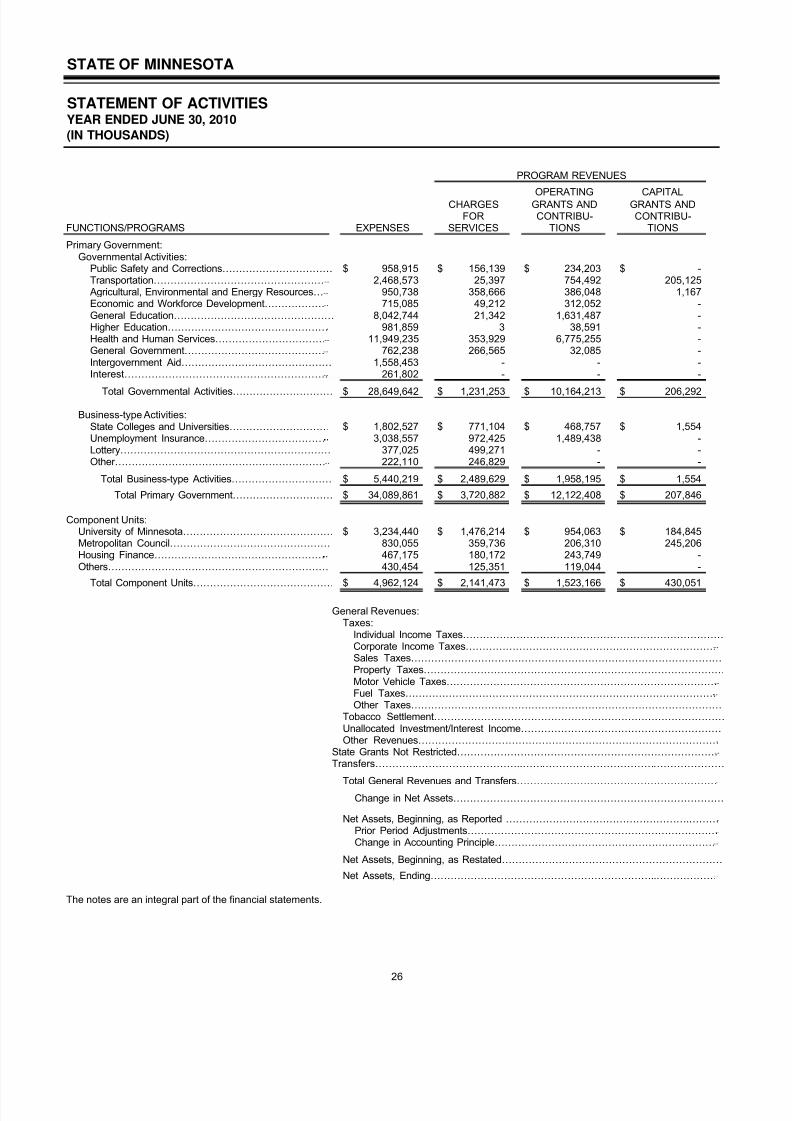
8/6/2019 2010 CAFR Minnesota
http://slidepdf.com/reader/full/2010-cafr-minnesota 42/265
STATE OF MINNESOTA
STATEMENT OF ACTIVITIESYEAR ENDED JUNE 30, 2010
(IN THOUSANDS)
FUNCTIONS/PROGRAMS
Primary Government:Governmental Activities:
Public Safety and Corrections…………………………… $ 958,915 $ 156,139 $ 234,203 $ - Transportation…………………………………………… 2,468,573 25,397 754,492 205,125 Agricultural, Environmental and Energy Resources… 950,738 358,666 386,048 1,167 Economic and Workforce Development……………… 715,085 49,212 312,052 - General Education………………………………………… 8,042,744 21,342 1,631,487 - Higher Education………………………………………… 981,859 3 38,591 - Health and Human Services…………………………… 11,949,235 353,929 6,775,255 - General Government…………………………………… 762,238 266,565 32,085 - Intergovernment Aid……………………………………… 1,558,453 - - - Interest…………………………………………………… 261,802 - - -
Total Governmental Activities………………………… $ 28,649,642 $ 1,231,253 $ 10,164,213 $ 206,292
Business-type Activities:State Colleges and Universities………………………… $ 1,802,527 $ 771,104 $ 468,757 $ 1,554 Unemployment Insurance……………………………… 3,038,557 972,425 1,489,438 - Lottery……………………………………………………… 377,025 499,271 - - Other……………………………………………………… 222,110 246,829 - -
Total Business-type Activities………………………… $ 5,440,219 $ 2,489,629 $ 1,958,195 $ 1,554
Total Primary Government………………………… $ 34,089,861 $ 3,720,882 $ 12,122,408 $ 207,846
Component Units:University of Minnesota……………………………………… $ 3,234,440 $ 1,476,214 $ 954,063 $ 184,845 Metropolitan Council………………………………………… 830,055 359,736 206,310 245,206 Housing Finance…………………………………………… 467,175 180,172 243,749 - Others………………………………………………………… 430,454 125,351 119,044 -
Total Component Units…………………………………… $ 4,962,124 $ 2,141,473 $ 1,523,166 $ 430,051
General Revenues:Taxes:
Individual Income Taxes……………………………………………………………………Corporate Income Taxes…………………………………………………………………Sales Taxes…………………………………………………………………………………Property Taxes………………………………………………………………………………Motor Vehicle Taxes………………………………………………………………………Fuel Taxes…………………………………………………………………………………Other Taxes…………………………………………………………………………………
Tobacco Settlement……………………………………………………………………………Unallocated Investment/Interest Income……………………………………………………Other Revenues………………………………………………………………………………
State Grants Not Restricted……………………………………………………………………Transfers……………………………………..……………………………………………………
Total General Revenues and Transfers……………………………………………………Change in Net Assets………………………………………………………………………
Net Assets, Beginning, as Reported ……………………………………………….………Prior Period Adjustments…………………………………………………………………Change in Accounting Principle…………………………………………………………
Net Assets, Beginning, as Restated…………………………………………………………
Net Assets, Ending…………………………………………………………..………………
The notes are an integral part of the financial statements.
CAPITAL
PROGRAM REVENUES
EXPENSES SERVICESFOR
CHARGES
TIONSCONTRIBU-
GRANTS ANDOPERATING GRANTS ANDCONTRIBU-
TIONS
26
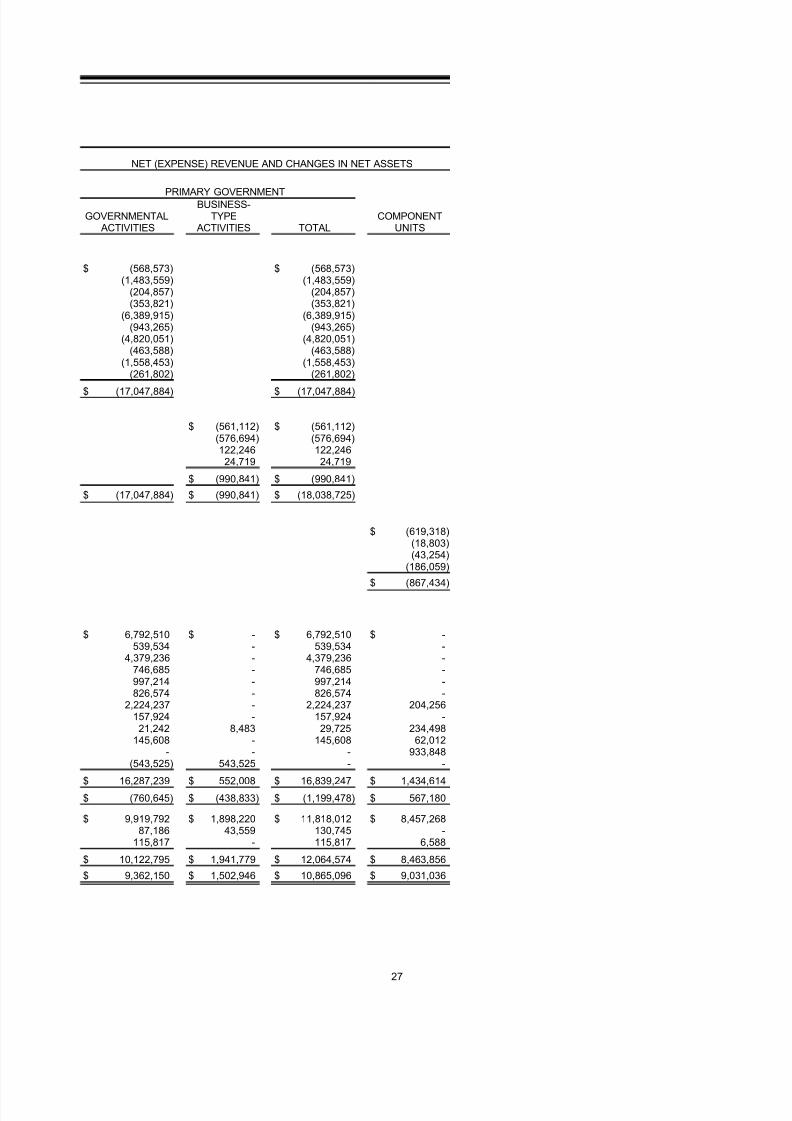
8/6/2019 2010 CAFR Minnesota
http://slidepdf.com/reader/full/2010-cafr-minnesota 43/265
$ (568,573) $ (568,573) (1,483,559) (1,483,559)
(204,857) (204,857) (353,821) (353,821)
(6,389,915) (6,389,915) (943,265) (943,265)
(4,820,051) (4,820,051) (463,588) (463,588)
(1,558,453) (1,558,453) (261,802) (261,802)
$ (17,047,884) $ (17,047,884)
$ (561,112) $ (561,112) (576,694) (576,694) 122,246 122,246 24,719 24,719
$ (990,841) $ (990,841)
$ (17,047,884) $ (990,841) $ (18,038,725)
$ (619,318) (18,803) (43,254)
(186,059)
$ (867,434)
$ 6,792,510 $ - $ 6,792,510 $ - 539,534 - 539,534 -
4,379,236 - 4,379,236 - 746,685 - 746,685 - 997,214 - 997,214 - 826,574 - 826,574 -
2,224,237 - 2,224,237 204,256 157,924 - 157,924 - 21,242 8,483 29,725 234,498
145,608 - 145,608 62,012 - - - 933,848
(543,525) 543,525 - -
$ 16,287,239 $ 552,008 $ 16,839,247 $ 1,434,614 $ (760,645) $ (438,833) $ (1,199,478) $ 567,180
$ 9,919,792 $ 1,898,220 $ 11,818,012 $ 8,457,268 87,186 43,559 130,745 -
115,817 - 115,817 6,588
$ 10,122,795 $ 1,941,779 $ 12,064,574 $ 8,463,856
$ 9,362,150 $ 1,502,946 $ 10,865,096 $ 9,031,036
NET (EXPENSE) REVENUE AND CHANGES IN NET ASSETS
GOVERNMENTALACTIVITIES
COMPONENTUNITSACTIVITIES
PRIMARY GOVERNMENTBUSINESS-TYPE
TOTAL
27

8/6/2019 2010 CAFR Minnesota
http://slidepdf.com/reader/full/2010-cafr-minnesota 44/265
MINNESOTA
Headwaters of the mighty Mississippi
28
8/6/2019 2010 CAFR Minnesota
http://slidepdf.com/reader/full/2010-cafr-minnesota 45/265
State of Minnesota
2010
Comprehensive
Annual
Financial Report
Fund Financial
Statements
29

8/6/2019 2010 CAFR Minnesota
http://slidepdf.com/reader/full/2010-cafr-minnesota 46/265
MINNESOTA
Headwaters of the mighty Mississippi
30
8/6/2019 2010 CAFR Minnesota
http://slidepdf.com/reader/full/2010-cafr-minnesota 47/265
State of Minnesota
2010
Comprehensive
Annual
Financial Report
Major
Governmental
Funds
General Fund
The fund accounts for all financial resources except those requiredto be accounted for in another fund.
Federal Fund
The fund receives and disburses federal government grants andreimbursements. The fund is administered in accordance with grant
agreements between the state and federal agencies.
31
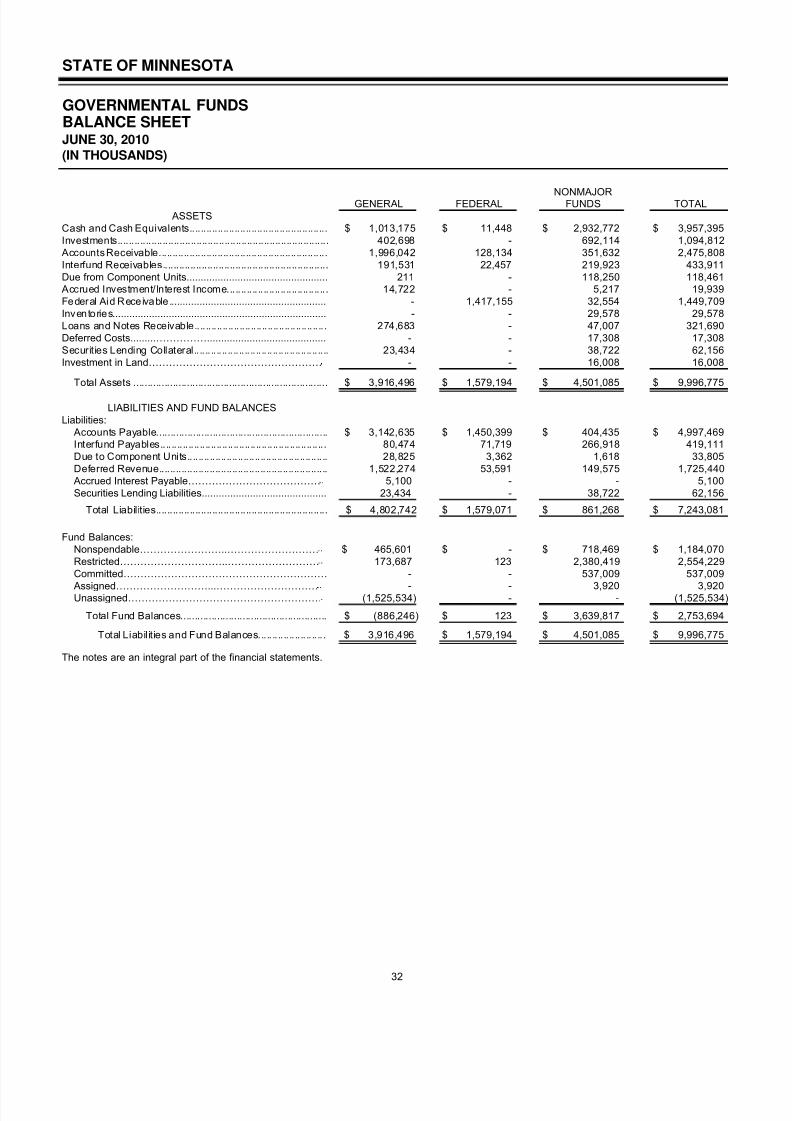
8/6/2019 2010 CAFR Minnesota
http://slidepdf.com/reader/full/2010-cafr-minnesota 48/265
STATE OF MINNESOTA
GOVERNMENTAL FUNDSBALANCE SHEETJUNE 30, 2010
(IN THOUSANDS)
ASSETSCash and Cash Equivalents................................................. $ 1,013,175 $ 11,448 $ 2,932,772 $ 3,957,395 Investments........................................................................... 402,698 - 692,114 1,094,812 Accounts Receivable............................................................ 1,996,042 128,134 351,632 2,475,808 Interfund Receivables........................................................... 191,531 22,457 219,923 433,911 Due from Component Units.................................................. 211 - 118,250 118,461 Accrued Investment/Interest Income.................................... 14,722 - 5,217 19,939 Federal Aid Receivable........................................................ - 1,417,155 32,554 1,449,709 Inventories............................................................................ - - 29,578 29,578 Loans and Notes Receivable............................................... 274,683 - 47,007 321,690 Deferred Costs.........…………….......................................... - - 17,308 17,308 Securities Lending Collateral................................................ 23,434 - 38,722 62,156 Investment in Land…………………………………………… - - 16,008 16,008
Total Assets ..................................................................... $ 3,916,496 $ 1,579,194 $ 4,501,085 $ 9,996,775
LIABILITIES AND FUND BALANCESLiabilities:
Accounts Payable............................................................. $ 3,142,635 $ 1,450,399 $ 404,435 $ 4,997,469 Interfund Payables........................................................... 80,474 71,719 266,918 419,111 Due to Component Units.................................................. 28,825 3,362 1,618 33,805 Deferred Revenue............................................................ 1,522,274 53,591 149,575 1,725,440 Accrued Interest Payable………………………………… 5,100 - - 5,100 Securities Lending Liabilities............................................ 23,434 - 38,722 62,156
Total Liabilities............................................................. $ 4,802,742 $ 1,579,071 $ 861,268 $ 7,243,081
Fund Balances:Nonspendable……………………..……………………… $ 465,601 $ - $ 718,469 $ 1,184,070 Restricted…………………………..……………………… 173,687 123 2,380,419 2,554,229 Committed…………………………………………………… - - 537,009 537,009
Assigned………………………...………………………… - - 3,920 3,920 Unassigned………………………………………………… (1,525,534) - - (1,525,534)
Total Fund Balances.................................................... $ (886,246) $ 123 $ 3,639,817 $ 2,753,694
Total Liabilities and Fund Balances........................ $ 3,916,496 $ 1,579,194 $ 4,501,085 $ 9,996,775
The notes are an integral part of the financial statements.
FEDERAL NONMAJOR TOTALGENERAL FUNDS
32
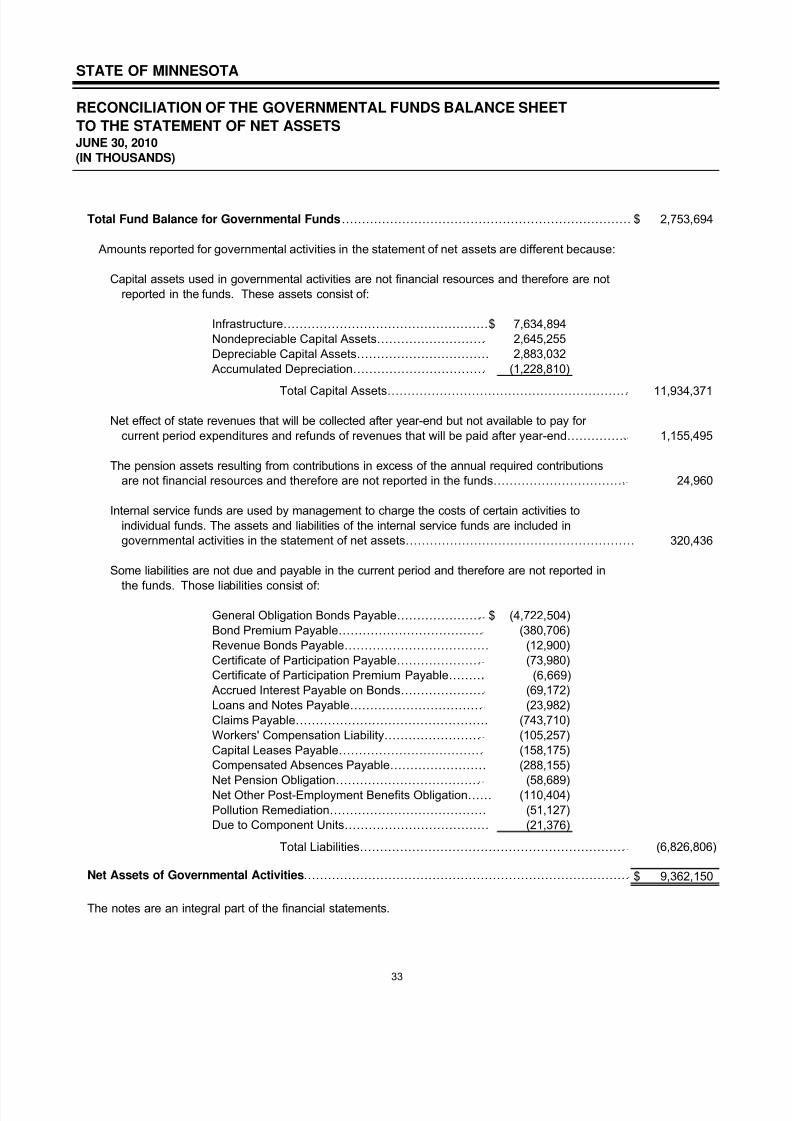
8/6/2019 2010 CAFR Minnesota
http://slidepdf.com/reader/full/2010-cafr-minnesota 49/265
STATE OF MINNESOTA
RECONCILIATION OF THE GOVERNMENTAL FUNDS BALANCE SHEET
TO THE STATEMENT OF NET ASSETSJUNE 30, 2010
(IN THOUSANDS)
Total Fund Balance for Governmental Funds……………………………………………………………… $ 2,753,694
Amounts reported for governmental activities in the statement of net assets are different because:
Capital assets used in governmental activities are not financial resources and therefore are notreported in the funds. These assets consist of:
Infrastructure……………………………………………$ 7,634,894 Nondepreciable Capital Assets……………………… 2,645,255 Depreciable Capital Assets…………………………… 2,883,032 Accumulated Depreciation…………………………… (1,228,810)
Total Capital Assets…………………………………………………… 11,934,371
Net effect of state revenues that will be collected after year-end but not available to pay for current period expenditures and refunds of revenues that will be paid after year-end…………… 1,155,495
The pension assets resulting from contributions in excess of the annual required contributionsare not financial resources and therefore are not reported in the funds…………………………… 24,960
Internal service funds are used by management to charge the costs of certain activities toindividual funds. The assets and liabilities of the internal service funds are included ingovernmental activities in the statement of net assets………………………………………………… 320,436
Some liabilities are not due and payable in the current period and therefore are not reported in
the funds. Those liabilities consist of:
General Obligation Bonds Payable………………… $ (4,722,504) Bond Premium Payable……………………………… (380,706) Revenue Bonds Payable……………………………… (12,900) Certificate of Participation Payable………………… (73,980) Certificate of Participation Premium Payable……… (6,669) Accrued Interest Payable on Bonds………………… (69,172) Loans and Notes Payable…………………………… (23,982) Claims Payable………………………………………… (743,710) Workers' Compensation Liability…………………… (105,257) Capital Leases Payable……………………………… (158,175) Compensated Absences Payable…………………… (288,155)
Net Pension Obligation……………………………… (58,689) Net Other Post-Employment Benefits Obligation…… (110,404) Pollution Remediation………………………………… (51,127) Due to Component Units……………………………… (21,376)
Total Liabilities………………………………………………………… (6,826,806)
Net Assets of Governmental Activities……………………………………………………………………… $ 9,362,150
The notes are an integral part of the financial statements.
33
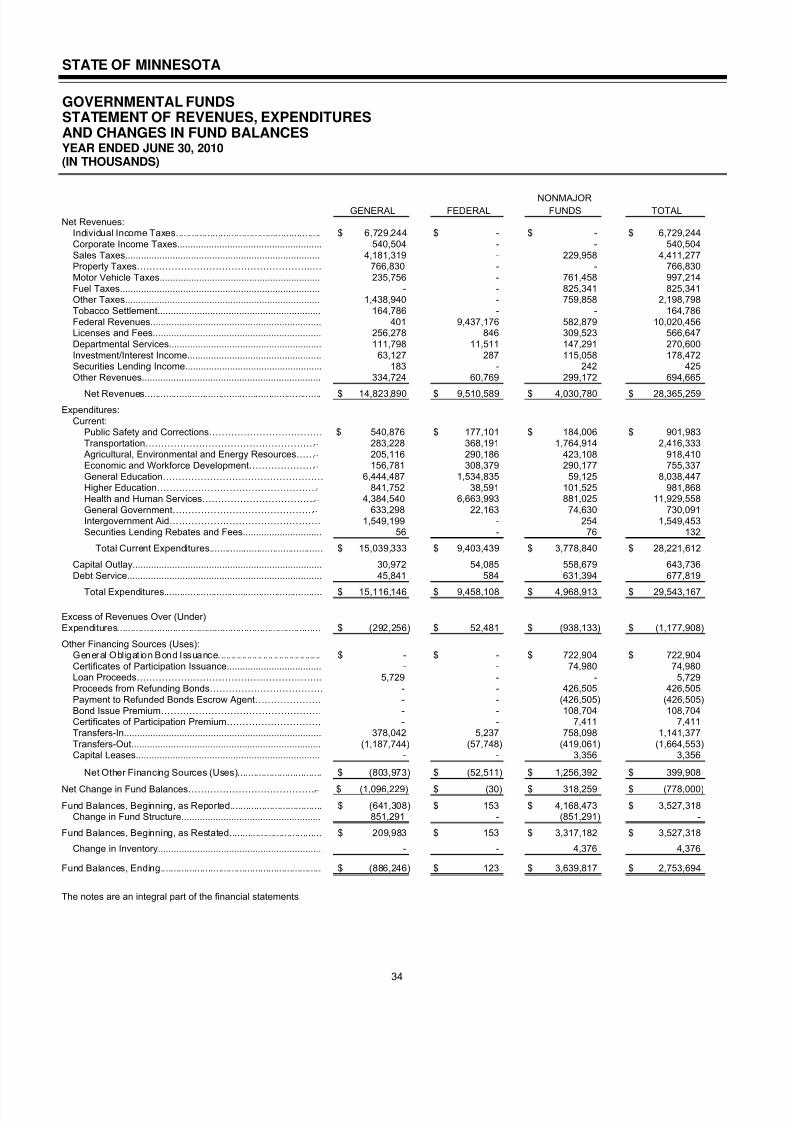
8/6/2019 2010 CAFR Minnesota
http://slidepdf.com/reader/full/2010-cafr-minnesota 50/265
STATE OF MINNESOTA
GOVERNMENTAL FUNDSSTATEMENT OF REVENUES, EXPENDITURESAND CHANGES IN FUND BALANCESYEAR ENDED JUNE 30, 2010(IN THOUSANDS)
Net Revenues:Individual Income Taxes....................................................... $ 6,729,244 $ - $ - $ 6,729,244 Corporate Income Taxes....................................................... 540,504 - - 540,504 Sales Taxes.......................................................................... 4,181,319 - 229,958 4,411,277 Property Taxes………………………………………………..… 766,830 - - 766,830 Motor Vehicle Taxes............................................................. 235,756 - 761,458 997,214 Fuel Taxes............................................................................ - - 825,341 825,341 Other Taxes.......................................................................... 1,438,940 - 759,858 2,198,798 Tobacco Settlement.............................................................. 164,786 - - 164,786 Federal Revenues................................................................. 401 9,437,176 582,879 10,020,456 Licenses and Fees................................................................ 256,278 846 309,523 566,647 Departmental Services.......................................................... 111,798 11,511 147,291 270,600 Investment/Interest Income................................................... 63,127 287 115,058 178,472 Securities Lending Income.................................................... 183 - 242 425 Other Revenues.................................................................... 334,724 60,769 299,172 694,665
Net Revenues................................................................... $ 14,823,890 $ 9,510,589 $ 4,030,780 $ 28,365,259
Expenditures:Current:
Public Safety and Corrections……………………………… $ 540,876 $ 177,101 $ 184,006 $ 901,983 Transportation……………………………………………… 283,228 368,191 1,764,914 2,416,333 Agricultural, Environmental and Energy Resources…… 205,116 290,186 423,108 918,410 Economic and Workforce Development………………… 156,781 308,379 290,177 755,337 General Education…………………………………………… 6,444,487 1,534,835 59,125 8,038,447 Higher Education…………………………………………… 841,752 38,591 101,525 981,868 Health and Human Services……………………………… 4,384,540 6,663,993 881,025 11,929,558 General Government……………………………………… 633,298 22,163 74,630 730,091 Intergovernment Aid………………………………………… 1,549,199 - 254 1,549,453 Securities Lending Rebates and Fees.............................. 56 - 76 132
Total Current Expenditures........................................... $ 15,039,333 $ 9,403,439 $ 3,778,840 $ 28,221,612
Capital Outlay........................................................................ 30,972 54,085 558,679 643,736 Debt Service.......................................................................... 45,841 584 631,394 677,819
Total Expenditures............................................................ $ 15,116,146 $ 9,458,108 $ 4,968,913 $ 29,543,167
Excess of Revenues Over (Under)Expenditures............................................................................. $ (292,256) $ 52,481 $ (938,133) $ (1,177,908)
Other Financing Sources (Uses):General Obligation Bond Issuance... .. .. .. .. .. .. .. .. .. .. .. .. .. .. .. .. .. .. $ - $ - $ 722,904 $ 722,904 Certificates of Participation Issuance.................................... - - 74,980 74,980 Loan Proceeds………………………………………………….. 5,729 - - 5,729 Proceeds from Refunding Bonds……………………………… - - 426,505 426,505 Payment to Refunded Bonds Escrow Agent………………… - - (426,505) (426,505) Bond Issue Premium…………………………………………… - - 108,704 108,704 Certificates of Participation Premium………………………… - - 7,411 7,411 Transfers-In........................................................................... 378,042 5,237 758,098 1,141,377 Transfers-Out........................................................................ (1,187,744) (57,748) (419,061) (1,664,553) Capital Leases...................................................................... - - 3,356 3,356
Net Other Financing Sources (Uses)................................ $ (803,973) $ (52,511) $ 1,256,392 $ 399,908
Net Change in Fund Balances………………………………….. $ (1,096,229) $ (30) $ 318,259 $ (778,000)
Fund Balances, Beginning, as Reported................................... $ (641,308) $ 153 $ 4,168,473 $ 3,527,318 Change in Fund Structure..................................................... 851,291 - (851,291) -
Fund Balances, Beginning, as Restated................................... $ 209,983 $ 153 $ 3,317,182 $ 3,527,318
Change in Inventory.............................................................. - - 4,376 4,376
Fund Balances, Ending............................................................. $ (886,246) $ 123 $ 3,639,817 $ 2,753,694
The notes are an integral part of the financial statements.
TOTALNONMAJOR
GENERAL FEDERAL FUNDS
34
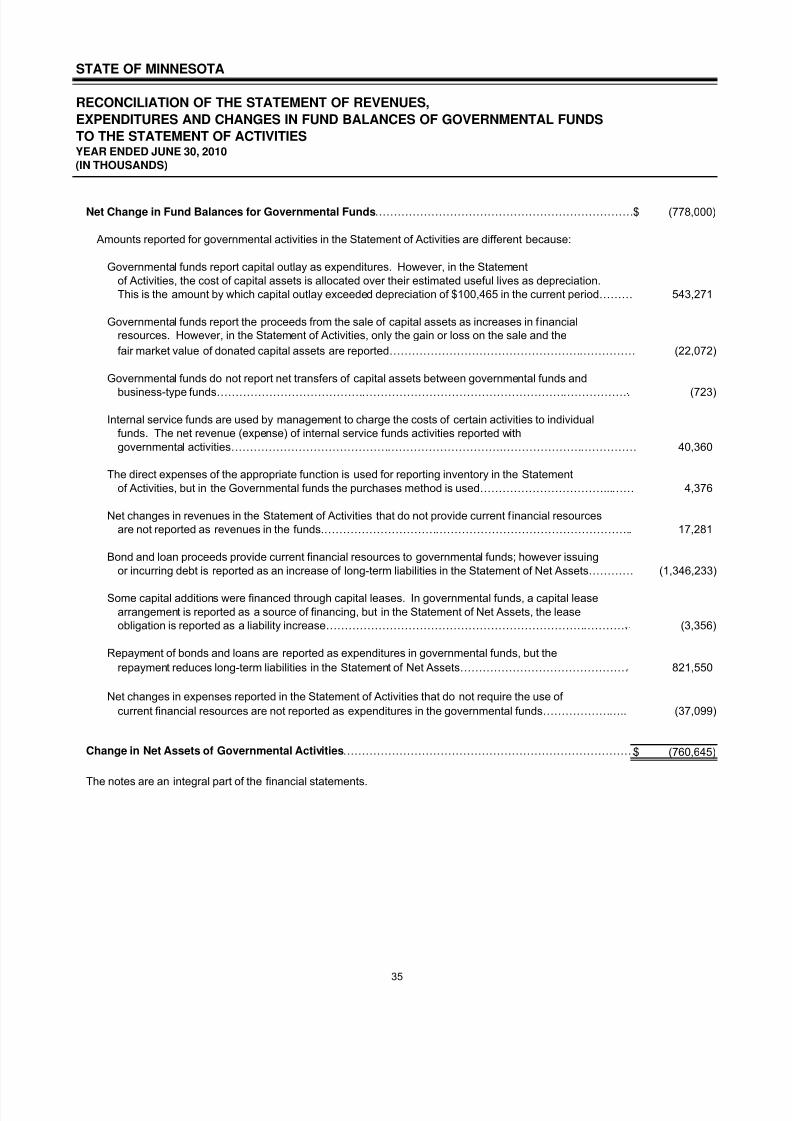
8/6/2019 2010 CAFR Minnesota
http://slidepdf.com/reader/full/2010-cafr-minnesota 51/265
STATE OF MINNESOTA
RECONCILIATION OF THE STATEMENT OF REVENUES,
EXPENDITURES AND CHANGES IN FUND BALANCES OF GOVERNMENTAL FUNDS
TO THE STATEMENT OF ACTIVITIESYEAR ENDED JUNE 30, 2010
(IN THOUSANDS)
Net Change in Fund Balances for Governmental Funds……………………………………………………………$ (778,000)
Amounts reported for governmental activities in the Statement of Activities are different because:
Governmental funds report capital outlay as expenditures. However, in the Statementof Activities, the cost of capital assets is allocated over their estimated useful lives as depreciation.This is the amount by which capital outlay exceeded depreciation of $100,465 in the current period……… 543,271
Governmental funds report the proceeds from the sale of capital assets as increases in f inancialresources. However, in the Statement of Activities, only the gain or loss on the sale and the
fair market value of donated capital assets are reported………………………………………………………… (22,072)
Governmental funds do not report net transfers of capital assets between governmental funds and
business-type funds………………………………………………………………………………………………… (723)
Internal service funds are used by management to charge the costs of certain activities to individualfunds. The net revenue (expense) of internal service funds activities reported withgovernmental activities……………………………………………………………….……………………………… 40,360
The direct expenses of the appropriate function is used for reporting inventory in the Statementof Activities, but in the Governmental funds the purchases method is used……………………………...…… 4,376
Net changes in revenues in the Statement of Activities that do not provide current f inancial resourcesare not reported as revenues in the funds.……………………………………………………………………….. 17,281
Bond and loan proceeds provide current financial resources to governmental funds; however issuing or incurring debt is reported as an increase of long-term liabilities in the Statement of Net Assets………… (1,346,233)
Some capital additions were financed through capital leases. In governmental funds, a capital leasearrangement is reported as a source of financing, but in the Statement of Net Assets, the leaseobligation is reported as a liability increase……………………………………………………………………… (3,356)
Repayment of bonds and loans are reported as expenditures in governmental funds, but the
repayment reduces long-term liabilities in the Statement of Net Assets……………………………………… 821,550
Net changes in expenses reported in the Statement of Activities that do not require the use of
current financial resources are not reported as expenditures in the governmental funds………………….. (37,099)
Change in Net Assets of Governmental Activities……………………………………………………………………$ (760,645)
The notes are an integral part of the financial statements.
35
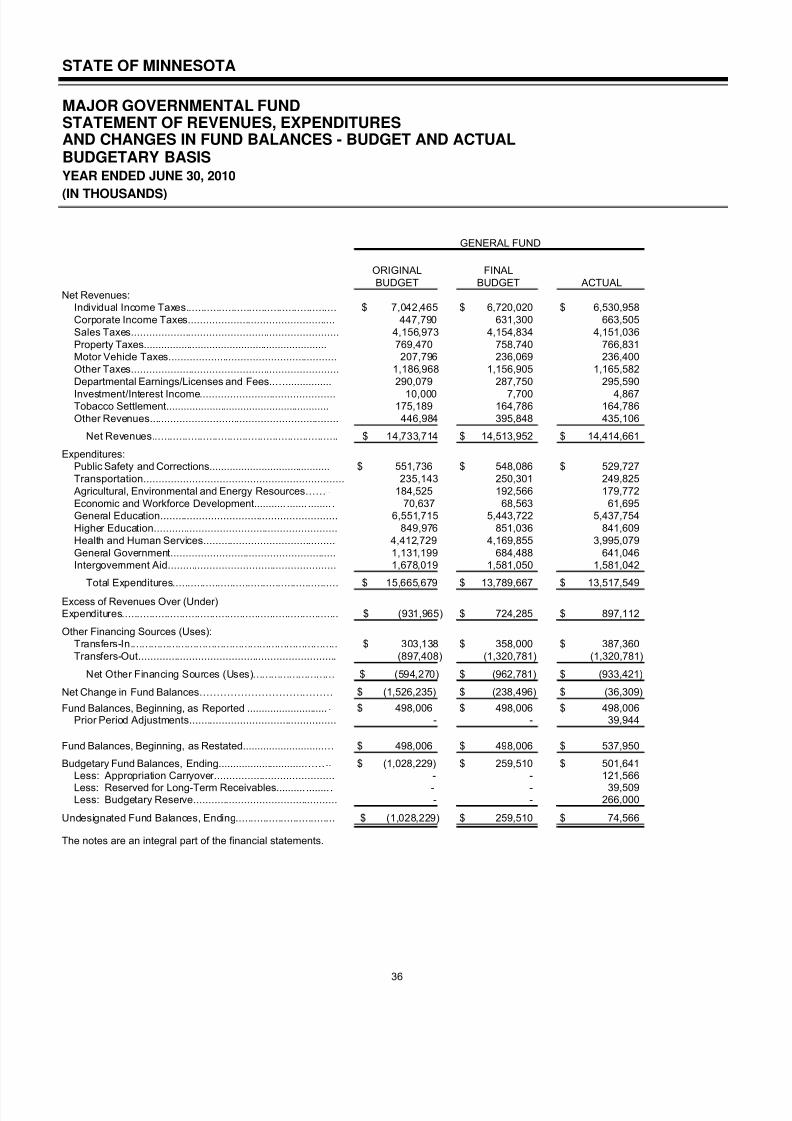
8/6/2019 2010 CAFR Minnesota
http://slidepdf.com/reader/full/2010-cafr-minnesota 52/265
STATE OF MINNESOTA
MAJOR GOVERNMENTAL FUNDSTATEMENT OF REVENUES, EXPENDITURESAND CHANGES IN FUND BALANCES - BUDGET AND ACTUALBUDGETARY BASISYEAR ENDED JUNE 30, 2010
(IN THOUSANDS)
Net Revenues:Individual Income Taxes.................................................. $ 7,042,465 $ 6,720,020 $ 6,530,958 Corporate Income Taxes................................................. 447,790 631,300 663,505 Sales Taxes..................................................................... 4,156,973 4,154,834 4,151,036 Property Taxes................................................................ 769,470 758,740 766,831 Motor Vehicle Taxes........................................................ 207,796 236,069 236,400 Other Taxes..................................................................... 1,186,968 1,156,905 1,165,582 Departmental Earnings/Licenses and Fees..…................ 290,079 287,750 295,590
Investment/Interest Income............................................. 10,000 7,700 4,867 Tobacco Settlement......................................................... 175,189 164,786 164,786 Other Revenues............................................................... 446,984 395,848 435,106
Net Revenues.............................................................. $ 14,733,714 $ 14,513,952 $ 14,414,661
Expenditures:Public Safety and Corrections.......................................... $ 551,736 $ 548,086 $ 529,727 Transportation.................................................................. 235,143 250,301 249,825 Agricultural, Environmental and Energy Resources…… 184,525 192,566 179,772 Economic and Workforce Development........... ....... ........ . 70,637 68,563 61,695 General Education........................................................... 6,551,715 5,443,722 5,437,754 Higher Education............................................................. 849,976 851,036 841,609 Health and Human Services............................................ 4,412,729 4,169,855 3,995,079 General Government....................................................... 1,131,199 684,488 641,046 Intergovernment Aid........................................................ 1,678,019 1,581,050 1,581,042
Total Expenditures....................................................... $ 15,665,679 $ 13,789,667 $ 13,517,549
Excess of Revenues Over (Under)Expenditures........................................................................ $ (931,965) $ 724,285 $ 897,112
Other Financing Sources (Uses):Transfers-In..................................................................... $ 303,138 $ 358,000 $ 387,360 Transfers-Out.................................................................. (897,408) (1,320,781) (1,320,781)
Net Other Financing Sources (Uses)........................... $ (594,270) $ (962,781) $ (933,421)
Net Change in Fund Balances………………………………… $ (1,526,235) $ (238,496) $ (36,309)
Fund Balances, Beginning, as Reported ............................ $ 498,006 $ 498,006 $ 498,006 Prior Period Adjustments................................................. - - 39,944
Fund Balances, Beginning, as Restated............................… $ 498,006 $ 498,006 $ 537,950
Budgetary Fund Balances, Ending..............................…… $ (1,028,229) $ 259,510 $ 501,641 Less: Appropriation Carryover........................................ - - 121,566
Less: Reserved for Long-Term Receivables.......... ........ . - - 39,509 Less: Budgetary Reserve................................................ - - 266,000
Undesignated Fund Balances, Ending................................. $ (1,028,229) $ 259,510 $ 74,566
The notes are an integral part of the financial statements.
GENERAL FUND
BUDGETORIGINAL FINAL
BUDGET ACTUAL
36
8/6/2019 2010 CAFR Minnesota
http://slidepdf.com/reader/full/2010-cafr-minnesota 53/265
State of Minnesota
2010
Comprehensive
Annual
Financial Report
Major
Proprietary
Funds
State Colleges and Universities Fund
The fund accounts for the activities of Minnesota State Colleges andUniversities (MnSCU). MnSCU is a system of public stateuniversities and two-year colleges and is the largest system of higher education in the state. While the primary activity of MnSCUis to provide educational services, the fund also includes
scholarships, student loans, bookstores, student living activities,research, and long-term debt.
Unemployment Insurance Fund
The fund receives unemployment taxes collected from employersand pays unemployment benefits to eligible individuals.
37
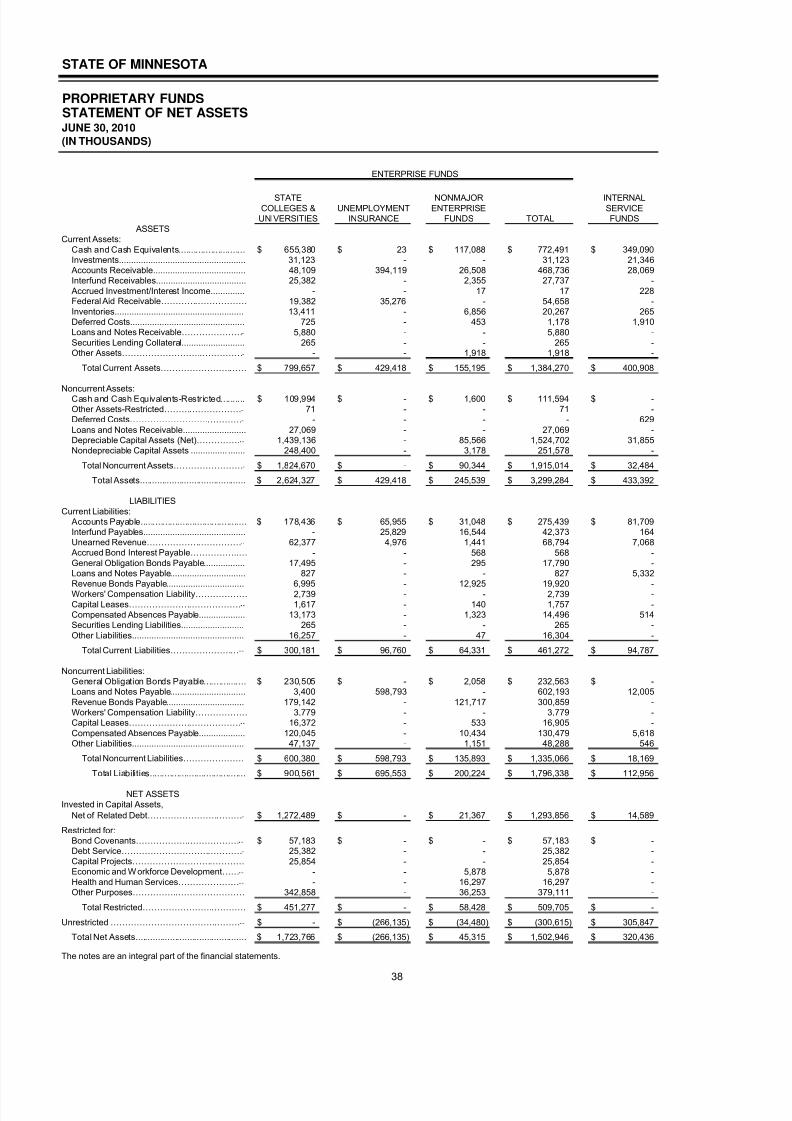
8/6/2019 2010 CAFR Minnesota
http://slidepdf.com/reader/full/2010-cafr-minnesota 54/265
STATE OF MINNESOTA
PROPRIETARY FUNDSSTATEMENT OF NET ASSETSJUNE 30, 2010
(IN THOUSANDS)
ASSETSCurrent Assets:
Cash and Cash Equivalents........................... $ 655,380 $ 23 $ 117,088 $ 772,491 $ 349,090 Investments.................................................... 31,123 - - 31,123 21,346 Accounts Receivable...................................... 48,109 394,119 26,508 468,736 28,069 Interfund Receivables..................................... 25,382 - 2,355 27,737 - Accrued Investment/Interest Income.............. - - 17 17 228 Federal Aid Receivable………………………… 19,382 35,276 - 54,658 - Inventories..................................................... 13,411 - 6,856 20,267 265 Deferred Costs............................................... 725 - 453 1,178 1,910 Loans and Notes Receivable………………… 5,880 - - 5,880 - Securities Lending Collateral.......................... 265 - - 265 - Other Assets…………………………………… - - 1,918 1,918 -
Total Current Assets………………………… $ 799,657 $ 429,418 $ 155,195 $ 1,384,270 $ 400,908
Noncurrent Assets:Cash and Cash Equivalents-Restricted.......... $ 109,994 $ - $ 1,600 $ 111,594 $ - Other Assets-Restricted……………………… 71 - - 71 - Deferred Costs………………………………… - - - - 629 Loans and Notes Receivable.......................... 27,069 - - 27,069 - Depreciable Capital Assets (Net)…………… 1,439,136 - 85,566 1,524,702 31,855 Nondepreciable Capital Assets ............... ....... 248,400 - 3,178 251,578 -
Total Noncurrent Assets…………………… $ 1,824,670 $ - $ 90,344 $ 1,915,014 $ 32,484
Total Assets........................................... $ 2,624,327 $ 429,418 $ 245,539 $ 3,299,284 $ 433,392
LIABILITIESCurrent Liabilities:
Accounts Payable........................................... $ 178,436 $ 65,955 $ 31,048 $ 275,439 $ 81,709 Interfund Payables.......................................... - 25,829 16,544 42,373 164 Unearned Revenue…………………………… 62,377 4,976 1,441 68,794 7,068 Accrued Bond Interest Payable……………..… - - 568 568 - General Obligation Bonds Payable................. 17,495 - 295 17,790 - Loans and Notes Payable............................... 827 - - 827 5,332 Revenue Bonds Payable................................ 6,995 - 12,925 19,920 - Workers' Compensation Liability……………… 2,739 - - 2,739 - Capital Leases………………………………… 1,617 - 140 1,757 - Compensated Absences Payable................... 13,173 - 1,323 14,496 514 Securities Lending Liabilities.......................... 265 - - 265 - Other Liabilities.............................................. 16,257 - 47 16,304 -
Total Current Liabilities…………………… $ 300,181 $ 96,760 $ 64,331 $ 461,272 $ 94,787
Noncurrent Liabilities:General Obligation Bonds Payable................. $ 230,505 $ - $ 2,058 $ 232,563 $ - Loans and Notes Payable............................... 3,400 598,793 - 602,193 12,005 Revenue Bonds Payable................................ 179,142 - 121,717 300,859 - Workers' Compensation Liability……………… 3,779 - - 3,779 - Capital Leases………………………………… 16,372 - 533 16,905 - Compensated Absences Payable................... 120,045 - 10,434 130,479 5,618 Other Liabilities.............................................. 47,137 - 1,151 48,288 546
Total Noncurrent Liabilities………………… $ 600,380 $ 598,793 $ 135,893 $ 1,335,066 $ 18,169
Total Liabilities....................................... $ 900,561 $ 695,553 $ 200,224 $ 1,796,338 $ 112,956
Invested in Capital Assets,
Net of Related Debt…………………………… $ 1,272,489 $ - $ 21,367 $ 1,293,856 $ 14,589
Restricted for:Bond Covenants……………………………… $ 57,183 $ - $ - $ 57,183 $ - Debt Service…………………………………… 25,382 - - 25,382 - Capital Projects………………………………… 25,854 - - 25,854 - Economic and Workforce Development…… - - 5,878 5,878 - Health and Human Services………………… - - 16,297 16,297 - Other Purposes………………………………… 342,858 - 36,253 379,111 -
Total Restricted……………………………… $ 451,277 $ - $ 58,428 $ 509,705 $ -
Unrestricted ……………………………………… $ - $ (266,135) $ (34,480) $ (300,615) $ 305,847
Total Net Assets............................................. $ 1,723,766 $ (266,135) $ 45,315 $ 1,502,946 $ 320,436
The notes are an integral part of the financial statements.
FUNDS
INTERNALSERVICECOLLEGES & UNEMPLOYMENT ENTERPRISE
TOTAL
STATE
ENTERPRISE FUNDS
NONMAJOR
NET ASSETS
UNIVERSITIES INSURANCE FUNDS
38
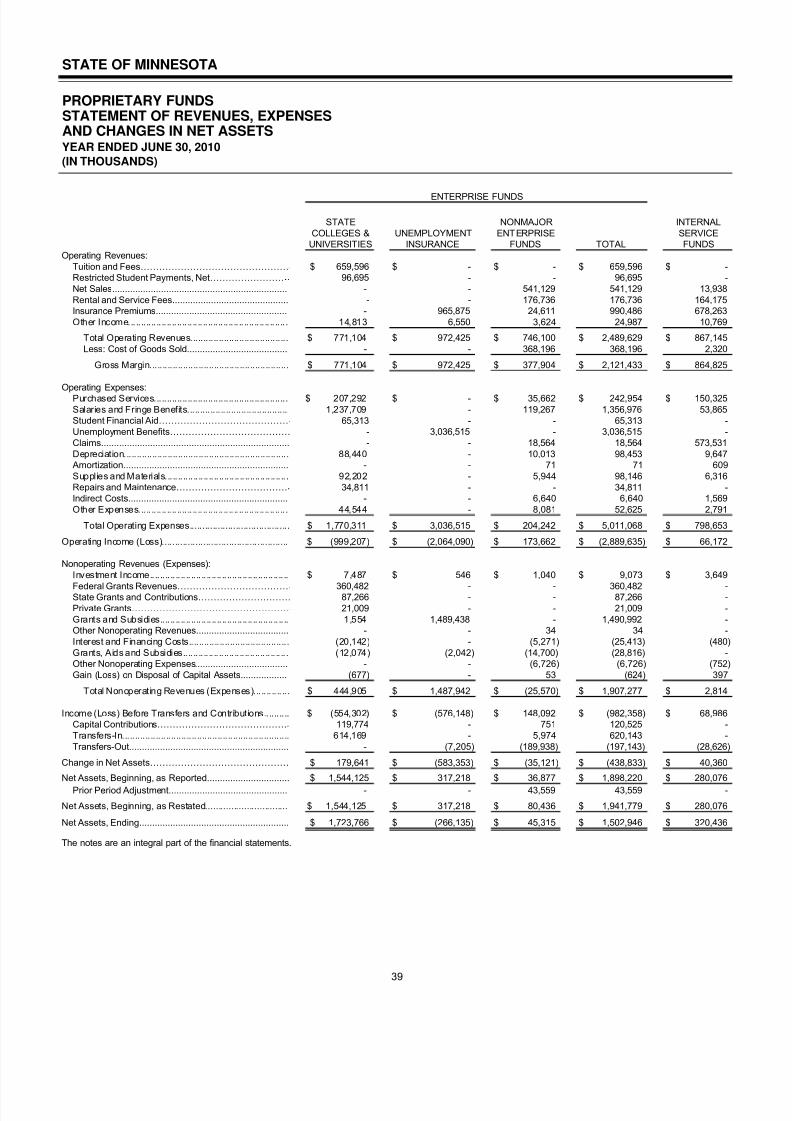
8/6/2019 2010 CAFR Minnesota
http://slidepdf.com/reader/full/2010-cafr-minnesota 55/265
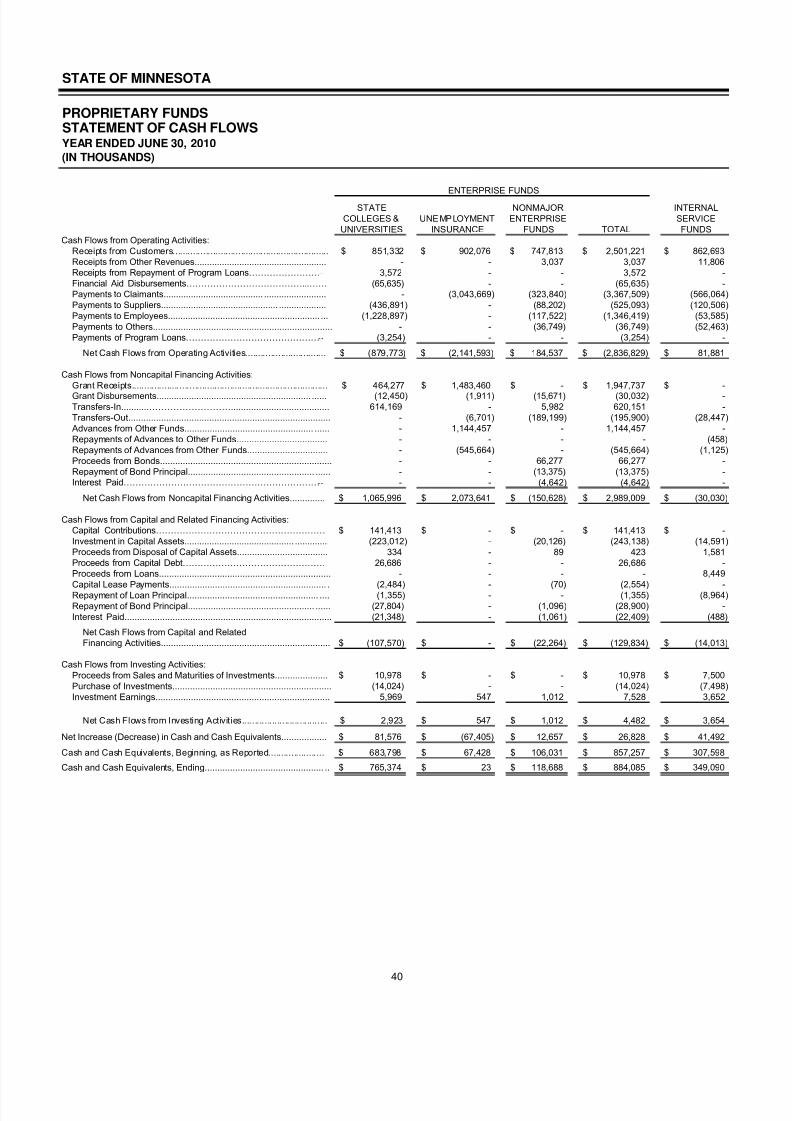
8/6/2019 2010 CAFR Minnesota
http://slidepdf.com/reader/full/2010-cafr-minnesota 56/265
STATE OF MINNESOTA
PROPRIETARY FUNDSSTATEMENT OF CASH FLOWSYEAR ENDED JUNE 30, 2010
(IN THOUSANDS)
Cash Flows from Operating Activities:Receipts from Customers.............................................................. $ 851,332 $ 902,076 $ 747,813 $ 2,501,221 $ 862,693 Receipts from Other Revenues..................................................... - - 3,037 3,037 11,806 Receipts from Repayment of Program Loans…………………… 3,572 - - 3,572 - Financial Aid Disbursements…………………………………...…… (65,635) - - (65,635) - Payments to Claimants........................................ ......................... - (3,043,669) (323,840) (3,367,509) (566,064) Payments to Suppliers............................................... ................... (436,891) - (88,202) (525,093) (120,506) Payments to Employees............................................................. ... (1,228,897) - (117,522) (1,346,419) (53,585) Payments to Others....................................................................... - - (36,749) (36,749) (52,463) Payments of Program Loans……………………………………… (3,254) - - (3,254) -
Net Cash Flows from Operating Activities................................ $ (879,773) $ (2,141,593) $ 184,537 $ (2,836,829) $ 81,881
Cash Flows from Noncapital Financing Activities:Grant Receipts.............................................................................. $ 464,277 $ 1,483,460 $ - $ 1,947,737 $ -
Grant Disbursements.............................................................. ...... (12,450) (1,911) (15,671) (30,032) - Transfers-In...........………………………....................................... 614,169 - 5,982 620,151 - Transfers-Out................................................................................ - (6,701) (189,199) (195,900) (28,447) Advances from Other Funds................................................... ...... - 1,144,457 - 1,144,457 - Repayments of Advances to Other Funds.................................... - - - - (458) Repayments of Advances from Other Funds................................ - (545,664) - (545,664) (1,125) Proceeds from Bonds.................................................................... - - 66,277 66,277 - Repayment of Bond Principal.................................................. ...... - - (13,375) (13,375) - Interest Paid………………………………………………………… - - (4,642) (4,642) -
Net Cash Flows from Noncapital Financing Activities.............. $ 1,065,996 $ 2,073,641 $ (150,628) $ 2,989,009 $ (30,030)
Cash Flows from Capital and Related Financing Activities:Capital Contributions………………………………………………… $ 141,413 $ - $ - $ 141,413 $ - Investment in Capital Assets............................................ ............. (223,012) - (20,126) (243,138) (14,591) Proceeds from Disposal of Capital Assets.................................... 334 - 89 423 1,581 Proceeds from Capital Debt………………………………………… 26,686 - - 26,686 - Proceeds from Loans.................................................................... - - - - 8,449
Capital Lease Payments.............................................................. .(2,484) - (70) (2,554) -
Repayment of Loan Principal.................................................... .... (1,355) - - (1,355) (8,964) Repayment of Bond Principal.................................................. ...... (27,804) - (1,096) (28,900) - Interest Paid.................................................................................. (21,348) - (1,061) (22,409) (488)
Net Cash Flows from Capital and RelatedFinancing Activities................................................................... $ (107,570) $ - $ (22,264) $ (129,834) $ (14,013)
Cash Flows from Investing Activities:Proceeds from Sales and Maturities of Investments..................... $ 10,978 $ - $ - $ 10,978 $ 7,500 Purchase of Investments............................................................... (14,024) - - (14,024) (7,498) Investment Earnings..................................................................... 5,969 547 1,012 7,528 3,652
Net Cash Flows from Investing Activities.................................. $ 2,923 $ 547 $ 1,012 $ 4,482 $ 3,654
Net Increase (Decrease) in Cash and Cash Equivalents.................. $ 81,576 $ (67,405) $ 12,657 $ 26,828 $ 41,492
Cash and Cash Equivalents, Beginning, as Reported...................... $ 683,798 $ 67,428 $ 106,031 $ 857,257 $ 307,598
Cash and Cash Equivalents, Ending............................................... .. $ 765,374 $ 23 $ 118,688 $ 884,085 $ 349,090
ENTERPRISE FUNDS
SERVICECOLLEGES & UNEMPLOYMENTSTATE
FUNDS
INTERNALENTERPRISE
UNIVERSITIES INSURANCE FUNDS TOTAL
NONMAJOR
40
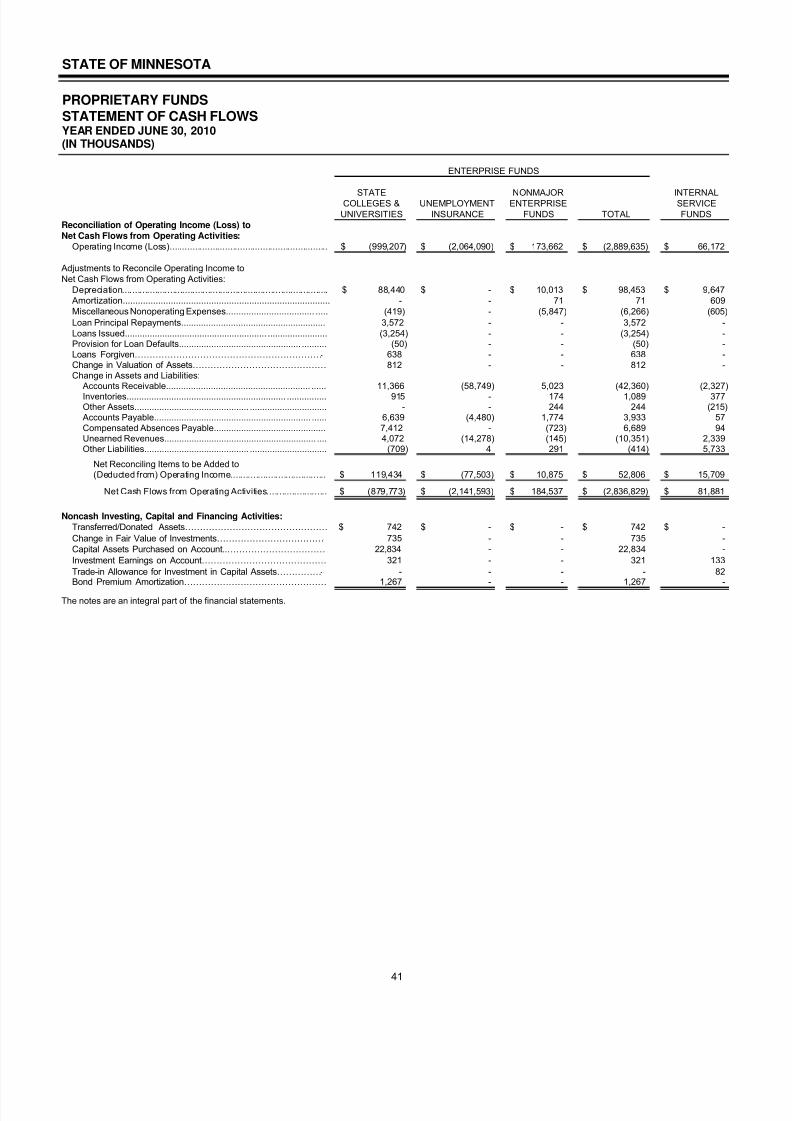
8/6/2019 2010 CAFR Minnesota
http://slidepdf.com/reader/full/2010-cafr-minnesota 57/265
STATE OF MINNESOTA
PROPRIETARY FUNDSSTATEMENT OF CASH FLOWSYEAR ENDED JUNE 30, 2010(IN THOUSANDS)
Reconciliation of Operating Income (Loss) to Net Cash Flows from Operating Activities:
Operating Income (Loss)............................................................... $ (999,207) $ (2,064,090) $ 173,662 $ (2,889,635) $ 66,172
Adjustments to Reconcile Operating Income toNet Cash Flows from Operating Activities:
Depreciation.................................................................................. $ 88,440 $ - $ 10,013 $ 98,453 $ 9,647 Amortization.................................................................................. - - 71 71 609 Miscellaneous Nonoperating Expenses................................... ..... (419) - (5,847) (6,266) (605)
Loan Principal Repayments.......................................................... 3,572 - - 3,572 - Loans Issued......................................................... ........................ (3,254) - - (3,254) - Provision for Loan Defaults................................................. .......... (50) - - (50) - Loans Forgiven……………………………………………………… 638 - - 638 - Change in Valuation of Assets……………………………………… 812 - - 812 - Change in Assets and Liabilities:
Accounts Receivable.......................................................... ...... 11,366 (58,749) 5,023 (42,360) (2,327) Inventories................................................................ ................ 915 - 174 1,089 377 Other Assets.............................................. ............................... - - 244 244 (215) Accounts Payable............................................................... ...... 6,639 (4,480) 1,774 3,933 57 Compensated Absences Payable............................................. 7,412 - (723) 6,689 94 Unearned Revenues............................................................. .... 4,072 (14,278) (145) (10,351) 2,339 Other Liabilities.......................................... ............................... (709) 4 291 (414) 5,733
Net Reconciling Items to be Added to(Deducted from) Operating Income...................................... $ 119,434 $ (77,503) $ 10,875 $ 52,806 $ 15,709
Net Cash Flows from Operating Activities........................ $ (879,773) $ (2,141,593) $ 184,537 $ (2,836,829) $ 81,881
Noncash Investing, Capital and Financing Activities:Transferred/Donated Assets………………………………………… $ 742 $ - $ - $ 742 $ -
Change in Fair Value of Investments……………………………… 735 - - 735 - Capital Assets Purchased on Account..…………………………… 22,834 - - 22,834 -
Investment Earnings on Account…………………………………… 321 - - 321 133
Trade-in Allowance for Investment in Capital Assets…………… - - - - 82 Bond Premium Amortization………………………………………… 1,267 - - 1,267 -
The notes are an integral part of the financial statements.
FUNDSUNIVERSITIES INSURANCE FUNDS TOTALCOLLEGES & UNEMPLOYMENT ENTERPRISE SERVICE
ENTERPRISE FUNDS
STATE NONMAJOR INTERNAL
41

8/6/2019 2010 CAFR Minnesota
http://slidepdf.com/reader/full/2010-cafr-minnesota 58/265
MINNESOTA
Headwaters of the mighty Mississippi
42
8/6/2019 2010 CAFR Minnesota
http://slidepdf.com/reader/full/2010-cafr-minnesota 59/265
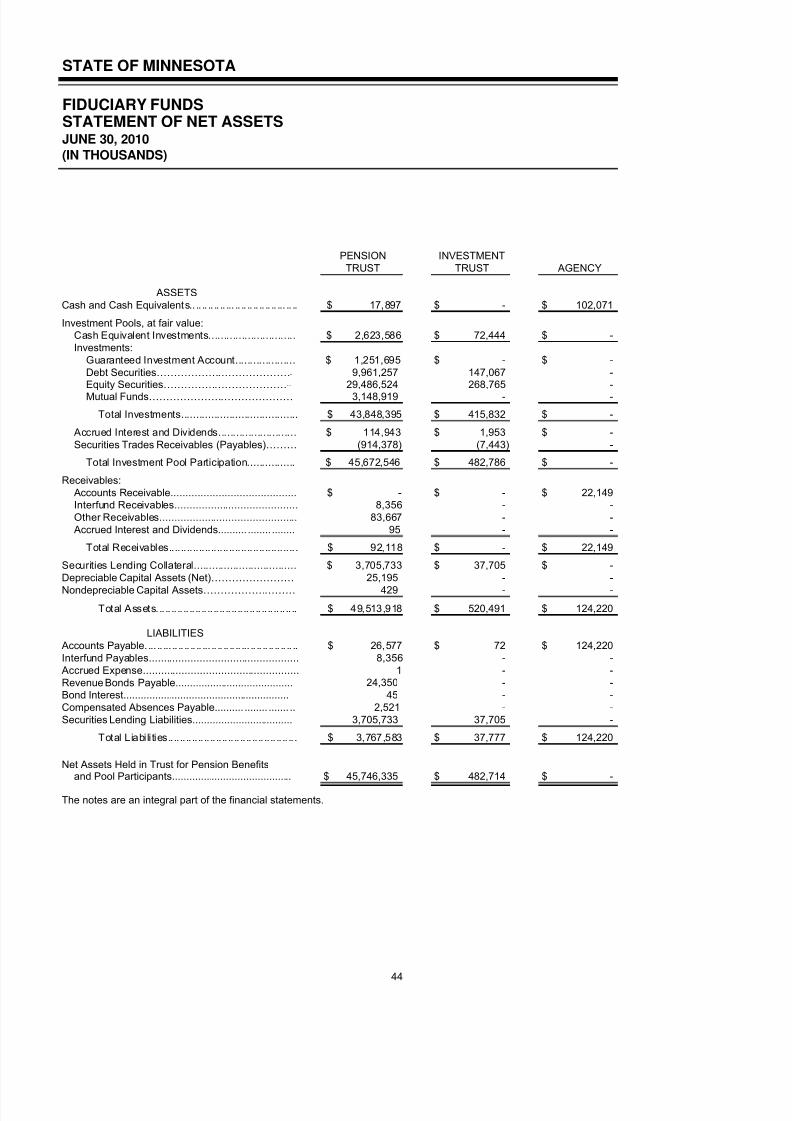
8/6/2019 2010 CAFR Minnesota
http://slidepdf.com/reader/full/2010-cafr-minnesota 60/265
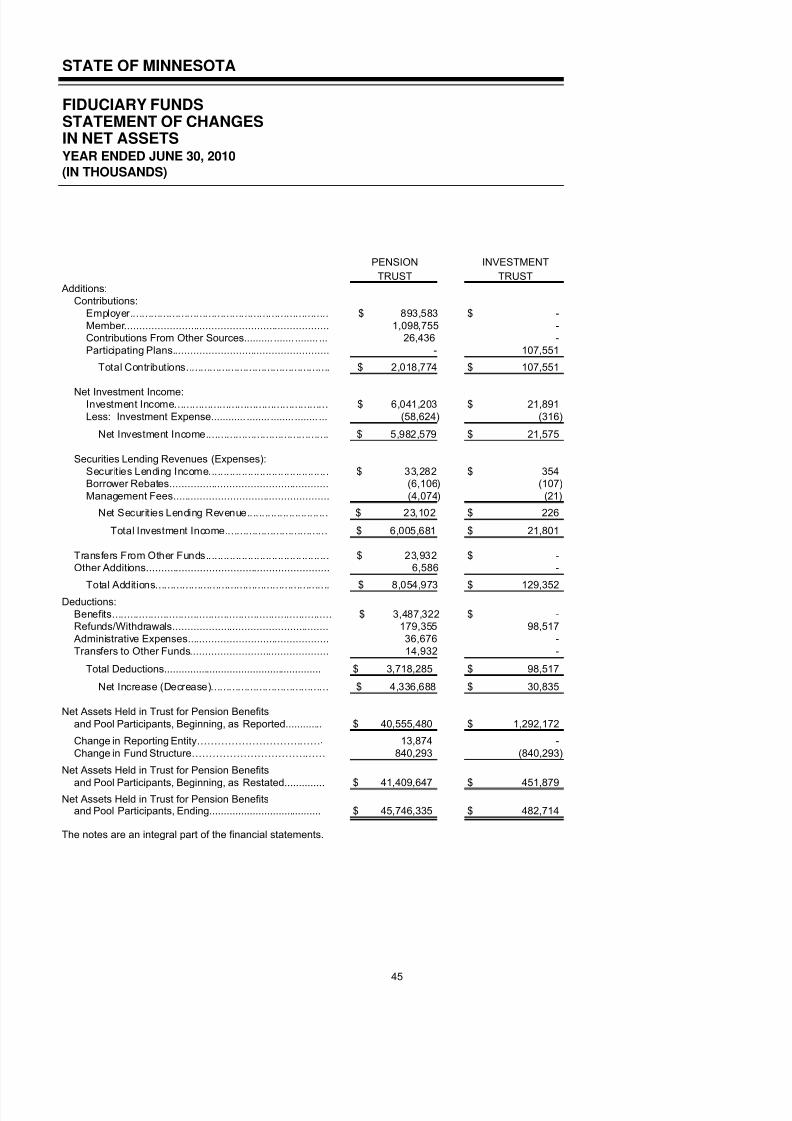
8/6/2019 2010 CAFR Minnesota
http://slidepdf.com/reader/full/2010-cafr-minnesota 61/265
STATE OF MINNESOTA
FIDUCIARY FUNDSSTATEMENT OF CHANGESIN NET ASSETSYEAR ENDED JUNE 30, 2010
(IN THOUSANDS)
Additions:Contributions:
Employer.................................................................. $ 893,583 $ - Member.................................................................... 1,098,755 - Contributions From Other Sources.......... ....... ........ ... 26,436 - Participating Plans.................................................... - 107,551
Total Contributions................................................ $ 2,018,774 $ 107,551
Net Investment Income:Investment Income................................................... $ 6,041,203 $ 21,891 Less: Investment Expense............ ........ ........ ........ ... (58,624) (316)
Net Investment Income......................................... $ 5,982,579 $ 21,575
Securities Lending Revenues (Expenses):Securities Lending Income........................................ $ 33,282 $ 354 Borrower Rebates..................................................... (6,106) (107) Management Fees.................................................... (4,074) (21)
Net Securities Lending Revenue........................... $ 23,102 $ 226
Total Investment Income.................................. $ 6,005,681 $ 21,801
Transfers From Other Funds......................................... $ 23,932 $ - Other Additions............................................................. 6,586 -
Total Additions.......................................................... $ 8,054,973 $ 129,352 Deductions:
Benefits......................................................................... $ 3,487,322 $ - Refunds/Withdrawals.................................................... 179,355 98,517 Administrative Expenses............................................... 36,676 - Transfers to Other Funds.............................................. 14,932 -
Total Deductions....................................................... $ 3,718,285 $ 98,517
Net Increase (Decrease)....................................... $ 4,336,688 $ 30,835
Net Assets Held in Trust for Pension Benefitsand Pool Participants, Beginning, as Reported............. $ 40,555,480 $ 1,292,172
Change in Reporting Entity……………………………… 13,874 - Change in Fund Structure………………………………… 840,293 (840,293)
Net Assets Held in Trust for Pension Benefits
and Pool Participants, Beginning, as Restated.............. $ 41,409,647 $ 451,879 Net Assets Held in Trust for Pension Benefits
and Pool Participants, Ending....................................... $ 45,746,335 $ 482,714
The notes are an integral part of the financial statements.
PENSION
TRUST
INVESTMENT
TRUST
45

8/6/2019 2010 CAFR Minnesota
http://slidepdf.com/reader/full/2010-cafr-minnesota 62/265
8/6/2019 2010 CAFR Minnesota
http://slidepdf.com/reader/full/2010-cafr-minnesota 63/265
State of Minnesota
2010
Comprehensive
Annual
Financial Report
Major
Component
Unit Funds
Housing Finance Agency
The agency provides money for loans and technical assistance for
construction and rehabilitation of housing for families of low and
moderate incomes.
Metropolitan Council
The council is responsible for coordinating the planning and
development of the Twin Cities metropolitan area. The council also
operates the metropolitan regional sewage treatment and disposal
systems and the public transit system. The Metropolitan Sports
Facilities Commission, a component unit of the council, operates the
Hubert H. Humphrey Metrodome sports facility.
University of Minnesota
The multi-campus university provides undergraduate and graduate
degrees, advanced research opportunities, and an extension
service. The university includes several nonprofit foundations thatprovide resources which benefit the university.
47
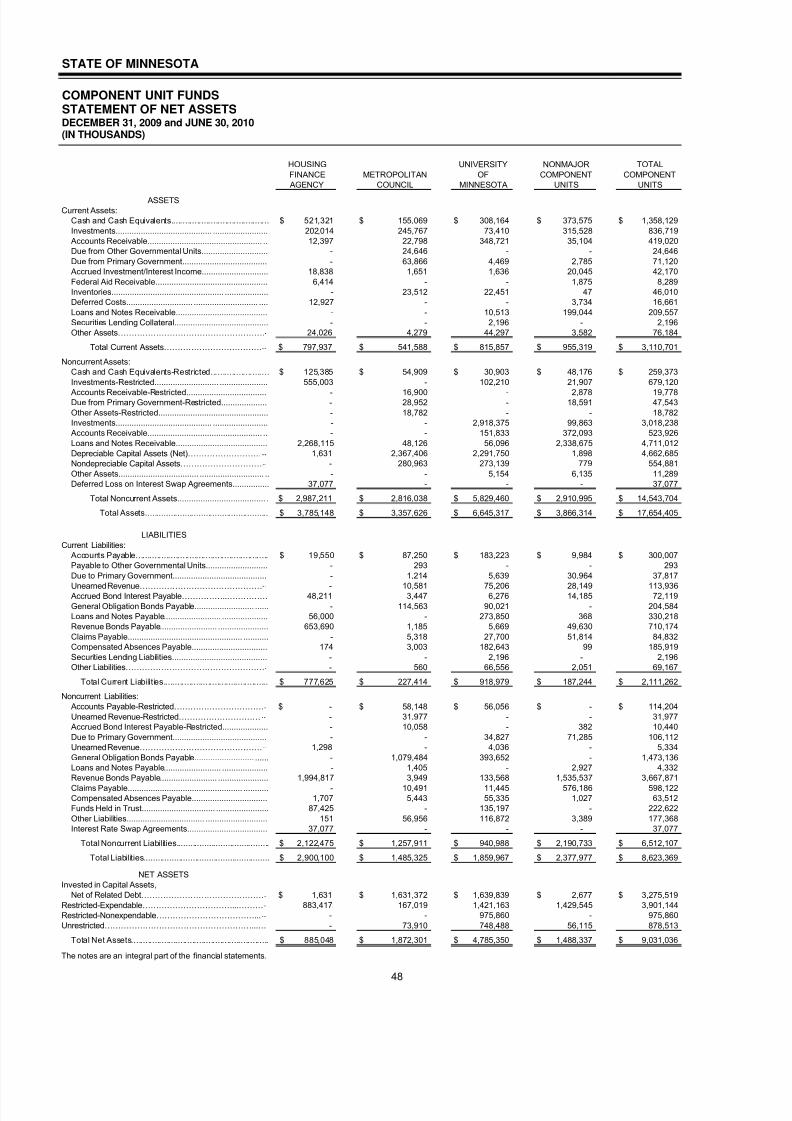
8/6/2019 2010 CAFR Minnesota
http://slidepdf.com/reader/full/2010-cafr-minnesota 64/265
STATE OF MINNESOTA
COMPONENT UNIT FUNDSSTATEMENT OF NET ASSETSDECEMBER 31, 2009 and JUNE 30, 2010(IN THOUSANDS)
Current Assets:Cash and Cash Equivalents.......................................... $ 521,321 $ 155,069 $ 308,164 $ 373,575 $ 1,358,129
Investments.......................................... ........................ 202,014 245,767 73,410 315,528 836,719 Accounts Receivable.................................................. .. 12,397 22,798 348,721 35,104 419,020 Due from Other Governmental Units............................. - 24,646 - - 24,646
Due from Primary Government..................................... - 63,866 4,469 2,785 71,120 Accrued Investment/Interest Income............................. 18,838 1,651 1,636 20,045 42,170
Federal Aid Receivable................................................. 6,414 - - 1,875 8,289 Inventories................................................. ................... - 23,512 22,451 47 46,010 Deferred Costs............................. ............................ .... 12,927 - - 3,734 16,661
Loans and Notes Receivable........................................ - - 10,513 199,044 209,557 Securities Lending Collateral......................................... - - 2,196 - 2,196
Other Assets……………………………………………… 24,026 4,279 44,297 3,582 76,184
Total Current Assets……………………………… $ 797,937 $ 541,588 $ 815,857 $ 955,319 $ 3,110,701
Noncurrent Assets:Cash and Cash Equivalents-Restricted......................... $ 125,385 $ 54,909 $ 30,903 $ 48,176 $ 259,373
Investments-Restricted............................ ..................... 555,003 - 102,210 21,907 679,120
Accounts Receivable-Restricted................................... - 16,900 - 2,878 19,778 Due from Primary Government-Restricted.................... - 28,952 - 18,591 47,543
Other Assets-Restricted................................................ - 18,782 - - 18,782 Investments.......................................... ........................ - - 2,918,375 99,863 3,018,238 Accounts Receivable.................................................. .. - - 151,833 372,093 523,926
Loans and Notes Receivable........................................ 2,268,115 48,126 56,096 2,338,675 4,711,012
Depreciable Capital Assets (Net)……………………… 1,631 2,367,406 2,291,750 1,898 4,662,685
Nondepreciable Capital Assets………………………… - 280,963 273,139 779 554,881
Other Assets................................... ............................ .. - - 5,154 6,135 11,289 Deferred Loss on Interest Swap Agreements................ 37,077 - - - 37,077
Total Noncurrent Assets...................................... . $ 2,987,211 $ 2,816,038 $ 5,829,460 $ 2,910,995 $ 14,543,704
Total Assets..................................................... $ 3,785,148 $ 3,357,626 $ 6,645,317 $ 3,866,314 $ 17,654,405
LIABILITIES
Current Liabilities:Accounts Payable......................................................... $ 19,550 $ 87,250 $ 183,223 $ 9,984 $ 300,007 Payable to Other Governmental Units........................... - 293 - - 293
Due to Primary Government......................................... - 1,214 5,639 30,964 37,817
Unearned Revenue……………………………………… - 10,581 75,206 28,149 113,936 Accrued Bond Interest Payable……………..…………… 48,211 3,447 6,276 14,185 72,119
General Obligation Bonds Payable.......................... ...... - 114,563 90,021 - 204,584 Loans and Notes Payable......................... .................... 56,000 - 273,850 368 330,218 Revenue Bonds Payable......................... ...................... 653,690 1,185 5,669 49,630 710,174
Claims Payable.................................................. ........... - 5,318 27,700 51,814 84,832 Compensated Absences Payable................................. 174 3,003 182,643 99 185,919
Securities Lending Liabilities......................................... - - 2,196 - 2,196 Other Liabilities…………………………………………… - 560 66,556 2,051 69,167
Total Current Liabilities............................................. $ 777,625 $ 227,414 $ 918,979 $ 187,244 $ 2,111,262
Noncurrent Liabilities:
Accounts Payable-Restricted…………………………… $ - $ 58,148 $ 56,056 $ - $ 114,204
Unearned Revenue-Restricted………………………… - 31,977 - - 31,977 Accrued Bond Interest Payable-Restricted.................... - 10,058 - 382 10,440
Due to Primary Government......................................... - - 34,827 71,285 106,112
Unearned Revenue……………………………………… 1,298 - 4,036 - 5,334
General Obligation Bonds Payable.......................... ...... - 1,079,484 393,652 - 1,473,136 Loans and Notes Payable......................... .................... - 1,405 - 2,927 4,332 Revenue Bonds Payable......................... ...................... 1,994,817 3,949 133,568 1,535,537 3,667,871
Claims Payable.................................................. ........... - 10,491 11,445 576,186 598,122 Compensated Absences Payable................................. 1,707 5,443 55,335 1,027 63,512 Funds Held in Trust................................ ....................... 87,425 - 135,197 - 222,622
Other Liabilities.................................. ........................... 151 56,956 116,872 3,389 177,368 Interest Rate Swap Agreements................................... 37,077 - - - 37,077
Total Noncurrent Liabilities........................................ $ 2,122,475 $ 1,257,911 $ 940,988 $ 2,190,733 $ 6,512,107
Total Liabilities...................................................... $ 2,900,100 $ 1,485,325 $ 1,859,967 $ 2,377,977 $ 8,623,369
Invested in Capital Assets,
Net of Related Debt……………………………………… $ 1,631 $ 1,631,372 $ 1,639,839 $ 2,677 $ 3,275,519
Restricted-Expendable……………………………...……… 883,417 167,019 1,421,163 1,429,545 3,901,144
Restricted-Nonexpendable………………………………... - - 975,860 - 975,860
Unrestricted………………………………………………...… - 73,910 748,488 56,115 878,513
Total Net Assets........................................................... $ 885,048 $ 1,872,301 $ 4,785,350 $ 1,488,337 $ 9,031,036
The notes are an integral part of the financial statements.
HOUSING
UNITSMETROPOLITAN OF
UNITSFINANCE
TOTAL
COMPONENT
UNIVERSITY NONMAJOR
COMPONENT
NET ASSETS
ASSETS
COUNCIL MINNESOTAAGENCY
48
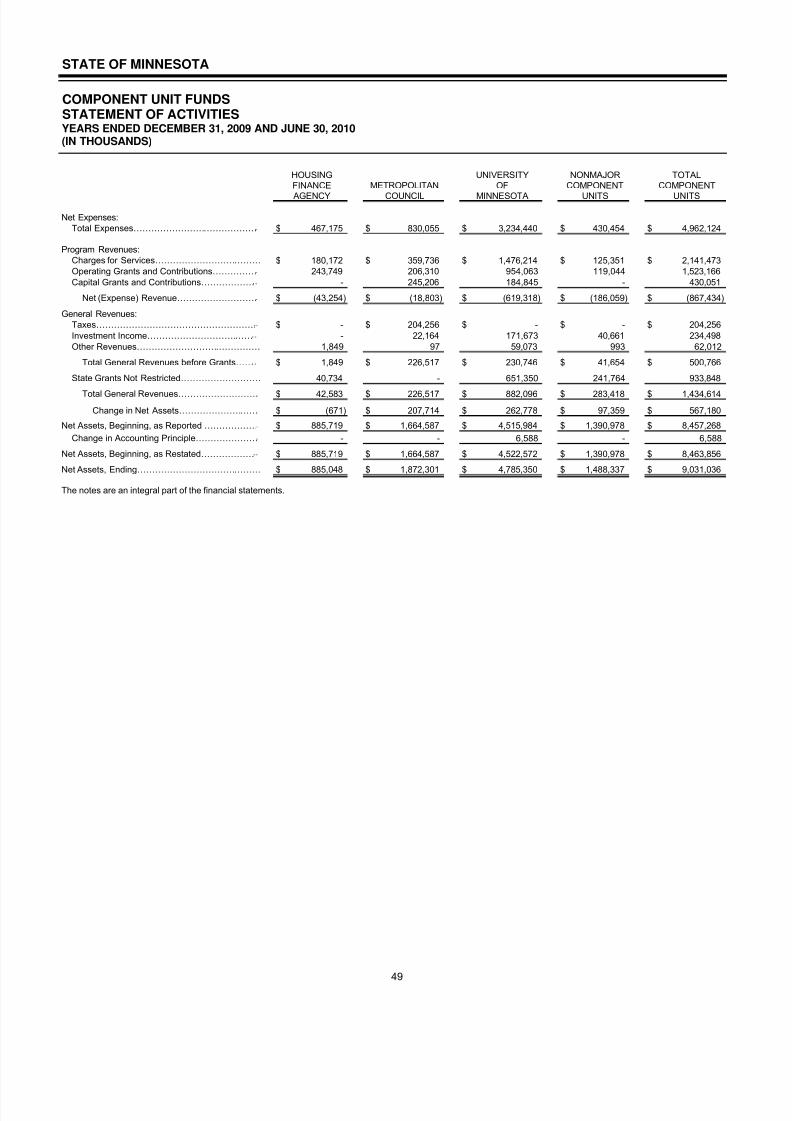
8/6/2019 2010 CAFR Minnesota
http://slidepdf.com/reader/full/2010-cafr-minnesota 65/265
STATE OF MINNESOTA
COMPONENT UNIT FUNDSSTATEMENT OF ACTIVITIESYEARS ENDED DECEMBER 31, 2009 AND JUNE 30, 2010(IN THOUSANDS)
Net Expenses:Total Expenses…………………………………… $ 467,175 $ 830,055 $ 3,234,440 $ 430,454 $ 4,962,124
Program Revenues:Charges for Services……………………………… $ 180,172 $ 359,736 $ 1,476,214 $ 125,351 $ 2,141,473 Operating Grants and Contributions…………… 243,749 206,310 954,063 119,044 1,523,166 Capital Grants and Contributions……………… - 245,206 184,845 - 430,051
Net (Expense) Revenue……………………… $ (43,254) $ (18,803) $ (619,318) $ (186,059) $ (867,434)
General Revenues:Taxes……………………………………………… $ - $ 204,256 $ - $ - $ 204,256 Investment Income……………………………… - 22,164 171,673 40,661 234,498 Other Revenues…………………………………… 1,849 97 59,073 993 62,012
Total General Revenues before Grants…… $ 1,849 $ 226,517 $ 230,746 $ 41,654 $ 500,766
State Grants Not Restricted……………………… 40,734 - 651,350 241,764 933,848
Total General Revenues……………………… $ 42,583 $ 226,517 $ 882,096 $ 283,418 $ 1,434,614
Change in Net Assets……………………… $ (671) $ 207,714 $ 262,778 $ 97,359 $ 567,180
Net Assets, Beginning, as Reported ……………… $ 885,719 $ 1,664,587 $ 4,515,984 $ 1,390,978 $ 8,457,268
Change in Accounting Principle………………… - - 6,588 - 6,588
Net Assets, Beginning, as Restated……………… $ 885,719 $ 1,664,587 $ 4,522,572 $ 1,390,978 $ 8,463,856
Net Assets, Ending…………………………………… $ 885,048 $ 1,872,301 $ 4,785,350 $ 1,488,337 $ 9,031,036
The notes are an integral part of the financial statements.
UNITSAGENCY MINNESOTA UNITSCOUNCIL
TOTALFINANCE OF COMPONENT COMPONENTMETROPOLITANHOUSING UNIVERSITY NONMAJOR
49

8/6/2019 2010 CAFR Minnesota
http://slidepdf.com/reader/full/2010-cafr-minnesota 66/265
MINNESOTA
Headwaters of the mighty Mississippi
50
8/6/2019 2010 CAFR Minnesota
http://slidepdf.com/reader/full/2010-cafr-minnesota 67/265

8/6/2019 2010 CAFR Minnesota
http://slidepdf.com/reader/full/2010-cafr-minnesota 68/265
MINNESOTA
Headwaters of the mighty Mississippi
52
8/6/2019 2010 CAFR Minnesota
http://slidepdf.com/reader/full/2010-cafr-minnesota 69/265
State of Minnesota
2010 Comprehensive Annual Financial Report
Notes to the Financial Statements
These notes provide disclosures relevant to the basic financial statements on the preceding pages.
Note 1 – Summary of Significant Accounting and Reporting Policies
Basis of Presentation
The accompanying financial statements of the state of Minnesota (the state) have been prepared toconform to generally accepted accounting principles (GAAP) as prescribed by the GovernmentalAccounting Standards Board (GASB). The state implemented the following seven GASB statements for the fiscal year ended June 30, 2010.
GASB Statement No. 51 “Accounting and Financial Reporting for Intangible Assets” was issued in June
2007. The statement establishes accounting and financial reporting requirements for intangible assets toreduce inconsistencies, thereby enhancing the comparability of the accounting and financial reporting of such assets among state and local governments. It requires that all intangible assets not specificallyexcluded by its scope provisions be classified as capital assets. Additional information on the impact of implementing this statement is located in Note 6 – Capital Assets.
GASB Statement No. 53 “Accounting and Financial Reporting for Derivative Instruments” was issued inJune 2008. The statement addresses the recognition, measurement, and disclosure of informationregarding derivative instruments entered into by state and local governments. Additional information onthe impact of implementing this statement is located in Note 2 – Cash, Investments, and DerivativeInstruments.
GASB Statement No. 54 “Fund Balance Reporting and Governmental Fund Type Definitions” was issued
in February 2009. This statement enhances the usefulness of fund balance information by providingclearer fund balance classifications that can be more consistently applied and by clarifying the existinggovernmental fund type definitions. It establishes fund balance classifications that comprise a hierarchybased primarily on the extent to which a government is bound to observe constraints imposed upon theuse of the resources reported in governmental funds. This statement changed the definitions of somegovernmental fund types as well. As a result of implementing this statement, there were significantchanges in the state‟s fund structure. Funds that did not meet the new special revenue fund definitionwere moved to the General Fund. This movement included the Environment and Natural Resources, IronRange Resources and Rehabilitation, Maximum Effort School Loan, Health Impact, and Medical Educationand Research funds as well as certain activities within the Miscellaneous Special Revenue Fund. Inaddition, the Environmental and Remediation funds were combined into one fund called the“Environmental and Remediation Fund.” The statement also requires that restricted or committedrevenues that are the foundation for a special revenue fund that are initially received in another fund and
subsequently distributed to a special revenue fund be recognized as revenue in the special revenue fundexpending the revenues. Therefore, transfers from the Highway User Tax Distribution Fund to the TrunkHighway, Municipal State-Aid Street, County State-Aid Highway, and Natural Resources funds wererecognized as revenue in the fund expending the revenues, rather than as transfers-in as in prior years.The Highway User Tax Distribution Fund no longer reports the revenue or transfers-out.
GASB Statement No. 55 “The Hierarchy of Generally Accepted Accounting Princ iples for State and LocalGovernments” was issued in March 2009. This statement incorporates the hierarchy of GAAP for stateand local governments into GASB‟s authoritative literature. The GAAP hierarchy consists of the sources of accounting principles used in the preparation of financial statements of state and local governmentalentities that are presented in conformity with GAAP, and the framework for selecting those principles.
53
8/6/2019 2010 CAFR Minnesota
http://slidepdf.com/reader/full/2010-cafr-minnesota 70/265
GASB Statement No. 56 “Codification of Accounting and Financial Reporting Guidance Contained in theAICPA Statements on Auditing Standards” was issued in March 2009. This statement incorporates certainaccounting and financial reporting guidance presented in the American Institute of Certified PublicAccountants‟ Statement on Auditing Standards into GASB‟s authoritative literature. This statementaddresses three issues not included in the authoritative literature that establishes accounting principles – related party transactions, going concern considerations, and subsequent events.
GASB Statement No. 57 “OPEB Measurements by Agent Employers and Agent Multiple-Employer Plans”was issued in December 2009. The statement addresses issues related to the use of the alternativemeasurement method and the frequency and timing of measurements by employers that participate inagency multiple-employer other post-employment benefit (OPEB) plans. This statement had no impact onthe state.
GASB Statement No. 58 “Accounting and Financial Reporting for Chapter 9 Bankruptcies” was issued inDecember 2009. The statement provides accounting and financial reporting guidance for governmentsthat have petitioned for protection from creditors by filing for bankruptcy under Chapter 9 of the UnitedStates Bankruptcy Code. This statement had no impact on the state.
Financial Reporting Entity of the State of Minnesota
This report includes the state departments, agencies, institutions, and organizational units that arecontrolled by or dependent upon the Minnesota legislature or its constitutional officers. The state of Minnesota, as a primary government, consists of all organizations that make up its legal entity. This reportalso includes other legally separate organizations as component units. GASB has established criteria for determining which organizations should be included as component units. Legally separate organizationsare reported as component units if either the state is financially accountable for the organization or thenature and significance of the organization‟s relationship with the state are such that exclusion wouldcause the state's financial statements to be misleading or incomplete. These criteria include the state'sability to appoint a voting majority of an organization's governing body, and either the state‟s ability toimpose its will on that organization, or the potential for the organization to provide specific financial benefitsto, or impose specific financial burdens on, the state.
Component units may be blended or discretely presented. All of the state‟s component units are discretelypresented, or shown separately fr om the primary government. The “Component Units” column in theaccompanying financial statements includes the financial data of the state‟s discretely presentedcomponent units. Component units are also identified separately in the note disclosures because of their separate legal status. All component units are presented in this report on the economic resourcesmeasurement focus and the accrual basis of accounting.
The following provides a description of the state‟s discretely presented component units . Additionalinformation is available from the component unit‟s separately issued financial statements.
Housing Finance Agency (HFA) – HFA provides money for loans and technical assistance for constructing and rehabilitating housing for families of low and moderate incomes. The HFA board hasseven members who are either heads of state departments or appointed by the governor. HFA isunder the administrative control of a commissioner appointed by the governor. The state has theability to significantly influence the programs, projects, and levels of services provided by HFA. HFA
issues bonds in its own name.
Metropolitan Council (MC) – MC is responsible for coordinating the planning and development of theseven-county metropolitan area. MC operates the public transit system and the regional sewagecollection and treatment system. The governor appoints the council members, including the chair,subject to the advice and consent of the Minnesota senate. The state has the ability to significantlyinfluence the projects and levels of services provided by MC. The regional administrator, appointed bythe council, is responsible for the administration of council activities. MC includes the MetropolitanSports Facilities Commission as a component unit. The fiscal year for MC ends December 31.
54
8/6/2019 2010 CAFR Minnesota
http://slidepdf.com/reader/full/2010-cafr-minnesota 71/265
University of Minnesota (U of M) – U of M was established permanently by the Minnesota constitution.The state appropriates a large percentage of the U of M‟s operating budget. The legislature elects thetwelve-member board of regents, which governs U of M, but the state does not have direct authorityover the management of the university. The state has issued debt for U of M capital projects. U of Mincludes several foundations as component units.
Agricultural and Economic Development Board (AEDB) – AEDB administers programs for agricultural
and economic development. AEDB has seven members, four of whom are commissioners of statedepartments. The state has the ability to significantly influence the programs and projects of AEDB.AEDB controls the operations of the agriculture resource programs and loans. AEDB may issuerevenue bonds for the purpose of financing development projects.
National Sports Center Foundation (NSCF) – The Minnesota Amateur Sports Commission contractswith NSCF to operate various sports facilities, including the National Sports Center, primarily for holding youth-oriented athletic and other non-athletic functions and events. Although the facilitiesbelong to the state, NSCF is responsible for the operating costs and certain improvements to thefacilities. The commission appoints foundation board members, approves the foundation's spendingbudget, approves all rates and fees, and owns any reserve funds. The fiscal year for NSCF endsDecember 31.
Office of Higher Education (OHE) – OHE makes and guarantees loans to qualified post-secondarystudents. To fund the loan program, revenue bonds are issued in OHE‟s name with limitations set bythe legislature. OHE also administers the state grant program. The state provides administrativefunding for these programs. The governor appoints the OHE director with the advice and consent of the senate.
Public Facilities Authority (PFA) – PFA provides assistance to municipalities, primarily for wastewater treatment construction projects. The state provides funding and administrative services for PFA. Theauthority is composed of commissioners from state departments and agencies. The commissionersdirect the operations of the authority and determine the funding for local government projects. PFAissues revenue bonds to make loans for wastewater treatment facilities.
Rural Finance Authority (RFA) – RFA administers a number of state agriculture programs, includingthe homestead redemption program, loan restructuring program, and agricultural improvementprogram. The board of the authority consists of state department heads and members appointed bythe governor. RFA is under the administrative control of the commissioner of the Department of Agriculture, who is a member of the board. The state has issued general obligation bond debt for RFAprograms.
Workers' Compensation Assigned Risk Plan (WCARP) – WCARP is the source of workers'compensation and employers' liability coverage for Minnesota employers unable to obtain aninsurance policy through the voluntary market. WCARP operations are subject to review by the statecommissioner of the Department of Commerce. The commissioner enters into administrativecontracts, sets premium rates, and makes assessments. The commissioner has the authority toassess all licensed workers' compensation insurance companies doing business in Minnesota anamount sufficient to fully fund the obligations of the plan to the extent that the assets of the plan areinadequate to meet its obligations. The fiscal year for WCARP ends December 31.
A component unit is classified as major or nonmajor, depending on its significance relative to other component units and the nature and significance of the component unit‟s relationship to the primarygovernment. HFA, MC, and U of M are classified as major component units for this report.
Because AEDB and RFA do not issue separately audited financial statements, the combining financialstatements include a Statement of Revenues, Expenses, and Changes in Net Assets and a Statement of Cash Flows for each of these component units.
55
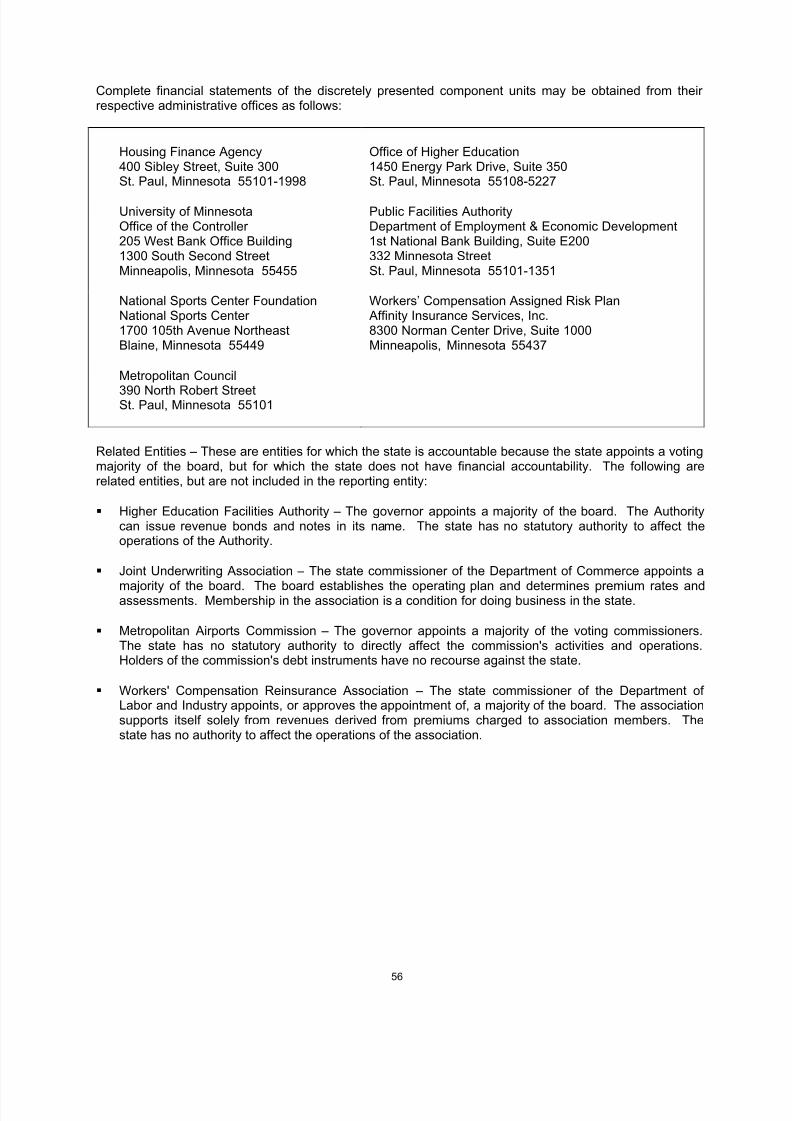
8/6/2019 2010 CAFR Minnesota
http://slidepdf.com/reader/full/2010-cafr-minnesota 72/265
Complete financial statements of the discretely presented component units may be obtained from their respective administrative offices as follows:
Housing Finance Agency400 Sibley Street, Suite 300St. Paul, Minnesota 55101-1998
Office of Higher Education1450 Energy Park Drive, Suite 350St. Paul, Minnesota 55108-5227
University of MinnesotaOffice of the Controller 205 West Bank Office Building1300 South Second StreetMinneapolis, Minnesota 55455
Public Facilities AuthorityDepartment of Employment & Economic Development1st National Bank Building, Suite E200332 Minnesota StreetSt. Paul, Minnesota 55101-1351
National Sports Center FoundationNational Sports Center 1700 105th Avenue NortheastBlaine, Minnesota 55449
Workers‟ Compensation Assigned Risk Plan Affinity Insurance Services, Inc.8300 Norman Center Drive, Suite 1000Minneapolis, Minnesota 55437
Metropolitan Council
390 North Robert StreetSt. Paul, Minnesota 55101
Related Entities – These are entities for which the state is accountable because the state appoints a votingmajority of the board, but for which the state does not have financial accountability. The following arerelated entities, but are not included in the reporting entity:
Higher Education Facilities Authority – The governor appoints a majority of the board. The Authoritycan issue revenue bonds and notes in its name. The state has no statutory authority to affect theoperations of the Authority.
Joint Underwriting Association – The state commissioner of the Department of Commerce appoints a
majority of the board. The board establishes the operating plan and determines premium rates andassessments. Membership in the association is a condition for doing business in the state.
Metropolitan Airports Commission – The governor appoints a majority of the voting commissioners.The state has no statutory authority to directly affect the commission's activities and operations.Holders of the commission's debt instruments have no recourse against the state.
Workers' Compensation Reinsurance Association – The state commissioner of the Department of Labor and Industry appoints, or approves the appointment of, a majority of the board. The associationsupports itself solely from revenues derived from premiums charged to association members. Thestate has no authority to affect the operations of the association.
56
8/6/2019 2010 CAFR Minnesota
http://slidepdf.com/reader/full/2010-cafr-minnesota 73/265
The following organizations, which are included in the primary government, prepare and publish separatefinancial reports, which may contain differences in presentation resulting from differing reporting emphasis.These financial reports may be obtained directly from each organization.
Minnesota State Lottery2645 Long Lake Road
Roseville, Minnesota 55113
Minnesota State Retirement System60 Empire Drive, Suite 300
St. Paul, Minnesota 55103
Public Employees Retirement Association60 Empire Drive, Suite 200St. Paul, Minnesota 55103
Teachers Retirement Association60 Empire Drive, Suite 400St. Paul, Minnesota 55103
State Board of Investment60 Empire Drive, Suite 355St. Paul, Minnesota 55103
Minnesota State Colleges and UniversitiesFinancial Reporting Unit500 Wells Fargo Place, 30 East 7 th StreetSt. Paul, Minnesota 55101
The financial reports, available from the State Board of Investment, report on investments in investment
pools, which include the majority of the state‟s Fiduciary Funds.
Financial Reporting Structure of the State of Minnesota
The basic financial statements include government-wide and fund financial statements. The government-wide financial statements report on the state as a whole, while the fund financial statements emphasizemajor individual funds and fund types. Both types of statements categorize activities as either governmental or business-type. Governmental expenditures are classified by function. Each of the state‟sdepartments and agencies is included in a functional classification based on its primary mission andobjectives.
Government-wide Financial Statements
The government-wide financial statements (Statement of Net Assets and Statement of Activities) displayinformation about the state as a whole, except for its fiduciary activities. These statements includeseparate columns for the governmental and business-type activities of the state and its discretelypresented component units. Eliminations have been made in the Statement of Activities so that certainallocated expenses are recorded only once in the function for which the expenses were made. Generalgovernment expenses that benefit state agencies have not been allocated as indirect expenses to thevarious functions of the state, but are reported under the General Government function.
The focus of the government-wide statements is on financial information of the state as an entity and thechange in the overall financial position of the state as a result of the activities of the fiscal year.Government-wide financial statements are presented using the economic resources measurement focusand the accrual basis of accounting. Under the economic resources measurement focus, all economicresources and obligations of the reporting government, both current and long-term, are reported in the
government-wide statements. Under the accrual basis of accounting, revenues, expenses, gains, losses,assets, and liabilities resulting from exchange and exchange-like transactions are recognized when theexchange takes place. Amounts paid to acquire capital assets are capitalized as assets in thegovernment-wide financial statements. These amounts are reported as expenditures in the governmentalfund financial statements. Long-term debt is recorded as a liability in the government-wide financialstatements, rather than as an other financing source. Amounts paid to reduce long-term indebtedness of the reporting government are reported as a reduction of the related liabilities, rather than as expenditures.
In the government-wide Statement of Net Assets, both the governmental and business-type activities arepresented on a consolidated basis by column. The statement includes long-term assets and receivablesas well as long-term debt and obligations.
57
8/6/2019 2010 CAFR Minnesota
http://slidepdf.com/reader/full/2010-cafr-minnesota 74/265
The government-wide Statement of Activities reports how much of the cost of each functional category(public safety and corrections, transportation, etc.) is supported by general government revenues (salestaxes, income taxes, etc.). The Statement of Activities reduces gross expenses, including depreciation, byrelated program revenues, and by operating and capital grants and contributions.
Program revenues must be directly associated with, or derived directly from, the function, or a business-type activity. Program revenues include: 1) charges to customers or applicants for goods, services, or
privileges provided by a given function, and 2) grants and contributions that are restricted to meeting theoperational or capital requirements of a particular function. Operating grants include operating-specificand discretionary (either operating or capital) grants, while the capital grants column reflects capital-specific grants. Program revenues are applied against program expenses in the Statement of Activities toreport the net cost of each program.
General revenues normally cover the net costs (program expenses less program revenues) of all activities.Taxes represent the majority of general revenues. Internally dedicated resources are reported as generalrevenues, rather than program revenues.
Fund Financial Statements
Fund financial statements report on the financial operations and position of governmental, proprietary, and
fiduciary funds, even though fiduciary funds are excluded from the government-wide financial statements.The emphasis in fund financial statements is on the major funds in the governmental or enterprisecategories. All remaining governmental, proprietary, and fiduciary funds are aggregated and reported asnonmajor funds.
Governmental funds, including the general, special revenue, capital projects, debt service, and permanentfunds, are presented on a current financial resource measurement focus and modified accrual basis of accounting in the fund financial statements. This presentation is deemed most appropriate to demonstratecompliance with legal and covenant requirements, the source and use of financial resources, and how thestate‟s actual spending conforms to the budget. Because the governmental fund statements arepresented using a different measurement focus and basis of accounting than used in the governmentalcolumn in the government-wide statements, reconciliations explaining the adjustments required to restatethe fund-based financial statements for the government-wide governmental activities column are included.
Proprietary funds, including the enterprise and internal service funds, are presented on the economicresource measurement focus and full accrual basis of accounting in the fund financial statements. This isthe same measurement focus and basis of accounting as the government-wide financial statements.
The state‟s fiduciary funds are presented in the fund financial statements by type (pension, investmenttrust, or agency). These assets are held for the benefit of others and cannot be used for activities or obligations of the government; therefore, the funds are excluded from the government-wide statements.
The fund financial statements are presented after the government-wide financial statements. Thesestatements display information about major funds individually, and nonmajor funds in the aggregate, for governmental and enterprise funds.
Classification of Funds
The financial position and results of state operations are organized using individual funds. Each fund is aseparate accounting entity with a self-balancing set of accounts used to record the financial transactionsand balances of that entity. Individual funds have been established as stipulated by legal provisions or byadministrative discretion. The state uses fund accounting, which is designed to demonstrate legalcompliance and to segregate transactions related to certain government functions or activities.
Governmental Fund Types – These funds account for the acquisition, use, and balances of expendablefinancial resources and the related current liabilities. Most state operations are accounted for in this fundcategory. Included in this classification are:
58
8/6/2019 2010 CAFR Minnesota
http://slidepdf.com/reader/full/2010-cafr-minnesota 75/265
General Fund which accounts for all financial resources not accounted for and reported in another fund.
Special revenue funds which account for revenue sources that are restricted or committed toexpenditure for specific purposes other than debt service or capital projects.
Capital project funds which account for financial resources that are restricted, committed, or assigned
to expenditure for capital outlays, including the acquisition or construction of capital facilities and other capital assets. Capital project funds exclude capital-related outflows financed by proprietary funds or for assets that will be held in trust.
Debt Service Fund which accounts for the accumulation of resources for, and the payment of, mostgeneral obligation long-term debt principal and interest.
Permanent Fund which accounts for resources that are restricted to the extent that only earnings, andnot principal, may be used for purposes that support the state‟s programs.
The state has two major governmental funds. The General Fund is the principal operating fund used toaccount for most of the general activities of the state. The Federal Fund is the state‟s only major specialrevenue fund. It receives and disburses federal government grants, reimbursements, recoveries, and
premiums.
Proprietary Fund Types – These funds focus on determining net income, changes in net assets, financialposition, and cash flows. Generally accepted accounting principles similar to those used by private sector businesses are followed in accounting for these funds. The fund types included in this category are theenterprise and internal service funds.
Enterprise funds account for activities that charge a fee to external users for goods or services.Activities of enterprise funds are financed and operated similarly to private business enterprises wherethe intent of the governing body is to recover costs primarily through user fees.
Internal service funds account for the financing of goods or services provided by one agency to other agencies on a cost reimbursement or other basis. The activities reported as internal service funds
include motor pool, central services, central stores, employee insurance, technology services, plantmanagement, and risk management.
The state has two major enterprise funds, the State Colleges and Universities Fund and theUnemployment Insurance Fund. The State Colleges and Universities Fund accounts for the activities of the Minnesota State Colleges and Universities (MnSCU) System. MnSCU, the largest higher educationsystem in the state, is a system of public colleges and universities. The Unemployment Insurance Fundreceives unemployment taxes collected from employers and pays unemployment benefits to eligibleindividuals.
Fiduciary Funds Types – These funds account for assets held by the state in a trustee capacity or as anagent for individuals, private organizations, or other governmental units. Pension, investment trust, andagency fund types are included in this fund category.
Pension trust funds report retirement funds administered by independent boards for which the statehas a fiduciary role.
Investment trust funds provide an investment vehicle for entities outside the state, including variouspublic retirement plans.
The Agency Fund accounts for resources held in a custodial capacity for various other governmentalunits, private organizations, or individuals. Some examples include resources held for inmates of correctional facilities or residents of veterans and group homes, sales taxes to be distributed to localgovernments, and child support collections to be distributed to custodial parents.
59
8/6/2019 2010 CAFR Minnesota
http://slidepdf.com/reader/full/2010-cafr-minnesota 76/265
Basis of Accounting, Measurement Focus, and Fund Financial Statement Presentation
All governmental funds focus on the flow of current financial resources and use the modified accrual basisof accounting. With this measurement focus, only current assets and current liabilities are included on thebalance sheet. Governmental fund operating statements present increases (revenues and other financingsources) and decreases (expenditures and other financing uses) to fund balances. Under the modifiedaccrual basis of accounting, revenues are recognized in the period in which they become both measurable
and available to finance operations of the fiscal year, or to liquidate liabilities existing at fiscal year end.The state considers receivables collected after June 30, but by the close of the books in late August, to beavailable, and recognizes these receivables as current year revenues in governmental funds. Individualincome taxes, property taxes, sales taxes, and federal grants are the major revenue sources susceptible toaccrual. Revenues collected in advance, including certain federal grant revenues to which the state doesnot yet have legal entitlement, are reported as deferred revenue until the related commitment arises, atwhich time revenue is recognized. Expenditures and related liabilities are recognized when fundobligations are incurred, except for debt service, compensated absences, pollution remediation obligations,pension and other postemployment benefits, and claims and judgments, which are recorded when due andexpected to be liquidated with available financial resources. The following provides further detail onspecific items regarding the modified accrual basis of accounting.
Tax Revenues – Tax revenues, excluding property taxes, are recognized in the period they become both
measurable and available to finance expenditures of the current period. Measurable means that taxpayer liability is supported by sufficient documentation and can be reasonably estimated. The state‟s liability for anticipated refunds of such taxes is estimated and recorded as reductions in revenue in the period whenthe related tax is recognized.
Property Tax Revenues – Laws of Minnesota Special Session 2001 established a state general tax(property tax) against commercial-industrial and seasonal recreational property. The tax is distributedamong counties by applying a uniform rate to the appropriate tax capacities in each county. Levies aredetermined based on the formula contained in the laws. The state preliminarily certifies the state generallevy rate to each county no later than November 1 of each year for taxes payable in the following calendar year. The state certifies the final state general tax levy on January 1 of each year to each county.Property taxes are due to counties in two installments for each year – May 15 and October 15. Thecounties pay the state general tax to the state on three dates – June 30, December 1, and January 25, for any adjustments or changes. Local units of government, as agents for the state, assess the state generaltax. Property tax is recognized, net of uncollectible amounts, in the period for which the taxes are leviedand the taxes are available.
Federal Revenues – Federal revenues, earned by incurring allowable obligations, are recognized at thesame time the related obligation is recognized, with one exception. Trunk Highway Fund (special revenuefund) expenditures incurred by June 30, but not converted to Federal funding by the close of the federalfiscal year, are not recognized as federal revenues.
Proprietary, pension, and investment trust funds are accounted for using the full accrual basis of accounting. Revenues are recognized when earned, and expenses are recognized as incurred. Theaccrual basis of accounting is also used for contributions, benefits, and refunds paid for defined benefitand defined contribution pension plans. Agency funds use the accrual basis of accounting, but do nothave a measurement focus because agency funds do not recognize revenues and expenses.
60
8/6/2019 2010 CAFR Minnesota
http://slidepdf.com/reader/full/2010-cafr-minnesota 77/265
Proprietary funds distinguish operating from nonoperating items. Operating revenues and expenses resultfrom providing services or producing and delivering goods in connection with the proprietary fund‟sprincipal ongoing operations. Operating expenses for enterprise and internal service funds include thecost of sales and services, administrative expense, and depreciation of capital assets. All other revenuesand expenses are reported as nonoperating items.
Private-sector standards of accounting and financial reporting, including Financial Accounting Standards
Board (FASB) Statements and Interpretations, Accounting Principles Board Opinions, and AccountingResearch Bulletins issued on or before November 30, 1989, generally are followed in the government-wide, proprietary, and component unit financial statements to the extent that those standards do notconflict with or contradict GASB guidance. Except for the Workers‟ Compensation Assigned Risk Plan(WCARP) (component unit), the government has elected not to follow subsequent private-sector guidance.WCARP has elected to follow all applicable FASB statements issued after November 30, 1989, that do notcontradict GASB pronouncements.
Cash Equivalents and Investments
Cash Equivalents – Cash equivalents are short-term, highly liquid investments having original maturities(remaining time to maturity at acquisition) of three months or less. Cash equivalents also includemanagement pools and money market funds that are used essentially as demand deposit accounts.
Investments – Investments are reported at fair value. The basis for determining the fair value of investments that is not based on market quotations includes analysis of future cash flows, audited financialstatements, and independent appraisals. Investments in derivatives are generally made to manage theoverall risk of the individual manager‟s portfolios to a level satisfactory to the investment management firmand in accordance with the firm‟s contract with the State Board of Investment. See Note 2 – Cash,Investments, and Derivative Instruments for additional information regarding cash, investments, andderivative instruments.
Inventories
Generally, inventories for governmental funds are recorded as expenditures when purchased and are nota resource available for appropriation. For the Trunk Highway Fund (special revenue fund), inventories
are valued using weighted-average cost. Inventories maintained by the various funds are determined byannual and periodic physical counts. Inventories of proprietary funds are valued using the first-in, first-out,average cost, or specific cost methods.
Securities Lending
Securities on loan for cash collateral and the liabilities resulting from the security lending transactions arereported on the Statement of Net Assets or the Balance Sheet, as appropriate, for the particular fund typeor level of reporting. Securities lending income and rebate and management fees are reported separatelyon the Statement of Revenues, Expenditures and Changes in Fund Balances; the Statement of Revenues,Expenses and Changes in Net Assets; or the Statement of Changes in Net Assets, as appropriate for theparticular fund type.
Restricted Assets
Mandatory asset segregations required by bond covenants and other external restrictions are presented inenterprise funds and discretely presented component units as restricted assets. After liabilities fromrestricted assets are paid, any remaining restricted assets in the enterprise funds will be used for debtservice.
61
8/6/2019 2010 CAFR Minnesota
http://slidepdf.com/reader/full/2010-cafr-minnesota 78/265
Income Tax Credits
The Minnesota Department of Revenue processes several types of tax credits through the individualincome tax system. For financial reporting purposes, income tax credits that are limited by the amount of the individual‟s tax liability (before considering such credits) are reported as revenue reductions. Incontrast, credits for Education, Working Family, Fuel Taxes, and Child and Dependent Care may bereceived even if they exceed the individual‟s tax liability. These types of credits are reported as
expenditures, rather than revenue reductions, because the income tax system is, essentially, being usedas a filing and payment mechanism to make grant payments to individuals.
Grant Expenditures and Liabilities Recognition
Grants are defined as nonexchange transactions because the state gives (or receives) value to another party without receiving (or giving) equal value in return. Grants are normally paid on either areimbursement basis or an entitlement basis.
Reimbursement type grants may be awarded for specific services provided to eligible recipients, or may bemade for eligible types of reimbursements. Grants paid on the reimbursement basis are recognized asexpenditures and liabilities in the year in which the grantee incurs the costs of providing specific services toeligible recipients or makes eligible types of expenditures.
Entitlement type grants may be based on services provided by the grantee. The intent of the grant is tohelp fund such services, but the grant amount is not based on the cost of providing the service(s).Expenditures and the related liabilities for these types of entitlement grants are recognized as the serviceis provided if the amount owed can be reasonably estimated soon after the end of the state‟s fiscal year.Other types of entitlement grants are not based on the services provided or action taken by the grantee.Expenditures and the related liabilities for these types of grants are recognized in the fiscal year in whichthe resources were appropriated.
Compensated Absences
State employees accrue vacation leave, sick leave, and compensatory leave at various rates within limitsspecified in the collective bargaining agreements. Leave balances are liquidated in cash only upon
termination from state employment. The current and noncurrent compensated absences liabilities for governmental funds are reported only in the government-wide Statement of Net Assets. All other fundtypes report the liability for compensated absences as a liability of the specific fund.
Capital Assets
Capital assets, which include land, buildings, equipment, infrastructure, and intangible assets, are reportedin the government-wide financial statements and the fund financial statements for proprietary and fiduciaryfunds. Capital assets are generally defined by the state as assets with an initial, individual cost of morethan $30,000 for equipment and $300,000 for buildings, and an estimated useful life of at least three years.
Capital assets are recorded at cost or, for donated assets, at fair value at the date of acquisition. Aninventory of land and buildings was completed in 1985. Historical cost records for older capital assets areincomplete or not available; therefore, estimated historical costs have been used in these situations.Permanent School Fund (permanent fund) land is reported at estimated historic cost. The land included inthe Permanent School Fund was granted to the state by the federal government in connection with thestate being admitted to the United States. Tax forfeited land is not included in land inventory because thestate does not take permanent title. When the land is sold, proceeds are distributed to local jurisdictions.
62
8/6/2019 2010 CAFR Minnesota
http://slidepdf.com/reader/full/2010-cafr-minnesota 79/265
Capital assets are depreciated using the straight-line method generally based on the following useful lives:20-50 years for buildings, 20-50 years for large improvements, 20-50 years for easements, 8-12 years for internally generated computer software, 3-10 years for small improvements, and 3-12 years for equipment.Transportation infrastructure assets using the modified approach, land, construction in progress,permanent easements with indefinite useful lives, and works of art and historical treasures, such as thestate capitol, are not depreciated.
GASB Statement No. 34 allows an alternative (modified) approach to the recording of infrastructure assetsin which costs to maintain and preserve these assets are expensed in lieu of depreciation. Thetransportation infrastructure capital assets of pavement and bridges are reported using the modifiedapproach. In electing to use this option for transportation infrastructure, the state uses an assetmanagement system which establishes minimum standards and determines, at least every three years,whether the minimum standards are being met. Disclosures of the minimum standards and the currentstatus of the state‟s pavement and bridges are included in Required Supplementary Information. See Note6 – Capital Assets for further information on capital assets.
Current and Noncurrent Assets
At the government-wide level, assets are classified as either current or noncurrent. Governmental activitycurrent assets are those, including cash, various receivables, and short-term investments, considered
available for appropriation and expenditure. Current assets in business-type activities are those that areavailable or can readily be made available to meet the cost of operating or to pay current liabilities. Allother assets are considered noncurrent. Assets are classified as current or noncurrent in proprietaryfunds, but assets are not classified at the fund level for governmental funds.
Noncurrent Liabilities
In the government-wide financial statements, long-term debt and other long-term obligations are reportedas liabilities in the applicable governmental activities or business-type activities column. Long-termliabilities are the noncurrent portions of liabilities resulting from debt issuances, compensated absences,closure and postclosure care for landfills, workers‟ compensation claims, pollution remediation obligations,net pension and other postemployment benefit obligations, and arbitrage rebate requirements. Inproprietary fund statements, these liabilities are reported as liabilities of each individual fund.
In the fund financial statements, governmental fund types recognize bond premiums and discounts duringthe current period. The face amount of the debt issued is reported as other financing sources whilediscounts on debt issuances are reported as other financing uses. Issuance costs, whether or not withheldfrom the actual debt proceeds received, are reported as debt service expenditures. In the government-wide financial statements, bond premiums and discounts are deferred and amortized over the life of thebonds using the straight-line method.
See Note 12 – Long-Term Liabilities – Primary Government for further information.
Deferred Compensation Plan
The state offers a deferred compensation plan created in accordance with Internal Revenue Service Code,Section 457. The State Deferred Compensation Fund (pension trust fund) represents the value of allassets of the plan. The plan is available to all public employees in the state and is administered by theMinnesota State Retirement System. Under this plan, compensation is deferred for income tax purposesin accordance with Section 457 and is not available to employees until termination, retirement, death, or unforeseeable emergency. In accordance with state statute, effective July 1, 1997, contributions are heldfor the exclusive benefit of the participants and their beneficiaries. These amounts are held in trust, incustodial accounts, or in qualifying contracts, as required by federal law. The State Board of Investmentdetermines the investment options available to plan participants and oversees the activities of theinvestment managers. The majority of the assets of the plan are invested in various mutual funds. Thestate is not liable for any investment losses under the plan.
63
8/6/2019 2010 CAFR Minnesota
http://slidepdf.com/reader/full/2010-cafr-minnesota 80/265
Net Assets/Fund Balances and Fund Balance Classification Policies and Procedures
The difference between fund assets and liabilities is “Net Assets” on the government-wide, proprietary, andfiduciary fund statements and “Fund Balances” on governmental fund statements.
Invested in Capital Assets, Net of Related Debt, consists of capital assets, net of accumulated depreciationand reduced by the outstanding balances of bonds, mortgages, notes, or other debt attributable to the
acquisition, construction, or improvement of such assets. Significant unspent related debt proceeds areincluded in Restricted for Capital Projects.
Restricted Net Assets represent the portion of net assets that are constrained either externally by partiessuch as creditors or grantors, or legally through constitution provisions or enabling legislation. Restrictednet assets are determined at the fund level. For a fund with more than one revenue stream, restricted netassets are determined by the materiality of any restricted revenues in the fund. When both restricted andunrestricted net assets are available for use, the state policy is to use restricted resources first.
In the fund financial statements, governmental funds report fund balance classifications that comprise ahierarchy based primarily on the extent to which the state is bound to honor constraints on the specificpurposes for which amounts in those funds can be spent. Fund balance is reported as restricted whenconstraints placed on the use of the resources are either externally imposed by creditors, grantors,
contributors, or laws or regulations of other governments; or, imposed by law through constitutionalprovisions or enabling legislation. Amounts that can only be used for specific purposes pursuant toconstraints imposed by formal action of the state legislature are reported as committed fund balance.Those committed amounts cannot be used for any other purpose unless the state legislature removes or changes the specified use by taking the same type of action it employed to commit those amounts.Amounts that ar e constrained by the state‟s intent to be used for specific purposes , but are neither restricted nor committed, are classified as assigned fund balances. Intent is expressed by state officials towhom the state has delegated the authority to assign amounts to be used for specific purposes.Unassigned fund balance represents fund balance that has not been assigned to other funds and that hasnot been restricted, committed, or assigned to specific purposes within the general fund. Nonspendablefund balances include amounts that cannot be spent because they are either not in spendable form or legally or contractually required to be maintained intact.
The state‟s policy is that restricted amounts are spent first when an expenditure is incurred for purposes for which both restricted or unrestricted (committed, assigned, or unassigned) amounts are available. Withinunrestricted fund balance, the state‟s policy is that committed amounts are reduced first, followed byassigned amounts, and then unassigned amounts when expenditures are incurred for purposes for whichamounts in any of those unrestricted fund balance classifications could be used.
Budgeting and Budgetary Control
The state operates on a two-year (biennial) budget cycle ending on June 30 of odd-numbered years.Appropriations in the biennial budget are usually for a single year; however, where specified, single year appropriations may be carried forward to the following year of the biennium. The governor's budget for thebiennium is developed by Minnesota Management and Budget and presented to the legislature for approval. Specific appropriations are required for the majority of the expenditures from the General Fund.The accounts not requiring specific appropriations are considered perspective differences in the budgetary
basis vs. GAAP reconciliation. Specific appropriations are also required for all special revenue fundsexcept the Federal, Municipal State-Aid Street, County State-Aid Highway, Douglas J. Johnson EconomicProtection Trust, Endowment, and Miscellaneous Special Revenue funds. Some appropriations are "openappropriations" for entitlement type and some interfund transfer programs. In these cases, the amountthat is needed to fulfill the obligation for the fiscal year is made available. There is no limit on the amountthat can be expended for the program. Estimates of the amount needed for such programs are included inthe budget forecast.
64
8/6/2019 2010 CAFR Minnesota
http://slidepdf.com/reader/full/2010-cafr-minnesota 81/265
Budgetary control is essentially maintained at the departmental level except for certain programs wherecontrol is at the program level. In most departments, upon notifying the governor and legislativeleadership, department heads are permitted to revise budgets by transferring amounts between programswithin their departments.
Unencumbered appropriation balances generally cancel to the fund at the end of the fiscal year. However,if specifically provided by law, or if statutory authority is invoked by the agency, the unencumbered balance
may be carried forward between fiscal years. The budget and the state accounting system are maintainedessentially on a cash basis with the exception that, at year-end, encumbered amounts are included in theexpenditures of the year appropriated for budgetary reporting. The accounting system controlsexpenditures by appropriation line item as established in the legally adopted appropriation bills. There wasone instance in fiscal year 2010 where expenditures exceeded the authorized limits at the legal level of budgetary control. The Tax Court overspent its budget authority by $2,547. The Tax Court plans to seeklegislative action to approve the additional expenditures. A separate report showing the detail of legallevel of budgetary control and actual expenditures is available from Minnesota Management and Budget.
Interfund Activity and Balances
Generally, internal service fund activity has been eliminated from the government-wide statements.Internal service fund activity from external customers is reported under governmental activities in the
government-wide statements. Interfund receivables and payables have been eliminated from thegovernment-wide Statement of Net Assets, except for residual amounts between governmental andbusiness-type activities. See Note 5 – Interfund Transactions for additional information.
Prior Period Adjustments
See Note 6 – Capital Assets for discussion of the prior period adjustments.
Minneapolis Employees Retirement Fund
The Laws of Minnesota, Chapter 359, Article 11, transferred the administration of the MinneapolisEmployees Retirement Fund (MERF) to the Public Employees Retirement Association board of directorseffective June 30, 2010. During fiscal year 2009, investment activity of MERF was presented in the state‟s
Investment Trust Fund (fiduciary fund). Investment balances as of July 1, 2009, were transferred from theInvestment Trust Fund to a pension trust fund (Minneapolis Employees Retirement) managed by thePublic Employees Retirement Association board of directors and were reported as a change in fundstructure. The additional July 1, 2009, assets and liabilities were reported as a change in reporting entityin the Minneapolis Employees Retirement Fund (pension trust).
Note 2 – Cash, Investments, and Derivative Instruments
Primary Government
Cash and Cash Equivalents
The majority of the primary government‟s cash is held in the state treasury and commingled in state bank
accounts, while the majority of component unit cash is held in separate bank accounts. Cash in individualfunds may be invested separately where permitted by statute; however, cash in most funds is invested aspart of an investment pool. A fund‟s investment with the primary government‟s cash pools is reported as acash equivalent. Where provided by statute, investment earnings of the primary government‟s pools areallocated to the individual funds. Earnings for all other participants are credited to the General Fund.
65
8/6/2019 2010 CAFR Minnesota
http://slidepdf.com/reader/full/2010-cafr-minnesota 82/265
Deposits
Minnesota Statutes, Section 9.031, requires that deposits be secured by depository insurance or acombination of depository insurance and collateral securities held in the state‟s name by an agent of thestate. The statute further requires that the insurance and collateral shall be in an amount sufficient toensure that the deposits do not exceed 90 percent of the sum of the insured amounts and the fair value of the collateral.
Investments
The State Board of Investment (SBI) manages the majority of the state‟s investments. All investmentsundertaken by SBI are governed by the standards codified in Minnesota Statutes, Chapters 11A and 356A.Minnesota Statutes, Section 11A.24, broadly restricts investments of the primary government to obligationsand stocks of United States and Canadian governments, their agencies and registered corporations, other international securities, short-term obligations of specified high quality, restricted participation as a limitedpartner in venture capital, real estate, or resource equity investments, and restricted participation inregistered mutual funds.
Funds not invested by SBI are primarily Minnesota State Colleges and Universities‟ funds. Investments for these funds must also conform to the above statutes and may be further restricted by bond indentures.
Generally, when applicable, the statutes limit investments to those rated by a nationally recognized ratingagency within the top four quality ratings categories. The statutes further prescribe the maximumpercentage of fund assets that may be invested in various asset classes and contain specific restrictions toensure the quality of the investments.
SBI is authorized to establish, and has established, combined investment funds used by participatingpublic retirement and nonretirement funds. Retirement and nonretirement funds may not be commingled.Each investment fund has its own characteristics, including investment objective and risk characteristics.Within statutory requirements and based on detailed analyses of each fund, SBI has establishedinvestment guidelines and benchmarks for all funds under its management. These investment guidelinesand benchmarks are tailored to the particular needs of each fund and specify investment objectives, risktolerance, asset allocation, investment management structure, and specific performance standards.
Investment Derivative Instruments
Minnesota Statutes, Section 11A.24, provides that any agreement for put and call options and futurescontracts may only be entered into with a fully offsetting amount of cash or securities. This provisionapplies to foreign currency forward contracts used to offset the currency risk of a security. All other derivatives are exchange traded. The purpose of the SBI derivative activity is to equitize cash in theportfolio, to adjust the duration of the portfolio, or to off-set current futures positions.
The cash inflows, cash outflows, and changes in fair value of investment derivatives are reported asinvestment income. The June 30, 2010, fair value of investment derivatives are reported as investments.
Synthetic Guaranteed Investment Contract (SGIC): SBI maintains a fully benefit-responsive SGIC for theSupplemental Investment Pool - Fixed Interest Account of the Pension Trust and Investment Trust Fundsportfolio. The investment objective of the Fixed Interest Account is to protect investors in definedcontribution and deferred compensation plans from loss of their original investment and to provide acompetitive interest rate. On June 30, 2010, the SGIC had a portfolio of well diversified high qualityinvestment grade fixed income securities with a fair value of $747,887,000 that is $37,692,000 in excess of the value protected by the wrap contract. The Fixed Income Account also includes a liquid investmentpool and a guaranteed investment contract with fair values of $214,955,000 and $326,545,000,respectively.
66
8/6/2019 2010 CAFR Minnesota
http://slidepdf.com/reader/full/2010-cafr-minnesota 83/265
The following table summarizes, by derivative type, the investment derivative activity and June 30positions for fiscal year 2010:
Change in Fair
Value
Year End
Notional
Amount
Year End Fair
Value
Governmental Activities:Futures 23,370$ 113$ -$
Fiduciary Activities:
Futures 15,272$ (42,397)$ -$
Futures Options Bought (5) 164 420
Futures Options Written 3,820 (4,338) (2,433)
FX Forwards 4,633 - 641 TBA Transactions 56,042 906,900 7,332 (1)
Stock Rights/Warrants 2,374 2,615 2,248
82,136$ 862,944$ 8,208$
(1) Shown at net unrealized gain.
Primary Government
Derivative Activity for the Year Ended June 30, 2010
By Derivative Type
(In Thousands)
Credit Risk : Minnesota is exposed to credit risk through the counter parties in foreign currency forward(FX Forward) contracts used to offset the currency risk of a security. The state‟s FX Forward counter party, Royal Bank of Scotland, PLC, exposes the state to a maximum loss of $1,526,000 and five otherscombined expose the state to a maximum loss of $773,000 should these counter parties fail to perform.These counter parties have S&P credit ratings of AA- or better.
Foreign Currency Risk : Currency futures and foreign stock index futures are exposed to foreign currencyrisk. Their currency risks are included in the investment Foreign Currency Risk schedule of this note.
Component Unit Derivative Activity: Derivative activity of the state‟s component units is disclosed in thelast section of this note.
Interest Rate Risk – Investments
Interest rate risk is the risk that changes in interest rates of debt investments will adversely affect the fair value of an investment. The state does not have a policy on interest risk. The contracts between SBI andinvestment managers contain the guidelines and limitations regarding interest rate risk. Debt securities areconstrained around the quality rating, sector mix, and duration of the Lehman Aggregate Bond Index.
Interest rate risk information is presented using the weighted average maturity method, which expressesinvestment time horizons, the period when investments become due and payable in years or months,weighted to reflect the dollar size of individual investments within investment type.
Credit Risk of Debt Security Investments
Credit risk is the risk that an issuer or other counterparty to an investment will not fulfill its obligations.Minnesota Statutes limit investments in debt securities to the top four quality ratings categories by anationally recognized rating agency. The state does not have a credit risk policy that is more stringentthan the statutory requirements. The contracts between SBI and investment managers include guidelinesor limitations regarding credit risk.
67
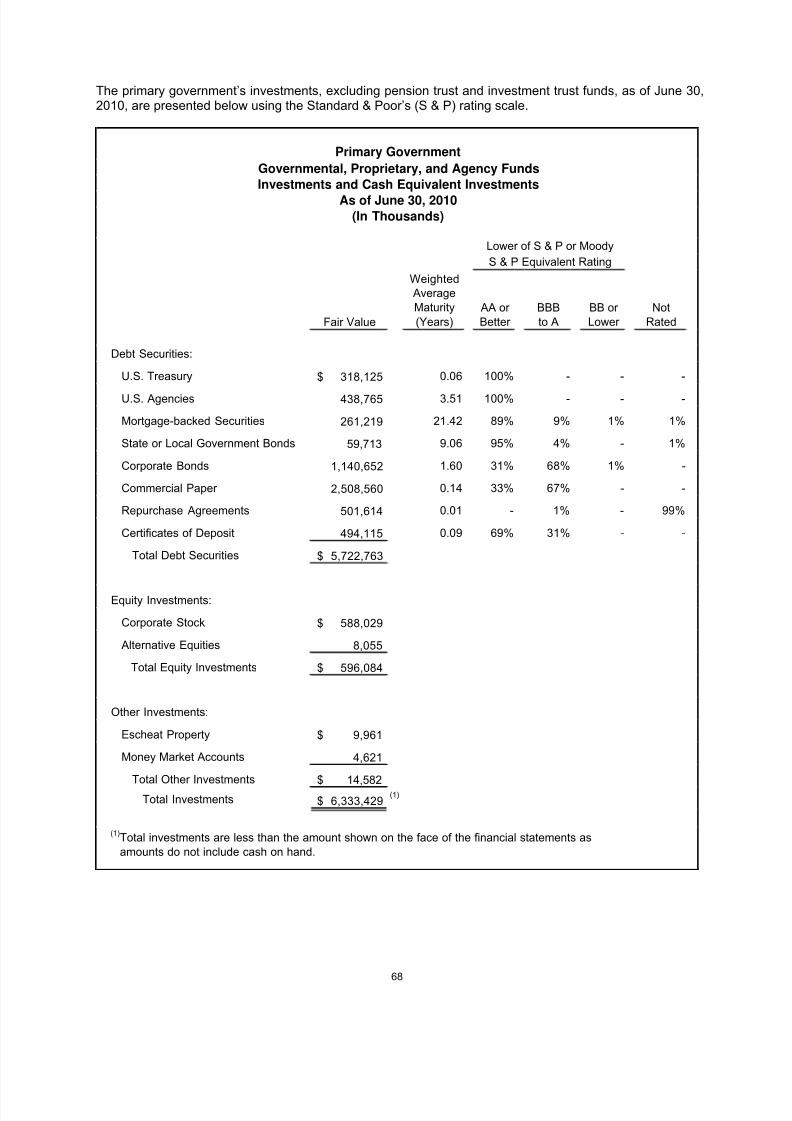
8/6/2019 2010 CAFR Minnesota
http://slidepdf.com/reader/full/2010-cafr-minnesota 84/265
The primary government‟s investments, excluding pension trust and investment trust funds, as of June 30,2010, are presented below using the Standard & Poor‟s (S & P) rating scale.
Fair Value
WeightedAverageMaturity
(Years)AA or Better
BBBto A
BB or Lower
NotRated
Debt Securities:
U.S. Treasury 318,125$ 0.06 100% - - -
U.S. Agencies 438,765 3.51 100% - - -
Mortgage-backed Securities 261,219 21.42 89% 9% 1% 1%
State or Local Government Bonds 59,713 9.06 95% 4% - 1%
Corporate Bonds 1,140,652 1.60 31% 68% 1% -
Commercial Paper 2,508,560 0.14 33% 67% - -
Repurchase Agreements 501,614 0.01 - 1% - 99%
Certificates of Deposit 494,115 0.09 69% 31% - -
Total Debt Securities 5,722,763$
Equity Investments:
Corporate Stock 588,029$
Alternative Equities 8,055
Total Equity Investments 596,084$
Other Investments:
Escheat Property 9,961$
Money Market Accounts 4,621
Total Other Investments14,582$
Total Investments 6,333,429$(1)
(In Thousands)
(1)Total investments are less than the amount shown on the face of the financial statements asamounts do not include cash on hand.
S & P Equivalent Rating
Primary Government
Governmental, Proprietary, and Agency Funds
Investments and Cash Equivalent Investments
As of June 30, 2010
Lower of S & P or Moody
68
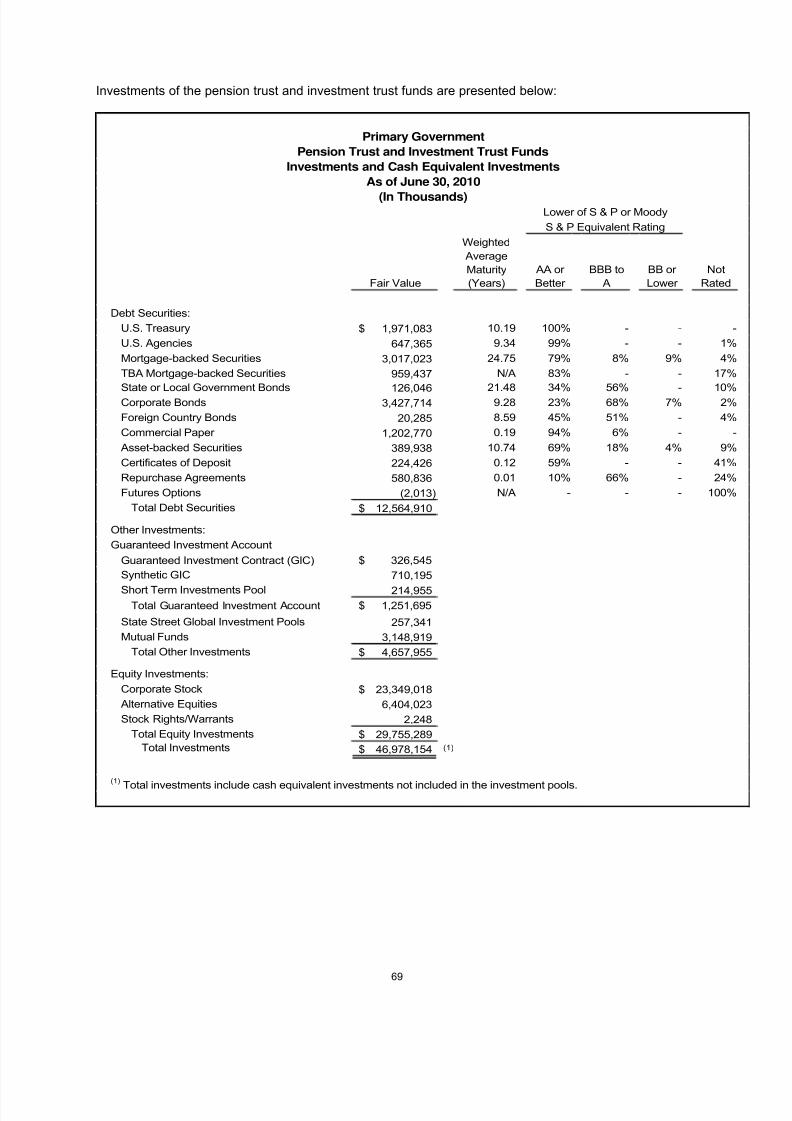
8/6/2019 2010 CAFR Minnesota
http://slidepdf.com/reader/full/2010-cafr-minnesota 85/265
Investments of the pension trust and investment trust funds are presented below:
Fair Value
Weighted
Average
Maturity
(Years)
AA or
Better
BBB to
A
BB or
Lower
Not
Rated
Debt Securities:
U.S. Treasury 1,971,083$ 10.19 100% - - -
U.S. Agencies 647,365 9.34 99% - - 1%
Mortgage-backed Securities 3,017,023 24.75 79% 8% 9% 4%
TBA Mortgage-backed Securities 959,437 N/A 83% - - 17%
State or Local Government Bonds 126,046 21.48 34% 56% - 10%Corporate Bonds 3,427,714 9.28 23% 68% 7% 2%
Foreign Country Bonds 20,285 8.59 45% 51% - 4%
Commercial Paper 1,202,770 0.19 94% 6% - -
Asset-backed Securities 389,938 10.74 69% 18% 4% 9%
Certificates of Deposit 224,426 0.12 59% - - 41%
Repurchase Agreements 580,836 0.01 10% 66% - 24%
Futures Options (2,013) N/A - - - 100%
Total Debt Securities 12,564,910$
Other Investments:
Guaranteed Investment Account
Guaranteed Investment Contract (GIC) 326,545$
Synthetic GIC 710,195
Short Term Investments Pool 214,955 Total Guaranteed Investment Account 1,251,695$
State Street Global Investment Pools 257,341
Mutual Funds 3,148,919
Total Other Investments 4,657,955$
Equity Investments:
Corporate Stock 23,349,018$
Alternative Equities 6,404,023
Stock Rights/Warrants 2,248
Total Equity Investments 29,755,289$
Total Investments 46,978,154$ (1)
Lower of S & P or Moody
S & P Equivalent Rating
(1)
Total investments include cash equivalent investments not included in the investment pools.
Primary Government
Pension Trust and Investment Trust Funds
As of June 30, 2010
(In Thousands)
Investments and Cash Equivalent Investments
69
8/6/2019 2010 CAFR Minnesota
http://slidepdf.com/reader/full/2010-cafr-minnesota 86/265
Concentration of Credit Risk – Investments
Concentration of credit risk is the risk of loss attributed to the magnitude of a government‟s investment in asingle issuer. The state does not have a formal policy regarding concentration of credit risk for ratedcorporate debt securities that are among the top four quality categories. For other types of investments,Minnesota Statutes, Section 11A.24, established the following parameters:
Unrated Corporate Obligations
Aggregate value may not exceed 5 percent of the market or book value, whichever is less, of the fundbeing invested.
SBI‟s participation is limited to 50 percent of a single offering.
SBI‟s participation is limited to 25 percent of the issuer‟s unrated obligations.
Corporate Stock
Aggregate value of corporate stock may not exceed 85 percent of the market or book value, whichever is less, of a fund.
Generally, investment in corporate stock may not exceed five percent of the total outstanding shares of any one corporation.
The state did not have concentration of credit risk over 5% as of June 30, 2010.
Foreign Currency Risk – Investments
Foreign currency risk is the risk that changes in currency exchange rates will adversely affect the fair valueof an investment or a deposit. SBI has established guidelines to be used by investment managers for international investing. Under these guidelines, countries are categorized based on a country‟s legalstructures and standings regarding worker and human rights issues. Managers may invest in countrieswith legal structures that generally respect the rights of workers and human rights without additional
notification of SBI. Investment managers who wish to invest in other countries must either notify SBI inwriting or appear before SBI, depending on the country involved. Managers with authority to invest inforeign securities are given authority to hedge foreign currency through forward contracts to avoid currencylosses.
The primary government, excluding pension trust and investment trust funds, had no exposure to foreigncurrency risk as of June 30, 2010.
70
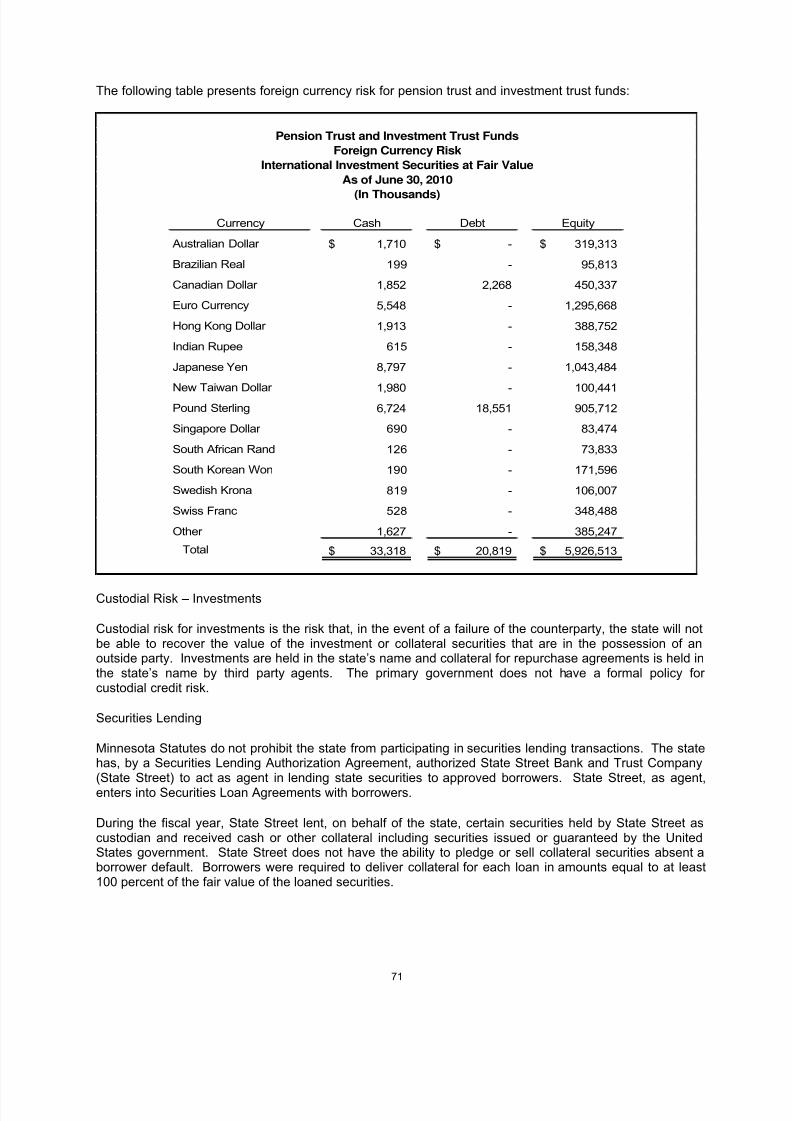
8/6/2019 2010 CAFR Minnesota
http://slidepdf.com/reader/full/2010-cafr-minnesota 87/265
The following table presents foreign currency risk for pension trust and investment trust funds:
Currency Cash Debt Equity
Australian Dollar 1,710$ -$ 319,313$
Brazilian Real 199 - 95,813
Canadian Dollar 1,852 2,268 450,337
Euro Currency 5,548 - 1,295,668
Hong Kong Dollar 1,913 - 388,752
Indian Rupee 615 - 158,348
Japanese Yen 8,797 - 1,043,484
New Taiwan Dollar 1,980 - 100,441 Pound Sterling 6,724 18,551 905,712
Singapore Dollar 690 - 83,474
South African Rand 126 - 73,833
South Korean Won 190 - 171,596
Swedish Krona 819 - 106,007
Swiss Franc 528 - 348,488
Other 1,627 - 385,247
Total 33,318$ 20,819$ 5,926,513$
Pension Trust and Investment Trust Funds
Foreign Currency Risk
International Investment Securities at Fair Value
As of June 30, 2010
(In Thousands)
Custodial Risk – Investments
Custodial risk for investments is the risk that, in the event of a failure of the counterparty, the state will notbe able to recover the value of the investment or collateral securities that are in the possession of anoutside party. Investments are held in the state‟s name and collateral for repurchase agreements is held inthe state‟s name by third party agents. The primary government does not have a formal policy for custodial credit risk.
Securities Lending
Minnesota Statutes do not prohibit the state from participating in securities lending transactions. The statehas, by a Securities Lending Authorization Agreement, authorized State Street Bank and Trust Company(State Street) to act as agent in lending state securities to approved borrowers. State Street, as agent,enters into Securities Loan Agreements with borrowers.
During the fiscal year, State Street lent, on behalf of the state, certain securities held by State Street ascustodian and received cash or other collateral including securities issued or guaranteed by the UnitedStates government. State Street does not have the ability to pledge or sell collateral securities absent aborrower default. Borrowers were required to deliver collateral for each loan in amounts equal to at least100 percent of the fair value of the loaned securities.
71
8/6/2019 2010 CAFR Minnesota
http://slidepdf.com/reader/full/2010-cafr-minnesota 88/265
Pursuant to the Securities Lending Authorization Agreement, State Street had an obligation to indemnifythe state in the event of default by a borrower. No borrower failed to return loaned securities or paydistributions thereon during the fiscal year that resulted in a declaration or notice of default.
During the fiscal year, the state and the borrowers maintained the right to terminate securities lendingtransactions upon notice. The cash collateral received on each loan, together with the cash collateral of other qualified tax-exempt plan lenders, was invested in a collective investment pool. As of June 30, 2010,
such investment had an average duration of 8.03 days and an average weighted maturity of 43.2 days for USD collateral.
Because the loans were terminable at will, their duration did not generally match the duration of theinvestments made with cash collateral. On June 30, 2010, the state had no credit risk exposure toborrowers because the amounts the state owed the borrowers exceeded the amounts the borrowers owedthe state.
The fair value of collateral held and the fair value of securities on loan for the state as of June 30, 2010,were $3,845,017,000 and $3,720,274,000 respectively. Some component units that are allocated aportion of the collateral have a December 31 year end.
Component Units
Metropolitan Council and University of Minnesota (major component units) were engaged in separatesecurities lending programs during the calendar year and fiscal year, respectively. Their separately-issuedfinancial statements disclose the facts regarding those programs. Neither of these component units had acredit risk at year-end.
Housing Finance Agency
As of June 30, 2010, Housing Finance Agency (HFA) had $1,403,723,000 of cash, cash equivalents, andinvestments. As of June 30, 2010, $475,564,000 of deposits and $802,982,000 of investment securitieswere subject to custodial credit risk. HFA investments have weighted average maturities ranging fromunder one month (certificates of deposit) to 2.6 – 24.1 years (U.S. Agencies).
HFA cash equivalents included $171,142,000 of investment agreements, which are generallyuncollateralized interest-bearing contracts. As of June 30, 2010, most investment agreement providershad a Standard & Poor‟s long-term credit rating of „A- or higher ‟ and a Moody‟s Investors Service long-termcredit rating of „A3 or higher .‟ The individual investment agreements were unrated. Substantially all of theagreements contain termination clauses so that HFA may withdraw funds early if credit ratings deterioratebelow specified levels and remedial action is not taken.
HFA investments had an estimated fair market value of $757,017,000 as of June 30, 2010. Included inthese investments were $10,683,000 in U. S. Treasuries (not rated), plus $332,355,000 in Certificates of Deposit and $366,221,000 in U.S. Agencies having a Standard & Poor‟s rating of „AAA‟ and Moody‟sInvestors Services rating of „Aaa‟. An additional $36,970,000 in municipal debt investments had aStandard & Poor‟s rating of „AA‟ and Moody‟s Investors Services rating of „Aa‟.
HFA had investments in single issuers as of June 30, 2010, excluding investments issued or explicitlyguaranteed by the U.S. Government, that were five percent or more of total investments. Theseinvestments amounted to $593,446,000 and involved Federal Home Loan Banks and Federal NationalMortgage Association.
HFA has entered into interest rate swap agreements to hedge its issuance of variable rate mortgagerevenue bonds for the objective of reducing HFA‟s cost of capital compared to using long -term fixed ratebonds. These interest rate swap agreements have been determined to be effective hedges by HFA‟sconsultant and are reported at fair value as of June 30, 2010, as Interest Rate Swap Agreementsnoncurrent liability. The change in fair value for fiscal year 2010 is reported in Deferred Loss on InterestRate Swap Agreements noncurrent asset.
72
8/6/2019 2010 CAFR Minnesota
http://slidepdf.com/reader/full/2010-cafr-minnesota 89/265
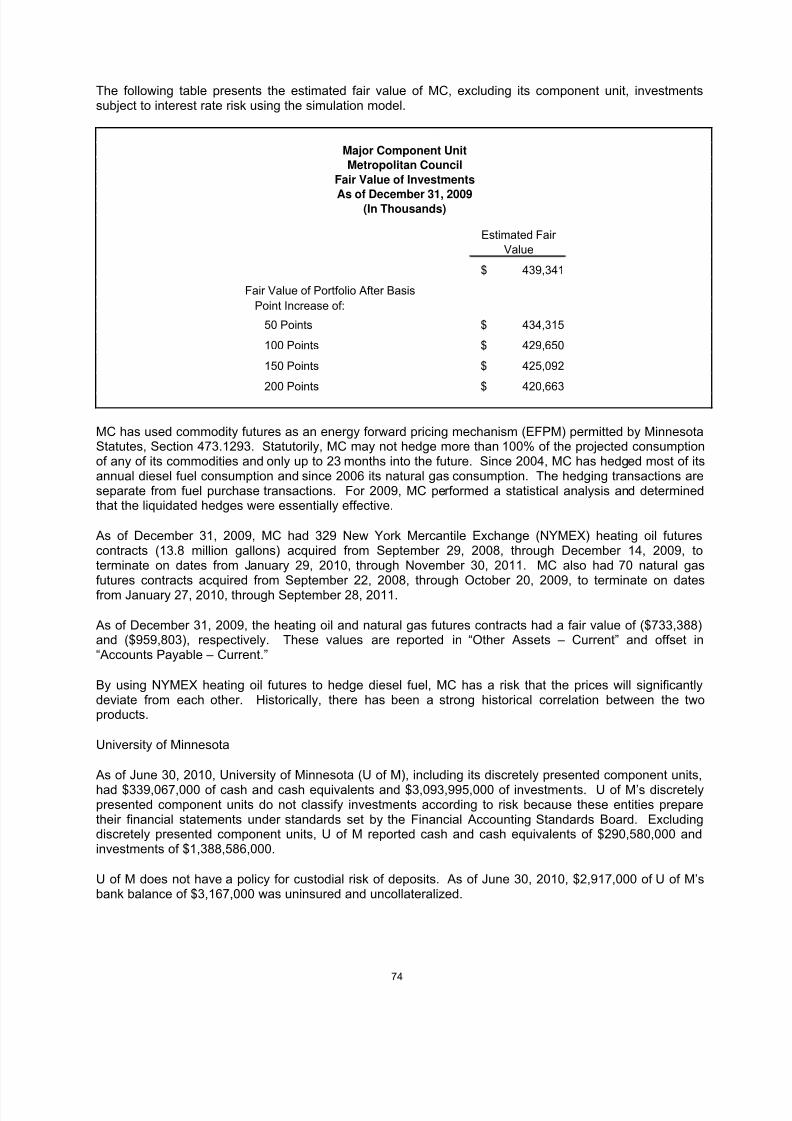
8/6/2019 2010 CAFR Minnesota
http://slidepdf.com/reader/full/2010-cafr-minnesota 90/265
The following table presents the estimated fair value of MC, excluding its component unit, investmentssubject to interest rate risk using the simulation model.
Estimated Fair
Value
$ 439,341
Fair Value of Portfolio After Basis
Point Increase of:
50 Points $ 434,315
100 Points $ 429,650
150 Points $ 425,092
200 Points $ 420,663
Major Component Unit
Metropolitan Council
Fair Value of Investments
(In Thousands)As of December 31, 2009
MC has used commodity futures as an energy forward pricing mechanism (EFPM) permitted by MinnesotaStatutes, Section 473.1293. Statutorily, MC may not hedge more than 100% of the projected consumptionof any of its commodities and only up to 23 months into the future. Since 2004, MC has hedged most of itsannual diesel fuel consumption and since 2006 its natural gas consumption. The hedging transactions areseparate from fuel purchase transactions. For 2009, MC performed a statistical analysis and determinedthat the liquidated hedges were essentially effective.
As of December 31, 2009, MC had 329 New York Mercantile Exchange (NYMEX) heating oil futurescontracts (13.8 million gallons) acquired from September 29, 2008, through December 14, 2009, toterminate on dates from January 29, 2010, through November 30, 2011. MC also had 70 natural gasfutures contracts acquired from September 22, 2008, through October 20, 2009, to terminate on datesfrom January 27, 2010, through September 28, 2011.
As of December 31, 2009, the heating oil and natural gas futures contracts had a fair value of ($733,388)and ($959,803), respectively. These values are reported in “Other Assets – Current” and offset in“Accounts Payable – Current.”
By using NYMEX heating oil futures to hedge diesel fuel, MC has a risk that the prices will significantlydeviate from each other. Historically, there has been a strong historical correlation between the twoproducts.
University of Minnesota
As of June 30, 2010, University of Minnesota (U of M), including its discretely presented component units,
had $339,067,000 of cash and cash equivalents and $3,093,995,000 of investments. U of M‟s discretelypresented component units do not classify investments according to risk because these entities preparetheir financial statements under standards set by the Financial Accounting Standards Board. Excludingdiscretely presented component units, U of M reported cash and cash equivalents of $290,580,000 andinvestments of $1,388,586,000.
U of M does not have a policy for custodial risk of deposits. As of June 30, 2010, $2,917,000 of U of M‟sbank balance of $3,167,000 was uninsured and uncollateralized.
74
8/6/2019 2010 CAFR Minnesota
http://slidepdf.com/reader/full/2010-cafr-minnesota 91/265
U of M maintains centralized management for substantially all of its cash and investments. The Board of Regents establishes U of M‟s investment policies and objectives. U of M uses internal investment poolsdesigned to maximize investment return within established risk parameters for each pool.
U of M has established policies to address the various types of investment risks. U of M uses Standard &Poor‟s ratings and duration as a measure of a debt investment‟s exposure to fair value changes arisingfrom changing interest rates. As of June 30, 2010, $695,948,000 of investment in securities was subject to
quality rating and interest rate risk. This amount was rated as follows:
$684,486,000 was rated AAA
$10,101,000 was rated BBB
$1,361,000 was not rated
The securities subject to interest rate risk were comprised of:
$365,591,000 in government agencies with an average duration of 1.95 years
$10,101,000 in corporate bonds with an average duration of 0.99 years
$25,215,000 in mortgage backed securities with an average duration of 2.33 years
$275,555,000 in cash and cash equivalents with an average duration of 0.04 year
$19,486,000 in other types of securities (primarily mutual funds) with an average duration of 0.73years
As of June 30, 2010, U of M had $40,862,000 of equity investments subject to foreign currency risk. Thethree largest components of this amount are $5,284,000 in Japanese Yen; $17,471,000 in Euro Currency;and $2,683,000 in Pound Sterling.
U of M has entered into six separate pay-fixed, receive-variable interest rate swaps to hedge against the
variability of cash flows for budgeting purposes.
Upon implementation of GASB 53, three of the contracts were determined to be ineffective hedges andwere terminated effective November 1, 2009, in a restructuring that modified the fixed pay rate and thevariable pay reference rates. Termination of the ineffective contracts resulted in retirement of long-termdebt of $18,479,000 and recognition of new long-term debt of $13,960,000 for a net gain of $4,519,000.
The three contracts with the new terms are effective hedges with a total notional amount of $301,150,000and total fair value of ($9,749,000) at June 30, 2010. U of M‟s exposure to credit risk is measured by thefair value. The contracts have terms requiring the counter parties to post collateral if the fair value reachesa minimum threshold. These counterparties are rated „Aa3,‟ „Aa1,‟ and „A1‟ by Moody‟s Investors Service.
The U of M is exposed to interest rate risk, termination risk (upon default of the other party), and basis risk.
The other three swaps are considered ineffective. At June 30, 2010, their total a fair value was($20,840,000) and changes in fair value were reported as investment income.
75
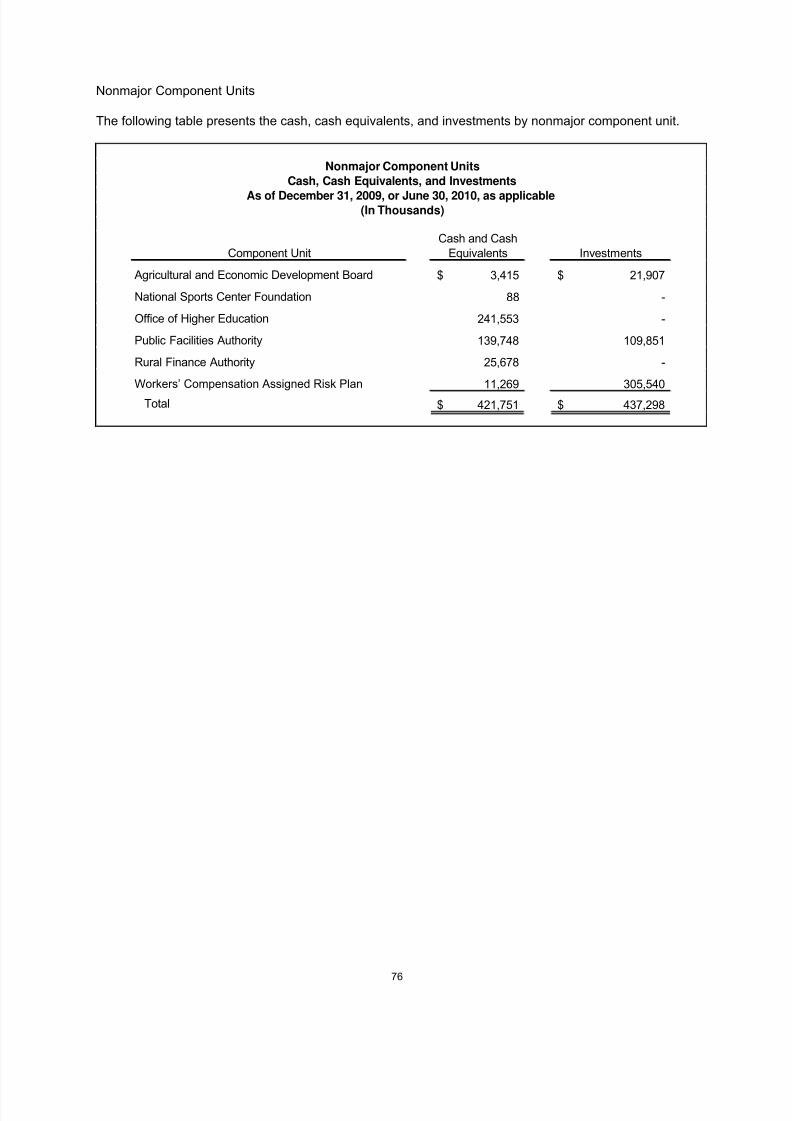
8/6/2019 2010 CAFR Minnesota
http://slidepdf.com/reader/full/2010-cafr-minnesota 92/265
Nonmajor Component Units
The following table presents the cash, cash equivalents, and investments by nonmajor component unit.
Component UnitCash and Cash
Equivalents Investments
Agricultural and Economic Development Board 3,415$ 21,907$
National Sports Center Foundation 88 -
Office of Higher Education 241,553 -
Public Facilities Authority 139,748 109,851
Rural Finance Authority 25,678 -
Workers‟ Compensation Assigned Risk Plan 11,269 305,540
Total 421,751$ 437,298$
Nonmajor Component Units
Cash, Cash Equivalents, and Investments
As of December 31, 2009, or June 30, 2010, as applicable(In Thousands)
76
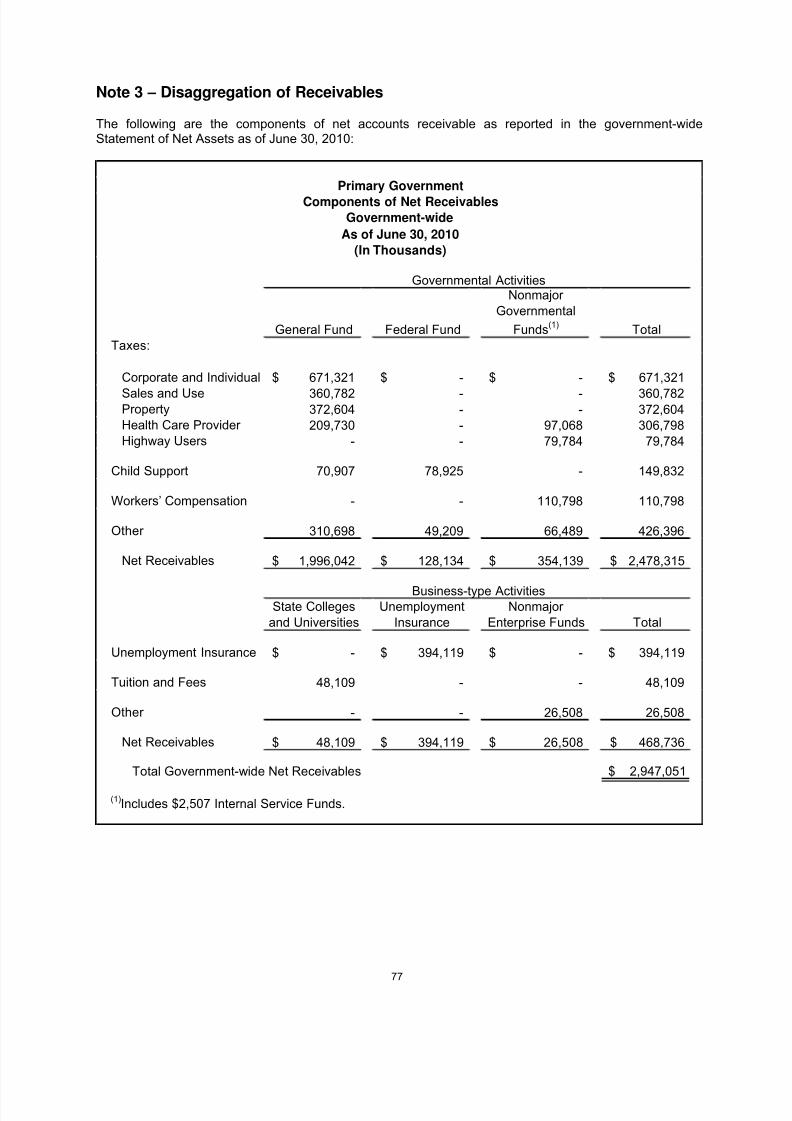
8/6/2019 2010 CAFR Minnesota
http://slidepdf.com/reader/full/2010-cafr-minnesota 93/265
Note 3 – Disaggregation of Receivables
The following are the components of net accounts receivable as reported in the government-wideStatement of Net Assets as of June 30, 2010:
General Fund Federal Fund
Nonmajor Governmental
Funds(1) TotalTaxes:
Corporate and Individual 671,321$ -$ -$ 671,321$
Sales and Use 360,782 - - 360,782 Property 372,604 - - 372,604 Health Care Provider 209,730 - 97,068 306,798 Highway Users - - 79,784 79,784
Child Support 70,907 78,925 - 149,832
Workers‟ Compensation - - 110,798 110,798
Other 310,698 49,209 66,489 426,396
Net Receivables 1,996,042$ 128,134$ 354,139$ 2,478,315$
State Collegesand Universities
UnemploymentInsurance
Nonmajor Enterprise Funds Total
Unemployment Insurance -$ 394,119$ -$ 394,119$
Tuition and Fees 48,109 - - 48,109
Other - - 26,508 26,508
Net Receivables 48,109$ 394,119$ 26,508$ 468,736$
Total Government-wide Net Receivables 2,947,051$
Components of Net Receivables
As of June 30, 2010
(In Thousands)
Primary Government
Government-wide
(1)Includes $2,507 Internal Service Funds.
Governmental Activities
Business-type Activities
77
8/6/2019 2010 CAFR Minnesota
http://slidepdf.com/reader/full/2010-cafr-minnesota 94/265
Accounts receivable are reported net of allowances for uncollectible amounts. Significant uncollectibleamounts are:
Corporate and Individual Taxes $149,986,000
Sales and Use Taxes $47,844,000
Child Support $309,141,000
Other Receivables $50,976,000
Significant receivable balances not expected to be collected within one year are:
Corporate and Individual Taxes $117,816,000
Sales and Use Taxes $53,919,000
Child Support $142,668,000
Health Care Provider $89,374,000
Other Receivables $17,490,000
78
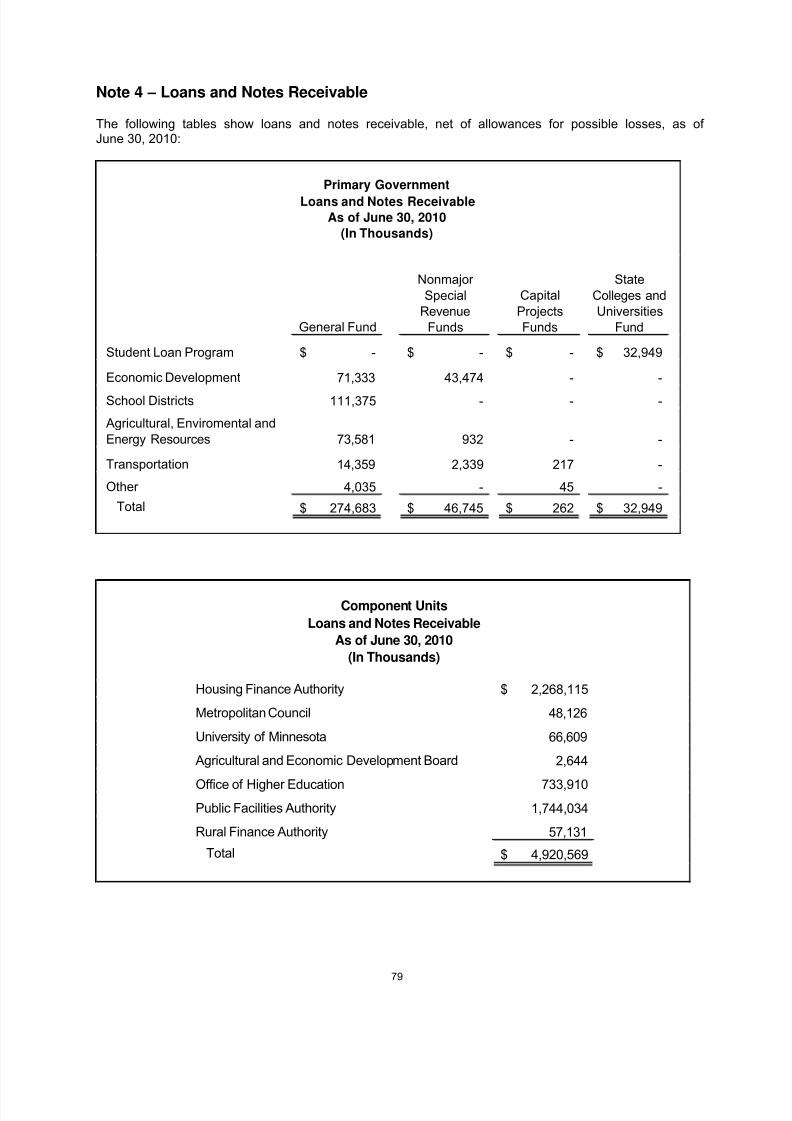
8/6/2019 2010 CAFR Minnesota
http://slidepdf.com/reader/full/2010-cafr-minnesota 95/265
Note 4 – Loans and Notes Receivable
The following tables show loans and notes receivable, net of allowances for possible losses, as of June 30, 2010:
General Fund
Nonmajor Special
RevenueFunds
CapitalProjectsFunds
StateColleges andUniversities
Fund
Student Loan Program -$ -$ -$ 32,949$
Economic Development 71,333 43,474 - -
School Districts 111,375 - - -
Agricultural, Enviromental andEnergy Resources 73,581 932 - -
Transportation 14,359 2,339 217 -
Other 4,035 - 45 -
Total 274,683$ 46,745$ 262$ 32,949$
Primary Government
Loans and Notes Receivable
As of June 30, 2010
(In Thousands)
Housing Finance Authority 2,268,115$
Metropolitan Council 48,126
University of Minnesota 66,609
Agricultural and Economic Development Board 2,644
Office of Higher Education 733,910 Public Facilities Authority 1,744,034
Rural Finance Authority 57,131
Total 4,920,569$
Component Units
Loans and Notes Receivable
As of June 30, 2010
(In Thousands)
79
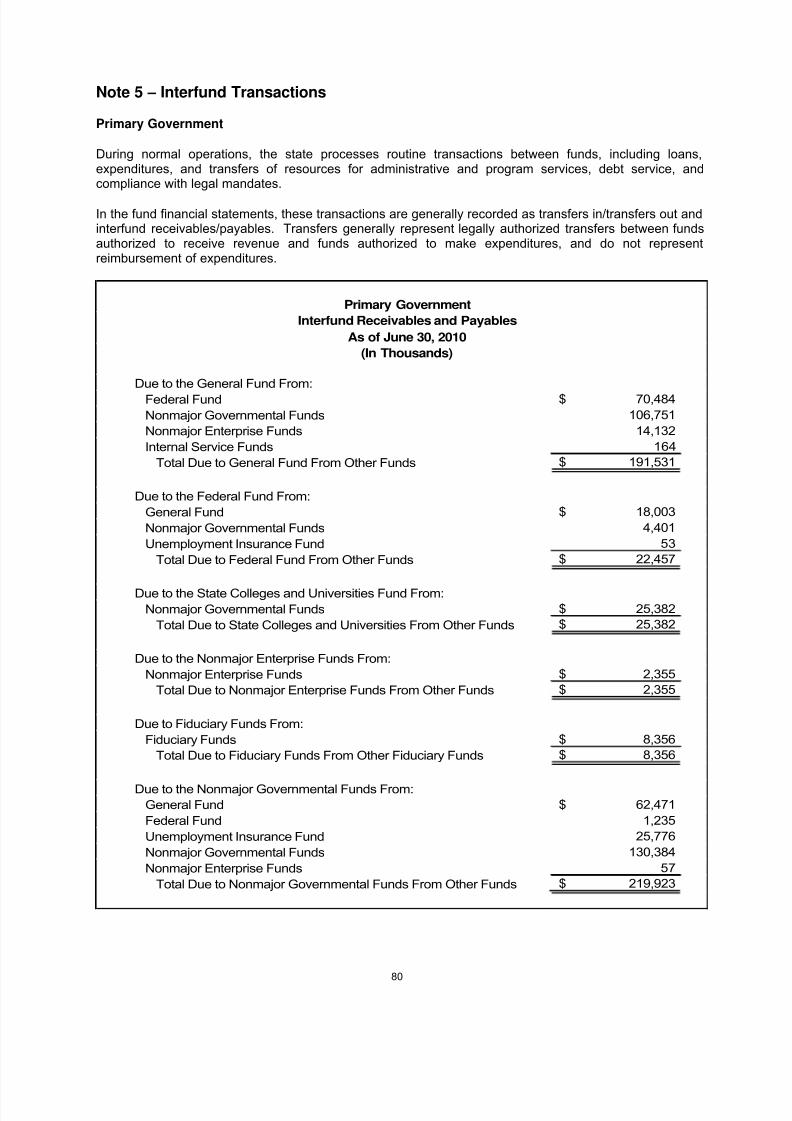
8/6/2019 2010 CAFR Minnesota
http://slidepdf.com/reader/full/2010-cafr-minnesota 96/265
Note 5 – Interfund Transactions
Primary Government
During normal operations, the state processes routine transactions between funds, including loans,expenditures, and transfers of resources for administrative and program services, debt service, andcompliance with legal mandates.
In the fund financial statements, these transactions are generally recorded as transfers in/transfers out andinterfund receivables/payables. Transfers generally represent legally authorized transfers between fundsauthorized to receive revenue and funds authorized to make expenditures, and do not representreimbursement of expenditures.
Due to the General Fund From:
Federal Fund 70,484$
Nonmajor Governmental Funds 106,751
Nonmajor Enterprise Funds 14,132
Internal Service Funds 164
Total Due to General Fund From Other Funds 191,531$
Due to the Federal Fund From:
General Fund 18,003$
Nonmajor Governmental Funds 4,401
Unemployment Insurance Fund 53
Total Due to Federal Fund From Other Funds 22,457$
Due to the State Colleges and Universities Fund From:Nonmajor Governmental Funds 25,382$
Total Due to State Colleges and Universities From Other Funds 25,382$
Due to the Nonmajor Enterprise Funds From:
Nonmajor Enterprise Funds 2,355$
Total Due to Nonmajor Enterprise Funds From Other Funds 2,355$
Due to Fiduciary Funds From:
Fiduciary Funds 8,356$
Total Due to Fiduciary Funds From Other Fiduciary Funds 8,356$
Due to the Nonmajor Governmental Funds From:General Fund 62,471$
Federal Fund 1,235
Unemployment Insurance Fund 25,776
Nonmajor Governmental Funds 130,384
Nonmajor Enterprise Funds 57
Total Due to Nonmajor Governmental Funds From Other Funds 219,923$
Interfund Receivables and Payables
As of June 30, 2010
(In Thousands)
Primary Government
80
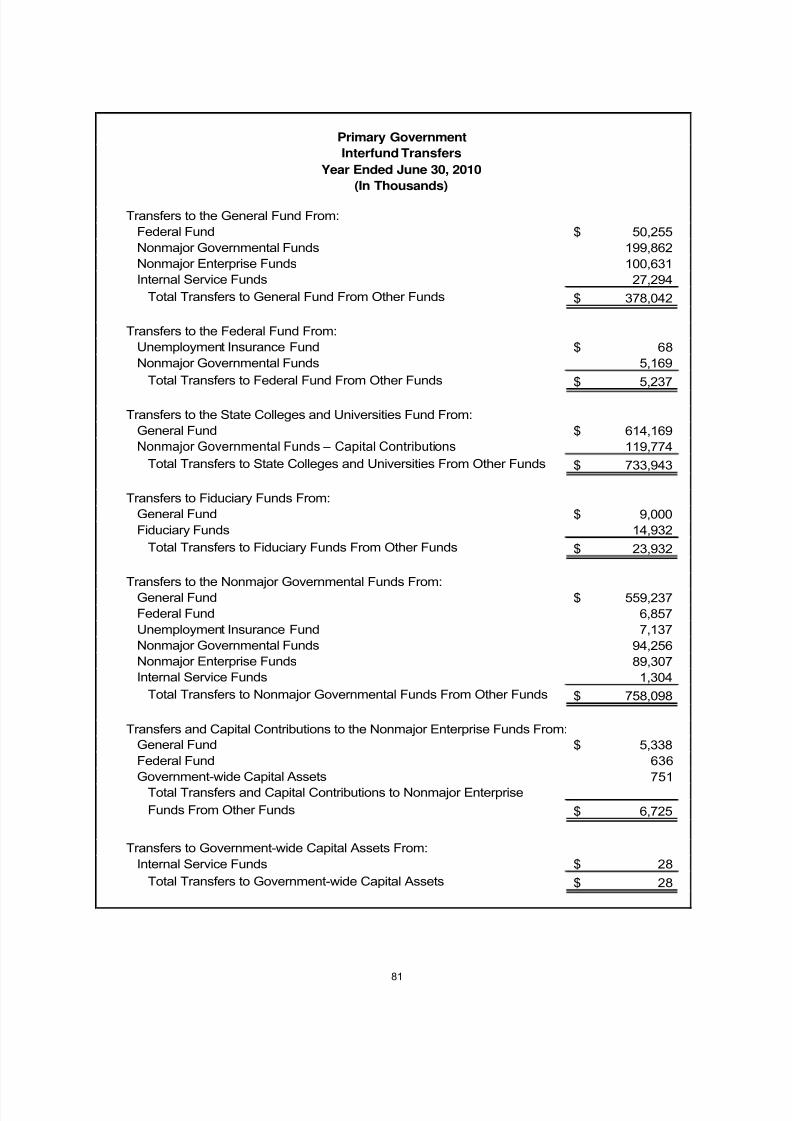
8/6/2019 2010 CAFR Minnesota
http://slidepdf.com/reader/full/2010-cafr-minnesota 97/265
Transfers to the General Fund From:
Federal Fund 50,255$
Nonmajor Governmental Funds 199,862
Nonmajor Enterprise Funds 100,631
Internal Service Funds 27,294
Total Transfers to General Fund From Other Funds 378,042$
Transfers to the Federal Fund From:
Unemployment Insurance Fund 68$
Nonmajor Governmental Funds 5,169
Total Transfers to Federal Fund From Other Funds 5,237$
Transfers to the State Colleges and Universities Fund From:
General Fund 614,169$
Nonmajor Governmental Funds – Capital Contributions 119,774
Total Transfers to State Colleges and Universities From Other Funds 733,943$
Transfers to Fiduciary Funds From:
General Fund 9,000$
Fiduciary Funds 14,932
Total Transfers to Fiduciary Funds From Other Funds 23,932$
Transfers to the Nonmajor Governmental Funds From:
General Fund 559,237$
Federal Fund 6,857
Unemployment Insurance Fund 7,137
Nonmajor Governmental Funds 94,256
Nonmajor Enterprise Funds 89,307
Internal Service Funds 1,304
Total Transfers to Nonmajor Governmental Funds From Other Funds 758,098$
Transfers and Capital Contributions to the Nonmajor Enterprise Funds From:
General Fund 5,338$
Federal Fund 636
Government-wide Capital Assets 751
Total Transfers and Capital Contributions to Nonmajor Enterprise
Funds From Other Funds 6,725$
Transfers to Government-wide Capital Assets From:
Internal Service Funds 28$
Total Transfers to Government-wide Capital Assets 28$
Interfund Transfers
Year Ended June 30, 2010
(In Thousands)
Primary Government
81
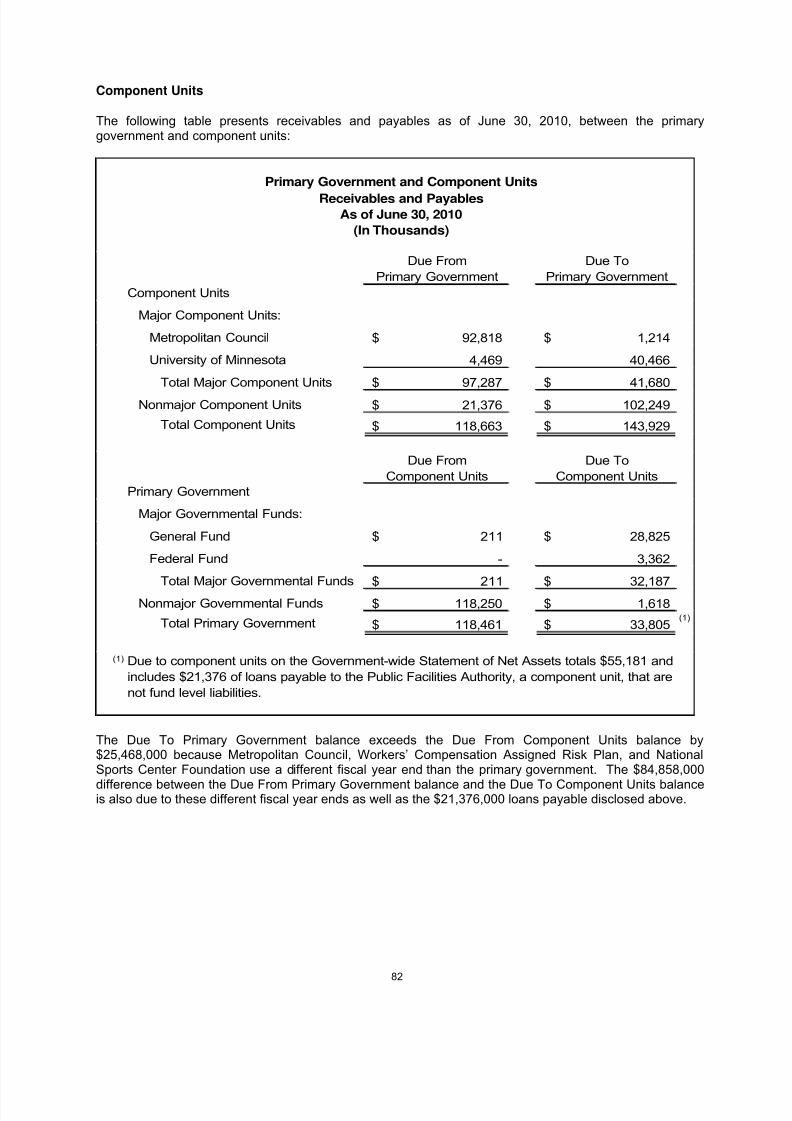
8/6/2019 2010 CAFR Minnesota
http://slidepdf.com/reader/full/2010-cafr-minnesota 98/265
Component Units
The following table presents receivables and payables as of June 30, 2010, between the primarygovernment and component units:
Due From
Primary Government
Due To
Primary Government
Component Units
Major Component Units:
Metropolitan Council 92,818$ 1,214$
University of Minnesota 4,469 40,466
Total Major Component Units 97,287$ 41,680$
Nonmajor Component Units 21,376$ 102,249$
Total Component Units 118,663$ 143,929$
Due From
Component Units
Due To
Component UnitsPrimary Government
Major Governmental Funds:
General Fund 211$ 28,825$
Federal Fund - 3,362
Total Major Governmental Funds 211$ 32,187$
Nonmajor Governmental Funds 118,250$ 1,618$
Total Primary Government 118,461$ 33,805$(1)
(1) Due to component units on the Government-wide Statement of Net Assets totals $55,181 and
includes $21,376 of loans payable to the Public Facilities Authority, a component unit, that are
not fund level liabilities.
Primary Government and Component Units
Receivables and PayablesAs of June 30, 2010
(In Thousands)
The Due To Primary Government balance exceeds the Due From Component Units balance by$25,468,000 because Metropolitan Council, Workers‟ Compensation Assigned Risk Plan, and NationalSports Center Foundation use a different fiscal year end than the primary government. The $84,858,000
difference between the Due From Primary Government balance and the Due To Component Units balanceis also due to these different fiscal year ends as well as the $21,376,000 loans payable disclosed above.
82
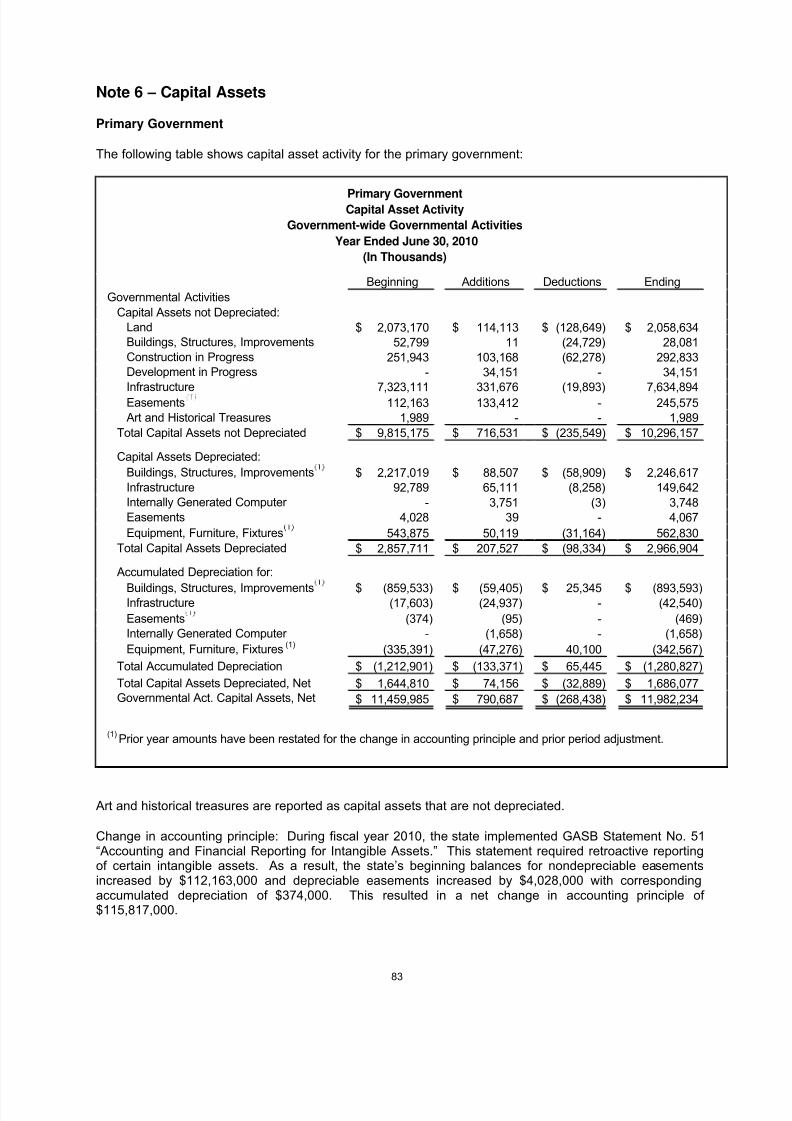
8/6/2019 2010 CAFR Minnesota
http://slidepdf.com/reader/full/2010-cafr-minnesota 99/265
Note 6 – Capital Assets
Primary Government
The following table shows capital asset activity for the primary government:
Beginning Additions Deductions Ending
Governmental Activities
Capital Assets not Depreciated:Land 2,073,170$ 114,113$ (128,649)$ 2,058,634$Buildings, Structures, Improvements 52,799 11 (24,729) 28,081 Construction in Progress 251,943 103,168 (62,278) 292,833 Development in Progress - 34,151 - 34,151
Infrastructure 7,323,111 331,676 (19,893) 7,634,894 Easements 112,163 133,412 - 245,575 Art and Historical Treasures 1,989 - - 1,989
Total Capital Assets not Depreciated 9,815,175$ 716,531$ (235,549)$ 10,296,157$
Capital Assets Depreciated:
Buildings, Structures, Improvements 2,217,019$ 88,507$ (58,909)$ 2,246,617$
Infrastructure 92,789 65,111 (8,258) 149,642 Internally Generated Computer - 3,751 (3) 3,748 Easements 4,028 39 - 4,067
Equipment, Furniture, Fixtures 543,875 50,119 (31,164) 562,830
Total Capital Assets Depreciated 2,857,711$ 207,527$ (98,334)$ 2,966,904$
Accumulated Depreciation for:
Buildings, Structures, Improvements
(859,533)$ (59,405)$ 25,345$ (893,593)$Infrastructure (17,603) (24,937) - (42,540)
Easements
(374) (95) - (469) Internally Generated Computer - (1,658) - (1,658)
Equipment, Furniture, Fixtures (1)(335,391) (47,276) 40,100 (342,567)
Total Accumulated Depreciation (1,212,901)$ (133,371)$ 65,445$ (1,280,827)$
Total Capital Assets Depreciated, Net 1,644,810$ 74,156$ (32,889)$ 1,686,077$Governmental Act. Capital Assets, Net 11,459,985$ 790,687$ (268,438)$ 11,982,234$
(1)Prior year amounts have been restated for the change in accounting principle and prior period adjustment.
Primary GovernmentCapital Asset Activity
Government-wide Governmental Activities
Year Ended June 30, 2010
(In Thousands)
Art and historical treasures are reported as capital assets that are not depreciated.
Change in accounting principle: During fiscal year 2010, the state implemented GASB Statement No. 51“Accounting and Financial Reporting for Intangible Assets.” This statement required retroactive reportingof certain intangible assets. As a result, the state‟s beginning balances for nondepreciable easementsincreased by $112,163,000 and depreciable easements increased by $4,028,000 with correspondingaccumulated depreciation of $374,000. This resulted in a net change in accounting principle of $115,817,000.
83
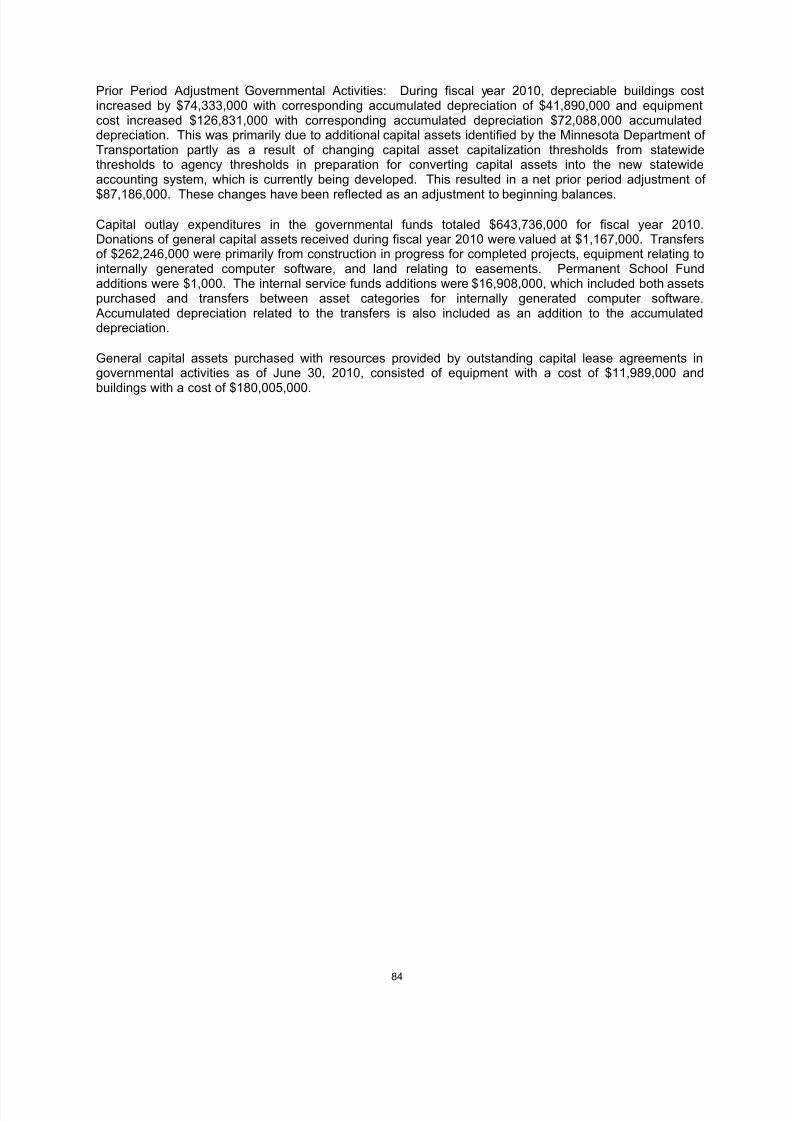
8/6/2019 2010 CAFR Minnesota
http://slidepdf.com/reader/full/2010-cafr-minnesota 100/265
Prior Period Adjustment Governmental Activities: During fiscal year 2010, depreciable buildings costincreased by $74,333,000 with corresponding accumulated depreciation of $41,890,000 and equipmentcost increased $126,831,000 with corresponding accumulated depreciation $72,088,000 accumulateddepreciation. This was primarily due to additional capital assets identified by the Minnesota Department of Transportation partly as a result of changing capital asset capitalization thresholds from statewidethresholds to agency thresholds in preparation for converting capital assets into the new statewideaccounting system, which is currently being developed. This resulted in a net prior period adjustment of
$87,186,000. These changes have been reflected as an adjustment to beginning balances.
Capital outlay expenditures in the governmental funds totaled $643,736,000 for fiscal year 2010.Donations of general capital assets received during fiscal year 2010 were valued at $1,167,000. Transfersof $262,246,000 were primarily from construction in progress for completed projects, equipment relating tointernally generated computer software, and land relating to easements. Permanent School Fundadditions were $1,000. The internal service funds additions were $16,908,000, which included both assetspurchased and transfers between asset categories for internally generated computer software.Accumulated depreciation related to the transfers is also included as an addition to the accumulateddepreciation.
General capital assets purchased with resources provided by outstanding capital lease agreements ingovernmental activities as of June 30, 2010, consisted of equipment with a cost of $11,989,000 and
buildings with a cost of $180,005,000.
84
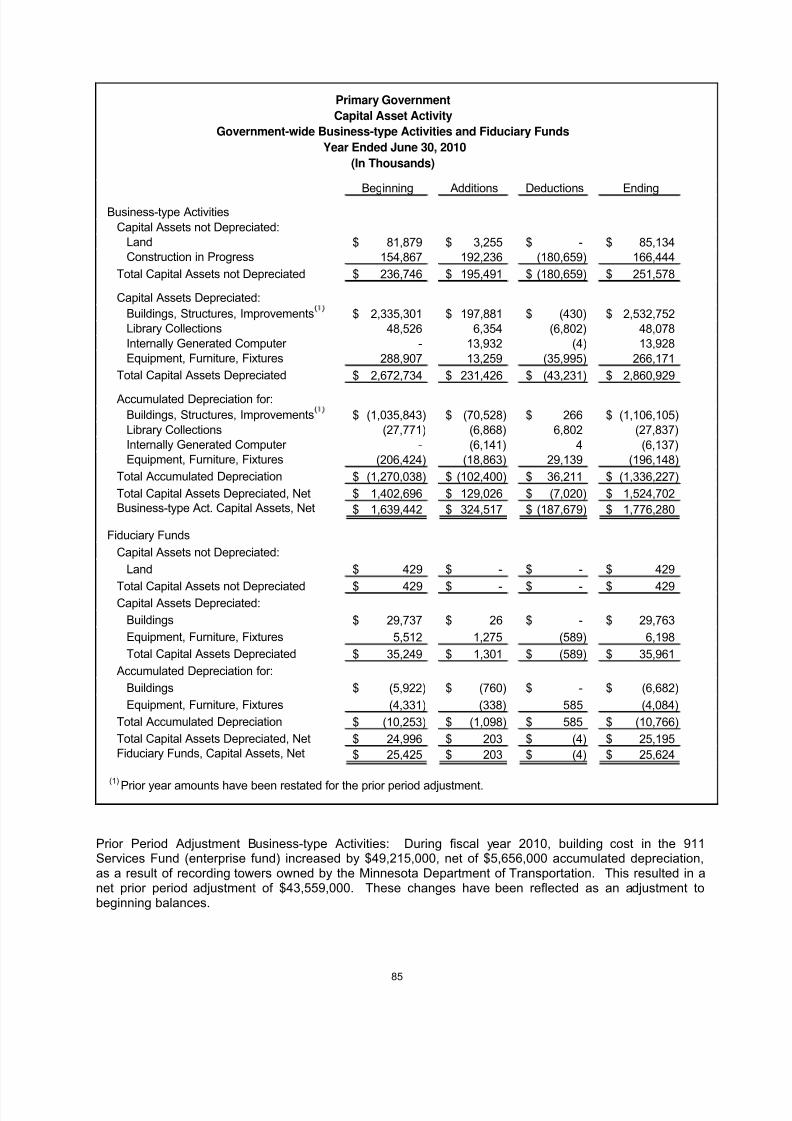
8/6/2019 2010 CAFR Minnesota
http://slidepdf.com/reader/full/2010-cafr-minnesota 101/265
Beginning Additions Deductions Ending
Business-type Activities
Capital Assets not Depreciated:Land 81,879$ 3,255$ -$ 85,134$Construction in Progress 154,867 192,236 (180,659) 166,444
Total Capital Assets not Depreciated 236,746$ 195,491$ (180,659)$ 251,578$
Capital Assets Depreciated:
Buildings, Structures, Improvements 2,335,301$ 197,881$ (430)$ 2,532,752$
Library Collections 48,526 6,354 (6,802) 48,078 Internally Generated Computer - 13,932 (4) 13,928 Equipment, Furniture, Fixtures 288,907 13,259 (35,995) 266,171
Total Capital Assets Depreciated 2,672,734$ 231,426$ (43,231)$ 2,860,929$
Accumulated Depreciation for:
Buildings, Structures, Improvements (1,035,843)$ (70,528)$ 266$ (1,106,105)$
Library Collections (27,771) (6,868) 6,802 (27,837) Internally Generated Computer - (6,141) 4 (6,137) Equipment, Furniture, Fixtures (206,424) (18,863) 29,139 (196,148)
Total Accumulated Depreciation (1,270,038)$ (102,400)$ 36,211$ (1,336,227)$
Total Capital Assets Depreciated, Net 1,402,696$ 129,026$ (7,020)$ 1,524,702$Business-type Act. Capital Assets, Net 1,639,442$ 324,517$ (187,679)$ 1,776,280$
Fiduciary Funds
Capital Assets not Depreciated:
Land 429$ -$ -$ 429$
Total Capital Assets not Depreciated 429$ -$ -$ 429$Capital Assets Depreciated:
Buildings 29,737$ 26$ -$ 29,763$
Equipment, Furniture, Fixtures 5,512 1,275 (589) 6,198
Total Capital Assets Depreciated 35,249$ 1,301$ (589)$ 35,961$
Accumulated Depreciation for:
Buildings (5,922)$ (760)$ -$ (6,682)$
Equipment, Furniture, Fixtures (4,331) (338) 585 (4,084)
Total Accumulated Depreciation (10,253)$ (1,098)$ 585$ (10,766)$
Total Capital Assets Depreciated, Net 24,996$ 203$ (4)$ 25,195$Fiduciary Funds, Capital Assets, Net 25,425$ 203$ (4)$ 25,624$
(1)
Prior year amounts have been restated for the prior period adjustment.
Primary Government
Capital Asset Activity
Government-wide Business-type Activities and Fiduciary Funds
Year Ended June 30, 2010
(In Thousands)
Prior Period Adjustment Business-type Activities: During fiscal year 2010, building cost in the 911Services Fund (enterprise fund) increased by $49,215,000, net of $5,656,000 accumulated depreciation,as a result of recording towers owned by the Minnesota Department of Transportation. This resulted in anet prior period adjustment of $43,559,000. These changes have been reflected as an adjustment tobeginning balances.
85
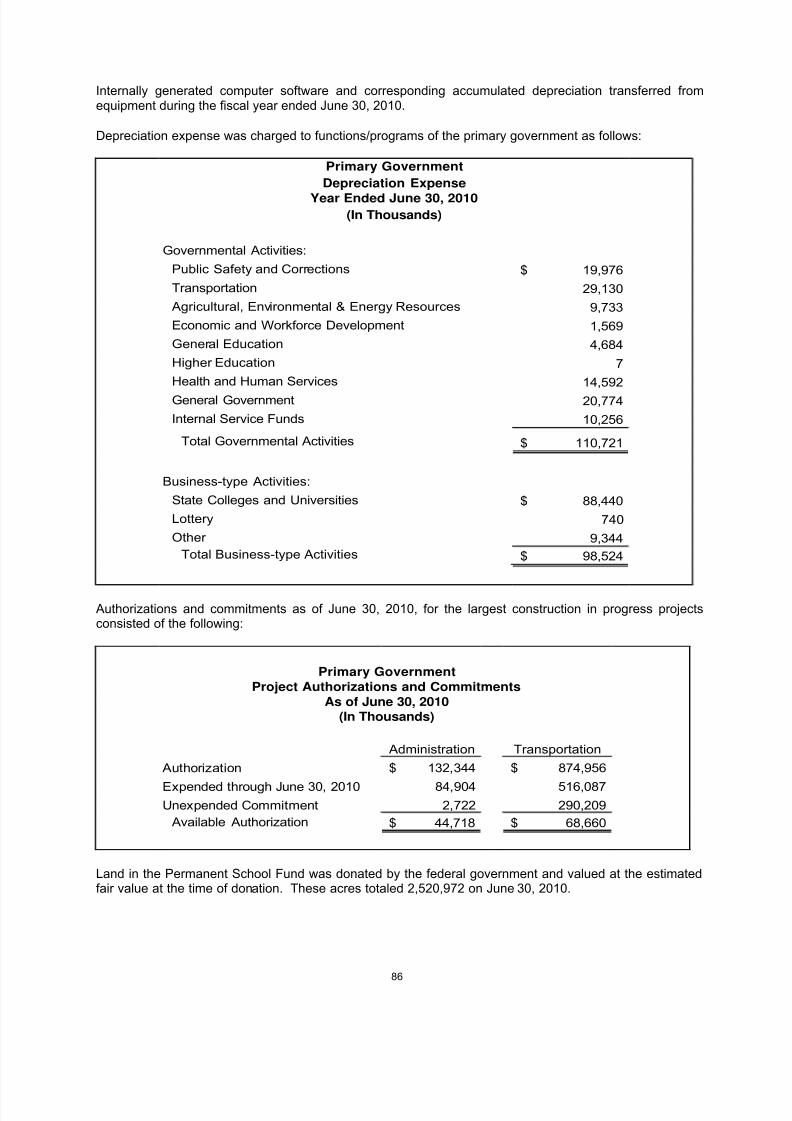
8/6/2019 2010 CAFR Minnesota
http://slidepdf.com/reader/full/2010-cafr-minnesota 102/265
Internally generated computer software and corresponding accumulated depreciation transferred fromequipment during the fiscal year ended June 30, 2010.
Depreciation expense was charged to functions/programs of the primary government as follows:
Governmental Activities:
Public Safety and Corrections 19,976$
Transportation 29,130
Agricultural, Environmental & Energy Resources 9,733
Economic and Workforce Development 1,569
General Education 4,684
Higher Education 7
Health and Human Services 14,592
General Government 20,774
Internal Service Funds 10,256
Total Governmental Activities 110,721$
Business-type Activities:
State Colleges and Universities 88,440$
Lottery 740
Other 9,344
Total Business-type Activities 98,524$
Primary Government
Depreciation Expense
Year Ended June 30, 2010(In Thousands)
Authorizations and commitments as of June 30, 2010, for the largest construction in progress projectsconsisted of the following:
Administration Transportation
Authorization 132,344$ 874,956$
Expended through June 30, 2010 84,904 516,087 Unexpended Commitment 2,722 290,209
Available Authorization 44,718$ 68,660$
Primary Government
Project Authorizations and Commitments
As of June 30, 2010
(In Thousands)
Land in the Permanent School Fund was donated by the federal government and valued at the estimatedfair value at the time of donation. These acres totaled 2,520,972 on June 30, 2010.
86
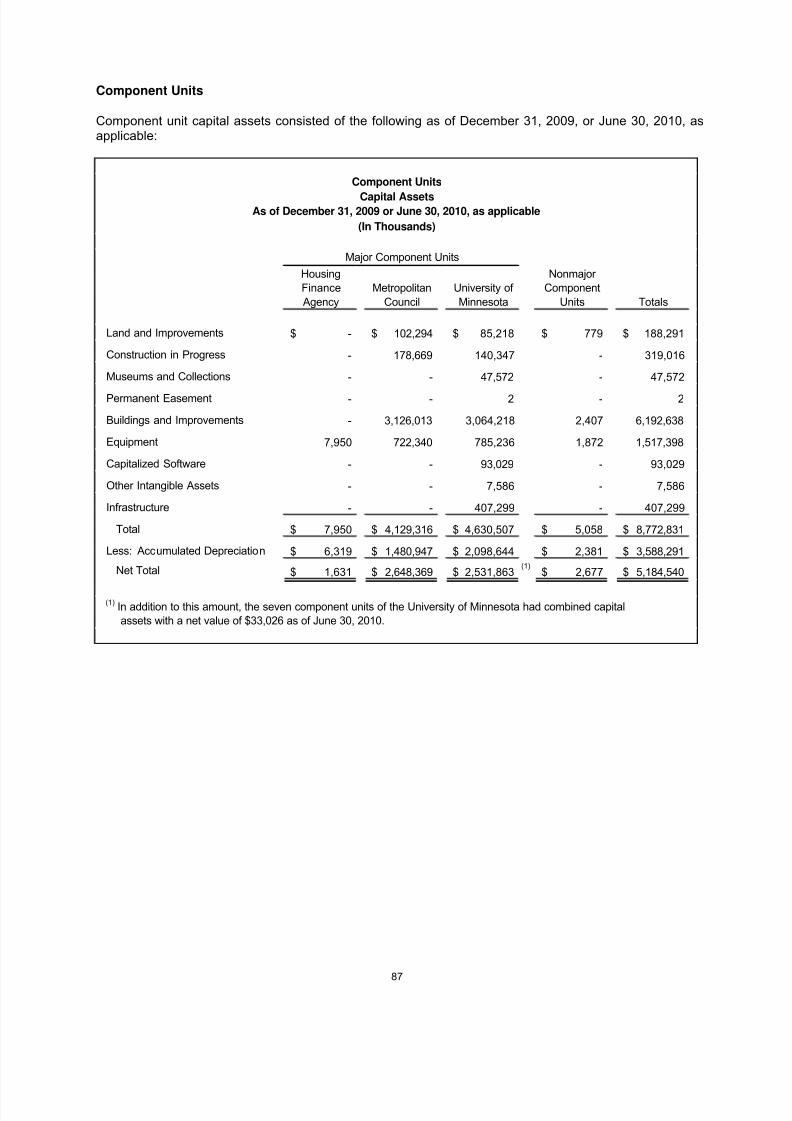
8/6/2019 2010 CAFR Minnesota
http://slidepdf.com/reader/full/2010-cafr-minnesota 103/265
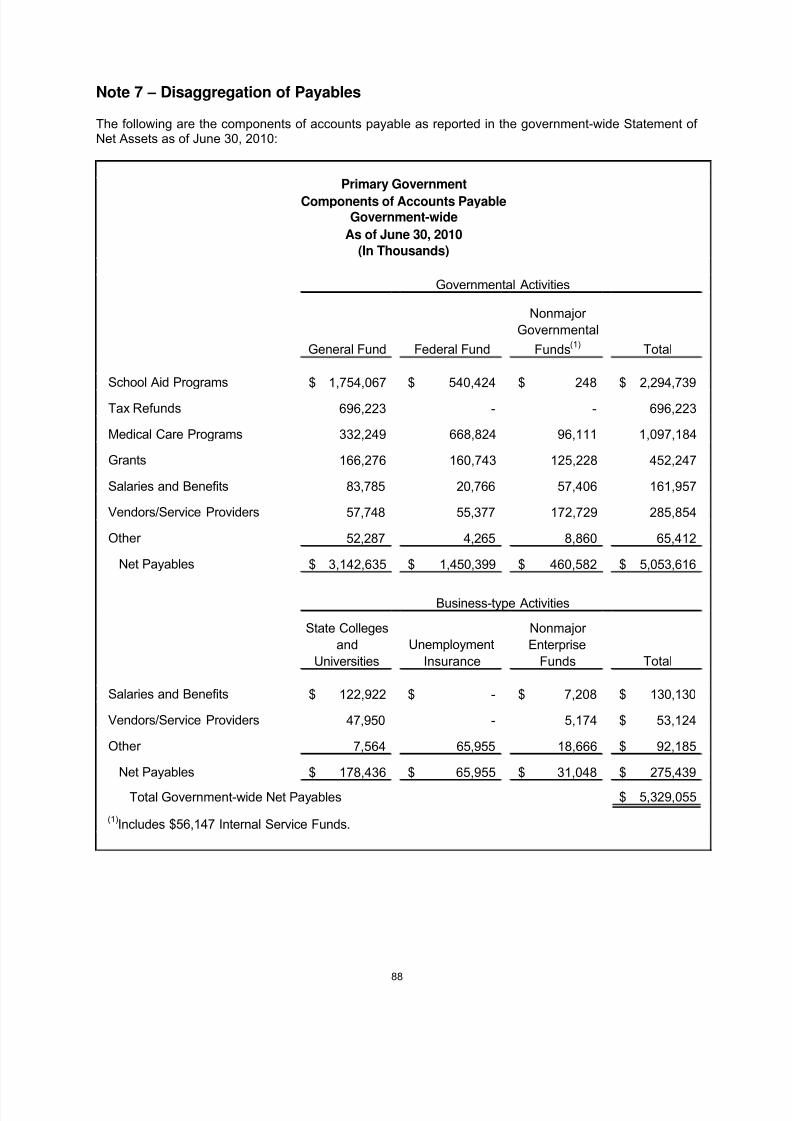
8/6/2019 2010 CAFR Minnesota
http://slidepdf.com/reader/full/2010-cafr-minnesota 104/265
Note 7 – Disaggregation of Payables
The following are the components of accounts payable as reported in the government-wide Statement of Net Assets as of June 30, 2010:
General Fund Federal Fund
Nonmajor
Governmental
Funds(1) Total
School Aid Programs 1,754,067$ 540,424$ 248$ 2,294,739$
Tax Refunds 696,223 - - 696,223
Medical Care Programs 332,249 668,824 96,111 1,097,184
Grants 166,276 160,743 125,228 452,247
Salaries and Benefits 83,785 20,766 57,406 161,957
Vendors/Service Providers 57,748 55,377 172,729 285,854
Other 52,287 4,265 8,860 65,412
Net Payables 3,142,635$ 1,450,399$ 460,582$ 5,053,616$
State Colleges
and
Universities
Unemployment
Insurance
Nonmajor
Enterprise
Funds Total
Salaries and Benefits 122,922$ -$ 7,208$ 130,130$
Vendors/Service Providers 47,950 - 5,174 53,124$
Other 7,564 65,955 18,666 92,185$
Net Payables 178,436$ 65,955$ 31,048$ 275,439$
Total Government-wide Net Payables 5,329,055$
Governmental Activities
Business-type Activities
(1)Includes $56,147 Internal Service Funds.
Primary Government
Components of Accounts PayableGovernment-wide
As of June 30, 2010
(In Thousands)
88
8/6/2019 2010 CAFR Minnesota
http://slidepdf.com/reader/full/2010-cafr-minnesota 105/265
Note 8 – Pension and Investment Trust Funds
The state performs a fiduciary role for several pension trust funds. For some of these funds, the statecontributes as an employer, and performs only a fiduciary role for other funds. These trust funds arecategorized as either defined benefit or defined contribution (pension trust funds) or investment trustfunds.
Three plan administrators, who prepare and publish their own stand-alone comprehensive annualfinancial reports, including financial statements and required supplementary information, and MinnesotaState Colleges and Universities (MnSCU), which publishes a stand-alone pension statement, provide thepension fund information. Each plan administrator accounts for one or more pension plans. Copies of these reports may be obtained directly from the organizations listed below.
See Note 1 – Summary of Significant Accounting and Reporting Policies for addresses of MSRS, PERAand TRA. The address for MnSCU is included in the “Defined contribution Funds” section of this note.
Plan Administrator Plans Covered
Minnesota State Retirement System (MSRS) State Employees Retirement Fund
Correctional Employees Retirement FundElective State Officers Fund
Judicial Retirement Fund
Legislative Retirement Fund
State Patrol Retirement Fund
Unclassified Employees Retirement Fund
Postretirement Health Care Benefits Fund
State Deferred Compensation Fund
Hennepin County Supplemental Retirement Fund
Public Employees Retirement Association (PERA) Public Employees Retirement Fund
Minneapolis Employees Retirement FundPolice and Fire Fund
Public Employees Correctional Fund
Volunteer Firefighter Retirement Fund
Defined Contribution Fund
Teachers Retirement Association (TRA) Teachers Retirement Fund
Minnesota State Colleges and Universities State Colleges and Universities Retirement Fund
Basis of Accounting and Valuation of Investments
The four plan administrators prepare financial statements using the accrual basis of accounting.Employee and employer contributions are recognized in the period in which they are earned and becomemeasurable. Expenses are recognized when the liability is incurred. Benefits and refunds are recognizedwhen due and payable in accordance with the terms of each plan.
Except as described below, investments are reported at fair value. Short-term investments are reportedat cost, which approximates fair value. Securities traded on a national or international exchange arevalued at the last reported trade price. Investments that do not have an established market are reportedat estimated fair value.
89
8/6/2019 2010 CAFR Minnesota
http://slidepdf.com/reader/full/2010-cafr-minnesota 106/265
The individual pension trust funds participate in internal investment pools sponsored by the state andadministered by the State Board of Investment (SBI). The pools function much like mutual funds, with thevarious pension trust funds purchasing “units” in the pool rather than individual securities. At year -end,some security purchase and sale transactions entered into by SBI were not settled, resulting in securitiestrades receivables and payables. These unsettled securities trades are an essential element indetermining the fair value of each pension trust fund‟s pooled investment balance; therefore, the tradesare reported in the Combining Statement of Net Assets of pension trust funds as net amounts and
allocated to the individual pension trust funds. As of June 30, 2010, this presentation resulted in anegative asset within the total investment pool participation.
Defined Benefit Pension Funds
Plan Descriptions and Contribution Information
Multiple employer, cost-sharing plans:
The State Employees Retirement Fund (SERF) covers those employees of the state, University of Minnesota, and certain other entities not covered by other pension funds. Twenty-seven employersparticipate in this plan. Normal retirement age is 65. The annuity formula is the greater of a step ratewith a flat rate reduction for each month of early retirement, or a level rate (the higher step rate) with
an actuarial reduction for early retirement. The applicable rates for each year of allowable service are1.2 percent and 1.7 percent of a member‟s average salary, which is defined as the average salary of the five highest paid successive years of service. Annual benefits increase by at least 2 percent or 2.5 percent if the plan is funded at least 90% of full funding. The state, as an employer for someparticipants, is liable for a portion of any unfunded accrued liability of this fund.
The Police and Fire Fund (P&FF) covers persons employed as police officers and firefighters by localgovernmental units and subdivisions. Approximately 500 employers participate in this plan. Normalretirement age is 55. The annuity formula for each member is 3.0 percent of average salary for eachyear of service in that plan. Annual benefits increase by at least 1 percent or 2.5 percent if the plan isfunded at least 90% of full funding. Prior to 1981, these employees were not covered by a local relief association. The fund covers all those hired since 1980. The state is not an employer of participantsin the plan, but performs in a fiduciary capacity.
The Public Employees Correctional Fund (PECF) covers employees in county correctional facilitieswho have direct contact with inmates. Eighty county employers participate in this plan. Normalretirement age is 55. The annuity formula for each member is 1.9 percent of average salary for eachyear of service in that plan. Annual benefits increase Annual benefits increase by at least 1 percentor 2.5 percent if the plan is funded at least 90% of full funding. The state is not an employer of participants in the plan, but performs in a fiduciary capacity.
The Public Employees Retirement Fund (PERF) covers employees of various governmental units andsubdivisions, including counties, cities, school districts, and related organizations. Approximately2,000 employers participate in this plan. There are two types of membership: „basic‟ for membersnot covered by the Social Security Act (closed to new members since 1968) and „coordinated‟ for members who are covered by the act. Normal retirement age is 65. The annuity formula for eachtype of membership is the greater of a step rate with a flat reduction for each month of early
retirement, or a level rate (the higher step rate) with an actuarially based reduction for earlyretirement. The applicable rates for each year of allowable service based on average salary for basicmembers are 2.2 and 2.7 percent, and for coordinated members, 1.2 and 1.7 percent. Annualbenefits increase by at least 1 percent or 2.5 percent if the plan is funded at least 90% of full funding.The state is not an employer of the participants in the plan, but performs in a fiduciary capacity.
90
8/6/2019 2010 CAFR Minnesota
http://slidepdf.com/reader/full/2010-cafr-minnesota 107/265
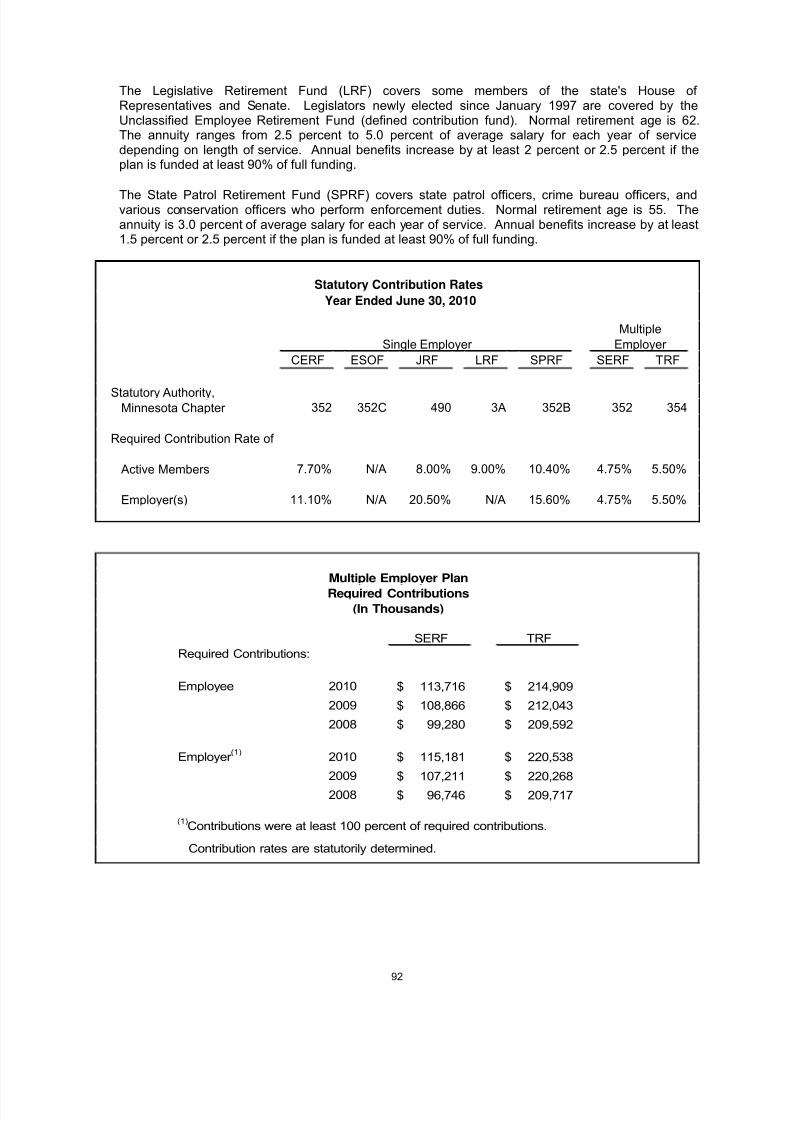
8/6/2019 2010 CAFR Minnesota
http://slidepdf.com/reader/full/2010-cafr-minnesota 108/265
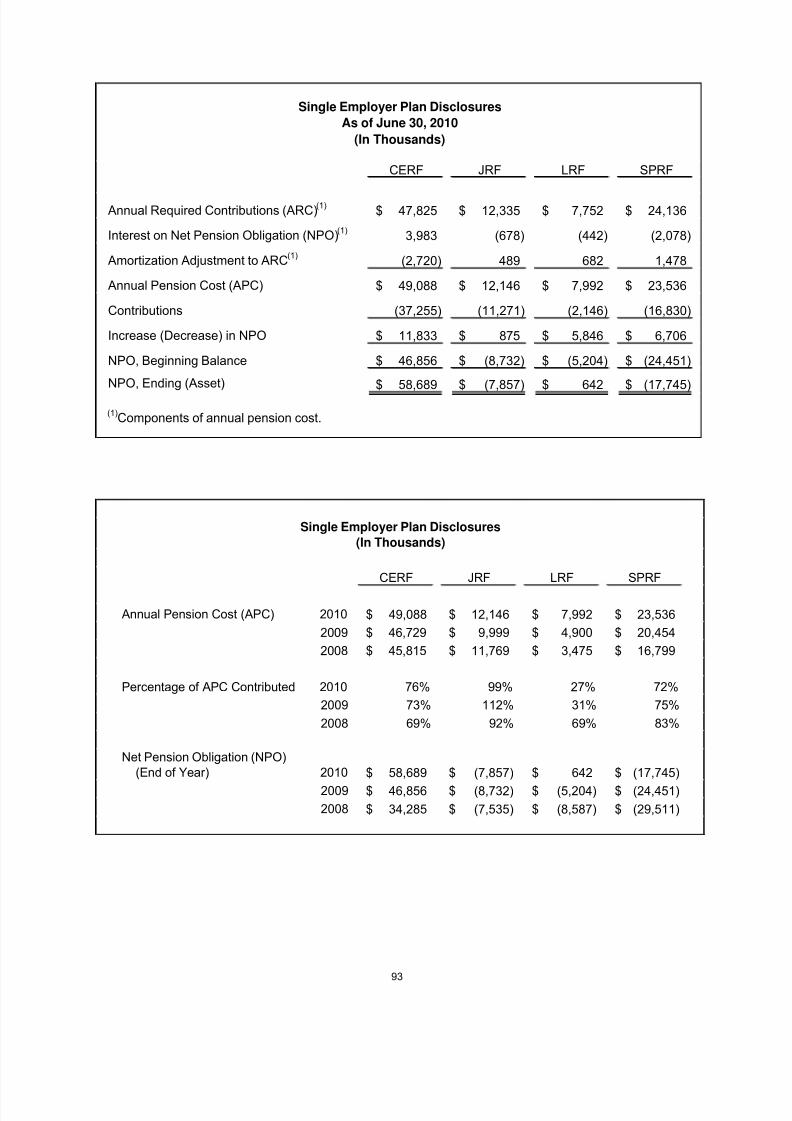
8/6/2019 2010 CAFR Minnesota
http://slidepdf.com/reader/full/2010-cafr-minnesota 109/265
CERF JRF LRF SPRF
Annual Required Contributions (ARC)(1)47,825$ 12,335$ 7,752$ 24,136$
Interest on Net Pension Obligation (NPO)(1)3,983 (678) (442) (2,078)
Amortization Adjustment to ARC(1)(2,720) 489 682 1,478
Annual Pension Cost (APC) 49,088$ 12,146$ 7,992$ 23,536$
Contributions (37,255) (11,271) (2,146) (16,830)
Increase (Decrease) in NPO 11,833$ 875$ 5,846$ 6,706$
NPO, Beginning Balance 46,856$ (8,732)$ (5,204)$ (24,451)$
NPO, Ending (Asset) 58,689$ (7,857)$ 642$ (17,745)$
(1)Components of annual pension cost.
Single Employer Plan Disclosures
(In Thousands)
As of June 30, 2010
CERF JRF LRF SPRF
Annual Pension Cost (APC) 2010 49,088$ 12,146$ 7,992$ 23,536$
2009 46,729$ 9,999$ 4,900$ 20,454$
2008 45,815$ 11,769$ 3,475$ 16,799$
Percentage of APC Contributed 2010 76% 99% 27% 72%
2009 73% 112% 31% 75%
2008 69% 92% 69% 83%
Net Pension Obligation (NPO)(End of Year) 2010 58,689$ (7,857)$ 642$ (17,745)$
2009 46,856$ (8,732)$ (5,204)$ (24,451)$
2008 34,285$ (7,535)$ (8,587)$ (29,511)$
Single Employer Plan Disclosures
(In Thousands)
93
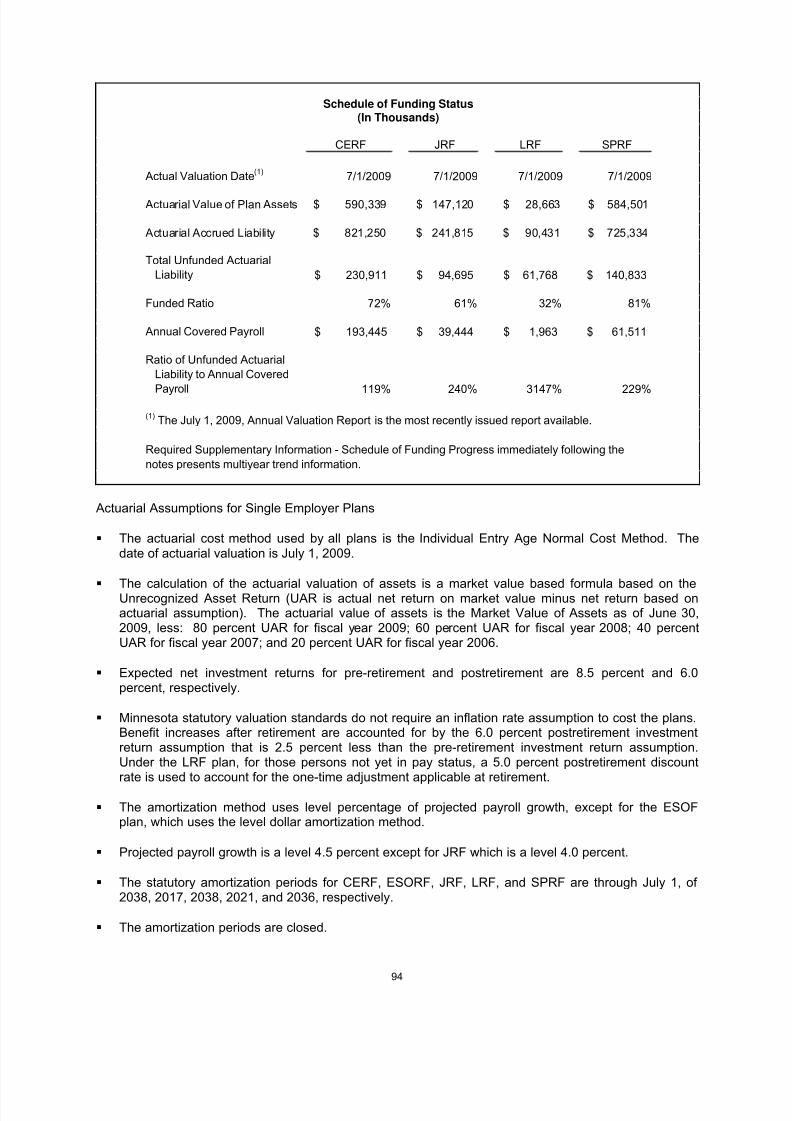
8/6/2019 2010 CAFR Minnesota
http://slidepdf.com/reader/full/2010-cafr-minnesota 110/265
CERF JRF LRF SPRF
Actual Valuation Date(1)
7/1/2009 7/1/2009 7/1/2009 7/1/2009
Actuarial Value of Plan Assets $ 590,339 $ 147,120 $ 28,663 $ 584,501
Actuarial Accrued Liability $ 821,250 $ 241,815 $ 90,431 $ 725,334
Total Unfunded Actuarial
Liability 230,911$ 94,695$ 61,768$ 140,833$
Funded Ratio 72% 61% 32% 81%
Annual Covered Payroll 193,445$ 39,444$ 1,963$ 61,511$
Ratio of Unfunded Actuarial
Liability to Annual Covered
Payroll 119% 240% 3147% 229%
(1) The July 1, 2009, Annual Valuation Report is the most recently issued report available.
Required Supplementary Information - Schedule of Funding Progress immediately following the
notes presents multiyear trend information.
Schedule of Funding Status(In Thousands)
Actuarial Assumptions for Single Employer Plans
The actuarial cost method used by all plans is the Individual Entry Age Normal Cost Method. Thedate of actuarial valuation is July 1, 2009.
The calculation of the actuarial valuation of assets is a market value based formula based on theUnrecognized Asset Return (UAR is actual net return on market value minus net return based onactuarial assumption). The actuarial value of assets is the Market Value of Assets as of June 30,2009, less: 80 percent UAR for fiscal year 2009; 60 percent UAR for fiscal year 2008; 40 percentUAR for fiscal year 2007; and 20 percent UAR for fiscal year 2006.
Expected net investment returns for pre-retirement and postretirement are 8.5 percent and 6.0percent, respectively.
Minnesota statutory valuation standards do not require an inflation rate assumption to cost the plans.Benefit increases after retirement are accounted for by the 6.0 percent postretirement investmentreturn assumption that is 2.5 percent less than the pre-retirement investment return assumption.Under the LRF plan, for those persons not yet in pay status, a 5.0 percent postretirement discountrate is used to account for the one-time adjustment applicable at retirement.
The amortization method uses level percentage of projected payroll growth, except for the ESOFplan, which uses the level dollar amortization method.
Projected payroll growth is a level 4.5 percent except for JRF which is a level 4.0 percent.
The statutory amortization periods for CERF, ESORF, JRF, LRF, and SPRF are through July 1, of 2038, 2017, 2038, 2021, and 2036, respectively.
The amortization periods are closed.
94
8/6/2019 2010 CAFR Minnesota
http://slidepdf.com/reader/full/2010-cafr-minnesota 111/265
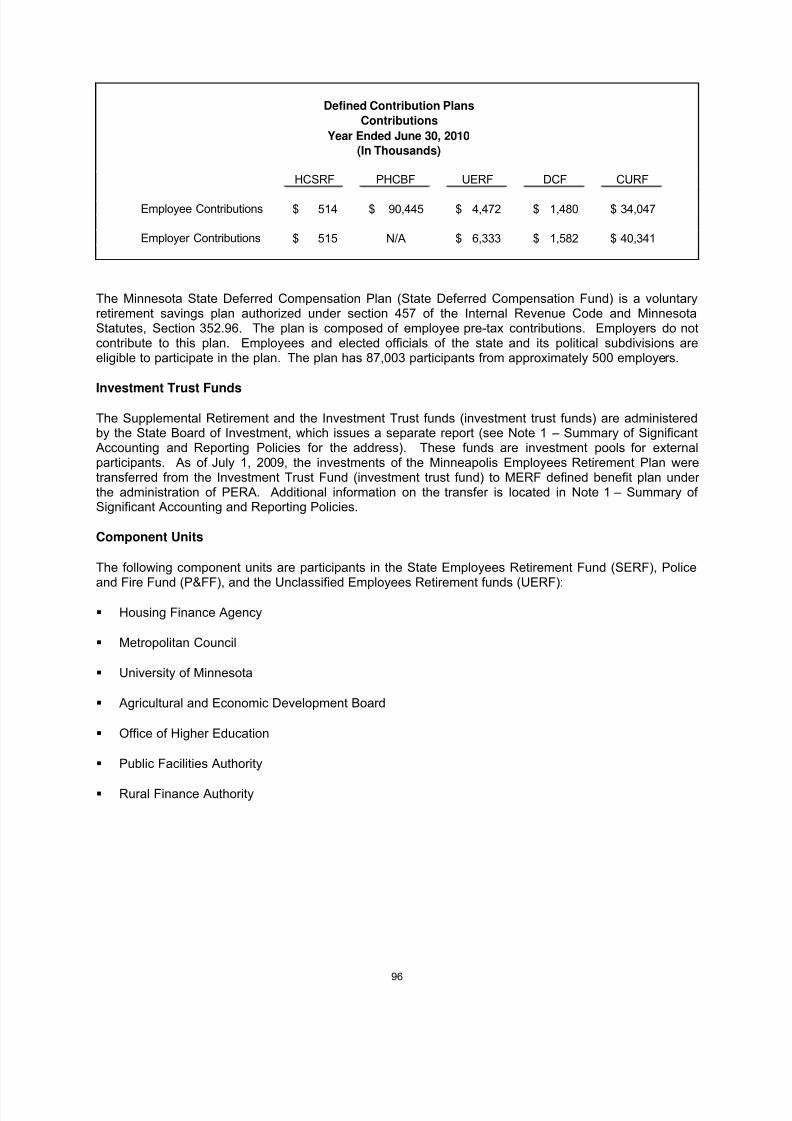
8/6/2019 2010 CAFR Minnesota
http://slidepdf.com/reader/full/2010-cafr-minnesota 112/265
8/6/2019 2010 CAFR Minnesota
http://slidepdf.com/reader/full/2010-cafr-minnesota 113/265
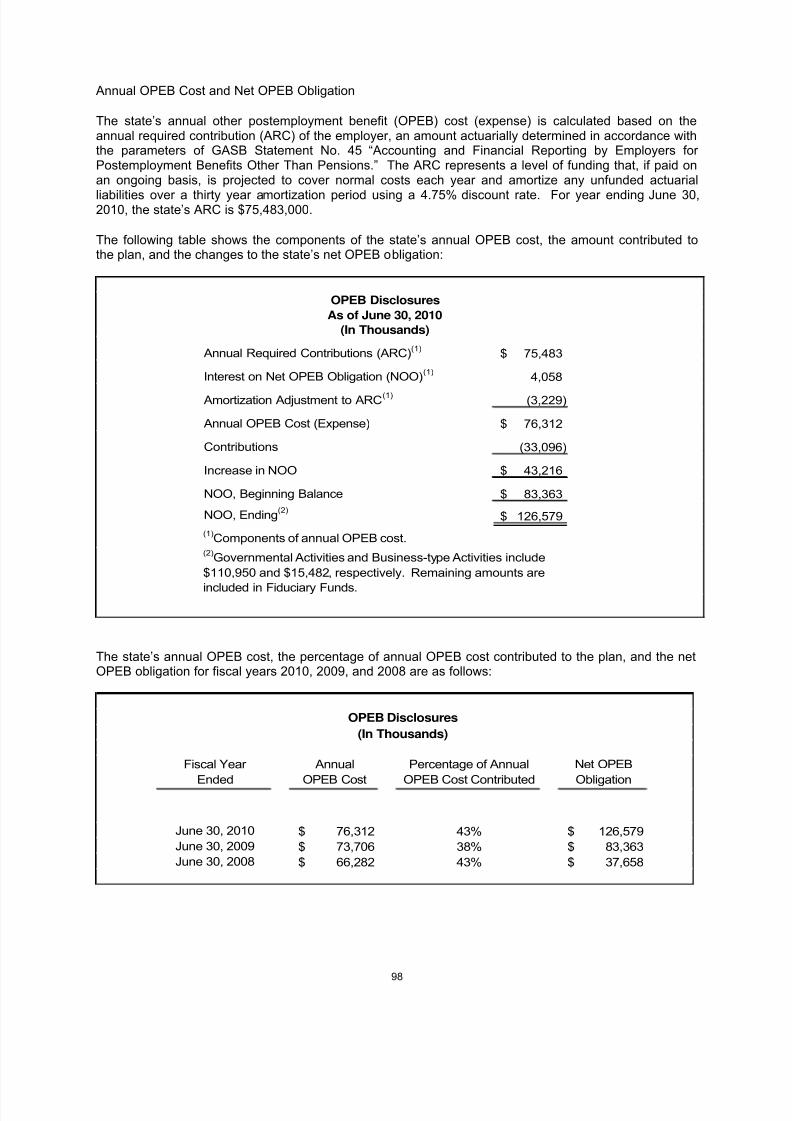
8/6/2019 2010 CAFR Minnesota
http://slidepdf.com/reader/full/2010-cafr-minnesota 114/265
Annual OPEB Cost and Net OPEB Obligation
The state‟s annual other postemployment benefit (OPEB) cost (expense) is calculated based on theannual required contribution (ARC) of the employer, an amount actuarially determined in accordance withthe parameters of GASB Statement No. 45 “Accounting and Financial Reporting by Employers for Postemployment Benefits Other Than Pensions.” The ARC represents a level of funding that, if paid onan ongoing basis, is projected to cover normal costs each year and amortize any unfunded actuarial
liabilities over a thirty year amortization period using a 4.75% discount rate. For year ending June 30,2010, the state‟s ARC is $75,483,000.
The following table shows the components of the state‟s annual OPEB cost, the amount contributed tothe plan, and the changes to the state‟s net OPEB obligation:
OPEB Disclosures
(In Thousands)
Annual Required Contributions (ARC)(1)
75,483$
Interest on Net OPEB Obligation (NOO)(1)
4,058
Amortization Adjustment to ARC(1) (3,229)
Annual OPEB Cost (Expense) 76,312$
Contributions (33,096)
Increase in NOO 43,216$
NOO, Beginning Balance 83,363$
NOO, Ending(2)
126,579$
(1)Components of annual OPEB cost.
As of June 30, 2010
(2)Governmental Activities and Business-type Activities include
$110,950 and $15,482, respectively. Remaining amounts are
included in Fiduciary Funds.
The state‟s annual OPEB cost, the percentage of annual OPEB cost contributed to the plan, and the netOPEB obligation for fiscal years 2010, 2009, and 2008 are as follows:
Fiscal Year
Ended
Annual
OPEB Cost
Percentage of Annual
OPEB Cost Contributed
Net OPEB
Obligation
June 30, 2010 $ 76,312 43% $ 126,579
June 30, 2009 $ 73,706 38% $ 83,363
June 30, 2008 $ 66,282 43% $ 37,658
OPEB Disclosures
(In Thousands)
98
8/6/2019 2010 CAFR Minnesota
http://slidepdf.com/reader/full/2010-cafr-minnesota 115/265
8/6/2019 2010 CAFR Minnesota
http://slidepdf.com/reader/full/2010-cafr-minnesota 116/265
Component Units – Postemployment Benefits Other Than Pensions
Metropolitan Council (MC) administers another postemployment benefit (OPEB) plan, a single-employer defined benefit health care and life insurance plan to eligible retirees, their spouses, and dependents.MC does not fund its OPEB benefits in an irrevocable trust. However, it has separately invested $70.8million as of December 31, 2009, for this purpose. The annual required contribution for 2009 was $29.8million or 11.3 percent of annual covered payroll. As of December 31, 2009, 2008 and 2007, the net
OPEB obligation was $44.4 million, $29.6 million and $14.5 million respectively. The actuarial accruedliability (AAL) for benefits was $311.9 million as of December 31, 2009, all of which was unfunded. Thecovered payroll was $263.1 million, and the ratio of the unfunded actuarial accrued liability (UAAL) to thecovered payroll was 118.5 percent.
University of Minnesota (U of M) administers another postemployment benefit (OPEB) plan, a single-employer defined benefit health care plan to eligible employees, retirees, their spouses, and dependentsand an academic disability plan for faculty and academic professional and administrative employees. Uof M does not fund its OPEB benefits in an irrevocable trust. The annual required contribution for theyear ended June 30, 2010, was $19.7 million or 1.7 percent of annual covered payroll. As of June 30,2010, the net OPEB obligation was $33.5 million. The actuarial accrued liability (AAL) for benefits was$88.9 million as of June 30, 2010, all of which was unfunded. The covered payroll was $1.2 billion, andthe ratio of the unfunded actuarial accrued liability (UAAL) to the covered payroll was 7.5 percent.
100
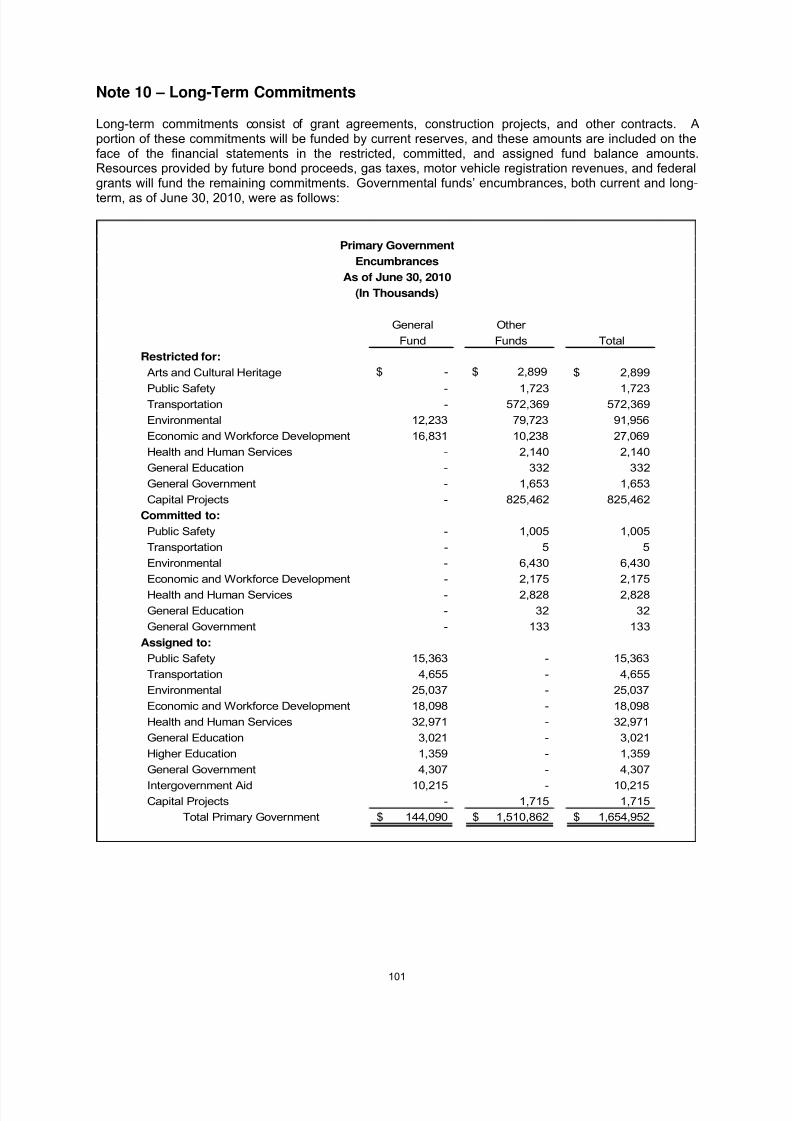
8/6/2019 2010 CAFR Minnesota
http://slidepdf.com/reader/full/2010-cafr-minnesota 117/265
8/6/2019 2010 CAFR Minnesota
http://slidepdf.com/reader/full/2010-cafr-minnesota 118/265
Petroleum Tank Environmental Cleanup
The Petroleum Tank Release Cleanup Act, Minnesota Statutes, Chapter 115C, requires the state toreimburse eligible applicants for a significant portion of their costs to investigate and clean upcontamination from leaking petroleum storage tanks. Reimbursements are made from the PetroleumTank Cleanup Fund (Petrofund) (special revenue fund). As of October 2010, the Petrofund hasreimbursed eligible applicants approximately $406,000,000 since program inception in 1987. Future
expenditures from the Petrofund will be necessary as existing cleanup projects are completed and newcleanup projects are begun at currently undiscovered leak sites. The estimated total payments from theprogram, which is scheduled to sunset on June 30, 2012, are between $425,000,000 and $465,000,000for investigative and cleanup costs.
Environmental and Remediation Fund
The Remediation Account was established in the state treasury as part of the Environmental andRemediation Fund (special revenue fund) to provide a reliable source of public money for response andcorrective actions to address releases of hazardous substances, pollutants, contaminants, agriculturalchemicals, and petroleum, and for environmental response actions at qualified closed landfills for whichthe state has assumed responsibility. Money in the general portion of the fund may be spent for actionsrelated to releases of hazardous substances, pollutants, or containments and to provide technical and
other assistance. Additionally, funds may be spent for corrective actions to address incidents involvingagricultural chemicals, including related administrative, enforcement, and cost recovery actions.
In addition to the general portion of the fund, two dedicated accounts are held within the fund. The firstaccount is the dry cleaner environmental response and reimbursement account. Money in the accountmay be used for environmental response actions at dry cleaning facilities and sites as well as relatedadministrative costs. The second account, the metropolitan landfill contingency action trust account,consists of revenue deposited from twenty-five percent of the metropolitan solid waste landfill fee. Moneyin the account is appropriated for closure and post closure care of mixed municipal solid waste disposalfacilities in the metropolitan area for a 30 year period after closure if it is determined that theoperator/owner will not take the necessary actions as directed by the Pollution Control Agency.
The Closed Landfill Investment Account consists of money credited to the fund plus interest and other earnings. Money in the fund may be spent only after fiscal year 2020 on environmental response actionsat qualified closed mixed municipal solid waste disposal facilities.
Minnesota State Colleges and Universities
The Minnesota State Colleges and Universities had commitments of $124,138,000 for construction andrenovation of college and university facilities.
Component Units
As of June 30, 2010, the Housing Finance Agency (HFA) had committed approximately $417,000,000 for the purchase or origination of future loans or other housing assistance.
Metropolitan Council enters into contracts for various purposes such as transit services and constructionprojects. As of December 31, 2009, unpaid commitments for Metro Transit Bus services wereapproximately $127,000,000. Future commitments for Metro Transit Light Rail were approximately$19,600,000, while future commitments for Metro Transit Commuter Rail were approximately$13,500,000. Finally, future commitments for Regional Transit and Environmental Services wereapproximately $97,700,000 and $107,900,000, respectively.
University of Minnesota (U of M) has construction projects in progress with an estimated completion costof $190,000,000. These costs will be funded from plant fund assets and state appropriations.
102
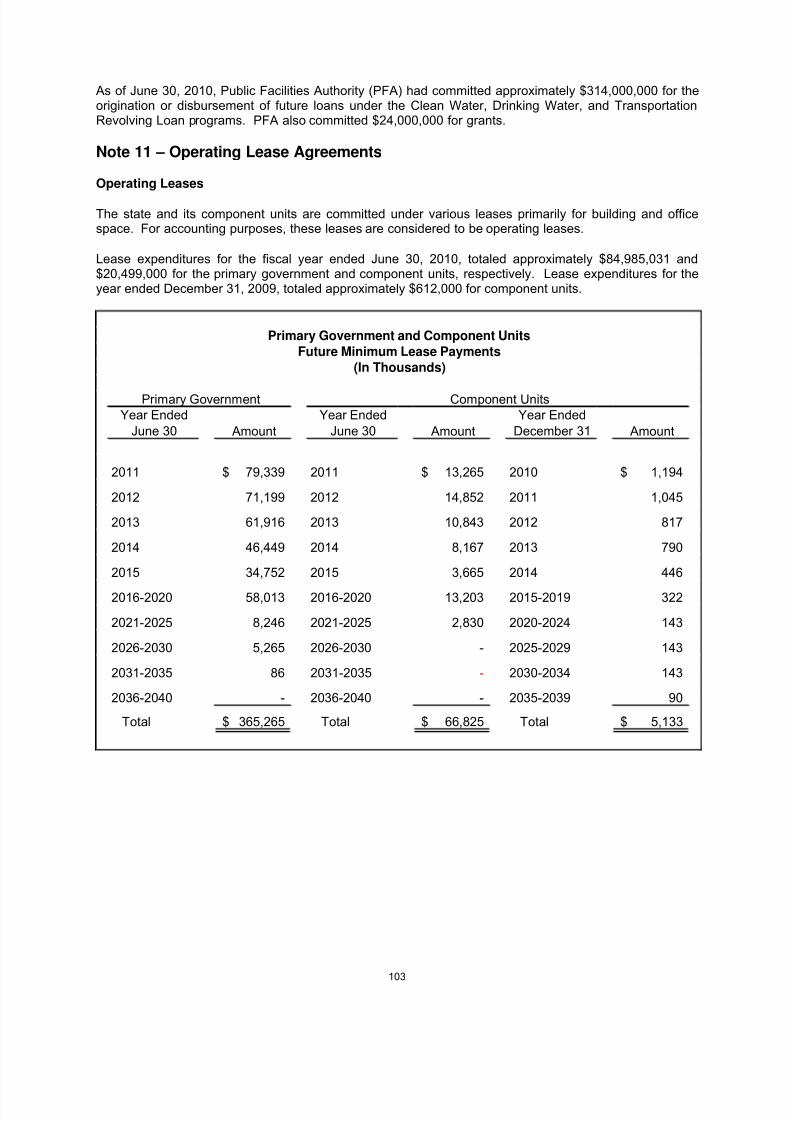
8/6/2019 2010 CAFR Minnesota
http://slidepdf.com/reader/full/2010-cafr-minnesota 119/265
As of June 30, 2010, Public Facilities Authority (PFA) had committed approximately $314,000,000 for theorigination or disbursement of future loans under the Clean Water, Drinking Water, and TransportationRevolving Loan programs. PFA also committed $24,000,000 for grants.
Note 11 – Operating Lease Agreements
Operating Leases
The state and its component units are committed under various leases primarily for building and officespace. For accounting purposes, these leases are considered to be operating leases.
Lease expenditures for the fiscal year ended June 30, 2010, totaled approximately $84,985,031 and$20,499,000 for the primary government and component units, respectively. Lease expenditures for theyear ended December 31, 2009, totaled approximately $612,000 for component units.
Year EndedJune 30 Amount
Year EndedJune 30 Amount
Year EndedDecember 31 Amount
2011 79,339$ 2011 13,265$ 2010 1,194$
2012 71,199 2012 14,852 2011 1,045
2013 61,916 2013 10,843 2012 817
2014 46,449 2014 8,167 2013 790
2015 34,752 2015 3,665 2014 446
2016-2020 58,013 2016-2020 13,203 2015-2019 322
2021-2025 8,246 2021-2025 2,830 2020-2024 143
2026-2030 5,265 2026-2030 - 2025-2029 143
2031-2035 86 2031-2035 - 2030-2034 143
2036-2040 - 2036-2040 - 2035-2039 90
Total 365,265$ Total 66,825$ Total 5,133$
Primary Government Component Units
Future Minimum Lease Payments
(In Thousands)
Primary Government and Component Units
103
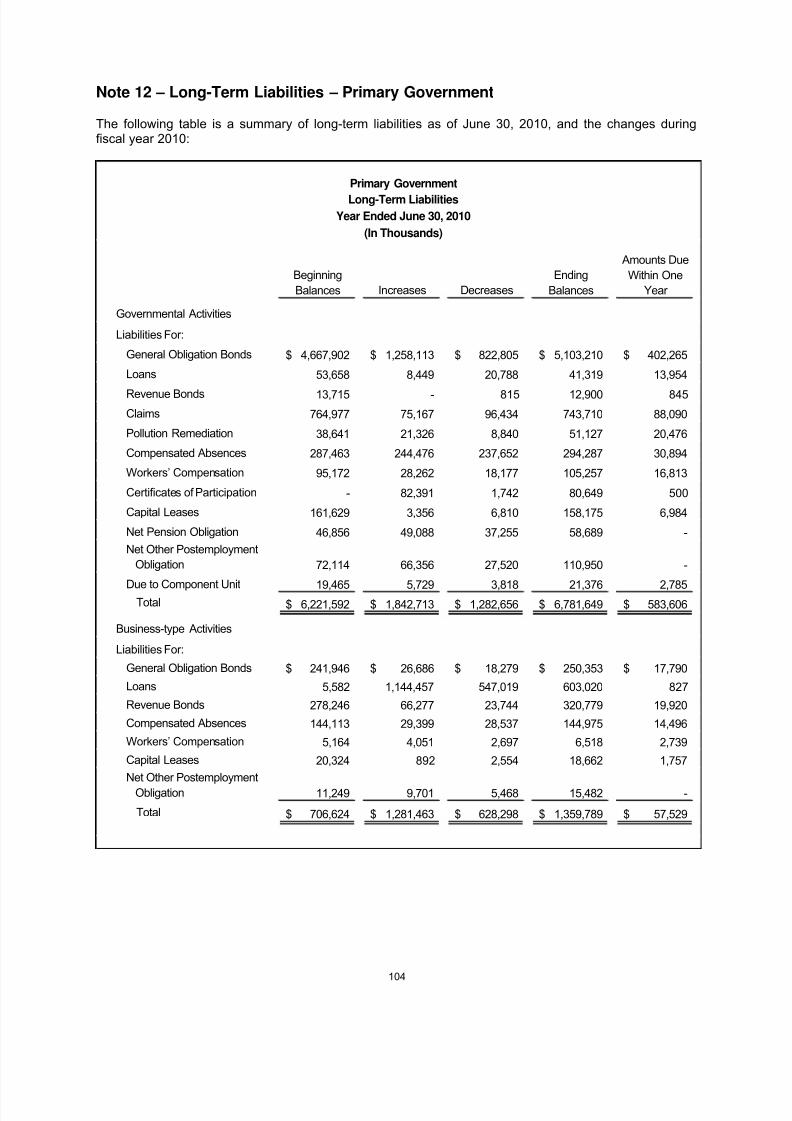
8/6/2019 2010 CAFR Minnesota
http://slidepdf.com/reader/full/2010-cafr-minnesota 120/265
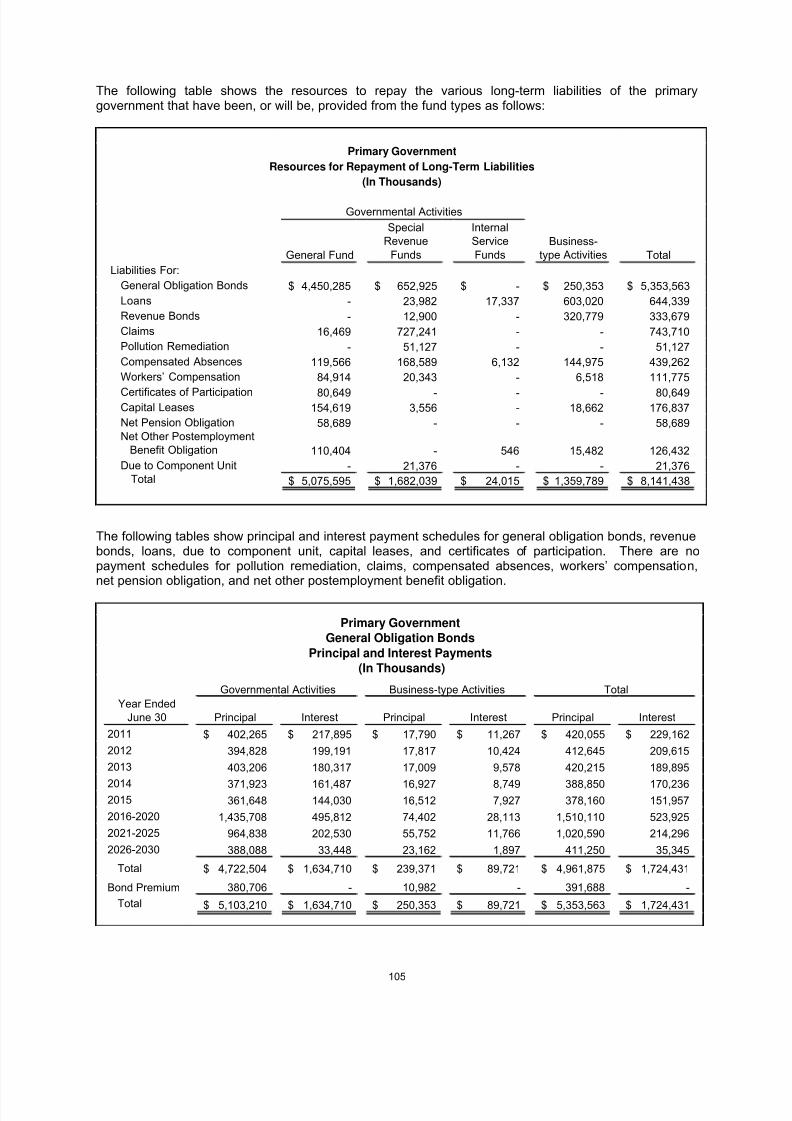
8/6/2019 2010 CAFR Minnesota
http://slidepdf.com/reader/full/2010-cafr-minnesota 121/265
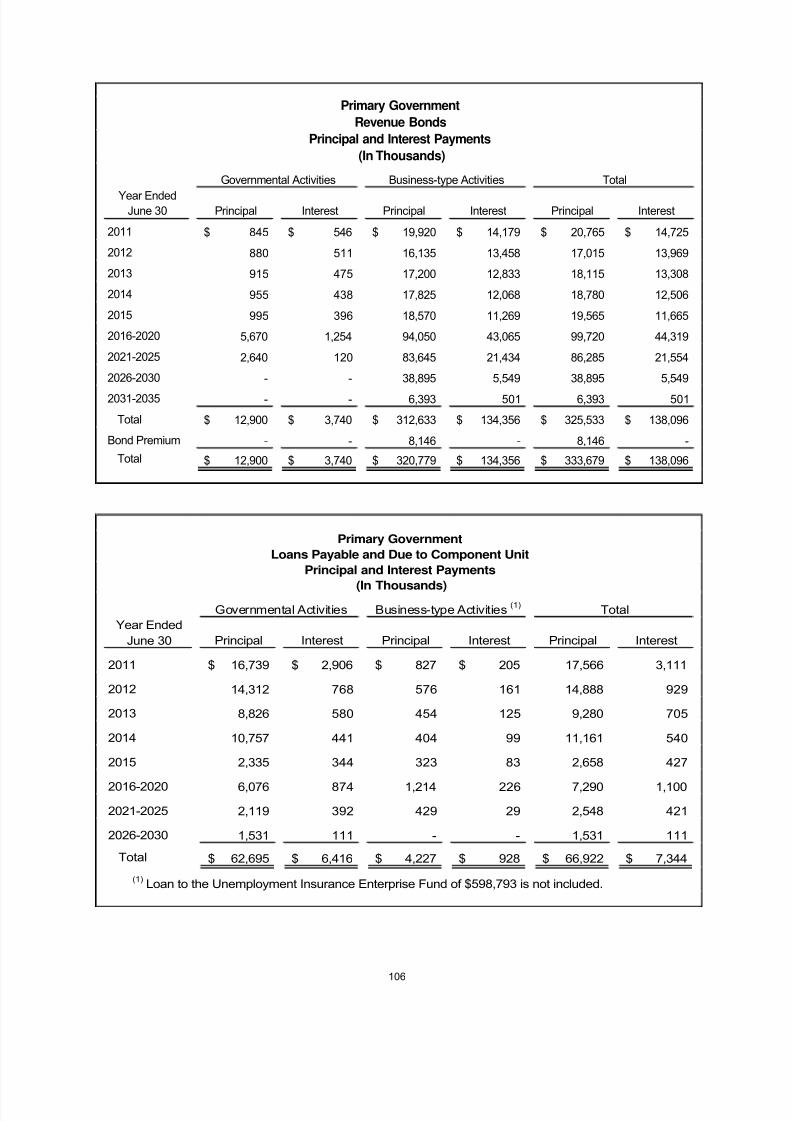
8/6/2019 2010 CAFR Minnesota
http://slidepdf.com/reader/full/2010-cafr-minnesota 122/265
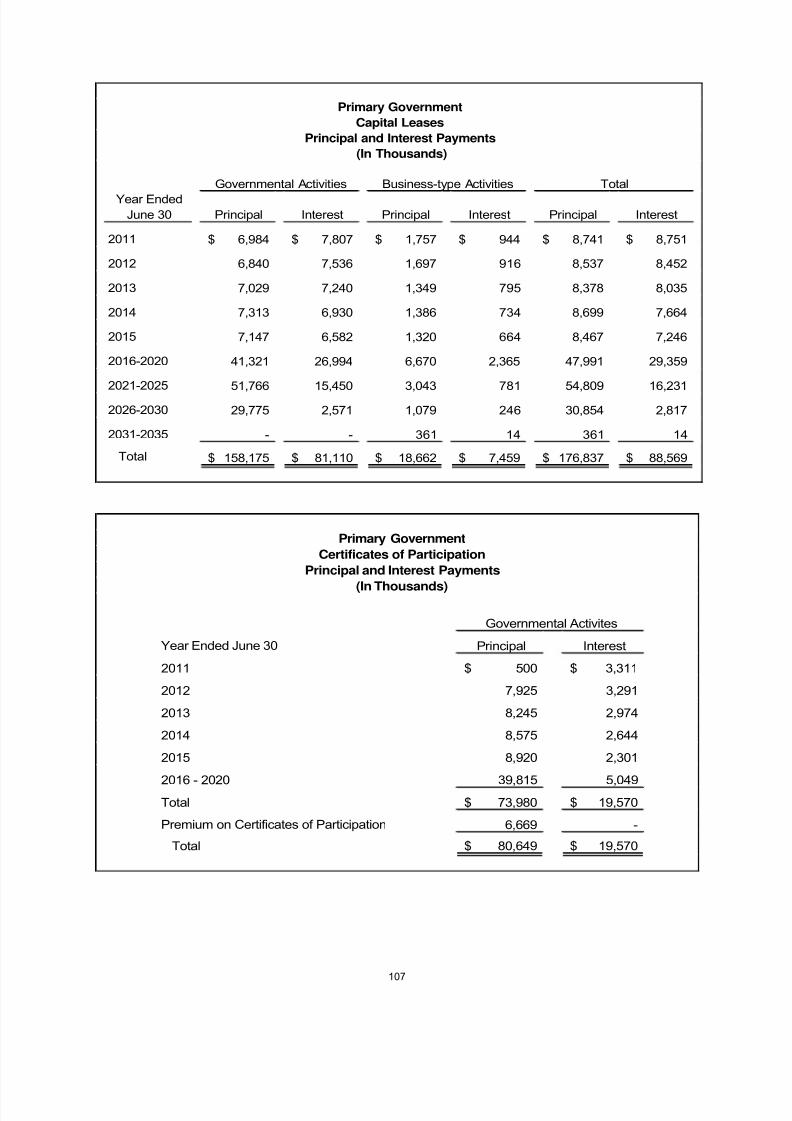
8/6/2019 2010 CAFR Minnesota
http://slidepdf.com/reader/full/2010-cafr-minnesota 123/265
Year EndedJune 30 Principal Interest Principal Interest Principal Interest
2011 6,984$ 7,807$ 1,757$ 944$ 8,741$ 8,751$
2012 6,840 7,536 1,697 916 8,537 8,452
2013 7,029 7,240 1,349 795 8,378 8,035
2014 7,313 6,930 1,386 734 8,699 7,664
2015 7,147 6,582 1,320 664 8,467 7,246
2016-2020 41,321 26,994 6,670 2,365 47,991 29,359
2021-2025 51,766 15,450 3,043 781 54,809 16,231
2026-2030 29,775 2,571 1,079 246 30,854 2,817
2031-2035 - - 361 14 361 14
Total 158,175$ 81,110$ 18,662$ 7,459$ 176,837$ 88,569$
Governmental Activities Business-type Activities Total
Principal and Interest Payments
(In Thousands)
Primary Government
Capital Leases
Year Ended June 30 Principal Interest
2011 500$ 3,311$
2012 7,925 3,291
2013 8,245 2,974
2014 8,575 2,644
2015 8,920 2,301
2016 - 2020 39,815 5,049Total 73,980$ 19,570$
Premium on Certificates of Participation 6,669 -
Total 80,649$ 19,570$
Governmental Activites
(In Thousands)
Principal and Interest Payments
Certificates of Participation
Primary Government
107
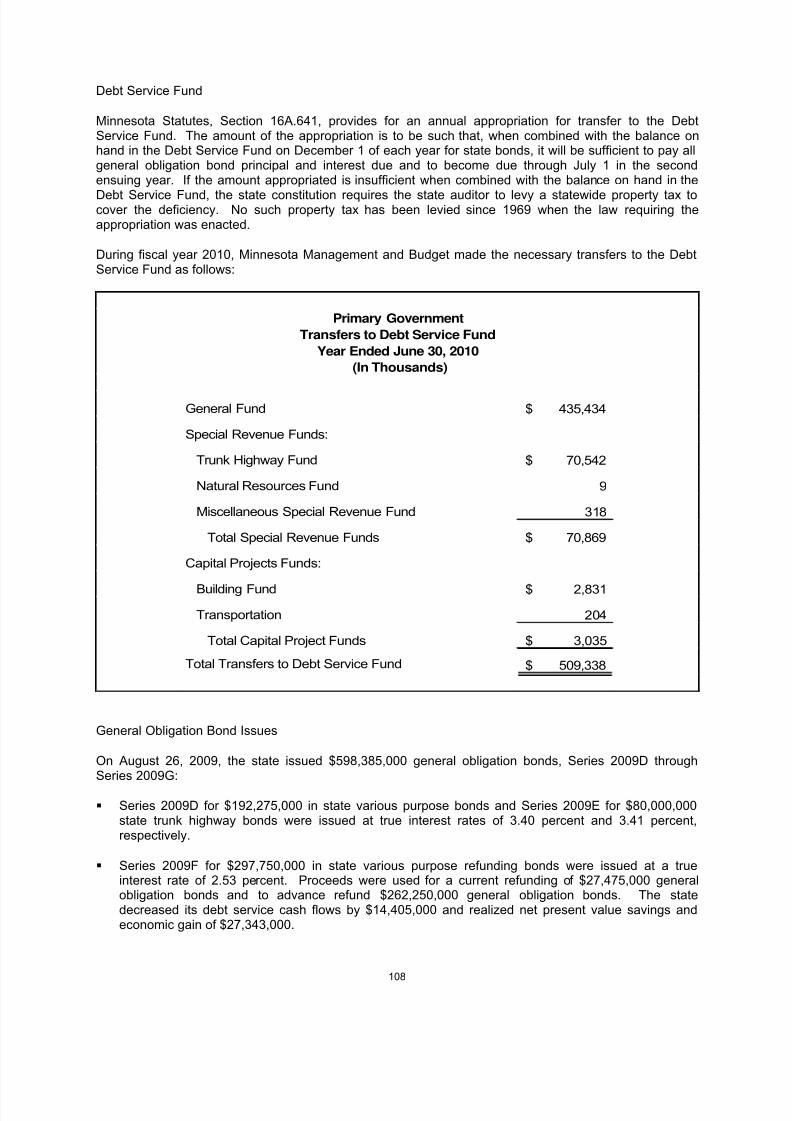
8/6/2019 2010 CAFR Minnesota
http://slidepdf.com/reader/full/2010-cafr-minnesota 124/265
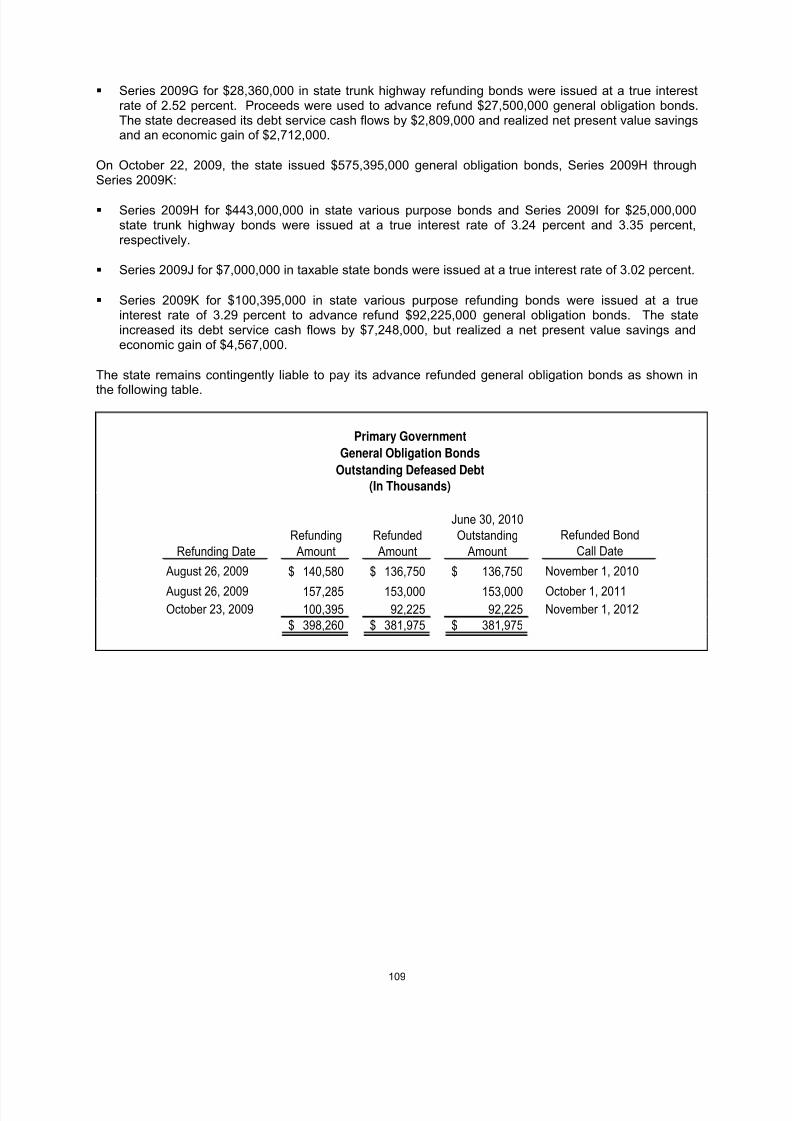
8/6/2019 2010 CAFR Minnesota
http://slidepdf.com/reader/full/2010-cafr-minnesota 125/265

8/6/2019 2010 CAFR Minnesota
http://slidepdf.com/reader/full/2010-cafr-minnesota 126/265
The following table is a schedule of general obligation bonds authorized, but unissued, and bondsoutstanding as of June 30, 2010. This schedule includes all general obligation bonds that were sold,including bonds sold for the State Operated Community Services and State Colleges and Universitiesfunds (enterprise funds).
Purpose
Authorized But
Unissued
Amount
Outstanding
Interest Rates
Range - %
State Building 698$ 65,300$ 5.00 - 5.62
State Operated Community Services - 2,353 5.00
State Transportation 22,560 194,133 5.00 - 5.62
Waste Management - 145 5.00 - 5.50
Water Pollution Control - 4,975 5.00 - 5.62
Maximum Effort School Loan - 65,770 5.00 - 5.25
Rural Finance Authority 23,500 66,500 5.00 - 5.60
Refunding Bonds - 1,058,355 4.00 - 5.00
Municipal Energy Building - 75 5.00
Trunk Highway 1,771,838 652,925 3.25 - 5.25
Various Purpose 1,643,920 2,851,344 5.00 - 5.62
Total 3,462,516$ 4,961,875$
Primary Government
General Obligation Bonds Authorized, but Unissued, and Bonds OutstandingAs of June 30, 2010
(In Thousands)
Certificates of Participation
On August 18, 2009, the state issued $74,980,000 of certificates of participation (C.O.P.s) at a trueinterest rate of 2.88 percent to finance the acquisition of computer software development intangibleassets. The proceeds are funding the development of the statewide financial and procurement systemand the state‟s integrated tax accounting system. The C.O.P.s were issued under a trust agreement withU.S. Bank, NA., trustee, who will collect rental payments according to the principal and interest schedulepursuant to the Technology Systems Lease Purchase Agreement for remittance to the investors. TheC.O.P.s are not general or moral obligations of the state and no revenues are pledged to repay them. If the state defaults on the debt, the trustee has the right to terminate the lease terms of either or bothprojects and take whatever action at law which may appear necessary to collect rental payment(s).
110

8/6/2019 2010 CAFR Minnesota
http://slidepdf.com/reader/full/2010-cafr-minnesota 127/265

8/6/2019 2010 CAFR Minnesota
http://slidepdf.com/reader/full/2010-cafr-minnesota 128/265
The state is authorized by Minnesota Statutes, Section 403.275, and by Minnesota Statewide RadioBoard resolution to issue revenue bonds for a current development phase of a public safety radiocommunications system. On November 1, 2006, $35,000,000 in revenue bonds were issued at a trueinterest rate of 3.76 percent. On November 13, 2008, $42,205,000 in revenue bonds were issued at atrue interest rate of 4.60 percent. On October 22, 2009, $60,510,000 in revenue bonds were issued at atrue interest rate of 3.17 percent. The state has pledged future 911 fee revenues to repay the debt. Thedebt service on these bonds is payable solely from the revenues derived from the 911 fee assessed on
wireless and wire-line telephone service. Annual principal and interest payments on the bonds areexpected to require less than 30 percent of the total 911 fee revenues. The total principal and interestremaining to be paid on the bonds as of June 30, 2010, is $154,529,000, payable through June 2025.Principal and interest paid during fiscal year 2010 and total 911 fee revenues were $18,017,000 and$60,229,000, respectively. The bonds are accounted for in the 911 Services Fund (enterprise fund) andare insured by a financial guaranty insurance policy issued by MBIA Insurance Corporation.
Minnesota State Colleges and Universities (MnSCU) (enterprise fund) is authorized by MinnesotaStatutes, Section 136F.98, to issue revenue bonds whose aggregate principal shall not exceed$300,000,000 at any time. The proceeds of these bonds are used to finance the acquisition, constructionand remodeling of buildings for dormitory, residence hall, parking ramps, student union, and food servicepurposes at state universities. Revenue bonds currently outstanding have interest rates of 2.00 to 6.50percent. The revenue bonds are payable solely from, and collateralized by, an irrevocable pledge of
revenues to be derived from the operation of the financed buildings and from student fees. Theserevenue bonds are payable through 2033. Annual principal and interest payments on the bonds areexpected to require less than 16 percent of net revenues. The total principal and interest remaining to bepaid on the bonds is $269,707,000. Principal and interest paid during fiscal year 2010 and total customer net revenues were $16,941,000 and $101,311,000, respectively.
Itasca Community College issued revenue bonds through the Itasca County Housing RedevelopmentAuthority that are payable through 2025. These bonds are payable solely from, and collateralized by, anirrevocable pledge of revenues to be derived from the operation of the financed buildings. Annualprincipal and interest payments on the bonds are expected to require less than 52 percent of netrevenues. The total principal and interest remaining to be paid on the bonds is $3,492,000. Principal andinterest paid and total customer net revenues during fiscal year 2010 were $204,000 and $400,000,respectively. These revenue bonds have a variable interest rate of 2.50 to 5.75 percent.
Vermilion Community College issued revenue bonds through the Minnesota Higher Education FacilitiesAuthority that are payable through 2013. These bonds are payable solely from, and collateralized by, anirrevocable pledge of revenues to be derived from the operation of the financed buildings and guaranteedby the City of Ely. Annual principal and interest payments on the bonds are expected to require less than40 percent of net revenues. The total principal and interest remaining to be paid on the bonds is$253,000. Principal and interest paid and total customer net revenues during fiscal year 2010 were$82,000 and $228,000, respectively. These revenue bonds have a fixed interest rate of 6.00 percent.
On November 1, 2000, $16,000,000 in revenue bonds were issued for financing expansion of the GiantsRidge Recreational Area at a true interest rate of 7.48 percent. In addition, $3,710,000 in bonds wererefunded. The original refunded bonds have been eliminated, and the new advance refunding bondshave been added to the Giants Ridge Fund (enterprise fund). The Iron Range Resources andRehabilitation Agency has pledged the gross revenues from the operation of the Giants Ridge
Recreational Facilities, including green fees and ski lift ticket receipts, to repay the debt. The debt serviceon these bonds is payable solely from these sources. The total principal and interest remaining to bepaid on the bonds as of June 30, 2010, is $19,008,000, payable through November 2025. Principal andinterest paid during fiscal year 2010 and net Giants Ridge Fund available revenues were $1,673,000 and$4,184,000, respectively.
112

8/6/2019 2010 CAFR Minnesota
http://slidepdf.com/reader/full/2010-cafr-minnesota 129/265
Refunded Bond
Call Date
November 1, 2000 3,710$ 3,710$ 2,475$ November 1, 2025
Giants Ridge
Outstanding Defeased Debt
(In Thousands)
Refunding Date
Refunding
Amount
Refunded
Amount
June 30, 2010
Outstanding
Amount
Pollution Remediation
The state of Minnesota is financially responsible to remediate certain known pollution present on either state owned or non-state owned land. In most cases, the state voluntarily assumes responsibility for siteassessment and clean-up activities when the responsible party cannot be found or is financially unable toperform the remediation. Pollution remediation obligation liabilities as of June 30, 2010, were$51,127,000. Of this total, $33,592,000 was the liability for remediation on sites designated pursuant to
state or federal superfund laws. The pollution remediation amounts are estimated through an analysis of existing polluted sites. The liabilities are based on the weighted average of the pollution remediationoutlays expected to be incurred to settle those liabilities. Because the liabilities are measured at their current value, they are subject to change due to inflation, technology improvements, or changes toapplicable laws and regulations. Funding for the state‟s pollution remediation primarily comes from theEnvironmental and Remediation Fund (special revenue fund), which was established under MinnesotaStatutes, Section 116.155, and the Petroleum Tank Cleanup Fund (special revenue fund), which wasestablished under Minnesota Statutes, Section 115C.08.
Claims
Municipal solid waste landfill liability of $220,310,000 for closure and postclosure care claims are payablefrom the Environmental and Remediation Fund (special revenue fund) and the General Fund. The state
has assumed responsibility for the long-term care of certain closed municipal solid waste facilities.Minnesota Statutes, Section 115B.39, established the landfill cleanup program to provide environmentalresponse to qualified, state-permitted, closed landfills. The state is responsible, in perpetuity, for performing cleanup and final closure work, as well as all postclosure maintenance and monitoring, atqualifying sites. There are currently 109 landfills in the program. Funding for the state‟s ongoing claimsat these landfills comes from the Environmental and Remediation Fund (special revenue fund). TheEnvironmental and Remediation Fund includes revenues from insurance recovery proceeds and financialassurance from previous owners and operators. Proceeds from the sale of state general obligationbonds, accounted for in the Building Fund (capital projects fund) and repaid by the General Fund, havebeen used for design and construction work at the publicly-owned landfills in the program. Estimatedlandfill closure and postclosure liabilities include planned response actions, future unknown additionalremedies which have some probability of occurring, future replacement of some remedial systems, andadministrative costs. Since costs are estimated at current value, actual costs could be different because
of inflation, changes in technology, inclusion of additional qualifying sites or changes in regulations, andfuture unanticipated response actions.
Claims of $39,600,000 are for workers' compensation claims of employees of uninsured and bankruptfirms. These claims are funded by an assessment on insurers and are payable from the SpecialCompensation Fund (special revenue fund).
113

8/6/2019 2010 CAFR Minnesota
http://slidepdf.com/reader/full/2010-cafr-minnesota 130/265
The remaining claim amount of $483,800,000 is for reimbursements of supplementary and second injurybenefits for old workers‟ compensation injur ies. Legislative action ended both the supplementary andsecond injury programs. The claim amount represents the estimated discounted (5.00%) cost of supplementary benefits for injuries prior to October 1, 1995, and second injury program benefits for injuries prior to July 1, 1992. Without alteration by settlements, the liability is expected to extend toapproximately the year 2050 for supplementary benefits and 2036 for second injuries.
Compensated Absences
The compensated absences liability for governmental activities and business-type activities of $294,287,000 and $144,975,000, respectively, are primarily for vacation leave and vested sick leave,which are payable as severance pay under specific conditions. Both amounts are paid in cash only whenan employee terminates state employment. This obligation will be liquidated using future resources atunspecified times.
Workers‟ Compensation
The governmental activities and business-type activities liability for workers' compensation of $105,257,000 and $6,518,000, respectively, are based on claims filed for injuries to state employeesoccurring prior to June 30, 2010, and is an undiscounted estimate of future payments. The liability will be
liquidated using future resources at unspecified times.
Arbitrage Liabilities
An arbitrage rebate payable to the federal government is required by the Tax Reform Act of 1986 andU.S. Treasury regulations and penalties if there are excess earnings on tax-exempt bond proceeds anddebt service reserves. For fiscal year 2010, the state did not have excess earnings on tax-exempt bondproceeds and debt service.
Revenue Bonds Payable – Fiduciary Funds
On June 1, 2000, the state of Minnesota issued revenue bonds totaling $29,000,000 on behalf of thestate‟s three retirement systems. Minnesota Statutes, Section 356.89, authorized the issuance of the
revenue bonds for the construction of an administrative office building. The revenue bonds have avariable interest rate of 5.38 to 6.00 percent and are not general obligations of the state. The bonds arebacked by the assets of the three retirement systems, excluding assets segregated for retired employeesand assets of the systems‟ defined contribution funds. The debt service payments are allocated to eachsystem based on the percentage interest each has in the facility. For fiscal year 2010, principal andinterest paid by the State Employees Retirement Fund (SERF), Teachers Retirement Fund (TRF), andPublic Employees Retirement Fund (PERF) was $2,071,000. The total principal and interest remaining tobe paid as of June 30, 2010, is $ 42,104,000, payable through 2030.
114

8/6/2019 2010 CAFR Minnesota
http://slidepdf.com/reader/full/2010-cafr-minnesota 131/265

8/6/2019 2010 CAFR Minnesota
http://slidepdf.com/reader/full/2010-cafr-minnesota 132/265
Office of Higher Education (OHE) is authorized by Minnesota Statutes, Sections 136A.171-.175, to issuerevenue bonds and notes to finance guaranteed loans for students attending eligible post-secondaryeducational institutions. The amount outstanding on these bonds at any one time, not including refundedbonds or otherwise defeased or discharged bonds, shall not exceed $850,000,000, according toMinnesota Statutes, Section 136A.171. On June 30, 2010, the outstanding principal of revenue bondswas $590,100,000.
Public Facilities Authority (PFA) is authorized by Minnesota Statutes, Section 446A.072, to issue revenuebonds to make loans to municipalities for wastewater treatment facilities. The amount outstanding onthese bonds at any time shall not exceed $1,500,000,000, according to Minnesota Statutes, Section446A.12. The principal amount of bonds outstanding on June 30, 2010, net of unamortized premium,was $987,707,000.
Year Ended Principal Interest Principal Interest
2011 114,563$ 41,692$ 90,021$ 46,526$
2012 94,216 38,262 228,316 21,763
2013 73,285 35,075 6,526 8,217
2014 67,624 32,380 6,776 7,972
2015 68,859 29,915 7,046 7,700
2016-2020 383,495 110,177 38,841 34,381
2021-2025 284,246 45,234 46,443 24,325
2026-2030 88,945 6,760 49,216 9,947
2031-2035 - - 10,488 1,347
1,175,233$ 339,495$ 483,673$ 162,178$
18,814 - - -
1,194,047$ 339,495$ 483,673$ 162,178$
(1)MC fiscal year ends December 31.
Component Units
U of MMC(1)
and Issuance Costs
Total
Unamortized Discounts/Premiums
General Obligation Bonds
Major Component Units
(In Thousands)
116

8/6/2019 2010 CAFR Minnesota
http://slidepdf.com/reader/full/2010-cafr-minnesota 133/265

8/6/2019 2010 CAFR Minnesota
http://slidepdf.com/reader/full/2010-cafr-minnesota 134/265
Year Ended Principal Interest Principal Interest Principal Interest
2011 795$ 393$ -$ 4,668$ 48,835$ 44,875$
2012 835 352 - 4,668 59,465 44,016
2013 885 307 - 4,668 59,705 41,182
2014 925 261 - 4,668 62,710 38,224
2015 970 210 - 4,667 66,180 35,116
2016-2020 2,665 459 - 23,338 352,320 124,199
2021-2025 285 10 - 23,338 244,815 43,759
2026-2030 - - - 23,338 51,475 4,625
2031-2035 - - 53,500 23,338 - -
2036-2040 - - 366,600 13,948 - -
2041-2045 - - 170,000 1,743 - -
7,360$ 1,992$ 590,100$ 132,382$ 945,505$ 375,996$
Unamortized
Discounts/Premiums
and Issuance Costs - - - - 42,202 -
Total 7,360$ 1,992$ 590,100$ 132,382$ 987,707$ 375,996$
Nonmajor Component Units
Long-Term Debt Repayment Schedule
(In Thousands)
OHE PFAAEDB
Revenue Bonds
Component Units
Variable Rate Debt
University of Minnesota
To protect against future interest rate fluctuations on U of M‟s general obligation bonds and for budgetingpurposes, U of M has entered into six separate interest rate swaps. All of these are pay-fixed, receive-variable interest rate swaps which are intended to change U of M‟s variable interest rate bonds tosynthetic fixed-rate bonds. See Note 2 – Cash, Investments, and Derivative Instruments.
Office of Higher Education
The interest rates on all of the bonds are reset periodically. The rates on all of the bonds, except thetaxable Series 2008A bonds and the tax-exempt Series 2008B bonds, are based on a determination bythe auction agent through auction proceedings. The rates on the taxable bonds cannot exceed the lesser of one-month LIBOR plus 1 percent; 17 percent; or the 91 day average of the three-month T-Bill plus anapplicable spread of 1.25 percent. The rates on the tax-exempt bonds cannot exceed the lesser of theapplicable percentage of the Kenny index or the after-tax equivalent rate; 14 percent; or the three monthaverage of the three-month T-Bill plus an applicable spread of 1.25 percent. The interest on the auctionrate bonds is payable each time the rates are reset and no principal payments are required until finalmaturity.
118

8/6/2019 2010 CAFR Minnesota
http://slidepdf.com/reader/full/2010-cafr-minnesota 135/265

8/6/2019 2010 CAFR Minnesota
http://slidepdf.com/reader/full/2010-cafr-minnesota 136/265
Note 14 – Segment Information
Vermilion Itasca
Revenue
Fund
Modular
Housing
Residence
Halls Giants Ridge 911 Services
Condensed Statement of Net Assets
Assets:
Current Assets 65,732$ 153$ (4)$ 6,626$ 41,028$
Restricted Assets 107,519 141 273 1,600 -
Notes Receivable 2,400 - - - -
Capital Assets 204,855 830 3,546 21,265 54,530
Total Assets 380,506$ 1,124$ 3,815$ 29,491$ 95,558$
Liabilities:
Current Liabilities 21,157$ 187$ 101$ 1,577$ 13,951$
Noncurrent Liabilities 185,327 155 2,027 10,788 111,639 Total Liabilities 206,484$ 342$ 2,128$ 12,365$ 125,590$
Net Assets:
Invested in Capital Assets, Net of
Related Debt 91,306$ 675$ 1,433$ 11,248$ -$
Restricted 82,716 64 273 - -
Unrestricted - 43 (19) 5,878 (30,032) Total Net Assets 174,022$ 782$ 1,687$ 17,126$ (30,032)$
Condensed Statement of Revenues,
Expenses and Changes in Fund Net Assets
Operating Revenues - Customer Charges 101,311$ 228$ 400$ 4,083$ 60,229$
Depreciation Expense (10,755) (36) (119) (1,159) (5,707)
Other Operating Expenses (71,426) (123) (215) (5,889) (7,290)
Operating Income (Loss) 19,130$ 69$ 66$ (2,965)$ 47,232$Nonoperating Revenues (Expenses):
Interest Income 865$ -$ 9$ 101$ 274$
Private Grants 657 - - - -
Interest Expense (7,723) (16) (124) (856) (4,227)
Other (13) - - (29) (14,700)
Transfers-In (Out) - - - 4,547 (65,075)
Change in Net Assets 12,916$ 53$ (49)$ 798$ (36,496)$
Beginning Net Assets 161,106 729 1,736 16,328 (37,095)
Prior Period Adjustment - - - - 43,559 Ending Net Assets 174,022$ 782$ 1,687$ 17,126$ (30,032)$
Condensed Statement of Cash Flows
Net Cash Provided (Used) By:
Operating Activities 25,845$ 101$ 147$ (1,931)$ 52,931$
Net Cash Provided Concapital Activities 657 - - - -
Noncapital Financing Activities - - - 4,547 (33,286)
Capital and Related Financing Activities (62,092) (82) (204) (3,017) (15,859)
Investing Activities 1,276 - 9 72 274
Net Increase (Decrease) (34,314)$ 19$ (48)$ (329)$ 4,060$
Beginning Cash and Cash Equivalents 165,932$ 140$ 291$ 6,702$ 31,889$Ending Cash and Cash Equivalents 131,618$ 159$ 243$ 6,373$ 35,949$
Primary Government
Segment Information Financial Data
Year Ended June 30, 2010
(In Thousands)
Minnesota State Colleges and Universities
120

8/6/2019 2010 CAFR Minnesota
http://slidepdf.com/reader/full/2010-cafr-minnesota 137/265

8/6/2019 2010 CAFR Minnesota
http://slidepdf.com/reader/full/2010-cafr-minnesota 138/265

8/6/2019 2010 CAFR Minnesota
http://slidepdf.com/reader/full/2010-cafr-minnesota 139/265

8/6/2019 2010 CAFR Minnesota
http://slidepdf.com/reader/full/2010-cafr-minnesota 140/265

8/6/2019 2010 CAFR Minnesota
http://slidepdf.com/reader/full/2010-cafr-minnesota 141/265
Note 17 – Risk Management
Primary Government
The state is exposed to various risks of loss related to torts; to theft of, damage to, or destruction of assets; to errors and omissions; and to employer obligations. The state manages these risks through theRisk Management Fund (internal service fund), a self-insurance fund, and other insurance and self-
funding mechanisms. All health plans are self-insured.
Risk Management Fund
State agencies may elect to participate in the Risk Management Fund (internal service fund), which offersauto, liability, property, and related coverage. The agencies pay a premium to participate in thiscoverage. All agencies that own state vehicles are required to purchase automobile liability coveragefrom the fund.
The property coverage offers an agency a range of deductibles from $1,000 through $250,000 per loss.The fund covers the balance of the claim up to $1,000,000. The reinsurance program provides coverageup to $1,000,000,000. Once annual aggregate losses paid by the Risk Management Fund reach$4,000,000 in any one fiscal year, the reinsurer will provide coverage in excess of a $25,000 maintenance
deductible for each claim. Agencies electing not to participate in the Risk Management Fund, and notable to cover the losses from their operating budget, must seek other reimbursements or additionalappropriations from the legislature.
The liability coverage is up to the statutory limit (tort claims cap) of $500,000 bodily injury and propertydamage per person, and $1,500,000 bodily injury and property damage per occurrence. The casualtyreinsurance program provides $10,000,000 excess of a $1,000,000 retention to protect the state fromauto and general liability claims that are extra-territorial, as well as for suits brought in federal court whichwould be outside the state‟s jurisdiction.
The Risk Management Fund purchases insurance policies for state agencies seeking insurance for specialized insurance needs for which the state does not self-insure. These coverages include aviation,medical malpractice, and foster care liability. The premiums for these policies are billed back to the
agencies at cost.
Minnesota Statutes, Section 15.38, Subdivision 8, permits the purchase of insurance on state-ownedbuildings and contents.
All losses of state property are covered by programs of the Risk Management Fund, by insurance policiespurchased in the commercial market, or are uninsured and become the liability of the state.
Tort Claims
State agencies may elect to participate in the Risk Management Fund and obtain coverage for selectedexposures, subject to the tort claims limits. Agencies not electing to participate in the Risk ManagementFund are responsible for paying the cost of claims from their operating budget. The legislature also
makes an annual Tort Claim Appropriation to cover claims that would unduly impair agency operations.Agencies not able to cover claims through these two avenues must seek additional appropriations fromthe legislature. Tort claims brought outside Minnesota state jurisdiction and in Federal court haveunlimited liability exposure.
Workers' Compensation
The state, as a self-insured employer, assumes all risks for workers‟ compensation related claims andprovides workers‟ compensation insurance coverage for state employees. The program provides a full-service workers‟ compensation insurance program, including work place safety and loss control,rehabilitative and return to work services, claim services, and legal services.
125

8/6/2019 2010 CAFR Minnesota
http://slidepdf.com/reader/full/2010-cafr-minnesota 142/265

8/6/2019 2010 CAFR Minnesota
http://slidepdf.com/reader/full/2010-cafr-minnesota 143/265

8/6/2019 2010 CAFR Minnesota
http://slidepdf.com/reader/full/2010-cafr-minnesota 144/265
2010 2009
Unpaid Claims and Claim Adjustment Expenses, Beginning 895$ 975$
Incurred Claims and Claim Adjustment Expenses:Provision for Insured Events of Current Year 18,788$ 8,806$
Increases (Decreases) in Provision for Insured Events of Prior Years (316) (15)
Total Incurred Claims and Claim Adjustment Expenses 18,472$ 8,791$
Payments:Claims and Claims Adjustment Expenses Attributable to Insured
Events of Current Year 16,848$ 7,921$
Claims and Claims Adjustment Expenses Attributable to InsuredEvents of Prior Years 559 950
Total Payments 17,407$ 8,871$
Total Unpaid Claims and Claim Adjustment Expenses, Ending 1,960$ 895$
Year Ended June 30
Primary Government
Public Employee Insurance Program
Medical Claims
(In Thousands)
Component Units
Housing Finance Agency
Housing Finance Agency (HFA) is exposed to various insurable risks of loss related to tort; theft of,damage to, or destruction of assets; errors or omissions; and employer obligations. HFA manages theserisks through the primary government‟s insurance plans including the primary government‟s RiskManagement Fund and through purchased insurance coverage. HFA retains the risk of loss, although
there have been no settlements or actual losses in excess of coverage in the last three years. HFAparticipates in the State Employee Group Insurance Plan (SEGIP), which provides life insurance andhospital, medical, and dental benefits coverage through provider organizations. HFA also participates inthe primary government‟s Workers‟ Compensation Program. Annual premiums are assessed by theprogram based on average costs and claims.
Metropolitan Council
Metropolitan Council (MC) is exposed to various risks of loss related to torts; theft of, damage to, anddestruction of assets; errors and omissions; and to employer obligations. MC both purchases commercialinsurance and self-insures for these risks of loss as discussed above. MC has not experienced significantreduction in insurance coverage from the prior year. MC has not had any settlements in excess of commercial coverage for the past three years.
MC purchases general liability insurance to protect all divisions of MC and recognizes a current liability for incurred, reported claims, and a long-term liability for claims incurred but not reported. Claims liabilitiesare calculated considering recent claim settlement trends including frequency and amount of payouts.Minnesota Statutes, Section 466.04, generally limits the MC‟s tort exposure to $500,000 per claim and$1,500,000 per occurrence for a claim arising on or after July 1, 2009. For claims arising earlier, the limitsare $400,000 per claim and $1,200,000 per occurrence. In addition, an amount equal to twice theselimits applies if the claim arises out of the release or threatened release of a hazardous substance.
128

8/6/2019 2010 CAFR Minnesota
http://slidepdf.com/reader/full/2010-cafr-minnesota 145/265
MC has self-administered workers' compensation claims for all divisions. Liabilities are reported wheninformation is available that suggests there has been an occurrence with probable loss incurred.Liabilities include an amount for claims that have been incurred but not reported. Claims liabilities are re-evaluated periodically to consider recently settled claims, the frequency of claims, and other economicand social factors. Liabilities for incurred losses to be settled by fixed or reasonably determinablepayments over a long period of time are reported at their present value using a discount rate of 4.64percent. The self-insurance retention limit for workers' compensation is $1,800,000 per single loss. For
claims above the retention limit, the Workers' Compensation Reinsurance Association reimburses MC.
University of Minnesota
University of Minnesota (U of M) is self-insured for medical malpractice, general liability, directors andofficers liability, and automobile liability through RUMINCO, Ltd., a wholly-owned single parent captiveinsurance company. Claims are reported to a third-party administrator, which pays expenses and sets upreserves. The total expense of a claim is estimated and booked as a liability when it is probable that aloss has occurred, and the amount of the loss can be reasonably estimated in the year in which it isreported. In addition, an actuarial liability is established for incurred but not reported claims using adiscount rate of 1.5 percent.
U of M is also self-insured for workers' compensation through an internally maintained fund. The internal
fund for workers' compensation is maintained only to fund current year expected payouts. Excessinsurance is maintained through the Workers' Compensation Reinsurance Association. Each year, anactuarial estimate of the U of M‟s liability for workers' compensation is compiled and recorded, but theliability is not funded in a separate reserve.
U of M‟s medical (health) and dental coverage for faculty and staff is a self -insured program. Under theplan, U of M pays claims, while the administration of the program is handled by independentadministrators. U of M‟s graduate assistant medical plan and student health plan are also self-insured.Each year, an actuarial estimate of the U of M‟s liability for medical claims, including incurred but notreported claims, is recorded.
129

8/6/2019 2010 CAFR Minnesota
http://slidepdf.com/reader/full/2010-cafr-minnesota 146/265
The following table presents changes in the balances of claims liabilities during the fiscal years endedDecember 31, 2008, and 2009, or June 30, 2009, and 2010, as applicable:
Beginning
Claims
Liability
Net Additions
and Changes
in Claims
Payment of
Claims
Ending Claims
Liability
Fiscal Year Ended 12/31/08 15,931$ 6,180$ 6,793$ 15,318$
Fiscal Year Ended 12/31/09 15,318$ 7,842$ 7,351$ 15,809$
Fiscal Year Ended 6/30/09 9,757$ 1,011$ 2,848$ 7,920$
Fiscal Year Ended 6/30/10 7,920$ 2,185$ 2,287$ 7,818$
Fiscal Year Ended 6/30/09 7,374$ 10,633$ 3,875$ 14,132$
Fiscal Year Ended 6/30/10 14,132$ 2,978$ 4,427$ 12,683$
Fiscal Year Ended 6/30/09 16,162$ 219,327$ 217,232$ 18,257$
Fiscal Year Ended 6/30/10 18,257$ 239,781$ 239,394$ 18,644$
Metropolitan Council - Workers' Compensation
University of Minnesota – Medical/Dental
University of Minnesota – Workers‟ Compensation
University of Minnesota – RUMINCO, Ltd.
Component Units
Claims Liabilities
(In Thousands)
130

8/6/2019 2010 CAFR Minnesota
http://slidepdf.com/reader/full/2010-cafr-minnesota 147/265

8/6/2019 2010 CAFR Minnesota
http://slidepdf.com/reader/full/2010-cafr-minnesota 148/265

8/6/2019 2010 CAFR Minnesota
http://slidepdf.com/reader/full/2010-cafr-minnesota 149/265
b) ACS State and Local Solutions, Inc. v. State of Minnesota, through its Commissioner of the Department of Human Services (Ramsey County District Court). In May, 2003, the MinnesotaDepartment of Human Services (“DHS”) entered into a software development contract with anentity known as SSi North America. Under the contract, SSi was to develop and deliver a web-based software program known as “HealthMatch,” intended to combine and automate certainevaluation and decision-making tasks regarding eligibility for several health care assistanceprograms administered by DHS. The HealthMatch contract was subsequently assigned to Albion,
Inc., which was owned by SSi, and later, the assets of Albion, Inc., including the HealthMatchcontract, were purchased by ACS State and Local Solutions, Inc. Initially, the contract was tocontinue until May, 2005, but as difficulties arose with regard to completion of the software, it waseventually extended to May, 2008. In March, 2008, DHS determined that satisfactory progresstoward completion was not being made and terminated the contract. ACS filed suit on September 9, 2008, claiming damages in excess of $50,000 based on breach of contract, quantum meruit(just compensation for work performed), and unjust enrichment. While denying liability, DHSestimates that a decision favorable to plaintiff ACS could result in an impact on the General Fundin excess of $15 million. The court granted in part DHS‟s motion for summary judgment anddismissed ACS‟s claims for quantum merit and unjust enrichment. On October 21, 2010,argument was held on ACS‟s motion for summary judgment on DHS‟s counter claim. At thepresent time, the motion is under advisement. The court has set the case on for trial during athree week block beginning on March 14, 2011.
c) Alliance Pipeline, L.P. v. Commissioner of Revenue, et al. (Minnesota Tax Court). Allianceoperates a natural gas pipeline company and owns and operates property throughout 13Minnesota counties. In mid-October 2009, Alliance filed an appeal in Minnesota Tax Courtchallenging the Commissioner‟s 2009 assessment of Alliance‟s natural gas pipeline property inMinnesota. The legal issues in this appeal are very similar to the legal challenges raised in theMERC appeals below. Alliance challenges the assessment asserting that the Commissioner hasfailed to correctly determine the market value of the property as defined by Minnesota Statutes,Section 272.03, Subdivision 8. Alliance also challenges Minnesota Rule 8100 to the extent itexceeds the Commissioner‟s statutory authority arguing that it creates a valuation process whichdoes not value utility property at its fair market value. Alliance also challenges the rule asunconstitutional in violation of the Equal Protection Clause, the Uniformity Clause and the DueProcess Clause of the Minnesota Constitution and the Equal Protection and Due ProcessClauses of the U.S. Constitution. Alliance also alleges the Commissioner‟s assessment violatesthe Commerce Clause of the U.S. Constitution.
d) Electric Cooperative Assessment Cases (Minnesota Tax Court). This series of separate appealsfiled against the Commissioner of Revenue in Tax Court currently involves 15 electric coops (withlikely 7 more to be filed soon for a total of 22 cases). Each electric cooperative has appealed theCommissioner‟s assessment of sales tax for varying periods generally ranging from 2003 through2006. Each electric cooperative estimates costs for its members as it bills those membersthroughout the year and collects sales tax based on those estimates. At year‟s end, if thecooperative has charged members in excess of the actual costs, it issues patronage adjustmentsin the form of “capital credits” to the members for the difference in cost. After doing so, theappellants filed for a refund in the sales tax paid on the difference between the actual andestimated costs. The Department initially paid the refunds to each appellant but later issuedassessments for the amounts that had been refunded. Citing Minnesota Rule 8130.1100,
Subpart 5 (stating that when part of contribution is credited back to patron‟s capital account after sale, credited amount is included in taxable sales price), the Department denied each appellant‟sadministrative appeal. The state filed Returns and Answers in 13 of these files on August 9,2010, with the rest due soon. There are an estimated 44 electric coops in the state who aresimilarly situated to the 15 (soon to be 22) electric coops who have filed appeals in TaxCourt. The total financial potential impact to the state of the Commissioner losing the legal issuein these cases is approximately $20.9 million in one-time refunds with an on-going annual impactof $4.2 million
133

8/6/2019 2010 CAFR Minnesota
http://slidepdf.com/reader/full/2010-cafr-minnesota 150/265
e) The Home Insurance Company v. Special Compensation Fund, and Minnesota Department of Labor and Industry (Ramsey County District Court). The Home Insurance Company (“Home”)seeks a declaration that it is entitled to reimbursement from the Special Compensation Fund(special revenue fund) for certain workers‟ compensation payments Home has made. Home,which is in liquidation, seeks the reimbursement to which it claims it is entitled under the s tate‟sworkers‟ compensation scheme, and without recourse to the General Fund. DefendantsMinnesota Department of Labor and Industry and Special Compensation Fund have denied
Home‟s requests for reimbursement, raising various statutory defenses and stating that Home isnot entitled to reimbursement under the law. Home claims it is entitled to $21 million in past andfuture reimbursements. Summary judgment motions of both parties were heard in May 2010.Defendants asked to have Plaintiffs' complaint dismissed. The district court granted partialsummary judgment in favor of the plaintiff in the amount of $7,265,246, and denied summary judgment as premature as to future payments on qualifying claims. The state is consideringoptions, including appeal.
f) Jensen, et al. v. METO, et al. (U.S District Court). Parents/guardians of several patients/former patients of the Minnesota Extended Treatment Options (“METO”) program allege violations of various state and federal constitutional and statutory rights because of alleged misuse of restraints and seclusion of people committed in part because of developmental disabilities andseek class action status, money damages and injunctive relief. A tentative settlement on
monetary issues was reached (with the state contributing $2.8 million) but a settlement has notbeen finalized.
g) Minnesota Energy Resources Corp. v. Commissioner of Revenue (Minnesota Tax Court). Theplaintiff, a natural gas pipeline corporation, appeals the market valuations made of the pipelinecorporation‟s real, personal and operating property subject to assessment in 53 counties inMinnesota. The separate appeals for tax years 2008, 2009, and 2010 are consolidated.The pipeline corporation argues: (1) that the Commissioner has failed to correctly determine themarket value (as defined in Minnesota Statutes, Section 272.03, Subdivision 8) of the pipeline'sproperty in Minnesota and in its determination has employed methods which overstate the marketvalue and arrived at a value in excess of market value; and (2) that the pipeline's property inMinnesota was unfairly and unequally assessed compared to property in the same class and theproperty of similarly situated taxpayers in violation of Minnesota Statutes, Section 273.11, theEqual Protection Clause; the Uniformity of Taxation Clause (art. X, sec. 1) and the Due Processclause of the Minnesota Constitution and the Equal Protection and Due Process Clause of U.S.Constitution. The apportionable 2008 market value for this property is $126 million. A new rulegoverns calculation for the 2009 tax year. MERC objects to both the old and new Rules.Specifically, MERC disagrees with how the capitalization rate is calculated, the fact that externalobsolescence is not included in depreciation, the weighting of cost factors and claim that theproperty tax assessments are not applied evenly throughout Minnesota.
h) R.J. Reynolds Tobacco Co. v. Comm'r of Revenue (Minnesota Tax Court). This is a corporatefranchise case where the taxpayer originally reported a $2.9 billion sale from the sale of certaininternational business operations as business income apportionable to Minnesota whichincreased its sales factor denominator by the gain amount. The Commissioner excluded gainfrom the company's sales factor and made no adjustment to the taxable income. The taxpayer objected, arguing that the business income must be represented in the apportionment factors to
avoid distortion, or in the alternative, the gain must be deemed non-business income because thetaxpayer did not conduct a unitary business with its international operations. The Commissioner rejected both arguments and also allowed only an 80% deduction for dividends received from aforeign subsidiary, rather than a 100% deduction. The Commissioner denied the taxpayer‟srefund claim asserting that the gain from the sale of trademark assets ($2.6 billion) was non-business income. The amount at issue with this particular taxpayer is $3.2 million plus $1.2million in a denied refund claim. If the Commissioner‟s decision is not upheld, the Commissioner estimates that the outcome of this litigation will affect similarly situated taxpayers resulting in aprospective loss of $8 million per year starting in FY 2011, and a retroactive effect of $24 millionfor FY 2011.
134

8/6/2019 2010 CAFR Minnesota
http://slidepdf.com/reader/full/2010-cafr-minnesota 151/265

8/6/2019 2010 CAFR Minnesota
http://slidepdf.com/reader/full/2010-cafr-minnesota 152/265

8/6/2019 2010 CAFR Minnesota
http://slidepdf.com/reader/full/2010-cafr-minnesota 153/265
State of Minnesota
2010
Comprehensive
Annual
Financial Report
Required
Supplementary
Information
137

8/6/2019 2010 CAFR Minnesota
http://slidepdf.com/reader/full/2010-cafr-minnesota 154/265
MINNESOTA
Headwaters of the mighty Mississippi
138

8/6/2019 2010 CAFR Minnesota
http://slidepdf.com/reader/full/2010-cafr-minnesota 155/265

8/6/2019 2010 CAFR Minnesota
http://slidepdf.com/reader/full/2010-cafr-minnesota 156/265

8/6/2019 2010 CAFR Minnesota
http://slidepdf.com/reader/full/2010-cafr-minnesota 157/265
The criteria for placing a bridge in each of the three categories are as follows:
Rating Description
Good If all of the condition codes are 7 or greater, and if both of the appraisal ratings are 6 or greater.
Fair If any of the condition codes are 5 or 6, or if either of the appraisal ratings are 3, 4, or 5.
Poor If any of the condition codes are 4 or less, or if either of the appraisal ratings are 2 or less. This is also defined as structurally deficient.
Established Condition Level
Ninety-two percent of principal arterial system bridges will be maintained at fair to good, while 80 percentof all other system bridges will be maintained at fair to good.
Assessed Conditions
Principal Arterial 2009 2008 2007
Fair to Good 94.0% 93.5% 97.6%
All Other Systems 2009 2008 2007
Fair to Good 90.4% 90.2% 93.2%
Budgeted and Estimated Costs to Maintain
The following table presents the state’s estimate of spending necessary to preserve and maintain theroads and bridges at, or above, the “Established Condition Levels” cited above, and the actual amountspent (in thousands):
Bridges Pavement Total Costs Bridges Pavement Total Costs
TotalConstruction
Program
Budget 2010 128,668$ 391,274$ 519,942$ 14,172$ 328,573$ 342,745$ 862,687$
2009 153,692 357,479 511,171 12,312 250,415 262,727 773,898
2008 183,449 308,443 491,892 10,836 223,926 234,762 726,654
2007 148,320 480,900 629,220 63,835 223,476 287,311 916,531
2006
(1)
773,735 301,852 1,075,587
Actual 2010 142,295$ 188,096$ 330,391$ 71,361$ 531,980$ 603,341$ 933,732$
2009 175,274 257,489 432,763 37,994 408,090 446,084 878,847
2008 252,306 279,664 531,970 35,341 364,939 400,280 932,250
2007 150,497 253,040 403,537 15,125 312,567 327,692 731,229
2006 (1) 451,935 360,835 812,770
(1) Due to system limitations, bridge and pavement costs are combined for the year ended June 30, 2006.
Maintenance of SystemCosts to be Capitalized
141

8/6/2019 2010 CAFR Minnesota
http://slidepdf.com/reader/full/2010-cafr-minnesota 158/265

8/6/2019 2010 CAFR Minnesota
http://slidepdf.com/reader/full/2010-cafr-minnesota 159/265
CERF JRF LRF SPRFActuarial Valuation Date 2009(1) 7/1/2009 7/1/2009 7/1/2009 7/1/2009
2008 7/1/2008 7/1/2008 7/1/2008 7/1/20082007 7/1/2007 7/1/2007 7/1/2007 7/1/2007
Actuarial Value of Plan Assets 2009 $ 590,339 $ 147,120 $ 28,663 $ 584,501
2008 $ 572,719 $ 147,542 $ 39,209 $ 595,0822007 $ 559,852 $ 153,562 $ 44,869 $ 617,901
Actuarial Accrued Liability 2009 $ 821,250 $ 241,815 $ 90,431 $ 725,3342008 $ 760,363 $ 231,623 $ 86,131 $ 693,6862007 $ 708,292 $ 214,297 $ 86,449 $ 673,444
Total Unfunded Actuarial 2009 $ 230,911 $ 94,695 $ 61,768 $ 140,833Liability 2008 $ 187,644 $ 84,081 $ 46,922 $ 98,604
2007 $ 148,440 $ 60,735 $ 41,580 $ 55,543
Funded Ratio(2) 2009 72% 61% 32% 81%
2008 75% 64% 46% 86%
2007 79% 72% 52% 92%
Annual Covered Payroll 2009 $ 193,445 $ 39,444 $ 1,963 $ 61,5112008 $ 194,391 $ 38,296 $ 1,993 $ 60,0292007 $ 167,727 $ 36,195 $ 2,380 $ 61,498
Ratio of Unfunded Actuarial 2009 119% 240% 3147% 229%Liability to Annual Covered 2008 97% 220% 2354% 164%Payroll 2007 89% 168% 1747% 90%
(2)Actuarial value of assets as a percent of actuarial accrued liability.
Required Supplementary Information
Schedule of Funding Progress
(In Thousands)
(1)The July 1, 2009, Annual Valuation Report is the most recently issued report available.
143

8/6/2019 2010 CAFR Minnesota
http://slidepdf.com/reader/full/2010-cafr-minnesota 160/265
Actuarial Measures of Other Postemployment Benefits Funding Progress
The state of Minnesota offers other postemployment benefits to state employees and their dependentsthrough a single-employer defined benefit heath care plan.
Actuarial Valuation Date 2010(1) 7/1/2008
2009 7/1/20082008 7/1/2006
Actuarial Value of Plan Assets 2010 $ -2009 $ -
2008 $ -
Actuarial Accrued Liability 2010 $ 754,801
2009 $ 754,8012008 $ 659,044
Total Unfunded Actuarial Liability 2010 $ 754,8012009 $ 754,8012008 $ 659,044
Funded Ratio(2) 2010 0%
2009 0%
2008 0%
Annual Covered Payroll 2010 $ 2,785,3352009 $ 2,785,3352008 $ 2,838,228
Ratio of Unfunded Actuarial 2010 27%Liability to Annual Covered Payroll 2009 27%
2008 23%
(1)The July 1, 2008, Annual Valuation Report is the most recently issued report available.
(2)
Actuarial value of assets as a percent of actuarial accrued liability.
Required Supplementary Information
Schedule of Funding Progress
(In Thousands)
144

8/6/2019 2010 CAFR Minnesota
http://slidepdf.com/reader/full/2010-cafr-minnesota 161/265

8/6/2019 2010 CAFR Minnesota
http://slidepdf.com/reader/full/2010-cafr-minnesota 162/265
4. This section shows the cumulative net amounts paid as of the end of successive years for eachpolicy year.
5. This line shows the latest re-estimated amount of claims assumed by reinsurers as of the end of thecurrent year for each policy year.
6. This section shows how each policy year’s net incurred claims increased or decreased as of the
end of successive years. (This annual re-estimation results from new information received onknown claims, re-evaluation of existing information on known claims, and emergence of new claimsnot previously known.)
7. This line compares the latest re-estimated net incurred claims amount to the amount originallyestablished (section 3) and shows whether this latest estimate of net claims cost is greater or lessthan originally thought. As data for individual policy years mature, the correlation between originalestimates and re-estimated amounts commonly is used to evaluate the accuracy of net incurredclaims currently recognized in less mature policy years. The columns of the table show data for successive policy years.
146

8/6/2019 2010 CAFR Minnesota
http://slidepdf.com/reader/full/2010-cafr-minnesota 163/265
State of Minnesota
2010
Comprehensive
Annual
Financial Report
Combining and
Individual Fund
Statements –
Nonmajor Funds
147

8/6/2019 2010 CAFR Minnesota
http://slidepdf.com/reader/full/2010-cafr-minnesota 164/265

8/6/2019 2010 CAFR Minnesota
http://slidepdf.com/reader/full/2010-cafr-minnesota 165/265
State of Minnesota
2010
Comprehensive
Annual
Financial Report
Nonmajor
Special Revenue,
Debt Service,
Permanent and
Capital Projects
Funds
Debt Service
Debt Service Fund
The fund accounts for the accumulation of resources for, and thepayment of, most general obligation long-term debt principal andinterest as well as lease-purchase financing for technologyimprovement.
Permanent Fund
Permanent School Fund
The constitutionally established trust fund receives revenue frominvestments and the sale of state land and timber for distribution toschool districts.
149

8/6/2019 2010 CAFR Minnesota
http://slidepdf.com/reader/full/2010-cafr-minnesota 166/265
STATE OF MINNESOTA
NONMAJOR GOVERNMENTAL FUNDS - BY FUND TYPECOMBINING BALANCE SHEETJUNE 30, 2010
(IN THOUSANDS)
ASSETS
Cash and Cash Equivalents................................................... $ 1,971,900 $ 611,485 $ 111,755 $ 237,632 $ 2,932,772 Investments............... ........................................... ................... 66,814 59,713 565,587 - 692,114 Accounts Receivable.............................................................. 346,267 - 5,365 - 351,632 Interfund Receivables............................................................. 219,903 - 20 - 219,923 Due from Component Units.................................................... - 118,250 - - 118,250 Accrued Investment/Interest Income...................................... 542 381 4,294 - 5,217 Federal Aid Receivable......... ........................................... ....... 32,554 - - - 32,554 Inventories..... ........................................... ............................... 29,578 - - - 29,578 Loans and Notes Receivable................................................. 46,745 - - 262 47,007 Deferred Costs.........……………............................................ 1,453 - - 15,855 17,308 Securities Lending Collateral.................................................. 4,105 - 34,617 - 38,722 Investment in Land……………………………………………… - - 16,008 - 16,008
Total Assets........................................................................ $ 2,719,861 $ 789,829 $ 737,646 $ 253,749 $ 4,501,085
LIABILITIES AND FUND BALANCESLiabilities:
Accounts Payable............................................................... $ 361,323 $ - $ 6 $ 43,106 $ 404,435 Interfund Payables......................... ..................................... 227,324 25,382 8,571 5,641 266,918 Due to Component Units.................................................... 1,618 - - - 1,618 Deferred Revenue.............................................................. 149,575 - - - 149,575 Securities Lending Liabilities............................................ 4,105 - 34,617 - 38,722
Total Liabilities................................................................ $ 743,945 $ 25,382 $ 43,194 $ 48,747 $ 861,268
Fund Balances:Nonspendable……………………………………………… $ 29,578 $ - $ 688,891 $ - $ 718,469 Restricted…………………………….……………………… 1,409,329 764,447 5,561 201,082 2,380,419 Committed……………………………..…………………… 537,009 - - - 537,009 Assigned……………………………….…………………… - - - 3,920 3,920
Total Fund Balances ..................................................... $ 1,975,916 $ 764,447 $ 694,452 $ 205,002 $ 3,639,817
Total Liabilities and Fund Balances ......................... $ 2,719,861 $ 789,829 $ 737,646 $ 253,749 $ 4,501,085
TOTALSPECIAL
REVENUECAPITAL
PROJECTSSCHOOL
PERMANENT
DEBTSERVICE
PERMANENT
150

8/6/2019 2010 CAFR Minnesota
http://slidepdf.com/reader/full/2010-cafr-minnesota 167/265

8/6/2019 2010 CAFR Minnesota
http://slidepdf.com/reader/full/2010-cafr-minnesota 168/265
State of Minnesota
2010
Comprehensive
Annual
Financial Report
Nonmajor
Special Revenue Funds
Trunk Highway Fund
The fund receives a portion of the revenue from taxes on motor
vehicles and motor fuels and federal grants to plan, design,
construct, and maintain the state trunk highway system.
Highway User Tax Distribution Fund
The fund receives a portion of the revenue from taxes on motor vehicles and motor fuels to administer vehicle licensing services.
State Airports Fund
The fund uses revenue from aviation-related taxes and fees to
provide technical and financial assistance to municipal airports and
to promote aviation safety, planning, and regulation.
Municipal State-Aid Street Fund
The fund receives a portion of the revenue from taxes on motor
vehicles and motor fuels primarily for distribution to municipalities for
improvement of streets.
County State-Aid Highway Fund
The fund receives a portion of the revenue from taxes on motor
vehicles and motor fuels for distribution to counties for improvement
of county roads.
Petroleum Tank Cleanup Fund
The fund receives funding from a fee imposed on petroleum
distributors to reimburse responsible parties for most of their costs
to clean up environmental contamination from petroleum tanks.
152

8/6/2019 2010 CAFR Minnesota
http://slidepdf.com/reader/full/2010-cafr-minnesota 169/265
Nonmajor Special Revenue Funds – Cont’d.
Natural Resources Fund
The fund receives taxes from fuel used inrecreational vehicles, and fees and donations thatare used to fund management of the related naturalresource programs.
Game and Fish Fund
The fund receives revenues from license fees andfines related to hunting and fishing which are spentfor related purposes
Environmental and Remediation Fund
The fund accounts for activities that monitor andcontrol environmental problems using taxes and
fees from activities and industries contributing toenvironmental problems. It also accounts for activities that respond to and correct releases of hazardous substances, pollutants, chemicals, andpetroleum, as well as environmental actions atqualified landfill facilities.
Douglas J. Johnson Economic Protection TrustFund
The fund receives distribution from taconiteproduction taxes to be held in trust or expended onlyin economic emergency for the purposes of rehabilitation and diversification of industry in the
area largely dependent on the taconite miningindustry.
Endowment Fund
The fund receives gifts, donations, and endowmentsthat may be expended only for those purposesspecified by the onors.
Special Compensation Fund
The fund receives assessments on all insurers for administration of the state workers’ compensationprogram, including enforcement; for reimbursement
of certain supplemental benefits; and for payment of claims to employees of uninsured and bankruptfirms.
Health Care Access Fund
The fund receives taxes on health service providersand premiums for programs to help contain the costsof health care, make reforms in health insurance,and provide competitively-priced insurance for people unable to obtain affordable coverage
Health Care Access Fund
The fund receives taxes on health service providers
and premiums for programs to help contain the costsof health care, make reforms in health insurance,and provide competitively-priced insurance for people unable to obtain affordable coverage
Workforce Development Fund
The fund receives special assessments levied onemployers for employment and training programs.
Heritage Fund
The fund receives a portion of sales and use taxesto restore, protect, and enhance the outdoors, water
quality, parks and trails, and arts and culturalheritage.
Miscellaneous Special Revenue Fund
The fund includes numerous smaller accountswhose revenues are restricted or committed to avariety of specific purposes.
153

8/6/2019 2010 CAFR Minnesota
http://slidepdf.com/reader/full/2010-cafr-minnesota 170/265
STATE OF MINNESOTA
NONMAJOR SPECIAL REVENUE FUNDSCOMBINING BALANCE SHEETJUNE 30, 2010
(IN THOUSANDS)
ASSETS
Cash and Cash Equivalents...................................... $ 369,321 $ 19,094 $ 18,561 $ 131,988 $ 396,632 Investments.............................................................. - - - - - Accounts Receivable................................................ 16,296 79,784 716 442 1,850 Interfund Receivables............................................... 62,914 25,214 - 8,611 32,786 Accrued Investment/Interest Income........ ....... ........ .. - - - - - Federal Aid Receivable............................................. 30,552 - - - - Inventories................................................................ 29,578 - - - - Loans and Notes Receivable.................................... - - 2,339 - - Deferred Costs.........……………............................... - - - - - Securities Lending Collateral.................................... - - - - -
Total Assets.......................................................... $ 508,661 $ 124,092 $ 21,616 $ 141,041 $ 431,268
LIABILITIES AND FUND BALANCESLiabilities:
Accounts Payable................................................. $ 79,847 $ 1,407 $ 2,573 $ 17,962 $ 62,385 Interfund Payables................................................ - 116,466 - - - Due to Component Units....................................... - - - - - Deferred Revenue................................................. 5,241 5,834 - 2 - Securities Lending Liabilities................................. - - - - -
Total Liabilities.................................................. $ 85,088 $ 123,707 $ 2,573 $ 17,964 $ 62,385
Fund Balances:Nonspendable……………………………………… $ 29,578 $ - $ - $ - $ - Restricted……………………………………………. 393,995 385 19,043 123,077 368,883 Committed…………………………………………… - - - - -
Total Fund Balances................................ $ 423,573 $ 385 $ 19,043 $ 123,077 $ 368,883
Total Liabil it ies and Fund Balances...... $ 508,661 $ 124,092 $ 21,616 $ 141,041 $ 431,268
HIGHWAY DISTRIBUTION AIRPORTSTRUNK USER TAX STATE STATE-AID
HIGHWAY MUNICIPAL COUNTYSTATE-AID
STREET HIGHWAY
154

8/6/2019 2010 CAFR Minnesota
http://slidepdf.com/reader/full/2010-cafr-minnesota 171/265
$ 18,473 $ 38,156 $ 36,356 $ - $ - $ - $ 75,443 - - 5,778 - - - 530 - 2,988 380 - - - 12,969
6,697 15,368 953 - - - 12,309 - - 31 - - - - - - 2,002 - - - - - - - - - - - - - - - - - 932 - - - - - - - - - 345 - - - 30
$ 25,170 $ 56,512 $ 45,845 $ - $ - $ - $ 102,213
$ 3,209 $ 4,622 $ 8,193 $ - $ - $ - $ 6,990 1,330 20 384 - - - -
- 432 4 - - - - 1 1,096 51 - - - 7,295 - - 345 - - - 30
$ 4,540 $ 6,170 $ 8,977 $ - $ - $ - $ 14,315
$ - $ - $ - $ - $ - $ - $ - 20,630 - 36,868 - - - 87,898
- 50,342 - - - - -
$ 20,630 $ 50,342 $ 36,868 $ - $ - $ - $ 87,898
$ 25,170 $ 56,512 $ 45,845 $ - $ - $ - $ 102,213
MENTAL
ENVIRONMENTAL
REMEDIATIONRESOURCESENVIRON-NATURAL ANDGAME AND
FISHRESOURCES REMEDIATIONAND NATURALENVIRONMENT
TANKCLEANUP
PETROLEUM
155

8/6/2019 2010 CAFR Minnesota
http://slidepdf.com/reader/full/2010-cafr-minnesota 172/265

8/6/2019 2010 CAFR Minnesota
http://slidepdf.com/reader/full/2010-cafr-minnesota 173/265
$ 30,129 $ 287,988 $ - $ 15,930 $ 316,127 $ 1,971,900 - - - - - 66,814
110,798 97,068 - 15,392 5,083 346,267 - - - 23 32,867 219,903 - - - - - 542 - - - - - 32,554 - - - - - 29,578 - - - - - 46,745 - - - - - 1,453 - - - - - 4,105
$ 140,927 $ 385,056 $ - $ 31,345 $ 354,077 $ 2,719,861
$ 9,646 $ 83,888 $ - $ 3,286 $ 66,247 $ 361,323 - 52,647 - - 56,447 227,324 - 40 - - 802 1,618
111,834 4,766 - 558 12,897 149,575 - - - - - 4,105
$ 121,480 $ 141,341 $ - $ 3,844 $ 136,393 $ 743,945
$ - $ - $ - $ - $ - $ 29,578 19,447 - - 27,501 144,253 1,409,329
- 243,715 - - 73,431 537,009
$ 19,447 $ 243,715 $ - $ 27,501 $ 217,684 $ 1,975,916
$ 140,927 $ 385,056 $ - $ 31,345 $ 354,077 $ 2,719,861
MEDICALEDUCATIONANDSPECIAL
HEALTH
COMPENSATION ACCESSCARE
TOTALDEVELOPMENT
MISCELLANEOUS
RESEARCHSPECIALWORKFORCE
REVENUE
157

8/6/2019 2010 CAFR Minnesota
http://slidepdf.com/reader/full/2010-cafr-minnesota 174/265
STATE OF MINNESOTA
NONMAJOR SPECIAL REVENUE FUNDSCOMBINING STATEMENT OF REVENUES, EXPENDITURESAND CHANGES IN FUND BALANCESYEAR ENDED JUNE 30, 2010
(IN THOUSANDS)
Net Revenues:Sales Taxes..................................................................... $ - $ - $ - $ - $ - Motor Vehicle Taxes........................................................ 437,191 5,356 13,842 63,463 241,606 Fuel Taxes....................................................................... 471,928 2,003 3,329 68,505 260,802 Other Taxes..................................................................... - - - - - Federal Revenues........................................................... 542,828 - - 256 432 Licenses and Fees........................................................... 3,298 4,247 652 - - Departmental Services.................................................... 1,686 - - - - Investment/Interest Income............................................. 2,632 164 143 1,124 3,186 Penalties and Fines......................................................... 6 419 - - - Securities Lending Income............................................... - - - - -
Other Revenues............................................................... 22,366 439 - - -
Net Revenues.............................................................. $ 1,481,935 $ 12,628 $ 17,966 $ 133,348 $ 506,026
Expenditures:Current:
Public Safety and Corrections………………………… $ 84,670 $ 8,002 $ - $ - $ - Transportation…………………………………………… 935,803 23 15,273 134,744 457,975 Agricultural, Environmental and Energy Resources… - - - - - Economic and Workforce Development……………… - - - - - General Education……………………………………… - - - - - Higher Education………………………………………… - - - - - Health and Human Services…………………………… - - - - - General Government................................................... 393 2,058 - - - Intergovernment Aid……………………………………… - - - - - Securities Lending Rebates and Fees......................... - - - - -
Total Current Expenditures...................................... $ 1,020,866 $ 10,083 $ 15,273 $ 134,744 $ 457,975
Capital Outlay.................................................................. 357,383 - - - - Debt Service.................................................................... 4,097 30 - - -
Total Expenditures....................................................... $ 1,382,346 $ 10,113 $ 15,273 $ 134,744 $ 457,975
Excess of Revenues Over (Under) Expenditures................. $ 99,589 $ 2,515 $ 2,693 $ (1,396) $ 48,051
Other Financing Sources (Uses):Transfers-In..................................................................... $ 9,034 $ - $ - $ - $ 1 Transfers-Out.................................................................. (70,594) (2,205) - - - Capital Leases................................................................. 2,253 - - - -
Net Other Financing Sources (Uses)........................... $ (59,307) $ (2,205) $ - $ - $ 1
Net Change in Fund Balances………………………………… $ 40,282 $ 310 $ 2,693 $ (1,396) $ 48,052
Fund Balances, Beginning, as Reported.............................. $ 378,915 $ 75 $ 16,350 $ 124,473 $ 320,831
Change in Fund Structure………………………………… - - - - - Fund Balances, Beginning, as Restated.............................. $ 378,915 $ 75 $ 16,350 $ 124,473 $ 320,831
Change in Inventory......................................................... 4,376 - - - -
Fund Balances, Ending.............................................……… $ 423,573 $ 385 $ 19,043 $ 123,077 $ 368,883
TRUNKHIGHWAY STREET HIGHWAY
STATE-AID STATE-AIDHIGHWAYUSER TAX
DISTRIBUTIONSTATE
AIRPORTS
MUNICIPAL COUNTY
158

8/6/2019 2010 CAFR Minnesota
http://slidepdf.com/reader/full/2010-cafr-minnesota 175/265
$ - $ - $ - $ - $ - $ - $ - - - - - - - - - 18,774 - - - - - - - - - - - 48,465 - 238 26,213 - - - -
13,094 20,408 56,704 - - - 33,151 - 20,975 2,053 - - - 93
229 124 969 - - - 6,173 - 88 267 - - - 2,369 - - 3 - - - -
85 3,035 234 - - - 14,551
$ 13,408 $ 63,642 $ 86,443 $ - $ - $ - $ 104,802
$ - $ - $ - $ - $ - $ - $ 69 - 4,804 - - - - -
4,951 66,235 94,258 - - - 99,435 4,529 - - - - - 1,114
- 160 - - - - - - - - - - - - - - - - - - 266 - - - - - - 488 - - - - - - - - - 1 - - - -
$ 9,480 $ 71,199 $ 94,259 $ - $ - $ - $ 101,372
- 1,025 4,042 - - - - - - - - - - -
$ 9,480 $ 72,224 $ 98,301 $ - $ - $ - $ 101,372
$ 3,928 $ (8,582) $ (11,858) $ - $ - $ - $ 3,430
$ 920 $ 14,698 $ 12,630 $ - $ - $ - $ 7,559 (12,024) (29) (1,801) - - - (920)
- - - - - - -
$ (11,104) $ 14,669 $ 10,829 $ - $ - $ - $ 6,639
$ (7,176) $ 6,087 $ (1,029) $ - $ - $ - $ 10,069
$ 27,806 $ 44,255 $ 37,897 $ 436,124 $ 19,240 $ 58,589 $ -
- - - (436,124) (19,240) (58,589) 77,829 $ 27,806 $ 44,255 $ 37,897 $ - $ - $ - $ 77,829
- - - - - - -
$ 20,630 $ 50,342 $ 36,868 $ - $ - $ - $ 87,898
CONTINUED
REMEDIATIONANDENVIRON-
MENTAL
ENVIRONMENT ENVIRONMENTALPETROLEUMTANK
CLEANUP REMEDIATIONRESOURCESNATURAL GAME AND
FISHAND NATURALRESOURCES
159

8/6/2019 2010 CAFR Minnesota
http://slidepdf.com/reader/full/2010-cafr-minnesota 176/265
STATE OF MINNESOTA
NONMAJOR SPECIAL REVENUE FUNDS (CONTINUED)COMBINING STATEMENT OF REVENUES, EXPENDITURESAND CHANGES IN FUND BALANCESYEAR ENDED JUNE 30, 2010
(IN THOUSANDS)
Net Revenues:Sales Taxes.................................................................... $ - $ - $ 229,958 $ - $ - Motor Vehicle Taxes....................................................... - - - - - Fuel Taxes...................................................................... - - - - - Other Taxes.................................................................... - 4,260 - - - Federal Revenues........................................................... - - - - - Licenses and Fees.......................................................... - - - - - Departmental Services.................................................... - 140 - - - Investment/Interest Income............................................. - 8,178 348 192 - Penalties and Fines........................................................ - - - - - Securities Lending Income.............................................. - 21 - - -
Other Revenues.............................................................. - 63 - 11,607 -
Net Revenues............................................................. $ - $ 12,662 $ 230,306 $ 11,799 $ -
Expenditures:Current:
Public Safety and Corrections………………………… $ - $ - $ - $ 170 $ - Transportation…………………………………………… - - 898 - - Agricultural, Environmental and Energy Resources… - - 39,667 4,932 - Economic and Workforce Development……………… - 3,934 2,202 1,441 - General Education……………………………………… - - 8,385 1,399 - Higher Education………………………………………… - - 1,150 - - Health and Human Services…………………………… - - 361 408 - General Government.................................................. - - 20,952 486 - Intergovernment Aid…………………………………… - - - - - Securities Lending Rebates and Fees........................ - 7 - - -
Total Current Expenditures..................................... $ - $ 3,941 $ 73,615 $ 8,836 $ -
Capital Outlay................................................................. - - 3,553 3,976 - Debt Service................................................................... - 697 - - -
Total Expenditures...................................................... $ - $ 4,638 $ 77,168 $ 12,812 $ -
Excess of Revenues Over (Under) Expenditures................ $ - $ 8,024 $ 153,138 $ (1,013) $ -
Other Financing Sources (Uses):Transfers-In.. .. .. .. .. .. .. .. ... .. .. .. .. .. ... .. .. .. .. .. ... .. .. .. .. .. .. .. ... .. .. .. $ - $ 1,145 $ - $ - $ - Transfers-Out.................................................................. - - (1,950) (30) - Capital Leases................................................................ - - - - -
Net Other Financing Sources (Uses).......................... $ - $ 1,145 $ (1,950) $ (30) $ -
Net Change in Fund Balances……………………………… $ - $ 9,169 $ 151,188 $ (1,043) $ -
Fund Balances, Beginning, as Reported............................. $ 74,336 $ 160,352 $ - $ 17,204 $ 72,651
Change in Fund Structure………………………………… (74,336) - - - (72,651) Fund Balances, Beginning, as Restated............................. $ - $ 160,352 $ - $ 17,204 $ -
Change in Inventory........................................................ - - - - -
Fund Balances, Ending....................................................... $ - $ 169,521 $ 151,188 $ 16,161 $ -
ENDOWMENT
MAXIMUMEFFORTSCHOOL
D J JOHNSON
PROTECTIONIRON RANGE
RESOURCES &ECONOMIC
HERITAGE LOANTRUSTREHABILITATION
160

8/6/2019 2010 CAFR Minnesota
http://slidepdf.com/reader/full/2010-cafr-minnesota 177/265
$ - $ - $ - $ - $ - $ 229,958 - - - - - 761,458 - - - - - 825,341
91,304 534,495 - 50,071 31,263 759,858 - - - - 12,912 582,879
73 - - - 177,022 308,649 859 806 - - 97,847 124,459 256 2,048 - 176 696 26,638
5,077 - - - 9,062 17,288 - - - - - 24
1,337 7,161 - 50 219,268 280,196
$ 98,906 $ 544,510 $ - $ 50,297 $ 548,070 $ 3,916,748
$ - $ - $ - $ - $ 86,204 $ 179,115 - - - - 25,903 1,575,423 - - - - 47,694 357,172
95,304 2 - 52,204 32,444 193,174 - - - - 19,595 29,539 - - - - 22,250 23,400 - 541,121 - - 337,985 880,141
6,768 1,784 - - 32,508 65,437 - - - - 254 254 - - - - - 8
$ 102,072 $ 542,907 $ - $ 52,204 $ 604,837 $ 3,303,663
- - - - 7,482 377,461 - 623 - - 983 6,430
$ 102,072 $ 543,530 $ - $ 52,204 $ 613,302 $ 3,687,554
$ (3,166) $ 980 $ - $ (1,907) $ (65,232) $ 229,194
$ - $ - $ - $ 1,450 $ 136,168 $ 183,605 (1,425) (89,083) - (4,100) (109,081) (293,242)
- - - - 1,103 3,356
$ (1,425) $ (89,083) $ - $ (2,650) $ 28,190 $ (106,281)
$ (4,591) $ (88,103) $ - $ (4,557) $ (37,042) $ 122,913
$ 24,038 $ 331,818 $ 24,009 $ 32,058 $ 498,897 $ 2,699,918
- - (24,009) - (244,171) (851,291) $ 24,038 $ 331,818 $ - $ 32,058 $ 254,726 $ 1,848,627
- - - - - 4,376
$ 19,447 $ 243,715 $ - $ 27,501 $ 217,684 $ 1,975,916
EDUCATIONAND
RESEARCH
MEDICAL
TOTALCOMPENSATION
MISCELLANEOUS
REVENUESPECIAL
ACCESSCARESPECIAL
HEALTHWORKFORCE
DEVELOPMENT
161

8/6/2019 2010 CAFR Minnesota
http://slidepdf.com/reader/full/2010-cafr-minnesota 178/265

8/6/2019 2010 CAFR Minnesota
http://slidepdf.com/reader/full/2010-cafr-minnesota 179/265
$ - $ - $ - $ - $ - $ - - - - - - -
3,100 3,375 - - - - 14,005 13,843 - - 11,765 11,722
- - - - 873 238 510 655 20,006 13,093 40,065 41,295 180 143 900 230 238 124 300 294 73 89 1,732 1,418
$ 18,095 $ 18,310 $ 20,979 $ 13,412 $ 54,673 $ 54,797
$ - $ - $ - $ - $ - $ - 22,727 21,598 - - 5,070 5,070
- - 7,951 7,547 84,110 74,648 - - 2,768 2,768 - - - - - - - - - - - - 160 160 - - - - - -
229 - - - - - - - - - - -
$ 22,956 $ 21,598 $ 10,719 $ 10,315 $ 89,340 $ 79,878
$ (4,861) $ (3,288) $ 10,260 $ 3,097 $ (34,667) $ (25,081)
$ - $ - $ 920 $ 920 $ 28,731 $ 28,894 - - (12,024) (12,024) (2,731) (2,731)
$ - $ - $ (11,104) $ (11,104) $ 26,000 $ 26,163
$ (4,861) $ (3,288) $ (844) $ (8,007) $ (8,667) $ 1,082
$ 10,252 $ 10,252 $ 22,398 $ 22,398 $ 26,400 $ 26,400 - 378 - 4,371 - 1,806
$ 10,252 $ 10,630 $ 22,398 $ 26,769 $ 26,400 $ 28,206
$ 5,391 $ 7,342 $ 21,554 $ 18,762 $ 17,733 $ 29,288 - 3,161 - 8,021 - 13,738 - 2,339 - - - -
$ 5,391 $ 1,842 $ 21,554 $ 10,741 $ 17,733 $ 15,550
CONTINUED
BUDGETFINAL
STATE AIRPORTS NATURAL RESOURCES
ACTUAL BUDGETFINAL
ACTUAL
PETROLEUM TANK CLEANUP
FINALBUDGET ACTUAL
163

8/6/2019 2010 CAFR Minnesota
http://slidepdf.com/reader/full/2010-cafr-minnesota 180/265

8/6/2019 2010 CAFR Minnesota
http://slidepdf.com/reader/full/2010-cafr-minnesota 181/265
$ 227,280 $ 229,957 $ - $ - $ - $ - - - - - - - - - - - - - - - 97,094 94,772 531,000 523,640 - - - - - - - - 846 4,171 - -
170 348 2,927 448 2,101 2,047 - - - - 7,901 8,681
$ 227,450 $ 230,305 $ 100,867 $ 99,391 $ 541,002 $ 534,368
$ - $ - $ - $ - $ - $ - 13,041 1,061 - - - -
136,898 102,916 751 610 - - 13,441 4,701 96,527 95,137 1,000 2
1,150 1,150 - - - - 14,311 9,271 - - - -
1,645 362 - - 645,716 513,763 30,762 25,229 7,350 6,914 49,939 49,733
- - - - 622 622
$ 211,248 $ 144,690 $ 104,628 $ 102,661 $ 697,277 $ 564,120
$ 16,202 $ 85,615 $ (3,761) $ (3,270) $ (156,275) $ (29,752)
$ - $ - $ - $ - $ - $ - (1,950) (1,950) (1,425) (1,425) (39,672) (39,672)
$ (1,950) $ (1,950) $ (1,425) $ (1,425) $ (39,672) $ (39,672)
$ 14,252 $ 83,665 $ (5,186) $ (4,695) $ (195,947) $ (69,424)
$ - $ - $ 26,509 $ 26,509 $ 291,896 $ 291,896 - - - 169 - 248
$ - $ - $ 26,509 $ 26,678 $ 291,896 $ 292,144
$ 14,252 $ 83,665 $ 21,323 $ 21,983 $ 95,949 $ 222,720 - 64,167 - 3,859 - 25,751 - - - - - -
$ 14,252 $ 19,498 $ 21,323 $ 18,124 $ 95,949 $ 196,969
CONTINUED
SPECIAL COMPENSATION
ACTUAL
HEALTH CARE ACCESS
FINALFINALBUDGET BUDGET ACTUAL
HERITAGE
FINALBUDGET ACTUAL
165

8/6/2019 2010 CAFR Minnesota
http://slidepdf.com/reader/full/2010-cafr-minnesota 182/265
STATE OF MINNESOTA
NONMAJOR APPROPRIATED SPECIAL REVENUE FUNDSCOMBINING SCHEDULE OF REVENUES, EXPENDITURESAND CHANGES IN FUND BALANCES - BUDGET AND ACTUALBUDGETARY BASIS - CONTINUEDYEAR ENDED JUNE 30, 2010
(IN THOUSANDS)
Net Revenues:Sales Taxes................................................................ $ - $ - $ 227,280 $ 229,957 Motor Vehicle Taxes................................................... - - 752,471 752,471 Fuel Taxes.................................................................. - - 826,486 826,761 Other Taxes................................................................ 47,472 45,540 760,049 749,428 Federal Revenues...................................................... - - 536,514 499,239 Departmental Services/Licenses and Fees................ - - 164,446 162,657 Investment/Interest Income........................................ 800 176 11,467 6,866 Other Revenues.......................................................... - - 87,422 55,655
Net Revenues......................................................... $ 48,272 $ 45,716 $ 3,366,135 $ 3,283,034 Expenditures:
Public Safety and Corrections………………………… $ - $ - $ 96,271 $ 91,873 Transportation............................................................. - - 1,429,661 1,254,603 Agricultural and Environmental Resources………… - - 436,268 381,756 Economic and Workforce Development..................... 47,806 47,141 162,242 150,449 Higher Education........................................................ - - 1,150 1,150 General Education...................................................... - - 14,471 9,431 Health and Human Services....................................... - - 647,746 514,391 General Government.................................................. - - 92,086 84,660 Intergovernment Aid................................................... - - 761 652
Total Expenditures.................................................. $ 47,806 $ 47,141 $ 2,880,656 $ 2,488,965
Excess of Revenues Over (Under)Expenditures................................................................... $ 466 $ (1,425) $ 485,479 $ 794,069
Other Financing Sources (Uses):
Transfers-In................................................................ $ 1,450 $ 1,450 $ 948,482 $ 956,040 Transfers-Out.............................................................. (2,500) (2,500) (1,702,893) (1,702,893)
Net Other Financing Sources (Uses)...................... $ (1,050) $ (1,050) $ (754,411) $ (746,853)
Net Change in Fund Balances…………………………… $ (584) $ (2,475) $ (268,932) $ 47,216
Fund Balances, Beginning, as Reported........................ $ 677 $ 677 $ 523,480 $ 523,480 Prior Period Adjustments............................................ - 5,102 - 32,359
Fund Balances, Beginning, as Restated........................ $ 677 $ 5,779 $ 523,480 $ 555,839
Fund Balances, Ending.................................................. $ 93 $ 3,304 $ 254,548 $ 603,055 Less Appropriation Carryover..................................... - 3,304 - 288,286 Less Long-term Receivables...................................... - - - 3,271
Undesignated Fund Balances, Ending........................... $ 93 $ - $ 254,548 $ 311,498
FINAL
COMBINED TOTALSWORKFORCE DEVELOPMENT
FINALBUDGET ACTUALACTUALBUDGET
166

8/6/2019 2010 CAFR Minnesota
http://slidepdf.com/reader/full/2010-cafr-minnesota 183/265

8/6/2019 2010 CAFR Minnesota
http://slidepdf.com/reader/full/2010-cafr-minnesota 184/265
MINNESOTA
Headwaters of the mighty Mississippi
168

8/6/2019 2010 CAFR Minnesota
http://slidepdf.com/reader/full/2010-cafr-minnesota 185/265

8/6/2019 2010 CAFR Minnesota
http://slidepdf.com/reader/full/2010-cafr-minnesota 186/265
STATE OF MINNESOTA
NONMAJOR CAPITAL PROJECTS FUNDSCOMBINING BALANCE SHEETJUNE 30, 2010
(IN THOUSANDS)
ASSETS
Cash and Cash Equivalents..................................... $ 202,946 $ 4,182 $ 30,504 $ 237,632 Loans and Notes Receivable................................... 262 - - 262 Deferred Costs.........…………….............................. 15,855 - - 15,855
Total Assets ....................................................... $ 219,063 $ 4,182 $ 30,504 $ 253,749
LIABILITIES AND FUND BALANCESLiabilities:
Accounts Payable................................................ $ 27,505 $ 262 $ 15,339 $ 43,106 Interfund Payables............................................... 2,214 - 3,427 5,641
Total Liabilities................................................ $ 29,719 $ 262 $ 18,766 $ 48,747
Fund Balances:
Restricted for Capital Projects…………………… $ 189,344 $ - $ 11,738 $ 201,082 Assigned for Capital Projects……………………… - 3,920 - 3,920
Total Fund Balances .................................. $ 189,344 $ 3,920 $ 11,738 $ 205,002
Total Liabilities and Fund Balances ........ $ 219,063 $ 4,182 $ 30,504 $ 253,749
BUILDING PROJECTS TRANSPORTATION TOTALGENERAL
170

8/6/2019 2010 CAFR Minnesota
http://slidepdf.com/reader/full/2010-cafr-minnesota 187/265

8/6/2019 2010 CAFR Minnesota
http://slidepdf.com/reader/full/2010-cafr-minnesota 188/265
MINNESOTA
Headwaters of the mighty Mississippi
172

8/6/2019 2010 CAFR Minnesota
http://slidepdf.com/reader/full/2010-cafr-minnesota 189/265

8/6/2019 2010 CAFR Minnesota
http://slidepdf.com/reader/full/2010-cafr-minnesota 190/265

8/6/2019 2010 CAFR Minnesota
http://slidepdf.com/reader/full/2010-cafr-minnesota 191/265
$ 35,949 $ 9,933 $ 13,994 $ 22,394 $ 117,088 5,079 499 7,556 2,985 26,508
- - - 2,355 2,355 - - - - 17 - - 1,376 - 6,856 - - 451 - 453 - - - 150 1,918
$ 41,028 $ 10,432 $ 23,377 $ 27,884 $ 155,195
$ - $ - $ - $ - $ 1,600 53,630 - 2,266 3,003 85,566
900 - - 786 3,178
$ 54,530 $ - $ 2,266 $ 3,789 $ 90,344
$ 95,558 $ 10,432 $ 25,643 $ 31,673 $ 245,539
$ 1,304 $ 2,454 $ 9,671 $ 4,545 $ 31,048 57 - 14,132 - 16,544
- 1,070 301 - 1,441 429 - - - 568
- - - 295 295 12,100 - - - 12,925
- - - 77 140 61 4 147 694 1,323
- - - - 47
$ 13,951 $ 3,528 $ 24,251 $ 5,611 $ 64,331
$ - $ - $ - $ 2,058 $ 2,058 111,232 - - - 121,717
- - - 400 533 407 34 1,286 5,639 10,434
- 2 106 709 1,151
$ 111,639 $ 36 $ 1,392 $ 8,806 $ 135,893
$ 125,590 $ 3,564 $ 25,643 $ 14,417 $ 200,224
$ - $ - $ 2,266 $ 959 $ 21,367
$ - $ - $ - $ 16,297 $ 16,297 - - - - 5,878 - 6,868 - - 36,253
$ - $ 6,868 $ - $ 16,297 $ 58,428
(30,032) - (2,266) - (34,480)
$ (30,032) $ 6,868 $ - $ 17,256 $ 45,315
911 SERVICES TOTALSTATE
INSURANCE
STATE
LOTTERYEMPLOYEES
SERVICESCOMMUNITYOPERATEDPUBLIC
175

8/6/2019 2010 CAFR Minnesota
http://slidepdf.com/reader/full/2010-cafr-minnesota 192/265
STATE OF MINNESOTA
NONMAJOR ENTERPRISE FUNDSCOMBINING STATEMENT OF REVENUES, EXPENSESAND CHANGES IN NET ASSETSYEAR ENDED JUNE 30, 2010
(IN THOUSANDS)
Operating Revenues:
Net Sales......................................................................... $ - $ 2,643 $ 3,725 $ 35,490 Rental and Service Fees.................................................. 22,525 12,471 130 - Insurance Premiums........................................................ - - - - Other Income................................................................... 4 - 228 1,927
Total Operating Revenues........................................... $ 22,529 $ 15,114 $ 4,083 $ 37,417 Less: Cost of Goods Sold............................................ - 1,188 - 15,537
Gross Margin........................................................... $ 22,529 $ 13,926 $ 4,083 $ 21,880
Operating Expenses:
Purchased Services......................................................... $ 3,409 $ 2,078 $ 2,571 $ 4,696 Salaries and Fringe Benefits............................................ 19,365 4,975 2,816 9,418 Claims.............................................................…………… - - - - Depreciation..................................................................... 173 135 1,159 819 Amortization………………………………………………… - - 71 - Supplies and Materials..................................................... 261 173 247 843 Indirect Costs................................................................... 2,022 194 - 837 Other Expenses............................................................... 2,080 - 184 3,316
Total Operating Expenses............................................ $ 27,310 $ 7,555 $ 7,048 $ 19,929
Operating Income (Loss)...................................................... $ (4,781) $ 6,371 $ (2,965) $ 1,951
Nonoperating Revenues (Expenses):Investment Income........................................................... $ 10 $ - $ 101 $ 155 Other Nonoperating Revenues......................................... - - - - Interest and Financing Costs........ ....... ........ ........ ........ ..... - - (856) -
Grants, Aids and Subsidies.............................................. - - - - Other Nonoperating Expenses......................................... - (6,697) (29) - Gain (Loss) on Disposal of Capital Assets........ ........ ....... - 11 - 17
Total Nonoperating Revenues (Expenses)................... $ 10 $ (6,686) $ (784) $ 172
Income (Loss) Before Transfers & Contributions.................. $ (4,771) $ (315) $ (3,749) $ 2,123 Capital Contributions………………………………………… - 8 - - Transfers-In...................................................................... - 1,427 4,547 - Transfers-Out................................................................... - - - (1,574)
Change in Net Assets………………………………………… $ (4,771) $ 1,120 $ 798 $ 549
Net Assets, Beginning, as Reported..................................... $ 3,827 $ 6,057 $ 16,328 $ 27,315
Prior Period Adjustment................................................... - - - - Net Assets, Beginning, as Restated..................................... $ 3,827 $ 6,057 $ 16,328 $ 27,315
Net Assets, Ending............................................................... $ (944) $ 7,177 $ 17,126 $ 27,864
SERVICES ACTIVITIES INDUSTRIESRIDGEBEHAVIORAL ENTERPRISE GIANTS
MINNESOTACORRECTIONAL
176

8/6/2019 2010 CAFR Minnesota
http://slidepdf.com/reader/full/2010-cafr-minnesota 193/265
$ - $ - $ 499,271 $ - $ 541,129 60,229 - - 81,381 176,736
- 24,611 - - 24,611 - 443 - 1,022 3,624
$ 60,229 $ 25,054 $ 499,271 $ 82,403 $ 746,100 - - 351,471 - 368,196
$ 60,229 $ 25,054 $ 147,800 $ 82,403 $ 377,904
$ 949 $ 4,537 $ 12,426 $ 4,996 $ 35,662 4,549 153 10,974 67,017 119,267
- 18,564 - - 18,564 5,707 - 740 1,280 10,013
- - - - 71 1,748 - 875 1,797 5,944
44 1 - 3,542 6,640 - 29 539 1,933 8,081
$ 12,997 $ 23,284 $ 25,554 $ 80,565 $ 204,242
$ 47,232 $ 1,770 $ 122,246 $ 1,838 $ 173,662
$ 274 $ 68 $ 266 $ 166 $ 1,040 - - 34 - 34
(4,227) - - (188) (5,271)
(14,700) - - - (14,700) - - - - (6,726) - - - 25 53
$ (18,653) $ 68 $ 300 $ 3 $ (25,570)
$ 28,579 $ 1,838 $ 122,546 $ 1,841 $ 148,092 743 - - - 751
- - - - 5,974 (65,818) - (122,546) - (189,938)
$ (36,496) $ 1,838 $ - $ 1,841 $ (35,121)
$ (37,095) $ 5,030 $ - $ 15,415 $ 36,877
43,559 - - - 43,559 $ 6,464 $ 5,030 $ - $ 15,415 $ 80,436
$ (30,032) $ 6,868 $ - $ 17,256 $ 45,315
TOTALSTATE
INSURANCE SERVICESLOTTERYEMPLOYEES
911 SERVICES
STATEOPERATEDPUBLIC
COMMUNITY
177

8/6/2019 2010 CAFR Minnesota
http://slidepdf.com/reader/full/2010-cafr-minnesota 194/265
STATE OF MINNESOTA
NONMAJOR ENTERPRISE FUNDSCOMBINING STATEMENT OF CASH FLOWSYEAR ENDED JUNE 30, 2010
(IN THOUSANDS)
Cash Flows from Operating Activities:Receipts from Customers.................................................................... $ 29,009 $ 14,815 $ 4,001 $ 36,727 Receipts from Other Revenues........................................................... 4 1 - 1,927 Payments to Claimants........................................................................ - - - - Payments to Suppliers......................................................................... (8,104) (2,788) (3,186) (26,909) Payments to Employees...................................................................... (20,433) (4,920) (2,746) (7,561) Payments to Others............................................................................. - (6,682) -
Net Cash Flows from Operating Activities....................................... $ 476 $ 426 $ (1,931) $ 4,184
Cash Flows from Noncapital Financing Activities:Grant Disbursements........................................................................... $ - $ - $ - $ - Transfers-In..........................................……………............................. - 1,435 4,547 - Transfers-Out.......................................……………….......................... - - (1,574) Proceeds from Bonds.......................................................................... - - - - Repayment of Bond Principal... .. .. .. .. .. ... .. .. .. .. .. ... .. .. .. .. .. ... .. .. .. .. .. ... .. .. .. . - - - - Interest Paid......................................................................................... - - - -
Net Cash Flows from Noncapital Financing Activities..................... $ - $ 1,435 $ 4,547 $ (1,574)
Cash Flows from Capital and Related Financing Activities:Investment in Capital Assets............................................................... $ - $ (56) $ (1,340) $ (968) Proceeds from Disposal of Capital Assets........................................... - 12 - 18 Capital Lease Payments............……………….................................... - - - - Repayment of Bond Principal...........……………….............................. - - (815) - Interest Paid...................................………………................................ - - (862) -
Net Cash Flows from Capital and Related Financing Activities....... $ - $ (44) $ (3,017) $ (950)
Cash Flows from Investing Activities:
Investment Earnings............................................................................ $ 10 $ - $ 72 $ 155
Net Cash Flows from Investing Activities........................................ $ 10 $ - $ 72 $ 155
Net Increase (Decrease) in Cash and Cash Equivalents......................... $ 486 $ 1,817 $ (329) $ 1,815
Cash and Cash Equivalents, Beginning, as Reported............................. $ 1,438 $ 8,797 $ 6,702 $ 15,692
Cash and Cash Equivalents, Ending....................................................... $ 1,924 $ 10,614 $ 6,373 $ 17,507
Reconciliation of Operating Income (Loss) toNet Cash Flows from Operating Activities:
Operating Income (Loss)..................................................................... $ (4,781) $ 6,371 $ (2,965) $ 1,951
Adjustments to Reconcile Operating Income toNet Cash Flows from Operating Activities:
Depreciation......................................................................................... $ 173 $ 135 $ 1,159 $ 819
Amortization….…………………………………………………………… - - 71 - Miscellaneous Nonoperating Expenses….……………………………… - (5,847) - - Change in Assets and Liabilities:
Accounts Receivable....................................................................... 6,484 (223) (91) 1,237 Inventories....................................................................................... - (76) (12) 179 Other Assets.................................................................................... - 4 - 103 Accounts Payable............................................................................ (332) 37 (103) (39) Compensated Absences Payable................................................... (1,068) (2) 1 (94) Unearned Revenues... .. ... .. .. .. .. .. ... .. .. .. .. .. ... .. .. .. .. .. ... .. .. .. .. .. ... .. .. .. .. .. . - 2 9 - Other Liabilities................................................................................ - 25 - 28
Net Reconciling Items to be Added to(Deducted from) Operating Income............................................. $ 5,257 $ (5,945) $ 1,034 $ 2,233
Net Cash Flows from Operating Activities.............................. $ 476 $ 426 $ (1,931) $ 4,184
MINNESOTA
INDUSTRIESCORRECTIONAL
SERVICESGIANTSRIDGE
BEHAVIORAL ENTERPRISEACTIVITIES
178

8/6/2019 2010 CAFR Minnesota
http://slidepdf.com/reader/full/2010-cafr-minnesota 195/265
$ 59,462 $ 25,192 $ 497,287 $ 81,320 $ 747,813 - - 83 1,022 3,037 - (17,341) (306,499) - (323,840)
(1,862) (4,473) (28,557) (12,323) (88,202) (4,294) (147) (10,757) (66,664) (117,522)
(375) (36) (29,656) - (36,749)
$ 52,931 $ 3,195 $ 121,901 $ 3,355 $ 184,537
$ (15,671) $ - $ - $ - $ (15,671) - - - - 5,982
(65,875) - (121,750) - (189,199) 66,277 - - - 66,277
(13,375) - - - (13,375) (4,642) - - - (4,642)
$ (33,286) $ - $ (121,750) $ - $ (150,628)
$ (15,859) $ - $ (1,198) $ (705) $ (20,126) - - 34 25 89 - - - (70) (70) - - - (281) (1,096) - - - (199) (1,061)
$ (15,859) $ - $ (1,164) $ (1,230) $ (22,264)
$ 274 $ 69 $ 266 $ 166 $ 1,012 . .$ 274 $ 69 $ 266 $ 166 $ 1,012
$ 4,060 $ 3,264 $ (747) $ 2,291 $ 12,657
$ 31,889 $ 6,669 $ 14,741 $ 20,103 $ 106,031
$ 35,949 $ 9,933 $ 13,994 $ 22,394 $ 118,688
$ 47,232 $ 1,770 $ 122,246 $ 1,838 $ 173,662
$ 5,707 $ - $ 740 $ 1,280 $ 10,013
- - - - 71 - - - - (5,847)
(767) (219) (1,337) (61) 5,023 - - 83 - 174 - - 137 - 244
596 1,410 199 6 1,774 163 4 217 56 (723)
- 228 (384) - (145) - 2 - 236 291
$ 5,699 $ 1,425 $ (345) $ 1,517 $ 10,875
$ 52,931 $ 3,195 $ 121,901 $ 3,355 $ 184,537
COMMUNITY911 SERVICES TOTAL
STATEPUBLIC
INSURANCE SERVICESLOTTERY
STATEOPERATED
EMPLOYEES
179

8/6/2019 2010 CAFR Minnesota
http://slidepdf.com/reader/full/2010-cafr-minnesota 196/265
MINNESOTA
Headwaters of the mighty Mississippi
180

8/6/2019 2010 CAFR Minnesota
http://slidepdf.com/reader/full/2010-cafr-minnesota 197/265
State of Minnesota
2010
Comprehensive
Annual
Financial Report
Internal
Service Funds
Central Motor Pool Fund
The fund accounts for the operation of a fleet of passenger vehiclesand the state vehicle maintenance garage.
Central Services Fund
The fund accounts for miscellaneous centralized support servicesprovided to state agencies.
Central Stores FundThe fund accounts for the operation of centralized suppliespurchasing, storage, and distribution.
Employee Insurance Fund
The fund accounts for employee health and life insurance premiumsand makes payments based on insurance benefits provided toemployees.
Enterprise Technologies Fund
The fund accounts for the operation of statewide communication
and information systems.
Plant Management Fund
The fund accounts for maintenance and operation costs of state-owned buildings and grounds in the capitol complex.
Risk Management Fund
The fund accounts for the providing of liability insurance, primarilyautomobile, to state agencies.
181

8/6/2019 2010 CAFR Minnesota
http://slidepdf.com/reader/full/2010-cafr-minnesota 198/265
STATE OF MINNESOTA
INTERNAL SERVICE FUNDSCOMBINING STATEMENT OF NET ASSETSJUNE 30, 2010
(IN THOUSANDS)
ASSETSCurrent Assets:
Cash and Cash Equivalents................................... $ 2,205 $ 954 $ 1,257 $ 291,678 Investments....................……………….................. - - - 21,346
Accounts Receivable............................................. 1,705 1,557 15 7,570 Accrued Investment/Interest Income...................... - - - 228 Inventories............................................................. - 5 - - Deferred Costs.........……………............................ - 544 - -
Total Current Assets..........…………….............. $ 3,910 $ 3,060 $ 1,272 $ 320,822
Noncurrent Assets:Deferred Costs……………………………………… $ - $ - $ - $ - Depreciable Capital Assets (Net)…………………… 17,731 74 - -
Total Noncurrent Assets.......…………............... $ 17,731 $ 74 $ - $ -
Total Assets................................................... $ 21,641 $ 3,134 $ 1,272 $ 320,822
LIABILITIESCurrent Liabilities:
Accounts Payable.... .. .. .. .. .. ... .. .. .. .. .. ... .. .. .. .. .. ... .. .. .. . $ 313 $ 326 $ 8 $ 57,729 Interfund Payables................................................. - - 164 - Unearned Revenue………………………………… - - - 4,737 Loans Payable....................................................... 2,295 - - - Compensated Absences Payable.......................... 9 34 2 37
Total Current Liabilities....………….................... $ 2,617 $ 360 $ 174 $ 62,503
Noncurrent Liabilities:Loans Payable...............…………………………..... $ 8,809 $ - $ - $ -
Compensated Absences Payable………………… 89 405 18 485 Other Liabilities.................................................... 7 79 - 34
Total Noncurrent Liabilities.......……………........ $ 8,905 $ 484 $ 18 $ 519
Total Liabilities............................................... $ 11,522 $ 844 $ 192 $ 63,022
NET ASSETSInvested in Capital Assets,
Net of Related Debt......…………………………...... $ 6,627 $ 74 $ - $ - Unrestricted ……………………….……………............ 3,492 2,216 1,080 257,800
Total Net Assets........………………….................... $ 10,119 $ 2,290 $ 1,080 $ 257,800
MOTOR POOL SERVICES STORES INSURANCECENTRAL CENTRAL CENTRAL EMPLOYEE
182

8/6/2019 2010 CAFR Minnesota
http://slidepdf.com/reader/full/2010-cafr-minnesota 199/265
$ 15,115 $ 19,730 $ 18,151 $ 349,090 - - - 21,346
13,716 485 3,021 28,069 - - - 228 - 260 - 265
1,345 - 21 1,910
$ 30,176 $ 20,475 $ 21,193 $ 400,908
$ 629 $ - $ - $ 629 8,571 4,885 594 31,855
$ 9,200 $ 4,885 $ 594 $ 32,484
$ 39,376 $ 25,360 $ 21,787 $ 433,392
$ 6,161 $ 2,326 $ 14,846 $ 81,709 - - - 164
2,140 - 191 7,068 3,037 - - 5,332
273 154 5 514
$ 11,611 $ 2,480 $ 15,042 $ 94,787
$ 3,196 $ - $ - $ 12,005
3,134 1,405 82 5,618 239 178 9 546
$ 6,569 $ 1,583 $ 91 $ 18,169
$ 18,180 $ 4,063 $ 15,133 $ 112,956
$ 2,474 $ 4,854 $ 560 $ 14,589 18,722 16,443 6,094 305,847
$ 21,196 $ 21,297 $ 6,654 $ 320,436
ENTERPRISETOTALTECHNOLOGIES MANAGEMENT MANAGEMENT
PLANT RISK
183

8/6/2019 2010 CAFR Minnesota
http://slidepdf.com/reader/full/2010-cafr-minnesota 200/265
STATE OF MINNESOTA
INTERNAL SERVICE FUNDSCOMBINING STATEMENT OF REVENUES, EXPENSESAND CHANGES IN NET ASSETSYEAR ENDED JUNE 30, 2010
(IN THOUSANDS)
Operating Revenues:Net Sales.................................................................. $ - $ 11,108 $ 2,830 $ - Rental and Service Fees... .. .. .. .. .. .. ... .. .. .. .. .. ... .. .. .. .. .. .. 13,814 2,094 - - Insurance Premiums................................................. - - - 666,209 Other Income............................................................ 2 - - 10,076
Total Operat ing Revenues... .. .. .. ... .. .. .. .. .. ... .. .. .. .. .. . $ 13,816 $ 13,202 $ 2,830 $ 676,285 Less: Cost of Goods Sold..................................... - - 2,320 -
Gross Margin.. .. .. .. ... .. .. .. .. .. ... .. .. .. .. .. ... .. .. .. .. .. ... .. $ 13,816 $ 13,202 $ 510 $ 676,285
Operating Expenses:Purchased Services.... .. .. .. ... .. .. .. .. .. ... .. .. .. .. .. ... .. .. .. .. .. . $ 3,457 $ 9,746 $ 250 $ 76,633
Salaries and Fringe Benefits..................................... 640 3,406 296 3,721 Claims....................................................................... - - - 568,346 Depreciation.... .. .. .. .. .. ... .. .. .. .. .. ... .. .. .. .. .. .. .. ... .. .. .. .. .. ... .. 4,898 24 1 1 Amortization.............................................................. - - - - Supplies and Materials.............................................. 3,316 67 6 86 Indirect Costs............................................................ 331 121 155 88 Other Expenses........................................................ - 123 - 1,428
Total Operat ing Expenses.. .. .. .. .. .. ... .. .. .. .. .. ... .. .. .. .. . $ 12,642 $ 13,487 $ 708 $ 650,303
Operat ing Income (Loss)... .. .. .. .. .. .. .. ... .. .. .. .. .. ... .. .. .. .. .. ... . $ 1,174 $ (285) $ (198) $ 25,982
Nonoperating Revenues (Expenses):Investment Income.................................................... $ 83 $ - $ - $ 3,374 Interest and Financing Costs..................................... (251) - - - Other Nonoperating Expenses………………………… - - (147) - Gain (Loss) on Disposal of Capital Assets................ 282 - - -
Total Nonoperating Revenues (Expenses)............ $ 114 $ - $ (147) $ 3,374
Income (Loss) Before Transfers & Contributions........... $ 1,288 $ (285) $ (345) $ 29,356 Transfers-Out............................................................ - - (371) (9)
Change in Net Assets…………………………………… $ 1,288 $ (285) $ (716) $ 29,347
Net Assets, Beginning, as Reported... .. .. .. .. .. ... .. .. .. .. .. ... . $ 8,831 $ 2,575 $ 1,796 $ 228,453
Net Assets, Ending........................................................ $ 10,119 $ 2,290 $ 1,080 $ 257,800
MOTOR POOL SERVICES STORES INSURANCECENTRAL CENTRAL CENTRAL EMPLOYEE
184

8/6/2019 2010 CAFR Minnesota
http://slidepdf.com/reader/full/2010-cafr-minnesota 201/265
$ - $ - $ - $ 13,938 83,521 64,746 - 164,175
- - 12,054 678,263 582 - 109 10,769
$ 84,103 $ 64,746 $ 12,163 $ 867,145 - - - 2,320
$ 84,103 $ 64,746 $ 12,163 $ 864,825
$ 46,580 $ 8,420 $ 5,239 $ 150,325
30,232 14,722 848 53,865 - - 5,185 573,531
4,188 535 - 9,647 609 - - 609 945 1,887 9 6,316 136 674 64 1,569
1,233 - 7 2,791
$ 83,923 $ 26,238 $ 11,352 $ 798,653
$ 180 $ 38,508 $ 811 $ 66,172
$ 43 $ - $ 149 $ 3,649 (229) - - (480)
- - (605) (752) 110 5 - 397
$ (76) $ 5 $ (456) $ 2,814
$ 104 $ 38,513 $ 355 $ 68,986 (28) (28,218) - (28,626)
$ 76 $ 10,295 $ 355 $ 40,360
$ 21,120 $ 11,002 $ 6,299 $ 280,076
$ 21,196 $ 21,297 $ 6,654 $ 320,436
TOTALTECHNOLOGIES MANAGEMENT MANAGEMENTENTERPRISE PLANT RISK
185

8/6/2019 2010 CAFR Minnesota
http://slidepdf.com/reader/full/2010-cafr-minnesota 202/265
STATE OF MINNESOTA
INTERNAL SERVICE FUNDSCOMBINING STATEMENT OF CASH FLOWSYEAR ENDED JUNE 30, 2010
(IN THOUSANDS)
Cash Flows from Operating Activities:Receipts from Customers..................................................................... $ 13,368 $ 14,071 $ 3,416 $ 666,731 Receipts from Other Revenues............................................................ 2 - - 10,047 Payments to Claimants........................................................................ - - - (563,358) Payments to Suppliers......................................................................... (7,325) (10,204) (2,821) (79,166) Payments to Employees....................................................................... (668) (3,420) (366) (3,622) Payments to Others.................................................……….................. - (25) - (1,811)
Net Cash Flows from Operating Activities........................................ $ 5,377 $ 422 $ 229 $ 28,821
Cash Flows from Noncapital Financing Activities:Transfers-Out...................................................………......................... $ - $ - $ (209) $ (20) Repayments of Advances to Other Funds............................................ - (458) - - Repayments of Advances from Other Funds........................................ (1,125) - - -
Net Cash Flows from Noncapital Financing Activities....................... $ (1,125) $ (458) $ (209) $ (20)
Cash Flows from Capital and Related Financing Activities:Investment in Capital Assets................................................................ $ (6,828) $ - $ - $ - Proceeds from Disposal of Capital Assets............................................ 1,576 - - - Proceeds from Loans........................................................................... 5,715 - - - Repayment of Loan Principal...............………...................................... (5,310) - - - Interest Paid.........................................………..................................... (253) - - -
Net Cash Flows from Capital and Related Financing Activities......... $ (5,100) $ - $ - $ -
Cash Flows from Investing Activities:Proceeds from Sales and Maturities of Investments............................. $ - $ - $ - $ 7,500 Purchase of Investments.......................…………................................. - - - (7,498) Investment Earnings..............................…………................................ 83 - - 3,377
Net Cash Flows from Investing Activit ies.. .. .. .. ... .. .. .. .. .. .. .. .. .. .. .. .. .. .. .. $ 83 $ - $ - $ 3,379
Net Increase (Decrease) in Cash and Cash Equivalents.......................... $ (765) $ (36) $ 20 $ 32,180
Cash and Cash Equivalents, Beginning, as Reported............................... $ 2,970 $ 990 $ 1,237 $ 259,498
Cash and Cash Equivalents, Ending........................................................ $ 2,205 $ 954 $ 1,257 $ 291,678
Reconciliation of Operating Income (Loss) toNet Cash Flows from Operating Activities:
Operating Income (Loss)...................................................................... $ 1,174 $ (285) $ (198) $ 25,982
Adjustments to Reconcile Operating Income toNet Cash Flows from Operating Activities:
Depreciation......................................................................................... $ 4,898 $ 24 $ 1 $ 1 Amortization......................................................................................... - - - - Miscellaneous Nonoperating Expenses... .. .. .. .. .. .. .. .. .. .. .. .. .. .. .. .. .. .. .. .. .. .. . - - - - Change in Assets and Liabilities:
Accounts Receivable....................................................................... (446) 936 586 (32)
Inventories....................................................................................... 1 5 303 - Other Assets... .. .. .. .. .. .. .. ... .. .. .. .. .. .. .. .. .. .. .. .. .. .. .. .. .. .. .. ... .. .. .. .. .. .. .. .. .. .. .. . 2 (375) - - Accounts Payable............................................................................ (247) 98 (409) 2,576 Compensated Absences Payable.. .. .. .. .. .. .. .. .. .. .. .. .. .. .. .. .. .. .. .. .. .. ... .. .. . (7) (3) (50) 61 Unearned Revenues.. .. .. .. .. .. .. .. .. .. .. .. .. .. .. ... .. .. .. .. .. .. .. .. .. .. .. .. .. .. .. .. .. .. .. . - - - 195 Other Liabilities................................................................................ 2 22 (4) 38
Net Reconciling Items to be Added to(Deducted from) Operating Income.............................................. $ 4,203 $ 707 $ 427 $ 2,839
Net Cash Flows from Operating Activities................................ $ 5,377 $ 422 $ 229 $ 28,821
Noncash Investing, Capital and Financing Activities:
Accrual of Computer Equipment as an Investment
in Capital Assets………………………………………………………… $ - $ - $ - $ -
Trade-In Allowance for Investment in Capital Assets……………..…… - - - -
MOTOR POOL SERVICES STORES INSURANCECENTRAL CENTRAL CENTRAL EMPLOYEE
186

8/6/2019 2010 CAFR Minnesota
http://slidepdf.com/reader/full/2010-cafr-minnesota 203/265
$ 83,897 $ 69,134 $ 12,076 $ 862,693 581 1,176 - 11,806
- - (2,706) (566,064) - (15,832) (5,158) (120,506)
(30,010) (14,627) (872) (53,585) (50,022) - (605) (52,463)
$ 4,446 $ 39,851 $ 2,735 $ 81,881
$ - $ (28,218) $ - $ (28,447) - - - (458) - - - (1,125)
$ - $ (28,218) $ - $ (30,030)
$ (2,608) $ (4,846) $ (309) $ (14,591) - 5 - 1,581
2,734 - - 8,449 (3,654) - - (8,964)
(235) - - (488)
$ (3,763) $ (4,841) $ (309) $ (14,013)
$ - $ - $ - $ 7,500 - - - (7,498)
43 - 149 3,652
$ 43 $ - $ 149 $ 3,654
$ 726 $ 6,792 $ 2,575 $ 41,492
$ 14,389 $ 12,938 $ 15,576 $ 307,598
$ 15,115 $ 19,730 $ 18,151 $ 349,090
$ 180 $ 38,508 $ 811 $ 66,172
$ 4,188 $ 535 $ - $ 9,647 609 - - 609
- - (605) (605)
(2,030) 1,482 (2,823) (2,327)
- 68 - 377 - - 158 (215) (6,444) (827) 5,310 57
83 36 (26) 94 2,140 - 4 2,339 5,720 49 (94) 5,733
$ 4,266 $ 1,343 $ 1,924 $ 15,709
$ 4,446 $ 39,851 $ 2,735 $ 81,881
$ 133 $ - $ - $ 133
82 - - 82
TOTALTECHNOLOGIES MANAGEMENT MANAGEMENTENTERPRISE PLANT RISK
187

8/6/2019 2010 CAFR Minnesota
http://slidepdf.com/reader/full/2010-cafr-minnesota 204/265
State of Minnesota
2010
Comprehensive
Annual
Financial Report
Pension
Trust Funds
Minnesota State Retirement System
Correctional Employees Retirement Fund
The fund includes resources accumulated to pay present and future
retirement annuities to state employees who have direct
responsibility for offenders at Minnesota correctional facilities.
Elective State Officers Fund
The fund includes resources accumulated to pay present and future
retirement annuities for the state’s constitutional officers.
Hennepin County Supplemental Retirement Fund
The fund accounts for resources administered by the MinnesotaState Retirement System on behalf of the Hennepin Countysupplemental retirement program.
Judicial Retirement Fund
The fund includes resources accumulated to pay present and futureretirement annuities to eligible district, municipal, county, andprobate court judges, supreme court justices, and various courtreferees.
Legislative Retirement Fund
The fund includes resources accumulated to pay present and futureretirement annuities for members of the state legislature.
Postretirement Health Care Benefits Fund
The fund includes contributions by or on behalf of employees and
accumulated earnings for reimbursement of health-related expenses
of the employee or dependents after retirement.
State Deferred Compensation Fund
The fund includes contributions by participants toward a voluntaryretirement savings plan.
188

8/6/2019 2010 CAFR Minnesota
http://slidepdf.com/reader/full/2010-cafr-minnesota 205/265
Pension Trust Funds – Cont’d.
State Employees Retirement Fund
The fund includes resources accumulated to paypresent and future retirement annuities to state andUniversity of Minnesota employees not covered byother pension funds.
State Patrol Retirement Fund
The fund includes resources accumulated to paypresent and future retirement annuities to eligiblestate patrol officers, conservation officers, and crimebureau personnel.
Unclassified Employees Retirement Fund
The fund includes the aggregate of unclassifiedemployee share accounts which are either refundedor used to purchase a retirement annuity upontermination of service.
Public Employees RetirementAssociation
Defined Contribution Fund
The fund is an IRC Section 401(a) deferredcompensation plan administered by the PublicEmployees Retirement Association.
Minneapolis Employees Retirement Fund
The fund includes resources accumulated to paypresent and future retirement annuities to eligibleemployees of the City of Minneapolis.
Police and Fire Fund
The fund includes resources accumulated to paypresent and future retirement annuities to eligiblepolice officers and firefighters.
Public Employees Correctional Fund
The fund includes resources accumulated to paypresent and future retirement annuities to eligiblecorrectional employees of various local units of government.
Public Employees Retirement Fund
The fund includes resources accumulated to paypresent and future retirement annuities to eligibleemployees of various local units of government.
Volunteer Firefighter Retirement Fund
The fund contains the assets attributable to thevoluntary statewide lump-sum volunteer firefighter retirement plan.
Teachers Retirement Association
Teachers Retirement Fund
The fund includes resources accumulated to paypresent and future retirement annuities for membersof both the basic and coordinated teachersretirement plans.
State Colleges and Universities
Colleges and Universities Retirement Fund
The fund includes unclassified teachers, librarians,administrators, and certain other staff members whohave been employed fulltime for a minimum of twoacademic years.
189

8/6/2019 2010 CAFR Minnesota
http://slidepdf.com/reader/full/2010-cafr-minnesota 206/265
STATE OF MINNESOTA
PENSION TRUST FUNDSCOMBINING STATEMENT OF NET ASSETSJUNE 30, 2010
(IN THOUSANDS)
ASSETS
Cash and Cash Equivalents................................. $ 1 $ - $ 13 $ 18
Investment Pools, at fair value:Cash Equivalent Investments... .. .. ... .. .. .. .. .. .. .. ... $ 31,061 $ - $ 19,401 $ 7,747 Investments:
Guaranteed Investment Account.................. $ - $ - $ - $ -
Debt Securities……………………………… 125,653 - 28,121 30,150 Equity Securities……………………………… 377,025 - 62,650 90,451 Mutual Funds………………………………… - - - -
Total Investments.................................... $ 502,678 $ - $ 90,771 $ 120,601
Accrued Interest and Dividends.... .. .. .. ... .. .. .. .. .. . $ 1,449 $ - $ 334 $ 349 Securities Trades Receivables (Payables)…… (11,616) - (989) (2,788)
Total Investment Pool Participation.............. $ 523,572 $ - $ 109,517 $ 125,909
Receivables:Interfund Receivables....................................... $ - $ - $ - $ - Receivables...................................................... 2,269 215 32 351 Accrued Interest and Dividends.......... ........ ...... 6 - - 1
Total Receivables.. .. .. .. ... .. .. .. .. .. ... .. .. .. .. .. .. .. ... $ 2,275 $ 215 $ 32 $ 352
Securities Lending Collateral................................ $ 47,031 $ - $ 9,070 $ 11,284
Depreciable Capital Assets (Net)………………… - - - - Nondepreciable Capital Assets…………………… - - - -
Total Assets............................................. $ 572,879 $ 215 $ 118,632 $ 137,563
LIABILITIESAccounts Payable.... .. ... .. .. .. .. .. ... .. .. .. .. .. ... .. .. .. .. .. .. .. $ 153 $ - $ 8 $ 39 Interfund Payables............................................... 450 1 6 39 Accrued Expense................................................. - - - - Revenue Bonds Payable...................................... - - - - Bond Interest........................................................ - - - - Compensated Absences Payable.......... ........ ....... - - - - Securities Lending Liabilities................................ 47,031 - 9,070 11,284
Total Liabili ties......................................... $ 47,634 $ 1 $ 9,084 $ 11,362
Net Assets Held in Trust for Pension Benefits
and Pool Participants....................................... $ 525,245 $ 214 $ 109,548 $ 126,201
ELECTIVE
HENNEPIN
COUNTY
MINNESOTA STATE RETIREMENT SYSTEM
CORRECTIONAL
EMPLOYEES
RETIREMENT OFFICERS
SUPPLEMENTAL
RETIREMENT
STATE
RETIREMENT
JUDICIAL
190

8/6/2019 2010 CAFR Minnesota
http://slidepdf.com/reader/full/2010-cafr-minnesota 207/265
$ 5 $ 888 $ 9,826 $ 6 $ 1 $ 109
$ 1,056 $ 137,669 $ 83,909 $ 435,176 $ 27,799 $ 17,719
$ - $ 85,421 $ 1,129,598 $ - $ - $ 33,493
4,713 28,834 - 1,847,660 117,428 52,517 14,142 66,825 - 5,544,014 352,347 150,281 - - 2,262,520 - - -
$ 18,855 $ 181,080 $ 3,392,118 $ 7,391,674 $ 469,775 $ 236,291
$ 54 $ 372 $ 12 $ 21,316 $ 1,355 $ 692 (435) (1,901) - (170,820) (10,856) (1,741)
$ 19,530 $ 317,220 $ 3,476,039 $ 7,677,346 $ 488,073 $ 252,961
$ - $ - $ - $ 4,938 $ - $ - 7,321 5,605 12,111 14,022 1,051 483
- - - 83 5 -
$ 7,321 $ 5,605 $ 12,111 $ 19,043 $ 1,056 $ 483
$ 1,763 $ 9,814 $ - $ 691,454 $ 43,947 $ 20,157
- - - 5,811 - - - - - 88 - -
$ 28,619 $ 333,527 $ 3,497,976 $ 8,393,748 $ 533,077 $ 273,710
$ 7 $ 125 $ 272 $ 3,046 $ 141 $ 6 28 2,410 1,726 - 119 159
- - - - - - - - - 6,001 - - - - - - - - - - - 716 - -
1,763 9,814 - 691,454 43,947 20,157
$ 1,798 $ 12,349 $ 1,998 $ 701,217 $ 44,207 $ 20,322
$ 26,821 $ 321,178 $ 3,495,978 $ 7,692,531 $ 488,870 $ 253,388 CONTINUED
EMPLOYEESDEFERREDHEALTH CARE
STATESTATE
MINNESOTA STATE RETIREMENT SYSTEM
COMPENSATIONBENEFITS RETIREMENT
UNCLASSIFIEDPOSTRETIREMENT
LEGISLATIVE
RETIREMENT RETIREMENT
STATE
RETIREMENT
EMPLOYEESPATROL
191

8/6/2019 2010 CAFR Minnesota
http://slidepdf.com/reader/full/2010-cafr-minnesota 208/265
STATE OF MINNESOTA
PENSION TRUST FUNDS (CONTINUED)COMBINING STATEMENT OF NET ASSETSJUNE 30, 2010
(IN THOUSANDS)
ASSETSCash and Cash Equivalents................................. $ 232 $ 25 $ 1,000
Investment Pools, at fair value:Cash Equivalent Investments.. .. ... .. .. .. .. .. ... .. .. .. $ 2,880 $ 65,184 $ 256,835 Investments:
Guaranteed Investment Account................. $ 3,183 $ - $ -
Debt Securities……………………………… 7,395 279,252 1,072,294 Equity Securities……………………………… 18,561 509,619 3,214,693 Mutual Funds………………………………… - - -
Total Investments................................... $ 29,139 $ 788,871 $ 4,286,987
Accrued Interest and Dividends....................... $ 93 $ 3,009 $ 12,362 Securities Trades Receivables (Payables)…… (249) (25,843) (99,050)
Total Investment Pool Part icipat ion... .. .. .. .. .. $ 31,863 $ 831,221 $ 4,457,134
Receivables:Interfund Receivables...................................... $ - $ - $ 4 Receivables..................................................... 69 12,788 2,134 Accrued Interest and Dividends....................... - - -
Total Receivables........................................ $ 69 $ 12,788 $ 2,138
Securities Lending Collateral................................ $ 2,598 $ 87,592 $ 400,888
Depreciable Capital Assets (Net)………………… - - - Nondepreciable Capital Assets…………………… - - -
Total Assets... .. ... .. .. .. .. .. .. .. ... .. .. .. .. .. ... .. .. .. $ 34,762 $ 931,626 $ 4,861,160
LIABILITIESAccounts Payable................................................ $ 1 $ 1 $ 3,826 Interfund Payables............................................... 224 - 2,709 Accrued Expense................................................. - - - Revenue Bonds Payable...................................... - - - Bond Interest........................................................ - - - Compensated Absences Payable........................ - - - Securities Lending Liabilities................................ 2,598 87,592 400,888
Total Liabilities........................................ $ 2,823 $ 87,593 $ 407,423
Net Assets Held in Trust for Pension Benefits
and Pool Participants....................................... $ 31,939 $ 844,033 $ 4,453,737
PUBLIC EMPLOYEES
RETIREMENT ASSOCIATION
EMPLOYEES
RETIREMENT
MINNEAPOLIS
DEFINED
CONTRIBUTION AND FIRE
POLICE
192

8/6/2019 2010 CAFR Minnesota
http://slidepdf.com/reader/full/2010-cafr-minnesota 209/265

8/6/2019 2010 CAFR Minnesota
http://slidepdf.com/reader/full/2010-cafr-minnesota 210/265
STATE OF MINNESOTA
PENSION TRUST FUNDSCOMBINING STATEMENT OF CHANGESIN NET ASSETSYEAR ENDED JUNE 30, 2010
(IN THOUSANDS)
Additions: Contributions:
Employer............................................................ $ 21,988 $ - $ 515 $ 8,283 Member.............................................................. 15,267 - 514 2,988 Contributions From Other Sources...................... - 453 - -
Total Contributions.......................................... $ 37,255 $ 453 $ 1,029 $ 11,271
Net Investment Income: Investment Income............................................. $ 69,324 $ - $ 12,230 $ 17,446 Less: Investment Expense................................. (737) - - (177)
Net Investment Income................................... $ 68,587 $ - $ 12,230 $ 17,269
Securities Lending Revenues (Expenses): Securities Lending Income.................................. $ 422 $ - $ 82 $ 101 Borrower Rebates............................................... (77) - (14) (19) Management Fees.............................................. (49) - (10) (12)
Net Securities Lending Revenue..................... $ 296 $ - $ 58 $ 70
Total Investment Income............................ $ 68,883 $ - $ 12,288 $ 17,339
Transfers From Other Funds................................... $ 27 $ - $ - $ - Other Additions....................................................... - - 48 1
Total Additions.................................................... $ 106,165 $ 453 $ 13,365 $ 28,611
Deductions: Benefits................................................................... $ 36,078 $ 451 $ 3,514 $ 17,058 Refunds/Withdrawals.............................................. 1,170 - 2,244 - Administrative Expenses......................................... 455 1 52 42 Transfers to Other Funds........................................ - - - -
Total Deductions................................................. $ 37,703 $ 452 $ 5,810 $ 17,100
Net Increase (Decrease)................................. $ 68,462 $ 1 $ 7,555 $ 11,511
Net Assets Held in Trust for Pension Benefits and Pool Participants, Beginning, as Reported....... $ 456,783 $ 213 $ 101,993 $ 114,690
Change in Reporting Entity………………………… - - - - Change in Fund Structure…………………………… - - - -
Net Assets Held in Trust for Pension Benefitsand Pool Participants, Beginning, as Restated........ $ 456,783 $ 213 $ 101,993 $ 114,690
Net Assets Held in Trust for Pension Benefits and Pool Participants, Ending................................. $ 525,245 $ 214 $ 109,548 $ 126,201
MINNESOTA STATE RETIREMENT SYSTEM
HENNEPIN
SUPPLEMENTAL
RETIREMENT
JUDICIAL
RETIREMENT
COUNTY
RETIREMENT
ELECTIVE
STATE
CORRECTIONAL
OFFICERS
EMPLOYEES
194

8/6/2019 2010 CAFR Minnesota
http://slidepdf.com/reader/full/2010-cafr-minnesota 211/265
$ - $ - $ - $ 115,181 $ 10,104 $ 6,333 171 90,445 228,190 113,716 6,726 4,472
1,975 - - - - -
$ 2,146 $ 90,445 $ 228,190 $ 228,897 $ 16,830 $ 10,805
$ 3,219 $ 12,965 $ 308,697 $ 1,047,553 $ 68,619 $ 28,722 (31) - - (10,990) (709) -
$ 3,188 $ 12,965 $ 308,697 $ 1,036,563 $ 67,910 $ 28,722
$ 16 $ 95 $ - $ 6,210 $ 395 $ 194 (3) (16) - (1,140) (73) (31) (2) (12) - (760) (48) (25)
$ 11 $ 67 $ - $ 4,310 $ 274 $ 138
$ 3,199 $ 13,032 $ 308,697 $ 1,040,873 $ 68,184 $ 28,860
$ - $ - $ - $ 14,618 $ 28 $ 259 - 63 2,305 321 13 -
$ 5,345 $ 103,540 $ 539,192 $ 1,284,709 $ 85,055 $ 39,924
$ 7,159 $ 35,613 $ 30,353 $ 473,447 $ 46,119 $ - - - 114,889 9,733 3 5,691
28 2,131 4,441 5,802 123 198 - - - 314 - 14,618
$ 7,187 $ 37,744 $ 149,683 $ 489,296 $ 46,245 $ 20,507
$ (1,842) $ 65,796 $ 389,509 $ 795,413 $ 38,810 $ 19,417
$ 28,663 $ 255,382 $ 3,106,469 $ 6,897,118 $ 450,060 $ 233,971
- - - - - - - - - - - -
$ 28,663 $ 255,382 $ 3,106,469 $ 6,897,118 $ 450,060 $ 233,971
$ 26,821 $ 321,178 $ 3,495,978 $ 7,692,531 $ 488,870 $ 253,388
CONTINUED
MINNESOTA STATE RETIREMENT SYSTEM
RETIREMENT
STATE STATE
RETIREMENT RETIREMENTRETIREMENT
LEGISLATIVE EMPLOYEES
BENEFITS COMPENSATION
PATROL
UNCLASSIFIEDPOSTRETIREMENT
HEALTH CARE DEFERRED
STATE
EMPLOYEES
195

8/6/2019 2010 CAFR Minnesota
http://slidepdf.com/reader/full/2010-cafr-minnesota 212/265
STATE OF MINNESOTA
PENSION TRUST FUNDS (CONTINUED)COMBINING STATEMENT OF CHANGESIN NET ASSETSYEAR ENDED JUNE 30, 2010
(IN THOUSANDS)
Additions:Contributions:
Employer............................................................. $ 1,582 $ 4,798 $ 107,065 Member............................................................... 1,480 1,081 71,736 Contributions From Other Sources.......... ....... ...... - - -
Total Contributions........................................... $ 3,062 $ 5,879 $ 178,801
Net Investment Income:Investment Income.............................................. $ 3,693 $ 126,667 $ 606,036 Less: Investment Expense.................................. - (1,486) (6,358)
Net Investment Income.................................... $ 3,693 $ 125,181 $ 599,678
Securities Lending Revenues (Expenses):Securit ies Lending Income... .. .. .. .. ... .. .. .. .. .. ... .. .. .. .. $ 24 $ 769 $ 3,600 Borrower Rebates................................................ (4) (147) (660) Management Fees............................................... (3) (93) (441)
Net Securities Lending Revenue...................... $ 17 $ 529 $ 2,499
Total Investment Income............................. $ 3,710 $ 125,710 $ 602,177
Transfers From Other Funds.................................... $ - $ 9,000 $ - Other Additions........................................................ 1 - -
Total Additions..................................................... $ 6,773 $ 140,589 $ 780,978
Deductions:Benefits. .. .. .. .. .. .. .. ... .. .. .. .. .. .. .. ... .. .. .. .. .. ... .. .. .. .. .. ... .. .. .. . $ - $ 147,099 $ 326,041 Refunds/Withdrawals............................................... 1,817 27 1,493 Administrative Expenses.......................................... 211 2,806 753 Transfers to Other Funds......................................... - - -
Total Deductions.................................................. $ 2,028 $ 149,932 $ 328,287
Net Increase (Decrease).................................. $ 4,745 $ (9,343) $ 452,691
Net Assets Held in Trust for Pension Benefitsand Pool Participants, Beginning, as Reported........ $ 27,194 $ - $ 4,001,046
Change in Reporting Entity…………………………… - 13,083 - Change in Fund Structure…………………………… - 840,293 -
Net Assets Held in Trust for Pension Benefitsand Pool Participants, Beginning, as Restated......... $ 27,194 $ 853,376 $ 4,001,046
Net Assets Held in Trust for Pension Benefitsand Pool Participants, Ending.................................. $ 31,939 $ 844,033 $ 4,453,737
RETIREMENT
MINNEAPOLIS
PUBLIC EMPLOYEESRETIREMENT ASSOCIATION
CONTRIBUTION AND FIRE
DEFINED EMPLOYEES
POLICE
196

8/6/2019 2010 CAFR Minnesota
http://slidepdf.com/reader/full/2010-cafr-minnesota 213/265
$ 14,170 $ 342,678 $ 7 $ 220,538 $ 40,341 $ 893,583 9,442 303,571 - 214,909 34,047 1,098,755
- - - 22,807 1,201 26,436
$ 23,612 $ 646,249 $ 7 $ 458,254 $ 75,589 $ 2,018,774
$ 24,909 $ 1,529,582 $ (8) $ 2,100,983 $ 80,566 $ 6,041,203 (281) (16,139) - (21,716) - (58,624)
$ 24,628 $ 1,513,443 $ (8) $ 2,079,267 $ 80,566 $ 5,982,579
$ 169 $ 9,140 $ - $ 12,065 $ - $ 33,282 (31) (1,677) - (2,214) - (6,106) (21) (1,120) - (1,478) - (4,074)
$ 117 $ 6,343 $ - $ 8,373 $ - $ 23,102
$ 24,745 $ 1,519,786 $ (8) $ 2,087,640 $ 80,566 $ 6,005,681
$ - $ - $ - $ - $ - $ 23,932 - 241 - 3,593 - 6,586
$ 48,357 $ 2,166,276 $ (1) $ 2,549,487 $ 156,155 $ 8,054,973
$ 3,353 $ 906,300 $ 25 $ 1,421,382 $ 33,330 $ 3,487,322 714 28,770 - 12,804 - 179,355 222 9,476 1 9,611 323 36,676
- - - - - 14,932
$ 4,289 $ 944,546 $ 26 $ 1,443,797 $ 33,653 $ 3,718,285
$ 44,068 $ 1,221,730 $ (27) $ 1,105,690 $ 122,502 $ 4,336,688
$ 167,300 $ 10,116,852 $ - $ 13,833,849 $ 763,897 $ 40,555,480
- - 791 - - 13,874 - - - - - 840,293
$ 167,300 $ 10,116,852 $ 791 $ 13,833,849 $ 763,897 $ 41,409,647
$ 211,368 $ 11,338,582 $ 764 $ 14,939,539 $ 886,399 $ 45,746,335
PUBLIC
EMPLOYEES
RETIREMENT
PUBLIC EMPLOYEESRETIREMENT ASSOCIATION
STATE
VOLUNTEER
CORRECTIONAL RETIREMENT
TEACHERSFIREFIGHTEREMPLOYEES
TOTAL
COLLEGES AND
RETIREMENTRETIREMENT
PUBLIC
UNIVERSITIES
197

8/6/2019 2010 CAFR Minnesota
http://slidepdf.com/reader/full/2010-cafr-minnesota 214/265
MINNESOTA
Headwaters of the mighty Mississippi
198

8/6/2019 2010 CAFR Minnesota
http://slidepdf.com/reader/full/2010-cafr-minnesota 215/265
State of Minnesota
2010
Comprehensive
Annual
Financial Report
Investment Trust
Funds
Supplemental Retirement Fund
The fund provides an investment vehicle for the assets of variouspublic retirement plans and funds.
Investment Trust Fund
The fund provides an investment vehicle for external fundsauthorized to be invested by the state.
199

8/6/2019 2010 CAFR Minnesota
http://slidepdf.com/reader/full/2010-cafr-minnesota 216/265
STATE OF MINNESOTA
INVESTMENT TRUST FUNDS
STATEMENT OF PLAN NET ASSETSJUNE 30, 2010
(IN THOUSANDS)
ASSETS
Investment Pools, at fair value: Cash Equivalent Investments.................................. $ 18,756 $ 53,688 $ 72,444 Investments:
Debt Securities................................................... $ 87,234 $ 59,833 $ 147,067 Equity Securities................................................. 216,046 52,719 268,765
Total Investments........................................... $ 303,280 $ 112,552 $ 415,832
Accrued Interest and Dividends............................... $ 1,052 $ 901 $ 1,953 Securities Trades Receivables (Payables).............. (6,805) (638) (7,443)
Total Investment Pool Participation..................... $ 316,283 $ 166,503 $ 482,786
Securities Lending Collateral....................................... $ 30,843 $ 6,862 $ 37,705
Total Assets.................................................... $ 347,126 $ 173,365 $ 520,491
LIABILITIES
Accounts Payable....................................................... $ 72 $ - $ 72 Securities Lending Liabilities....................................... 30,843 6,862 37,705
Total Liabilities................................................ $ 30,915 $ 6,862 $ 37,777
Net Assets Held in Trust for Pension Benefits and Pool Participants.............................................. $ 316,211 $ 166,503 $ 482,714
RETIREMENT
SUPPLEMENTAL INVESTMENT
TRUST TOTAL
200

8/6/2019 2010 CAFR Minnesota
http://slidepdf.com/reader/full/2010-cafr-minnesota 217/265

8/6/2019 2010 CAFR Minnesota
http://slidepdf.com/reader/full/2010-cafr-minnesota 218/265
MINNESOTA
Headwaters of the mighty Mississippi
202

8/6/2019 2010 CAFR Minnesota
http://slidepdf.com/reader/full/2010-cafr-minnesota 219/265

8/6/2019 2010 CAFR Minnesota
http://slidepdf.com/reader/full/2010-cafr-minnesota 220/265
STATE OF MINNESOTA
AGENCY FUNDSTATEMENT OF CHANGES IN ASSETS AND LIABILITIESYEAR ENDED JUNE 30, 2010
(IN THOUSANDS)
MISCELLANEOUS AGENCY
ASSETSCash and Cash Equivalents............... $ 131,015 $ 1,254,691 $ 1,283,635 $ 102,071 Accounts Receivable........... ....... ........ 19,627 22,149 19,627 22,149
Total Assets................................... $ 150,642 $ 1,276,840 $ 1,303,262 $ 124,220
LIABILITIESAccounts Payable.............................. $ 150,642 $ 1,276,840 $ 1,303,262 $ 124,220
Total Liabilities............................... $ 150,642 $ 1,276,840 $ 1,303,262 $ 124,220
BEGINNING ENDINGBALANCE INCREASES DECREASES BALANCE
204

8/6/2019 2010 CAFR Minnesota
http://slidepdf.com/reader/full/2010-cafr-minnesota 221/265
State of Minnesota
2010
Comprehensive
Annual
Financial Report
Nonmajor
Component Unit
Funds
Agricultural and Economic Development Board
The board administers programs for agricultural and economicdevelopment.
National Sports Center Foundation
The foundation is under contract with the Minnesota Amateur SportsCommission to maintain and operate the National Sports Center facility. The primary purpose of the facility is to hold youth-orientedathletic and other non-athletic functions and events.
Office of Higher Education
The office makes and guarantees loans to qualified post secondarystudents.
Public Facilities Authority
The authority provides financial assistance to eligible municipalities
with high cost wastewater infrastructure projects.
Rural Finance Authority
The authority administers state agricultural programs.
Workers’ Compensation Assigned Risk Plan
The plan is the source of workers’ compensation and employers’liability coverage for Minnesota employers who have been unable toobtain an insurance policy through the voluntary market.
205

8/6/2019 2010 CAFR Minnesota
http://slidepdf.com/reader/full/2010-cafr-minnesota 222/265
STATE OF MINNESOTA
NONMAJOR COMPONENT UNIT FUNDSCOMBINING STATEMENT OF NET ASSETSDECEMBER 31, 2009 and JUNE 30, 2010(IN THOUSANDS)
Current Assets:
Cash and Cash Equivalents.................................... $ 3,415 $ 88 $ 193,377
Investments.............................................................. - - -
Accounts Receivable............................................... - 754 5,494
Due from Primary Government................................ - - -
Accrued Investment/Interest Income....................... 148 - -
Federal Aid Receivable............................................ - - -
Inventories............................................................... - 47 -
Deferred Costs......................................................... - 48 215
Loans and Notes Receivable................................... 978 - 89,271
Other Assets............................................................ 3,500 - -
Total Current Assets............................................ $ 8,041 $ 937 $ 288,357
Noncurrent Assets:
Cash and Cash Equivalents-Restricted................... $ - $ - $ 48,176
Investments-Restricted............................................ 21,907 - -
Accounts Receivable-Restricted…………………… - 2,878 -
Due from Primary Government…………………… - - -
Investments……………………………………...…… - - -
Accounts Receivable............................................... - - -
Loans and Notes Receivable................................... 1,666 - 644,639
Depreciable Capital Assets (Net)…………………… - 1,876 22
Nondepreciable Capital Assets…………………… - 779 -
Other Assets............................................................ - - 3,665
Total Noncurrent Assets...................................... $ 23,573 $ 5,533 $ 696,502
Total Assets..................................................... $ 31,614 $ 6,470 $ 984,859
Current Liabilities:
Accounts Payable....... .. .. .. .. .. .. .. .. .. .. .. .. .. .. .. .. .. .. .. .. .. .. . $ 13 $ 1,211 $ 3,506
Due to Primary Government.................................... - - 211
Unearned Revenue………………………………… - 868 8,481
Accrued Bond Interest Payable……………..……… 172 - -
Loans and Notes Payable........................................ - 368 -
Revenue Bonds Payable......................................... 795 - -
Claims Payable........................................................ - - -
Compensated Absences Payable............................ - - 59
Other Liabilities……………………………………… - - -
Total Current Liabili ties....... .. .. .. .. .. .. .. .. .. .. .. .. .. .. .. .. . $ 980 $ 2,447 $ 12,257
Noncurrent Liabilities:
Accrued Bond Interest Payable-Restricted.............. $ - $ - $ 382
Due to Primary Government.................................... - - -
Loans and Notes Payable........................................ - 2,927 -
Revenue Bonds Payable......................................... 6,565 - 590,100 Claims Payable........................................................ - - -
Compensated Absences Payable............................ - - 647
Other Liabilities........................................................ - - 3,316
Total Noncurrent Liabilities.................................. $ 6,565 $ 2,927 $ 594,445
Total Liabilities................................................ $ 7,545 $ 5,374 $ 606,702
Invested in Capital Assets,Net of Related Debt………………………………… $ - $ 2,655 $ 22
Restricted…………………………...…………………… 21,383 - 377,806 Unrestricted ……………………………………….…… 2,686 (1,559) 329
Total Net Assets...................................................... $ 24,069 $ 1,096 $ 378,157
LIABILITIES
SPORTS OFFICE OF
ASSETS
BOARD FOUNDATION EDUCATION
DEVELOPMENT CENTER HIGHER
NET ASSETS
& ECONOMICNATIONALAGRICULTURAL
206

8/6/2019 2010 CAFR Minnesota
http://slidepdf.com/reader/full/2010-cafr-minnesota 223/265
$ 139,748 $ 25,678 $ 11,269 $ 373,575
9,988 - 305,540 315,528
- 4 28,852 35,104
2,785 - - 2,785
18,077 - 1,820 20,045
1,875 - - 1,875
- - - 47
- - 3,471 3,734
101,728 7,067 - 199,044
- - 82 3,582
$ 274,201 $ 32,749 $ 351,034 $ 955,319
$ - $ - $ - $ 48,176
- - - 21,907
- - - 2,878
18,591 - - 18,591
99,863 - - 99,863
- - 372,093 372,093
1,642,306 50,064 - 2,338,675
- - - 1,898
- - - 779
2,470 - - 6,135
$ 1,763,230 $ 50,064 $ 372,093 $ 2,910,995
$ 2,037,431 $ 82,813 $ 723,127 $ 3,866,314
$ 3,180 $ - $ 2,074 $ 9,984
- 6,500 24,253 30,964
- - 18,800 28,149
14,013 - - 14,185
- - - 368
48,835 - - 49,630
- - 51,814 51,814
40 - - 99
2,051 - - 2,051
$ 68,119 $ 6,500 $ 96,941 $ 187,244
$ - $ - $ - $ 382
- 71,285 - 71,285
- - - 2,927
938,872 - - 1,535,537 - - 576,186 576,186
380 - - 1,027
73 - - 3,389
$ 939,325 $ 71,285 $ 576,186 $ 2,190,733
$ 1,007,444 $ 77,785 $ 673,127 $ 2,377,977
$ - $ - $ - $ 2,677 1,027,180 - 3,176 1,429,545
2,807 5,028 46,824 56,115
$ 1,029,987 $ 5,028 $ 50,000 $ 1,488,337
AUTHORITY
PUBLIC
PLAN TOTALFINANCE
AUTHORITY
COMPENSATIONFACILITIES ASSIGNED RISK
RURAL
WORKERS'
207

8/6/2019 2010 CAFR Minnesota
http://slidepdf.com/reader/full/2010-cafr-minnesota 224/265

8/6/2019 2010 CAFR Minnesota
http://slidepdf.com/reader/full/2010-cafr-minnesota 225/265

8/6/2019 2010 CAFR Minnesota
http://slidepdf.com/reader/full/2010-cafr-minnesota 226/265
STATE OF MINNESOTA
NONMAJOR COMPONENT UNITSNOT ISSUING SEPARATELY AUDITED FINANCIAL STATEMENTSCOMBINING STATEMENT OF REVENUES, EXPENSESAND CHANGES IN NET ASSETSYEAR ENDED JUNE 30, 2010
(IN THOUSANDS)
Operating Revenues:
Loan Interest Income………………………………………… $ 328 $ 3,066 $ 3,394 Rental and Service Fees.................................................. - 1 1 Other Income.................................................................... 51 - 51
Total Operat ing Revenues... .. .. .. ... .. .. .. .. .. ... .. .. .. .. .. .. .. ... .. $ 379 $ 3,067 $ 3,446
Operating Expenses:Economic and Manpower Development…………………… $ 1,442 $ 1,729 $ 3,171
Total Operating Expenses............................................ $ 1,442 $ 1,729 $ 3,171
Operating Income (Loss)...................................................... $ (1,063) $ 1,338 $ 275
Nonoperating Revenues (Expenses):Bond Interest Expense……………………………………… $ (426) $ - $ (426) Investment/Interest Income………………………………… 813 - 813
Total Nonoperating Revenues (Expenses)................... $ 387 $ - $ 387
Change in Net Assets…………………………………………… $ (676) $ 1,338 $ 662
Net Assets, Beginning, as Reported..................................... $ 24,745 $ 3,690 $ 28,435
Net Assets, Ending............................................................... $ 24,069 $ 5,028 $ 29,097
AGRICULTURAL& ECONOMIC RURAL
TOTALBOARD AUTHORITYDEVELOPMENT FINANCE
210

8/6/2019 2010 CAFR Minnesota
http://slidepdf.com/reader/full/2010-cafr-minnesota 227/265
STATE OF MINNESOTA
NONMAJOR COMPONENT UNITSNOT ISSUING SEPARATELY AUDITED FINANCIAL STATEMENTSCOMBINING STATEMENT OF CASH FLOWSYEAR ENDED JUNE 30, 2010
(IN THOUSANDS)
Cash Flows from Operating Activities:Receipts from Customers................................................................... $ 1,066 $ 10,936 $ 12,002 Receipts from Other Revenues........... ........ ........ ....... ........ ........ ........ . 1,514 15,074 16,588 Payments to Customers..................................................................... - (10,075) (10,075) Payments to Suppliers........................................................................ (764) - (764) Payments to Others............................................................................ - (11,183) (11,183)
Net Cash Flows from Operating Activities...................................... $ 1,816 $ 4,752 $ 6,568
Cash Flows from Non-Capital Financing:Payment of Bond Interest………………………………………………… $ (493) $ - $ (493) Repayment of Bond Principal…………………………………………… (2,525) - (2,525) Loan Issuances…............……………….............................................. (400) - (400)
Net Cash Flows from Non-Capital Financing Act ivit ies.... .. .. .. ... .. .. .. $ (3,418) $ - $ (3,418)
Cash Flows from Investing Activities:Proceeds from Sales and Maturit ies of Investments... ... .. .. .. .. .. .. .. ... .. .. $ 5,391 $ - $ 5,391 Purchase of Investments…………………………………………………. (4,821) - (4,821) Investment Interest……………………………………………………...… 779 - 779
Net Cash Flows from Investing Activit ies... .. .. .. ... .. .. .. .. .. ... .. .. .. .. .. .. .. . $ 1,349 $ - $ 1,349
Net Increase (Decrease) in Cash and Cash Equivalents......................... $ (253) $ 4,752 $ 4,499
Cash and Cash Equivalents, Beginning, as Reported... .. .. .. .. .. .. .. ... .. .. .. .. . $ 3,668 $ 20,926 $ 24,594
Cash and Cash Equivalents, Ending....................................................... $ 3,415 $ 25,678 $ 29,093
Reconciliation of Operating Income (Loss) toNet Cash Flows from Operating Activities:
Operating Income (Loss).................................................................... $ (1,063) $ 1,338 $ 275
Adjustments to Reconcile Operating Income toNet Cash Flows from Operating Activities:
Loans Receivable…………………………………………………………. $ 2,879 $ (2,126) $ 753 Due to Primary Government………………………………………...…… - 5,540 5,540
Net Reconciling Items to be Added to(Deducted from) Operat ing Income.... ... .. .. .. .. .. ... .. .. .. .. .. .. .. ... .. .. .. . $ 2,879 $ 3,414 $ 6,293
Net Cash Flows from Operating Activities.............................. $ 1,816 $ 4,752 $ 6,568
TOTALFINANCE
AUTHORITY
AGRICULTURAL& ECONOMIC RURAL
BOARDDEVELOPMENT
211

8/6/2019 2010 CAFR Minnesota
http://slidepdf.com/reader/full/2010-cafr-minnesota 228/265
MINNESOTA
Headwaters of the mighty Mississippi
212

8/6/2019 2010 CAFR Minnesota
http://slidepdf.com/reader/full/2010-cafr-minnesota 229/265

8/6/2019 2010 CAFR Minnesota
http://slidepdf.com/reader/full/2010-cafr-minnesota 230/265
Total Previously Remaining
Purpose of Issue Law Authorizing Authorization Issued Authorization
Building17, 18, 19, 20
1990,Ch.610 270,129.1$ 270,126.0$ 3.1$
Building 10, 14, 16, 18 1994,Ch.643 523,874.5 523,849.0 25.5
Building8, 9, 10, 14
X1997, Ch. 2 37,432.0 37,335.0 97.0
Building10, 11, 14, 15
1999, Ch. 240 439,437.1 438,865.0 572.1
Various Purpose3, 8, 9, 10, 13
2000, Ch. 492 527,684.7 518,170.0 9,514.7
Various Purpose3, 8, 10, 12
X2001, Ch. 12 116,758.7 115,425.0 1,333.7
Various Purpose2, 3, 8
2002, Ch. 374 74,017.0 74,017.0 0.0
Various Purpose2, 3, 6, 8, 10, 11
2002, Ch. 393 600,831.8 598,605.0 2,226.8
Various Purpose3, 8
X2002, Ch. 1 15,273.0 15,055.0 218.0
Trunk Highway2, 3
X2003, Ch. 19, Art.3 400,191.5 399,990.0 201.5
Trunk Highway2, 3
X2003, Ch. 19, Art.4 106,026.5 105,700.0 326.5
Various Purpose2, 6
2005, Ch. 20 941,297.4 905,079.0 36,218.4
Various Purpose2, 6, 7
2006, Ch. 258 1,002,855.2 928,975.0 73,880.2
Various Purpose
2
X2007, Ch. 2 53,971.7 22,845.0 31,126.7Trunk Highway
2X2007, Ch. 2 20,020.0 19,085.0 935.0
Trunk Highway 2008, Ch. 152 1,783,300.0 180,975.0 1,602,325.0
Transportation 2008, Ch. 152 60,060.0 37,500.0 22,560.0
Various Purpose2, 4
2008, Ch. 179 800,869.3 562,298.0 238,571.3
Various Purpose 2008, Ch. 365 105,500.0 58,400.0 47,100.0
Trunk Highway 2009, Ch. 36 40,000.0 5,000.0 35,000.0
Various Purpose2, 3
2009, Ch. 93 258,865.0 106,500.0 152,365.0
Trunk Highway 2009, Ch. 93 2,705.0 2,700.0 5.0
Various Purpose1
2010, Ch. 189 1,074,865.0 0.0 1,074,865.0
Trunk Highway1
2010, Ch. 189 32,945.0 0.0 32,945.0
Trunk Highway 2010, Ch. 388 100,100.0 0.0 100,100.0
Totals 9,389,009.5$ 5,926,494.0$ 3,462,515.5$
(1)
(2)
(3)
(4)
(5)
(6)
Laws 2008, Chapter 179 reduced Various Purpose Bonds authorizations in Laws 2002, Chapter 393 by $17,262,000; Laws2005, Chapter 20 by $2,000,000; and Laws 2006, Chapter 258 by $3,767,000.
Laws 2007, Chapter 45 reduced the Various Purpose Bond authorization in Laws 2006, Chapter 258 by $150,000.
Minnesota Statutes 16A.642, required that on January 1, 2009 the Commissioner of Finance report unencumbered bondproceeds balances to the legislature that were enacted more than four years prior. These bond proceeds balances and their bond authorizations cancelled effective on July 1, 2009. The cancellation report reduced Various Purpose Bonds authorizationsas follows: Laws 2000, Chapter 492 by $217,331; Special Session Laws 2001, Chapter 12 by $171,552; Laws 2002, Chapter
374 by $30,014; Laws 2002, Chapter 393 by $284,508; and Special Session Laws 2002, Chapter 1 by $178,656. Thecancellation report also reduced Trunk Highway Bonds authorized by Special Session Laws 2003, Chapter 19, Article 3 by$208,570; Special Session Laws 2003, Chapter 19, Article 4 by $4,083,466.
GENERAL OBLIGATION BONDS AUTHORIZED, ISSUED AND UNISSUED
June 30, 2010
(In Thousands)
Laws 2008, Chapter 365 reduced the Various Purpose Bond authorization in Laws 2008, Chapter 179 by $223,588,000.
The Governor vetoed $361,460,000 of appropriations for Various Purpose capital projects and $6,500,000 for Trunk Highwayprojects to be funded from Laws 2010, Chapter 189. The Governor will request that the bond authorizations be reduced to matchthe appropriations in the 2011 Legislative Session.
Laws 2010, Chapter 189 also reduced Various Purpose Bonds authorizations in Laws 2002, Chapter 374 by $553,774; Laws2002, Chapter 393 by $280,914; Laws 2005, Chapter 20 by $1,682,567; Laws 2006, Chapter 258 by $7,770; Special SessionLaws 2007, Chapter 2 by $2,283,263; Laws 2008, Chapter 179 by $152,660; and Laws 2009, Chapter 93 by $3,900,000. Laws2010, Chapter 189 reduced Trunk Highway Bond authorization Laws 2008, Chapter 152 by $18,500,000. Laws 2010, Chapter 189 reduced the Various Purpose Bond authorization in Laws 2009, Chapter 93 by $85,155,000.
214

8/6/2019 2010 CAFR Minnesota
http://slidepdf.com/reader/full/2010-cafr-minnesota 231/265
(7)
(8)
(9)
(10)
(11)
(12)
(13)
(14)
(15)
(16)
(17)
(18)
(19)
(20)
Minnesota Statutes 16A.642, required that on January 1, 2007 the Commissioner of Finance report unencumbered bondproceeds balances to the legislature that were enacted more than four years prior. These bond proceeds balances and their bond authorizations cancelled effective on July 1, 2007. The cancellation report reduced Building Bond authorizations asfollows: Special Session Laws 1997, Chapter 2 by $112,548; and Laws 1999, Chapter 240 by $93,091. The cancellation reportalso reduced Various Purpose Bonds authorizations as follows: Laws 2000, Chapter 492 by $524,411; Special Session Laws2001, Chapter 12 by $274,734; Laws 2002, Chapter 374 by $88,266; Laws 2002, Chapter 393 by $6,052,781; and SpecialSession Laws 2002, Chapter 1 by $863,386. The cancellation report also reduced Transportation Bonds authorized by Laws
2002, Chapter 374 by $590,000.
Laws 1993, Chapter 373 reduced Building Bond authorizations of Laws 1990, Chapter 610 by $2,500,000.
Laws 1993, Chapter 373 reduced Building Bond authorizations of Laws 1990, Chapter 610 by $2,500,000.
Laws 1994, Chapter 643 reduced Building Bond authorizations of Laws 1990, Chapter 610 by $115,000.
Special Session Laws 1995, Chapter 2 reduced Building Bond authorizations as follows: Laws 1990, Chapter 610 by $580,000;and Laws 1994, Chapter 643 by $1,245,000.
Laws 1998, Chapter 404 reduced Building Bonds authorization in Laws 1994, Chapter 643 by $1,350,000. Laws 1998, Chapter 404 also reduced Transportation Bond authorization in Laws 1994, Chapter 643 by $10,000,000.
Laws 2000, Chapter 492 reduced Building Bonds authorizations as follows: Laws 1994, Chapter 643 by $1,964.000; SpecialSession Laws 1997, Chapter 2 by $10,000,000; and Laws 1999, Chapter 240 by $4,000,000. The $2,700,000 bondauthorization reduction for Laws of 1998, Chapter 404 was for the cancellation of projects actually authorized by Laws of 1999,Chapter 240.
The Governor vetoed $23,605,000 of appropriations for capital projects and $10,440,000 of appropriations for transportationprojects to be funded from Laws 1999, Chapter 240. The bond authorization was reduced to match the appropriations in Laws2005, Chapter 20.
Laws 1997, Chapter 202 reduced Building Bond authorizations as follows: Laws 1990, Chapter 610 by $9,260,000. Laws 1997,
Chapter 202 also reduced; Transportation Bonds authorized in Laws 1990, Chapter 610 by $165,000; Reinvest in MinnesotaBond authorization in Laws 1990, Chapter 610 by $20,000.
The Governor vetoed $1,000,000 of appropriations for capital projects to be funded from Special Session Laws 2001, Chapter 12. The bond authorization was reduced to match the appropriations in the Laws 2005, Chapter 20.
Laws of 2001, Chapter 55 converted $7 million of transportation improvement projects authorized in Laws 2000, Chapter 479from general fund to Transporation Bonds and converted capital projects authorized in Laws 2000, Chapter 492 to be financedfrom Various Purpose general obligation bonds to general fund cash.
The Governor vetoed $352,923,000 of appropriations for capital projects to be funded from Laws 2002, Chapter 393. The bondauthorization was reduced to match the appropriations in Laws 2005, Chapter 20. Laws of 2002, Chapter 393 also corrected thebond authorization reported in footnote 13 below by increasing the bond authorization of Laws 1998, Chapter 404 by $2,700,000and reducing the bond authorization of Laws 1999, Chapter 240 by the $2,700,000.
Laws 2005, Chapter 20 reduced Building Bond authorizations as follows: Laws 1994, Chapter 643 by $2,631,376; SpecialSession Laws 1997, Chapter 2 by $18; and Laws 1999, Chapter 240 by $24,887,000. Laws 2005, Chapter 20 also reducedMunicipal Energy Building Bonds authorized by Laws 1994, Chapter 643 by $25,000; Laws 1994, Chapter 643 by $128,720;Laws 1999, Chapter 240 by $10,440,000 and Various Purpose Bonds authorized by Laws 2000, Chapter 492 by $3,300,000;Special Session Laws 2001, Chapter 12 by $1,000,000; and Laws 2002, Chapter 393 by $352,923,000.
Minnesota Statutes 16A.642, required that on January 1, 2005 the Commissioner of Finance report unencumbered bondproceeds balances to the legislature that were enacted more than four years prior. These bond proceeds balances and their bond authorizations cancelled effective on July 1, 2005. The cancellation report reduced Building Bond authorizations asfollows: Special Session Laws 1997, Chapter 2 by 763,514; and Laws 1999, Chapter 240 by $292,887. The cancellation reportalso reduced Various Purpose Bonds authorizationed by Laws 2000, Chapter 492 by $3,333,695.
215

8/6/2019 2010 CAFR Minnesota
http://slidepdf.com/reader/full/2010-cafr-minnesota 232/265
MINNESOTA
Headwaters of the mighty Mississippi
216

8/6/2019 2010 CAFR Minnesota
http://slidepdf.com/reader/full/2010-cafr-minnesota 233/265
State of Minnesota
2010
Comprehensive
Annual
Financial Report
Statistical
Section
The statistical section presents detailed information as a context for understanding what the information in the financial statements, notedisclosures, and required supplementary information says about thestate’s overall financial health.
Financial Trends
These schedules contain trend information to help understand andassess how the state’s financial position has changed over time.
Revenue Capacity
These schedules contain information to assess the state’s mostsignificant revenue source, individual income taxes. Minnesota’sdata privacy laws prevent disclosing the names of principaltaxpayers.
Debt Capacity
These schedules present information to help assess the affordabilityof the state’s current level of outstanding debt and the state’s abilityto issue additional debt in the future.
Economic and Demographic Information
These schedules offer economic and demographic indicators to helpunderstand the environment within which the state’s financialactivities take place.
Operating Information
These schedules contain service and infrastructure data to helpunderstand how the information in the state’s financial report relatesto the services the state provides and the activities it performs.
217

8/6/2019 2010 CAFR Minnesota
http://slidepdf.com/reader/full/2010-cafr-minnesota 234/265
MINNESOTA
Headwaters of the mighty Mississippi
218

8/6/2019 2010 CAFR Minnesota
http://slidepdf.com/reader/full/2010-cafr-minnesota 235/265
State of Minnesota
2010 Comprehensive Annual Financial Report
Index of Statistical Section
PageFinancial Trends
Schedule 1 – Net Assets by Component .............................................................................................. 220
Schedule 2 – Changes in Net Assets .................................................................................................... 222
Schedule 3 – Fund Balances – Governmental Funds ........................................................................... 226
Schedule 4 – Changes in Fund Balances – Governmental Funds ........................................................ 230
Revenue Capacity
Schedule 5 – Revenue Base ................................................................................................................ 232
Schedule 6 – Revenue Rates ............................................................................................................... 234
Schedule 7 – Principal Tax Payers....................................................................................................... 237
Debt Capacity
Schedule 8 – Ratios of Outstanding and General Bonded Debt .......................................................... 238
Schedule 9 – Pledged Revenue Coverage .......................................................................................... 240
Economic and Demographic Information
Schedule 10 – Demographic and Economic Statistics ......................................................................... 245
Schedule 11 – Principal Employers ...................................................................................................... 245
Operating Information
Schedule 12 – Full-Time Equivalent State Employees by Function ..................................................... 246
Schedule 13 – Operating and Capital Asset Indicators by Function .................................................... 248
219

8/6/2019 2010 CAFR Minnesota
http://slidepdf.com/reader/full/2010-cafr-minnesota 236/265
2002 2003 2004 2005
Governmental Activities:
Invested in Capital Assets, Net of Related Debt 3,516,294$ 4,998,667$ 5,525,157$ 5,943,503$
Restricted 2,300,180 2,280,661 2,387,732 2,452,423
Unrestricted 2,364,102 (526,251) (987,312) (673,695)
Total Governmental Activities Net Assets 8,180,576$ 6,753,077$ 6,925,577$ 7,722,231$
Business-type Activities:
Invested in Capital Assets, Net of Related Debt 776,233$ 812,780$ 872,804$ 884,486$
Restricted 431,695 151,812 86,291 520,745
Unrestricted 157,403 179,009 218,797 (1,096)
Total Business-type Activities Net Assets 1,365,331$ 1,143,601$ 1,177,892$ 1,404,135$
Primary Government:
Invested in Capital Assets, Net of Related Debt 4,292,527$ 5,811,447$ 6,397,961$ 6,827,989$
Restricted 2,731,875 2,432,473 2,474,023 2,973,168
Unrestricted 2,521,505 (347,242) (768,515) (674,791)
Total Primary Government Net Assets 9,545,907$ 7,896,678$ 8,103,469$ 9,126,366$
Note: The state implemented GASB Statement No. 34 in fiscal year 2002. Data begins that year.
Source: The state's Comprehensive Annual Financial Report for the relevant year.
Schedule 1 - Net Assets By ComponentLast Nine Years
Accrual Basis of Accounting(In Thousands)
220

8/6/2019 2010 CAFR Minnesota
http://slidepdf.com/reader/full/2010-cafr-minnesota 237/265
2006 2007 2008 2009 2010
6,468,103$ 6,781,966$ 7,775,939$ 8,285,028$ 8,947,341$
2,482,626 2,703,598 2,693,756 2,552,659 3,060,905
649,481 1,317,416 489,661 (917,895) (2,646,096)
9,600,210$ 10,802,980$ 10,959,356$ 9,919,792$ 9,362,150$
931,297$ 1,016,955$ 1,108,136$ 1,199,727$ 1,293,856$
852,943 1,058,032 1,140,070 737,400 509,705
(1,089) (1,403) (5,900) (38,907) (300,615)
1,783,151$ 2,073,584$ 2,242,306$ 1,898,220$ 1,502,946$
7,399,400$ 7,798,921$ 8,884,075$ 9,484,755$ 10,241,197$
3,335,569 3,761,630 3,833,826 3,290,059 3,570,610
648,392 1,316,013 483,761 (956,802) (2,946,711)
11,383,361$ 12,876,564$ 13,201,662$ 11,818,012$ 10,865,096$
221

8/6/2019 2010 CAFR Minnesota
http://slidepdf.com/reader/full/2010-cafr-minnesota 238/265
2002 2003 2004 2005
Program Revenues:
Governmental Activities:
Charges for Services:
Public Safety and Corrections 104,577$ 101,157$ 138,359$ 143,998$
Transportation 3,976 16,445 15,473 17,451 Agricultural, Environmental and Energy Resources
(1)179,838 179,037 187,779 196,047
Economic and Workforce Development(1)
117,993 125,832 158,788 159,929
General Education 20,822 34,038 33,284 39,655
Higher Education - 249 - 2
Health and Human Services 721,014 571,531 516,539 360,563
General Government 250,588 183,052 214,962 226,809
Operating Grants and Contributions
Health and Human Services 3,229,846 3,764,754 3,874,378 4,075,420
All Others 1,468,115 1,454,634 1,554,481 1,480,801
Capital Grants and Contributions 21,508 131,632 269,786 261,236
6,118,277$ 6,562,361$ 6,963,829$ 6,961,911$
Business-type Activities:
Charges for Services:
State Colleges and Universities 539,365$ 583,236$ 636,138$ 651,094$
Unemployment Insurance 378,531 608,634 806,185 908,540
Lottery 352,618 351,815 387,800 408,011
Other 126,326 153,962 171,598 169,182
Operating Grants and Contributions 437,777 369,481 312,200 198,217
Capital Grants and Contributions 24,333 2,274 2,307 1,687
1,858,950$ 2,069,402$ 2,316,228$ 2,336,731$
Total Primary Government Program7,977,227$ 8,631,763$ 9,280,057$ 9,298,642$
Expenses:
Governmental Activities:
Public Safety and Corrections 702,345$ 750,143$ 731,438$ 764,307$
Transportation 1,619,806 1,727,604 1,662,402 1,685,256
Agricultural, Environmental and Energy Resources(1)
609,199 541,828 557,414 612,566
Economic and Workforce Development(1)
731,568 671,469 591,513 505,901
General Education 5,461,074 6,929,870 6,512,834 6,820,389
Higher Education 865,729 785,524 744,112 762,092
Health and Human Services 7,307,133 8,102,781 8,228,552 8,466,865
General Government 849,938 652,005 671,908 654,758
Intergovernmental Aid 1,287,768 1,480,533 1,355,683 1,284,576
Interest 161,129 169,023 181,323 184,573
Total Governmental Activities Expenses 19,595,689$ 21,810,780$ 21,237,179$ 21,741,283$
Business-type Activities:
State Colleges and Universities 1,296,697$ 1,386,493$ 1,385,817$ 1,394,893$
Unemployment Insurance 946,562 1,054,281 931,659 686,818
Lottery 296,985 273,884 287,550 302,575
Other 132,479 153,397 166,923 172,886
Total Business-type Activities Expenses 2,672,723$ 2,868,055$ 2,771,949$ 2,557,172$
Total Primary Government Expenses 22,268,412$ 24,678,835$ 24,009,128$ 24,298,455$
Note: The state implemented GASB Statement No. 34 in fiscal year 2002. Data begins that year.
Schedule 2 - Changes in Net Assets
Accrual Basis of Accounting
(In Thousands)
(1)Beginning in fiscal year 2007, the Department of Commerce financial activity was moved from the Economic and
Workforce Development function to the Agricultural, Environmental and Energy Resources function.
Total Governmental Activities Program
Source: The state's Comprehensive Annual Financial Report for the relevant year.
Last Nine Years
Total Business-type Activities Program
Revenues
Revenues
Revenues
222

8/6/2019 2010 CAFR Minnesota
http://slidepdf.com/reader/full/2010-cafr-minnesota 239/265
2006 2007 2008 2009 2010
174,807$ 130,830$ 143,073$ 159,155$ 156,139$
19,226 18,796 21,474 45,385 25,397 218,376 335,670 360,056 339,523 358,666
214,650 44,551 52,400 47,377 49,212
38,808 42,943 54,662 42,192 21,342
- - - - 3
447,404 265,853 330,570 285,963 353,929
245,015 278,846 240,331 270,153 266,565
4,187,909 4,609,077 4,909,527 5,996,063 6,775,255
1,506,094 1,891,362 1,767,796 1,758,923 3,388,958
452,197 236,700 449,765 272,736 206,292
7,504,486$ 7,854,628$ 8,329,654$ 9,217,470$ 11,601,758$
694,053$ 750,742$ 794,091$ 827,997$ 771,104$
1,054,227 946,269 835,725 800,590 972,425
449,761 422,570 461,565 482,738 499,271
178,764 230,657 233,944 232,570 246,829
176,023 187,530 217,224 872,484 1,958,195
1,963 1,839 1,142 4,262 1,554
2,554,791$ 2,539,607$ 2,543,691$ 3,220,641$ 4,449,378$
10,059,277$ 10,394,235$ 10,873,345$ 12,438,111$ 16,051,136$
818,192$ 855,328$ 901,641$ 944,400$ 958,915$
1,791,316 1,795,056 2,047,500 2,068,880 2,468,573
525,251 762,549 825,842 834,458 950,738
273,510 568,064 704,501 695,314 715,085
7,336,455 7,323,406 7,675,567 7,811,723 8,042,744
786,563 921,339 981,943 912,011 981,859
8,823,115 9,596,061 10,296,359 11,248,700 11,949,235
718,996 771,733 816,111 800,123 762,238
1,400,479 1,489,439 1,511,715 1,435,897 1,558,453
172,612 208,719 221,162 210,435 261,802
22,646,489$ 24,291,694$ 25,982,341$ 26,961,941$ 28,649,642$
1,479,519$ 1,550,936$ 1,675,051$ 1,743,609$ 1,802,527$
690,713 735,987 828,857 1,865,939 3,038,557
332,031 311,893 346,834 363,832 377,025
183,043 215,005 228,361 235,163 222,110
2,685,306$ 2,813,821$ 3,079,103$ 4,208,543$ 5,440,219$
25,331,795$ 27,105,515$ 29,061,444$ 31,170,484$ 34,089,861$
223

8/6/2019 2010 CAFR Minnesota
http://slidepdf.com/reader/full/2010-cafr-minnesota 240/265
2002 2003 2004 2005
Net (Expense)/Revenue:
Governmental Activities (13,477,412)$ (15,248,419)$ (14,273,350)$ (14,779,372)$
Business-type Activities (813,773) (798,653) (455,721) (220,441)
Total Primary Government Net Expense (14,291,185)$ (16,047,072)$ (14,729,071)$ (14,999,813)$
General Revenues and Other Changes in Net Assets
Governmental Activities:
Taxes:
Individual Income Taxes 5,419,220$ 5,497,328$ 5,863,383$ 6,556,331$
Corporate Income Taxes 428,614 636,214 643,442 702,839
Sales Taxes 3,777,259 3,924,424 3,911,496 4,269,837
Property Taxes 308,337 594,094 608,860 603,412
Motor Vehicle Taxes 616,616 606,137 587,223 552,856
Fuel Taxes 614,285 656,326 643,964 652,493
Other Taxes 1,862,382 1,981,468 2,190,491 2,417,175
Tobacco Settlement 380,024 261,525 173,173 178,177
Unallocated Investment/Interest Income 83,432 24,049 32,712 42,753
Other Revenues 71,621 203,206 178,255 63,182
Special Item 134,000 30,000 - -
Transfers (615,758) (548,291) (471,382) (425,180)
Total Governmental Activities 13,080,032$ 13,866,480$ 14,361,617$ 15,613,875$
Business-type Activities:
Unallocated Investment/Interest Income 35,853$ 15,697$ 16,213$ 9,264$
Other Revenues 721 9,294 2,417 12,240
Transfers 615,758 548,291 471,382 425,180
Total Business-type Activities 652,332$ 573,282$ 490,012$ 446,684$
13,732,364$ 14,439,762$ 14,851,629$ 16,060,559$
Change in Net Assets:
Governmental Activities: (397,380)$ (1,381,939)$ 88,267$ 834,503$
Prior Period Adjustments - (41,919) 84,233 (37,849)
Change in Accounting Principle - - - -
Change in Fund Structure - (3,641) - -
Change in Inventory 2,441 - - -
Business-type Activities: (161,441) (225,371) 34,291 226,243
Prior Period Adjustments - - - -
Change in Accounting Principle - - - -
Change in Fund Structure - 3,641 - -
(556,380)$ (1,649,229)$ 206,791$ 1,022,897$
Note: The state implemented GASB Statement No. 34 in fiscal year 2002. Data begins that year.
Source: The state's Comprehensive Annual Financial Report for the relevant year.
Last Eight Years
Total Primary Government General
Revenues
Assets
Total Primary Government Change in Net
(1)Beginning in fiscal year 2007, the Department of Commerce financial activity was moved from the Economic A27and
Workforce Development function to the Agricultural, Environmental and Energy Resources function.
(In Thousands)
Schedule 2 - Changes in Net Assets (Cont'd.)
Accrual Basis of Accounting
224

8/6/2019 2010 CAFR Minnesota
http://slidepdf.com/reader/full/2010-cafr-minnesota 241/265
2006 2007 2008 2009 2010
(15,142,003)$ (16,437,066)$ (17,652,687)$ (17,744,471)$ (17,047,884)$
(130,515) (274,214) (535,412) (987,902) (990,841)
(15,272,518)$ (16,711,280)$ (18,188,099)$ (18,732,373)$ (18,038,725)$
7,069,242$ 7,463,959$ 7,929,096$ 7,203,337$ 6,792,510$
1,189,328 1,160,380 1,039,843 741,049 539,534
4,439,667 4,600,984 4,474,576 4,338,748 4,379,236
633,288 667,395 703,972 733,899 746,685
539,468 1,025,820 1,011,494 955,785 997,214
659,980 647,168 651,988 758,271 826,574
2,663,939 2,154,689 2,149,162 2,206,648 2,224,237
184,139 184,924 186,425 176,140 157,924
101,803 155,016 121,638 57,790 21,242
28,447 91,867 103,416 95,316 145,608
- - - - -
(474,090) (510,578) (654,359) (610,880) (543,525)
17,035,211$ 17,641,624$ 17,717,251$ 16,656,103$ 16,287,239$
18,300$ 26,786$ 48,126$ 32,306$ 8,483$
17,141 17,811 1,649 630 -
474,090 510,578 654,359 610,880 543,525
509,531$ 555,175$ 704,134$ 643,816$ 552,008$
17,544,742$ 18,196,799$ 18,421,385$ 17,299,919$ 16,839,247$
1,893,208$ 1,204,558$ 64,564$ (1,088,368)$ (760,645)$
(15,229) 7,684 - 94,658 87,186
- - 91,812 (45,854) 115,817
- (9,472) - - -
- - - - -
379,016 280,961 168,722 (344,086) (438,833)
- - - - 43,559
- - - - -
- 9,472 - - -
2,256,995$ 1,493,203$ 325,098$ (1,383,650)$ (952,916)$
225

8/6/2019 2010 CAFR Minnesota
http://slidepdf.com/reader/full/2010-cafr-minnesota 242/265
2002 2003 2004 2005
General Fund:
Reserved 146,286$ 74,766$ 120,506$ 161,257$
Designated 482,657 - - -
Undesignated 56,516 (1,006,866) (448,465) (68,292)
Total General Fund 685,459$ (932,100)$ (327,959)$ 92,965$
All Other Governmental Funds:
Reserved 3,755,023$ 3,944,156$ 2,543,206$ 2,797,593$
Designated, Reported In:
783,976 442,662 580,118 484,012
Debt Service Fund - - - -
Permanent Funds - - - -
Undesignated, Reported In:
472,520 396,014 262,630 189,873
1,608 44 (62,340) (8,187)
5,013,127$ 4,782,876$ 3,323,614$ 3,463,291$
Total Governmental Funds 5,698,586$ 3,850,776$ 2,995,655$ 3,556,256$
Notes:
Capital Projects Funds
Total All Other Governmental
Funds
Schedule 3 - Fund Balances - Governmental Funds
Last Nine Years
Modified Accrual Basis of Accounting
(In Thousands)
Special Revenue Funds
Special Revenue Funds
Due to significant fund structure changes that occurred when the state implemented GASB Statement No. 34 in
fiscal year 2002, earlier financial statement information is not presented.
The State implemented GASB Statement No. 54 in fiscal year 2010, which significantly changed the fundbalance classifications. Fiscal year 2010 fund balance classifications are not comparable to prior years'
classifications.
Source: The state's Comprehensive Annual Financial Report for the relevant year.
226

8/6/2019 2010 CAFR Minnesota
http://slidepdf.com/reader/full/2010-cafr-minnesota 243/265

8/6/2019 2010 CAFR Minnesota
http://slidepdf.com/reader/full/2010-cafr-minnesota 244/265
2002 2003 2004 2005
General Fund:
Nonspendable -$ -$ -$ -$
Restricted - - - -
Committed - - - -
Assigned - - - -
Unassigned - - - -
Total General Fund -$ -$ -$ -$
All Other Governmental Funds:
Nonspendable -$ -$ -$ -$
Restricted - - - -
Committed - - - -
Assigned - - - -
Unassigned - - - -
-$ -$ -$ -$
Total Governmental Funds -$ -$ -$ -$
Notes:
Source: The state's Comprehensive Annual Financial Report for the relevant year.
Due to significant fund structure changes that occurred when the state implemented GASB Statement No. 34 infiscal year 2002, earlier financial statement information is not presented.
Total All Other Governmental
Funds
The State implemented GASB Statement No. 54 in fiscal year 2010, which significantly changed the fundbalance classifications. Fiscal year 2010 fund balance classifications are not comparable to prior years'classifications.
Schedule 3 - Fund Balances - Governmental Funds
Last Nine Years
Modified Accrual Basis of Accounting
(In Thousands)
228

8/6/2019 2010 CAFR Minnesota
http://slidepdf.com/reader/full/2010-cafr-minnesota 245/265
2006 2007 2008 2009 2010
-$ -$ -$ -$ 465,601$
- - - - 173,687
- - - - -
- - - - -
- - - - (1,525,534)
-$ -$ -$ -$ (886,246)$
-$ -$ -$ -$ 718,469$
- - - - 2,380,542
- - - - 537,009
- - - - 3,920
- - - - -
-$ -$ -$ -$ 3,639,940$
-$ -$ -$ -$ 2,753,694$
229

8/6/2019 2010 CAFR Minnesota
http://slidepdf.com/reader/full/2010-cafr-minnesota 246/265
2002 2003 2004 2005
Revenues:
Individual Income Taxes 5,439,186$ 5,477,799$ 5,836,790$ 6,534,422$Corporate Income Taxes 454,318 572,689 648,837 711,136
Sales Taxes 3,795,942 3,822,453 3,959,236 4,281,391
Property Taxes 305,573 585,416 599,622 610,809
Motor Vehicle Taxes 1,111,953 1,109,090 1,096,890 1,067,444
Fuel Taxes 611,886 645,886 651,261 655,162
Federal Revenues 4,650,483 5,265,603 5,550,606 5,606,553
Other Taxes and Revenues 3,121,250 3,212,677 3,396,171 3,591,776
Total Revenues 19,490,591$ 20,691,613$ 21,739,413$ 23,058,693$
Current:
Public Safety and Corrections 695,305$ 748,482$ 711,888$ 753,260$
Transportation 1,610,669 1,724,106 1,647,447 1,644,500
Agricultural, Environmental and Energy Resources
(1)
637,139 594,696 575,363 578,000 Economic and Workforce Development (1) 776,484 750,463 649,090 617,247
General Education 5,460,622 6,929,529 6,512,633 6,820,292
Higher Education 864,395 785,887 745,406 764,072
Health and Human Services 7,118,313 8,091,315 8,229,553 8,465,547
General Government 712,474 604,481 617,052 622,177
Intergovernment Aid 1,287,768 1,480,533 1,355,683 1,284,576
Securities Lending Rebates and Fees 25,408 6,968 3,854 9,030
Capital Outlay 500,458 572,534 701,372 703,777
Debt Service:
Principal 241,855 275,718 253,127 260,930
Interest 142,567 144,940 184,833 184,191
Total Expenditures 20,073,457$ 22,709,652$ 22,187,301$ 22,707,599$
Excess of Revenues Over (Under) Expenditures (582,866)$ (2,018,039)$ (447,888)$ 351,094$Other Financing Sources (Uses):
Bond Proceeds 602,613$ 256,362$ 417,937$ 507,294$
Certificates of Participation Issuance - - - -
Loan Proceeds - 14,897 - 17,885
Proceeds from Refunding Bonds 37,405 391,680 20,855 171,880
Payment of Refunding Bonds (37,405) - (425,715) (171,880)
Bond Issue Premium 35,476 58,252 33,455 61,662
Certificates of Participation Premium - - - -
Net Transfers In (Out) (601,319) (523,318) (456,971) (387,029)
Capital Leases 3,326 3,134 1,774 8,387
Total Other Financing Sources (Uses) 40,096$ 201,007$ (408,665)$ 208,199$
Changes in Inventory 2,441 (321) 1,432 1,308 Changes in Fund Structure 2,241,775 (1,117) - -
Changes in Accounting Principles 67,749 - - -
Prior Period Adjustments (26,608) (59,340) - -
Special Item 134,000 30,000 - -
Net Change in Fund Balances 1,876,587$ (1,847,810)$ (855,121)$ 560,601$
Debt Service as a Percentage of Noncapital Expenditures 2.0% 1.9% 2.0% 2.0%
Schedule 4 - Changes in Fund Balances - Governmental Funds
Last Nine Years
Modified Accrual Basis of Accounting
(In Thousands)
Source: The state's Comprehensive Annual Financial Report for the relevant year.
Expenditures:
Note: The state implemented GASB Statement No. 34 in fiscal year 2002. Data begins that year.
(1)Beginning in fiscal year 2007, the Department of Commerce financial activity was moved from the
Economic and Workforce Development funct ion to the Agricultural, Environmental and EnergyResources function.
230

8/6/2019 2010 CAFR Minnesota
http://slidepdf.com/reader/full/2010-cafr-minnesota 247/265
2006 2007 2008 2009 2010
7,068,712$ 7,412,381$ 7,932,036$ 7,162,974$ 6,729,244$1,189,915 1,163,095 1,024,040 727,928 540,504
4,473,275 4,513,452 4,499,550 4,279,178 4,411,277
631,279 665,746 704,246 729,373 766,830
1,037,593 1,025,820 1,011,494 955,785 997,214
659,647 648,078 651,860 756,381 825,341
5,864,373 6,333,686 6,858,191 7,887,945 10,020,456
4,080,518 4,027,767 4,005,067 3,810,907 4,074,393
25,005,312$ 25,790,025$ 26,686,484$ 26,310,471$ 28,365,259$
793,202$ 813,636$ 858,385$ 891,480$ 901,983$
1,776,980 1,765,410 2,029,762 2,040,334 2,416,333
537,220 755,168 782,381 866,963 918,410 703,108 605,784 719,801 704,736 755,337
7,337,888 7,320,491 7,673,220 7,808,279 8,038,447
786,606 922,772 983,319 913,292 981,868
8,820,143 9,581,606 10,298,462 11,238,043 11,929,558
690,753 699,585 772,835 753,882 730,091
1,400,479 1,489,439 1,511,715 1,435,897 1,549,453
18,049 29,929 21,534 1,237 132
854,612 693,041 818,701 746,955 643,736
288,932 349,941 373,619 389,371 381,845
183,240 222,175 220,957 230,645 295,974
24,191,212$ 25,248,977$ 27,064,691$ 28,021,114$ 29,543,167$
814,100$ 541,048$ (378,207)$ (1,710,643)$ (1,177,908)$
377,949$ 720,445$ 637,744$ 675,810$ 722,904$
- - - - 74,980
24,388 24,610 414 549 5,729
160,960 264,050 - 155,415 426,505
(160,960) (264,050) - (155,415) (426,505)
45,141 57,918 34,016 56,112 108,704
- - - - 7,411
(449,246) (479,598) (622,455) (580,540) (523,176)
180,005 1,090 1,308 - 3,356
178,237$ 324,465$ 51,027$ 151,931$ 399,908$
- 2,845 2,287 1,347 4,376 - (9,588) - - -
- - - - -
- - - - -
- - - - -
992,337$ 858,770$ (324,893)$ (1,557,365)$ (773,624)$
2.0% 2.3% 2.3% 2.3% 2.3%
231

8/6/2019 2010 CAFR Minnesota
http://slidepdf.com/reader/full/2010-cafr-minnesota 248/265
2001 2002 2003
1,004,155$ 980,509$ 1,890,660$
298,387$ 282,013$ 296,927$415,323 380,852 399,799
1,143,504 1,176,293 1,136,952 8,994,221 9,279,159 9,693,308
13,321,368 13,377,345 13,858,423 6,632,406 6,981,285 7,155,596 8,499,396 8,605,381 8,930,235 8,676,404 8,974,539 9,258,367
5,276,600 5,010,525 5,178,203 4,021,489 4,005,539 3,915,092
10,306,601 10,702,728 11,492,034 2,532,330 2,821,021 2,893,049 10,115,591 10,074,878 10,221,545
6,231,039 6,062,365 6,052,241 3,906,768 3,991,636 4,124,896
1,377,067 1,525,624 1,621,389 12,536,745 13,859,167 14,908,626
1,187,536 1,317,325 1,440,220 3,131,273 3,215,164 3,376,348
4,728,135 5,266,709 5,232,613 113,332,183$ 116,909,548$ 121,185,863$
2,314,424$ 2,434,264$ 2,557,012$
368,330 473,651 663,606 14,823,299 15,625,483 16,089,018
17,506,053$ 18,533,398$ 19,309,636$
130,838,236 135,442,946 140,495,499
131,842,391$ 136,423,455$ 142,386,159$
131,842,391$ 136,423,455$ 142,386,159$
34,324,879 34,574,578 35,760,502
166,167,270$ 170,998,033$ 178,146,661$
(1)Adjustments for Residence, Dividends, Interest, Rent and Transfer Receipts less Social Security Benefits
Note
Total Earnings By Industry
Earnings By Place of Work
Other Personal Income(1)
Personal income
Health Care and Social Assistance
Government and Government Enterprises:
Federal, Civilian
MilitaryState and Local
The Personal Income by Industry Report for 2001 and later is not directly comparable to previous years because of a major change in the
way in which the data was summarized. The Federal government changed its industry classif ication system from the Standard Industrial
Classification (SIC) to the North American Industry Classification System (NAICS). The change to NAICS codes was an improvement in a
number of ways. For example, NAICS codes reflect recent technological changes and also the growth and diversification of services. In
2001, the Bureau of Economic Affairs changed to the new NAICS system. Because of this change, a direct comparison of the 2001 data
with any earlier data is not possible.
Arts, Entertainment, and RecreationAccommodation and Food Services
Bureau of Economic Analysis, U.S. Department of Commerce, SA05N - Personal income by major source and earnings by industry as of September 20, 2010.
Derivation of Personal Income:
Source:
Total Private Earnings
Nonfarm Earnings
Schedule 5 - Revenue Base
Last Nine Calendar Years
Professional and Technical ServicesManagement of Companies and EnterprisesAdministrative and Waste Services
Educational Services
Other Services, Except Public Administration
Total Government and Government Enterprises
Personal Income By Industry
Farm Earnings
Transportation and WarehousingInformation
Finance and Insurance
Wholesale Trade
Durable Goods Manufacturing
Real Estate and Rental and Leasing
Retail Trade
Manufacturing:
Utilities
Private Earnings:
Construction
Forestry, Fishing, Related ActivitiesMining
Nondurable Goods Manufacturing
232

8/6/2019 2010 CAFR Minnesota
http://slidepdf.com/reader/full/2010-cafr-minnesota 249/265
2004 2005 2006 2007 2008 2009
2,466,520$ 3,089,441$ 2,680,438$ 2,611,808$ 4,437,239$ 3,055,131$
301,315$ 301,845$ 322,520$ 326,460$ 334,601$ 343,486$430,736 453,720 510,529 496,748 635,598 482,940
1,273,103 1,248,361 1,359,490 1,341,738 1,486,868 1,515,451 10,377,189 10,574,558 10,519,155 10,156,740 9,508,248 8,019,344
14,703,033 14,903,048 15,139,874 15,484,077 15,516,229 14,102,116 7,284,143 7,260,833 7,557,310 7,582,545 7,735,234 7,338,273 9,500,469 10,025,738 10,539,400 11,077,061 11,523,055 10,760,403 9,590,980 9,571,126 9,640,300 9,774,633 9,498,383 9,077,948
5,433,112 5,583,772 5,294,729 5,539,557 5,749,921 5,170,534 4,091,623 4,142,205 4,179,078 4,417,478 4,467,624 4,294,343
12,187,514 12,647,381 13,391,232 14,040,372 13,405,787 13,092,848 2,914,275 2,970,362 2,983,106 2,651,231 2,712,748 2,619,612 10,825,901 11,440,141 12,375,438 13,449,811 14,365,535 13,778,816
6,926,319 6,719,458 7,217,755 8,291,781 9,430,065 7,755,681 4,333,128 4,611,705 4,902,735 5,080,034 5,112,934 4,655,383
1,739,372 1,781,380 1,938,994 2,110,834 2,260,907 2,366,580 15,988,253 16,675,293 18,059,007 19,245,134 20,244,583 21,238,553
1,502,810 1,523,561 1,731,523 1,780,233 1,826,320 1,749,050 3,587,470 3,677,062 3,795,917 4,026,521 3,950,264 3,826,791
5,453,478 5,693,557 5,824,217 5,964,706 5,905,855 5,763,550 128,444,223$ 131,805,106$ 137,282,309$ 142,837,694$ 145,670,759$ 137,951,702$
2,757,741$ 2,832,440$ 2,995,599$ 3,059,076$ 3,177,572$ 3,260,605$
745,144 966,040 896,525 971,403 960,408 1,058,107 16,567,688 17,138,227 17,962,127 18,750,648 19,761,405 20,210,589
20,070,573$ 20,936,707$ 21,854,251$ 22,781,127$ 23,899,385$ 24,529,301$
148,514,796 152,741,813 159,136,560 165,618,821 169,570,144 162,481,003
150,981,316$ 155,831,254$ 161,816,998$ 168,230,629$ 174,007,383$ 165,536,134$
150,981,316$ 155,831,254$ 161,816,998$ 168,230,629$ 174,007,383$ 165,536,134$
37,348,629 38,158,390 44,040,406 48,447,030 52,151,340 54,901,449
188,329,945$ 193,989,644$ 205,857,404$ 216,677,659$ 226,158,723$ 220,437,583$
233

8/6/2019 2010 CAFR Minnesota
http://slidepdf.com/reader/full/2010-cafr-minnesota 250/265
5.35% Up To 7.05% 7.85% Over
Married Joint 26,480$ $26,481 - $105,200 105,200$Married Separate 13,240$ $13,241 - $ 52,600 52,600$Single 18,120$ $18,121 - $ 59,500 59,500$Head of Household 22,300$ $22,301 - $ 89,610 89,610$
5.35% Up To 7.05% 7.85% Over
Married Joint 27,350$ $27,351 - $108,660 108,660$Married Separate 13,680$ $13,681 - $ 54,330 54,330$Single 18,710$ $18,711 - $ 61,460 61,460$Head of Household 23,040$ $23,041 - $ 92,560 92,560$
5.35% Up To 7.05% 7.85% Over
Married Joint 27,780$ $27,781 - $110,390 110,390$Married Separate 13,890$ $13,891 - $ 55,200 55,200$Single 19,010$ $19,011 - $ 62,440 62,440$Head of Household 23,400$ $23,401 - $ 94,030 94,030$
5.35% Up To 7.05% 7.85% Over
Married Joint 28,420$ $28,421 - $112,910 112,910$Married Separate 14,210$ $14,211 - $ 56,460 56,460$Single 19,440$ $19,441 - $ 63,860 63,860$Head of Household 23,940$ $23,941 - $ 96,180 96,180$
5.35% Up To 7.05% 7.85% Over
Married Joint 29,070$ $29,071 - $115,510 115,510$Married Separate 14,540$ $14,541 - $ 57,760 57,760$Single 19,890$ $19,891 - $ 65,330 65,330$Head of Household 24,490$ $24,491 - $ 98,390 98,390$
Source: Minnesota Department of Revenue Tax Research DivisionMinnesota Taxable Income is the Federal Taxable Income modified for state-specificadditions and subtractions.
Schedule 6 - Revenue Rates
Tax Rates and Taxable Income Brackets for 2001 Through 2010
Tax Year 2001
Tax Year 2002
Tax Year 2003
Tax Year 2004
Tax Year 2005
234

8/6/2019 2010 CAFR Minnesota
http://slidepdf.com/reader/full/2010-cafr-minnesota 251/265
5.35% Up To 7.05% 7.85% Over
Married Joint 29,980$ $29,981 - $119,100 119,100$Married Separate 14,990$ $14,991 - $ 59,550 59,550$Single 20,510$ $20,511 - $ 67,360 67,360$Head of Household 25,250$ $25,251 - $101,450 101,450$
5.35% Up To 7.05% 7.85% Over
Married Joint 31,150$ $31,151 - $123,750 123,750$Married Separate 15,580$ $15,581 - $ 61,880 61,880$Single 21,310$ $21,311 - $ 69,990 69,990$Head of Household 26,230$ $26,231 - $105,410 105,410$
5.35% Up To 7.05% 7.85% Over
Married Joint 31,860$ $31,861 - $126,580 126,580$Married Separate 15,930$ $15,931 - $ 63,290 63,290$Single 21,800$ $21,801 - $ 71,590 71,590$Head of Household 26,830$ $26,831 - $107,820 107,820$
5.35% Up To 7.05% 7.85% Over
Married Joint 33,220$ $33,221 - $131,970 131,970$Married Separate 16,610$ $16,611 - $ 65,990 65,990$Single 22,730$ $22,731 - $ 74,650 74,650$Head of Household 27,980$ $27,981 - $112,420 112,420$
5.35% Up To 7.05% 7.85% Over
Married Joint 33,280$ $33,281 - $132,220 132,220$Married Separate 16,640$ $16,641 - $ 66,110 66,110$Single 22,770$ $22,771 - $ 74,780 74,780$Head of Household 28,030$ $28,031 - $112,620 112,620$
Source: Minnesota Department of Revenue Tax Research DivisionMinnesota Taxable Income is the Federal Taxable Income modified for state-specificadditions and subtractions.
Tax Year 2007
Tax Year 2006
Schedule 6 - Revenue Rates
Tax Rates and Taxable Income Brackets for 2001 Through 2010 - (Cont'd.)
Tax Year 2010
Tax Year 2008
Tax Year 2009
235

8/6/2019 2010 CAFR Minnesota
http://slidepdf.com/reader/full/2010-cafr-minnesota 252/265
MINNESOTA
Headwaters of the mighty Mississippi
236

8/6/2019 2010 CAFR Minnesota
http://slidepdf.com/reader/full/2010-cafr-minnesota 253/265
Number of Filers Percent of Total
Personal Income
Tax Liability(1)
Percent of Total
0$ – 4,999 249,889 10.43% 3,722,673$ 0.07%5,000$ – 9,999 224,446 9.37% 18,901,496 0.35%
10,000$ – 19,999 384,467 16.04% 111,000,783 2.07%20,000$ – 29,999 323,167 13.49% 242,409,164 4.53%30,000$ – 39,999 265,534 11.08% 340,144,594 6.35%40,000$ – 49,999 197,140 8.23% 342,045,948 6.39%
50,000$ – 99,999 550,327 22.97% 1,670,868,392 31.21%100,000$ – 249,999 162,360 6.78% 1,193,241,339 22.29%250,000$ – 499,999 23,883 1.00% 465,182,828 8.69%
500,000$ & Over 15,091 0.63% 966,627,525 18.05%
2,396,304 100.00% $5,354,144,742 100.00%
Number of Filers Percent of Total
Personal Income
Tax Liability(1) Percent of Total
0$ – 4,999 233,988 9.19% 3,588,683$ 0.05%
5,000$ – 9,999 201,728 7.92% 6,797,920 0.09%10,000$ – 19,999 324,131 12.73% 66,515,188 0.93%20,000$ – 29,999 301,465 11.84% 173,397,454 2.41%30,000$ – 39,999 253,703 9.96% 260,376,454 3.63%
40,000$ –
49,999 207,963 8.17% 322,014,928 4.48%50,000$ – 99,999 645,261 25.34% 1,847,773,404 25.73%
100,000$ – 249,999 317,385 12.46% 2,183,190,792 30.40%250,000$ – 499,999 39,304 1.54% 744,386,446 10.37%
500,000$ & Over 21,726 0.85% 1,572,896,921 21.90%
2,546,654 100.00% 7,180,938,190$ 100.00%
(1)Minnesota Income Tax Liability before refundable tax credits.
Note: Calendar year 2008 is the most recent year available.
Source: Minnesota Department of Revenue, 1999 and 2008 Individual Income Tax Sample.
Federal Adjusted GrossIncome
Schedule 7 - Principal Tax Payers
Personal Income Tax Filers and Liability By Income Level
Calendar Years 1999 and 2008
Calendar Year 1999
Federal Adjusted GrossIncome
Calendar Year 2008
237

8/6/2019 2010 CAFR Minnesota
http://slidepdf.com/reader/full/2010-cafr-minnesota 254/265
2001 2002 2003 2004
Governmental Activities:
General Obligation Bonds 2,588,155$ 2,923,221$ 3,295,545$ 3,055,496$
Bond Premium(1)
- - 92,387 117,619
Loans 36,643 39,618 24,198 19,653 Revenue Bonds 16,100 - - -
Capital Leases 26,357 18,027 8,846 9,085
Total 2,667,255$ 2,980,866$ 3,420,976$ 3,201,853$
Business-type Activities:
General Obligation Bonds 4,440$ 108,874$ 125,950$ 141,859$
Bond Premium(1)
- - 1,694 3,242
Loans 1,965 4,498 135,486 275,703
Revenue Bonds 1,410 53,365 52,925 51,410
Capital Leases - 8,578 12,483 14,868
Total 7,815$ 175,315$ 328,538$ 487,082$
Total Debt to the Primary Government 2,675,070$ 3,156,181$ 3,749,514$ 3,688,935$
Less: Set Aside to Repay General Debt (257,534)$ (243,830)$ (263,810)$ (258,925)$
Net Debt to the Primary Government 2,417,536$ 2,912,351$ 3,485,704$ 3,430,010$
Total Personal Income 160,833,329$ 166,167,270$ 170,998,033$ 178,146,661$
Ratio of Total Debt to Personal Income 1.66% 1.90% 2.19% 2.07%
Per Capita Total Outstanding Debt (Actual Dollars) 537$ 628$ 741$ 724$
Ratio of Net General Obligation Debt to Personal Income 1.45% 1.68% 1.85% 1.65%
Per Capita Net General Obligation Debt (Actual Dollars) 468$ 555$ 624$ 577$
(1)
(2)
(3)
Sources: The state's Comprehensive Annual Financial Report for the relevant year.Bureau of Economic Analysis, U.S. Department of Commerce
Bond Premium information not available prior to 2003.
Based on projected 2010 population. U.S. Census Bureau, Population Division.
Estimate.
Schedule 8 - Ratios of Outstanding and General Bonded Debt
Last Ten Years
(In Thousands)
238

8/6/2019 2010 CAFR Minnesota
http://slidepdf.com/reader/full/2010-cafr-minnesota 255/265
2005 2006 2007 2008 2009 2010
3,315,282$ 3,414,239$ 3,791,494$ 4,330,291$ 4,667,902$ 5,103,210$
168,574 201,142 245,209 - - -
17,130 45,918 60,494 59,889 53,658 41,319 - - 15,145 14,500 13,715 12,900
11,037 182,930 172,732 167,877 161,629 158,175
3,512,023$ 3,844,229$ 4,285,074$ 4,572,557$ 4,896,904$ 5,315,604$
145,028$ 156,896$ 188,096$ 224,090$ 241,946$ 250,353$
4,420 7,735 11,594 - - -
87,376 5,832 5,419 5,829 5,582 603,020
52,475 95,780 170,941 209,719 278,246 320,779
26,497 26,520 25,382 22,647 20,324 18,662
315,796$ 292,763$ 401,432$ 462,285$ 546,098$ 1,192,814$
3,827,819$ 4,136,992$ 4,686,506$ 5,034,842$ 5,443,002$ 6,508,418$
(286,535)$ (313,324)$ (372,510)$ (368,800)$ (406,310)$ (420,055)$
3,541,284$ 3,823,668$ 4,313,996$ 4,666,042$ 5,036,692$ 6,088,363$
188,329,945$ 193,989,644$ 205,857,404$ 216,677,659$ 226,158,723$ 220,437,583$(2)
2.03% 2.13% 2.28% 2.32% 2.41% 2.95%
747$ 801$ 902$ 969$ 1,043$ 1,236$(3)
1.69% 1.68% 1.75% 1.93% 1.99% 2.24%
619$ 631$ 694$ 805$ 863$ 937$
239

8/6/2019 2010 CAFR Minnesota
http://slidepdf.com/reader/full/2010-cafr-minnesota 256/265
2001 2002 2003 2004
State University Board Revenue
- Segment of College and University Enterprise Fund
Gross Revenues(1)
54,385$ 55,964$ 60,606$ 66,221$
Less: Operating Expenses(2)
(42,343) (47,830) (47,599) (54,221)
Net Available Revenue 12,042$ 8,134$ 13,007$ 12,000$
Debt Service
Principal 27,390$ -$ -$ 1,065$
Interest 2,933 - 2,247 1,695
Total Debt Service 30,323$ -$ 2,247$ 2,760$
Coverage 0.40 N/A 5.79 4.35
Vermilion Community College and Itasca Community College Student Housing
- Segments of College and University Enterprise Fund
Gross Revenues(1)555$ 544$ 570$ 595$
Less: Operating Expenses(2)(329) (309) (335) (332)
Net Available Revenue 226$ 235$ 235$ 263$
Debt Service
Principal 110$ 120$ 130$ 140$
Interest 110 101 96 86
Total Debt Service 220$ 221$ 226$ 226$
Coverage 1.03 1.06 1.04 1.16
Giants Ridge Enterprise Fund(4)
Gross Revenues(1)4,718$ 3,455$ 3,128$ 4,994$
Less: Operating Expenses(2) (3,982) (4,070) (3,876) (4,283) Net Available Revenue 736$ (615)$ (748)$ 711$
Debt Service
Principal(3)
-$ 200$ 310$ 310$
Interest 1,066 151 574 1,170
Total Debt Service 1,066$ 351$ 884$ 1,480$
Coverage 0.69 (1.75) (0.85) 0.48
(1) Proceeds from grants and subsidies and investment income from nonoperating revenues are included.(2) Depreciation, amortization, bad debt, interest and financing expenses are not included.(3) Revenue bonds were defeased in June 2001 and reissued in February 2002.(4)
Revenue bonds of $16.0 million for Giants Ridge were issued on November 1, 2000.(5) Revenue bonds of $15.0 million for Iron Range Educational Facilities were issued on July 26, 2006.
(7) Taxes pledged for these bonds consist only of the portion allocated to the Iron Range Resources and Rehabilitation Agency (IRRRA) and D.J.Johnson Economic Protection Trust Funds.
Source: The state's Comprehensive Annual Financial Report for the relevant year.
Fund moved to the General Fund. Beginning with Fiscal Year 2010, it is shown separately from the
D.J. Johnson Economic Protection Trust Fund.
(6) Revenue bonds of $35.0 million and $42.2 were issued on November 1, 2006, and November 13, 2008,respectively, for 911 Services.
Last Ten Fiscal Years (In Thousands)
Schedule 9 - Pledged Revenue Coverage
(8)With the implementation of GASB Statement Number 54, the Iron Range Resources and Rehabilitation Fund
240

8/6/2019 2010 CAFR Minnesota
http://slidepdf.com/reader/full/2010-cafr-minnesota 257/265
2005 2006 2007 2008 2009 2010
70,091$ 76,901$ 83,073$ 88,884$ 96,248$ 101,311$
(53,884) (57,496) (60,778) (65,166) (69,867) (71,426)
16,207$ 19,405$ 22,295$ 23,718$ 26,381$ 29,885$
1,115$ 1,222$ 1,875$ 1,945$ 2,945$ 6,125$
1,401 3,496 4,663 5,374 7,091 10,816
2,516$ 4,718$ 6,538$ 7,319$ 10,036$ 16,941$
6.44 4.11 3.41 3.24 2.63 1.76
595$ 1,010$ 1,074$ 1,038$ 618$ 628$
(385) (660) (567) (675) (346) (338)
210$ 350$ 507$ 363$ 272$ 290$
150$ 230$ 370$ 135$ 145$ 145$
75 189 170 155 148 141
225$ 419$ 540$ 290$ 293$ 286$
0.93 0.84 0.94 1.25 0.93 1.01
5,138$ 4,693$ 4,204$ 4,338$ 4,195$ 4,184$
(4,532) (5,139) (5,293) (5,447) (5,796) (5,889) 606$ (446)$ (1,089)$ (1,109)$ (1,601)$ (1,705)$
615$ 615$ 665$ 705$ 760$ 815$
1,071 1,045 1,009 963 917 858
1,686$ 1,660$ 1,674$ 1,668$ 1,677$ 1,673$
0.36 (0.27) (0.65) (0.66) (0.95) (1.02)
241

8/6/2019 2010 CAFR Minnesota
http://slidepdf.com/reader/full/2010-cafr-minnesota 258/265
2001 2002 2003 2004
Taconite Production Tax(7)-$ -$ -$ -$
Net Available Revenue -$ -$ -$ -$
Debt Service
Principal -$ -$ -$ -$
Interest - - - -
Total Debt Service -$ -$ -$ -$
Coverage N/A N/A N/A N/A
Taconite Production Tax
-$ -$ -$ -$
Net Available Revenue -$ -$ -$ -$
Debt Service
Principal -$ -$ -$ -$
Interest - - - - Total Debt Service -$ -$ -$ -$
Coverage N/A N/A N/A N/A
911 Services Fund(6)
911 Services Fees -$ -$ -$ -$
Less: Operating Expenses(2)
- - - -
Net Available Revenue -$ -$ -$ -$
Debt Service
Principal -$ -$ -$ -$
Interest - - - -
Total Debt Service -$ -$ -$ -$
Coverage N/A N/A N/A N/A
(1) Proceeds from grants and subsidies and investment income from nonoperating revenues are included.(2) Depreciation, amortization, bad debt, interest and financing expenses are not included.(3) Revenue bonds were defeased in June 2001 and reissued in February 2002.
Revenue bonds of $16.0 million for Giants Ridge were issued on November 1, 2000.(5) Revenue bonds of $15.0 million for Iron Range Educational Facilities were issued on July 26, 2006.
(7) Taxes pledged for these bonds consist only of the portion allocated to the Iron Range Resources and
Rehabilitation Agency (IRRRA) and D.J.Johnson Economic Protection Trust Funds.
Source: The state's Comprehensive Annual Financial Report for the relevant year.
Fund moved to the General Fund. Beginning with Fiscal Year 2010, it is shown separately from the
D.J. Johnson Economic Protection Trust Fund.
Schedule 9 - Pledged Revenue Coverage (Cont'd.)
Last Ten Fiscal Years (In Thousands)
(6) Revenue bonds of $35.0 million and $42.2 were issued on November 1, 2006, and November 13, 2008,
Iron Range Resources and Rehabilitation Agency (IRRRA)(8)
Iron Range Resources and Rehabilitation Agency (IRRRA)
and D.J. Johnson Economic Protection Trust Funds(5) (8)
(8) With the implementation of GASB Statement Number 54, the Iron Range Resources and Rehabilitation Fund
242

8/6/2019 2010 CAFR Minnesota
http://slidepdf.com/reader/full/2010-cafr-minnesota 259/265
2005 2006 2007 2008 2009 2010
-$ -$ 36,189$ 37,975$ 50,326$ 3,197$
-$ -$ 36,189$ 37,975$ 50,326$ 3,197$
-$ -$ -$ 644$ 786$ 408$
- - 529 640 610 289
-$ -$ 529$ 1,284$ 1,396$ 697$
N/A N/A 68.41 29.58 36.05 4.59
-$ -$ -$ -$ -$ 19,612$
-$ -$ -$ -$ -$ 19,612$
-$ -$ -$ -$ -$ 408$
- - - - - 289 -$ -$ -$ -$ -$ 697$
N/A N/A N/A N/A N/A 28.14
-$ -$ 49,527$ 52,271$ 52,677$ 60,229$
- - (15,052) (25,812) (23,225) (7,290)
-$ -$ 34,475$ 26,459$ 29,452$ 52,939$
-$ -$ -$ 2,590$ 5,365$ 13,375$
- - 976 1,672 2,453 4,642
-$ -$ 976$ 4,262$ 7,818$ 18,017$
N/A N/A 35.32 6.21 3.77 2.94
243

8/6/2019 2010 CAFR Minnesota
http://slidepdf.com/reader/full/2010-cafr-minnesota 260/265
MINNESOTA
Headwaters of the mighty Mississippi
244

8/6/2019 2010 CAFR Minnesota
http://slidepdf.com/reader/full/2010-cafr-minnesota 261/265
Sources: U.S. Census Bureau
Bureau of Economic Analysis, U.S. Department of Commerce
Minnesota Department of Employment and Economic Development
Percent of
Total State
Employment
State of Minnesota 2.04%
Mayo Foundation 1.40%
United States Government 1.25%
Target Corporation 1.10%
Allina Health System 0.90%Fairview Health Services 0.81%
Wells Fargo and Company 0.78%
Wal-Mart Stores Inc. 0.77%
University of Minnesota 0.75%
3M Company 0.57%
Northwest Airlines Corp. -
TotalTotal State Employment
Sources: Minneapolis/St. Paul Business Journal Book of Lists published October 26, 2001, and March 6, 2009.
Minnesota Department of Employment and Economic Development
Unemployment
Rate
15,259
5.4%
273,615
--
3.1%
Employees
2
Schedule 10 - Demographic and Economic Statistics
Last Ten Calendar Years
Schedule 11 - Principal Employers
Current Year and Nine Years Ago
4.5%
4.9%
4.6%
4.2%
2004 188,329,945$
429,000
33,000
3.8%
37,000
4.1%
Rank
1
3
53,729
9
8
10
22,261
7
4
--
36.7
8
1.15%
2,639,716
19,718
0.83%21,507 23,818
15,000
-
2007
2008
41,739$
39,985$5,148,346
226,158,723$
10
9
4.6%
43,238$
6
36.9
37.2
2010
7
2,689,351271,158
0.69%
0.68%
20,230
1.18%
20,613 0.57%
18,606
18,270
5,079,344
5,106,560
5,191,206 216,677,659$
37,078$
Employer
5,266,214 41,859$
2005
2006
Age
32,597$
166,167,270$
178,146,661$
205,857,404$
193,989,644$
36.3
36.5
34,081$
35,292$ 36.1
35.9
Personal
Income
(Thousands)
35.4
35.733,348$
Per Capita
Personal
Income
Median
30,823
1
5
6
31,731 3
160,833,329$
220,437,583$
2001
4,933,958
5,047,862
170,998,033$
2
37,988$
5,230,567
Percent of
Total State
Employment
0.91%
2009
2.09%
Rank
34,806
Year
2000
2002 4,982,813 5,017,458
2003
Population
56,320
18,495 5
37.3
Employees
2001
8.0%
0.69%
1.29%
24,587
245

8/6/2019 2010 CAFR Minnesota
http://slidepdf.com/reader/full/2010-cafr-minnesota 262/265
2001 2002 2003 2004
Primary Government:
Public Safety and Corrections 5,792 5,750 5,807 5,705
Transportation 5,461 5,288 5,223 4,788
Agricultural, Environmental and Energy Resources(1)
4,806 4,645 4,539 4,400
Economic & Workforce Development(1)
2,696 2,654 2,669 4,257
General Education 943 911 880 857
Higher Education 13,714 13,704 14,094 14,006
Health and Human Services 9,155 9,039 9,118 7,415
General Government 5,404 5,498 5,470 5,761
Total 47,971 47,489 47,800 47,189
Sources: Minnesota Management & Budget
Minnesota State Colleges and Universities
Beginning in fiscal year 2007, the Department of Commerce financial activity
was moved from the Economic and Workforce Development function to the
Agricultural, Environmental and Energy Resources function.
Schedule 12
Full-Time Equivalent State Employees By Function
Last Ten Fiscal Years
246

8/6/2019 2010 CAFR Minnesota
http://slidepdf.com/reader/full/2010-cafr-minnesota 263/265
2005 2006 2007 2008 2009 2010
5,752 6,245 6,198 6,447 6,517 6,553
4,849 4,710 4,435 4,544 4,713 4,969
4,389 4,019 4,322 4,465 4,515 4,467
4,136 3,976 3,486 2,379 2,499 2,661
864 964 935 897 882 880
14,407 14,150 14,437 14,841 15,592 15,766
7,570 7,827 8,042 9,587 8,257 9,167
6,050 6,520 6,559 7,393 8,393 6,868
48,017 48,411 48,414 50,553 51,368 51,331
247

8/6/2019 2010 CAFR Minnesota
http://slidepdf.com/reader/full/2010-cafr-minnesota 264/265
2001 2002 2003 2004
Public Safety and CorrectionsIncarcerated Inmates 6,187 6,583 7,073 7,795 Offenders on Supervision 16,535 15,797 16,753 19,061
Correctional Facilities 10 10 10 10
Reassignment of Minnesota Certificates of Title 2,677,848 2,677,848 2,700,603 2,363,013
Crashes Investigated By State Patrol 24,083 22,827 22,939 18,789
TransportationMiles of Highways N/A 29,024 29,078 29,153
Trunk Highway Bridges N/A 2,855 2,784 2,831 Acres of Right-of-Way N/A 247,019 250,243 252,205
Agricultural, Environmental and Energy ResourcesRecreational Fishing Licenses Issued/License Year 1,521,753 1,513,303 1,513,018 1,490,110
Watercraft Licenses Issued/Calendar Year 826,173 834,974 845,379 854,110 Acres of State Land Managed by Forestry/Fiscal Year 3,857,000 3,856,000 3,853,000 3,853,000 Farms/Calendar Year 81,000 80,900 80,000 79,600
Acres of Farmland/Calendar Year (1,000 Acres) 27,800 27,800 27,600 27,400 Agricultural Production-Crops/Calendar Year 3,186,925$ 4,351,693$ 4,391,532$ 5,147,314$
(In Thousands)Agricultural Production-Livestock/Calendar Year 4,300,453$ 3,615,553$ 4,089,925$ 4,974,098$(In Thousands)
Economic and Workforce Development
Unemployment Claims Filed 252,655 319,647 323,262 299,630
Workplace Injuries Reported 56,681 50,470 44,983 43,871
General Education
Kindergarten Through Grade 12 Students(1)842,764 839,424 835,227 829,832
School Districts 343 343 343 343
Charter Schools 64 67 78 88Special Education Age 0-21 Childcount 112,833 113,930 115,802 117,666
Higher Education
Full Year Equivalents 118,861 126,215 132,586 135,819Number of Students Graduated 24,907 26,680 29,438 32,480
Buildings - Square Footage 23,815,342 24,310,545 24,509,182 25,263,803
Health and Human Services
Average Monthly Cash Recipients 170,546 179,905 184,848 182,645Average Monthly Health Care Enrollees 532,722 579,388 636,228 649,032
Health Care Providers 5,050 5,250 5,517 5,491
General Government
Individual Income Tax Payers/Calendar Year 2,442,043 2,415,039 2,416,197 2,415,563
Corporate Income Tax Returns/Calendar Year 44,220 50,498 37,522 51,803Sales Tax Permit Holders/Calendar Year 250,000 234,000 226,000 229,000
Note: N/A = Information not available.
(1)
(2)
(3) Estimate.
Source: Applicable State Agencies
Fiscal year 1997-2003 average daily membership is adjusted to current law which requires that eachstudent can be counted as no more than one.
Certificates of Titles prior to FY 2006 were based on the number of transactions. Beginning in FY
2006, Certificates of Titles were based on number of applications.
Schedule 13 - Operating and Capital Asset Indicators By Function
Last Ten Years
248

8/6/2019 2010 CAFR Minnesota
http://slidepdf.com/reader/full/2010-cafr-minnesota 265/265
2005 2006 2007 2008 2009 2010
7,978 8,874 8,900 9,270 9,217 9,619 18,106 19,977 18,979 20,132 20,974 20,559
10 10 10 10 10 10 (2)