平成30年1月の鉱工業(生産・出荷・在庫)指数の … ( 110.5 ) 3.0 ( 0.5 )...
TRANSCRIPT
平成30年1月の鉱工業(生産・出荷・在庫)指数の動向(速報) Indices of Industrial Production for January 2018 (Preliminary Report)
概 況
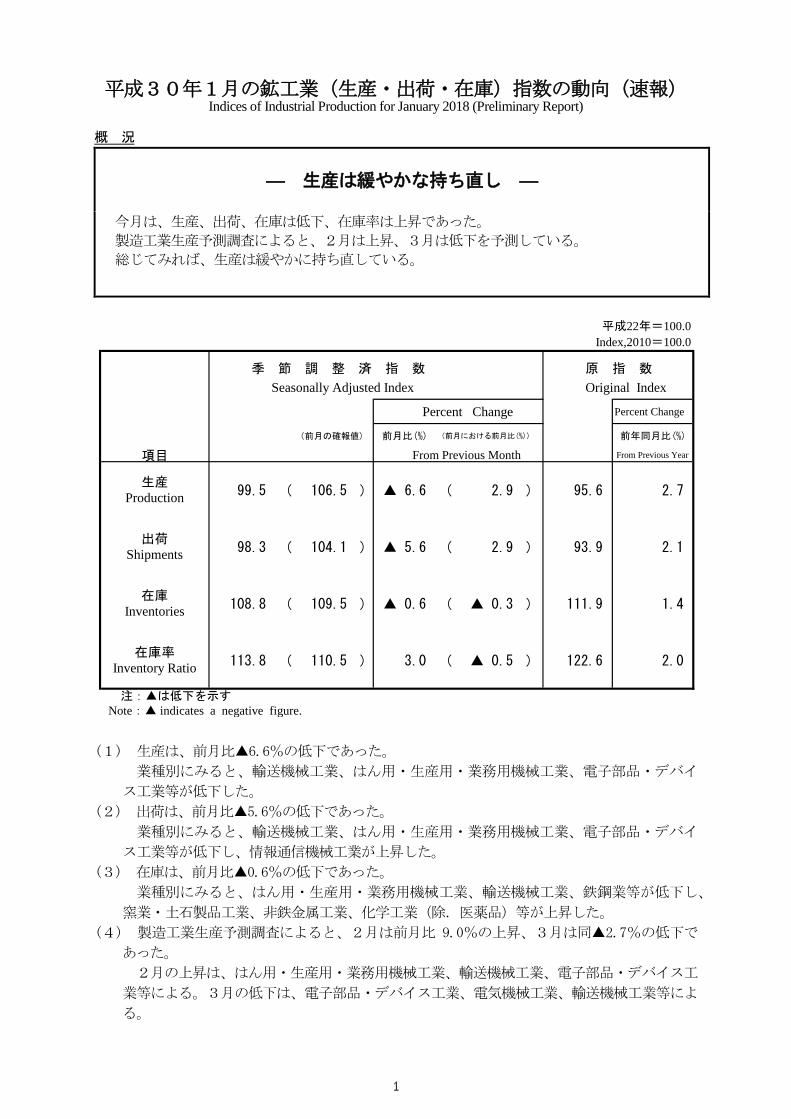
― 生産は緩やかな持ち直し ―
今月は、生産、出荷、在庫は低下、在庫率は上昇であった。
製造工業生産予測調査によると、2月は上昇、3月は低下を予測している。
総じてみれば、生産は緩やかに持ち直している。
(1) 生産は、前月比▲6.6%の低下であった。
業種別にみると、輸送機械工業、はん用・生産用・業務用機械工業、電子部品・デバイ
ス工業等が低下した。
(2) 出荷は、前月比▲5.6%の低下であった。
業種別にみると、輸送機械工業、はん用・生産用・業務用機械工業、電子部品・デバイ
ス工業等が低下し、情報通信機械工業が上昇した。
(3) 在庫は、前月比▲0.6%の低下であった。
業種別にみると、はん用・生産用・業務用機械工業、輸送機械工業、鉄鋼業等が低下し、
窯業・土石製品工業、非鉄金属工業、化学工業(除.医薬品)等が上昇した。
(4) 製造工業生産予測調査によると、2月は前月比 9.0%の上昇、3月は同▲2.7%の低下で
あった。
2月の上昇は、はん用・生産用・業務用機械工業、輸送機械工業、電子部品・デバイス工
業等による。3月の低下は、電子部品・デバイス工業、電気機械工業、輸送機械工業等によ
る。
季 節 調 整 済 指 数 原 指 数
Seasonally Adjusted Index Original Index
Percent Change Percent Change
(前月の確報値) 前月比(%) (前月における前月比(%)) 前年同月比(%)
項目 From Previous Month From Previous Year
生産Production 99.5 ( 106.5 ) ▲ 6.6 ( 2.9 ) 95.6 2.7
出荷Shipments 98.3 ( 104.1 ) ▲ 5.6 ( 2.9 ) 93.9 2.1
在庫Inventories 108.8 ( 109.5 ) ▲ 0.6 ( ▲ 0.3 ) 111.9 1.4
在庫率Inventory Ratio 113.8 ( 110.5 ) 3.0 ( ▲ 0.5 ) 122.6 2.0
注:▲は低下を示す Note:▲ indicates a negative figure.
平成22年=100.0Index,2010=100.0
1

《 生 産 》低下した業種
寄 与 し た 主 な 品 目
前 月 比 ▲ 14.1 %減
前 年 同 月 比 0.6 %増
前 月 比 ▲ 7.8 %減
前 年 同 月 比 7.9 %増
前 月 比 ▲ 6.3 %減
前 年 同 月 比 2.1 %増
前 月 比 ▲ 7.9 %減
前 年 同 月 比 1.7 %増
前 月 比 ▲ 11.3 %減
前 年 同 月 比 ▲ 3.4 %減
前 月 比 ▲ 9.8 %減
前 年 同 月 比 2.0 %増
前 月 比 ▲ 1.3 %減
前 年 同 月 比 9.3 %増
前 月 比 ▲ 1.8 %減
前 年 同 月 比 1.5 %増
前 月 比 ▲ 3.9 %減
前 年 同 月 比 0.0 %
前 月 比 ▲ 1.6 %減
前 年 同 月 比 2.4 %増
前 月 比 ▲ 2.0 %減
前 年 同 月 比 1.5 %増
前 月 比 ▲ 4.1 %減
前 年 同 月 比 ▲ 5.2 %減
前 月 比 ▲ 2.6 %減
前 年 同 月 比 ▲ 0.7 %減
前 月 比 ▲ 2.2 %減
前 年 同 月 比 0.7 %増
前 月 比 ▲ 1.1 %減
前 年 同 月 比 1.9 %増
電子部品・デバイス工業モス型半導体集積回路(メモリ)、モス型半導体集積回路(CCD)、固定コンデンサ等
業 種
輸送機械工業普通乗用車、駆動伝導・操縦装置部品、自動車用エンジン等
はん用・生産用・業務用機械工業ショベル系掘削機械、専用機、プレス用金型等
電気機械工業セパレート形エアコン、太陽電池モジュール、医用X線装置等
金属製品工業橋りょう、木造住宅用アルミニウムサッシ、ビル用アルミニウムサッシ等
非鉄金属工業通信用ケーブル光ファイバ製品、アルミニウムダイカスト、アルミニウム鋳物等
化学工業(除.医薬品)化粧水、ファンデーション、シャンプー等
その他工業工業用ゴム製品、ゴムホース、システムキッチン等
情報通信機械工業カーナビゲーションシステム、外部記憶装置、デスクトップ型パソコン等
プラスチック製品工業プラスチック製機械器具部品、強化プラスチック製品等
鉄鋼業銑鉄鋳物、鉄系鍛工品、特殊鋼熱間圧延鋼材等
石油・石炭製品工業軽油、ジェット燃料油等
パルプ・紙・紙加工品工業製紙パルプ、段ボールシート、印刷用紙(塗工)等
繊維工業炭素繊維等
窯業・土石製品工業ファインセラミックス(機能材)、複層ガラス、安全ガラス等
2

《 出 荷 》低下した業種
寄 与 し た 主 な 品 目
前 月 比 ▲ 10.2 %減
前 年 同 月 比 2.4 %増
前 月 比 ▲ 4.9 %減
前 年 同 月 比 10.1 %増
前 月 比 ▲ 7.5 %減
前 年 同 月 比 0.5 %増
前 月 比 ▲ 13.0 %減
前 年 同 月 比 0.3 %増
前 月 比 ▲ 8.8 %減
前 年 同 月 比 ▲ 2.3 %減
前 月 比 ▲ 5.0 %減
前 年 同 月 比 ▲ 2.2 %減
前 月 比 ▲ 4.2 %減
前 年 同 月 比 ▲ 0.9 %減
前 月 比 ▲ 4.5 %減
前 年 同 月 比 1.3 %増
前 月 比 ▲ 2.8 %減
前 年 同 月 比 3.0 %増
前 月 比 ▲ 6.6 %減
前 年 同 月 比 0.4 %増
前 月 比 ▲ 4.1 %減
前 年 同 月 比 2.6 %増
前 月 比 ▲ 3.2 %減
前 年 同 月 比 3.3 %増
前 月 比 ▲ 4.8 %減
前 年 同 月 比 ▲ 0.8 %減
前 月 比 ▲ 4.4 %減
前 年 同 月 比 ▲ 1.0 %減
上昇した業種
前 月 比 5.3 %増
前 年 同 月 比 ▲ 1.2 %減
電子部品・デバイス工業モス型半導体集積回路(CCD)、モス型半導体集積回路(メモリ)、 モス型半導体集積回路(マイコン)等
業 種
輸送機械工業普通乗用車、駆動伝導・操縦装置部品、自動車用エンジン等
はん用・生産用・業務用機械工業ショベル系掘削機械、一般用蒸気タービン、建設用クレーン等
非鉄金属工業電気金、アルミニウムダイカスト、通信用ケーブル光ファイバ製品等
金属製品工業橋りょう、木造住宅用アルミニウムサッシ、アルミニウムエクステリア等
石油・石炭製品工業軽油、B・C重油、ガソリン等
鉄鋼業特殊鋼熱間圧延鋼材、亜鉛めっき鋼板、普通鋼鋼板等
電気機械工業太陽電池モジュール、医用X線装置、低圧開閉スイッチ等
化学工業(除.医薬品)パラキシレン、キシレン、シャンプー等
窯業・土石製品工業安全ガラス、セメント、ファインセラミックス(機能材)等
その他工業工業用ゴム製品、乗用車用タイヤ、システムキッチン等
プラスチック製品工業プラスチック製機械器具部品、プラスチック製パイプ等
パルプ・紙・紙加工品工業段ボール原紙、印刷用紙(塗工)、段ボール箱等
繊維工業炭素繊維、靴下、合成繊維(短繊維)等
情報通信機械工業ノート型パソコン、携帯電話、固定通信装置等
3

《 在 庫 》低下した業種
寄 与 し た 主 な 品 目
前 月 比 ▲ 1.4 %減
前 年 同 月 比 ▲ 4.8 %減
前 月 比 ▲ 2.4 %減
前 年 同 月 比 8.8 %増
前 月 比 ▲ 1.4 %減
前 年 同 月 比 ▲ 6.6 %減
前 月 比 ▲ 2.8 %減
前 年 同 月 比 ▲ 4.6 %減
前 月 比 ▲ 2.1 %減
前 年 同 月 比 2.0 %増
前 月 比 ▲ 4.1 %減
前 年 同 月 比 22.6 %増
前 月 比 ▲ 1.0 %減
前 年 同 月 比 9.3 %増
前 月 比 ▲ 1.2 %減
前 年 同 月 比 7.3 %増
前 月 比 ▲ 0.4 %減
前 年 同 月 比 ▲ 7.0 %減
前 月 比 ▲ 0.1 %減
前 年 同 月 比 4.9 %増
上昇した業種
前 月 比 1.8 %増
前 年 同 月 比 5.6 %増
前 月 比 2.5 %増
前 年 同 月 比 ▲ 2.4 %減
前 月 比 0.3 %増
前 年 同 月 比 5.7 %増
前 月 比 0.8 %増
前 年 同 月 比 ▲ 4.1 %減
前 月 比 0.4 %増
前 年 同 月 比 2.2 %増
鉄鋼業フェロニッケル、フェロマンガン(高炭素、低炭素)、普通鋼熱間鋼管等
業 種
はん用・生産用・業務用機械工業デジタル・フルカラー複写機、カメラ用交換レンズ、機械プレス等
輸送機械工業普通トラック、普通乗用車、軽乗用車等
その他工業特殊車両用タイヤ等
金属製品工業飲料用アルミニウム缶、ガス湯沸器、ガス風呂がま等
情報通信機械工業携帯電話、カーナビゲーションシステム、薄型テレビ等
電気機械工業セパレート形エアコン、電気冷蔵庫、太陽電池モジュール等
電子部品・デバイス工業アクティブ型液晶素子(大型)、モス型半導体集積回路(ロジック)、太陽電池セル等
石油・石炭製品工業ジェット燃料油、灯油、ガソリン等
プラスチック製品工業プラスチック製フィルム・シート等
窯業・土石製品工業無アルカリガラス基板、セメント、ガラス長繊維製品等
非鉄金属工業電気金、伸銅製品等
化学工業(除.医薬品)ポリエチレン、フェノール、モイスチャークリーム等
繊維工業炭素繊維、合成繊維(短繊維)、靴下等
パルプ・紙・紙加工品工業段ボール原紙、製紙パルプ等
4
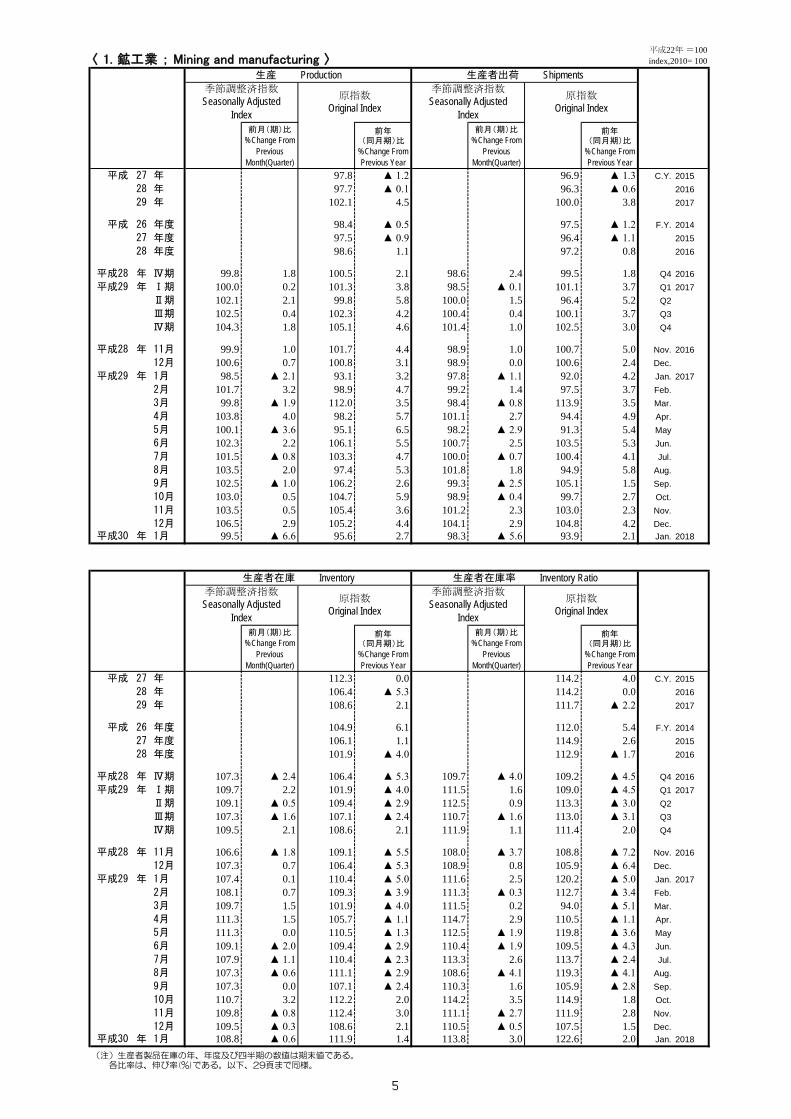
〈 1. 鉱工業 ; Mining and manufacturing 〉
前月(期)比%Change From
PreviousMonth(Quarter)
前年(同月期)比
%Change FromPrevious Year
前月(期)比%Change From
PreviousMonth(Quarter)
前年(同月期)比
%Change FromPrevious Year
平成 27 年 97.8 ▲ 1.2 96.9 ▲ 1.3 C.Y. 201528 年 97.7 ▲ 0.1 96.3 ▲ 0.6 201629 年 102.1 4.5 100.0 3.8 2017
平成 26 年度 98.4 ▲ 0.5 97.5 ▲ 1.2 F.Y. 201427 年度 97.5 ▲ 0.9 96.4 ▲ 1.1 201528 年度 98.6 1.1 97.2 0.8 2016
平成28 年 Ⅳ期 99.8 1.8 100.5 2.1 98.6 2.4 99.5 1.8 Q4 2016平成29 年 Ⅰ期 100.0 0.2 101.3 3.8 98.5 ▲ 0.1 101.1 3.7 Q1 2017
Ⅱ期 102.1 2.1 99.8 5.8 100.0 1.5 96.4 5.2 Q2Ⅲ期 102.5 0.4 102.3 4.2 100.4 0.4 100.1 3.7 Q3Ⅳ期 104.3 1.8 105.1 4.6 101.4 1.0 102.5 3.0 Q4
平成28 年 11月 99.9 1.0 101.7 4.4 98.9 1.0 100.7 5.0 Nov. 201612月 100.6 0.7 100.8 3.1 98.9 0.0 100.6 2.4 Dec.
平成29 年 1月 98.5 ▲ 2.1 93.1 3.2 97.8 ▲ 1.1 92.0 4.2 Jan. 20172月 101.7 3.2 98.9 4.7 99.2 1.4 97.5 3.7 Feb.3月 99.8 ▲ 1.9 112.0 3.5 98.4 ▲ 0.8 113.9 3.5 Mar.4月 103.8 4.0 98.2 5.7 101.1 2.7 94.4 4.9 Apr.5月 100.1 ▲ 3.6 95.1 6.5 98.2 ▲ 2.9 91.3 5.4 May6月 102.3 2.2 106.1 5.5 100.7 2.5 103.5 5.3 Jun.7月 101.5 ▲ 0.8 103.3 4.7 100.0 ▲ 0.7 100.4 4.1 Jul.8月 103.5 2.0 97.4 5.3 101.8 1.8 94.9 5.8 Aug.9月 102.5 ▲ 1.0 106.2 2.6 99.3 ▲ 2.5 105.1 1.5 Sep.10月 103.0 0.5 104.7 5.9 98.9 ▲ 0.4 99.7 2.7 Oct.11月 103.5 0.5 105.4 3.6 101.2 2.3 103.0 2.3 Nov.12月 106.5 2.9 105.2 4.4 104.1 2.9 104.8 4.2 Dec.
平成30 年 1月 99.5 ▲ 6.6 95.6 2.7 98.3 ▲ 5.6 93.9 2.1 Jan. 2018
前月(期)比%Change From
PreviousMonth(Quarter)
前年(同月期)比
%Change FromPrevious Year
前月(期)比%Change From
PreviousMonth(Quarter)
前年(同月期)比
%Change FromPrevious Year
平成 27 年 112.3 0.0 114.2 4.0 C.Y. 201528 年 106.4 ▲ 5.3 114.2 0.0 201629 年 108.6 2.1 111.7 ▲ 2.2 2017
平成 26 年度 104.9 6.1 112.0 5.4 F.Y. 201427 年度 106.1 1.1 114.9 2.6 201528 年度 101.9 ▲ 4.0 112.9 ▲ 1.7 2016
平成28 年 Ⅳ期 107.3 ▲ 2.4 106.4 ▲ 5.3 109.7 ▲ 4.0 109.2 ▲ 4.5 Q4 2016平成29 年 Ⅰ期 109.7 2.2 101.9 ▲ 4.0 111.5 1.6 109.0 ▲ 4.5 Q1 2017
Ⅱ期 109.1 ▲ 0.5 109.4 ▲ 2.9 112.5 0.9 113.3 ▲ 3.0 Q2Ⅲ期 107.3 ▲ 1.6 107.1 ▲ 2.4 110.7 ▲ 1.6 113.0 ▲ 3.1 Q3Ⅳ期 109.5 2.1 108.6 2.1 111.9 1.1 111.4 2.0 Q4
平成28 年 11月 106.6 ▲ 1.8 109.1 ▲ 5.5 108.0 ▲ 3.7 108.8 ▲ 7.2 Nov. 201612月 107.3 0.7 106.4 ▲ 5.3 108.9 0.8 105.9 ▲ 6.4 Dec.
平成29 年 1月 107.4 0.1 110.4 ▲ 5.0 111.6 2.5 120.2 ▲ 5.0 Jan. 20172月 108.1 0.7 109.3 ▲ 3.9 111.3 ▲ 0.3 112.7 ▲ 3.4 Feb.3月 109.7 1.5 101.9 ▲ 4.0 111.5 0.2 94.0 ▲ 5.1 Mar.4月 111.3 1.5 105.7 ▲ 1.1 114.7 2.9 110.5 ▲ 1.1 Apr.5月 111.3 0.0 110.5 ▲ 1.3 112.5 ▲ 1.9 119.8 ▲ 3.6 May6月 109.1 ▲ 2.0 109.4 ▲ 2.9 110.4 ▲ 1.9 109.5 ▲ 4.3 Jun.7月 107.9 ▲ 1.1 110.4 ▲ 2.3 113.3 2.6 113.7 ▲ 2.4 Jul.8月 107.3 ▲ 0.6 111.1 ▲ 2.9 108.6 ▲ 4.1 119.3 ▲ 4.1 Aug.9月 107.3 0.0 107.1 ▲ 2.4 110.3 1.6 105.9 ▲ 2.8 Sep.10月 110.7 3.2 112.2 2.0 114.2 3.5 114.9 1.8 Oct.11月 109.8 ▲ 0.8 112.4 3.0 111.1 ▲ 2.7 111.9 2.8 Nov.12月 109.5 ▲ 0.3 108.6 2.1 110.5 ▲ 0.5 107.5 1.5 Dec.
平成30 年 1月 108.8 ▲ 0.6 111.9 1.4 113.8 3.0 122.6 2.0 Jan. 2018
原指数Original Index
(注)生産者製品在庫の年、年度及び四半期の数値は期末値である。 各比率は、伸び率(%)である。以下、29頁まで同様。
生産者在庫率 Inventory Ratio季節調整済指数Seasonally Adjusted
Index
原指数Original Index
季節調整済指数Seasonally Adjusted
Index
原指数Original Index
平成22年 =100index,2010= 100
生産 Production 生産者出荷 Shipments季節調整済指数Seasonally Adjusted
Index
原指数Original Index
季節調整済指数Seasonally Adjusted
Index
生産者在庫 Inventory
5

〈 2. 鉄鋼業 ; Iron and steel 〉
前月(期)比%Change From
PreviousMonth(Quarter)
前年(同月期)比
%Change FromPrevious Year
前月(期)比%Change From
PreviousMonth(Quarter)
前年(同月期)比
%Change FromPrevious Year
平成 27 年 93.3 ▲ 5.7 94.6 ▲ 6.2 C.Y. 201528 年 92.4 ▲ 1.0 94.1 ▲ 0.5 201629 年 94.4 2.2 95.9 1.9 2017
平成 26 年度 97.9 ▲ 1.1 99.7 ▲ 0.5 F.Y. 201427 年度 92.4 ▲ 5.6 93.5 ▲ 6.2 201528 年度 93.0 0.6 94.9 1.5 2016
平成28 年 Ⅳ期 94.0 1.5 94.1 1.5 96.9 3.0 97.3 3.5 Q4 2016平成29 年 Ⅰ期 94.0 0.0 94.3 2.4 95.7 ▲ 1.2 97.3 3.4 Q1 2017
Ⅱ期 94.5 0.5 94.0 3.3 96.0 0.3 94.4 3.6 Q2Ⅲ期 93.8 ▲ 0.7 93.6 1.2 95.2 ▲ 0.8 94.8 1.1 Q3Ⅳ期 95.3 1.6 95.6 1.6 96.8 1.7 97.3 0.0 Q4
平成28 年 11月 93.6 0.3 93.6 1.5 97.1 ▲ 1.3 98.1 7.1 Nov. 201612月 95.0 1.5 93.3 3.0 95.1 ▲ 2.1 94.5 2.3 Dec.
平成29 年 1月 93.1 ▲ 2.0 93.4 2.1 95.7 0.6 93.6 5.9 Jan. 20172月 95.2 2.3 90.6 1.9 95.5 ▲ 0.2 92.4 1.1 Feb.3月 93.7 ▲ 1.6 98.9 3.2 95.8 0.3 105.8 3.1 Mar.4月 96.7 3.2 94.4 5.7 97.3 1.6 92.2 5.3 Apr.5月 93.6 ▲ 3.2 94.1 2.8 93.8 ▲ 3.6 93.6 1.2 May6月 93.3 ▲ 0.3 93.5 1.3 96.9 3.3 97.3 4.4 Jun.7月 91.8 ▲ 1.6 92.9 ▲ 0.6 93.5 ▲ 3.5 94.7 ▲ 2.8 Jul.8月 94.5 2.9 92.2 1.4 96.6 3.3 90.6 3.1 Aug.9月 95.0 0.5 95.6 2.8 95.4 ▲ 1.2 99.0 3.0 Sep.10月 94.6 ▲ 0.4 97.4 2.0 91.1 ▲ 4.5 92.6 ▲ 6.7 Oct.11月 95.5 1.0 95.5 2.0 100.9 10.8 101.9 3.9 Nov.12月 95.9 0.4 94.0 0.8 98.3 ▲ 2.6 97.5 3.2 Dec.
平成30 年 1月 94.0 ▲ 2.0 94.8 1.5 94.2 ▲ 4.2 92.8 ▲ 0.9 Jan. 2018
前月(期)比%Change From
PreviousMonth(Quarter)
前年(同月期)比
%Change FromPrevious Year
前月(期)比%Change From
PreviousMonth(Quarter)
前年(同月期)比
%Change FromPrevious Year
平成 27 年 115.6 ▲ 3.3 116.1 2.3 C.Y. 201528 年 119.9 3.7 126.5 9.0 201629 年 112.3 ▲ 6.3 121.0 ▲ 4.3 2017
平成 26 年度 110.4 ▲ 2.4 114.1 ▲ 4.4 F.Y. 201427 年度 114.8 4.0 119.0 4.3 201528 年度 109.9 ▲ 4.3 125.4 5.4 2016
平成28 年 Ⅳ期 118.5 0.1 119.9 3.7 123.9 ▲ 1.7 124.9 6.9 Q4 2016平成29 年 Ⅰ期 114.2 ▲ 3.6 109.9 ▲ 4.3 121.8 ▲ 1.7 120.5 ▲ 3.8 Q1 2017
Ⅱ期 118.5 3.8 117.1 ▲ 3.6 126.0 3.4 124.3 ▲ 3.0 Q2Ⅲ期 108.1 ▲ 8.8 109.0 ▲ 8.7 118.8 ▲ 5.7 120.4 ▲ 5.9 Q3Ⅳ期 111.0 2.7 112.3 ▲ 6.3 117.9 ▲ 0.8 118.9 ▲ 4.8 Q4
平成28 年 11月 118.0 0.0 119.8 3.6 124.2 0.9 126.1 5.8 Nov. 201612月 118.5 0.4 119.9 3.7 124.4 0.2 123.2 2.4 Dec.
平成29 年 1月 117.2 ▲ 1.1 121.3 ▲ 0.6 120.1 ▲ 3.5 124.3 ▲ 4.3 Jan. 20172月 119.3 1.8 118.6 ▲ 0.8 127.3 6.0 130.9 1.6 Feb.3月 114.2 ▲ 4.3 109.9 ▲ 4.3 118.0 ▲ 7.3 106.2 ▲ 9.1 Mar.4月 121.2 6.1 114.6 1.6 129.2 9.5 125.0 1.5 Apr.5月 124.0 2.3 122.0 2.5 129.6 0.3 129.4 ▲ 1.6 May6月 118.5 ▲ 4.4 117.1 ▲ 3.6 119.1 ▲ 8.1 118.6 ▲ 8.7 Jun.7月 116.9 ▲ 1.4 115.1 ▲ 2.5 125.9 5.7 122.0 1.1 Jul.8月 111.3 ▲ 4.8 116.0 ▲ 4.8 116.6 ▲ 7.4 125.7 ▲ 6.1 Aug.9月 108.1 ▲ 2.9 109.0 ▲ 8.7 113.8 ▲ 2.4 113.6 ▲ 12.0 Sep.10月 114.2 5.6 117.1 ▲ 3.2 124.6 9.5 127.0 1.2 Oct.11月 110.3 ▲ 3.4 112.0 ▲ 6.5 110.6 ▲ 11.2 112.3 ▲ 10.9 Nov.12月 111.0 0.6 112.3 ▲ 6.3 118.4 7.1 117.3 ▲ 4.8 Dec.
平成30 年 1月 109.5 ▲ 1.4 113.3 ▲ 6.6 114.5 ▲ 3.3 118.5 ▲ 4.7 Jan. 2018
生産者在庫 Inventory 生産者在庫率 Inventory Ratio季節調整済指数Seasonally Adjusted
Index
原指数Original Index
季節調整済指数Seasonally Adjusted
Index
原指数Original Index
平成22年 =100index,2010= 100
生産 Production 生産者出荷 Shipments季節調整済指数Seasonally Adjusted
Index
原指数Original Index
季節調整済指数Seasonally Adjusted
Index
原指数Original Index
6
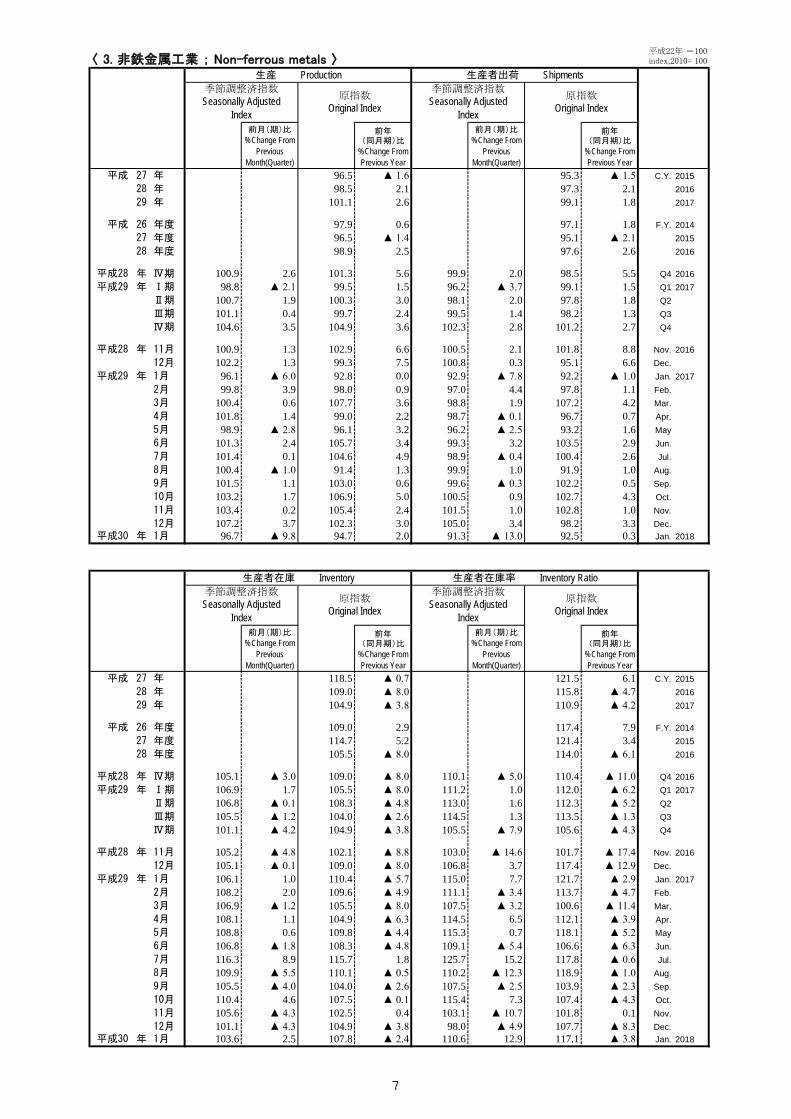
〈 3. 非鉄金属工業 ; Non-ferrous metals 〉
前月(期)比%Change From
PreviousMonth(Quarter)
前年(同月期)比
%Change FromPrevious Year
前月(期)比%Change From
PreviousMonth(Quarter)
前年(同月期)比
%Change FromPrevious Year
平成 27 年 96.5 ▲ 1.6 95.3 ▲ 1.5 C.Y. 201528 年 98.5 2.1 97.3 2.1 201629 年 101.1 2.6 99.1 1.8 2017
平成 26 年度 97.9 0.6 97.1 1.8 F.Y. 201427 年度 96.5 ▲ 1.4 95.1 ▲ 2.1 201528 年度 98.9 2.5 97.6 2.6 2016
平成28 年 Ⅳ期 100.9 2.6 101.3 5.6 99.9 2.0 98.5 5.5 Q4 2016平成29 年 Ⅰ期 98.8 ▲ 2.1 99.5 1.5 96.2 ▲ 3.7 99.1 1.5 Q1 2017
Ⅱ期 100.7 1.9 100.3 3.0 98.1 2.0 97.8 1.8 Q2Ⅲ期 101.1 0.4 99.7 2.4 99.5 1.4 98.2 1.3 Q3Ⅳ期 104.6 3.5 104.9 3.6 102.3 2.8 101.2 2.7 Q4
平成28 年 11月 100.9 1.3 102.9 6.6 100.5 2.1 101.8 8.8 Nov. 201612月 102.2 1.3 99.3 7.5 100.8 0.3 95.1 6.6 Dec.
平成29 年 1月 96.1 ▲ 6.0 92.8 0.0 92.9 ▲ 7.8 92.2 ▲ 1.0 Jan. 20172月 99.8 3.9 98.0 0.9 97.0 4.4 97.8 1.1 Feb.3月 100.4 0.6 107.7 3.6 98.8 1.9 107.2 4.2 Mar.4月 101.8 1.4 99.0 2.2 98.7 ▲ 0.1 96.7 0.7 Apr.5月 98.9 ▲ 2.8 96.1 3.2 96.2 ▲ 2.5 93.2 1.6 May6月 101.3 2.4 105.7 3.4 99.3 3.2 103.5 2.9 Jun.7月 101.4 0.1 104.6 4.9 98.9 ▲ 0.4 100.4 2.6 Jul.8月 100.4 ▲ 1.0 91.4 1.3 99.9 1.0 91.9 1.0 Aug.9月 101.5 1.1 103.0 0.6 99.6 ▲ 0.3 102.2 0.5 Sep.10月 103.2 1.7 106.9 5.0 100.5 0.9 102.7 4.3 Oct.11月 103.4 0.2 105.4 2.4 101.5 1.0 102.8 1.0 Nov.12月 107.2 3.7 102.3 3.0 105.0 3.4 98.2 3.3 Dec.
平成30 年 1月 96.7 ▲ 9.8 94.7 2.0 91.3 ▲ 13.0 92.5 0.3 Jan. 2018
前月(期)比%Change From
PreviousMonth(Quarter)
前年(同月期)比
%Change FromPrevious Year
前月(期)比%Change From
PreviousMonth(Quarter)
前年(同月期)比
%Change FromPrevious Year
平成 27 年 118.5 ▲ 0.7 121.5 6.1 C.Y. 201528 年 109.0 ▲ 8.0 115.8 ▲ 4.7 201629 年 104.9 ▲ 3.8 110.9 ▲ 4.2 2017
平成 26 年度 109.0 2.9 117.4 7.9 F.Y. 201427 年度 114.7 5.2 121.4 3.4 201528 年度 105.5 ▲ 8.0 114.0 ▲ 6.1 2016
平成28 年 Ⅳ期 105.1 ▲ 3.0 109.0 ▲ 8.0 110.1 ▲ 5.0 110.4 ▲ 11.0 Q4 2016平成29 年 Ⅰ期 106.9 1.7 105.5 ▲ 8.0 111.2 1.0 112.0 ▲ 6.2 Q1 2017
Ⅱ期 106.8 ▲ 0.1 108.3 ▲ 4.8 113.0 1.6 112.3 ▲ 5.2 Q2Ⅲ期 105.5 ▲ 1.2 104.0 ▲ 2.6 114.5 1.3 113.5 ▲ 1.3 Q3Ⅳ期 101.1 ▲ 4.2 104.9 ▲ 3.8 105.5 ▲ 7.9 105.6 ▲ 4.3 Q4
平成28 年 11月 105.2 ▲ 4.8 102.1 ▲ 8.8 103.0 ▲ 14.6 101.7 ▲ 17.4 Nov. 201612月 105.1 ▲ 0.1 109.0 ▲ 8.0 106.8 3.7 117.4 ▲ 12.9 Dec.
平成29 年 1月 106.1 1.0 110.4 ▲ 5.7 115.0 7.7 121.7 ▲ 2.9 Jan. 20172月 108.2 2.0 109.6 ▲ 4.9 111.1 ▲ 3.4 113.7 ▲ 4.7 Feb.3月 106.9 ▲ 1.2 105.5 ▲ 8.0 107.5 ▲ 3.2 100.6 ▲ 11.4 Mar.4月 108.1 1.1 104.9 ▲ 6.3 114.5 6.5 112.1 ▲ 3.9 Apr.5月 108.8 0.6 109.8 ▲ 4.4 115.3 0.7 118.1 ▲ 5.2 May6月 106.8 ▲ 1.8 108.3 ▲ 4.8 109.1 ▲ 5.4 106.6 ▲ 6.3 Jun.7月 116.3 8.9 115.7 1.8 125.7 15.2 117.8 ▲ 0.6 Jul.8月 109.9 ▲ 5.5 110.1 ▲ 0.5 110.2 ▲ 12.3 118.9 ▲ 1.0 Aug.9月 105.5 ▲ 4.0 104.0 ▲ 2.6 107.5 ▲ 2.5 103.9 ▲ 2.3 Sep.10月 110.4 4.6 107.5 ▲ 0.1 115.4 7.3 107.4 ▲ 4.3 Oct.11月 105.6 ▲ 4.3 102.5 0.4 103.1 ▲ 10.7 101.8 0.1 Nov.12月 101.1 ▲ 4.3 104.9 ▲ 3.8 98.0 ▲ 4.9 107.7 ▲ 8.3 Dec.
平成30 年 1月 103.6 2.5 107.8 ▲ 2.4 110.6 12.9 117.1 ▲ 3.8 Jan. 2018
生産者在庫 Inventory 生産者在庫率 Inventory Ratio季節調整済指数Seasonally Adjusted
Index
原指数Original Index
季節調整済指数Seasonally Adjusted
Index
原指数Original Index
平成22年 =100index,2010= 100
生産 Production 生産者出荷 Shipments季節調整済指数Seasonally Adjusted
Index
原指数Original Index
季節調整済指数Seasonally Adjusted
Index
原指数Original Index
7

〈 4. 金属製品工業 ; Fabricated metals 〉
前月(期)比%Change From
PreviousMonth(Quarter)
前年(同月期)比
%Change FromPrevious Year
前月(期)比%Change From
PreviousMonth(Quarter)
前年(同月期)比
%Change FromPrevious Year
平成 27 年 95.0 ▲ 2.8 95.4 ▲ 2.7 C.Y. 201528 年 92.8 ▲ 2.3 93.1 ▲ 2.4 201629 年 93.6 0.9 94.4 1.4 2017
平成 26 年度 96.3 ▲ 3.8 96.3 ▲ 4.6 F.Y. 201427 年度 95.7 ▲ 0.6 95.9 ▲ 0.4 201528 年度 92.4 ▲ 3.4 92.9 ▲ 3.1 2016
平成28 年 Ⅳ期 92.4 2.2 94.6 ▲ 3.4 93.3 2.2 98.1 ▲ 1.7 Q4 2016平成29 年 Ⅰ期 94.2 1.9 95.2 ▲ 1.7 94.5 1.3 94.9 ▲ 0.9 Q1 2017
Ⅱ期 92.9 ▲ 1.4 90.4 0.7 93.6 ▲ 1.0 89.3 1.4 Q2Ⅲ期 93.4 0.5 92.3 2.7 94.0 0.4 92.7 2.4 Q3Ⅳ期 94.2 0.9 96.5 2.0 95.5 1.6 100.5 2.4 Q4
平成28 年 11月 92.7 1.6 97.8 0.3 95.0 3.5 102.3 3.5 Nov. 201612月 93.4 0.8 91.2 ▲ 2.5 93.2 ▲ 1.9 96.3 ▲ 1.3 Dec.
平成29 年 1月 93.5 0.1 88.2 ▲ 0.6 94.8 1.7 88.1 0.7 Jan. 20172月 95.6 2.2 91.3 2.2 95.4 0.6 90.1 2.0 Feb.3月 93.5 ▲ 2.2 106.0 ▲ 5.7 93.3 ▲ 2.2 106.6 ▲ 4.5 Mar.4月 94.8 1.4 89.2 ▲ 0.1 94.8 1.6 87.9 ▲ 0.5 Apr.5月 88.8 ▲ 6.3 84.3 1.0 90.2 ▲ 4.9 84.2 2.7 May6月 95.2 7.2 97.7 1.2 95.8 6.2 95.9 1.9 Jun.7月 95.6 0.4 95.2 4.2 95.6 ▲ 0.2 94.4 4.1 Jul.8月 95.4 ▲ 0.2 88.7 4.0 95.9 0.3 88.6 3.5 Aug.9月 89.1 ▲ 6.6 93.0 0.0 90.5 ▲ 5.6 95.0 ▲ 0.3 Sep.10月 91.3 2.5 97.0 2.4 92.9 2.7 98.8 3.2 Oct.11月 91.8 0.5 96.9 ▲ 0.9 94.1 1.3 101.4 ▲ 0.9 Nov.12月 99.6 8.5 95.6 4.8 99.6 5.8 101.4 5.3 Dec.
平成30 年 1月 88.3 ▲ 11.3 85.2 ▲ 3.4 90.8 ▲ 8.8 86.1 ▲ 2.3 Jan. 2018
前月(期)比%Change From
PreviousMonth(Quarter)
前年(同月期)比
%Change FromPrevious Year
前月(期)比%Change From
PreviousMonth(Quarter)
前年(同月期)比
%Change FromPrevious Year
平成 27 年 111.9 ▲ 2.9 127.4 0.0 C.Y. 201528 年 109.6 ▲ 2.1 131.6 3.3 201629 年 112.3 2.5 131.9 0.2 2017
平成 26 年度 113.7 2.8 131.4 7.4 F.Y. 201427 年度 112.9 ▲ 0.7 127.3 ▲ 3.1 201528 年度 112.2 ▲ 0.6 131.2 3.1 2016
平成28 年 Ⅳ期 118.7 ▲ 0.4 109.6 ▲ 2.1 132.0 0.0 124.9 2.4 Q4 2016平成29 年 Ⅰ期 119.9 1.0 112.2 ▲ 0.6 129.3 ▲ 2.0 130.0 ▲ 1.1 Q1 2017
Ⅱ期 121.6 1.4 125.6 ▲ 0.1 130.8 1.2 132.4 ▲ 0.7 Q2Ⅲ期 124.1 2.1 131.2 4.1 134.6 2.9 139.2 1.9 Q3Ⅳ期 121.6 ▲ 2.0 112.3 2.5 133.0 ▲ 1.2 125.7 0.6 Q4
平成28 年 11月 117.7 ▲ 0.9 118.9 ▲ 0.9 128.4 ▲ 5.8 122.2 ▲ 1.3 Nov. 201612月 118.7 0.8 109.6 ▲ 2.1 131.4 2.3 119.2 ▲ 0.1 Dec.
平成29 年 1月 116.7 ▲ 1.7 109.9 ▲ 3.8 126.2 ▲ 4.0 139.0 ▲ 5.4 Jan. 20172月 119.2 2.1 113.1 ▲ 1.6 132.5 5.0 135.5 1.7 Feb.3月 119.9 0.6 112.2 ▲ 0.6 129.3 ▲ 2.4 115.6 1.1 Mar.4月 122.0 1.8 116.5 0.8 133.2 3.0 128.7 0.7 Apr.5月 121.2 ▲ 0.7 120.0 0.3 128.9 ▲ 3.2 136.0 ▲ 2.6 May6月 121.6 0.3 125.6 ▲ 0.1 130.4 1.2 132.6 ▲ 0.1 Jun.7月 122.2 0.5 129.9 0.9 139.0 6.6 137.4 0.8 Jul.8月 123.2 0.8 132.5 2.6 131.3 ▲ 5.5 146.7 2.1 Aug.9月 124.1 0.7 131.2 4.1 133.4 1.6 133.5 2.9 Sep.10月 122.1 ▲ 1.6 129.8 2.8 134.8 1.0 131.8 ▲ 1.1 Oct.11月 121.0 ▲ 0.9 122.2 2.8 130.8 ▲ 3.0 124.5 1.9 Nov.12月 121.6 0.5 112.3 2.5 133.3 1.9 120.9 1.4 Dec.
平成30 年 1月 119.0 ▲ 2.1 112.1 2.0 131.3 ▲ 1.5 144.6 4.0 Jan. 2018
生産者在庫 Inventory 生産者在庫率 Inventory Ratio季節調整済指数Seasonally Adjusted
Index
原指数Original Index
季節調整済指数Seasonally Adjusted
Index
原指数Original Index
平成22年 =100index,2010= 100
生産 Production 生産者出荷 Shipments季節調整済指数Seasonally Adjusted
Index
原指数Original Index
季節調整済指数Seasonally Adjusted
Index
原指数Original Index
8
前月(期)比%Change From
PreviousMonth(Quarter)
前年(同月期)比
%Change FromPrevious Year
前月(期)比%Change From
PreviousMonth(Quarter)
前年(同月期)比
%Change FromPrevious Year
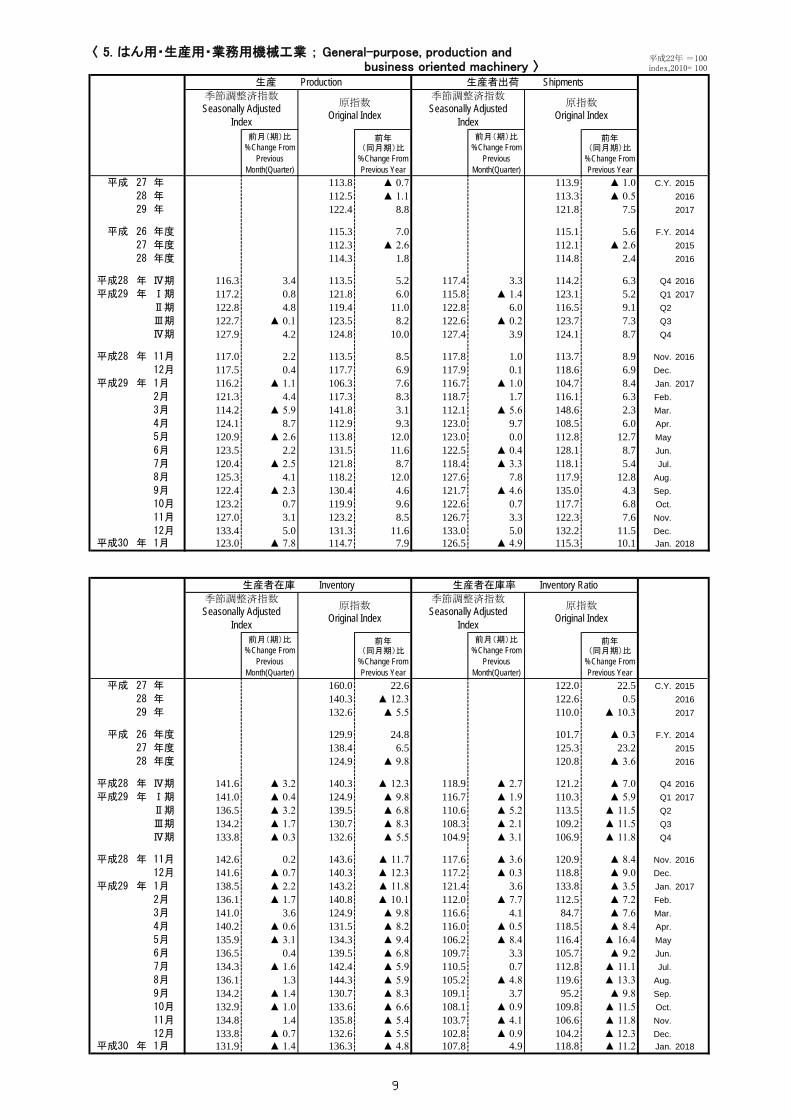
平成 27 年 113.8 ▲ 0.7 113.9 ▲ 1.0 C.Y. 201528 年 112.5 ▲ 1.1 113.3 ▲ 0.5 201629 年 122.4 8.8 121.8 7.5 2017
平成 26 年度 115.3 7.0 115.1 5.6 F.Y. 201427 年度 112.3 ▲ 2.6 112.1 ▲ 2.6 201528 年度 114.3 1.8 114.8 2.4 2016
平成28 年 Ⅳ期 116.3 3.4 113.5 5.2 117.4 3.3 114.2 6.3 Q4 2016平成29 年 Ⅰ期 117.2 0.8 121.8 6.0 115.8 ▲ 1.4 123.1 5.2 Q1 2017
Ⅱ期 122.8 4.8 119.4 11.0 122.8 6.0 116.5 9.1 Q2Ⅲ期 122.7 ▲ 0.1 123.5 8.2 122.6 ▲ 0.2 123.7 7.3 Q3Ⅳ期 127.9 4.2 124.8 10.0 127.4 3.9 124.1 8.7 Q4
平成28 年 11月 117.0 2.2 113.5 8.5 117.8 1.0 113.7 8.9 Nov. 201612月 117.5 0.4 117.7 6.9 117.9 0.1 118.6 6.9 Dec.
平成29 年 1月 116.2 ▲ 1.1 106.3 7.6 116.7 ▲ 1.0 104.7 8.4 Jan. 20172月 121.3 4.4 117.3 8.3 118.7 1.7 116.1 6.3 Feb.3月 114.2 ▲ 5.9 141.8 3.1 112.1 ▲ 5.6 148.6 2.3 Mar.4月 124.1 8.7 112.9 9.3 123.0 9.7 108.5 6.0 Apr.5月 120.9 ▲ 2.6 113.8 12.0 123.0 0.0 112.8 12.7 May6月 123.5 2.2 131.5 11.6 122.5 ▲ 0.4 128.1 8.7 Jun.7月 120.4 ▲ 2.5 121.8 8.7 118.4 ▲ 3.3 118.1 5.4 Jul.8月 125.3 4.1 118.2 12.0 127.6 7.8 117.9 12.8 Aug.9月 122.4 ▲ 2.3 130.4 4.6 121.7 ▲ 4.6 135.0 4.3 Sep.10月 123.2 0.7 119.9 9.6 122.6 0.7 117.7 6.8 Oct.11月 127.0 3.1 123.2 8.5 126.7 3.3 122.3 7.6 Nov.12月 133.4 5.0 131.3 11.6 133.0 5.0 132.2 11.5 Dec.
平成30 年 1月 123.0 ▲ 7.8 114.7 7.9 126.5 ▲ 4.9 115.3 10.1 Jan. 2018
前月(期)比%Change From
PreviousMonth(Quarter)
前年(同月期)比
%Change FromPrevious Year
前月(期)比%Change From
PreviousMonth(Quarter)
前年(同月期)比
%Change FromPrevious Year
平成 27 年 160.0 22.6 122.0 22.5 C.Y. 201528 年 140.3 ▲ 12.3 122.6 0.5 201629 年 132.6 ▲ 5.5 110.0 ▲ 10.3 2017
平成 26 年度 129.9 24.8 101.7 ▲ 0.3 F.Y. 201427 年度 138.4 6.5 125.3 23.2 201528 年度 124.9 ▲ 9.8 120.8 ▲ 3.6 2016
平成28 年 Ⅳ期 141.6 ▲ 3.2 140.3 ▲ 12.3 118.9 ▲ 2.7 121.2 ▲ 7.0 Q4 2016平成29 年 Ⅰ期 141.0 ▲ 0.4 124.9 ▲ 9.8 116.7 ▲ 1.9 110.3 ▲ 5.9 Q1 2017
Ⅱ期 136.5 ▲ 3.2 139.5 ▲ 6.8 110.6 ▲ 5.2 113.5 ▲ 11.5 Q2Ⅲ期 134.2 ▲ 1.7 130.7 ▲ 8.3 108.3 ▲ 2.1 109.2 ▲ 11.5 Q3Ⅳ期 133.8 ▲ 0.3 132.6 ▲ 5.5 104.9 ▲ 3.1 106.9 ▲ 11.8 Q4
平成28 年 11月 142.6 0.2 143.6 ▲ 11.7 117.6 ▲ 3.6 120.9 ▲ 8.4 Nov. 201612月 141.6 ▲ 0.7 140.3 ▲ 12.3 117.2 ▲ 0.3 118.8 ▲ 9.0 Dec.
平成29 年 1月 138.5 ▲ 2.2 143.2 ▲ 11.8 121.4 3.6 133.8 ▲ 3.5 Jan. 20172月 136.1 ▲ 1.7 140.8 ▲ 10.1 112.0 ▲ 7.7 112.5 ▲ 7.2 Feb.3月 141.0 3.6 124.9 ▲ 9.8 116.6 4.1 84.7 ▲ 7.6 Mar.4月 140.2 ▲ 0.6 131.5 ▲ 8.2 116.0 ▲ 0.5 118.5 ▲ 8.4 Apr.5月 135.9 ▲ 3.1 134.3 ▲ 9.4 106.2 ▲ 8.4 116.4 ▲ 16.4 May6月 136.5 0.4 139.5 ▲ 6.8 109.7 3.3 105.7 ▲ 9.2 Jun.7月 134.3 ▲ 1.6 142.4 ▲ 5.9 110.5 0.7 112.8 ▲ 11.1 Jul.8月 136.1 1.3 144.3 ▲ 5.9 105.2 ▲ 4.8 119.6 ▲ 13.3 Aug.9月 134.2 ▲ 1.4 130.7 ▲ 8.3 109.1 3.7 95.2 ▲ 9.8 Sep.10月 132.9 ▲ 1.0 133.6 ▲ 6.6 108.1 ▲ 0.9 109.8 ▲ 11.5 Oct.11月 134.8 1.4 135.8 ▲ 5.4 103.7 ▲ 4.1 106.6 ▲ 11.8 Nov.12月 133.8 ▲ 0.7 132.6 ▲ 5.5 102.8 ▲ 0.9 104.2 ▲ 12.3 Dec.
平成30 年 1月 131.9 ▲ 1.4 136.3 ▲ 4.8 107.8 4.9 118.8 ▲ 11.2 Jan. 2018
生産者在庫 Inventory 生産者在庫率 Inventory Ratio季節調整済指数Seasonally Adjusted
Index
原指数Original Index
季節調整済指数Seasonally Adjusted
Index
原指数Original Index
平成22年 =100index,2010= 100
生産 Production 生産者出荷 Shipments季節調整済指数Seasonally Adjusted
Index
原指数Original Index
季節調整済指数Seasonally Adjusted
Index
原指数Original Index
〈 5. はん用・生産用・業務用機械工業 ; General-purpose, production and business oriented machinery 〉
9

〈 6. 電子部品・デバイス工業 ; Electronic parts and devices 〉
前月(期)比%Change From
PreviousMonth(Quarter)
前年(同月期)比
%Change FromPrevious Year
前月(期)比%Change From
PreviousMonth(Quarter)
前年(同月期)比
%Change FromPrevious Year
平成 27 年 102.9 6.6 116.3 9.2 C.Y. 201528 年 96.4 ▲ 6.3 106.1 ▲ 8.8 201629 年 108.1 12.1 118.2 11.4 2017
平成 26 年度 99.5 9.8 110.3 10.9 F.Y. 201427 年度 101.0 1.5 114.2 3.5 201528 年度 98.9 ▲ 2.1 108.7 ▲ 4.8 2016
平成28 年 Ⅳ期 100.8 5.3 105.6 0.1 111.5 6.1 118.1 ▲ 3.3 Q4 2016平成29 年 Ⅰ期 106.6 5.8 101.3 10.8 117.1 5.0 112.4 10.2 Q1 2017
Ⅱ期 108.0 1.3 103.3 17.1 118.5 1.2 111.4 17.4 Q2Ⅲ期 109.4 1.3 113.5 13.2 120.8 1.9 124.4 13.8 Q3Ⅳ期 109.2 ▲ 0.2 114.4 8.3 117.3 ▲ 2.9 124.4 5.3 Q4
平成28 年 11月 101.1 2.3 107.5 3.1 110.9 2.4 117.7 ▲ 2.6 Nov. 201612月 102.4 1.3 104.4 3.7 115.2 3.9 121.2 5.9 Dec.
平成29 年 1月 106.0 3.5 101.0 5.6 112.9 ▲ 2.0 109.4 4.7 Jan. 20172月 109.6 3.4 96.2 14.9 123.3 9.2 107.2 12.1 Feb.3月 104.3 ▲ 4.8 106.7 12.3 115.0 ▲ 6.7 120.7 13.9 Mar.4月 109.7 5.2 99.5 15.8 119.2 3.7 106.0 15.6 Apr.5月 108.5 ▲ 1.1 103.7 21.4 116.4 ▲ 2.3 108.0 19.6 May6月 105.8 ▲ 2.5 106.6 14.1 119.8 2.9 120.2 16.9 Jun.7月 110.2 4.2 107.2 17.0 124.7 4.1 116.0 20.0 Jul.8月 112.1 1.7 115.6 15.6 124.5 ▲ 0.2 125.2 16.9 Aug.9月 105.8 ▲ 5.6 117.8 7.9 113.3 ▲ 9.0 132.0 6.5 Sep.10月 105.2 ▲ 0.6 114.1 8.8 114.8 1.3 124.3 7.7 Oct.11月 109.4 4.0 116.3 8.2 116.6 1.6 123.7 5.1 Nov.12月 113.1 3.4 112.9 8.1 120.6 3.4 125.2 3.3 Dec.
平成30 年 1月 106.0 ▲ 6.3 103.1 2.1 111.6 ▲ 7.5 109.9 0.5 Jan. 2018
前月(期)比%Change From
PreviousMonth(Quarter)
前年(同月期)比
%Change FromPrevious Year
前月(期)比%Change From
PreviousMonth(Quarter)
前年(同月期)比
%Change FromPrevious Year
平成 27 年 110.2 ▲ 2.4 134.8 4.2 C.Y. 201528 年 82.1 ▲ 25.5 127.1 ▲ 5.7 201629 年 88.5 7.8 103.6 ▲ 18.5 2017
平成 26 年度 112.3 2.0 129.8 ▲ 2.8 F.Y. 201427 年度 105.3 ▲ 6.2 134.4 3.5 201528 年度 83.3 ▲ 20.9 117.8 ▲ 12.4 2016
平成28 年 Ⅳ期 85.8 ▲ 11.8 82.1 ▲ 25.5 104.1 ▲ 19.7 99.6 ▲ 23.6 Q4 2016平成29 年 Ⅰ期 87.2 1.6 83.3 ▲ 20.9 97.7 ▲ 6.1 104.1 ▲ 26.3 Q1 2017
Ⅱ期 86.6 ▲ 0.7 88.4 ▲ 22.9 99.0 1.3 103.5 ▲ 29.1 Q2Ⅲ期 93.6 8.1 86.2 ▲ 3.8 109.1 10.2 101.0 ▲ 17.1 Q3Ⅳ期 92.5 ▲ 1.2 88.5 7.8 110.6 1.4 105.8 6.2 Q4
平成28 年 11月 86.7 ▲ 7.3 84.1 ▲ 23.8 98.1 ▲ 12.1 95.2 ▲ 26.2 Nov. 201612月 85.8 ▲ 1.0 82.1 ▲ 25.5 102.7 4.7 98.3 ▲ 25.4 Dec.
平成29 年 1月 85.1 ▲ 0.8 87.3 ▲ 24.4 101.0 ▲ 1.7 113.0 ▲ 24.1 Jan. 20172月 84.6 ▲ 0.6 89.3 ▲ 23.3 93.9 ▲ 7.0 111.2 ▲ 28.8 Feb.3月 87.2 3.1 83.3 ▲ 20.9 98.3 4.7 88.0 ▲ 25.9 Mar.4月 84.0 ▲ 3.7 84.0 ▲ 19.4 96.6 ▲ 1.7 102.4 ▲ 25.8 Apr.5月 88.0 4.8 92.1 ▲ 21.5 98.1 1.6 108.3 ▲ 32.9 May6月 86.6 ▲ 1.6 88.4 ▲ 22.9 102.4 4.4 99.8 ▲ 27.9 Jun.7月 89.6 3.5 93.5 ▲ 18.6 107.7 5.2 108.3 ▲ 28.8 Jul.8月 91.1 1.7 94.8 ▲ 15.7 102.8 ▲ 4.5 103.2 ▲ 16.3 Aug.9月 93.6 2.7 86.2 ▲ 3.8 116.8 13.6 91.5 1.9 Sep.10月 93.2 ▲ 0.4 89.6 ▲ 0.3 108.3 ▲ 7.3 102.1 ▲ 2.9 Oct.11月 96.7 3.8 93.8 11.5 111.9 3.3 108.6 14.1 Nov.12月 92.5 ▲ 4.3 88.5 7.8 111.5 ▲ 0.4 106.7 8.5 Dec.
平成30 年 1月 91.4 ▲ 1.2 93.7 7.3 109.7 ▲ 1.6 122.7 8.6 Jan. 2018
生産者在庫 Inventory 生産者在庫率 Inventory Ratio季節調整済指数Seasonally Adjusted
Index
原指数Original Index
季節調整済指数Seasonally Adjusted
Index
原指数Original Index
平成22年 =100index,2010= 100
生産 Production 生産者出荷 Shipments季節調整済指数Seasonally Adjusted
Index
原指数Original Index
季節調整済指数Seasonally Adjusted
Index
原指数Original Index
10
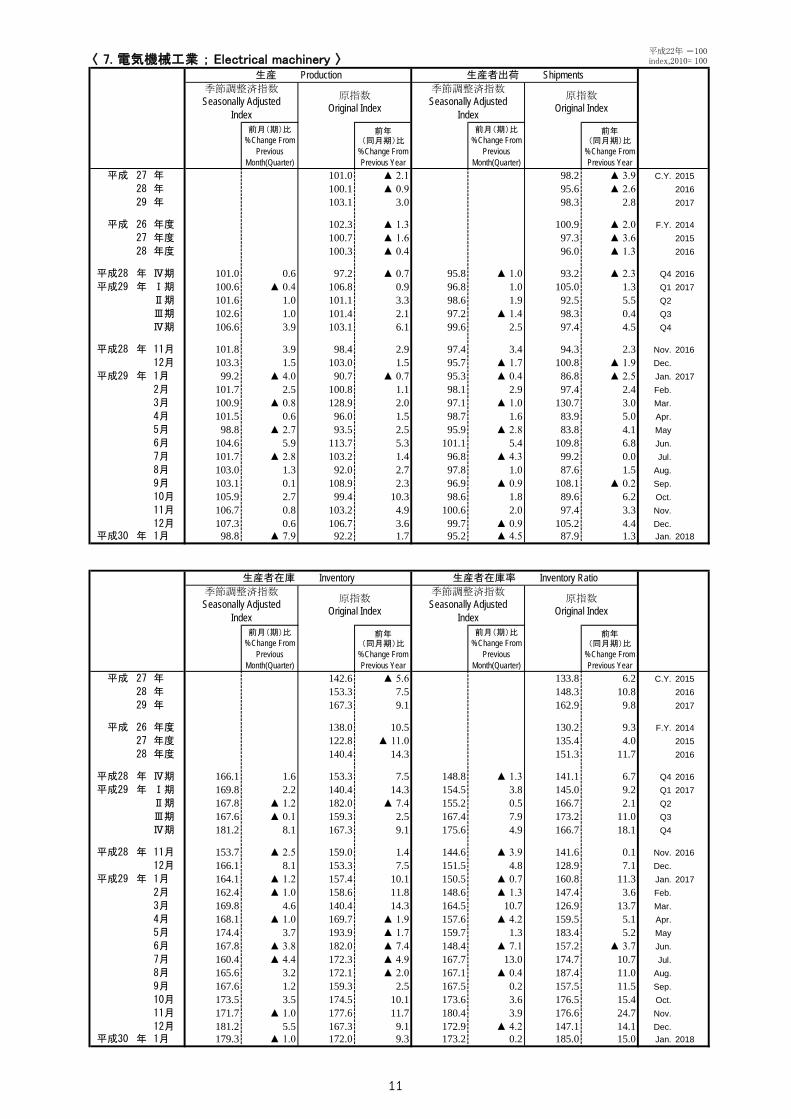
〈 7. 電気機械工業 ; Electrical machinery 〉
前月(期)比%Change From
PreviousMonth(Quarter)
前年(同月期)比
%Change FromPrevious Year
前月(期)比%Change From
PreviousMonth(Quarter)
前年(同月期)比
%Change FromPrevious Year
平成 27 年 101.0 ▲ 2.1 98.2 ▲ 3.9 C.Y. 201528 年 100.1 ▲ 0.9 95.6 ▲ 2.6 201629 年 103.1 3.0 98.3 2.8 2017
平成 26 年度 102.3 ▲ 1.3 100.9 ▲ 2.0 F.Y. 201427 年度 100.7 ▲ 1.6 97.3 ▲ 3.6 201528 年度 100.3 ▲ 0.4 96.0 ▲ 1.3 2016
平成28 年 Ⅳ期 101.0 0.6 97.2 ▲ 0.7 95.8 ▲ 1.0 93.2 ▲ 2.3 Q4 2016平成29 年 Ⅰ期 100.6 ▲ 0.4 106.8 0.9 96.8 1.0 105.0 1.3 Q1 2017
Ⅱ期 101.6 1.0 101.1 3.3 98.6 1.9 92.5 5.5 Q2Ⅲ期 102.6 1.0 101.4 2.1 97.2 ▲ 1.4 98.3 0.4 Q3Ⅳ期 106.6 3.9 103.1 6.1 99.6 2.5 97.4 4.5 Q4
平成28 年 11月 101.8 3.9 98.4 2.9 97.4 3.4 94.3 2.3 Nov. 201612月 103.3 1.5 103.0 1.5 95.7 ▲ 1.7 100.8 ▲ 1.9 Dec.
平成29 年 1月 99.2 ▲ 4.0 90.7 ▲ 0.7 95.3 ▲ 0.4 86.8 ▲ 2.5 Jan. 20172月 101.7 2.5 100.8 1.1 98.1 2.9 97.4 2.4 Feb.3月 100.9 ▲ 0.8 128.9 2.0 97.1 ▲ 1.0 130.7 3.0 Mar.4月 101.5 0.6 96.0 1.5 98.7 1.6 83.9 5.0 Apr.5月 98.8 ▲ 2.7 93.5 2.5 95.9 ▲ 2.8 83.8 4.1 May6月 104.6 5.9 113.7 5.3 101.1 5.4 109.8 6.8 Jun.7月 101.7 ▲ 2.8 103.2 1.4 96.8 ▲ 4.3 99.2 0.0 Jul.8月 103.0 1.3 92.0 2.7 97.8 1.0 87.6 1.5 Aug.9月 103.1 0.1 108.9 2.3 96.9 ▲ 0.9 108.1 ▲ 0.2 Sep.10月 105.9 2.7 99.4 10.3 98.6 1.8 89.6 6.2 Oct.11月 106.7 0.8 103.2 4.9 100.6 2.0 97.4 3.3 Nov.12月 107.3 0.6 106.7 3.6 99.7 ▲ 0.9 105.2 4.4 Dec.
平成30 年 1月 98.8 ▲ 7.9 92.2 1.7 95.2 ▲ 4.5 87.9 1.3 Jan. 2018
前月(期)比%Change From
PreviousMonth(Quarter)
前年(同月期)比
%Change FromPrevious Year
前月(期)比%Change From
PreviousMonth(Quarter)
前年(同月期)比
%Change FromPrevious Year
平成 27 年 142.6 ▲ 5.6 133.8 6.2 C.Y. 201528 年 153.3 7.5 148.3 10.8 201629 年 167.3 9.1 162.9 9.8 2017
平成 26 年度 138.0 10.5 130.2 9.3 F.Y. 201427 年度 122.8 ▲ 11.0 135.4 4.0 201528 年度 140.4 14.3 151.3 11.7 2016
平成28 年 Ⅳ期 166.1 1.6 153.3 7.5 148.8 ▲ 1.3 141.1 6.7 Q4 2016平成29 年 Ⅰ期 169.8 2.2 140.4 14.3 154.5 3.8 145.0 9.2 Q1 2017
Ⅱ期 167.8 ▲ 1.2 182.0 ▲ 7.4 155.2 0.5 166.7 2.1 Q2Ⅲ期 167.6 ▲ 0.1 159.3 2.5 167.4 7.9 173.2 11.0 Q3Ⅳ期 181.2 8.1 167.3 9.1 175.6 4.9 166.7 18.1 Q4
平成28 年 11月 153.7 ▲ 2.5 159.0 1.4 144.6 ▲ 3.9 141.6 0.1 Nov. 201612月 166.1 8.1 153.3 7.5 151.5 4.8 128.9 7.1 Dec.
平成29 年 1月 164.1 ▲ 1.2 157.4 10.1 150.5 ▲ 0.7 160.8 11.3 Jan. 20172月 162.4 ▲ 1.0 158.6 11.8 148.6 ▲ 1.3 147.4 3.6 Feb.3月 169.8 4.6 140.4 14.3 164.5 10.7 126.9 13.7 Mar.4月 168.1 ▲ 1.0 169.7 ▲ 1.9 157.6 ▲ 4.2 159.5 5.1 Apr.5月 174.4 3.7 193.9 ▲ 1.7 159.7 1.3 183.4 5.2 May6月 167.8 ▲ 3.8 182.0 ▲ 7.4 148.4 ▲ 7.1 157.2 ▲ 3.7 Jun.7月 160.4 ▲ 4.4 172.3 ▲ 4.9 167.7 13.0 174.7 10.7 Jul.8月 165.6 3.2 172.1 ▲ 2.0 167.1 ▲ 0.4 187.4 11.0 Aug.9月 167.6 1.2 159.3 2.5 167.5 0.2 157.5 11.5 Sep.10月 173.5 3.5 174.5 10.1 173.6 3.6 176.5 15.4 Oct.11月 171.7 ▲ 1.0 177.6 11.7 180.4 3.9 176.6 24.7 Nov.12月 181.2 5.5 167.3 9.1 172.9 ▲ 4.2 147.1 14.1 Dec.
平成30 年 1月 179.3 ▲ 1.0 172.0 9.3 173.2 0.2 185.0 15.0 Jan. 2018
生産者在庫 Inventory 生産者在庫率 Inventory Ratio季節調整済指数Seasonally Adjusted
Index
原指数Original Index
季節調整済指数Seasonally Adjusted
Index
原指数Original Index
平成22年 =100index,2010= 100
生産 Production 生産者出荷 Shipments季節調整済指数Seasonally Adjusted
Index
原指数Original Index
季節調整済指数Seasonally Adjusted
Index
原指数Original Index
11
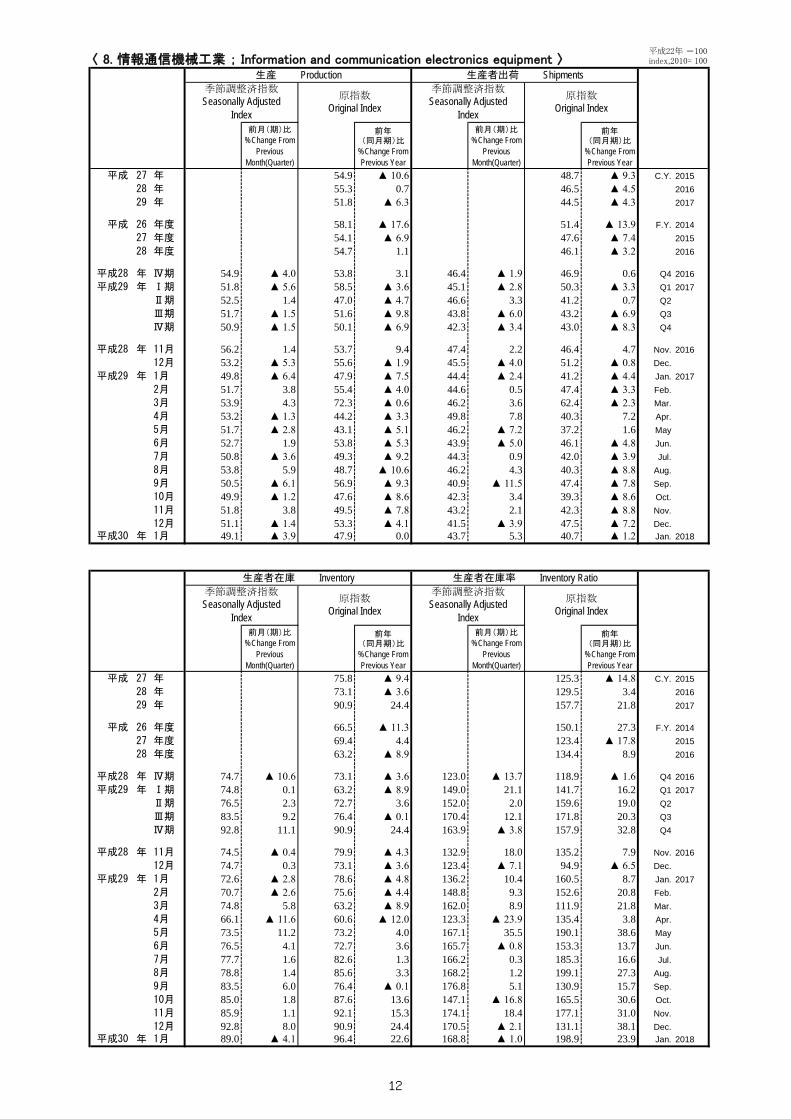
〈 8. 情報通信機械工業 ; Information and communication electronics equipment 〉
前月(期)比%Change From
PreviousMonth(Quarter)
前年(同月期)比
%Change FromPrevious Year
前月(期)比%Change From
PreviousMonth(Quarter)
前年(同月期)比
%Change FromPrevious Year
平成 27 年 54.9 ▲ 10.6 48.7 ▲ 9.3 C.Y. 201528 年 55.3 0.7 46.5 ▲ 4.5 201629 年 51.8 ▲ 6.3 44.5 ▲ 4.3 2017
平成 26 年度 58.1 ▲ 17.6 51.4 ▲ 13.9 F.Y. 201427 年度 54.1 ▲ 6.9 47.6 ▲ 7.4 201528 年度 54.7 1.1 46.1 ▲ 3.2 2016
平成28 年 Ⅳ期 54.9 ▲ 4.0 53.8 3.1 46.4 ▲ 1.9 46.9 0.6 Q4 2016平成29 年 Ⅰ期 51.8 ▲ 5.6 58.5 ▲ 3.6 45.1 ▲ 2.8 50.3 ▲ 3.3 Q1 2017
Ⅱ期 52.5 1.4 47.0 ▲ 4.7 46.6 3.3 41.2 0.7 Q2Ⅲ期 51.7 ▲ 1.5 51.6 ▲ 9.8 43.8 ▲ 6.0 43.2 ▲ 6.9 Q3Ⅳ期 50.9 ▲ 1.5 50.1 ▲ 6.9 42.3 ▲ 3.4 43.0 ▲ 8.3 Q4
平成28 年 11月 56.2 1.4 53.7 9.4 47.4 2.2 46.4 4.7 Nov. 201612月 53.2 ▲ 5.3 55.6 ▲ 1.9 45.5 ▲ 4.0 51.2 ▲ 0.8 Dec.
平成29 年 1月 49.8 ▲ 6.4 47.9 ▲ 7.5 44.4 ▲ 2.4 41.2 ▲ 4.4 Jan. 20172月 51.7 3.8 55.4 ▲ 4.0 44.6 0.5 47.4 ▲ 3.3 Feb.3月 53.9 4.3 72.3 ▲ 0.6 46.2 3.6 62.4 ▲ 2.3 Mar.4月 53.2 ▲ 1.3 44.2 ▲ 3.3 49.8 7.8 40.3 7.2 Apr.5月 51.7 ▲ 2.8 43.1 ▲ 5.1 46.2 ▲ 7.2 37.2 1.6 May6月 52.7 1.9 53.8 ▲ 5.3 43.9 ▲ 5.0 46.1 ▲ 4.8 Jun.7月 50.8 ▲ 3.6 49.3 ▲ 9.2 44.3 0.9 42.0 ▲ 3.9 Jul.8月 53.8 5.9 48.7 ▲ 10.6 46.2 4.3 40.3 ▲ 8.8 Aug.9月 50.5 ▲ 6.1 56.9 ▲ 9.3 40.9 ▲ 11.5 47.4 ▲ 7.8 Sep.10月 49.9 ▲ 1.2 47.6 ▲ 8.6 42.3 3.4 39.3 ▲ 8.6 Oct.11月 51.8 3.8 49.5 ▲ 7.8 43.2 2.1 42.3 ▲ 8.8 Nov.12月 51.1 ▲ 1.4 53.3 ▲ 4.1 41.5 ▲ 3.9 47.5 ▲ 7.2 Dec.
平成30 年 1月 49.1 ▲ 3.9 47.9 0.0 43.7 5.3 40.7 ▲ 1.2 Jan. 2018
前月(期)比%Change From
PreviousMonth(Quarter)
前年(同月期)比
%Change FromPrevious Year
前月(期)比%Change From
PreviousMonth(Quarter)
前年(同月期)比
%Change FromPrevious Year
平成 27 年 75.8 ▲ 9.4 125.3 ▲ 14.8 C.Y. 201528 年 73.1 ▲ 3.6 129.5 3.4 201629 年 90.9 24.4 157.7 21.8 2017
平成 26 年度 66.5 ▲ 11.3 150.1 27.3 F.Y. 201427 年度 69.4 4.4 123.4 ▲ 17.8 201528 年度 63.2 ▲ 8.9 134.4 8.9 2016
平成28 年 Ⅳ期 74.7 ▲ 10.6 73.1 ▲ 3.6 123.0 ▲ 13.7 118.9 ▲ 1.6 Q4 2016平成29 年 Ⅰ期 74.8 0.1 63.2 ▲ 8.9 149.0 21.1 141.7 16.2 Q1 2017
Ⅱ期 76.5 2.3 72.7 3.6 152.0 2.0 159.6 19.0 Q2Ⅲ期 83.5 9.2 76.4 ▲ 0.1 170.4 12.1 171.8 20.3 Q3Ⅳ期 92.8 11.1 90.9 24.4 163.9 ▲ 3.8 157.9 32.8 Q4
平成28 年 11月 74.5 ▲ 0.4 79.9 ▲ 4.3 132.9 18.0 135.2 7.9 Nov. 201612月 74.7 0.3 73.1 ▲ 3.6 123.4 ▲ 7.1 94.9 ▲ 6.5 Dec.
平成29 年 1月 72.6 ▲ 2.8 78.6 ▲ 4.8 136.2 10.4 160.5 8.7 Jan. 20172月 70.7 ▲ 2.6 75.6 ▲ 4.4 148.8 9.3 152.6 20.8 Feb.3月 74.8 5.8 63.2 ▲ 8.9 162.0 8.9 111.9 21.8 Mar.4月 66.1 ▲ 11.6 60.6 ▲ 12.0 123.3 ▲ 23.9 135.4 3.8 Apr.5月 73.5 11.2 73.2 4.0 167.1 35.5 190.1 38.6 May6月 76.5 4.1 72.7 3.6 165.7 ▲ 0.8 153.3 13.7 Jun.7月 77.7 1.6 82.6 1.3 166.2 0.3 185.3 16.6 Jul.8月 78.8 1.4 85.6 3.3 168.2 1.2 199.1 27.3 Aug.9月 83.5 6.0 76.4 ▲ 0.1 176.8 5.1 130.9 15.7 Sep.10月 85.0 1.8 87.6 13.6 147.1 ▲ 16.8 165.5 30.6 Oct.11月 85.9 1.1 92.1 15.3 174.1 18.4 177.1 31.0 Nov.12月 92.8 8.0 90.9 24.4 170.5 ▲ 2.1 131.1 38.1 Dec.
平成30 年 1月 89.0 ▲ 4.1 96.4 22.6 168.8 ▲ 1.0 198.9 23.9 Jan. 2018
生産者在庫 Inventory 生産者在庫率 Inventory Ratio季節調整済指数Seasonally Adjusted
Index
原指数Original Index
季節調整済指数Seasonally Adjusted
Index
原指数Original Index
平成22年 =100index,2010= 100
生産 Production 生産者出荷 Shipments季節調整済指数Seasonally Adjusted
Index
原指数Original Index
季節調整済指数Seasonally Adjusted
Index
原指数Original Index
12

〈 9. 輸送機械工業 ; Transport equipment 〉
前月(期)比%Change From
PreviousMonth(Quarter)
前年(同月期)比
%Change FromPrevious Year
前月(期)比%Change From
PreviousMonth(Quarter)
前年(同月期)比
%Change FromPrevious Year
平成 27 年 98.8 ▲ 2.8 96.8 ▲ 2.9 C.Y. 201528 年 100.1 1.3 98.0 1.2 201629 年 106.2 6.1 103.2 5.3 2017
平成 26 年度 100.3 ▲ 1.6 98.1 ▲ 3.1 F.Y. 201427 年度 98.3 ▲ 2.0 96.5 ▲ 1.6 201528 年度 101.9 3.7 99.8 3.4 2016
平成28 年 Ⅳ期 104.0 3.0 104.0 4.0 101.9 2.9 101.2 3.9 Q4 2016平成29 年 Ⅰ期 102.9 ▲ 1.1 108.5 7.1 100.8 ▲ 1.1 108.2 7.3 Q1 2017
Ⅱ期 106.7 3.7 101.9 8.2 103.0 2.2 98.4 7.0 Q2Ⅲ期 106.5 ▲ 0.2 104.8 4.1 103.8 0.8 101.7 3.9 Q3Ⅳ期 109.8 3.1 109.7 5.5 105.1 1.3 104.6 3.4 Q4
平成28 年 11月 104.1 1.8 108.3 7.5 102.6 1.2 106.5 9.0 Nov. 201612月 105.7 1.5 101.9 5.3 101.8 ▲ 0.8 97.6 2.4 Dec.
平成29 年 1月 100.5 ▲ 4.9 97.9 5.0 99.7 ▲ 2.1 96.4 7.7 Jan. 20172月 104.7 4.2 108.0 9.4 100.4 0.7 105.9 8.7 Feb.3月 103.6 ▲ 1.1 119.5 6.7 102.2 1.8 122.4 5.9 Mar.4月 114.8 10.8 100.7 14.7 108.1 5.8 96.9 10.9 Apr.5月 99.9 ▲ 13.0 92.8 4.4 97.3 ▲ 10.0 87.3 3.1 May6月 105.5 5.6 112.2 5.9 103.7 6.6 111.0 6.7 Jun.7月 105.1 ▲ 0.4 108.2 4.8 104.3 0.6 105.8 6.0 Jul.8月 107.8 2.6 94.9 7.5 106.2 1.8 90.2 7.8 Aug.9月 106.5 ▲ 1.2 111.3 0.6 100.9 ▲ 5.0 109.0 ▲ 1.1 Sep.10月 107.7 1.1 110.4 8.3 102.2 1.3 103.1 3.7 Oct.11月 107.4 ▲ 0.3 111.8 3.2 102.9 0.7 106.9 0.4 Nov.12月 114.3 6.4 106.8 4.8 110.3 7.2 103.9 6.5 Dec.
平成30 年 1月 98.2 ▲ 14.1 98.5 0.6 99.1 ▲ 10.2 98.7 2.4 Jan. 2018
前月(期)比%Change From
PreviousMonth(Quarter)
前年(同月期)比
%Change FromPrevious Year
前月(期)比%Change From
PreviousMonth(Quarter)
前年(同月期)比
%Change FromPrevious Year
平成 27 年 90.4 ▲ 23.7 102.3 3.1 C.Y. 201528 年 73.8 ▲ 18.4 82.7 ▲ 19.2 201629 年 90.3 22.4 85.5 3.4 2017
平成 26 年度 86.6 23.0 107.1 33.5 F.Y. 201427 年度 76.1 ▲ 12.1 97.3 ▲ 9.2 201528 年度 74.3 ▲ 2.4 81.3 ▲ 16.4 2016
平成28 年 Ⅳ期 72.4 ▲ 11.1 73.8 ▲ 18.4 73.4 ▲ 11.5 79.3 ▲ 20.1 Q4 2016平成29 年 Ⅰ期 87.2 20.4 74.3 ▲ 2.4 84.6 15.3 79.6 ▲ 6.9 Q1 2017
Ⅱ期 87.2 0.0 83.0 7.4 92.3 9.1 85.8 8.3 Q2Ⅲ期 81.7 ▲ 6.3 80.1 0.3 79.0 ▲ 14.4 82.5 ▲ 5.1 Q3Ⅳ期 88.5 8.3 90.3 22.4 87.2 10.4 94.2 18.8 Q4
平成28 年 11月 74.5 ▲ 1.2 84.9 ▲ 18.8 69.8 ▲ 10.6 79.2 ▲ 26.1 Nov. 201612月 72.4 ▲ 2.8 73.8 ▲ 18.4 72.4 3.7 72.3 ▲ 20.0 Dec.
平成29 年 1月 79.4 9.7 91.0 ▲ 8.8 85.7 18.4 100.1 ▲ 7.5 Jan. 20172月 83.3 4.9 85.9 ▲ 2.4 82.9 ▲ 3.3 78.2 ▲ 6.7 Feb.3月 87.2 4.7 74.3 ▲ 2.4 85.2 2.8 60.5 ▲ 6.3 Mar.4月 100.8 15.6 77.1 25.8 96.8 13.6 80.0 14.6 Apr.5月 95.4 ▲ 5.4 87.1 17.4 95.0 ▲ 1.9 102.1 11.8 May6月 87.2 ▲ 8.6 83.0 7.4 85.0 ▲ 10.5 75.3 ▲ 1.4 Jun.7月 78.0 ▲ 10.6 83.1 0.0 80.0 ▲ 5.9 79.7 ▲ 3.7 Jul.8月 79.7 2.2 82.7 ▲ 2.4 75.8 ▲ 5.2 94.0 ▲ 8.7 Aug.9月 81.7 2.5 80.1 0.3 81.3 7.3 73.9 ▲ 1.5 Sep.10月 89.5 9.5 98.0 18.8 88.5 8.9 97.9 13.3 Oct.11月 93.8 4.8 106.9 25.9 88.5 0.0 100.4 26.8 Nov.12月 88.5 ▲ 5.7 90.3 22.4 84.5 ▲ 4.5 84.4 16.7 Dec.
平成30 年 1月 86.4 ▲ 2.4 99.0 8.8 91.9 8.8 107.3 7.2 Jan. 2018
生産者在庫 Inventory 生産者在庫率 Inventory Ratio季節調整済指数Seasonally Adjusted
Index
原指数Original Index
季節調整済指数Seasonally Adjusted
Index
原指数Original Index
平成22年 =100index,2010= 100
生産 Production 生産者出荷 Shipments季節調整済指数Seasonally Adjusted
Index
原指数Original Index
季節調整済指数Seasonally Adjusted
Index
原指数Original Index
13

〈 10. 窯業・土石製品工業 ; Ceramics, stone and clay products 〉
前月(期)比%Change From
PreviousMonth(Quarter)
前年(同月期)比
%Change FromPrevious Year
前月(期)比%Change From
PreviousMonth(Quarter)
前年(同月期)比
%Change FromPrevious Year
平成 27 年 99.2 ▲ 3.0 99.8 ▲ 2.3 C.Y. 201528 年 98.5 ▲ 0.7 99.3 ▲ 0.5 201629 年 100.7 2.2 100.9 1.6 2017
平成 26 年度 101.8 0.3 101.9 0.1 F.Y. 201427 年度 98.2 ▲ 3.5 98.4 ▲ 3.4 201528 年度 99.3 1.1 100.1 1.7 2016
平成28 年 Ⅳ期 101.8 2.9 104.9 5.1 102.7 2.7 106.0 5.2 Q4 2016平成29 年 Ⅰ期 100.0 ▲ 1.8 97.5 3.3 99.8 ▲ 2.8 98.7 3.5 Q1 2017
Ⅱ期 99.9 ▲ 0.1 99.1 3.7 99.4 ▲ 0.4 97.2 1.7 Q2Ⅲ期 101.2 1.3 101.5 2.3 101.5 2.1 101.6 1.4 Q3Ⅳ期 101.1 ▲ 0.1 104.6 ▲ 0.3 102.5 1.0 106.2 0.2 Q4
平成28 年 11月 101.2 ▲ 0.3 105.0 6.4 102.4 0.7 106.4 6.7 Nov. 201612月 102.6 1.4 104.0 5.5 104.0 1.6 107.0 6.4 Dec.
平成29 年 1月 99.7 ▲ 2.8 93.8 5.4 98.4 ▲ 5.4 93.6 3.1 Jan. 20172月 100.1 0.4 94.9 1.7 100.7 2.3 97.3 4.2 Feb.3月 100.1 0.0 103.8 2.9 100.2 ▲ 0.5 105.3 3.1 Mar.4月 100.7 0.6 98.7 2.9 99.4 ▲ 0.8 96.1 1.5 Apr.5月 99.1 ▲ 1.6 95.2 6.3 97.4 ▲ 2.0 92.9 2.1 May6月 100.0 0.9 103.3 2.0 101.5 4.2 102.7 1.7 Jun.7月 100.7 0.7 103.5 2.4 99.6 ▲ 1.9 102.4 ▲ 0.7 Jul.8月 102.5 1.8 97.9 3.8 103.8 4.2 98.8 4.2 Aug.9月 100.4 ▲ 2.0 103.0 0.8 101.2 ▲ 2.5 103.6 0.9 Sep.10月 100.7 0.3 106.0 0.3 100.0 ▲ 1.2 104.2 ▲ 0.4 Oct.11月 101.1 0.4 104.9 ▲ 0.1 103.2 3.2 107.2 0.8 Nov.12月 101.5 0.4 102.8 ▲ 1.2 104.4 1.2 107.2 0.2 Dec.
平成30 年 1月 100.4 ▲ 1.1 95.6 1.9 97.5 ▲ 6.6 94.0 0.4 Jan. 2018
前月(期)比%Change From
PreviousMonth(Quarter)
前年(同月期)比
%Change FromPrevious Year
前月(期)比%Change From
PreviousMonth(Quarter)
前年(同月期)比
%Change FromPrevious Year
平成 27 年 107.9 ▲ 1.0 111.6 5.8 C.Y. 201528 年 102.1 ▲ 5.4 112.1 0.4 201629 年 105.2 3.0 108.9 ▲ 2.9 2017
平成 26 年度 103.1 1.8 106.4 0.9 F.Y. 201427 年度 105.2 2.0 114.1 7.2 201528 年度 98.4 ▲ 6.5 110.2 ▲ 3.4 2016
平成28 年 Ⅳ期 102.3 ▲ 1.4 102.1 ▲ 5.4 108.0 ▲ 1.9 102.3 ▲ 6.9 Q4 2016平成29 年 Ⅰ期 101.2 ▲ 1.1 98.4 ▲ 6.5 109.0 0.9 106.3 ▲ 6.8 Q1 2017
Ⅱ期 102.3 1.1 103.8 ▲ 3.4 108.8 ▲ 0.2 114.0 ▲ 3.9 Q2Ⅲ期 104.5 2.2 105.2 0.7 106.9 ▲ 1.7 110.1 ▲ 3.0 Q3Ⅳ期 105.4 0.9 105.2 3.0 110.8 3.6 105.0 2.6 Q4
平成28 年 11月 103.7 ▲ 0.2 104.2 ▲ 4.2 106.1 ▲ 4.7 100.2 ▲ 9.2 Nov. 201612月 102.3 ▲ 1.4 102.1 ▲ 5.4 106.7 0.6 100.4 ▲ 8.1 Dec.
平成29 年 1月 101.6 ▲ 0.7 101.4 ▲ 4.2 112.1 5.1 112.9 ▲ 3.8 Jan. 20172月 101.0 ▲ 0.6 99.4 ▲ 6.3 106.5 ▲ 5.0 105.4 ▲ 9.5 Feb.3月 101.2 0.2 98.4 ▲ 6.5 108.5 1.9 100.6 ▲ 7.5 Mar.4月 102.8 1.6 101.5 ▲ 4.7 110.3 1.7 112.2 ▲ 4.8 Apr.5月 104.7 1.8 103.6 ▲ 2.0 111.0 0.6 119.8 ▲ 4.6 May6月 102.3 ▲ 2.3 103.8 ▲ 3.4 105.0 ▲ 5.4 110.0 ▲ 2.2 Jun.7月 103.5 1.2 104.9 ▲ 1.2 110.7 5.4 109.2 0.6 Jul.8月 102.9 ▲ 0.6 104.8 ▲ 0.7 103.6 ▲ 6.4 113.9 ▲ 5.3 Aug.9月 104.5 1.6 105.2 0.7 106.5 2.8 107.3 ▲ 3.8 Sep.10月 107.0 2.4 108.3 3.0 114.7 7.7 109.6 3.1 Oct.11月 106.7 ▲ 0.3 107.3 3.0 109.9 ▲ 4.2 103.8 3.6 Nov.12月 105.4 ▲ 1.2 105.2 3.0 107.9 ▲ 1.8 101.5 1.1 Dec.
平成30 年 1月 107.3 1.8 107.1 5.6 116.3 7.8 117.1 3.7 Jan. 2018
生産者在庫 Inventory 生産者在庫率 Inventory Ratio季節調整済指数Seasonally Adjusted
Index
原指数Original Index
季節調整済指数Seasonally Adjusted
Index
原指数Original Index
平成22年 =100index,2010= 100
生産 Production 生産者出荷 Shipments季節調整済指数Seasonally Adjusted
Index
原指数Original Index
季節調整済指数Seasonally Adjusted
Index
原指数Original Index
14

〈 11. 化学工業(除.医薬品) ; Chemicals (excl. Drugs) 〉
前月(期)比%Change From
PreviousMonth(Quarter)
前年(同月期)比
%Change FromPrevious Year
前月(期)比%Change From
PreviousMonth(Quarter)
前年(同月期)比
%Change FromPrevious Year
平成 27 年 95.0 1.7 92.1 0.3 C.Y. 201528 年 96.9 2.0 94.4 2.5 201629 年 103.3 6.6 97.5 3.3 2017
平成 26 年度 92.5 ▲ 3.2 90.7 ▲ 4.7 F.Y. 201427 年度 95.6 3.4 92.5 2.0 201528 年度 97.9 2.4 95.2 2.9 2016
平成28 年 Ⅳ期 98.3 1.2 100.9 2.1 96.2 2.0 98.8 3.5 Q4 2016平成29 年 Ⅰ期 99.9 1.6 99.7 4.0 95.6 ▲ 0.6 96.3 3.2 Q1 2017
Ⅱ期 103.0 3.1 99.9 6.7 96.4 0.8 94.1 1.8 Q2Ⅲ期 105.3 2.2 104.9 7.8 98.9 2.6 97.4 4.5 Q3Ⅳ期 106.0 0.7 108.6 7.6 99.4 0.5 102.1 3.3 Q4
平成28 年 11月 98.2 0.8 101.3 3.4 96.7 2.1 99.7 6.7 Nov. 201612月 99.4 1.2 102.2 3.9 97.3 0.6 101.0 5.2 Dec.
平成29 年 1月 96.0 ▲ 3.4 95.9 2.8 94.9 ▲ 2.5 91.2 4.8 Jan. 20172月 102.1 6.4 99.4 3.0 95.9 1.1 94.0 1.2 Feb.3月 101.7 ▲ 0.4 103.8 6.0 96.1 0.2 103.8 3.7 Mar.4月 103.4 1.7 101.8 2.8 96.2 0.1 96.0 ▲ 1.2 Apr.5月 101.1 ▲ 2.2 97.6 9.4 95.9 ▲ 0.3 90.8 3.5 May6月 104.5 3.4 100.4 8.4 97.0 1.1 95.5 3.6 Jun.7月 103.1 ▲ 1.3 104.9 7.7 96.9 ▲ 0.1 96.8 2.5 Jul.8月 102.4 ▲ 0.7 102.2 5.0 98.7 1.9 94.9 5.4 Aug.9月 110.3 7.7 107.7 10.7 101.1 2.4 100.5 5.6 Sep.10月 107.3 ▲ 2.7 110.3 11.2 98.3 ▲ 2.8 100.5 4.9 Oct.11月 105.5 ▲ 1.7 108.9 7.5 100.3 2.0 103.4 3.7 Nov.12月 105.3 ▲ 0.2 106.7 4.4 99.5 ▲ 0.8 102.4 1.4 Dec.
平成30 年 1月 103.9 ▲ 1.3 104.8 9.3 96.7 ▲ 2.8 93.9 3.0 Jan. 2018
前月(期)比%Change From
PreviousMonth(Quarter)
前年(同月期)比
%Change FromPrevious Year
前月(期)比%Change From
PreviousMonth(Quarter)
前年(同月期)比
%Change FromPrevious Year
平成 27 年 109.7 4.8 117.8 1.1 C.Y. 201528 年 102.7 ▲ 6.4 116.2 ▲ 1.4 201629 年 107.5 4.7 113.7 ▲ 2.2 2017
平成 26 年度 104.2 1.1 117.8 4.2 F.Y. 201427 年度 109.3 4.9 119.0 1.0 201528 年度 103.5 ▲ 5.3 113.2 ▲ 4.9 2016
平成28 年 Ⅳ期 103.0 ▲ 2.6 102.7 ▲ 6.4 110.2 ▲ 4.0 106.6 ▲ 9.0 Q4 2016平成29 年 Ⅰ期 104.8 1.7 103.5 ▲ 5.3 110.2 0.0 111.2 ▲ 9.9 Q1 2017
Ⅱ期 105.3 0.5 103.2 ▲ 1.8 114.8 4.2 116.0 ▲ 2.5 Q2Ⅲ期 107.8 2.4 107.7 2.0 114.1 ▲ 0.6 115.1 ▲ 0.7 Q3Ⅳ期 107.8 0.0 107.5 4.7 116.2 1.8 112.5 5.5 Q4
平成28 年 11月 104.0 ▲ 2.0 102.4 ▲ 5.1 106.7 ▲ 8.8 103.9 ▲ 13.2 Nov. 201612月 103.0 ▲ 1.0 102.7 ▲ 6.4 106.8 0.1 104.4 ▲ 12.4 Dec.
平成29 年 1月 102.2 ▲ 0.8 107.0 ▲ 7.8 109.6 2.6 119.5 ▲ 12.6 Jan. 20172月 102.3 0.1 108.0 ▲ 7.3 110.0 0.4 115.1 ▲ 8.9 Feb.3月 104.8 2.4 103.5 ▲ 5.3 110.9 0.8 99.1 ▲ 7.5 Mar.4月 106.4 1.5 104.3 ▲ 3.0 117.5 6.0 111.7 0.0 Apr.5月 106.6 0.2 106.6 ▲ 1.9 114.6 ▲ 2.5 124.2 ▲ 3.8 May6月 105.3 ▲ 1.2 103.2 ▲ 1.8 112.2 ▲ 2.1 112.1 ▲ 3.6 Jun.7月 106.3 0.9 103.7 ▲ 0.3 117.8 5.0 113.6 0.4 Jul.8月 105.9 ▲ 0.4 107.1 ▲ 0.5 110.7 ▲ 6.0 119.2 ▲ 3.1 Aug.9月 107.8 1.8 107.7 2.0 113.8 2.8 112.6 0.8 Sep.10月 110.3 2.3 108.1 3.9 120.0 5.4 114.4 2.6 Oct.11月 107.7 ▲ 2.4 106.1 3.6 112.2 ▲ 6.5 109.3 5.2 Nov.12月 107.8 0.1 107.5 4.7 116.4 3.7 113.7 8.9 Dec.
平成30 年 1月 108.1 0.3 113.1 5.7 118.3 1.6 129.0 7.9 Jan. 2018
生産者在庫 Inventory 生産者在庫率 Inventory Ratio季節調整済指数Seasonally Adjusted
Index
原指数Original Index
季節調整済指数Seasonally Adjusted
Index
原指数Original Index
平成22年 =100index,2010= 100
生産 Production 生産者出荷 Shipments季節調整済指数Seasonally Adjusted
Index
原指数Original Index
季節調整済指数Seasonally Adjusted
Index
原指数Original Index
15
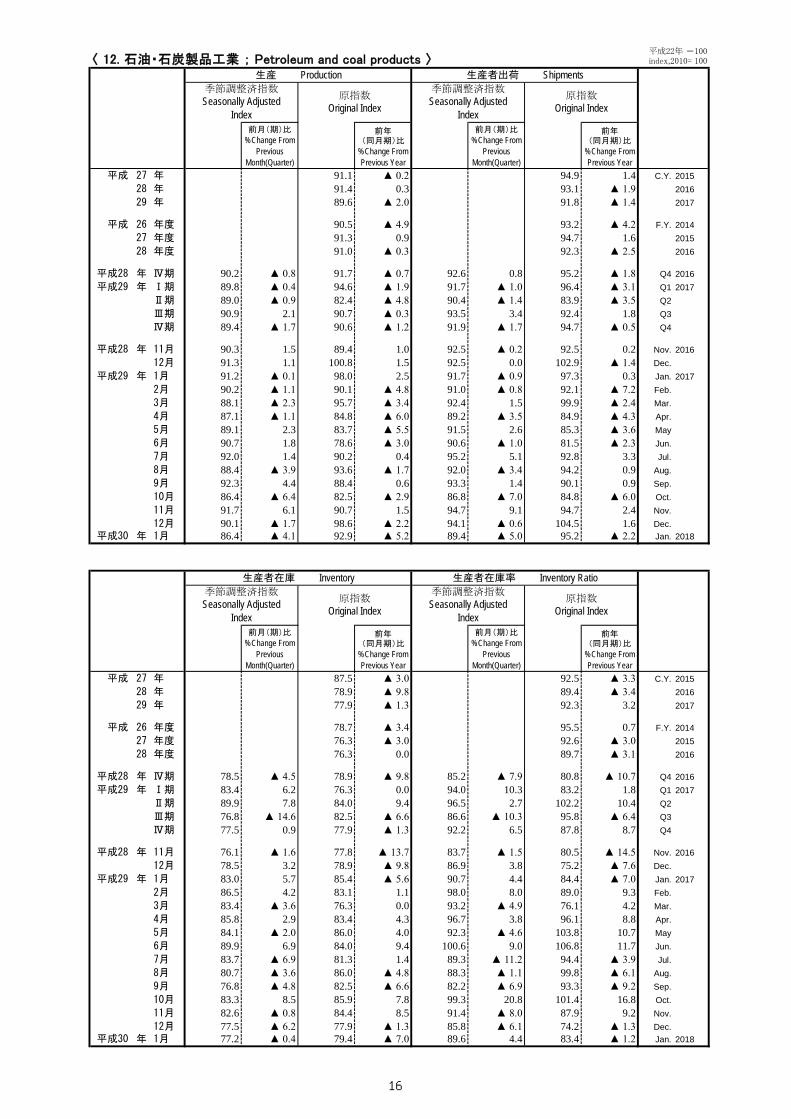
〈 12. 石油・石炭製品工業 ; Petroleum and coal products 〉
前月(期)比%Change From
PreviousMonth(Quarter)
前年(同月期)比
%Change FromPrevious Year
前月(期)比%Change From
PreviousMonth(Quarter)
前年(同月期)比
%Change FromPrevious Year
平成 27 年 91.1 ▲ 0.2 94.9 1.4 C.Y. 201528 年 91.4 0.3 93.1 ▲ 1.9 201629 年 89.6 ▲ 2.0 91.8 ▲ 1.4 2017
平成 26 年度 90.5 ▲ 4.9 93.2 ▲ 4.2 F.Y. 201427 年度 91.3 0.9 94.7 1.6 201528 年度 91.0 ▲ 0.3 92.3 ▲ 2.5 2016
平成28 年 Ⅳ期 90.2 ▲ 0.8 91.7 ▲ 0.7 92.6 0.8 95.2 ▲ 1.8 Q4 2016平成29 年 Ⅰ期 89.8 ▲ 0.4 94.6 ▲ 1.9 91.7 ▲ 1.0 96.4 ▲ 3.1 Q1 2017
Ⅱ期 89.0 ▲ 0.9 82.4 ▲ 4.8 90.4 ▲ 1.4 83.9 ▲ 3.5 Q2Ⅲ期 90.9 2.1 90.7 ▲ 0.3 93.5 3.4 92.4 1.8 Q3Ⅳ期 89.4 ▲ 1.7 90.6 ▲ 1.2 91.9 ▲ 1.7 94.7 ▲ 0.5 Q4
平成28 年 11月 90.3 1.5 89.4 1.0 92.5 ▲ 0.2 92.5 0.2 Nov. 201612月 91.3 1.1 100.8 1.5 92.5 0.0 102.9 ▲ 1.4 Dec.
平成29 年 1月 91.2 ▲ 0.1 98.0 2.5 91.7 ▲ 0.9 97.3 0.3 Jan. 20172月 90.2 ▲ 1.1 90.1 ▲ 4.8 91.0 ▲ 0.8 92.1 ▲ 7.2 Feb.3月 88.1 ▲ 2.3 95.7 ▲ 3.4 92.4 1.5 99.9 ▲ 2.4 Mar.4月 87.1 ▲ 1.1 84.8 ▲ 6.0 89.2 ▲ 3.5 84.9 ▲ 4.3 Apr.5月 89.1 2.3 83.7 ▲ 5.5 91.5 2.6 85.3 ▲ 3.6 May6月 90.7 1.8 78.6 ▲ 3.0 90.6 ▲ 1.0 81.5 ▲ 2.3 Jun.7月 92.0 1.4 90.2 0.4 95.2 5.1 92.8 3.3 Jul.8月 88.4 ▲ 3.9 93.6 ▲ 1.7 92.0 ▲ 3.4 94.2 0.9 Aug.9月 92.3 4.4 88.4 0.6 93.3 1.4 90.1 0.9 Sep.10月 86.4 ▲ 6.4 82.5 ▲ 2.9 86.8 ▲ 7.0 84.8 ▲ 6.0 Oct.11月 91.7 6.1 90.7 1.5 94.7 9.1 94.7 2.4 Nov.12月 90.1 ▲ 1.7 98.6 ▲ 2.2 94.1 ▲ 0.6 104.5 1.6 Dec.
平成30 年 1月 86.4 ▲ 4.1 92.9 ▲ 5.2 89.4 ▲ 5.0 95.2 ▲ 2.2 Jan. 2018
前月(期)比%Change From
PreviousMonth(Quarter)
前年(同月期)比
%Change FromPrevious Year
前月(期)比%Change From
PreviousMonth(Quarter)
前年(同月期)比
%Change FromPrevious Year
平成 27 年 87.5 ▲ 3.0 92.5 ▲ 3.3 C.Y. 201528 年 78.9 ▲ 9.8 89.4 ▲ 3.4 201629 年 77.9 ▲ 1.3 92.3 3.2 2017
平成 26 年度 78.7 ▲ 3.4 95.5 0.7 F.Y. 201427 年度 76.3 ▲ 3.0 92.6 ▲ 3.0 201528 年度 76.3 0.0 89.7 ▲ 3.1 2016
平成28 年 Ⅳ期 78.5 ▲ 4.5 78.9 ▲ 9.8 85.2 ▲ 7.9 80.8 ▲ 10.7 Q4 2016平成29 年 Ⅰ期 83.4 6.2 76.3 0.0 94.0 10.3 83.2 1.8 Q1 2017
Ⅱ期 89.9 7.8 84.0 9.4 96.5 2.7 102.2 10.4 Q2Ⅲ期 76.8 ▲ 14.6 82.5 ▲ 6.6 86.6 ▲ 10.3 95.8 ▲ 6.4 Q3Ⅳ期 77.5 0.9 77.9 ▲ 1.3 92.2 6.5 87.8 8.7 Q4
平成28 年 11月 76.1 ▲ 1.6 77.8 ▲ 13.7 83.7 ▲ 1.5 80.5 ▲ 14.5 Nov. 201612月 78.5 3.2 78.9 ▲ 9.8 86.9 3.8 75.2 ▲ 7.6 Dec.
平成29 年 1月 83.0 5.7 85.4 ▲ 5.6 90.7 4.4 84.4 ▲ 7.0 Jan. 20172月 86.5 4.2 83.1 1.1 98.0 8.0 89.0 9.3 Feb.3月 83.4 ▲ 3.6 76.3 0.0 93.2 ▲ 4.9 76.1 4.2 Mar.4月 85.8 2.9 83.4 4.3 96.7 3.8 96.1 8.8 Apr.5月 84.1 ▲ 2.0 86.0 4.0 92.3 ▲ 4.6 103.8 10.7 May6月 89.9 6.9 84.0 9.4 100.6 9.0 106.8 11.7 Jun.7月 83.7 ▲ 6.9 81.3 1.4 89.3 ▲ 11.2 94.4 ▲ 3.9 Jul.8月 80.7 ▲ 3.6 86.0 ▲ 4.8 88.3 ▲ 1.1 99.8 ▲ 6.1 Aug.9月 76.8 ▲ 4.8 82.5 ▲ 6.6 82.2 ▲ 6.9 93.3 ▲ 9.2 Sep.10月 83.3 8.5 85.9 7.8 99.3 20.8 101.4 16.8 Oct.11月 82.6 ▲ 0.8 84.4 8.5 91.4 ▲ 8.0 87.9 9.2 Nov.12月 77.5 ▲ 6.2 77.9 ▲ 1.3 85.8 ▲ 6.1 74.2 ▲ 1.3 Dec.
平成30 年 1月 77.2 ▲ 0.4 79.4 ▲ 7.0 89.6 4.4 83.4 ▲ 1.2 Jan. 2018
生産者在庫 Inventory 生産者在庫率 Inventory Ratio季節調整済指数Seasonally Adjusted
Index
原指数Original Index
季節調整済指数Seasonally Adjusted
Index
原指数Original Index
平成22年 =100index,2010= 100
生産 Production 生産者出荷 Shipments季節調整済指数Seasonally Adjusted
Index
原指数Original Index
季節調整済指数Seasonally Adjusted
Index
原指数Original Index
16

〈 13. プラスチック製品工業 ; Plastic products 〉
前月(期)比%Change From
PreviousMonth(Quarter)
前年(同月期)比
%Change FromPrevious Year
前月(期)比%Change From
PreviousMonth(Quarter)
前年(同月期)比
%Change FromPrevious Year
平成 27 年 97.1 ▲ 1.5 95.3 ▲ 2.0 C.Y. 201528 年 98.6 1.5 96.6 1.4 201629 年 101.7 3.1 99.6 3.1 2017
平成 26 年度 97.4 ▲ 2.4 95.8 ▲ 2.9 F.Y. 201427 年度 97.4 0.0 95.3 ▲ 0.5 201528 年度 99.3 2.0 97.4 2.2 2016
平成28 年 Ⅳ期 100.8 1.5 102.3 2.0 98.8 1.3 100.7 2.3 Q4 2016平成29 年 Ⅰ期 100.4 ▲ 0.4 98.7 3.2 97.7 ▲ 1.1 96.5 3.3 Q1 2017
Ⅱ期 101.2 0.8 102.3 4.5 99.8 2.1 99.5 5.0 Q2Ⅲ期 102.3 1.1 101.3 2.8 99.8 0.0 99.4 2.1 Q3Ⅳ期 102.5 0.2 104.3 2.0 101.0 1.2 103.1 2.4 Q4
平成28 年 11月 100.8 0.1 105.1 1.9 98.9 0.9 102.8 3.4 Nov. 201612月 100.8 0.0 98.4 2.4 99.6 0.7 99.8 3.2 Dec.
平成29 年 1月 100.2 ▲ 0.6 92.6 3.5 96.9 ▲ 2.7 89.7 3.3 Jan. 20172月 100.4 0.2 97.6 2.7 98.2 1.3 95.0 3.4 Feb.3月 100.6 0.2 105.9 3.5 97.9 ▲ 0.3 104.8 3.1 Mar.4月 102.0 1.4 102.7 5.1 100.3 2.5 100.8 4.3 Apr.5月 99.7 ▲ 2.3 96.7 4.7 99.2 ▲ 1.1 94.0 6.3 May6月 102.0 2.3 107.5 3.9 100.0 0.8 103.6 4.1 Jun.7月 101.8 ▲ 0.2 106.7 3.3 99.4 ▲ 0.6 102.9 2.5 Jul.8月 102.2 0.4 93.1 2.4 99.7 0.3 93.8 2.0 Aug.9月 102.8 0.6 104.2 2.9 100.2 0.5 101.5 1.6 Sep.10月 102.7 ▲ 0.1 106.6 3.1 100.5 0.3 103.6 4.1 Oct.11月 101.7 ▲ 1.0 106.1 1.0 100.6 0.1 104.5 1.7 Nov.12月 103.1 1.4 100.1 1.7 101.9 1.3 101.2 1.4 Dec.
平成30 年 1月 101.5 ▲ 1.6 94.8 2.4 98.6 ▲ 3.2 92.7 3.3 Jan. 2018
前月(期)比%Change From
PreviousMonth(Quarter)
前年(同月期)比
%Change FromPrevious Year
前月(期)比%Change From
PreviousMonth(Quarter)
前年(同月期)比
%Change FromPrevious Year
平成 27 年 109.6 3.9 112.7 3.5 C.Y. 201528 年 106.4 ▲ 2.9 113.0 0.3 201629 年 111.9 5.2 110.9 ▲ 1.9 2017
平成 26 年度 106.0 3.5 111.0 4.9 F.Y. 201427 年度 109.8 3.6 113.6 2.3 201528 年度 108.1 ▲ 1.5 111.6 ▲ 1.8 2016
平成28 年 Ⅳ期 108.3 ▲ 1.5 106.4 ▲ 2.9 110.7 ▲ 1.2 106.8 ▲ 2.8 Q4 2016平成29 年 Ⅰ期 109.9 1.5 108.1 ▲ 1.5 109.7 ▲ 0.9 113.0 ▲ 4.5 Q1 2017
Ⅱ期 109.3 ▲ 0.5 111.4 ▲ 1.3 109.2 ▲ 0.5 109.1 ▲ 4.5 Q2Ⅲ期 112.5 2.9 112.5 2.4 111.4 2.0 111.8 ▲ 0.6 Q3Ⅳ期 113.9 1.2 111.9 5.2 113.8 2.2 109.8 2.8 Q4
平成28 年 11月 109.3 ▲ 1.1 110.9 ▲ 1.9 108.6 ▲ 5.2 106.1 ▲ 4.8 Nov. 201612月 108.3 ▲ 0.9 106.4 ▲ 2.9 108.9 0.3 104.5 ▲ 5.4 Dec.
平成29 年 1月 108.5 0.2 107.9 ▲ 2.8 108.7 ▲ 0.2 120.0 ▲ 5.7 Jan. 20172月 108.6 0.1 109.4 ▲ 3.1 110.5 1.7 116.2 ▲ 3.8 Feb.3月 109.9 1.2 108.1 ▲ 1.5 109.8 ▲ 0.6 102.8 ▲ 3.9 Mar.4月 110.9 0.9 108.4 ▲ 0.4 111.7 1.7 106.5 ▲ 2.6 Apr.5月 110.1 ▲ 0.7 109.7 ▲ 1.0 107.9 ▲ 3.4 113.3 ▲ 6.7 May6月 109.3 ▲ 0.7 111.4 ▲ 1.3 108.0 0.1 107.5 ▲ 3.9 Jun.7月 111.3 1.8 114.2 0.4 112.8 4.4 110.7 ▲ 2.0 Jul.8月 111.3 0.0 110.8 0.8 109.6 ▲ 2.8 114.8 ▲ 0.6 Aug.9月 112.5 1.1 112.5 2.4 111.8 2.0 110.0 0.8 Sep.10月 114.7 2.0 115.0 3.8 115.1 3.0 110.3 0.5 Oct.11月 113.6 ▲ 1.0 115.2 3.9 112.3 ▲ 2.4 109.8 3.5 Nov.12月 113.9 0.3 111.9 5.2 114.0 1.5 109.4 4.7 Dec.
平成30 年 1月 113.8 ▲ 0.1 113.2 4.9 110.9 ▲ 2.7 122.4 2.0 Jan. 2018
生産者在庫 Inventory 生産者在庫率 Inventory Ratio季節調整済指数Seasonally Adjusted
Index
原指数Original Index
季節調整済指数Seasonally Adjusted
Index
原指数Original Index
平成22年 =100index,2010= 100
生産 Production 生産者出荷 Shipments季節調整済指数Seasonally Adjusted
Index
原指数Original Index
季節調整済指数Seasonally Adjusted
Index
原指数Original Index
17
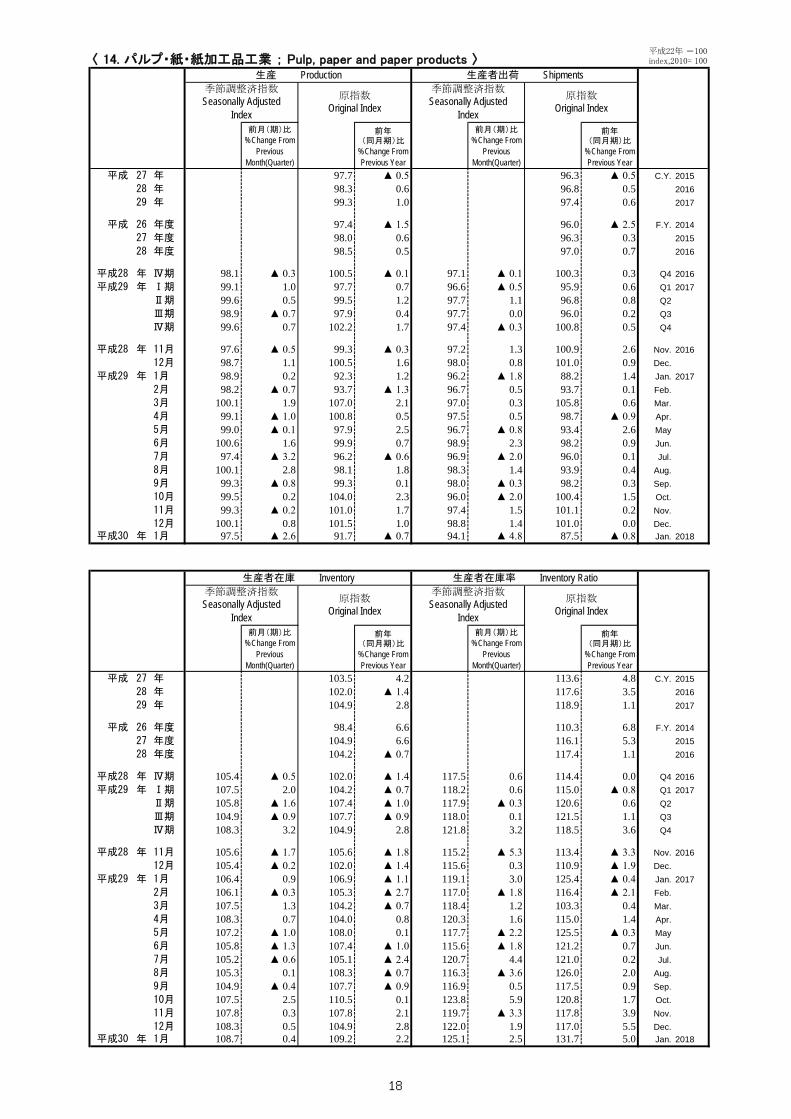
〈 14. パルプ・紙・紙加工品工業 ; Pulp, paper and paper products 〉
前月(期)比%Change From
PreviousMonth(Quarter)
前年(同月期)比
%Change FromPrevious Year
前月(期)比%Change From
PreviousMonth(Quarter)
前年(同月期)比
%Change FromPrevious Year
平成 27 年 97.7 ▲ 0.5 96.3 ▲ 0.5 C.Y. 201528 年 98.3 0.6 96.8 0.5 201629 年 99.3 1.0 97.4 0.6 2017
平成 26 年度 97.4 ▲ 1.5 96.0 ▲ 2.5 F.Y. 201427 年度 98.0 0.6 96.3 0.3 201528 年度 98.5 0.5 97.0 0.7 2016
平成28 年 Ⅳ期 98.1 ▲ 0.3 100.5 ▲ 0.1 97.1 ▲ 0.1 100.3 0.3 Q4 2016平成29 年 Ⅰ期 99.1 1.0 97.7 0.7 96.6 ▲ 0.5 95.9 0.6 Q1 2017
Ⅱ期 99.6 0.5 99.5 1.2 97.7 1.1 96.8 0.8 Q2Ⅲ期 98.9 ▲ 0.7 97.9 0.4 97.7 0.0 96.0 0.2 Q3Ⅳ期 99.6 0.7 102.2 1.7 97.4 ▲ 0.3 100.8 0.5 Q4
平成28 年 11月 97.6 ▲ 0.5 99.3 ▲ 0.3 97.2 1.3 100.9 2.6 Nov. 201612月 98.7 1.1 100.5 1.6 98.0 0.8 101.0 0.9 Dec.
平成29 年 1月 98.9 0.2 92.3 1.2 96.2 ▲ 1.8 88.2 1.4 Jan. 20172月 98.2 ▲ 0.7 93.7 ▲ 1.3 96.7 0.5 93.7 0.1 Feb.3月 100.1 1.9 107.0 2.1 97.0 0.3 105.8 0.6 Mar.4月 99.1 ▲ 1.0 100.8 0.5 97.5 0.5 98.7 ▲ 0.9 Apr.5月 99.0 ▲ 0.1 97.9 2.5 96.7 ▲ 0.8 93.4 2.6 May6月 100.6 1.6 99.9 0.7 98.9 2.3 98.2 0.9 Jun.7月 97.4 ▲ 3.2 96.2 ▲ 0.6 96.9 ▲ 2.0 96.0 0.1 Jul.8月 100.1 2.8 98.1 1.8 98.3 1.4 93.9 0.4 Aug.9月 99.3 ▲ 0.8 99.3 0.1 98.0 ▲ 0.3 98.2 0.3 Sep.10月 99.5 0.2 104.0 2.3 96.0 ▲ 2.0 100.4 1.5 Oct.11月 99.3 ▲ 0.2 101.0 1.7 97.4 1.5 101.1 0.2 Nov.12月 100.1 0.8 101.5 1.0 98.8 1.4 101.0 0.0 Dec.
平成30 年 1月 97.5 ▲ 2.6 91.7 ▲ 0.7 94.1 ▲ 4.8 87.5 ▲ 0.8 Jan. 2018
前月(期)比%Change From
PreviousMonth(Quarter)
前年(同月期)比
%Change FromPrevious Year
前月(期)比%Change From
PreviousMonth(Quarter)
前年(同月期)比
%Change FromPrevious Year
平成 27 年 103.5 4.2 113.6 4.8 C.Y. 201528 年 102.0 ▲ 1.4 117.6 3.5 201629 年 104.9 2.8 118.9 1.1 2017
平成 26 年度 98.4 6.6 110.3 6.8 F.Y. 201427 年度 104.9 6.6 116.1 5.3 201528 年度 104.2 ▲ 0.7 117.4 1.1 2016
平成28 年 Ⅳ期 105.4 ▲ 0.5 102.0 ▲ 1.4 117.5 0.6 114.4 0.0 Q4 2016平成29 年 Ⅰ期 107.5 2.0 104.2 ▲ 0.7 118.2 0.6 115.0 ▲ 0.8 Q1 2017
Ⅱ期 105.8 ▲ 1.6 107.4 ▲ 1.0 117.9 ▲ 0.3 120.6 0.6 Q2Ⅲ期 104.9 ▲ 0.9 107.7 ▲ 0.9 118.0 0.1 121.5 1.1 Q3Ⅳ期 108.3 3.2 104.9 2.8 121.8 3.2 118.5 3.6 Q4
平成28 年 11月 105.6 ▲ 1.7 105.6 ▲ 1.8 115.2 ▲ 5.3 113.4 ▲ 3.3 Nov. 201612月 105.4 ▲ 0.2 102.0 ▲ 1.4 115.6 0.3 110.9 ▲ 1.9 Dec.
平成29 年 1月 106.4 0.9 106.9 ▲ 1.1 119.1 3.0 125.4 ▲ 0.4 Jan. 20172月 106.1 ▲ 0.3 105.3 ▲ 2.7 117.0 ▲ 1.8 116.4 ▲ 2.1 Feb.3月 107.5 1.3 104.2 ▲ 0.7 118.4 1.2 103.3 0.4 Mar.4月 108.3 0.7 104.0 0.8 120.3 1.6 115.0 1.4 Apr.5月 107.2 ▲ 1.0 108.0 0.1 117.7 ▲ 2.2 125.5 ▲ 0.3 May6月 105.8 ▲ 1.3 107.4 ▲ 1.0 115.6 ▲ 1.8 121.2 0.7 Jun.7月 105.2 ▲ 0.6 105.1 ▲ 2.4 120.7 4.4 121.0 0.2 Jul.8月 105.3 0.1 108.3 ▲ 0.7 116.3 ▲ 3.6 126.0 2.0 Aug.9月 104.9 ▲ 0.4 107.7 ▲ 0.9 116.9 0.5 117.5 0.9 Sep.10月 107.5 2.5 110.5 0.1 123.8 5.9 120.8 1.7 Oct.11月 107.8 0.3 107.8 2.1 119.7 ▲ 3.3 117.8 3.9 Nov.12月 108.3 0.5 104.9 2.8 122.0 1.9 117.0 5.5 Dec.
平成30 年 1月 108.7 0.4 109.2 2.2 125.1 2.5 131.7 5.0 Jan. 2018
生産者在庫 Inventory 生産者在庫率 Inventory Ratio季節調整済指数Seasonally Adjusted
Index
原指数Original Index
季節調整済指数Seasonally Adjusted
Index
原指数Original Index
平成22年 =100index,2010= 100
生産 Production 生産者出荷 Shipments季節調整済指数Seasonally Adjusted
Index
原指数Original Index
季節調整済指数Seasonally Adjusted
Index
原指数Original Index
18
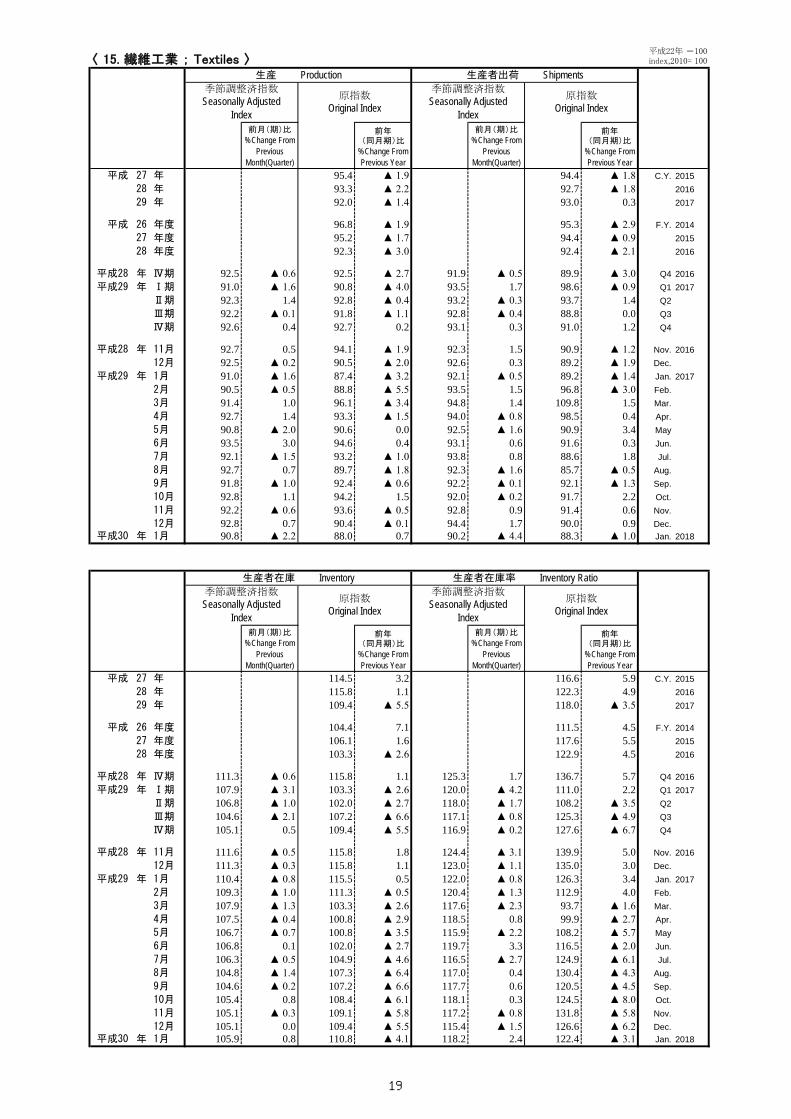
〈 15. 繊維工業 ; Textiles 〉
前月(期)比%Change From
PreviousMonth(Quarter)
前年(同月期)比
%Change FromPrevious Year
前月(期)比%Change From
PreviousMonth(Quarter)
前年(同月期)比
%Change FromPrevious Year
平成 27 年 95.4 ▲ 1.9 94.4 ▲ 1.8 C.Y. 201528 年 93.3 ▲ 2.2 92.7 ▲ 1.8 201629 年 92.0 ▲ 1.4 93.0 0.3 2017
平成 26 年度 96.8 ▲ 1.9 95.3 ▲ 2.9 F.Y. 201427 年度 95.2 ▲ 1.7 94.4 ▲ 0.9 201528 年度 92.3 ▲ 3.0 92.4 ▲ 2.1 2016
平成28 年 Ⅳ期 92.5 ▲ 0.6 92.5 ▲ 2.7 91.9 ▲ 0.5 89.9 ▲ 3.0 Q4 2016平成29 年 Ⅰ期 91.0 ▲ 1.6 90.8 ▲ 4.0 93.5 1.7 98.6 ▲ 0.9 Q1 2017
Ⅱ期 92.3 1.4 92.8 ▲ 0.4 93.2 ▲ 0.3 93.7 1.4 Q2Ⅲ期 92.2 ▲ 0.1 91.8 ▲ 1.1 92.8 ▲ 0.4 88.8 0.0 Q3Ⅳ期 92.6 0.4 92.7 0.2 93.1 0.3 91.0 1.2 Q4
平成28 年 11月 92.7 0.5 94.1 ▲ 1.9 92.3 1.5 90.9 ▲ 1.2 Nov. 201612月 92.5 ▲ 0.2 90.5 ▲ 2.0 92.6 0.3 89.2 ▲ 1.9 Dec.
平成29 年 1月 91.0 ▲ 1.6 87.4 ▲ 3.2 92.1 ▲ 0.5 89.2 ▲ 1.4 Jan. 20172月 90.5 ▲ 0.5 88.8 ▲ 5.5 93.5 1.5 96.8 ▲ 3.0 Feb.3月 91.4 1.0 96.1 ▲ 3.4 94.8 1.4 109.8 1.5 Mar.4月 92.7 1.4 93.3 ▲ 1.5 94.0 ▲ 0.8 98.5 0.4 Apr.5月 90.8 ▲ 2.0 90.6 0.0 92.5 ▲ 1.6 90.9 3.4 May6月 93.5 3.0 94.6 0.4 93.1 0.6 91.6 0.3 Jun.7月 92.1 ▲ 1.5 93.2 ▲ 1.0 93.8 0.8 88.6 1.8 Jul.8月 92.7 0.7 89.7 ▲ 1.8 92.3 ▲ 1.6 85.7 ▲ 0.5 Aug.9月 91.8 ▲ 1.0 92.4 ▲ 0.6 92.2 ▲ 0.1 92.1 ▲ 1.3 Sep.10月 92.8 1.1 94.2 1.5 92.0 ▲ 0.2 91.7 2.2 Oct.11月 92.2 ▲ 0.6 93.6 ▲ 0.5 92.8 0.9 91.4 0.6 Nov.12月 92.8 0.7 90.4 ▲ 0.1 94.4 1.7 90.0 0.9 Dec.
平成30 年 1月 90.8 ▲ 2.2 88.0 0.7 90.2 ▲ 4.4 88.3 ▲ 1.0 Jan. 2018
前月(期)比%Change From
PreviousMonth(Quarter)
前年(同月期)比
%Change FromPrevious Year
前月(期)比%Change From
PreviousMonth(Quarter)
前年(同月期)比
%Change FromPrevious Year
平成 27 年 114.5 3.2 116.6 5.9 C.Y. 201528 年 115.8 1.1 122.3 4.9 201629 年 109.4 ▲ 5.5 118.0 ▲ 3.5 2017
平成 26 年度 104.4 7.1 111.5 4.5 F.Y. 201427 年度 106.1 1.6 117.6 5.5 201528 年度 103.3 ▲ 2.6 122.9 4.5 2016
平成28 年 Ⅳ期 111.3 ▲ 0.6 115.8 1.1 125.3 1.7 136.7 5.7 Q4 2016平成29 年 Ⅰ期 107.9 ▲ 3.1 103.3 ▲ 2.6 120.0 ▲ 4.2 111.0 2.2 Q1 2017
Ⅱ期 106.8 ▲ 1.0 102.0 ▲ 2.7 118.0 ▲ 1.7 108.2 ▲ 3.5 Q2Ⅲ期 104.6 ▲ 2.1 107.2 ▲ 6.6 117.1 ▲ 0.8 125.3 ▲ 4.9 Q3Ⅳ期 105.1 0.5 109.4 ▲ 5.5 116.9 ▲ 0.2 127.6 ▲ 6.7 Q4
平成28 年 11月 111.6 ▲ 0.5 115.8 1.8 124.4 ▲ 3.1 139.9 5.0 Nov. 201612月 111.3 ▲ 0.3 115.8 1.1 123.0 ▲ 1.1 135.0 3.0 Dec.
平成29 年 1月 110.4 ▲ 0.8 115.5 0.5 122.0 ▲ 0.8 126.3 3.4 Jan. 20172月 109.3 ▲ 1.0 111.3 ▲ 0.5 120.4 ▲ 1.3 112.9 4.0 Feb.3月 107.9 ▲ 1.3 103.3 ▲ 2.6 117.6 ▲ 2.3 93.7 ▲ 1.6 Mar.4月 107.5 ▲ 0.4 100.8 ▲ 2.9 118.5 0.8 99.9 ▲ 2.7 Apr.5月 106.7 ▲ 0.7 100.8 ▲ 3.5 115.9 ▲ 2.2 108.2 ▲ 5.7 May6月 106.8 0.1 102.0 ▲ 2.7 119.7 3.3 116.5 ▲ 2.0 Jun.7月 106.3 ▲ 0.5 104.9 ▲ 4.6 116.5 ▲ 2.7 124.9 ▲ 6.1 Jul.8月 104.8 ▲ 1.4 107.3 ▲ 6.4 117.0 0.4 130.4 ▲ 4.3 Aug.9月 104.6 ▲ 0.2 107.2 ▲ 6.6 117.7 0.6 120.5 ▲ 4.5 Sep.10月 105.4 0.8 108.4 ▲ 6.1 118.1 0.3 124.5 ▲ 8.0 Oct.11月 105.1 ▲ 0.3 109.1 ▲ 5.8 117.2 ▲ 0.8 131.8 ▲ 5.8 Nov.12月 105.1 0.0 109.4 ▲ 5.5 115.4 ▲ 1.5 126.6 ▲ 6.2 Dec.
平成30 年 1月 105.9 0.8 110.8 ▲ 4.1 118.2 2.4 122.4 ▲ 3.1 Jan. 2018
生産者在庫 Inventory 生産者在庫率 Inventory Ratio季節調整済指数Seasonally Adjusted
Index
原指数Original Index
季節調整済指数Seasonally Adjusted
Index
原指数Original Index
平成22年 =100index,2010= 100
生産 Production 生産者出荷 Shipments季節調整済指数Seasonally Adjusted
Index
原指数Original Index
季節調整済指数Seasonally Adjusted
Index
原指数Original Index
19

〈 16. その他工業 ; Other manufacturing 〉
前月(期)比%Change From
PreviousMonth(Quarter)
前年(同月期)比
%Change FromPrevious Year
前月(期)比%Change From
PreviousMonth(Quarter)
前年(同月期)比
%Change FromPrevious Year
平成 27 年 93.7 ▲ 3.1 94.9 ▲ 3.6 C.Y. 201528 年 93.0 ▲ 0.7 94.2 ▲ 0.7 201629 年 92.6 ▲ 0.4 94.6 0.4 2017
平成 26 年度 95.8 ▲ 2.7 97.0 ▲ 3.5 F.Y. 201427 年度 93.3 ▲ 2.6 94.6 ▲ 2.5 201528 年度 92.8 ▲ 0.5 94.2 ▲ 0.4 2016
平成28 年 Ⅳ期 93.3 0.5 94.8 0.2 94.7 0.3 96.2 0.1 Q4 2016平成29 年 Ⅰ期 92.4 ▲ 1.0 93.4 ▲ 0.6 93.8 ▲ 1.0 95.9 0.1 Q1 2017
Ⅱ期 92.1 ▲ 0.3 91.3 ▲ 0.7 94.7 1.0 92.7 0.9 Q2Ⅲ期 92.0 ▲ 0.1 90.3 ▲ 1.0 94.4 ▲ 0.3 92.6 ▲ 0.3 Q3Ⅳ期 93.7 1.8 95.3 0.5 95.6 1.3 97.2 1.0 Q4
平成28 年 11月 93.5 1.0 96.7 1.5 94.8 0.5 98.6 2.2 Nov. 201612月 93.9 0.4 92.6 0.7 95.0 0.2 93.4 0.9 Dec.
平成29 年 1月 92.1 ▲ 1.9 84.5 0.0 92.4 ▲ 2.7 84.9 ▲ 0.4 Jan. 20172月 92.7 0.7 92.8 ▲ 1.0 94.6 2.4 94.5 ▲ 0.1 Feb.3月 92.4 ▲ 0.3 102.8 ▲ 1.0 94.5 ▲ 0.1 108.4 0.6 Mar.4月 92.4 0.0 93.2 ▲ 1.4 95.0 0.5 93.8 ▲ 0.3 Apr.5月 92.0 ▲ 0.4 86.5 0.9 94.6 ▲ 0.4 88.4 2.7 May6月 91.8 ▲ 0.2 94.1 ▲ 1.5 94.6 0.0 96.0 0.5 Jun.7月 91.4 ▲ 0.4 92.1 ▲ 1.2 93.2 ▲ 1.5 93.4 ▲ 1.0 Jul.8月 92.5 1.2 84.4 ▲ 0.4 95.5 2.5 87.4 1.5 Aug.9月 92.2 ▲ 0.3 94.5 ▲ 1.4 94.5 ▲ 1.0 97.1 ▲ 1.2 Sep.10月 93.4 1.3 96.7 1.8 94.5 0.0 98.1 1.7 Oct.11月 93.3 ▲ 0.1 96.4 ▲ 0.3 94.7 0.2 98.5 ▲ 0.1 Nov.12月 94.3 1.1 92.7 0.1 97.5 3.0 95.1 1.8 Dec.
平成30 年 1月 92.6 ▲ 1.8 85.8 1.5 93.5 ▲ 4.1 87.1 2.6 Jan. 2018
前月(期)比%Change From
PreviousMonth(Quarter)
前年(同月期)比
%Change FromPrevious Year
前月(期)比%Change From
PreviousMonth(Quarter)
前年(同月期)比
%Change FromPrevious Year
平成 27 年 96.9 ▲ 3.6 101.9 5.7 C.Y. 201528 年 96.9 0.0 100.1 ▲ 1.8 201629 年 94.0 ▲ 3.0 95.5 ▲ 4.6 2017
平成 26 年度 96.6 7.3 99.4 3.4 F.Y. 201427 年度 93.5 ▲ 3.2 101.1 1.7 201528 年度 89.3 ▲ 4.5 99.4 ▲ 1.7 2016
平成28 年 Ⅳ期 97.4 1.0 96.9 0.0 99.6 0.2 97.8 ▲ 0.3 Q4 2016平成29 年 Ⅰ期 93.9 ▲ 3.6 89.3 ▲ 4.5 97.0 ▲ 2.6 94.9 ▲ 3.0 Q1 2017
Ⅱ期 92.2 ▲ 1.8 92.6 ▲ 6.1 95.6 ▲ 1.4 96.4 ▲ 5.8 Q2Ⅲ期 90.7 ▲ 1.6 90.9 ▲ 5.9 94.0 ▲ 1.7 96.9 ▲ 5.6 Q3Ⅳ期 94.5 4.2 94.0 ▲ 3.0 95.4 1.5 93.7 ▲ 4.2 Q4
平成28 年 11月 96.9 ▲ 0.1 97.0 0.1 97.8 ▲ 3.2 95.9 ▲ 2.9 Nov. 201612月 97.4 0.5 96.9 0.0 100.0 2.2 99.7 ▲ 0.2 Dec.
平成29 年 1月 96.4 ▲ 1.0 99.0 ▲ 1.3 101.0 1.0 110.4 ▲ 0.3 Jan. 20172月 95.7 ▲ 0.7 98.8 ▲ 2.4 96.4 ▲ 4.6 96.3 ▲ 3.0 Feb.3月 93.9 ▲ 1.9 89.3 ▲ 4.5 93.5 ▲ 3.0 78.1 ▲ 6.5 Mar.4月 94.8 1.0 91.8 ▲ 4.0 98.3 5.1 93.8 ▲ 3.6 Apr.5月 93.4 ▲ 1.5 91.6 ▲ 5.1 94.9 ▲ 3.5 100.4 ▲ 7.6 May6月 92.2 ▲ 1.3 92.6 ▲ 6.1 93.5 ▲ 1.5 95.0 ▲ 5.9 Jun.7月 92.4 0.2 94.4 ▲ 5.4 98.7 5.6 99.6 ▲ 2.6 Jul.8月 90.7 ▲ 1.8 92.1 ▲ 7.0 90.7 ▲ 8.1 101.1 ▲ 8.5 Aug.9月 90.7 0.0 90.9 ▲ 5.9 92.6 2.1 90.1 ▲ 5.2 Sep.10月 93.4 3.0 93.2 ▲ 3.7 95.6 3.2 92.5 ▲ 5.4 Oct.11月 94.6 1.3 94.7 ▲ 2.4 95.6 0.0 93.8 ▲ 2.2 Nov.12月 94.5 ▲ 0.1 94.0 ▲ 3.0 95.0 ▲ 0.6 94.7 ▲ 5.0 Dec.
平成30 年 1月 91.9 ▲ 2.8 94.4 ▲ 4.6 94.2 ▲ 0.8 102.9 ▲ 6.8 Jan. 2018
生産者在庫 Inventory 生産者在庫率 Inventory Ratio季節調整済指数Seasonally Adjusted
Index
原指数Original Index
季節調整済指数Seasonally Adjusted
Index
原指数Original Index
平成22年 =100index,2010= 100
生産 Production 生産者出荷 Shipments季節調整済指数Seasonally Adjusted
Index
原指数Original Index
季節調整済指数Seasonally Adjusted
Index
原指数Original Index
20
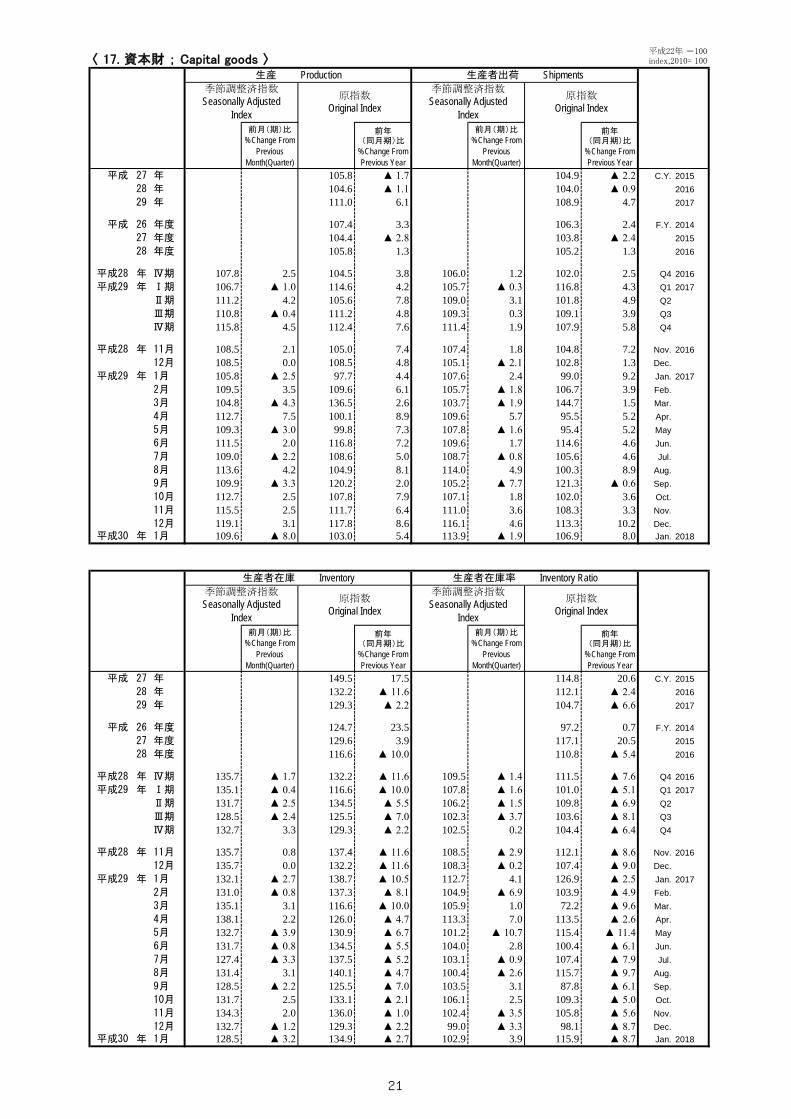
〈 17. 資本財 ; Capital goods 〉
前月(期)比%Change From
PreviousMonth(Quarter)
前年(同月期)比
%Change FromPrevious Year
前月(期)比%Change From
PreviousMonth(Quarter)
前年(同月期)比
%Change FromPrevious Year
平成 27 年 105.8 ▲ 1.7 104.9 ▲ 2.2 C.Y. 201528 年 104.6 ▲ 1.1 104.0 ▲ 0.9 201629 年 111.0 6.1 108.9 4.7 2017
平成 26 年度 107.4 3.3 106.3 2.4 F.Y. 201427 年度 104.4 ▲ 2.8 103.8 ▲ 2.4 201528 年度 105.8 1.3 105.2 1.3 2016
平成28 年 Ⅳ期 107.8 2.5 104.5 3.8 106.0 1.2 102.0 2.5 Q4 2016平成29 年 Ⅰ期 106.7 ▲ 1.0 114.6 4.2 105.7 ▲ 0.3 116.8 4.3 Q1 2017
Ⅱ期 111.2 4.2 105.6 7.8 109.0 3.1 101.8 4.9 Q2Ⅲ期 110.8 ▲ 0.4 111.2 4.8 109.3 0.3 109.1 3.9 Q3Ⅳ期 115.8 4.5 112.4 7.6 111.4 1.9 107.9 5.8 Q4
平成28 年 11月 108.5 2.1 105.0 7.4 107.4 1.8 104.8 7.2 Nov. 201612月 108.5 0.0 108.5 4.8 105.1 ▲ 2.1 102.8 1.3 Dec.
平成29 年 1月 105.8 ▲ 2.5 97.7 4.4 107.6 2.4 99.0 9.2 Jan. 20172月 109.5 3.5 109.6 6.1 105.7 ▲ 1.8 106.7 3.9 Feb.3月 104.8 ▲ 4.3 136.5 2.6 103.7 ▲ 1.9 144.7 1.5 Mar.4月 112.7 7.5 100.1 8.9 109.6 5.7 95.5 5.2 Apr.5月 109.3 ▲ 3.0 99.8 7.3 107.8 ▲ 1.6 95.4 5.2 May6月 111.5 2.0 116.8 7.2 109.6 1.7 114.6 4.6 Jun.7月 109.0 ▲ 2.2 108.6 5.0 108.7 ▲ 0.8 105.6 4.6 Jul.8月 113.6 4.2 104.9 8.1 114.0 4.9 100.3 8.9 Aug.9月 109.9 ▲ 3.3 120.2 2.0 105.2 ▲ 7.7 121.3 ▲ 0.6 Sep.10月 112.7 2.5 107.8 7.9 107.1 1.8 102.0 3.6 Oct.11月 115.5 2.5 111.7 6.4 111.0 3.6 108.3 3.3 Nov.12月 119.1 3.1 117.8 8.6 116.1 4.6 113.3 10.2 Dec.
平成30 年 1月 109.6 ▲ 8.0 103.0 5.4 113.9 ▲ 1.9 106.9 8.0 Jan. 2018
前月(期)比%Change From
PreviousMonth(Quarter)
前年(同月期)比
%Change FromPrevious Year
前月(期)比%Change From
PreviousMonth(Quarter)
前年(同月期)比
%Change FromPrevious Year
平成 27 年 149.5 17.5 114.8 20.6 C.Y. 201528 年 132.2 ▲ 11.6 112.1 ▲ 2.4 201629 年 129.3 ▲ 2.2 104.7 ▲ 6.6 2017
平成 26 年度 124.7 23.5 97.2 0.7 F.Y. 201427 年度 129.6 3.9 117.1 20.5 201528 年度 116.6 ▲ 10.0 110.8 ▲ 5.4 2016
平成28 年 Ⅳ期 135.7 ▲ 1.7 132.2 ▲ 11.6 109.5 ▲ 1.4 111.5 ▲ 7.6 Q4 2016平成29 年 Ⅰ期 135.1 ▲ 0.4 116.6 ▲ 10.0 107.8 ▲ 1.6 101.0 ▲ 5.1 Q1 2017
Ⅱ期 131.7 ▲ 2.5 134.5 ▲ 5.5 106.2 ▲ 1.5 109.8 ▲ 6.9 Q2Ⅲ期 128.5 ▲ 2.4 125.5 ▲ 7.0 102.3 ▲ 3.7 103.6 ▲ 8.1 Q3Ⅳ期 132.7 3.3 129.3 ▲ 2.2 102.5 0.2 104.4 ▲ 6.4 Q4
平成28 年 11月 135.7 0.8 137.4 ▲ 11.6 108.5 ▲ 2.9 112.1 ▲ 8.6 Nov. 201612月 135.7 0.0 132.2 ▲ 11.6 108.3 ▲ 0.2 107.4 ▲ 9.0 Dec.
平成29 年 1月 132.1 ▲ 2.7 138.7 ▲ 10.5 112.7 4.1 126.9 ▲ 2.5 Jan. 20172月 131.0 ▲ 0.8 137.3 ▲ 8.1 104.9 ▲ 6.9 103.9 ▲ 4.9 Feb.3月 135.1 3.1 116.6 ▲ 10.0 105.9 1.0 72.2 ▲ 9.6 Mar.4月 138.1 2.2 126.0 ▲ 4.7 113.3 7.0 113.5 ▲ 2.6 Apr.5月 132.7 ▲ 3.9 130.9 ▲ 6.7 101.2 ▲ 10.7 115.4 ▲ 11.4 May6月 131.7 ▲ 0.8 134.5 ▲ 5.5 104.0 2.8 100.4 ▲ 6.1 Jun.7月 127.4 ▲ 3.3 137.5 ▲ 5.2 103.1 ▲ 0.9 107.4 ▲ 7.9 Jul.8月 131.4 3.1 140.1 ▲ 4.7 100.4 ▲ 2.6 115.7 ▲ 9.7 Aug.9月 128.5 ▲ 2.2 125.5 ▲ 7.0 103.5 3.1 87.8 ▲ 6.1 Sep.10月 131.7 2.5 133.1 ▲ 2.1 106.1 2.5 109.3 ▲ 5.0 Oct.11月 134.3 2.0 136.0 ▲ 1.0 102.4 ▲ 3.5 105.8 ▲ 5.6 Nov.12月 132.7 ▲ 1.2 129.3 ▲ 2.2 99.0 ▲ 3.3 98.1 ▲ 8.7 Dec.
平成30 年 1月 128.5 ▲ 3.2 134.9 ▲ 2.7 102.9 3.9 115.9 ▲ 8.7 Jan. 2018
生産者在庫 Inventory 生産者在庫率 Inventory Ratio季節調整済指数Seasonally Adjusted
Index
原指数Original Index
季節調整済指数Seasonally Adjusted
Index
原指数Original Index
平成22年 =100index,2010= 100
生産 Production 生産者出荷 Shipments季節調整済指数Seasonally Adjusted
Index
原指数Original Index
季節調整済指数Seasonally Adjusted
Index
原指数Original Index
21
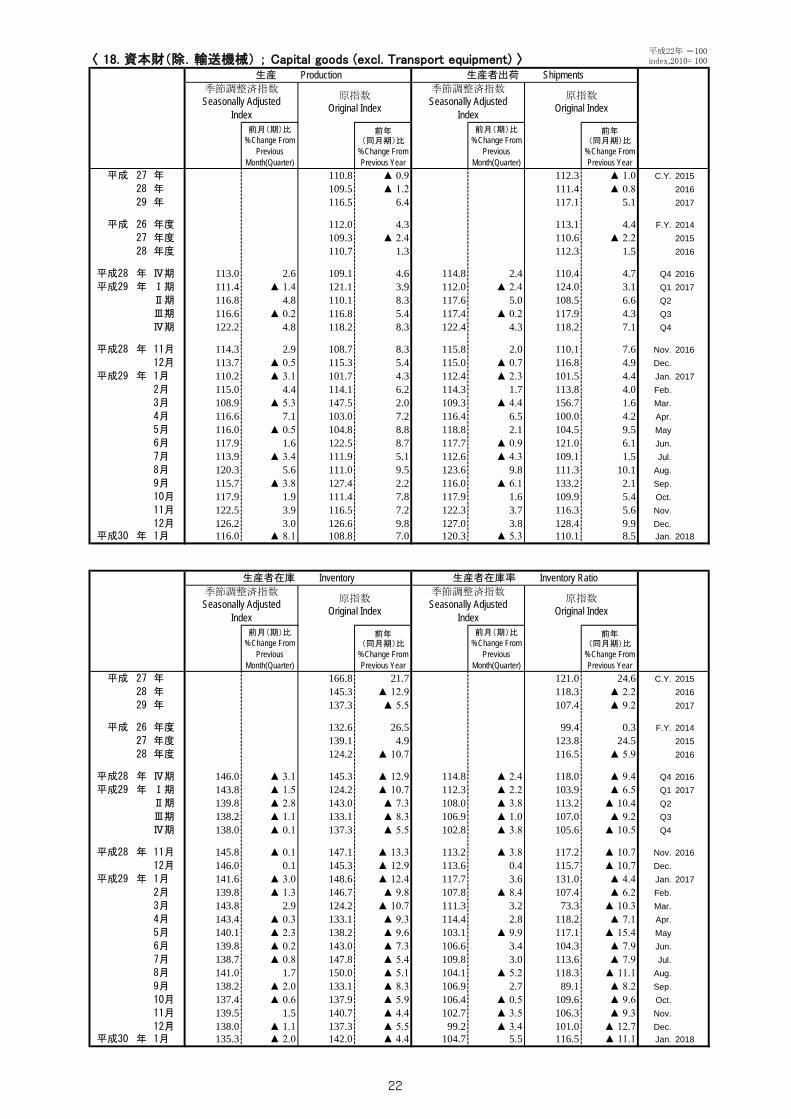
〈 18. 資本財(除.輸送機械) ; Capital goods (excl. Transport equipment) 〉
前月(期)比%Change From
PreviousMonth(Quarter)
前年(同月期)比
%Change FromPrevious Year
前月(期)比%Change From
PreviousMonth(Quarter)
前年(同月期)比
%Change FromPrevious Year
平成 27 年 110.8 ▲ 0.9 112.3 ▲ 1.0 C.Y. 201528 年 109.5 ▲ 1.2 111.4 ▲ 0.8 201629 年 116.5 6.4 117.1 5.1 2017
平成 26 年度 112.0 4.3 113.1 4.4 F.Y. 201427 年度 109.3 ▲ 2.4 110.6 ▲ 2.2 201528 年度 110.7 1.3 112.3 1.5 2016
平成28 年 Ⅳ期 113.0 2.6 109.1 4.6 114.8 2.4 110.4 4.7 Q4 2016平成29 年 Ⅰ期 111.4 ▲ 1.4 121.1 3.9 112.0 ▲ 2.4 124.0 3.1 Q1 2017
Ⅱ期 116.8 4.8 110.1 8.3 117.6 5.0 108.5 6.6 Q2Ⅲ期 116.6 ▲ 0.2 116.8 5.4 117.4 ▲ 0.2 117.9 4.3 Q3Ⅳ期 122.2 4.8 118.2 8.3 122.4 4.3 118.2 7.1 Q4
平成28 年 11月 114.3 2.9 108.7 8.3 115.8 2.0 110.1 7.6 Nov. 201612月 113.7 ▲ 0.5 115.3 5.4 115.0 ▲ 0.7 116.8 4.9 Dec.
平成29 年 1月 110.2 ▲ 3.1 101.7 4.3 112.4 ▲ 2.3 101.5 4.4 Jan. 20172月 115.0 4.4 114.1 6.2 114.3 1.7 113.8 4.0 Feb.3月 108.9 ▲ 5.3 147.5 2.0 109.3 ▲ 4.4 156.7 1.6 Mar.4月 116.6 7.1 103.0 7.2 116.4 6.5 100.0 4.2 Apr.5月 116.0 ▲ 0.5 104.8 8.8 118.8 2.1 104.5 9.5 May6月 117.9 1.6 122.5 8.7 117.7 ▲ 0.9 121.0 6.1 Jun.7月 113.9 ▲ 3.4 111.9 5.1 112.6 ▲ 4.3 109.1 1.5 Jul.8月 120.3 5.6 111.0 9.5 123.6 9.8 111.3 10.1 Aug.9月 115.7 ▲ 3.8 127.4 2.2 116.0 ▲ 6.1 133.2 2.1 Sep.10月 117.9 1.9 111.4 7.8 117.9 1.6 109.9 5.4 Oct.11月 122.5 3.9 116.5 7.2 122.3 3.7 116.3 5.6 Nov.12月 126.2 3.0 126.6 9.8 127.0 3.8 128.4 9.9 Dec.
平成30 年 1月 116.0 ▲ 8.1 108.8 7.0 120.3 ▲ 5.3 110.1 8.5 Jan. 2018
前月(期)比%Change From
PreviousMonth(Quarter)
前年(同月期)比
%Change FromPrevious Year
前月(期)比%Change From
PreviousMonth(Quarter)
前年(同月期)比
%Change FromPrevious Year
平成 27 年 166.8 21.7 121.0 24.6 C.Y. 201528 年 145.3 ▲ 12.9 118.3 ▲ 2.2 201629 年 137.3 ▲ 5.5 107.4 ▲ 9.2 2017
平成 26 年度 132.6 26.5 99.4 0.3 F.Y. 201427 年度 139.1 4.9 123.8 24.5 201528 年度 124.2 ▲ 10.7 116.5 ▲ 5.9 2016
平成28 年 Ⅳ期 146.0 ▲ 3.1 145.3 ▲ 12.9 114.8 ▲ 2.4 118.0 ▲ 9.4 Q4 2016平成29 年 Ⅰ期 143.8 ▲ 1.5 124.2 ▲ 10.7 112.3 ▲ 2.2 103.9 ▲ 6.5 Q1 2017
Ⅱ期 139.8 ▲ 2.8 143.0 ▲ 7.3 108.0 ▲ 3.8 113.2 ▲ 10.4 Q2Ⅲ期 138.2 ▲ 1.1 133.1 ▲ 8.3 106.9 ▲ 1.0 107.0 ▲ 9.2 Q3Ⅳ期 138.0 ▲ 0.1 137.3 ▲ 5.5 102.8 ▲ 3.8 105.6 ▲ 10.5 Q4
平成28 年 11月 145.8 ▲ 0.1 147.1 ▲ 13.3 113.2 ▲ 3.8 117.2 ▲ 10.7 Nov. 201612月 146.0 0.1 145.3 ▲ 12.9 113.6 0.4 115.7 ▲ 10.7 Dec.
平成29 年 1月 141.6 ▲ 3.0 148.6 ▲ 12.4 117.7 3.6 131.0 ▲ 4.4 Jan. 20172月 139.8 ▲ 1.3 146.7 ▲ 9.8 107.8 ▲ 8.4 107.4 ▲ 6.2 Feb.3月 143.8 2.9 124.2 ▲ 10.7 111.3 3.2 73.3 ▲ 10.3 Mar.4月 143.4 ▲ 0.3 133.1 ▲ 9.3 114.4 2.8 118.2 ▲ 7.1 Apr.5月 140.1 ▲ 2.3 138.2 ▲ 9.6 103.1 ▲ 9.9 117.1 ▲ 15.4 May6月 139.8 ▲ 0.2 143.0 ▲ 7.3 106.6 3.4 104.3 ▲ 7.9 Jun.7月 138.7 ▲ 0.8 147.8 ▲ 5.4 109.8 3.0 113.6 ▲ 7.9 Jul.8月 141.0 1.7 150.0 ▲ 5.1 104.1 ▲ 5.2 118.3 ▲ 11.1 Aug.9月 138.2 ▲ 2.0 133.1 ▲ 8.3 106.9 2.7 89.1 ▲ 8.2 Sep.10月 137.4 ▲ 0.6 137.9 ▲ 5.9 106.4 ▲ 0.5 109.6 ▲ 9.6 Oct.11月 139.5 1.5 140.7 ▲ 4.4 102.7 ▲ 3.5 106.3 ▲ 9.3 Nov.12月 138.0 ▲ 1.1 137.3 ▲ 5.5 99.2 ▲ 3.4 101.0 ▲ 12.7 Dec.
平成30 年 1月 135.3 ▲ 2.0 142.0 ▲ 4.4 104.7 5.5 116.5 ▲ 11.1 Jan. 2018
生産者在庫 Inventory 生産者在庫率 Inventory Ratio季節調整済指数Seasonally Adjusted
Index
原指数Original Index
季節調整済指数Seasonally Adjusted
Index
原指数Original Index
平成22年 =100index,2010= 100
生産 Production 生産者出荷 Shipments季節調整済指数Seasonally Adjusted
Index
原指数Original Index
季節調整済指数Seasonally Adjusted
Index
原指数Original Index
22
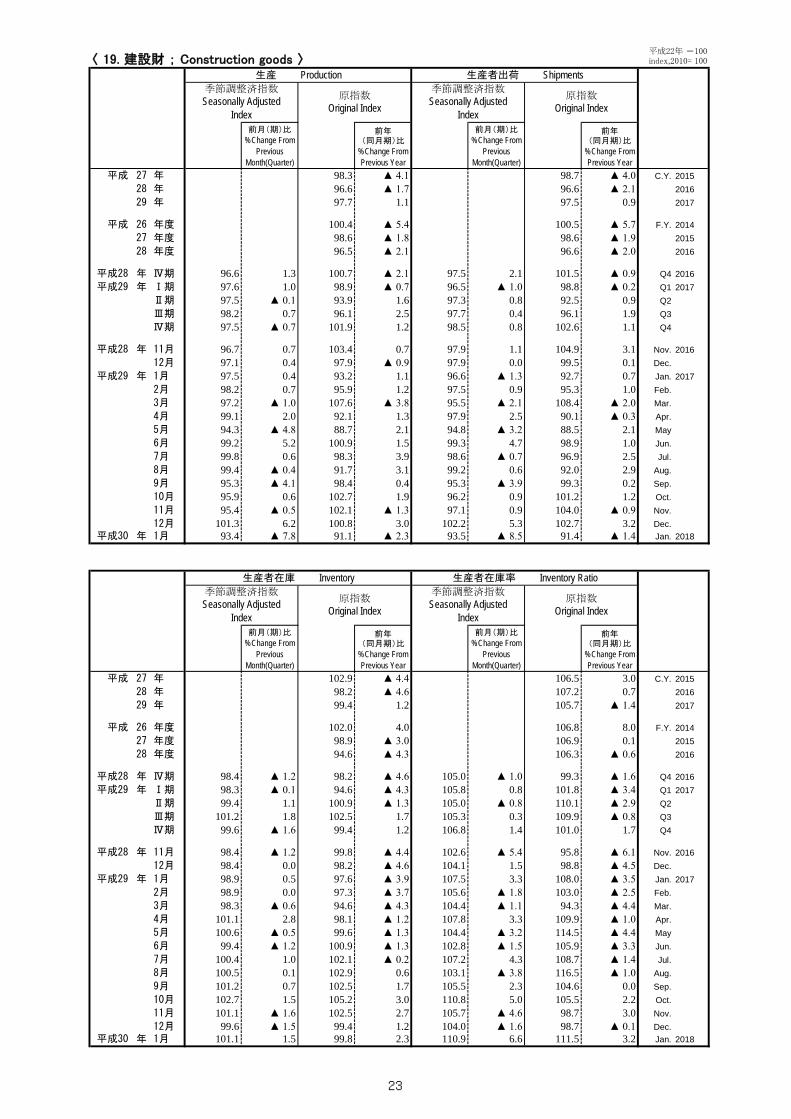
〈 19. 建設財 ; Construction goods 〉
前月(期)比%Change From
PreviousMonth(Quarter)
前年(同月期)比
%Change FromPrevious Year
前月(期)比%Change From
PreviousMonth(Quarter)
前年(同月期)比
%Change FromPrevious Year
平成 27 年 98.3 ▲ 4.1 98.7 ▲ 4.0 C.Y. 201528 年 96.6 ▲ 1.7 96.6 ▲ 2.1 201629 年 97.7 1.1 97.5 0.9 2017
平成 26 年度 100.4 ▲ 5.4 100.5 ▲ 5.7 F.Y. 201427 年度 98.6 ▲ 1.8 98.6 ▲ 1.9 201528 年度 96.5 ▲ 2.1 96.6 ▲ 2.0 2016
平成28 年 Ⅳ期 96.6 1.3 100.7 ▲ 2.1 97.5 2.1 101.5 ▲ 0.9 Q4 2016平成29 年 Ⅰ期 97.6 1.0 98.9 ▲ 0.7 96.5 ▲ 1.0 98.8 ▲ 0.2 Q1 2017
Ⅱ期 97.5 ▲ 0.1 93.9 1.6 97.3 0.8 92.5 0.9 Q2Ⅲ期 98.2 0.7 96.1 2.5 97.7 0.4 96.1 1.9 Q3Ⅳ期 97.5 ▲ 0.7 101.9 1.2 98.5 0.8 102.6 1.1 Q4
平成28 年 11月 96.7 0.7 103.4 0.7 97.9 1.1 104.9 3.1 Nov. 201612月 97.1 0.4 97.9 ▲ 0.9 97.9 0.0 99.5 0.1 Dec.
平成29 年 1月 97.5 0.4 93.2 1.1 96.6 ▲ 1.3 92.7 0.7 Jan. 20172月 98.2 0.7 95.9 1.2 97.5 0.9 95.3 1.0 Feb.3月 97.2 ▲ 1.0 107.6 ▲ 3.8 95.5 ▲ 2.1 108.4 ▲ 2.0 Mar.4月 99.1 2.0 92.1 1.3 97.9 2.5 90.1 ▲ 0.3 Apr.5月 94.3 ▲ 4.8 88.7 2.1 94.8 ▲ 3.2 88.5 2.1 May6月 99.2 5.2 100.9 1.5 99.3 4.7 98.9 1.0 Jun.7月 99.8 0.6 98.3 3.9 98.6 ▲ 0.7 96.9 2.5 Jul.8月 99.4 ▲ 0.4 91.7 3.1 99.2 0.6 92.0 2.9 Aug.9月 95.3 ▲ 4.1 98.4 0.4 95.3 ▲ 3.9 99.3 0.2 Sep.10月 95.9 0.6 102.7 1.9 96.2 0.9 101.2 1.2 Oct.11月 95.4 ▲ 0.5 102.1 ▲ 1.3 97.1 0.9 104.0 ▲ 0.9 Nov.12月 101.3 6.2 100.8 3.0 102.2 5.3 102.7 3.2 Dec.
平成30 年 1月 93.4 ▲ 7.8 91.1 ▲ 2.3 93.5 ▲ 8.5 91.4 ▲ 1.4 Jan. 2018
前月(期)比%Change From
PreviousMonth(Quarter)
前年(同月期)比
%Change FromPrevious Year
前月(期)比%Change From
PreviousMonth(Quarter)
前年(同月期)比
%Change FromPrevious Year
平成 27 年 102.9 ▲ 4.4 106.5 3.0 C.Y. 201528 年 98.2 ▲ 4.6 107.2 0.7 201629 年 99.4 1.2 105.7 ▲ 1.4 2017
平成 26 年度 102.0 4.0 106.8 8.0 F.Y. 201427 年度 98.9 ▲ 3.0 106.9 0.1 201528 年度 94.6 ▲ 4.3 106.3 ▲ 0.6 2016
平成28 年 Ⅳ期 98.4 ▲ 1.2 98.2 ▲ 4.6 105.0 ▲ 1.0 99.3 ▲ 1.6 Q4 2016平成29 年 Ⅰ期 98.3 ▲ 0.1 94.6 ▲ 4.3 105.8 0.8 101.8 ▲ 3.4 Q1 2017
Ⅱ期 99.4 1.1 100.9 ▲ 1.3 105.0 ▲ 0.8 110.1 ▲ 2.9 Q2Ⅲ期 101.2 1.8 102.5 1.7 105.3 0.3 109.9 ▲ 0.8 Q3Ⅳ期 99.6 ▲ 1.6 99.4 1.2 106.8 1.4 101.0 1.7 Q4
平成28 年 11月 98.4 ▲ 1.2 99.8 ▲ 4.4 102.6 ▲ 5.4 95.8 ▲ 6.1 Nov. 201612月 98.4 0.0 98.2 ▲ 4.6 104.1 1.5 98.8 ▲ 4.5 Dec.
平成29 年 1月 98.9 0.5 97.6 ▲ 3.9 107.5 3.3 108.0 ▲ 3.5 Jan. 20172月 98.9 0.0 97.3 ▲ 3.7 105.6 ▲ 1.8 103.0 ▲ 2.5 Feb.3月 98.3 ▲ 0.6 94.6 ▲ 4.3 104.4 ▲ 1.1 94.3 ▲ 4.4 Mar.4月 101.1 2.8 98.1 ▲ 1.2 107.8 3.3 109.9 ▲ 1.0 Apr.5月 100.6 ▲ 0.5 99.6 ▲ 1.3 104.4 ▲ 3.2 114.5 ▲ 4.4 May6月 99.4 ▲ 1.2 100.9 ▲ 1.3 102.8 ▲ 1.5 105.9 ▲ 3.3 Jun.7月 100.4 1.0 102.1 ▲ 0.2 107.2 4.3 108.7 ▲ 1.4 Jul.8月 100.5 0.1 102.9 0.6 103.1 ▲ 3.8 116.5 ▲ 1.0 Aug.9月 101.2 0.7 102.5 1.7 105.5 2.3 104.6 0.0 Sep.10月 102.7 1.5 105.2 3.0 110.8 5.0 105.5 2.2 Oct.11月 101.1 ▲ 1.6 102.5 2.7 105.7 ▲ 4.6 98.7 3.0 Nov.12月 99.6 ▲ 1.5 99.4 1.2 104.0 ▲ 1.6 98.7 ▲ 0.1 Dec.
平成30 年 1月 101.1 1.5 99.8 2.3 110.9 6.6 111.5 3.2 Jan. 2018
生産者在庫 Inventory 生産者在庫率 Inventory Ratio季節調整済指数Seasonally Adjusted
Index
原指数Original Index
季節調整済指数Seasonally Adjusted
Index
原指数Original Index
平成22年 =100index,2010= 100
生産 Production 生産者出荷 Shipments季節調整済指数Seasonally Adjusted
Index
原指数Original Index
季節調整済指数Seasonally Adjusted
Index
原指数Original Index
23

〈 20. 耐久消費財 ; Durable consumer goods 〉
前月(期)比%Change From
PreviousMonth(Quarter)
前年(同月期)比
%Change FromPrevious Year
前月(期)比%Change From
PreviousMonth(Quarter)
前年(同月期)比
%Change FromPrevious Year
平成 27 年 84.0 ▲ 5.0 82.3 ▲ 4.1 C.Y. 201528 年 85.4 1.7 82.3 0.0 201629 年 86.8 1.6 84.8 3.0 2017
平成 26 年度 85.9 ▲ 6.6 83.9 ▲ 6.7 F.Y. 201427 年度 84.2 ▲ 2.0 81.6 ▲ 2.7 201528 年度 86.0 2.1 83.1 1.8 2016
平成28 年 Ⅳ期 88.0 2.2 87.4 2.5 85.4 3.0 86.3 3.5 Q4 2016平成29 年 Ⅰ期 86.0 ▲ 2.3 89.2 3.0 83.0 ▲ 2.8 88.2 4.0 Q1 2017
Ⅱ期 87.6 1.9 85.8 4.5 86.8 4.6 81.3 8.0 Q2Ⅲ期 86.9 ▲ 0.8 85.2 ▲ 0.4 84.6 ▲ 2.5 83.7 1.3 Q3Ⅳ期 87.9 1.2 87.2 ▲ 0.2 84.8 0.2 85.7 ▲ 0.7 Q4
平成28 年 11月 88.3 1.7 90.9 7.3 86.8 2.7 89.1 8.7 Nov. 201612月 88.8 0.6 85.8 3.5 85.0 ▲ 2.1 87.3 2.5 Dec.
平成29 年 1月 84.0 ▲ 5.4 80.3 0.9 80.4 ▲ 5.4 76.2 0.8 Jan. 20172月 88.0 4.8 88.7 5.7 85.0 5.7 88.3 6.8 Feb.3月 86.1 ▲ 2.2 98.6 2.3 83.7 ▲ 1.5 100.2 4.3 Mar.4月 93.1 8.1 83.3 7.8 90.1 7.6 78.4 9.8 Apr.5月 82.9 ▲ 11.0 78.6 2.7 83.4 ▲ 7.4 72.0 6.5 May6月 86.9 4.8 95.5 3.4 87.0 4.3 93.5 7.5 Jun.7月 85.3 ▲ 1.8 90.7 ▲ 1.5 84.3 ▲ 3.1 88.0 1.3 Jul.8月 87.0 2.0 75.8 0.9 85.8 1.8 74.0 3.6 Aug.9月 88.3 1.5 89.0 ▲ 0.2 83.7 ▲ 2.4 89.2 ▲ 0.4 Sep.10月 86.8 ▲ 1.7 88.0 2.9 82.8 ▲ 1.1 82.4 ▲ 0.1 Oct.11月 86.4 ▲ 0.5 88.9 ▲ 2.2 84.1 1.6 86.4 ▲ 3.0 Nov.12月 90.6 4.9 84.7 ▲ 1.3 87.5 4.0 88.4 1.3 Dec.
平成30 年 1月 78.4 ▲ 13.5 77.2 ▲ 3.9 77.5 ▲ 11.4 74.9 ▲ 1.7 Jan. 2018
前月(期)比%Change From
PreviousMonth(Quarter)
前年(同月期)比
%Change FromPrevious Year
前月(期)比%Change From
PreviousMonth(Quarter)
前年(同月期)比
%Change FromPrevious Year
平成 27 年 99.8 ▲ 18.3 109.5 ▲ 1.8 C.Y. 201528 年 89.1 ▲ 10.7 97.5 ▲ 11.0 201629 年 102.9 15.5 103.8 6.5 2017
平成 26 年度 93.5 14.7 119.1 31.6 F.Y. 201427 年度 82.6 ▲ 11.7 105.0 ▲ 11.8 201528 年度 85.4 3.4 97.5 ▲ 7.1 2016
平成28 年 Ⅳ期 90.1 ▲ 8.7 89.1 ▲ 10.7 88.3 ▲ 12.7 91.9 ▲ 13.7 Q4 2016平成29 年 Ⅰ期 104.7 16.2 85.4 3.4 102.5 16.1 96.3 ▲ 0.1 Q1 2017
Ⅱ期 101.3 ▲ 3.2 101.6 ▲ 0.9 105.5 2.9 103.4 6.5 Q2Ⅲ期 97.7 ▲ 3.6 94.7 ▲ 0.9 102.2 ▲ 3.1 105.6 0.8 Q3Ⅳ期 104.1 6.6 102.9 15.5 105.4 3.1 109.7 19.4 Q4
平成28 年 11月 89.0 ▲ 3.3 97.5 ▲ 12.7 86.6 ▲ 5.6 94.0 ▲ 17.7 Nov. 201612月 90.1 1.2 89.1 ▲ 10.7 86.7 0.1 81.9 ▲ 15.6 Dec.
平成29 年 1月 94.0 4.3 100.4 ▲ 4.6 99.5 14.8 115.6 ▲ 3.2 Jan. 20172月 94.5 0.5 96.4 0.7 100.0 0.5 96.7 0.1 Feb.3月 104.7 10.8 85.4 3.4 107.9 7.9 76.6 4.8 Mar.4月 106.0 1.2 92.4 6.3 102.2 ▲ 5.3 92.4 5.4 Apr.5月 107.4 1.3 106.5 6.0 111.9 9.5 121.5 14.0 May6月 101.3 ▲ 5.7 101.6 ▲ 0.9 102.5 ▲ 8.4 96.4 ▲ 0.5 Jun.7月 94.4 ▲ 6.8 100.6 ▲ 3.7 103.7 1.2 107.6 2.0 Jul.8月 95.4 1.1 99.8 ▲ 4.1 98.7 ▲ 4.8 117.8 ▲ 1.3 Aug.9月 97.7 2.4 94.7 ▲ 0.9 104.2 5.6 91.4 2.2 Sep.10月 101.9 4.3 108.1 10.8 103.1 ▲ 1.1 112.3 12.4 Oct.11月 104.4 2.5 114.4 17.3 109.7 6.4 119.1 26.7 Nov.12月 104.1 ▲ 0.3 102.9 15.5 103.3 ▲ 5.8 97.6 19.2 Dec.
平成30 年 1月 102.4 ▲ 1.6 109.4 9.0 112.5 8.9 130.7 13.1 Jan. 2018
生産者在庫 Inventory 生産者在庫率 Inventory Ratio季節調整済指数Seasonally Adjusted
Index
原指数Original Index
季節調整済指数Seasonally Adjusted
Index
原指数Original Index
平成22年 =100index,2010= 100
生産 Production 生産者出荷 Shipments季節調整済指数Seasonally Adjusted
Index
原指数Original Index
季節調整済指数Seasonally Adjusted
Index
原指数Original Index
24

〈 21. 非耐久消費財 ; Non-durable consumer goods 〉
前月(期)比%Change From
PreviousMonth(Quarter)
前年(同月期)比
%Change FromPrevious Year
前月(期)比%Change From
PreviousMonth(Quarter)
前年(同月期)比
%Change FromPrevious Year
平成 27 年 99.3 0.3 97.4 0.1 C.Y. 201528 年 103.2 3.9 99.2 1.8 201629 年 106.3 3.0 102.1 2.9 2017
平成 26 年度 98.0 ▲ 2.3 96.2 ▲ 3.0 F.Y. 201427 年度 100.5 2.6 98.3 2.2 201528 年度 103.9 3.4 99.5 1.2 2016
平成28 年 Ⅳ期 103.4 0.2 106.6 1.6 99.0 0.2 102.9 0.3 Q4 2016平成29 年 Ⅰ期 105.3 1.8 99.2 2.8 100.8 1.8 96.1 1.3 Q1 2017
Ⅱ期 106.6 1.2 107.5 2.8 103.6 2.8 102.7 3.8 Q2Ⅲ期 106.7 0.1 108.1 2.9 102.2 ▲ 1.4 103.3 3.2 Q3Ⅳ期 107.3 0.6 110.6 3.8 102.1 ▲ 0.1 106.3 3.3 Q4
平成28 年 11月 102.0 ▲ 2.8 105.1 2.3 99.0 ▲ 0.5 100.0 2.9 Nov. 201612月 103.3 1.3 105.7 0.8 98.4 ▲ 0.6 107.2 ▲ 1.1 Dec.
平成29 年 1月 103.3 0.0 89.1 2.8 99.8 1.4 86.8 2.4 Jan. 20172月 107.2 3.8 100.0 2.9 101.3 1.5 94.7 ▲ 0.7 Feb.3月 105.3 ▲ 1.8 108.4 2.7 101.2 ▲ 0.1 106.9 2.2 Mar.4月 107.2 1.8 107.0 ▲ 0.6 103.8 2.6 102.4 0.5 Apr.5月 106.7 ▲ 0.5 103.4 6.1 104.2 0.4 100.8 6.9 May6月 106.0 ▲ 0.7 112.0 3.1 102.9 ▲ 1.2 104.9 4.3 Jun.7月 106.4 0.4 112.2 3.5 103.4 0.5 106.3 4.4 Jul.8月 104.4 ▲ 1.9 103.3 0.6 100.5 ▲ 2.8 101.5 2.7 Aug.9月 109.2 4.6 108.7 4.4 102.8 2.3 102.1 2.5 Sep.10月 107.5 ▲ 1.6 113.3 3.9 101.2 ▲ 1.6 104.5 2.9 Oct.11月 106.4 ▲ 1.0 109.6 4.3 102.3 1.1 103.4 3.4 Nov.12月 107.9 1.4 108.8 2.9 102.9 0.6 111.1 3.6 Dec.
平成30 年 1月 108.8 0.8 95.2 6.8 102.3 ▲ 0.6 89.9 3.6 Jan. 2018
前月(期)比%Change From
PreviousMonth(Quarter)
前年(同月期)比
%Change FromPrevious Year
前月(期)比%Change From
PreviousMonth(Quarter)
前年(同月期)比
%Change FromPrevious Year
平成 27 年 94.4 1.0 99.5 ▲ 1.7 C.Y. 201528 年 100.0 5.9 104.0 4.5 201629 年 105.6 5.6 106.5 2.4 2017
平成 26 年度 90.2 4.5 102.6 5.3 F.Y. 201427 年度 94.1 4.3 99.3 ▲ 3.2 201528 年度 100.8 7.1 105.6 6.3 2016
平成28 年 Ⅳ期 102.4 1.1 100.0 5.9 106.6 0.1 108.1 5.3 Q4 2016平成29 年 Ⅰ期 105.0 2.5 100.8 7.1 107.1 0.5 104.0 6.9 Q1 2017
Ⅱ期 104.2 ▲ 0.8 102.9 3.9 104.2 ▲ 2.7 101.5 1.9 Q2Ⅲ期 105.7 1.4 107.7 4.4 105.8 1.5 110.1 ▲ 0.6 Q3Ⅳ期 108.1 2.3 105.6 5.6 108.6 2.6 110.3 2.0 Q4
平成28 年 11月 99.9 ▲ 0.7 104.7 2.1 104.6 ▲ 1.7 113.9 0.8 Nov. 201612月 102.4 2.5 100.0 5.9 108.8 4.0 101.8 7.2 Dec.
平成29 年 1月 102.1 ▲ 0.3 102.9 4.6 107.0 ▲ 1.7 115.8 4.3 Jan. 20172月 104.3 2.2 104.6 9.0 108.4 1.3 106.5 11.6 Feb.3月 105.0 0.7 100.8 7.1 106.0 ▲ 2.2 89.8 4.9 Mar.4月 104.7 ▲ 0.3 102.4 6.3 105.9 ▲ 0.1 97.0 6.5 Apr.5月 103.9 ▲ 0.8 101.4 4.9 101.6 ▲ 4.1 101.4 ▲ 0.5 May6月 104.2 0.3 102.9 3.9 105.0 3.3 106.1 0.4 Jun.7月 103.4 ▲ 0.8 105.2 3.3 103.5 ▲ 1.4 108.9 ▲ 2.2 Jul.8月 105.9 2.4 105.9 2.0 105.8 2.2 111.5 ▲ 1.8 Aug.9月 105.7 ▲ 0.2 107.7 4.4 108.1 2.2 109.9 2.1 Sep.10月 106.7 0.9 109.8 6.1 107.9 ▲ 0.2 110.2 1.4 Oct.11月 107.3 0.6 112.4 7.4 109.5 1.5 119.2 4.7 Nov.12月 108.1 0.7 105.6 5.6 108.4 ▲ 1.0 101.4 ▲ 0.4 Dec.
平成30 年 1月 105.6 ▲ 2.3 106.4 3.4 109.6 1.1 118.6 2.4 Jan. 2018
生産者在庫 Inventory 生産者在庫率 Inventory Ratio季節調整済指数Seasonally Adjusted
Index
原指数Original Index
季節調整済指数Seasonally Adjusted
Index
原指数Original Index
平成22年 =100index,2010= 100
生産 Production 生産者出荷 Shipments季節調整済指数Seasonally Adjusted
Index
原指数Original Index
季節調整済指数Seasonally Adjusted
Index
原指数Original Index
25

〈 22. 生産財 ; Producer goods 〉
前月(期)比%Change From
PreviousMonth(Quarter)
前年(同月期)比
%Change FromPrevious Year
前月(期)比%Change From
PreviousMonth(Quarter)
前年(同月期)比
%Change FromPrevious Year
平成 27 年 97.7 ▲ 0.3 98.3 ▲ 0.2 C.Y. 201528 年 96.6 ▲ 1.1 97.1 ▲ 1.2 201629 年 101.9 5.5 101.4 4.4 2017
平成 26 年度 98.0 0.4 98.6 0.0 F.Y. 201427 年度 97.1 ▲ 0.9 97.6 ▲ 1.0 201528 年度 97.7 0.6 98.2 0.6 2016
平成28 年 Ⅳ期 99.0 2.4 100.4 1.9 99.9 2.7 101.5 1.9 Q4 2016平成29 年 Ⅰ期 100.0 1.0 100.2 4.7 99.9 0.0 101.1 4.6 Q1 2017
Ⅱ期 101.5 1.5 99.5 6.6 100.7 0.8 98.1 5.5 Q2Ⅲ期 102.3 0.8 102.2 5.4 102.2 1.5 101.7 4.6 Q3Ⅳ期 104.0 1.7 105.5 5.1 103.1 0.9 104.9 3.3 Q4
平成28 年 11月 99.2 1.5 101.9 3.8 99.9 1.1 102.6 4.2 Nov. 201612月 100.2 1.0 100.6 3.5 101.0 1.1 102.4 4.1 Dec.
平成29 年 1月 98.5 ▲ 1.7 95.6 3.8 98.5 ▲ 2.5 95.5 4.1 Jan. 20172月 101.2 2.7 97.5 4.8 101.4 2.9 98.1 4.4 Feb.3月 100.2 ▲ 1.0 107.6 5.4 99.9 ▲ 1.5 109.6 5.0 Mar.4月 103.0 2.8 99.3 6.5 102.0 2.1 97.4 5.3 Apr.5月 99.7 ▲ 3.2 95.7 7.3 98.6 ▲ 3.3 93.9 5.4 May6月 101.8 2.1 103.6 6.4 101.6 3.0 102.9 5.6 Jun.7月 101.6 ▲ 0.2 102.5 6.3 101.4 ▲ 0.2 101.4 4.9 Jul.8月 103.3 1.7 98.8 6.6 103.8 2.4 98.1 6.4 Aug.9月 102.1 ▲ 1.2 105.4 3.3 101.5 ▲ 2.2 105.6 2.7 Sep.10月 102.8 0.7 105.4 6.7 100.5 ▲ 1.0 102.9 3.3 Oct.11月 103.4 0.6 106.2 4.2 103.4 2.9 106.1 3.4 Nov.12月 105.9 2.4 104.9 4.3 105.5 2.0 105.6 3.1 Dec.
平成30 年 1月 99.5 ▲ 6.0 97.9 2.4 97.8 ▲ 7.3 96.3 0.8 Jan. 2018
前月(期)比%Change From
PreviousMonth(Quarter)
前年(同月期)比
%Change FromPrevious Year
前月(期)比%Change From
PreviousMonth(Quarter)
前年(同月期)比
%Change FromPrevious Year
平成 27 年 111.8 1.3 118.9 3.4 C.Y. 201528 年 107.3 ▲ 4.0 121.2 1.9 201629 年 107.4 0.1 116.8 ▲ 3.6 2017
平成 26 年度 106.2 1.1 116.1 1.2 F.Y. 201427 年度 110.0 3.6 120.7 4.0 201528 年度 104.2 ▲ 5.3 119.1 ▲ 1.3 2016
平成28 年 Ⅳ期 107.7 ▲ 2.0 107.3 ▲ 4.0 116.4 ▲ 3.7 114.4 ▲ 3.8 Q4 2016平成29 年 Ⅰ期 107.4 ▲ 0.3 104.2 ▲ 5.3 115.5 ▲ 0.8 115.6 ▲ 6.8 Q1 2017
Ⅱ期 108.8 1.3 108.4 ▲ 3.7 118.1 2.3 118.8 ▲ 4.5 Q2Ⅲ期 106.4 ▲ 2.2 106.8 ▲ 3.2 116.4 ▲ 1.4 117.6 ▲ 3.7 Q3Ⅳ期 107.8 1.3 107.4 0.1 117.3 0.8 115.3 0.8 Q4
平成28 年 11月 108.2 ▲ 1.4 108.1 ▲ 3.1 114.6 ▲ 4.3 112.8 ▲ 6.2 Nov. 201612月 107.7 ▲ 0.5 107.3 ▲ 4.0 114.9 0.3 112.8 ▲ 6.3 Dec.
平成29 年 1月 107.5 ▲ 0.2 110.0 ▲ 4.9 115.6 0.6 122.7 ▲ 7.3 Jan. 20172月 107.6 0.1 109.1 ▲ 5.4 116.2 0.5 120.9 ▲ 5.8 Feb.3月 107.4 ▲ 0.2 104.2 ▲ 5.3 114.8 ▲ 1.2 103.2 ▲ 7.2 Mar.4月 109.6 2.0 106.3 ▲ 2.7 119.9 4.4 116.3 ▲ 2.8 Apr.5月 110.5 0.8 110.4 ▲ 2.3 118.5 ▲ 1.2 124.4 ▲ 5.4 May6月 108.8 ▲ 1.5 108.4 ▲ 3.7 115.9 ▲ 2.2 115.6 ▲ 5.4 Jun.7月 109.1 0.3 109.0 ▲ 2.5 120.7 4.1 118.1 ▲ 2.2 Jul.8月 106.9 ▲ 2.0 109.8 ▲ 3.3 114.1 ▲ 5.5 122.2 ▲ 4.4 Aug.9月 106.4 ▲ 0.5 106.8 ▲ 3.2 114.5 0.4 112.5 ▲ 4.4 Sep.10月 110.1 3.5 110.2 0.4 121.0 5.7 119.0 1.1 Oct.11月 108.4 ▲ 1.5 108.3 0.2 114.4 ▲ 5.5 112.6 ▲ 0.2 Nov.12月 107.8 ▲ 0.6 107.4 0.1 116.4 1.7 114.3 1.3 Dec.
平成30 年 1月 107.9 0.1 110.4 0.4 117.7 1.1 124.9 1.8 Jan. 2018
生産者在庫 Inventory 生産者在庫率 Inventory Ratio季節調整済指数Seasonally Adjusted
Index
原指数Original Index
季節調整済指数Seasonally Adjusted
Index
原指数Original Index
平成22年 =100index,2010= 100
生産 Production 生産者出荷 Shipments季節調整済指数Seasonally Adjusted
Index
原指数Original Index
季節調整済指数Seasonally Adjusted
Index
原指数Original Index
26

〈 23. 鉱工業用生産財 ; For mining and manufacturing 〉
前月(期)比%Change From
PreviousMonth(Quarter)
前年(同月期)比
%Change FromPrevious Year
前月(期)比%Change From
PreviousMonth(Quarter)
前年(同月期)比
%Change FromPrevious Year
平成 27 年 98.4 ▲ 0.1 98.8 ▲ 0.2 C.Y. 201528 年 97.2 ▲ 1.2 97.6 ▲ 1.2 201629 年 103.0 6.0 102.5 5.0 2017
平成 26 年度 98.6 0.7 99.1 0.5 F.Y. 201427 年度 97.8 ▲ 0.8 98.1 ▲ 1.0 201528 年度 98.4 0.6 98.9 0.8 2016
平成28 年 Ⅳ期 99.9 2.7 101.1 2.0 100.7 3.0 102.1 2.0 Q4 2016平成29 年 Ⅰ期 100.8 0.9 101.2 5.1 100.9 0.2 101.9 5.2 Q1 2017
Ⅱ期 102.7 1.9 100.7 7.6 101.9 1.0 99.4 6.3 Q2Ⅲ期 103.5 0.8 103.6 5.9 103.1 1.2 102.8 4.9 Q3Ⅳ期 105.3 1.7 106.7 5.5 104.4 1.3 106.0 3.8 Q4
平成28 年 11月 100.0 1.5 102.6 3.8 100.7 1.3 103.4 4.3 Nov. 201612月 101.2 1.2 101.1 3.7 101.9 1.2 102.6 4.3 Dec.
平成29 年 1月 99.2 ▲ 2.0 96.7 3.9 99.3 ▲ 2.6 96.2 4.5 Jan. 20172月 102.1 2.9 98.3 5.2 102.4 3.1 98.9 5.3 Feb.3月 101.2 ▲ 0.9 108.5 6.0 101.1 ▲ 1.3 110.6 5.7 Mar.4月 104.5 3.3 100.2 7.4 103.4 2.3 98.5 6.1 Apr.5月 100.6 ▲ 3.7 96.7 7.9 99.2 ▲ 4.1 94.8 6.0 May6月 103.1 2.5 105.1 7.2 103.0 3.8 104.8 6.6 Jun.7月 102.7 ▲ 0.4 103.8 6.9 102.2 ▲ 0.8 102.4 5.0 Jul.8月 104.7 1.9 100.2 7.4 104.7 2.4 98.9 6.9 Aug.9月 103.2 ▲ 1.4 106.8 3.7 102.4 ▲ 2.2 107.1 3.1 Sep.10月 104.0 0.8 106.7 7.1 102.1 ▲ 0.3 104.7 4.3 Oct.11月 104.7 0.7 107.5 4.8 104.5 2.4 107.3 3.8 Nov.12月 107.3 2.5 105.9 4.7 106.7 2.1 106.1 3.4 Dec.
平成30 年 1月 100.4 ▲ 6.4 99.4 2.8 98.8 ▲ 7.4 97.2 1.0 Jan. 2018
前月(期)比%Change From
PreviousMonth(Quarter)
前年(同月期)比
%Change FromPrevious Year
前月(期)比%Change From
PreviousMonth(Quarter)
前年(同月期)比
%Change FromPrevious Year
平成 27 年 113.4 1.3 120.3 3.4 C.Y. 201528 年 109.3 ▲ 3.6 123.3 2.5 201629 年 109.3 0.0 118.3 ▲ 4.1 2017
平成 26 年度 108.1 0.9 117.3 0.8 F.Y. 201427 年度 112.5 4.1 122.3 4.3 201528 年度 106.1 ▲ 5.7 121.0 ▲ 1.1 2016
平成28 年 Ⅳ期 109.8 ▲ 1.9 109.3 ▲ 3.6 118.2 ▲ 3.7 116.6 ▲ 3.3 Q4 2016平成29 年 Ⅰ期 108.9 ▲ 0.8 106.1 ▲ 5.7 116.8 ▲ 1.2 117.6 ▲ 7.3 Q1 2017
Ⅱ期 110.3 1.3 110.3 ▲ 4.2 120.0 2.7 120.1 ▲ 5.0 Q2Ⅲ期 108.6 ▲ 1.5 108.5 ▲ 3.0 118.2 ▲ 1.5 118.7 ▲ 3.7 Q3Ⅳ期 109.8 1.1 109.3 0.0 118.5 0.3 116.9 0.3 Q4
平成28 年 11月 110.3 ▲ 1.4 110.1 ▲ 2.7 116.3 ▲ 4.5 115.0 ▲ 5.7 Nov. 201612月 109.8 ▲ 0.5 109.3 ▲ 3.6 116.6 0.3 115.0 ▲ 6.1 Dec.
平成29 年 1月 109.2 ▲ 0.5 111.8 ▲ 4.9 117.0 0.3 124.5 ▲ 7.4 Jan. 20172月 109.3 0.1 111.0 ▲ 5.7 117.3 0.3 123.0 ▲ 6.5 Feb.3月 108.9 ▲ 0.4 106.1 ▲ 5.7 116.0 ▲ 1.1 105.4 ▲ 7.9 Mar.4月 111.3 2.2 108.0 ▲ 3.1 121.5 4.7 117.9 ▲ 3.2 Apr.5月 112.3 0.9 112.3 ▲ 2.6 121.3 ▲ 0.2 126.2 ▲ 5.4 May6月 110.3 ▲ 1.8 110.3 ▲ 4.2 117.1 ▲ 3.5 116.3 ▲ 6.3 Jun.7月 111.3 0.9 111.1 ▲ 2.4 122.5 4.6 119.0 ▲ 2.5 Jul.8月 109.0 ▲ 2.1 111.7 ▲ 3.0 115.4 ▲ 5.8 123.3 ▲ 4.3 Aug.9月 108.6 ▲ 0.4 108.5 ▲ 3.0 116.6 1.0 113.9 ▲ 4.4 Sep.10月 111.9 3.0 111.7 0.0 122.0 4.6 119.9 0.2 Oct.11月 110.1 ▲ 1.6 109.9 ▲ 0.2 115.6 ▲ 5.2 114.3 ▲ 0.6 Nov.12月 109.8 ▲ 0.3 109.3 0.0 118.0 2.1 116.4 1.2 Dec.
平成30 年 1月 109.9 0.1 112.6 0.7 119.5 1.3 127.1 2.1 Jan. 2018
生産者在庫 Inventory 生産者在庫率 Inventory Ratio季節調整済指数Seasonally Adjusted
Index
原指数Original Index
季節調整済指数Seasonally Adjusted
Index
原指数Original Index
平成22年 =100index,2010= 100
生産 Production 生産者出荷 Shipments季節調整済指数Seasonally Adjusted
Index
原指数Original Index
季節調整済指数Seasonally Adjusted
Index
原指数Original Index
27

業種・財別 生産・出荷・在庫・在庫率 指数
12月 1月 12月 1月 12月 1月 12月 1月Dec. Jan. Dec. Jan. Dec. Jan. Dec. Jan.
鉱工業 106.5 99.5 ▲ 6.6 105.2 95.6 2.7 104.1 98.3 ▲ 5.6 104.8 93.9 2.1 製造工業 106.5 99.5 ▲ 6.6 105.2 95.6 2.7 104.1 98.3 ▲ 5.6 104.8 93.9 2.1 鉄鋼業 95.9 94.0 ▲ 2.0 94.0 94.8 1.5 98.3 94.2 ▲ 4.2 97.5 92.8 ▲ 0.9 非鉄金属工業 107.2 96.7 ▲ 9.8 102.3 94.7 2.0 105.0 91.3 ▲ 13.0 98.2 92.5 0.3 金属製品工業 99.6 88.3 ▲ 11.3 95.6 85.2 ▲ 3.4 99.6 90.8 ▲ 8.8 101.4 86.1 ▲ 2.3 はん用・生産用・業務用機械工業 133.4 123.0 ▲ 7.8 131.3 114.7 7.9 133.0 126.5 ▲ 4.9 132.2 115.3 10.1 はん用機械工業 111.0 103.4 ▲ 6.8 113.5 97.9 7.1 109.3 112.2 2.7 112.6 103.8 18.1 生産用機械工業 151.0 138.3 ▲ 8.4 148.5 129.5 9.3 152.9 141.3 ▲ 7.6 151.6 128.5 8.1 業務用機械工業 108.2 99.6 ▲ 7.9 100.8 93.3 2.6 112.9 105.7 ▲ 6.4 106.0 93.6 2.3 電子部品・デバイス工業 113.1 106.0 ▲ 6.3 112.9 103.1 2.1 120.6 111.6 ▲ 7.5 125.2 109.9 0.5 電気機械工業 107.3 98.8 ▲ 7.9 106.7 92.2 1.7 99.7 95.2 ▲ 4.5 105.2 87.9 1.3 情報通信機械工業 51.1 49.1 ▲ 3.9 53.3 47.9 0.0 41.5 43.7 5.3 47.5 40.7 ▲ 1.2 輸送機械工業 114.3 98.2 ▲ 14.1 106.8 98.5 0.6 110.3 99.1 ▲ 10.2 103.9 98.7 2.4 輸送機械工業(除.船舶・同機関、鉄道車両、航空機) 116.5 97.1 ▲ 16.7 107.0 98.4 0.7 114.3 96.7 ▲ 15.4 109.3 95.5 1.5 窯業・土石製品工業 101.5 100.4 ▲ 1.1 102.8 95.6 1.9 104.4 97.5 ▲ 6.6 107.2 94.0 0.4 化学工業 107.1 - - 108.3 - - 101.8 - - 104.2 - - 化学工業(除.医薬品) 105.3 103.9 ▲ 1.3 106.7 104.8 9.3 99.5 96.7 ▲ 2.8 102.4 93.9 3.0 石油・石炭製品工業 90.1 86.4 ▲ 4.1 98.6 92.9 ▲ 5.2 94.1 89.4 ▲ 5.0 104.5 95.2 ▲ 2.2 プラスチック製品工業 103.1 101.5 ▲ 1.6 100.1 94.8 2.4 101.9 98.6 ▲ 3.2 101.2 92.7 3.3 パルプ・紙・紙加工品工業 100.1 97.5 ▲ 2.6 101.5 91.7 ▲ 0.7 98.8 94.1 ▲ 4.8 101.0 87.5 ▲ 0.8 繊維工業 92.8 90.8 ▲ 2.2 90.4 88.0 0.7 94.4 90.2 ▲ 4.4 90.0 88.3 ▲ 1.0 食料品・たばこ工業 97.7 - - 104.2 - - 96.6 - - 107.8 - - その他工業 94.3 92.6 ▲ 1.8 92.7 85.8 1.5 97.5 93.5 ▲ 4.1 95.1 87.1 2.6 ゴム製品工業 97.7 93.2 ▲ 4.6 90.3 86.0 4.8 102.2 92.1 ▲ 9.9 93.0 86.3 4.4 家具工業 106.3 102.1 ▲ 4.0 107.8 100.6 2.3 102.6 101.3 ▲ 1.3 104.2 94.5 ▲ 0.5 印刷業 82.7 83.6 1.1 85.0 74.3 ▲ 3.3 82.6 83.5 1.1 84.9 74.2 ▲ 3.3 木材・木製品工業 102.3 - - 100.2 - - 101.7 - - 102.2 - - その他製品工業 104.3 103.7 ▲ 0.6 102.2 97.5 1.9 96.0 91.2 ▲ 5.0 96.5 84.6 1.7 鉱業 91.5 84.8 ▲ 7.3 99.7 93.2 ▲ 3.9 92.4 92.3 ▲ 0.1 103.1 103.7 4.1《参考》
産業総合(鉱工業、電力・ガス事業) 105.6 99.0 ▲ 6.2 104.9 96.1 2.8 103.4 97.9 ▲ 5.3 104.7 94.8 2.3 電力・ガス事業 92.7 91.9 ▲ 0.9 100.6 105.0 3.9 94.4 93.5 ▲ 1.0 102.8 107.6 4.0鉱工業 106.5 99.5 ▲ 6.6 105.2 95.6 2.7 104.1 98.3 ▲ 5.6 104.8 93.9 2.1 最終需要財 107.2 99.5 ▲ 7.2 105.5 93.3 3.0 102.5 98.1 ▲ 4.3 104.0 91.4 3.3 投資財 115.1 105.1 ▲ 8.7 113.8 100.2 3.7 113.1 108.9 ▲ 3.7 110.7 103.2 5.8 資本財 119.1 109.6 ▲ 8.0 117.8 103.0 5.4 116.1 113.9 ▲ 1.9 113.3 106.9 8.0 資本財(除.輸送機械) 126.2 116.0 ▲ 8.1 126.6 108.8 7.0 127.0 120.3 ▲ 5.3 128.4 110.1 8.5 建設財 101.3 93.4 ▲ 7.8 100.8 91.1 ▲ 2.3 102.2 93.5 ▲ 8.5 102.7 91.4 ▲ 1.4 消費財 99.9 93.9 ▲ 6.0 97.5 86.7 2.0 94.0 88.1 ▲ 6.3 98.3 81.4 0.7 耐久消費財 90.6 78.4 ▲ 13.5 84.7 77.2 ▲ 3.9 87.5 77.5 ▲ 11.4 88.4 74.9 ▲ 1.7 非耐久消費財 107.9 108.8 0.8 108.8 95.2 6.8 102.9 102.3 ▲ 0.6 111.1 89.9 3.6 生産財 105.9 99.5 ▲ 6.0 104.9 97.9 2.4 105.5 97.8 ▲ 7.3 105.6 96.3 0.8 鉱工業用生産財 107.3 100.4 ▲ 6.4 105.9 99.4 2.8 106.7 98.8 ▲ 7.4 106.1 97.2 1.0 その他用生産財 90.5 88.8 ▲ 1.9 94.4 82.2 ▲ 1.4 94.6 89.9 ▲ 5.0 101.5 88.7 ▲ 0.8
業
種
分
類
財
分
類
分 類
生 産 Production 生産者出荷 Shipments
前年同月比%Change FromPrevious Year
前 月 比%Change FromPrevious Month
前年同月比%Change FromPrevious Year
季節調整済指数Seasonally Adjusted Index
原 指 数Original Index
季節調整済指数Seasonally Adjusted Index
原 指 数Original Index
前 月 比%Change FromPrevious Month
28

Indices of Industrial Production,Producer's Shipments,Producer's Inventory of Finished Goods and Producer's Inventory Ratio of Finished Goods (Classification by Industry, Classification by Use of Goods)
12月 1月 12月 1月 12月 1月 12月 1月Dec. Jan. Dec. Jan. Dec. Jan. Dec. Jan.
109.5 108.8 ▲ 0.6 108.6 111.9 1.4 110.5 113.8 3.0 107.5 122.6 2.0 Mining and manufacturing109.5 108.8 ▲ 0.6 108.6 111.9 1.4 110.5 113.9 3.1 107.5 122.6 2.0 Manufacturing111.0 109.5 ▲ 1.4 112.3 113.3 ▲ 6.6 118.4 114.5 ▲ 3.3 117.3 118.5 ▲ 4.7 Iron and steel101.1 103.6 2.5 104.9 107.8 ▲ 2.4 98.0 110.6 12.9 107.7 117.1 ▲ 3.8 Non-ferrous metals121.6 119.0 ▲ 2.1 112.3 112.1 2.0 133.3 131.3 ▲ 1.5 120.9 144.6 4.0 Fabricated metals133.8 131.9 ▲ 1.4 132.6 136.3 ▲ 4.8 102.8 107.8 4.9 104.2 118.8 ▲ 11.2 General-purpose, production and business oriented machinery
116.1 111.7 ▲ 3.8 116.6 116.6 ▲ 0.3 121.2 115.7 ▲ 4.5 129.8 128.0 ▲ 0.6 General-purpose machinery144.4 144.1 ▲ 0.2 144.8 149.5 ▲ 6.6 91.8 103.1 12.3 93.0 110.1 ▲ 17.3 Production machinery116.7 111.6 ▲ 4.4 110.5 115.2 ▲ 2.4 114.2 113.2 ▲ 0.9 108.9 135.6 ▲ 4.7 Business oriented machinery
92.5 91.4 ▲ 1.2 88.5 93.7 7.3 111.5 109.7 ▲ 1.6 106.7 122.7 8.6 Electronic parts and devices181.2 179.3 ▲ 1.0 167.3 172.0 9.3 172.9 173.2 0.2 147.1 185.0 15.0 Electrical machinery92.8 89.0 ▲ 4.1 90.9 96.4 22.6 170.5 168.8 ▲ 1.0 131.1 198.9 23.9 Information and communication electronics equipment
88.5 86.4 ▲ 2.4 90.3 99.0 8.8 84.5 91.9 8.8 84.4 107.3 7.2 Transport equipment88.5 86.4 ▲ 2.4 90.3 99.0 8.8 84.5 91.9 8.8 84.4 107.3 7.2 Transport equipment (excl. ships and ship engines, rail vehicle and aircraft)
105.4 107.3 1.8 105.2 107.1 5.6 107.9 116.3 7.8 101.5 117.1 3.7 Ceramics, stone and clay products107.8 - - 107.5 - - 116.4 - - 113.7 - - Chemicals107.8 108.1 0.3 107.5 113.1 5.7 116.4 118.3 1.6 113.7 129.0 7.9 Chemicals (excl. Drugs)
77.5 77.2 ▲ 0.4 77.9 79.4 ▲ 7.0 85.8 89.6 4.4 74.2 83.4 ▲ 1.2 Petroleum and coal products113.9 113.8 ▲ 0.1 111.9 113.2 4.9 114.0 110.9 ▲ 2.7 109.4 122.4 2.0 Plastic products108.3 108.7 0.4 104.9 109.2 2.2 122.0 125.1 2.5 117.0 131.7 5.0 Pulp, paper and paper products105.1 105.9 0.8 109.4 110.8 ▲ 4.1 115.4 118.2 2.4 126.6 122.4 ▲ 3.1 Textiles116.7 - - 107.1 - - 118.0 - - 103.4 - - Foods and tobacco
94.5 91.9 ▲ 2.8 94.0 94.4 ▲ 4.6 95.0 94.2 ▲ 0.8 94.7 102.9 ▲ 6.8 Other manufacturing93.9 85.5 ▲ 8.9 87.5 82.0 ▲ 13.7 96.9 95.1 ▲ 1.9 95.2 98.7 ▲ 12.6 Rubber products
110.1 109.3 ▲ 0.7 120.3 127.6 4.3 104.9 105.4 0.5 109.7 127.4 3.6 Furniture- - - - - - - - - - - - Printing
88.6 - - 85.4 - - 88.1 - - 84.1 - - Wood and wood products81.9 82.1 0.2 85.5 87.8 ▲ 6.7 89.8 89.3 ▲ 0.6 91.5 101.5 ▲ 7.3 Other products
103.4 101.3 ▲ 2.0 105.2 101.6 3.4 124.9 115.1 ▲ 7.8 119.2 117.9 ▲ 2.3 Mining
109.5 108.8 ▲ 0.6 108.6 111.9 1.4 110.5 113.8 3.0 107.5 122.6 2.0 Industries (Mining and manufacturing, Electricity and gas)
- - - - - - - - - - - - Electricity and gas109.5 108.8 ▲ 0.6 108.6 111.9 1.4 110.5 113.8 3.0 107.5 122.6 2.0 Mining and manufacturing111.8 109.9 ▲ 1.7 110.0 113.8 2.7 103.1 108.8 5.5 98.8 119.7 2.2 Final demand goods118.3 116.7 ▲ 1.4 116.3 119.7 ▲ 1.0 100.9 106.3 5.4 98.3 113.9 ▲ 3.9 Investment goods132.7 128.5 ▲ 3.2 129.3 134.9 ▲ 2.7 99.0 102.9 3.9 98.1 115.9 ▲ 8.7 Capital goods138.0 135.3 ▲ 2.0 137.3 142.0 ▲ 4.4 99.2 104.7 5.5 101.0 116.5 ▲ 11.1 Capital goods (excl. Transport equipment)99.6 101.1 1.5 99.4 99.8 2.3 104.0 110.9 6.6 98.7 111.5 3.2 Construction goods
105.8 103.4 ▲ 2.3 104.0 108.2 6.7 105.3 110.7 5.1 99.2 125.5 8.5 Consumer goods104.1 102.4 ▲ 1.6 102.9 109.4 9.0 103.3 112.5 8.9 97.6 130.7 13.1 Durable consumer goods108.1 105.6 ▲ 2.3 105.6 106.4 3.4 108.4 109.6 1.1 101.4 118.6 2.4 Non-durable consumer goods107.8 107.9 0.1 107.4 110.4 0.4 116.4 117.7 1.1 114.3 124.9 1.8 Producer goods109.8 109.9 0.1 109.3 112.6 0.7 118.0 119.5 1.3 116.4 127.1 2.1 For mining and manufacturing
88.0 86.3 ▲ 1.9 88.4 87.9 ▲ 3.7 99.3 98.6 ▲ 0.7 92.8 102.8 ▲ 1.7 For other uses
前 月 比%Change FromPrevious Month
前年同月比%Change FromPrevious Year
生産者在庫率 Inventory Ratio
前 月 比%Change FromPrevious Month
前年同月比%Change FromPrevious Year
生産者在庫 Inventory
Classification
季節調整済指数Seasonally Adjusted Index
原 指 数Original Index
季節調整済指数Seasonally Adjusted Index
原 指 数Original Index
29

(2)実現率及び予測修正率Percent change from previous month (Seasonally Adjusted) Realization Ratio and
(%) Amendment Ratio (%)
9.0 ▲ 2.7
Manufacturing( ▲ 4.3 ) ( 5.7 )
鉄 鋼 業 ▲ 0.4 ▲ 2.5
Iron and steel ( 4.4 ) ( 1.6 )
非 鉄 金 属 工 業 7.3 ▲ 3.2
Non-ferrous metals ( ▲ 1.5 ) ( 2.7 )
金 属 製 品 工 業 11.5 ▲ 3.9
Fabricated metals ( ▲ 7.3 ) ( 4.6 )
はん用・生産用・業務用機械工業 12.2 ▲ 0.5
( ▲ 3.6 ) ( 8.3 )
電 子 部 品 ・ デ バ イ ス 工 業 16.0 ▲ 10.8
Electronic parts and devices ( 4.8 ) ( 13.5 )
電 気 機 械 工 業 9.9 ▲ 11.4
Electrical machinery ( 1.0 ) ( 4.2 )
情 報 通 信 機 械 工 業 0.0 ▲ 9.7
( 1.3 ) ( ▲ 0.2 )
輸 送 機 械 工 業 13.6 ▲ 3.3
Transport equipment ( ▲ 17.7 ) ( 9.8 )
化 学 工 業 2.4 1.4
Chemicals ( 1.0 ) ( ▲ 0.4 )
紙 ・ パ ル プ 工 業 2.5 0.2
Pulp and paper ( 0.2 ) ( 1.2 )
そ の 他 ▲ 0.1 ▲ 1.7
Others ( 0.8 ) ( ▲ 2.6 )
7.8 13.1Manufacturing (Original)
(前月調査による前月比) ( ▲ 4.8 ) ( 4.6 )
※ ( )内は前月調査による前月比を示す。 Parentheses indicate the percent change from previous month in the previous survey.
※ 調査票の提出期日は毎月10日となっている。 The deadline of submission from principal entrepreneurs is the 10th of month.
製 造 工 業 (原系列)
▲ 2.6 ▲ 1.3
▲ 3.2 ▲ 0.8
( 参 考 )
1.2
1.3
Information and communicationelectronics equipment
Survey of Production Forecast, February 2018
Amendment Ratio
▲ 4.7 1.6
2月 Feb.
0.4
見込み
2.4
▲ 1.1
▲ 7.1
▲ 2.6
Next Month Realization Ratio
▲ 4.7
▲ 0.5
▲ 9.2
業
種
別
製 造 工 業 ▲ 3.7
General-purpose, production andbusiness oriented machinery
▲ 1.3
▲ 4.8
▲ 1.6
▲ 1.0
2 月 の
This Month
▲ 3.0
▲ 1.3
▲ 0.7
見込み 実 現 率
平成30年 2月 の 製 造 工 業 生 産 予 測 調 査 結 果
(1)前月比(季節調整済)
分 類1月 Jan.
予測修正率3月 Mar.
Last Month
1 月 の
30

平成22年=100
index2010=100
(注) このグラフは、製造工業生産予測指数の動きを表現したもので、鉱工業生産指数ではない。Note: This graph shows the changes in indices of Production Forecast and doesn't show the very changes in Indices of Industrial Production.
Realization Ratio and Amendment Ratio (Percent Change From Previous Month)
製造工業生産予測指数(季節調整済)
製造工業の実現率・予測修正率(増減率)
Indices of Production Forecast (Seasonally Adjusted Index)
70.0
80.0
90.0
100.0
110.0
8 9 10 11 12 1 2 3 4 5 6 7 8 9 10 11 12 1 2 3 4 5 6 7 8 9 10 11 12 1 2 3
27 年 ┘ └ 28 年 ┘ └ 29 年 ┘ └ 30 年
前月実績指数 (Last Month)
当月見込指数 (This Month)
翌月予測指数 (Next Month)
▲ 7.0
▲ 6.0
▲ 5.0
▲ 4.0
▲ 3.0
▲ 2.0
▲ 1.0
0.0
1.0
2.0
3.0
4.0
5.0
8 9 10 11 12 1 2 3 4 5 6 7 8 9 10 11 12 1 2 3 4 5 6 7 8 9 10 11 12 1 2
27 年 ┘ └ 28 年 ┘ └ 29 年 ┘ └
実 現 率 (Realization Ratio)
予測修正率 (Amendment Ratio)
(%)
31
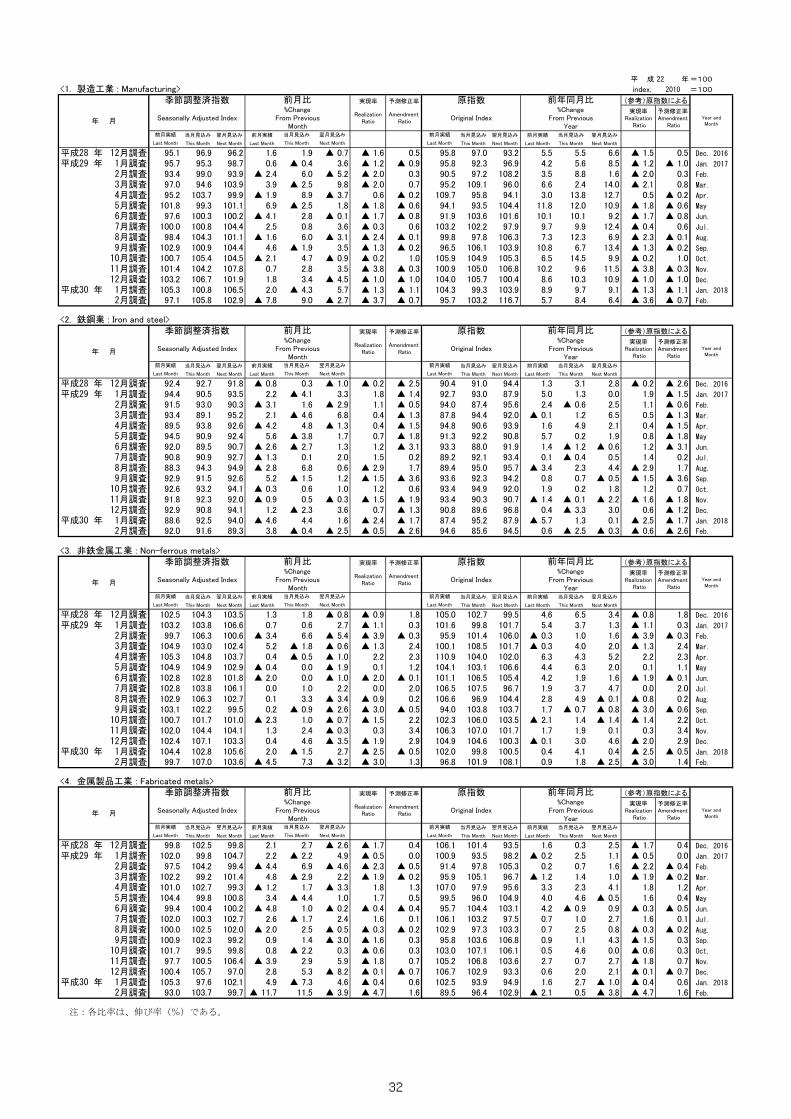
平 成 22 年=100
<1. 製造工業 : Manufacturing> index, 2010 =100
(参考)原指数による
実現率Realization
Ratio
予測修正率Amendment
Ratio
当月見込み 翌月見込み 前月実績 当月見込み 翌月見込み 前月実績 当月見込み 翌月見込み
This Month Next Month Last Month This Month Next Month Last Month This Month Next Month
平成28 年 96.9 96.2 1.6 97.0 93.2 5.5 5.5 6.6 ▲ 1.5 0.5 Dec. 2016
平成29 年 95.3 98.7 0.6 92.3 96.9 4.2 5.6 8.5 ▲ 1.2 ▲ 1.0 Jan. 2017
99.0 93.9 ▲ 2.4 97.2 108.2 3.5 8.8 1.6 ▲ 2.0 0.3 Feb.
94.6 103.9 3.9 109.1 96.0 6.6 2.4 14.0 ▲ 2.1 0.8 Mar.
103.7 99.9 ▲ 1.9 95.8 94.1 3.0 13.8 12.7 0.5 ▲ 0.2 Apr.
99.3 101.1 6.9 93.5 104.4 11.8 12.0 10.9 ▲ 1.8 ▲ 0.6 May
100.3 100.2 ▲ 4.1 103.6 101.6 10.1 10.1 9.2 ▲ 1.7 ▲ 0.8 Jun.
100.8 104.4 2.5 102.2 97.9 9.7 9.9 12.4 ▲ 0.4 0.6 Jul.
104.3 101.1 ▲ 1.6 97.8 106.3 7.3 12.3 6.9 ▲ 2.3 ▲ 0.1 Aug.
100.9 104.4 4.6 106.1 103.9 10.8 6.7 13.4 ▲ 1.3 ▲ 0.2 Sep.
105.4 104.5 ▲ 2.1 104.9 105.3 6.5 14.5 9.9 ▲ 0.2 1.0 Oct.
104.2 107.8 0.7 105.0 106.8 10.2 9.6 11.5 ▲ 3.8 ▲ 0.3 Nov.
106.7 101.9 1.8 105.7 100.4 8.6 10.3 10.9 ▲ 1.0 ▲ 1.0 Dec.
平成30 年 100.8 106.5 2.0 99.3 103.9 8.9 9.7 9.1 ▲ 1.3 ▲ 1.1 Jan. 2018
105.8 102.9 ▲ 7.8 103.2 116.7 5.7 8.4 6.4 ▲ 3.6 ▲ 0.7 Feb.
<2. 鉄鋼業 : Iron and steel>(参考)原指数による
実現率Realization
Ratio
予測修正率Amendment
Ratio
当月見込み 翌月見込み 前月実績 当月見込み 翌月見込み 前月実績 当月見込み 翌月見込み
This Month Next Month Last Month This Month Next Month Last Month This Month Next Month
平成28 年 92.7 91.8 ▲ 0.8 91.0 94.4 1.3 3.1 2.8 ▲ 0.2 ▲ 2.6 Dec. 2016
平成29 年 90.5 93.5 2.2 93.0 87.9 5.0 1.3 0.0 1.9 ▲ 1.5 Jan. 2017
93.0 90.3 ▲ 3.1 87.4 95.6 2.4 ▲ 0.6 2.5 1.1 ▲ 0.6 Feb.
89.1 95.2 2.1 94.4 92.0 ▲ 0.1 1.2 6.5 0.5 ▲ 1.3 Mar.
93.8 92.6 ▲ 4.2 90.6 93.9 1.6 4.9 2.1 0.4 ▲ 1.5 Apr.
90.9 92.4 5.6 92.2 90.8 5.7 0.2 1.9 0.8 ▲ 1.8 May
89.5 90.7 ▲ 2.6 88.0 91.9 1.4 ▲ 1.2 ▲ 0.6 1.2 ▲ 3.1 Jun.
90.9 92.7 ▲ 1.3 92.1 93.4 0.1 ▲ 0.4 0.5 1.4 0.2 Jul.
94.3 94.9 ▲ 2.8 95.0 95.7 ▲ 3.4 2.3 4.4 ▲ 2.9 1.7 Aug.
91.5 92.6 5.2 92.3 94.2 0.8 0.7 ▲ 0.5 ▲ 1.5 ▲ 3.6 Sep.
93.2 94.1 ▲ 0.3 94.9 92.0 1.9 0.2 1.8 1.2 0.7 Oct.
92.3 92.0 ▲ 0.9 90.3 90.7 ▲ 1.4 ▲ 0.1 ▲ 2.2 ▲ 1.6 ▲ 1.8 Nov.
90.8 94.1 1.2 89.6 96.8 0.4 ▲ 3.3 3.0 0.6 ▲ 1.2 Dec.
平成30 年 92.5 94.0 ▲ 4.6 95.2 87.9 ▲ 5.7 1.3 0.1 ▲ 2.5 ▲ 1.7 Jan. 2018
91.6 89.3 3.8 85.6 94.5 0.6 ▲ 2.5 ▲ 0.3 ▲ 0.6 ▲ 2.6 Feb.
<3. 非鉄金属工業 : Non-ferrous metals>(参考)原指数による
実現率Realization
Ratio
予測修正率Amendment
Ratio
当月見込み 翌月見込み 前月実績 当月見込み 翌月見込み 前月実績 当月見込み 翌月見込み
This Month Next Month Last Month This Month Next Month Last Month This Month Next Month
平成28 年 104.3 103.5 1.3 102.7 99.5 4.6 6.5 3.4 ▲ 0.8 1.8 Dec. 2016
平成29 年 103.8 106.6 0.7 99.8 101.7 5.4 3.7 1.3 ▲ 1.1 0.3 Jan. 2017
106.3 100.6 ▲ 3.4 101.4 106.0 ▲ 0.3 1.0 1.6 ▲ 3.9 ▲ 0.3 Feb.
103.0 102.4 5.2 108.5 101.7 ▲ 0.3 4.0 2.0 ▲ 1.3 2.4 Mar.
104.8 103.7 0.4 104.0 102.0 6.3 4.3 5.2 2.2 2.3 Apr.
104.9 102.9 ▲ 0.4 103.1 106.6 4.4 6.3 2.0 0.1 1.1 May
102.8 101.8 ▲ 2.0 106.5 105.4 4.2 1.9 1.6 ▲ 1.9 ▲ 0.1 Jun.
103.8 106.1 0.0 107.5 96.7 1.9 3.7 4.7 0.0 2.0 Jul.
106.3 102.7 0.1 96.9 104.4 2.8 4.9 ▲ 0.1 ▲ 0.8 0.2 Aug.
102.2 99.5 0.2 103.8 103.7 1.7 ▲ 0.7 ▲ 0.8 ▲ 3.0 ▲ 0.6 Sep.
101.7 101.0 ▲ 2.3 106.0 103.5 ▲ 2.1 1.4 ▲ 1.4 ▲ 1.4 2.2 Oct.
104.4 104.1 1.3 107.0 101.7 1.7 1.9 0.1 0.3 3.4 Nov.
107.1 103.3 0.4 104.6 100.3 ▲ 0.1 3.0 4.6 ▲ 2.0 2.9 Dec.
平成30 年 102.8 105.6 2.0 99.8 100.5 0.4 4.1 0.4 ▲ 2.5 ▲ 0.5 Jan. 2018
107.0 103.6 ▲ 4.5 101.9 108.1 0.9 1.8 ▲ 2.5 ▲ 3.0 1.4 Feb.
<4. 金属製品工業 : Fabricated metals>(参考)原指数による
実現率Realization
Ratio
予測修正率Amendment
Ratio
当月見込み 翌月見込み 前月実績 当月見込み 翌月見込み 前月実績 当月見込み 翌月見込み
This Month Next Month Last Month This Month Next Month Last Month This Month Next Month
平成28 年 102.5 99.8 2.1 101.4 93.5 1.6 0.3 2.5 ▲ 1.7 0.4 Dec. 2016
平成29 年 99.8 104.7 2.2 93.5 98.2 ▲ 0.2 2.5 1.1 ▲ 0.5 0.0 Jan. 2017
104.2 99.4 ▲ 4.4 97.8 105.3 0.2 0.7 1.6 ▲ 2.2 ▲ 0.4 Feb.
99.2 101.4 4.8 105.1 96.7 ▲ 1.2 1.4 1.0 ▲ 1.9 ▲ 0.2 Mar.
102.7 99.3 ▲ 1.2 97.9 95.6 3.3 2.3 4.1 1.8 1.2 Apr.
99.8 100.8 3.4 96.0 104.9 4.0 4.6 ▲ 0.5 1.6 0.4 May
100.4 100.2 ▲ 4.8 104.4 103.1 4.2 ▲ 0.9 0.9 ▲ 0.3 ▲ 0.5 Jun.
100.3 102.7 2.6 103.2 97.5 0.7 1.0 2.7 1.6 0.1 Jul.
102.5 102.0 ▲ 2.0 97.3 103.3 0.7 2.5 0.8 ▲ 0.3 ▲ 0.2 Aug.
102.3 99.2 0.9 103.6 106.8 0.9 1.1 4.3 ▲ 1.5 0.3 Sep.
99.5 99.8 0.8 107.1 106.1 0.5 4.6 0.0 ▲ 0.6 0.3 Oct.
100.5 106.4 ▲ 3.9 106.8 103.6 2.7 0.7 2.7 ▲ 1.8 0.7 Nov.
105.7 97.0 2.8 102.9 93.3 0.6 2.0 2.1 ▲ 0.1 ▲ 0.7 Dec.
平成30 年 97.6 102.1 4.9 93.9 94.9 1.6 2.7 ▲ 1.0 ▲ 0.4 0.6 Jan. 2018
103.7 99.7 ▲ 11.7 96.4 102.9 ▲ 2.1 0.5 ▲ 3.8 ▲ 4.7 1.6 Feb.
注:各比率は、伸び率(%)である。
Year andMonth
Year andMonth
Year andMonth年 月
年 月Year andMonth
年 月
年 月
前月比 原指数 前年同月比%Change
From PreviousMonth
Original Index
当月見込み
This Month
%ChangeFrom Previous
Year
前月比 原指数 前年同月比%Change
From PreviousMonth
Original Index%Change
From PreviousYear
▲ 4.33.42.8
季節調整済指数
前月比 原指数 前年同月比%Change
From PreviousMonth
Original Index%Change
From PreviousYear
季節調整済指数
前月比 原指数 前年同月比%Change
From PreviousMonth
Original Index%Change
From PreviousYear
12月調査1月調査2月調査3月調査4月調査5月調査6月調査7月調査8月調査9月調査
10月調査11月調査12月調査1月調査
1月調査2月調査
2月調査
12月調査1月調査2月調査3月調査4月調査5月調査6月調査
9月調査10月調査11月調査12月調査
7月調査8月調査
6月調査
6月調査7月調査8月調査9月調査
10月調査
12月調査1月調査2月調査3月調査
12月調査1月調査2月調査3月調査4月調査5月調査
7月調査8月調査9月調査
10月調査11月調査12月調査1月調査2月調査
12月調査1月調査2月調査
11月調査
4月調査5月調査
93.0105.3100.497.7
101.7100.9100.0102.099.4
104.4101.0102.297.5
102.099.8
Last Month
前月実績
Seasonally Adjusted Index
99.7104.4102.4102.0100.7103.1102.9102.8102.8104.9105.3104.999.7
103.2102.5
Last Month
前月実績
Seasonally Adjusted Index
92.088.692.991.892.692.988.390.892.094.589.593.491.594.492.4
Last Month
前月実績
Seasonally Adjusted Index
季節調整済指数
97.1105.3103.2101.4100.7
Last Month
前月実績
102.998.4
100.097.6
101.895.2
Seasonally Adjusted Index
季節調整済指数
97.093.495.795.1
11.5▲ 7.3
5.32.9
▲ 2.21.42.5
▲ 1.71.0
▲ 4.41.7
▲ 2.96.9
▲ 2.22.7
当月見込み
This Month
1.80.66.6
▲ 1.8▲ 0.5
0.00.01.03.3
▲ 0.91.02.44.6
▲ 1.57.3
0.3▲ 4.1
1.6▲ 4.6
4.8▲ 3.8
0.5▲ 2.3
4.4▲ 0.4
9.0
▲ 2.70.16.8
▲ 1.5
当月見込み
6.00.82.8
▲ 2.5
0.6
This Month
当月見込み
8.9▲ 2.5
6.0▲ 0.4
1.9This Month
4.7▲ 1.9
実現率
RealizationRatio
▲ 1.6▲ 1.2▲ 2.0▲ 2.0
0.6▲ 1.8▲ 1.7▲ 0.3▲ 2.4▲ 1.3▲ 0.2▲ 3.8▲ 1.0▲ 1.3▲ 3.7
翌月見込み
Next Month
▲ 0.73.6
▲ 5.29.8
▲ 3.71.8
▲ 0.13.6
▲ 3.13.5
▲ 0.93.5
▲ 4.55.7
▲ 2.7
翌月見込み
Next Month
▲ 1.03.3
▲ 2.96.8
▲ 1.31.71.32.0
実現率
RealizationRatio
▲ 0.21.8
1.2▲ 1.5
0.7▲ 2.4
1.10.40.40.71.21.5
▲ 0.5
0.61.21.0
▲ 0.33.61.6
▲ 2.5
▲ 2.9▲ 1.5
実現率
RealizationRatio
翌月見込み
Next Month
▲ 0.7▲ 0.3
▲ 0.82.7
▲ 5.4▲ 0.6▲ 1.0▲ 1.9 0.1
▲ 2.0▲ 1.02.2
▲ 3.4▲ 2.6
0.3▲ 1.9▲ 3.5
2.7▲ 3.2
▲ 0.9▲ 1.1▲ 3.9▲ 1.3
2.2
1.0
▲ 2.5▲ 3.0
実現率
RealizationRatio
翌月見込み
Next Month
▲ 0.8
▲ 2.64.9
▲ 4.62.2
▲ 3.3
0.0▲ 0.9▲ 3.0▲ 1.5
予測修正率
Amendment Ratio
▲ 0.2▲ 0.6
前月実績
Last Month
0.5▲ 0.9
0.30.7
0.6▲ 0.1▲ 0.2
1.0▲ 0.3▲ 1.0▲ 1.1▲ 0.7
95.895.890.595.2
109.794.191.9
103.299.896.5
105.9100.9104.0104.395.7
予測修正率
Amendment Ratio
前月実績
Last Month
▲ 2.5▲ 1.4▲ 0.5▲ 1.3▲ 1.5▲ 1.8▲ 3.1
0.21.7
▲ 3.60.6
▲ 1.9▲ 1.3▲ 1.7▲ 2.6
90.492.794.087.894.891.393.389.289.493.693.493.490.887.494.6
予測修正率
Amendment Ratio
前月実績
Last Month
0.2▲ 0.5
2.23.4
1.80.3
▲ 0.32.42.31.2
1.3
105.0101.695.9
100.1110.9104.1101.1▲ 0.1
2.0
102.3106.3104.9102.0
2.9▲ 0.5
106.5
96.8
予測修正率
Amendment Ratio
前月実績
Last Month
106.694.0
▲ 8.24.6
▲ 0.6▲ 1.8▲ 0.1▲ 0.4
1.6▲ 0.3▲ 1.6
▲ 1.7
▲ 3.0
5.90.3
▲ 0.22.4
▲ 0.5
▲ 0.40.1
▲ 0.2
▲ 3.9
▲ 0.5▲ 2.3▲ 1.9
1.81.7
▲ 0.4
0.40.0
▲ 0.5▲ 0.2
1.30.5
0.30.30.7
▲ 0.70.61.6
106.1100.991.495.9
107.099.595.7
106.1102.995.8
103.0105.2106.7102.589.5▲ 4.7
32
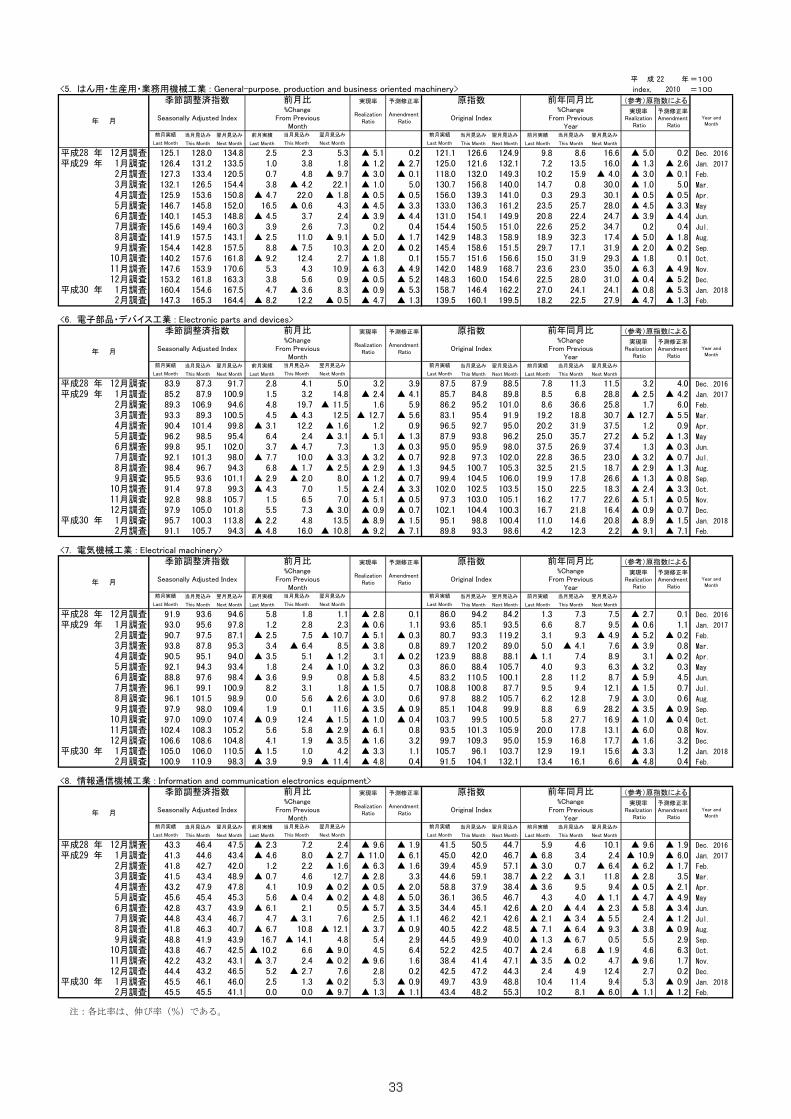
平 成 22 年=100
<5. はん用・生産用・業務用機械工業 : General-purpose, production and business oriented machinery> index, 2010 =100
(参考)原指数による
実現率Realization
Ratio
予測修正率Amendment
Ratio
当月見込み 翌月見込み 前月実績 当月見込み 翌月見込み 前月実績 当月見込み 翌月見込み
This Month Next Month Last Month This Month Next Month Last Month This Month Next Month
平成28 年 128.0 134.8 2.5 126.6 124.9 9.8 8.6 16.6 ▲ 5.0 0.2 Dec. 2016
平成29 年 131.2 133.5 1.0 121.6 132.1 7.2 13.5 16.0 ▲ 1.3 ▲ 2.6 Jan. 2017
133.4 120.5 0.7 132.0 149.3 10.2 15.9 ▲ 4.0 ▲ 3.0 ▲ 0.1 Feb.
126.5 154.4 3.8 156.8 140.0 14.7 0.8 30.0 ▲ 1.0 5.0 Mar.
153.6 150.8 ▲ 4.7 139.3 141.0 0.3 29.3 30.1 ▲ 0.5 ▲ 0.5 Apr.
145.8 152.0 16.5 136.3 161.2 23.5 25.7 28.0 ▲ 4.5 ▲ 3.3 May
145.3 148.8 ▲ 4.5 154.1 149.9 20.8 22.4 24.7 ▲ 3.9 ▲ 4.4 Jun.
149.4 160.3 3.9 150.5 151.0 22.6 25.2 34.7 0.2 0.4 Jul.
157.5 143.1 ▲ 2.5 148.3 158.9 18.9 32.3 17.4 ▲ 5.0 ▲ 1.8 Aug.
142.8 157.5 8.8 158.6 151.5 29.7 17.1 31.9 ▲ 2.0 ▲ 0.2 Sep.
157.6 161.8 ▲ 9.2 151.6 156.6 15.0 31.9 29.3 ▲ 1.8 0.1 Oct.
153.9 170.6 5.3 148.9 168.7 23.6 23.0 35.0 ▲ 6.3 ▲ 4.9 Nov.
161.8 163.3 3.8 160.0 154.6 22.5 28.0 31.0 ▲ 0.4 ▲ 5.2 Dec.
平成30 年 154.6 167.5 4.7 146.4 162.2 27.0 24.1 24.1 ▲ 0.8 ▲ 5.3 Jan. 2018
165.3 164.4 ▲ 8.2 160.1 199.5 18.2 22.5 27.9 ▲ 4.7 ▲ 1.3 Feb.
<6. 電子部品・デバイス工業 : Electronic parts and devices>(参考)原指数による
実現率Realization
Ratio
予測修正率Amendment
Ratio
当月見込み 翌月見込み 前月実績 当月見込み 翌月見込み 前月実績 当月見込み 翌月見込み
This Month Next Month Last Month This Month Next Month Last Month This Month Next Month
平成28 年 87.3 91.7 2.8 87.9 88.5 7.8 11.3 11.5 3.2 4.0 Dec. 2016
平成29 年 87.9 100.9 1.5 84.8 89.8 8.5 6.8 28.8 ▲ 2.5 ▲ 4.2 Jan. 2017
106.9 94.6 4.8 95.2 101.0 8.6 36.6 25.8 1.7 6.0 Feb.
89.3 100.5 4.5 95.4 91.9 19.2 18.8 30.7 ▲ 12.7 ▲ 5.5 Mar.
101.4 99.8 ▲ 3.1 92.7 95.0 20.2 31.9 37.5 1.2 0.9 Apr.
98.5 95.4 6.4 93.8 96.2 25.0 35.7 27.2 ▲ 5.2 ▲ 1.3 May
95.1 102.0 3.7 95.9 98.0 37.5 26.9 37.4 1.3 ▲ 0.3 Jun.
101.3 98.0 ▲ 7.7 97.3 102.0 22.8 36.5 23.0 ▲ 3.2 ▲ 0.7 Jul.
96.7 94.3 6.8 100.7 105.3 32.5 21.5 18.7 ▲ 2.9 ▲ 1.3 Aug.
93.6 101.1 ▲ 2.9 104.5 106.0 19.9 17.8 26.6 ▲ 1.3 ▲ 0.8 Sep.
97.8 99.3 ▲ 4.3 102.5 103.5 15.0 22.5 18.3 ▲ 2.4 ▲ 3.3 Oct.
98.8 105.7 1.5 103.0 105.1 16.2 17.7 22.6 ▲ 5.1 ▲ 0.5 Nov.
105.0 101.8 5.5 104.4 100.3 16.7 21.8 16.4 ▲ 0.9 ▲ 0.7 Dec.
平成30 年 100.3 113.8 ▲ 2.2 98.8 100.4 11.0 14.6 20.8 ▲ 8.9 ▲ 1.5 Jan. 2018
105.7 94.3 ▲ 4.8 93.3 98.6 4.2 12.3 2.2 ▲ 9.1 ▲ 7.1 Feb.
<7. 電気機械工業 : Electrical machinery>(参考)原指数による
実現率Realization
Ratio
予測修正率Amendment
Ratio
当月見込み 翌月見込み 前月実績 当月見込み 翌月見込み 前月実績 当月見込み 翌月見込み
This Month Next Month Last Month This Month Next Month Last Month This Month Next Month
平成28 年 93.6 94.6 5.8 94.2 84.2 1.3 7.3 7.5 ▲ 2.7 0.1 Dec. 2016
平成29 年 95.6 97.8 1.2 85.1 93.5 6.6 8.7 9.5 ▲ 0.6 1.1 Jan. 2017
97.5 87.1 ▲ 2.5 93.3 119.2 3.1 9.3 ▲ 4.9 ▲ 5.2 ▲ 0.2 Feb.
87.8 95.3 3.4 120.2 89.0 5.0 ▲ 4.1 7.6 ▲ 3.9 0.8 Mar.
95.1 94.0 ▲ 3.5 88.8 88.1 ▲ 1.1 7.4 8.9 3.1 ▲ 0.2 Apr.
94.3 93.4 1.8 88.4 105.7 4.0 9.3 6.3 ▲ 3.2 0.3 May
97.6 98.4 ▲ 3.6 110.5 100.1 2.8 11.2 8.7 ▲ 5.9 4.5 Jun.
99.1 100.9 8.2 100.8 87.7 9.5 9.4 12.1 ▲ 1.5 0.7 Jul.
101.5 98.9 0.0 88.2 105.7 6.2 12.8 7.9 ▲ 3.0 0.6 Aug.
98.0 109.4 1.9 104.8 99.9 8.8 6.9 28.2 ▲ 3.5 ▲ 0.9 Sep.
109.0 107.4 ▲ 0.9 99.5 100.5 5.8 27.7 16.9 ▲ 1.0 ▲ 0.4 Oct.
108.3 105.2 5.6 101.3 105.9 20.0 17.8 13.1 ▲ 6.0 0.8 Nov.
108.6 104.8 4.1 109.3 95.0 15.9 16.8 17.7 ▲ 1.6 3.2 Dec.
平成30 年 106.0 110.5 ▲ 1.5 96.1 103.7 12.9 19.1 15.6 ▲ 3.3 1.2 Jan. 2018
110.9 98.3 ▲ 3.9 104.1 132.1 13.4 16.1 6.6 ▲ 4.8 0.4 Feb.
<8. 情報通信機械工業 : Information and communication electronics equipment>(参考)原指数による
実現率Realization
Ratio
予測修正率Amendment
Ratio
当月見込み 翌月見込み 前月実績 当月見込み 翌月見込み 前月実績 当月見込み 翌月見込み
This Month Next Month Last Month This Month Next Month Last Month This Month Next Month
平成28 年 46.4 47.5 ▲ 2.3 50.5 44.7 5.9 4.6 10.1 ▲ 9.6 ▲ 1.9 Dec. 2016
平成29 年 44.6 43.4 ▲ 4.6 42.0 46.7 ▲ 6.8 3.4 2.4 ▲ 10.9 ▲ 6.0 Jan. 2017
42.7 42.0 1.2 45.9 57.1 ▲ 3.0 0.7 ▲ 6.4 ▲ 6.2 ▲ 1.7 Feb.
43.4 48.9 ▲ 0.7 59.1 38.7 ▲ 2.2 ▲ 3.1 11.8 ▲ 2.8 3.5 Mar.
47.9 47.8 4.1 37.9 38.4 ▲ 3.6 9.5 9.4 ▲ 0.5 ▲ 2.1 Apr.
45.4 45.3 5.6 36.5 46.7 4.3 4.0 ▲ 1.1 ▲ 4.7 ▲ 4.9 May
43.7 43.9 ▲ 6.1 45.1 42.6 ▲ 2.0 ▲ 4.4 ▲ 2.3 ▲ 5.8 ▲ 3.4 Jun.
43.4 46.7 4.7 42.1 42.6 ▲ 2.1 ▲ 3.4 ▲ 5.5 2.4 ▲ 1.2 Jul.
46.3 40.7 ▲ 6.7 42.2 48.5 ▲ 7.1 ▲ 6.4 ▲ 9.3 ▲ 3.8 ▲ 0.9 Aug.
41.9 43.9 16.7 49.9 40.0 ▲ 1.3 ▲ 6.7 0.5 5.5 2.9 Sep.
46.7 42.5 ▲ 10.2 42.5 40.7 ▲ 2.4 6.8 ▲ 1.9 4.6 6.3 Oct.
43.2 43.1 ▲ 3.7 41.4 47.1 ▲ 3.5 ▲ 0.2 4.7 ▲ 9.6 1.7 Nov.
43.2 46.5 5.2 47.2 44.3 2.4 4.9 12.4 2.7 0.2 Dec.
平成30 年 46.1 46.0 2.5 43.9 48.8 10.4 11.4 9.4 5.3 ▲ 0.9 Jan. 2018
45.5 41.1 0.0 48.2 55.3 10.2 8.1 ▲ 6.0 ▲ 1.1 ▲ 1.2 Feb.
注:各比率は、伸び率(%)である。
Year andMonth
Year andMonth
Year andMonth
Year andMonth年 月
前月比 原指数 前年同月比
年 月
年 月
年 月
%ChangeFrom Previous
Year
季節調整済指数
前月比 原指数 前年同月比%Change
From PreviousMonth
Original Index%Change
From PreviousYear
季節調整済指数
原指数 前年同月比%Change
From PreviousMonth
Original Index%Change
From PreviousYear
前月比 原指数 前年同月比%Change
From PreviousMonth
Original Index
%ChangeFrom Previous
Year
6.6▲ 14.1
10.8
%ChangeFrom Previous
Month
▲ 3.1
Original Index
12月調査1月調査2月調査3月調査4月調査5月調査6月調査7月調査8月調査9月調査
10月調査11月調査12月調査1月調査2月調査
12月調査1月調査2月調査3月調査4月調査5月調査6月調査7月調査8月調査9月調査
10月調査11月調査12月調査1月調査2月調査
12月調査1月調査2月調査3月調査4月調査5月調査6月調査7月調査8月調査9月調査
10月調査11月調査12月調査1月調査2月調査
12月調査1月調査2月調査3月調査4月調査5月調査6月調査7月調査8月調査9月調査
10月調査11月調査12月調査1月調査2月調査
45.545.544.442.243.848.841.844.842.845.643.241.541.841.343.3
Last Month
前月実績
Seasonally Adjusted Index
季節調整済指数
100.9105.0106.6102.497.097.996.196.188.892.190.593.890.793.091.9
Last Month
前月実績
Seasonally Adjusted Index
季節調整済指数
91.195.797.992.891.495.598.492.199.896.290.493.389.385.283.9
Last Month
前月実績
Seasonally Adjusted Index
147.3160.4153.2147.6140.2154.4141.9145.6140.1146.7125.9132.1127.3126.4125.1
Last Month
前月実績
Seasonally Adjusted Index
0.01.3
▲ 2.72.4
2.1▲ 0.4
10.94.62.28.07.2
This Month
当月見込み
9.91.01.95.8
12.40.15.63.19.92.45.1
▲ 6.47.52.81.8
当月見込み
This Month
16.04.87.36.5
前月比
7.0▲ 3.0
▲ 10.8
7.0▲ 2.0▲ 1.7
10.0▲ 4.7
2.412.2
▲ 4.319.73.24.1
This Month
当月見込み
12.2▲ 3.6
5.64.3
12.4▲ 7.5
11.02.63.7
▲ 0.622.0
▲ 4.24.83.82.3
当月見込み
This Month
実現率
RealizationRatio
予測修正率
Amendment Ratio
翌月見込み
Next Month
5.31.8
▲ 9.7
▲ 5.1▲ 1.2▲ 3.0
22.1▲ 1.8
4.32.47.3
▲ 9.110.32.7
10.90.98.3
▲ 0.5
▲ 1.0▲ 0.5▲ 4.5▲ 3.9
0.2▲ 5.0▲ 2.0▲ 1.8▲ 6.3▲ 0.5▲ 0.9▲ 4.7
▲ 1.7▲ 0.2
0.1
0.2▲ 2.7▲ 0.1
5.0▲ 0.5
▲ 1.3
前月実績
Last Month
121.1125.0118.0130.7
▲ 3.3▲ 4.4
0.4
156.0133.0131.0154.4142.9145.4155.7142.0148.3158.7139.5
翌月見込み 前月実績
▲ 4.9▲ 5.2▲ 5.3
Next Month
5.014.8
▲ 11.512.5
▲ 1.6
1.6▲ 12.7
1.2▲ 3.1
7.3▲ 3.3 ▲ 3.2
実現率
RealizationRatio
3.2▲ 2.4
▲ 2.9▲ 1.2
▲ 5.1▲ 2.4
13.5
▲ 2.58.01.5
▲ 9.2
予測修正率
Amendment Ratio
3.9▲ 4.1
5.9
▲ 5.11.3
▲ 5.60.9
▲ 1.3▲ 0.3▲ 0.7▲ 1.3▲ 0.7▲ 3.3▲ 0.5▲ 0.7▲ 1.5▲ 7.1
Last Month
87.585.786.283.196.587.995.092.894.599.4
102.097.3
102.195.189.8
実現率
RealizationRatio
予測修正率
Amendment Ratio
▲ 0.9▲ 8.9
翌月見込み
Next Month
1.12.3
▲ 10.78.5
▲ 1.2▲ 1.0
0.81.8
▲ 2.611.6
▲ 1.5▲ 2.9▲ 3.5
4.2▲ 11.4
▲ 2.8▲ 0.6▲ 5.1▲ 3.8
3.1▲ 3.2▲ 5.8▲ 1.5▲ 3.0▲ 3.5▲ 1.0▲ 6.1▲ 1.6▲ 3.3▲ 4.8
0.11.1
▲ 0.30.8
▲ 0.20.3
0.74.5
0.6▲ 0.9▲ 0.4
0.83.21.10.4
前月実績
Last Month
86.093.680.789.7
123.986.083.2
108.897.885.1
103.793.599.7
105.791.5
実現率
RealizationRatio
翌月見込み
Next Month
2.4▲ 2.7▲ 1.6
12.7▲ 0.2▲ 0.2
0.57.6
▲ 12.14.8
▲ 9.0▲ 0.2
7.6▲ 0.2▲ 9.7
▲ 9.6▲ 11.0▲ 6.3▲ 2.8▲ 0.5
4.5▲ 9.6
▲ 1.1
予測修正率
Amendment Ratio
▲ 1.9▲ 6.1
▲ 4.8▲ 5.7
2.5▲ 3.7
5.4
▲ 1.63.3
▲ 2.0▲ 5.0▲ 3.5
1.60.2
▲ 0.9▲ 1.1
▲ 0.92.9
前月実績
Last Month
41.545.039.444.658.836.134.446.240.544.552.238.442.549.743.4
2.85.3
▲ 1.3
6.4
33
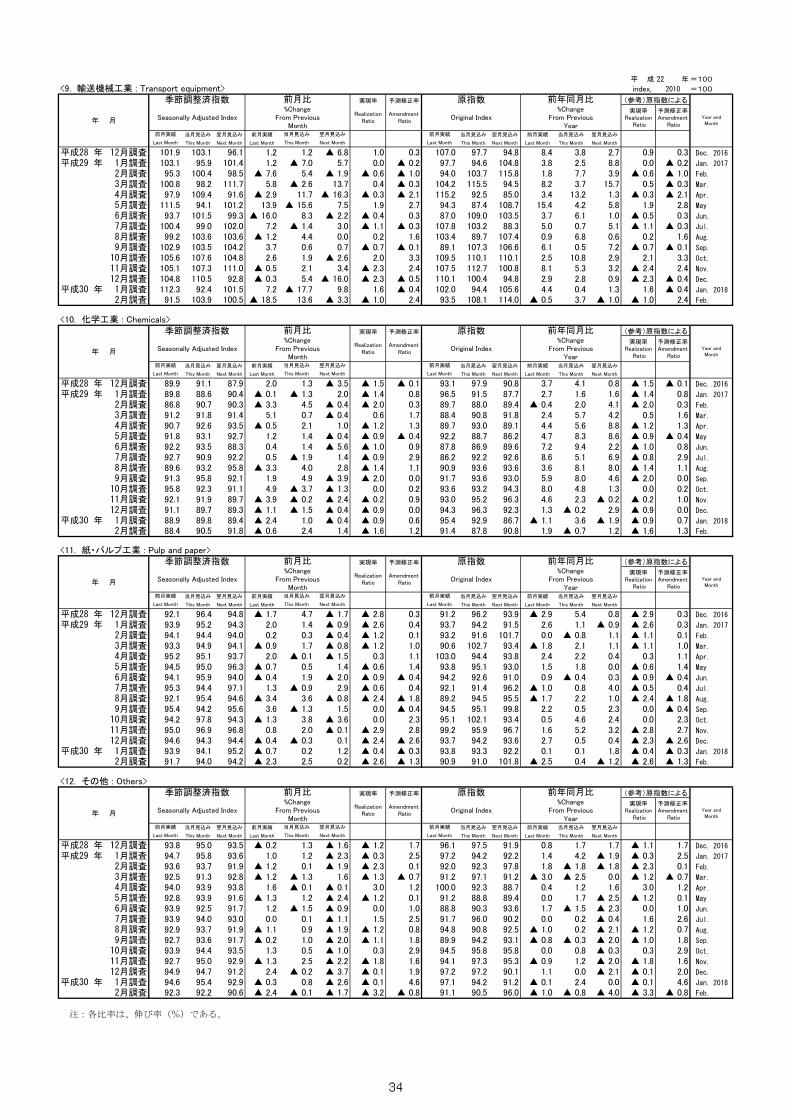
平 成 22 年=100
<9. 輸送機械工業 : Transport equipment> index, 2010 =100
(参考)原指数による
実現率Realization
Ratio
予測修正率Amendment
Ratio
当月見込み 翌月見込み 前月実績 当月見込み 翌月見込み 前月実績 当月見込み 翌月見込み
This Month Next Month Last Month This Month Next Month Last Month This Month Next Month
平成28 年 103.1 96.1 1.2 97.7 94.8 8.4 3.8 2.7 0.9 0.3 Dec. 2016
平成29 年 95.9 101.4 1.2 94.6 104.8 3.8 2.5 8.8 0.0 ▲ 0.2 Jan. 2017
100.4 98.5 ▲ 7.6 103.7 115.8 1.8 7.7 3.9 ▲ 0.6 ▲ 1.0 Feb.
98.2 111.7 5.8 115.5 94.5 8.2 3.7 15.7 0.5 ▲ 0.3 Mar.
109.4 91.6 ▲ 2.9 92.5 85.0 3.4 13.2 1.3 ▲ 0.3 ▲ 2.1 Apr.
94.1 101.2 13.9 87.4 108.7 15.4 4.2 5.8 1.9 2.8 May
101.5 99.3 ▲ 16.0 109.0 103.5 3.7 6.1 1.0 ▲ 0.5 0.3 Jun.
99.0 102.0 7.2 103.2 88.3 5.0 0.7 5.1 ▲ 1.1 ▲ 0.3 Jul.
103.6 103.6 ▲ 1.2 89.7 107.4 0.9 6.8 0.6 0.2 1.6 Aug.
103.5 104.2 3.7 107.3 106.6 6.1 0.5 7.2 ▲ 0.7 ▲ 0.1 Sep.
107.6 104.8 2.6 110.1 110.1 2.5 10.8 2.9 2.1 3.3 Oct.
107.3 111.0 ▲ 0.5 112.7 100.8 8.1 5.3 3.2 ▲ 2.4 2.4 Nov.
110.5 92.8 ▲ 0.3 100.4 94.8 2.9 2.8 0.9 ▲ 2.3 ▲ 0.4 Dec.
平成30 年 92.4 101.5 7.2 94.4 105.6 4.4 0.4 1.3 1.6 ▲ 0.4 Jan. 2018
103.9 100.5 ▲ 18.5 108.1 114.0 ▲ 0.5 3.7 ▲ 1.0 ▲ 1.0 2.4 Feb.
<10. 化学工業 : Chemicals>(参考)原指数による
実現率Realization
Ratio
予測修正率Amendment
Ratio
当月見込み 翌月見込み 前月実績 当月見込み 翌月見込み 前月実績 当月見込み 翌月見込み
This Month Next Month Last Month This Month Next Month Last Month This Month Next Month
平成28 年 91.1 87.9 2.0 97.9 90.8 3.7 4.1 0.8 ▲ 1.5 ▲ 0.1 Dec. 2016
平成29 年 88.6 90.4 ▲ 0.1 91.5 87.7 2.7 1.6 1.6 ▲ 1.4 0.8 Jan. 2017
90.7 90.3 ▲ 3.3 88.0 89.4 ▲ 0.4 2.0 4.1 ▲ 2.0 0.3 Feb.
91.8 91.4 5.1 90.8 91.8 2.4 5.7 4.2 0.5 1.6 Mar.
92.6 93.5 ▲ 0.5 93.0 89.1 4.4 5.6 8.8 ▲ 1.2 1.3 Apr.
93.1 92.7 1.2 88.7 86.2 4.7 8.3 8.6 ▲ 0.9 ▲ 0.4 May
93.5 88.3 0.4 86.9 89.6 7.2 9.4 2.2 ▲ 1.0 0.8 Jun.
90.9 92.2 0.5 92.2 92.6 8.6 5.1 6.9 ▲ 0.8 2.9 Jul.
93.2 95.8 ▲ 3.3 93.6 93.6 3.6 8.1 8.0 ▲ 1.4 1.1 Aug.
95.8 92.1 1.9 93.6 93.0 5.9 8.0 4.6 ▲ 2.0 0.0 Sep.
92.3 91.1 4.9 93.2 94.3 8.0 4.8 1.3 0.0 0.2 Oct.
91.9 89.7 ▲ 3.9 95.2 96.3 4.6 2.3 ▲ 0.2 ▲ 0.2 1.0 Nov.
89.7 89.3 ▲ 1.1 96.3 92.3 1.3 ▲ 0.2 2.9 ▲ 0.9 0.0 Dec.
平成30 年 89.8 89.4 ▲ 2.4 92.9 86.7 ▲ 1.1 3.6 ▲ 1.9 ▲ 0.9 0.7 Jan. 2018
90.5 91.8 ▲ 0.6 87.8 90.8 1.9 ▲ 0.7 1.2 ▲ 1.6 1.3 Feb.
<11. 紙・パルプ工業 : Pulp and paper>(参考)原指数による
実現率Realization
Ratio
予測修正率Amendment
Ratio
当月見込み 翌月見込み 前月実績 当月見込み 翌月見込み 前月実績 当月見込み 翌月見込み
This Month Next Month Last Month This Month Next Month Last Month This Month Next Month
平成28 年 96.4 94.8 ▲ 1.7 96.2 93.9 ▲ 2.9 5.4 0.8 ▲ 2.9 0.3 Dec. 2016
平成29 年 95.2 94.3 2.0 94.2 91.5 2.6 1.1 ▲ 0.9 ▲ 2.6 0.3 Jan. 2017
94.4 94.0 0.2 91.6 101.7 0.0 ▲ 0.8 1.1 ▲ 1.1 0.1 Feb.
94.9 94.1 ▲ 0.9 102.7 93.4 ▲ 1.8 2.1 1.1 ▲ 1.1 1.0 Mar.
95.1 93.7 2.0 94.4 93.8 2.4 2.2 0.4 0.3 1.1 Apr.
95.0 96.3 ▲ 0.7 95.1 93.0 1.5 1.8 0.0 ▲ 0.6 1.4 May
95.9 94.0 ▲ 0.4 92.6 91.0 0.9 ▲ 0.4 0.3 ▲ 0.9 ▲ 0.4 Jun.
94.4 97.1 1.3 91.4 96.2 ▲ 1.0 0.8 4.0 ▲ 0.5 0.4 Jul.
95.4 94.6 ▲ 3.4 94.5 95.5 ▲ 1.7 2.2 1.0 ▲ 2.4 ▲ 1.8 Aug.
94.2 95.6 3.6 95.1 99.8 2.2 0.5 2.3 0.0 ▲ 0.4 Sep.
97.8 94.3 ▲ 1.3 102.1 93.4 0.5 4.6 2.4 0.0 2.3 Oct.
96.9 96.8 0.8 95.9 96.7 1.6 5.2 3.2 ▲ 2.8 2.7 Nov.
94.3 94.4 ▲ 0.4 94.2 93.6 2.7 0.5 0.4 ▲ 2.3 ▲ 2.6 Dec.
平成30 年 94.1 95.2 ▲ 0.7 93.3 92.2 0.1 0.1 1.8 ▲ 0.4 ▲ 0.3 Jan. 2018
94.0 94.2 ▲ 2.3 91.0 101.8 ▲ 2.5 0.4 ▲ 1.2 ▲ 2.6 ▲ 1.3 Feb.
<12. その他 : Others>(参考)原指数による
実現率Realization
Ratio
予測修正率Amendment
Ratio
当月見込み 翌月見込み 前月実績 当月見込み 翌月見込み 前月実績 当月見込み 翌月見込み
This Month Next Month Last Month This Month Next Month Last Month This Month Next Month
平成28 年 95.0 93.5 ▲ 0.2 97.5 91.9 0.8 1.7 1.7 ▲ 1.1 1.7 Dec. 2016
平成29 年 95.8 93.6 1.0 94.2 92.2 1.4 4.2 ▲ 1.9 ▲ 0.3 2.5 Jan. 2017
93.7 91.9 ▲ 1.2 92.3 97.8 1.8 ▲ 1.8 ▲ 1.8 ▲ 2.3 0.1 Feb.
91.3 92.8 ▲ 1.2 97.1 91.2 ▲ 3.0 ▲ 2.5 0.0 ▲ 1.2 ▲ 0.7 Mar.
93.9 93.8 1.6 92.3 88.7 0.4 1.2 1.6 3.0 1.2 Apr.
93.9 91.6 ▲ 1.3 88.8 89.4 0.0 1.7 ▲ 2.5 ▲ 1.2 0.1 May
92.5 91.7 1.2 90.3 93.6 1.7 ▲ 1.5 ▲ 2.3 0.0 1.0 Jun.
94.0 93.0 0.0 96.0 90.2 0.0 0.2 ▲ 0.4 1.6 2.6 Jul.
93.7 91.9 ▲ 1.1 90.8 92.5 ▲ 1.0 0.2 ▲ 2.1 ▲ 1.2 0.7 Aug.
93.6 91.7 ▲ 0.2 94.2 93.1 ▲ 0.8 ▲ 0.3 ▲ 2.0 ▲ 1.0 1.8 Sep.
94.4 93.5 1.3 95.8 95.8 0.0 0.8 ▲ 0.3 0.3 2.9 Oct.
95.0 92.9 ▲ 1.3 97.3 95.3 ▲ 0.9 1.2 ▲ 2.0 ▲ 1.8 1.6 Nov.
94.7 91.2 2.4 97.2 90.1 1.1 0.0 ▲ 2.1 ▲ 0.1 2.0 Dec.
平成30 年 95.4 92.9 ▲ 0.3 94.2 91.2 ▲ 0.1 2.4 0.0 ▲ 0.1 4.6 Jan. 2018
92.2 90.6 ▲ 2.4 90.5 96.0 ▲ 1.0 ▲ 0.8 ▲ 4.0 ▲ 3.3 ▲ 0.8 Feb.
注:各比率は、伸び率(%)である。
Year andMonth
Year andMonth年 月
Year andMonth
Year andMonth
年 月
年 月
当月見込み
This Month
年 月
8月調査9月調査
10月調査11月調査
前月比 原指数 前年同月比
104.8105.1
▲ 15.68.3
101.9Last Month
105.6102.999.2
%ChangeFrom Previous
Year
前月比 原指数 前年同月比
This Month
%ChangeFrom Previous
Year
原指数 前年同月比
▲ 1.9
0.22.5
1.40.3
%ChangeFrom Previous
MonthOriginal Index
%ChangeFrom Previous
MonthOriginal Index
前月比
Original Index%Change
From PreviousYear
%ChangeFrom Previous
MonthOriginal Index
%ChangeFrom Previous
Year
前月比
当月見込み
4.7
原指数 前年同月比
92.9
92.3
94.9 ▲ 3.7▲ 2.6▲ 1.7
▲ 0.1
4月調査5月調査
94.092.893.993.9
6月調査
6月調査7月調査8月調査9月調査
10月調査
12月調査1月調査2月調査3月調査
12月調査1月調査2月調査3月調査4月調査5月調査
7月調査8月調査9月調査
10月調査11月調査12月調査1月調査2月調査
12月調査1月調査2月調査3月調査4月調査5月調査6月調査7月調査
12月調査1月調査2月調査
12月調査1月調査2月調査3月調査4月調査5月調査6月調査7月調査8月調査9月調査
10月調査11月調査12月調査1月調査2月調査
93.692.5
91.793.994.695.0
前月実績
Last Month
季節調整済指数
Seasonally Adjusted Index
94.295.492.195.394.194.595.293.394.193.992.1
Last Month
前月実績
季節調整済指数
Seasonally Adjusted Index
88.488.991.192.195.891.389.692.792.291.890.791.286.889.889.9
Last Month
前月実績
Seasonally Adjusted Index
季節調整済指数
91.5112.3
100.493.7
111.5
前月実績
Seasonally Adjusted Index
季節調整済指数
97.9100.895.3
103.1
▲ 0.1
94.6
93.894.7
92.793.992.7
12月調査1月調査2月調査
11月調査 2.5▲ 0.2
0.8▲ 0.1
1.00.5
当月見込み
This Month
1.2▲ 1.5
0.10.9
1.31.20.1
▲ 1.3
3.8
▲ 3.7▲ 0.2▲ 1.5
1.02.4
▲ 0.11.7
4.04.9
0.51.9
0.72.11.4
13.6
1.3▲ 1.3
4.5
2.0▲ 0.3
▲ 0.93.6
▲ 1.3
1.4
5.4
▲ 17.7
0.61.9
▲ 2.611.7
2.15.4
▲ 1.44.4
当月見込み
This Month
1.2▲ 7.0
実現率
RealizationRatio
翌月見込み
Next Month
▲ 6.85.7
▲ 1.913.7
▲ 16.37.5
▲ 2.23.00.00.7
▲ 2.63.4
▲ 16.09.8
▲ 3.3
1.00.0
▲ 0.60.4
▲ 0.31.9
▲ 0.4▲ 1.1
0.2▲ 0.7
2.0
0.3▲ 0.3
1.6▲ 0.1
予測修正率
Amendment Ratio
0.3▲ 0.2
▲ 1.0
▲ 2.3▲ 2.3
1.6▲ 0.5▲ 0.4
2.4
2.4
前月実績
Last Month
107.097.794.0
104.2▲ 1.0▲ 0.3▲ 2.1
2.7115.294.387.0
107.8103.4
実現率
RealizationRatio
89.1109.5107.5110.1102.093.5
3.3
1.4
1.4
翌月見込み
予測修正率
Amendment Ratio
▲ 1.5▲ 1.4▲ 2.0
Next Month
0.6
▲ 0.4▲ 5.6
▲ 3.52.0
▲ 0.4▲ 0.4
1.0
▲ 2.0
▲ 2.4▲ 0.4▲ 0.4
2.8▲ 3.9▲ 1.3 0.0
▲ 0.2▲ 0.9▲ 0.9▲ 1.6
▲ 1.2▲ 0.9▲ 1.0▲ 0.9▲ 1.4
▲ 0.10.80.31.71.3
▲ 0.40.92.91.10.00.2
前月実績
Last Month
93.196.589.788.489.792.287.886.290.991.793.693.094.395.491.4
翌月見込み
0.90.00.61.2
Next Month
予測修正率
Amendment Ratio
▲ 1.7▲ 0.9▲ 0.4▲ 0.8▲ 1.5
1.4
▲ 2.9
▲ 2.02.9
▲ 0.81.5
▲ 3.6▲ 0.1
0.0
0.11.20.2
実現率
RealizationRatio
▲ 2.8▲ 2.6
1.1
▲ 0.4
▲ 1.2▲ 1.2
0.3▲ 0.6▲ 0.9▲ 0.6▲ 2.4
0.0
103.0
▲ 2.4
0.30.4
1.4▲ 0.4
0.4▲ 1.8
0.11.0
前月実績
Last Month
91.293.793.290.6
93.8
92.194.2
89.294.5
▲ 1.3
95.199.293.793.890.9
▲ 0.42.3
実現率
RealizationRatio
翌月見込み
▲ 2.6
2.8▲ 2.6▲ 0.3
Next Month
%ChangeFrom Previous
Month
▲ 1.9
前月実績
Last Month
▲ 1.6▲ 2.3▲ 1.9
96.197.292.0
▲ 1.0▲ 2.2
0.3▲ 1.8
▲ 1.2▲ 0.3▲ 2.3
1.6
▲ 1.1
1.20.1
2.51.0
▲ 2.0
▲ 0.1▲ 2.4▲ 0.9▲ 1.1
0.1
▲ 1.2
▲ 0.7
0.01.5
▲ 1.33.0
▲ 1.2
予測修正率
Amendment Ratio
1.72.5
0.81.82.91.61.94.6
91.2100.091.2
89.994.594.1
88.891.794.8
97.297.1▲ 0.1
▲ 3.2 ▲ 0.8 91.1
34

(参考)(1)前月比(季節調整済) (2)実現率及び予測修正率Percent change from previous month (Seasonally Adjusted) Realization Ratio and
(%) Amendment Ratio (%)
Capital goods(excl.Transport equipment)
Construction goods
Durable consumer goods
Non-durable consumer goods
Producer goods for mining and manufacturing
※ ( )内は前月調査による前月比を示す。 Parentheses indicate the percent change from previous month in the previous survey.
※ 調査票の提出期日は毎月10日となっている。 The deadline of submission from principal entrepreneurs is the 10th of month.
【参考】 平 成 22 年=100
<13. 資本財(除.輸送機械) : Capital goods (excl. Transport equipment)> index, 2010 =100
(参考)原指数による
実現率Realization
Ratio
予測修正率Amendment
Ratio
当月見込み 翌月見込み 前月実績 当月見込み 翌月見込み 前月実績 当月見込み 翌月見込み
This Month Next Month Last Month This Month Next Month Last Month This Month Next Month
平成28 年 120.3 127.9 3.5 121.9 117.2 7.2 8.1 16.7 ▲ 5.9 ▲ 0.5 Dec. 2016
平成29 年 123.8 126.0 0.0 113.5 125.2 6.3 13.0 16.5 ▲ 1.6 ▲ 3.2 Jan. 2017
124.7 108.2 ▲ 0.1 123.9 151.5 8.0 15.3 ▲ 6.7 ▲ 4.5 ▲ 1.0 Feb.
112.7 144.4 4.3 157.9 125.2 14.0 ▲ 2.8 30.4 ▲ 1.0 4.2 Mar.
143.4 144.4 ▲ 6.7 124.3 127.9 ▲ 0.7 29.5 29.2 2.2 ▲ 0.7 Apr.
139.1 141.1 18.1 123.2 149.2 22.7 24.4 25.0 ▲ 5.2 ▲ 3.7 May
135.3 139.4 ▲ 2.9 143.1 136.1 18.0 19.8 22.9 ▲ 5.2 ▲ 4.1 Jun.
139.9 150.1 2.9 136.6 137.7 20.2 23.4 30.9 0.3 0.4 Jul.
147.8 130.9 ▲ 2.8 135.6 152.7 16.4 28.9 13.5 ▲ 5.7 ▲ 1.5 Aug.
130.8 151.7 10.4 152.6 139.0 27.0 13.5 34.7 ▲ 1.5 ▲ 0.1 Sep.
152.2 153.6 ▲ 11.1 139.4 143.4 12.3 35.1 29.8 ▲ 1.0 0.3 Oct.
147.2 154.1 8.0 137.4 157.9 24.1 24.3 31.7 ▲ 8.1 ▲ 4.2 Nov.
149.1 153.5 4.9 152.8 142.9 23.9 27.4 31.8 ▲ 0.4 ▲ 3.2 Dec.
平成30 年 147.8 156.2 1.1 137.6 151.0 26.8 26.9 23.2 ▲ 0.5 ▲ 3.7 Jan. 2018
154.2 141.9 ▲ 5.2 149.1 195.7 20.8 21.6 21.3 ▲ 4.9 ▲ 1.3 Feb.
<14. 建設財 : Construction goods>(参考)原指数による
実現率Realization
Ratio
予測修正率Amendment
Ratio
当月見込み 翌月見込み 前月実績 当月見込み 翌月見込み 前月実績 当月見込み 翌月見込み
This Month Next Month Last Month This Month Next Month Last Month This Month Next Month
平成28 年 106.5 103.9 0.0 110.9 100.4 2.4 4.1 5.0 ▲ 1.8 1.2 Dec. 2016
平成29 年 105.4 107.6 1.6 101.9 104.0 2.6 6.6 2.4 ▲ 1.4 1.5 Jan. 2017
106.7 103.6 ▲ 2.7 103.1 110.4 3.3 1.5 2.6 ▲ 3.0 ▲ 0.9 Feb.
102.6 105.7 1.8 109.3 97.7 ▲ 1.1 1.6 4.5 ▲ 2.5 ▲ 1.0 Mar.
105.7 104.6 ▲ 0.7 97.7 98.3 2.2 4.5 5.5 0.6 0.0 Apr.
104.4 104.8 3.3 98.1 105.7 5.5 5.3 0.7 0.9 ▲ 0.2 May
104.7 104.8 ▲ 2.8 105.6 104.7 4.6 0.6 1.9 ▲ 0.6 ▲ 0.1 Jun.
105.4 106.4 2.2 105.3 99.9 1.8 2.5 3.1 1.2 0.6 Jul.
106.6 104.9 ▲ 1.7 100.1 105.7 1.4 3.3 0.7 ▲ 1.1 0.2 Aug.
106.8 104.3 1.2 107.7 112.0 2.3 2.6 3.2 ▲ 1.0 1.9 Sep.
105.8 103.2 0.9 113.7 111.6 2.2 4.8 ▲ 0.1 ▲ 0.4 1.5 Oct.
103.5 106.6 ▲ 2.9 111.9 110.0 2.3 0.2 0.6 ▲ 2.4 0.3 Nov.
107.6 100.6 ▲ 0.2 111.1 99.5 ▲ 0.2 1.6 0.7 ▲ 0.4 1.0 Dec.
平成30 年 102.8 105.3 2.1 101.6 100.3 ▲ 0.5 2.8 ▲ 0.2 ▲ 2.2 2.1 Jan. 2018
107.4 104.2 ▲ 6.3 102.3 108.5 ▲ 1.2 1.8 ▲ 1.4 ▲ 3.9 2.0 Feb.
注:各比率は、伸び率(%)である。
4.4▲ 2.4
8.82.4
▲ 3.0
1.0▲ 0.6
2.31.2
▲ 0.60.2
3.10.44.4
▲ 1.32.3
▲ 2.2
105.5106.4103.3103.1105.398.7
104.0103.3106.7103.7106.0104.2
12月調査1月調査2月調査
前月実績
Last Month
季節調整済指数
Seasonally Adjusted Index
103.3105.0102.2
6月調査7月調査8月調査9月調査
10月調査11月調査
12月調査1月調査2月調査3月調査4月調査5月調査
▲ 10.217.65.31.6
▲ 0.39.7
148.3140.6
4.65.4
▲ 8.724.62.42.63.1
12.1135.7131.9145.6129.4139.8146.7
1.6
前月実績
Last Month
Seasonally Adjusted Index
季節調整済指数
当月見込み
This Month
10月調査11月調査12月調査1月調査2月調査
118.3123.4115.1135.9131.9
4月調査5月調査6月調査7月調査8月調査9月調査
12月調査1月調査2月調査
118.4118.4
3月調査
▲ 2.8
▲ 1.3
2.0
▲ 1.0
8.4
▲ 2.5
▲ 4.9
▲ 4.0
▲ 3.4
▲ 2.8
)
)
5.8 5.4
▲ 8.0
▲ 3.0
▲ 0.2
▲ 7.1
▲ 2.5
)
8.8 2.4
15.5 12.8
12.6 0.9
年 月
前月比 原指数 前年同月比
Year andMonth
%ChangeFrom Previous
MonthOriginal Index
%ChangeFrom Previous
Year当月見込み
This Month
年 月
前月比 原指数 前年同月比
Year andMonth
%ChangeFrom Previous
MonthOriginal Index
%ChangeFrom Previous
Year
Next Month Realization Ratio Amendment Ratio
3月 Mar. 1 月 の 2 月 の
見込み 実 現 率 予測修正率
財
別
Last Month
2月 Feb.見込み
This Month
1月 Jan.
( ) ( 9.7 5.7▲ 0.3
)▲ 2.4
(
(
3.6
▲ 11.8
)
( )
( )
(
( )
(
)(
翌月見込み
Next Month
6.3
▲ 1.0
110.5
前月実績
Last Month
1.8▲ 13.2
28.10.71.43.07.3
▲ 11.416.00.9
3.04.7
5.7▲ 8.0
実現率
RealizationRatio
▲ 5.9▲ 1.6▲ 4.4▲ 1.0
0.4▲ 1.5▲ 0.1
0.3
2.1▲ 5.2▲ 5.2
0.3▲ 5.7
▲ 0.7▲ 3.7▲ 4.1
▲ 1.1
予測修正率
Amendment Ratio
▲ 1.5
▲ 0.5▲ 3.2▲ 1.0
4.2
119.9108.4122.6161.3117.8116.8143.5128.8133.6151.0128.1136.9152.0130.9
実現率
▲ 4.2▲ 3.2▲ 3.7▲ 1.3▲ 4.9
▲ 8.1▲ 0.3
RealizationRatio
▲ 0.5
翌月見込み
Next Month
▲ 2.4 ▲ 1.72.1
▲ 2.9▲ 1.4▲ 3.0
3.0▲ 1.0
0.40.10.9
▲ 2.3▲ 1.6
▲ 2.50.70.9
▲ 0.7
▲ 2.4▲ 0.4
1.2
▲ 2.1
▲ 2.53.0
▲ 6.5
▲ 0.8▲ 1.0
0.0
▲ 1.1▲ 1.0▲ 0.4
0.21.81.4
▲ 4.0
予測修正率
Amendment Ratio
1.11.4
2.0
前月実績
Last Month
111.7109.398.8
100.5
▲ 0.2▲ 0.1
0.6
110.098.697.5
106.9104.199.1
107.3111.0111.5108.797.6
0.30.92.2
分 類
資 本 財 ( 除 . 輸 送 機 械 )
建 設 財
耐 久 消 費 財
非 耐 久 消 費 財
鉱 工 業 用 生 産 財
35

平 成 22 年=100
<15. 耐久消費財 : Durable consumer goods> index, 2010 =100
(参考)原指数による
実現率Realization
Ratio
予測修正率Amendment
Ratio
当月見込み 翌月見込み 前月実績 当月見込み 翌月見込み 前月実績 当月見込み 翌月見込み
This Month Next Month Last Month This Month Next Month Last Month This Month Next Month
平成28 年 86.4 82.2 1.8 83.8 79.5 8.3 5.9 4.6 ▲ 0.9 0.1 Dec. 2016
平成29 年 81.6 85.5 0.4 78.9 86.6 3.9 3.8 9.1 ▲ 1.9 ▲ 0.8 Jan. 2017
84.6 83.1 ▲ 6.0 85.7 95.8 1.4 7.9 3.3 ▲ 2.3 ▲ 1.0 Feb.
83.6 92.1 5.3 96.4 81.0 7.1 4.0 12.7 ▲ 0.8 0.6 Mar.
90.2 79.4 ▲ 1.8 79.4 74.7 2.5 10.4 4.2 ▲ 1.5 ▲ 2.0 Apr.
80.3 84.9 9.7 75.6 93.5 10.6 5.4 6.0 0.1 1.2 May
84.3 83.2 ▲ 12.5 92.9 88.2 3.8 5.3 0.6 ▲ 1.6 ▲ 0.6 Jun.
82.6 86.7 5.4 87.6 74.9 4.2 ▲ 0.1 5.8 ▲ 1.1 ▲ 0.7 Jul.
87.3 86.3 ▲ 1.6 75.4 87.5 ▲ 0.7 6.5 2.0 ▲ 0.6 0.7 Aug.
85.4 87.3 3.0 86.6 88.3 3.2 0.9 8.5 ▲ 3.1 ▲ 1.0 Sep.
87.5 87.3 1.2 88.5 90.2 1.2 8.7 3.3 0.2 0.2 Oct.
86.6 91.2 ▲ 2.5 89.4 85.4 3.7 2.4 3.9 ▲ 4.6 ▲ 0.9 Nov.
88.4 79.4 ▲ 0.2 82.8 79.2 ▲ 1.5 0.7 2.7 ▲ 3.8 ▲ 3.0 Dec.
平成30 年 77.6 87.5 5.6 77.4 89.0 0.2 0.4 4.7 ▲ 0.5 ▲ 2.3 Jan. 2018
86.6 86.4 ▲ 14.8 88.1 96.6 ▲ 3.0 3.6 1.7 ▲ 3.4 ▲ 1.0 Feb.
<16. 非耐久消費財 : Non-durable consumer goods>(参考)原指数による
実現率Realization
Ratio
予測修正率Amendment
Ratio
当月見込み 翌月見込み 前月実績 当月見込み 翌月見込み 前月実績 当月見込み 翌月見込み
This Month Next Month Last Month This Month Next Month Last Month This Month Next Month
平成28 年 106.6 94.4 ▲ 1.6 112.8 85.9 6.4 10.4 ▲ 4.8 ▲ 4.4 1.4 Dec. 2016
平成29 年 101.0 102.7 ▲ 0.4 91.9 94.9 5.3 1.9 ▲ 5.3 ▲ 4.6 7.0 Jan. 2017
108.3 96.8 ▲ 8.3 100.1 101.1 ▲ 5.9 ▲ 0.1 ▲ 8.2 ▲ 7.6 5.5 Feb.
100.2 98.4 18.0 104.6 97.6 1.5 ▲ 5.0 ▲ 2.4 1.6 3.5 Mar.
107.4 101.3 ▲ 8.5 106.5 92.3 ▲ 4.5 6.5 ▲ 1.6 0.5 9.1 Apr.
105.3 102.8 4.5 96.0 98.6 4.3 2.3 1.3 ▲ 2.1 4.0 May
107.9 93.3 ▲ 1.0 103.5 98.3 1.3 6.4 ▲ 9.9 ▲ 1.0 5.0 Jun.
107.0 93.1 2.5 112.7 92.1 5.2 3.3 ▲ 3.8 ▲ 1.1 14.6 Jul.
100.2 107.5 ▲ 1.1 99.1 106.1 1.9 3.6 3.5 ▲ 1.3 7.6 Aug.
113.0 98.2 ▲ 8.0 111.5 103.4 0.4 8.8 ▲ 5.7 ▲ 3.0 5.1 Sep.
107.0 99.3 13.6 112.6 108.6 6.2 2.7 ▲ 2.8 ▲ 2.3 8.9 Oct.
105.2 96.4 ▲ 5.8 115.1 101.7 ▲ 0.2 3.0 ▲ 5.5 ▲ 2.8 6.0 Nov.
97.9 94.8 ▲ 1.2 103.3 86.0 0.5 ▲ 4.0 1.3 ▲ 2.4 1.6 Dec.
平成30 年 98.7 99.6 ▲ 7.2 89.5 92.5 ▲ 6.5 5.4 ▲ 9.0 ▲ 2.6 4.1 Jan. 2018
108.0 100.3 0.6 100.3 105.0 2.5 ▲ 1.4 ▲ 0.1 ▲ 2.8 8.4 Feb.
<17. 鉱工業用生産財 : Producer goods for mining and manufacturing>(参考)原指数による
実現率Realization
Ratio
予測修正率Amendment
Ratio
当月見込み 翌月見込み 前月実績 当月見込み 翌月見込み 前月実績 当月見込み 翌月見込み
This Month Next Month Last Month This Month Next Month Last Month This Month Next Month
平成28 年 91.2 90.8 1.5 91.9 90.7 4.4 5.0 4.9 0.2 1.0 Dec. 2016
平成29 年 90.1 94.0 1.1 90.0 90.1 4.3 4.0 7.8 ▲ 0.7 ▲ 0.8 Jan. 2017
95.6 92.3 ▲ 0.7 91.6 97.2 3.9 9.6 8.2 ▲ 0.1 1.7 Feb.
91.4 94.6 1.8 96.3 91.8 5.0 7.2 10.2 ▲ 4.1 ▲ 0.9 Mar.
94.9 94.6 0.2 92.1 91.5 7.7 10.6 13.1 0.4 0.3 Apr.
93.8 93.5 2.1 90.7 92.6 9.1 12.1 9.7 ▲ 1.3 ▲ 0.9 May
93.9 94.6 0.2 93.0 94.6 12.2 10.2 11.0 0.1 0.4 Jun.
94.9 95.8 ▲ 0.4 94.9 95.2 9.7 11.4 10.3 ▲ 0.4 0.3 Jul.
95.5 94.8 ▲ 0.1 94.9 98.0 9.6 10.0 8.2 ▲ 1.6 ▲ 0.3 Aug.
93.8 96.8 1.0 96.9 98.6 8.6 7.0 10.9 ▲ 1.3 ▲ 1.1 Sep.
96.0 96.6 ▲ 0.6 97.7 98.0 6.8 9.9 7.8 ▲ 0.1 ▲ 0.9 Oct.
96.6 99.2 0.9 98.0 99.4 8.2 7.8 8.9 ▲ 1.5 0.0 Nov.
98.6 96.3 2.0 98.8 97.3 7.6 8.2 8.2 ▲ 0.2 ▲ 0.6 Dec.
平成30 年 94.8 99.9 ▲ 0.6 95.8 95.2 5.1 6.6 8.4 ▲ 2.8 ▲ 1.5 Jan. 2018
97.4 95.0 ▲ 3.9 92.9 98.9 3.4 5.8 2.3 ▲ 2.9 ▲ 2.4 Feb.
注:各比率は、伸び率(%)である。
2.22.3
▲ 1.05.8
3.40.10.01.52.2
94.596.495.892.1
当月見込み
This Month
1.8▲ 0.6
6.2
2.5
▲ 0.2
93.793.993.593.494.3
91.8
▲ 0.593.7
2月調査
季節調整済指数
Seasonally Adjusted Index
前月実績
Last Month
89.690.690.091.6
8月調査9月調査
10月調査11月調査12月調査1月調査
2月調査3月調査4月調査5月調査6月調査7月調査
3.612.6
12月調査1月調査
年 月
前月比
▲ 7.1
▲ 0.44.3
0.2▲ 5.1
16.4▲ 3.0
1.3▲ 4.7102.7
95.395.9
4.4▲ 0.7
16.1▲ 9.0
6.70.13.6104.2
106.8105.697.1
110.3103.9
102.1101.793.3
110.1100.7105.2
9月調査10月調査11月調査12月調査1月調査2月調査
3月調査4月調査5月調査6月調査7月調査8月調査
6.1▲ 11.8
15.5
12月調査1月調査2月調査
季節調整済指数
Seasonally Adjusted Index
前月実績
Last Month
6.6▲ 1.0
6.30.92.23.7
2.2▲ 3.8
6.1▲ 0.4
9.5▲ 11.2
84.685.683.583.388.075.0
83.982.490.479.183.482.1
9月調査10月調査11月調査12月調査1月調査2月調査
3月調査4月調査5月調査6月調査7月調査8月調査
前月実績
Last Month
12月調査1月調査2月調査
84.584.879.7
年 月
季節調整済指数 前月比
Seasonally Adjusted Index
原指数 前年同月比
Year andMonth
%ChangeFrom Previous
MonthOriginal Index
%ChangeFrom Previous
Year
Next Month
年 月
前月比 原指数 前年同月比
Year andMonth
%ChangeFrom Previous
MonthOriginal Index
%ChangeFrom Previous
Year当月見込み
This Month
原指数 前年同月比
Year andMonth
%ChangeFrom Previous
MonthOriginal Index
%ChangeFrom Previous
Year当月見込み
This Month
実現率
RealizationRatio
翌月見込み
Next Month
▲ 4.94.8
▲ 1.810.2
▲ 12.05.7
▲ 1.35.0
▲ 1.12.2
▲ 0.25.3
▲ 10.212.8
▲ 0.2
▲ 0.9
0.2
▲ 1.1▲ 1.5
▲ 0.6
0.2
▲ 1.9▲ 2.3▲ 0.8▲ 1.4
▲ 3.1
▲ 4.6▲ 3.8▲ 0.5▲ 3.4
予測修正率
Amendment Ratio
0.1▲ 0.7▲ 1.1
0.6▲ 2.1
1.1▲ 0.7▲ 0.7
0.7▲ 1.0
0.2▲ 0.8▲ 3.1▲ 2.3▲ 1.0
前月実績
Last Month
87.382.277.185.095.079.574.491.987.173.186.884.486.082.474.8
翌月見込み
Next Month
▲ 11.41.7
実現率
RealizationRatio
予測修正率
Amendment Ratio
▲ 10.6▲ 1.8▲ 5.7▲ 2.4
▲ 13.5▲ 13.0
7.3▲ 13.1▲ 7.2▲ 8.4▲ 3.2
0.9
▲ 1.3▲ 3.1
▲ 4.5▲ 4.6▲ 7.6
1.7
▲ 2.8
1.47.05.5
0.5▲ 2.0▲ 1.0▲ 1.0
3.59.13.95.0
14.77.65.19.05.91.64.18.4
前月実績
Last Month
111.7107.684.9
101.7105.1104.395.0
102.4111.296.1
108.9109.4112.3100.687.0
翌月見込み
▲ 2.4▲ 2.9▲ 2.4▲ 2.7
3.5▲ 3.5
▲ 0.3▲ 0.3
0.70.9
▲ 0.73.20.62.7
▲ 2.35.4
▲ 2.5
実現率
RealizationRatio
0.2▲ 0.7▲ 0.1▲ 4.2
0.4▲ 1.3
0.1▲ 0.4▲ 1.6▲ 1.3▲ 0.1▲ 1.6▲ 0.2▲ 2.8▲ 2.8
予測修正率
Amendment Ratio
1.0▲ 0.8
1.7▲ 1.0
0.3▲ 0.8
0.40.3
▲ 0.3
▲ 0.8▲ 1.1
0.0▲ 0.6▲ 1.6▲ 2.5
前月実績
Last Month
90.991.389.987.896.790.990.8
96.093.0
92.693.493.796.896.297.8
36
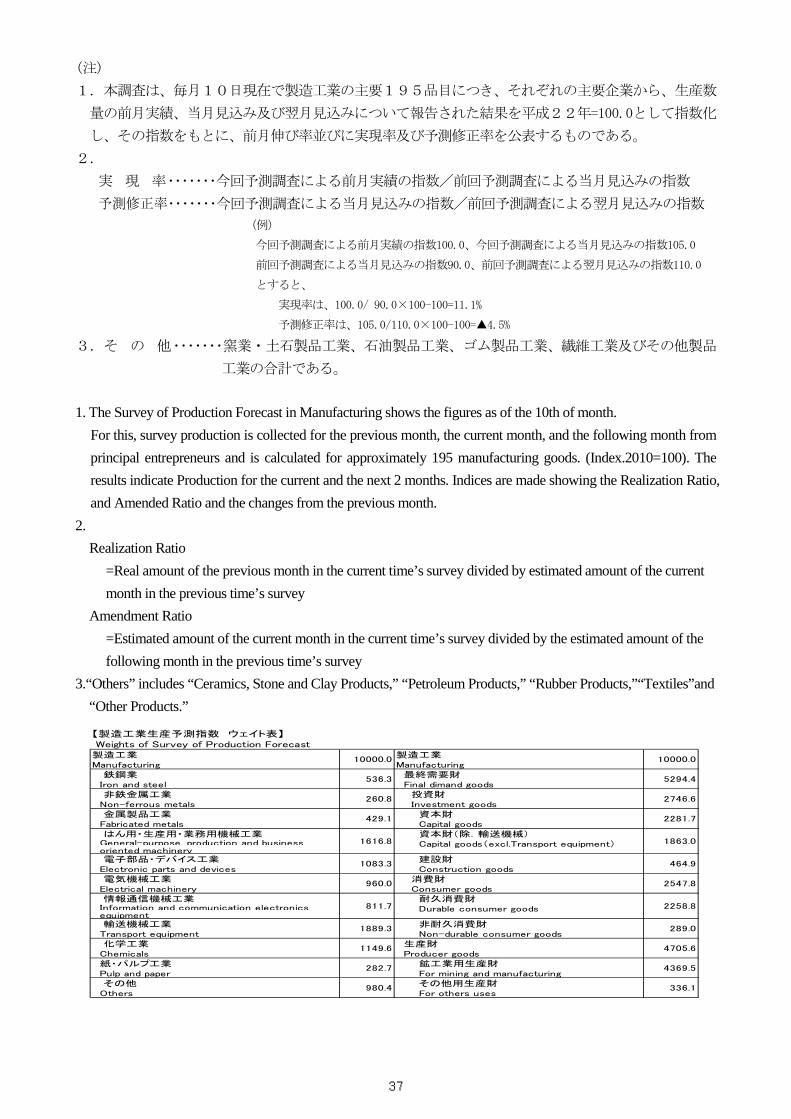
(注)
1.本調査は、毎月10日現在で製造工業の主要195品目につき、それぞれの主要企業から、生産数
量の前月実績、当月見込み及び翌月見込みについて報告された結果を平成22年=100.0として指数化
し、その指数をもとに、前月伸び率並びに実現率及び予測修正率を公表するものである。
2.
実 現 率・・・・・・・今回予測調査による前月実績の指数/前回予測調査による当月見込みの指数
予測修正率・・・・・・・今回予測調査による当月見込みの指数/前回予測調査による翌月見込みの指数
(例)
今回予測調査による前月実績の指数100.0、今回予測調査による当月見込みの指数105.0
前回予測調査による当月見込みの指数90.0、前回予測調査による翌月見込みの指数110.0
とすると、
実現率は、100.0/ 90.0×100-100=11.1%
予測修正率は、105.0/110.0×100-100=▲4.5%
3.そ の 他・・・・・・・窯業・土石製品工業、石油製品工業、ゴム製品工業、繊維工業及びその他製品
工業の合計である。
1. The Survey of Production Forecast in Manufacturing shows the figures as of the 10th of month.For this, survey production is collected for the previous month, the current month, and the following month fromprincipal entrepreneurs and is calculated for approximately 195 manufacturing goods. (Index.2010=100). Theresults indicate Production for the current and the next 2 months. Indices are made showing the Realization Ratio,and Amended Ratio and the changes from the previous month.
2. Realization Ratio
=Real amount of the previous month in the current time’s survey divided by estimated amount of the current month in the previous time’s survey
Amendment Ratio =Estimated amount of the current month in the current time’s survey divided by the estimated amount of the following month in the previous time’s survey
3.“Others” includes “Ceramics, Stone and Clay Products,” “Petroleum Products,” “Rubber Products,”“Textiles”and “Other Products.”
製造工業 製造工業Manufacturing Manufacturing 鉄鋼業 最終需要財 Iron and steel Final dimand goods 非鉄金属工業 投資財 Non-ferrous metals Investment goods 金属製品工業 資本財 Fabricated metals Capital goods はん用・生産用・業務用機械工業 資本財(除.輸送機械) General-purpose, production and business oriented machinery 電子部品・デバイス工業 建設財 Electronic parts and devices Construction goods 電気機械工業 消費財 Electrical machinery Consumer goods 情報通信機械工業 耐久消費財 Information and communication electronics equipment 輸送機械工業 非耐久消費財 Transport equipment Non-durable consumer goods 化学工業 生産財 Chemicals Producer goods 紙・パルプ工業 鉱工業用生産財 Pulp and paper For mining and manufacturing その他 その他用生産財 Others For others uses
980.4
282.7
1149.6
1889.3
10000.0
2258.8
2547.8
464.9
1863.0
2281.7
2746.6
5294.4
336.1
4369.5
4705.6
289.0
Capital goods(excl.Transport equipment)
Durable consumer goods
【製造工業生産予測指数 ウェイト表】 Weights of Survey of Production Forecast
10000.0
536.3
811.7
960.0
1083.3
1616.8
429.1
260.8
37