a method to improve survival prediction using mutual information based network
TRANSCRIPT

A method to improve predictivity of Net-Cox
using Mutual Information based network

Abstract
Cancer genes
Gene co-expression Network
NetCox(Network-constrained Cox regression)
Predict Survivability
1g
2g
3g
Dataset
Correlation between gene pairs
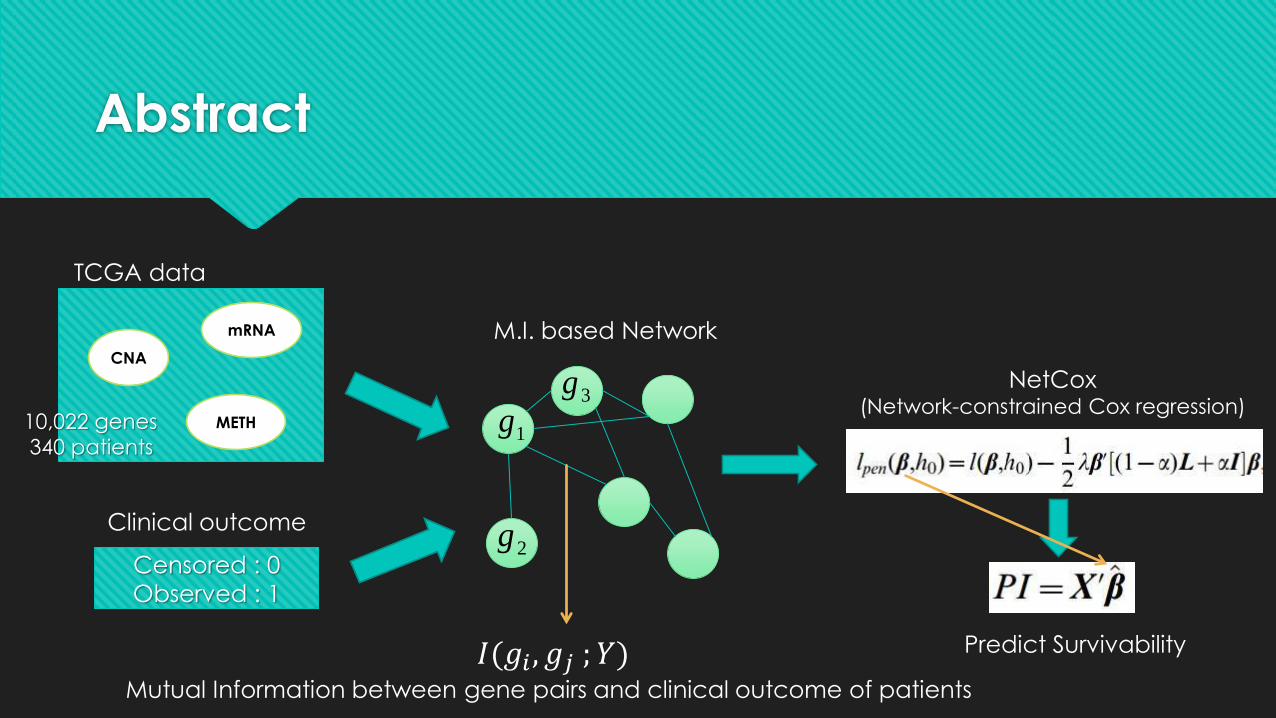
Abstract
CNA
mRNA
METH
TCGA data
10,022 genes
340 patients
Censored : 0
Observed : 1
Clinical outcome
M.I. based Network
NetCox(Network-constrained Cox regression)
Predict Survivability
3g
1g
2g
𝐼(𝑔𝑖 , 𝑔𝑗 ; 𝑌)Mutual Information between gene pairs and clinical outcome of patients
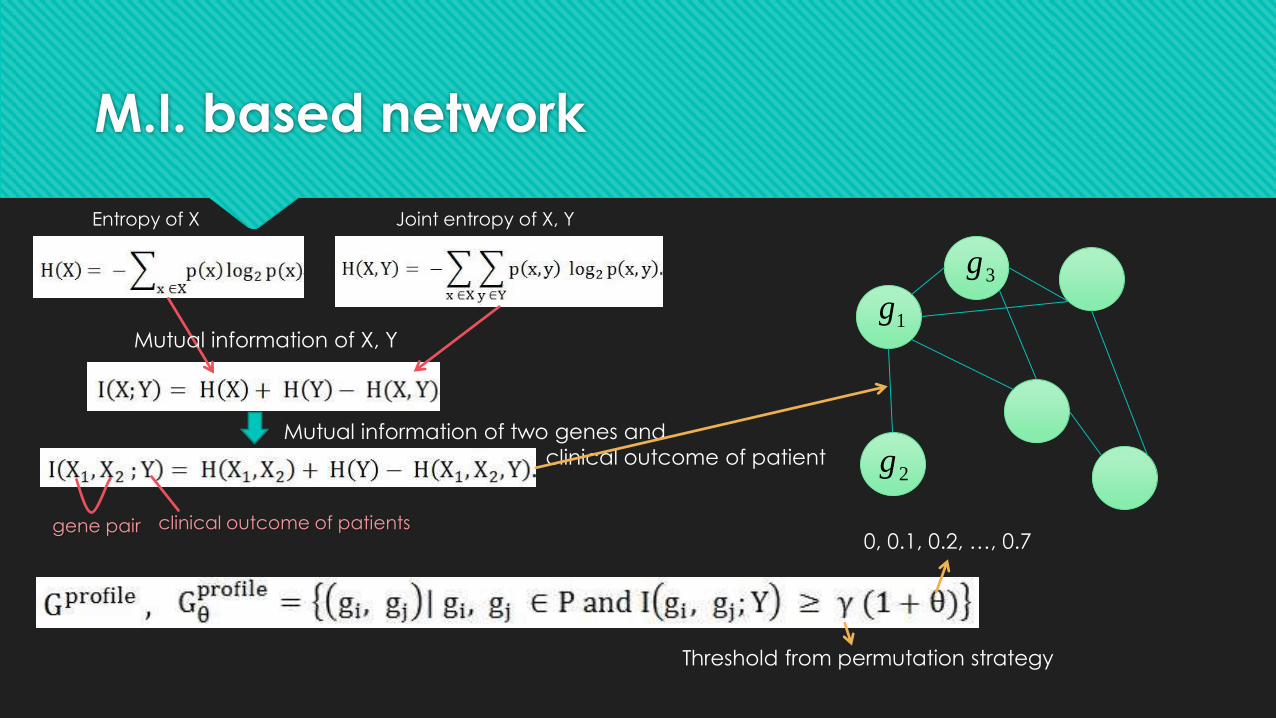
M.I. based network
gene pair clinical outcome of patients
Joint entropy of X, YEntropy of X
Mutual information of X, Y
Mutual information of two genes and
clinical outcome of patient
0, 0.1, 0.2, …, 0.7
Threshold from permutation strategy
1g
2g
3g
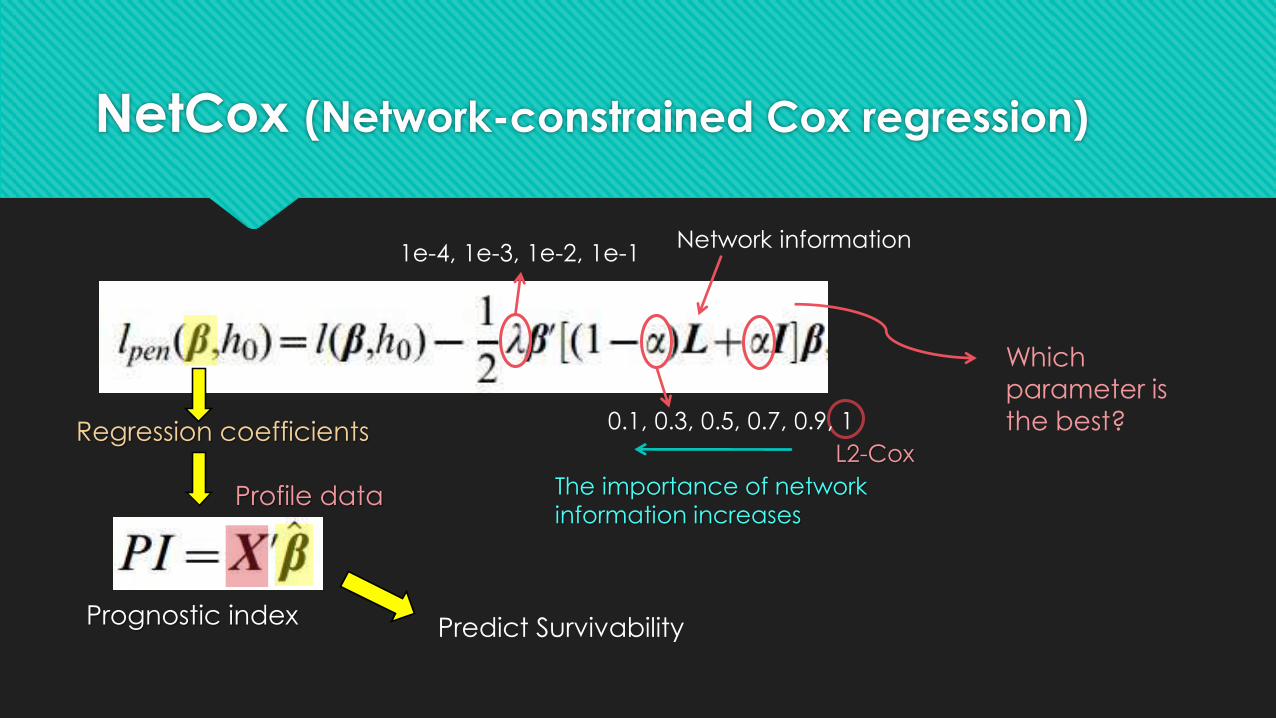
NetCox (Network-constrained Cox regression)
Network information1e-4, 1e-3, 1e-2, 1e-1
0.1, 0.3, 0.5, 0.7, 0.9, 1
L2-Cox
The importance of network
information increases
Regression coefficients
Prognostic index
Profile data
Which
parameter is
the best?
Predict Survivability

Cross validation for optimal parameters
profileG
10022
10022
network
profileX
Data
340 patients
10022 genes
1
1
0
1
…
340 patients
Clinical outcome
uncensored
(deceased)
censored
(living)
Test set Training set
5-fold cross validation
Sort in ascending order
by survival time of patients
test
profileX
NetCox training
'XPI
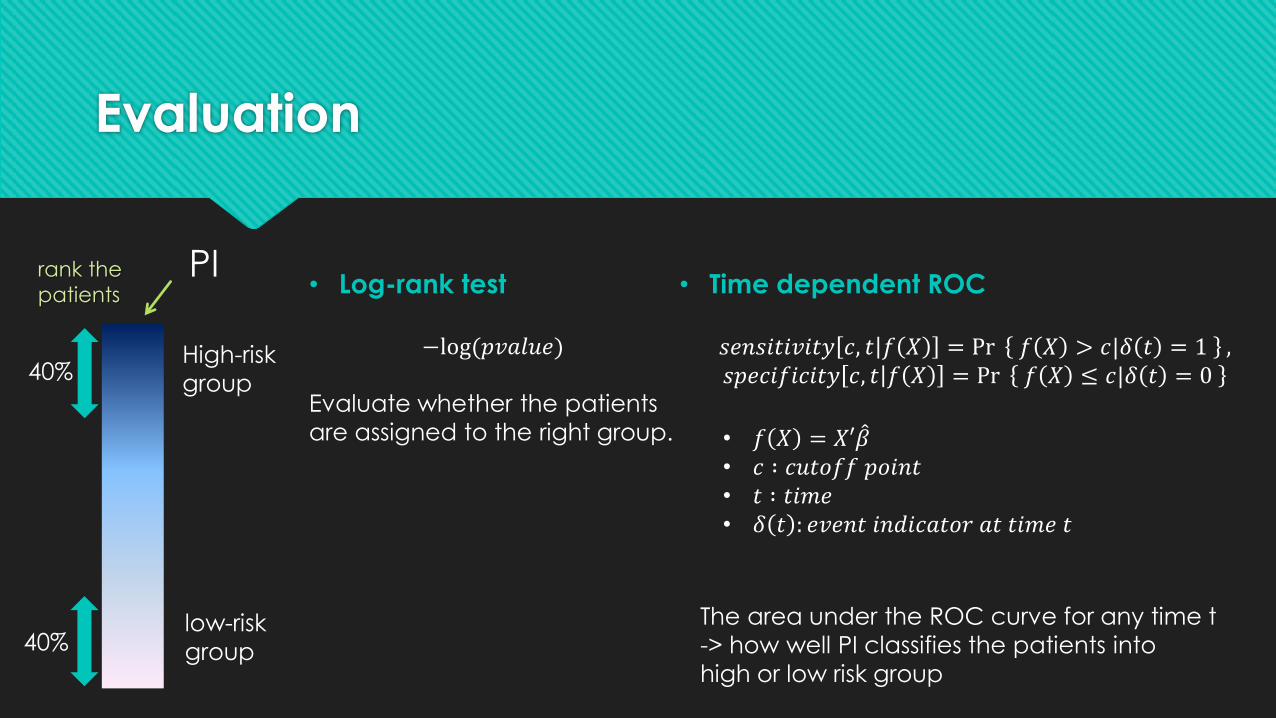
Evaluation
40%
40%
High-risk
group
low-risk
group
PIrank the
patients • Log-rank test • Time dependent ROC
𝑠𝑒𝑛𝑠𝑖𝑡𝑖𝑣𝑖𝑡𝑦 𝑐, 𝑡 𝑓 𝑋 = Pr 𝑓 𝑋 > 𝑐|𝛿 𝑡 = 1 ,𝑠𝑝𝑒𝑐𝑖𝑓𝑖𝑐𝑖𝑡𝑦 𝑐, 𝑡 𝑓 𝑋 = Pr 𝑓 𝑋 ≤ 𝑐|𝛿 𝑡 = 0
• 𝑓 𝑋 = 𝑋′ 𝛽• 𝑐 ∶ 𝑐𝑢𝑡𝑜𝑓𝑓 𝑝𝑜𝑖𝑛𝑡• 𝑡 ∶ 𝑡𝑖𝑚𝑒• 𝛿 𝑡 : 𝑒𝑣𝑒𝑛𝑡 𝑖𝑛𝑑𝑖𝑐𝑎𝑡𝑜𝑟 𝑎𝑡 𝑡𝑖𝑚𝑒 𝑡
The area under the ROC curve for any time t
-> how well PI classifies the patients into
high or low risk group
−log(𝑝𝑣𝑎𝑙𝑢𝑒)
Evaluate whether the patients
are assigned to the right group.
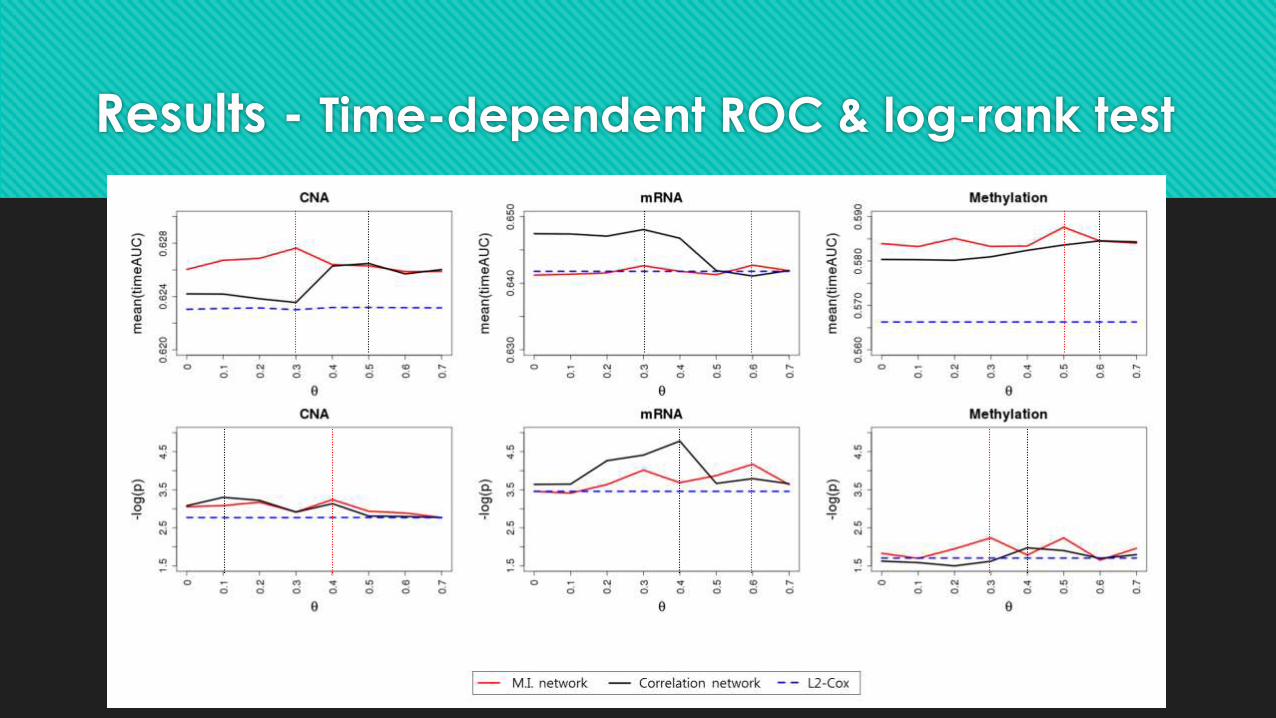
Results - Time-dependent ROC & log-rank test
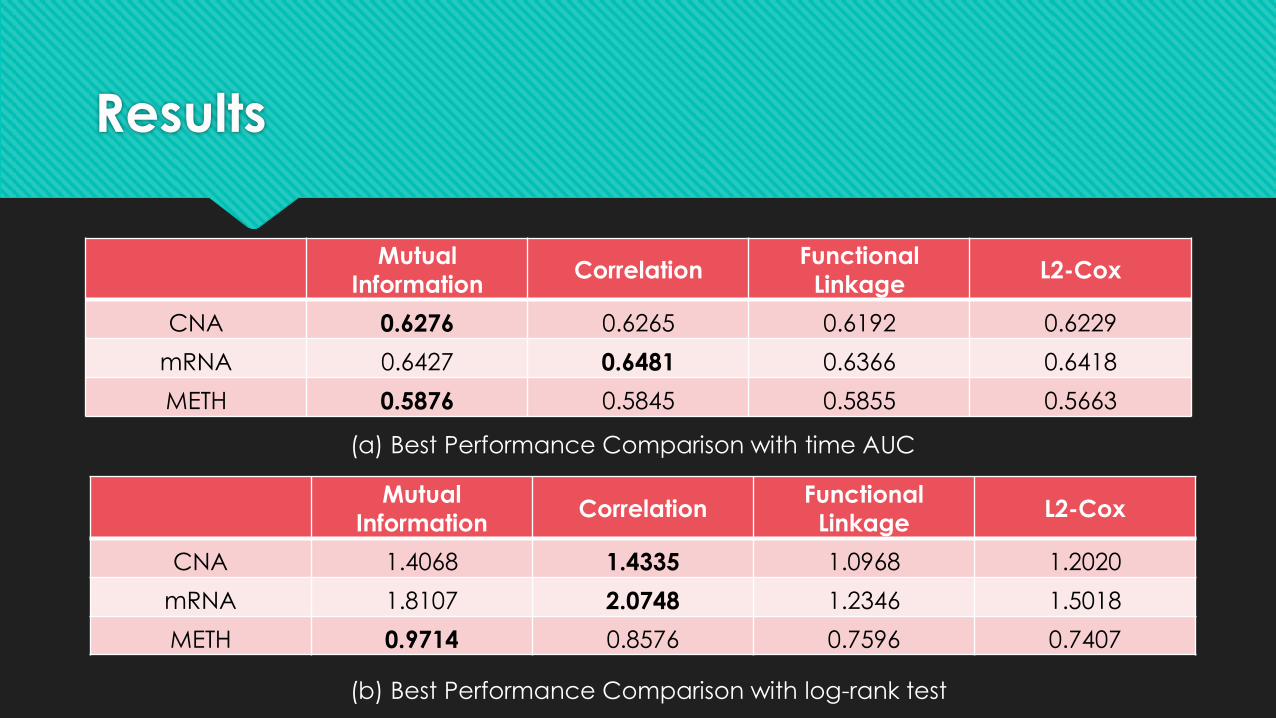
Results
Mutual
InformationCorrelation
Functional
LinkageL2-Cox
CNA 0.6276 0.6265 0.6192 0.6229
mRNA 0.6427 0.6481 0.6366 0.6418
METH 0.5876 0.5845 0.5855 0.5663
Mutual
InformationCorrelation
Functional
LinkageL2-Cox
CNA 1.4068 1.4335 1.0968 1.2020
mRNA 1.8107 2.0748 1.2346 1.5018
METH 0.9714 0.8576 0.7596 0.7407
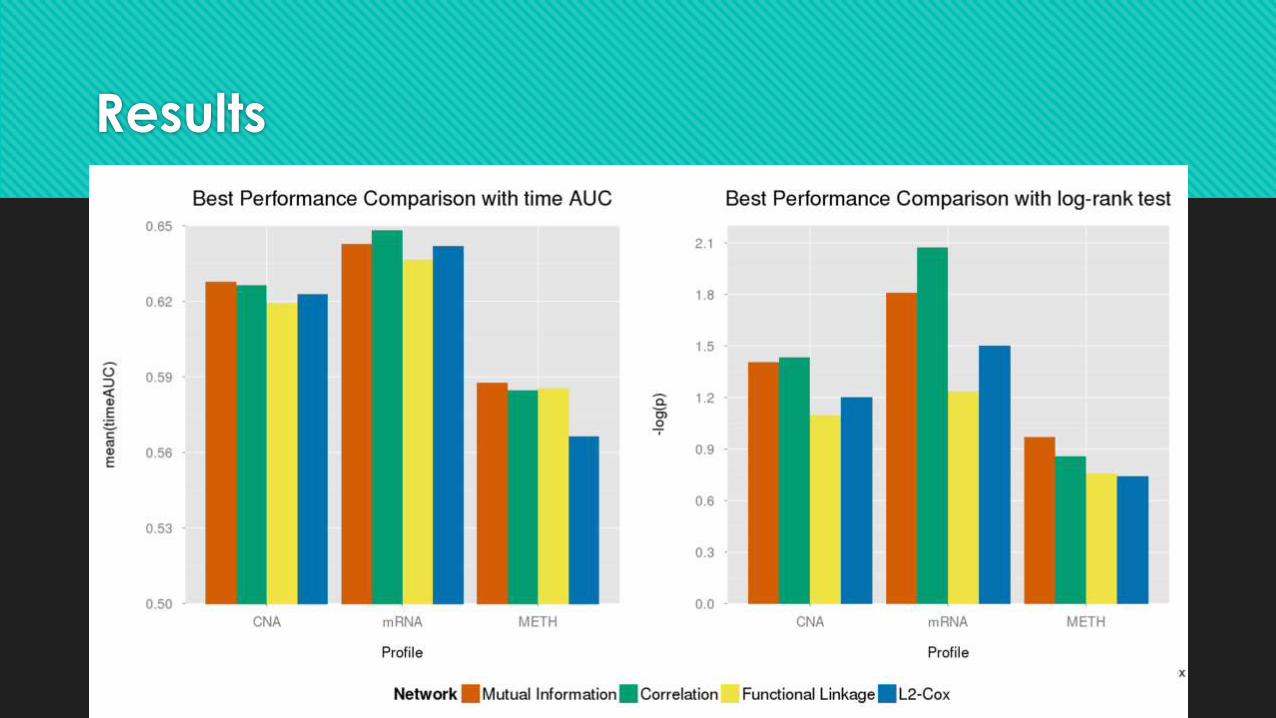
(a) Best Performance Comparison with time AUC
(b) Best Performance Comparison with log-rank test
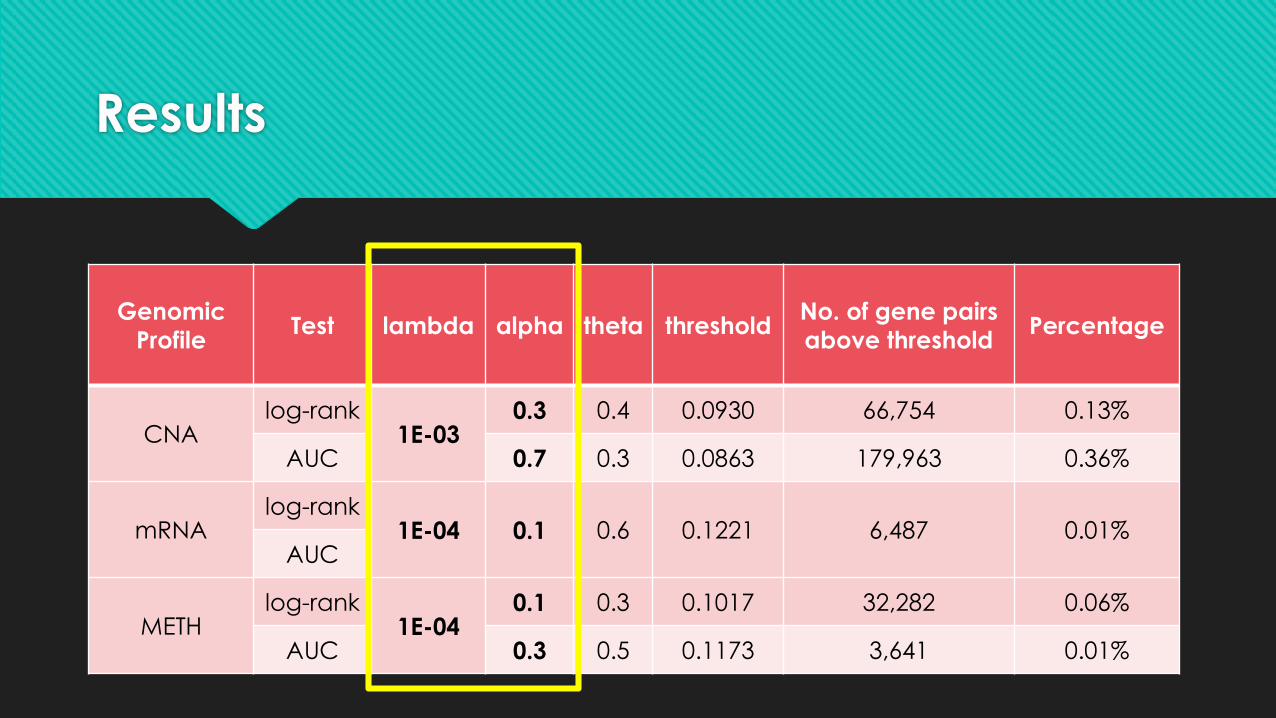
Results
Results
Genomic
ProfileTest lambda alpha theta threshold
No. of gene pairs
above thresholdPercentage
CNAlog-rank
1E-030.3 0.4 0.0930 66,754 0.13%
AUC 0.7 0.3 0.0863 179,963 0.36%
mRNAlog-rank
1E-04 0.1 0.6 0.1221 6,487 0.01%AUC
METHlog-rank
1E-040.1 0.3 0.1017 32,282 0.06%
AUC 0.3 0.5 0.1173 3,641 0.01%
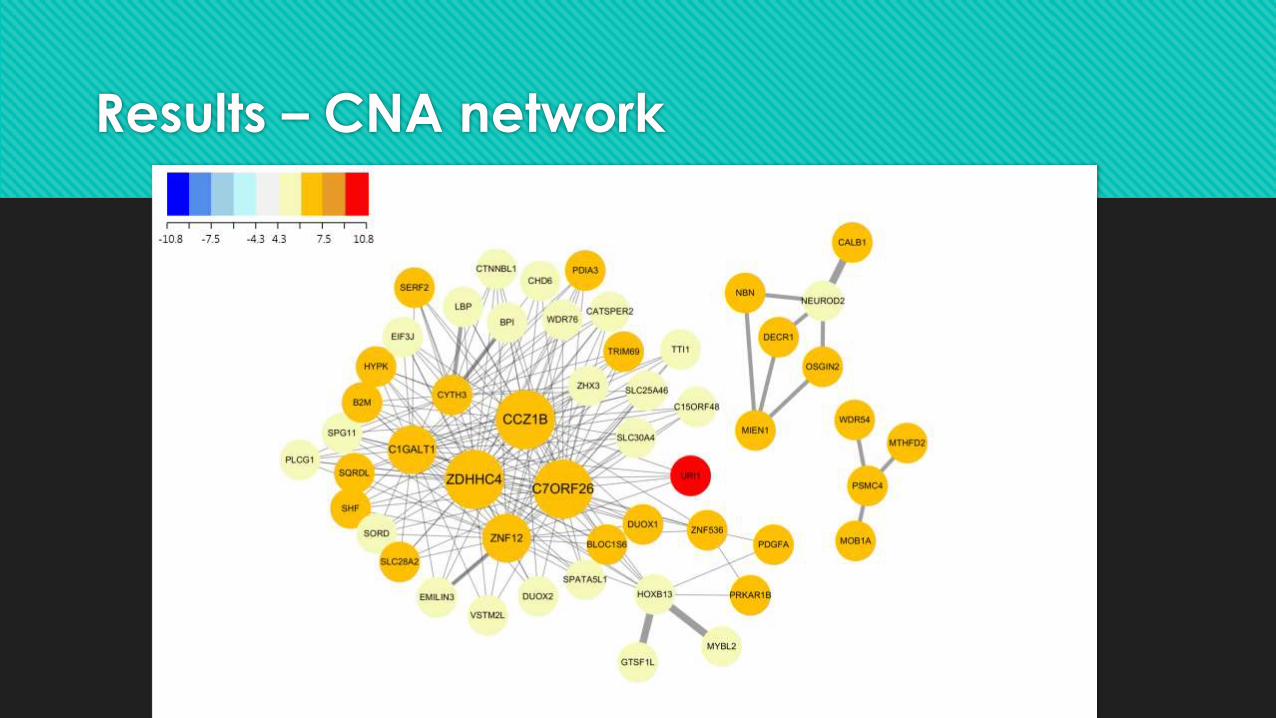
Results – CNA network
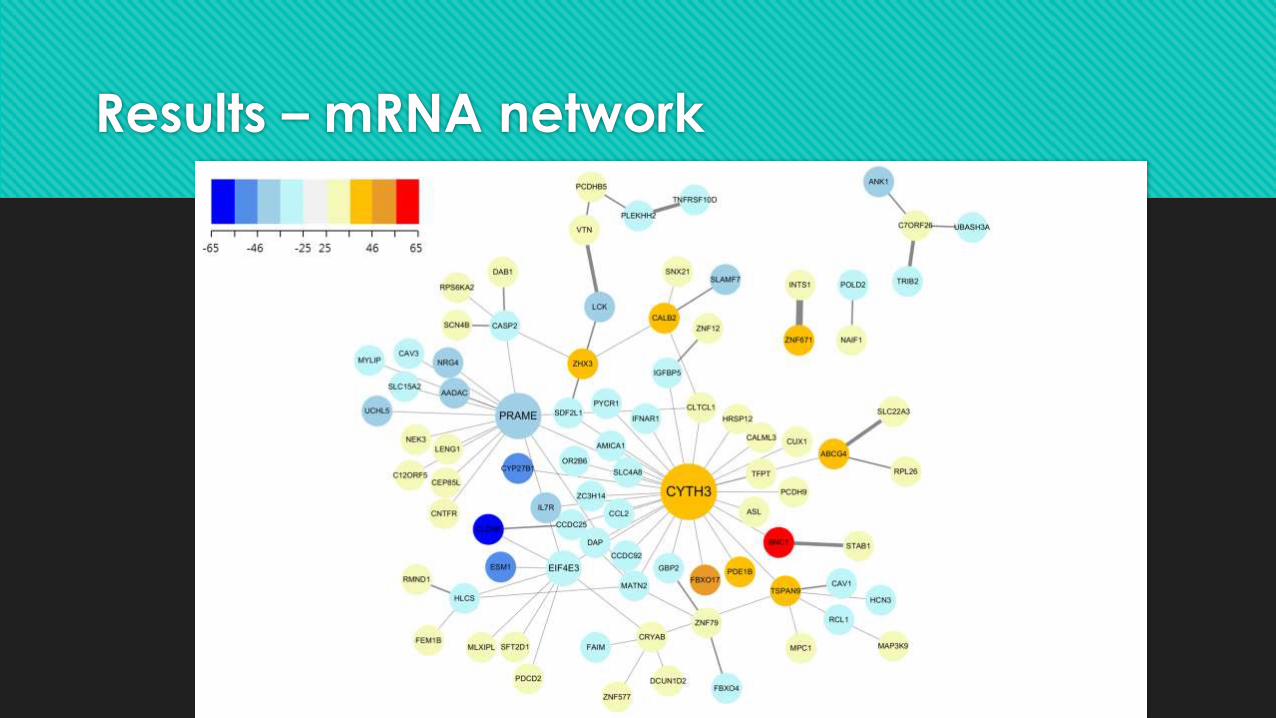
Results – mRNA network
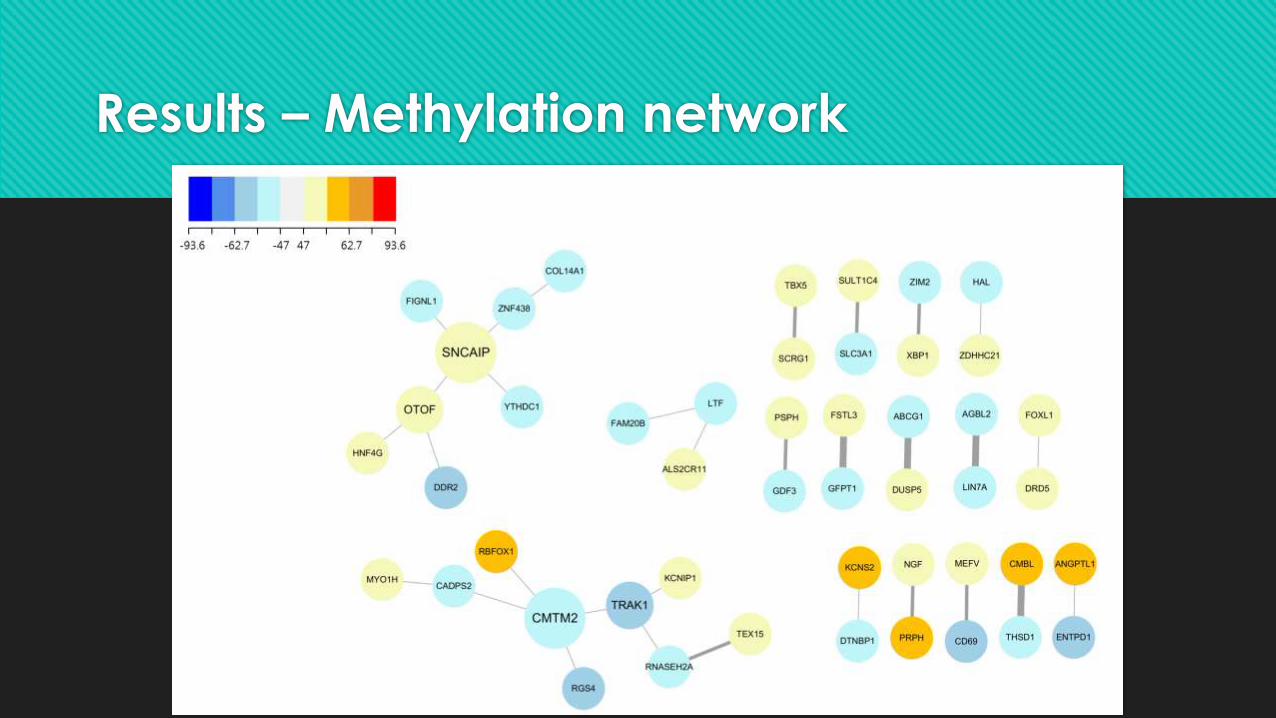
Results – Methylation network
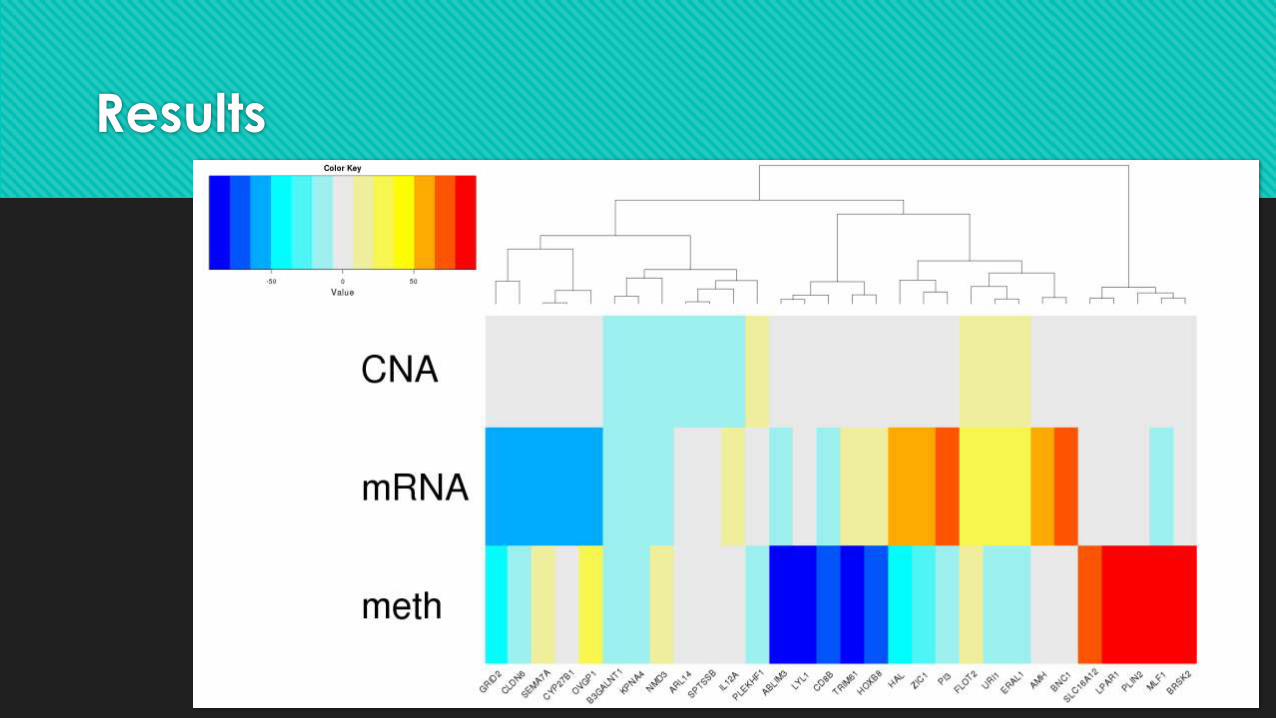
Results
Results
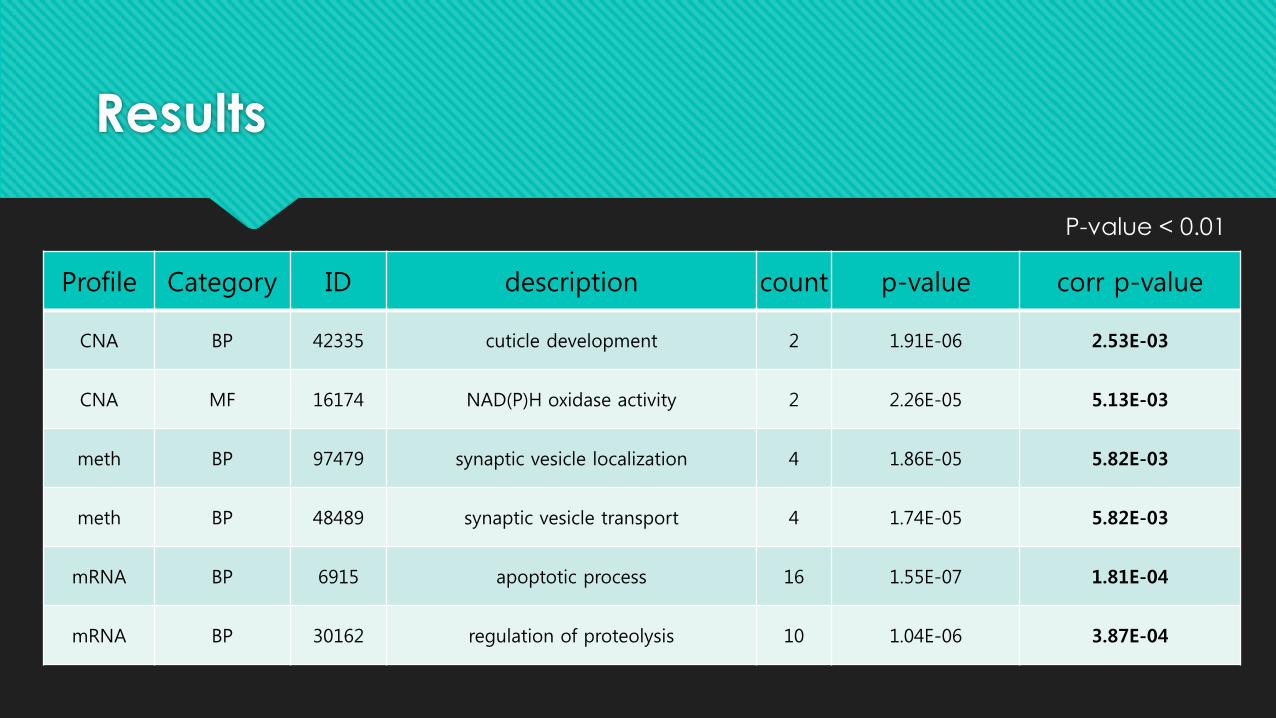
Profile Category ID description count p-value corr p-value
CNA BP 42335 cuticle development 2 1.91E-06 2.53E-03
CNA MF 16174 NAD(P)H oxidase activity 2 2.26E-05 5.13E-03
meth BP 97479 synaptic vesicle localization 4 1.86E-05 5.82E-03
meth BP 48489 synaptic vesicle transport 4 1.74E-05 5.82E-03
mRNA BP 6915 apoptotic process 16 1.55E-07 1.81E-04
mRNA BP 30162 regulation of proteolysis 10 1.04E-06 3.87E-04
P-value < 0.01