รายงานการวิจัย ชนิดแข็งใน ... · 2014-10-14 · ii...
TRANSCRIPT

รายงานการวิจัยความคุ้มค่าของการผ่าตัดต้อกระจกโดยใส่เลนส์แก้วตาเทียมชนิดนิ่มเปรียบเทียบกับชนิดแข็งในบริบทของประเทศไทย
Cost-effectiveness Analysis of Cataract Surgery Using a Foldableand a Rigid Intraocular Lensin Thailand
โครงการนี้ไดรับทุนสนับสนุนจากสำนักงานวิจัยเพื่อการพัฒนาหลักประกันสุขภาพไทย (สวปก.)
ดวงตามืดมัวหมองหมน หากในใจตน
ยังคงสวางสุกใส
โลกกวางใหญนี้ทั้งใบ เห็นไดดวยใจ
ชางงดงามเหลือประมาณ
ดวงตาสวางใสตระการ แตใจมืดมาร
มิอาจเปนสุขไดเลย
เปดใจกวางอยานิ่งเฉย ใชตาจนเคย
ละเลยคุณคาของใจ
พญ.กัลยา ตีระวัฒนานนท
28/5/2553
รายงานการวิจัย ความคุ้ มค่ าของการผ่ าตัดต้ อกระจกโดยใส่ เลนส์ แก้ วตาเทียมชนิดนิ่มเปรียบเทียบกับชนิดแข็งในบริบทของประเทศไทย
โครงการประเมินเทคโนโลยีและนโยบายด้านสุขภาพชั้น 6 อาคาร 6 กรมอนามัย
กระทรวงสาธารณสุข ถ.ติวานนท์ อ.เมือง จ.นนทบุรี 11000โทร : 02-590-4549, 02-290-4374-5
โทรสาร : 02-590-4369www.hitap.net

√“¬ß“π°“√«‘®—¬
§«“¡§ÿâ¡§à“¢Õß°“√ºà“µ—¥µâÕ°√–®°‚¥¬„ à‡≈π 巰⫵“‡∑’¬¡™π‘¥π‘Ë¡‡ª√’¬∫‡∑’¬∫°—∫™π‘¥·¢Áß„π∫√‘∫∑¢Õߪ√–‡∑»‰∑¬
Cost-effectiveness Analysis of Cataract SurgeryUsing a Foldable and a Rigid Intraocular
Lens in Thailand
‚¥¬
æ≠.°—≈¬“ µ’√–«—≤π“ππ∑å
√—°¡≥’ ∫ÿµ√™π
æ≠.¢«—≠„® «ß»å°‘µµ‘√—°…å
™π‘¥“ ‡≈‘»æ‘∑—°…åæß»å
∏’√– »‘√‘ ¡ÿ¥
¿≠.ªƒ…∞æ√ °‘Ëß·°â«
º».¥√.¿≠.Õÿ…“ ©“¬‡°≈Á¥·°â«
¥√.πæ.¬» µ’√–«—≤π“ππ∑å
‚§√ß°“√π’ȉ¥â√—∫∑ÿπ π—∫ πÿπ®“°
”π—°ß“π«‘®—¬‡æ◊ËÕ°“√æ—≤π“À≈—°ª√–°—π ÿ¢¿“æ‰∑¬ ( «ª°.)
‚§√ß°“√ª√–‡¡‘π‡∑§‚π‚≈¬’·≈–π‚¬∫“¬¥â“π ÿ¢¿“æ
™—Èπ 6 Õ“§“√ 6 °√¡Õπ“¡—¬
°√–∑√«ß “∏“√≥ ÿ¢ ∂.µ‘«“ππ∑å Õ.‡¡◊Õß ®.ππ∑∫ÿ√’ 11000
‚∑√ : 0-2590-4549, 0-2590-4374-5
‚∑√ “√ : 0-2590-4369
Website : www.hitap.net
E-mail : [email protected]
æ‘¡æå§√—Èß∑’Ë 1 ¡‘∂ÿπ“¬π 2553
®”π«π 500 ‡≈à¡
æ‘¡æå∑’Ë : ∫√‘…—∑ ‡¥Õ– °√“øî‚° ´‘ ‡µÁ¡ å ®”°—¥
119/138 ∂.µ‘«“ππ∑å ´.3 µ.µ≈“¥¢«—≠ Õ.‡¡◊Õß ®.ππ∑∫ÿ√’ 11000
‚∑√ : 0-2525-1121, 0-2525-4669-70 ‚∑√ “√ : 0-2525-1272
E-mail : [email protected]

‚§√ß°“√»÷°…“°√Õ∫§«“¡√à«¡¡◊Õ√–À«à“ß‚√ß欓∫“≈„π —ß°—¥°√–∑√«ß “∏“√≥ ÿ¢·≈–¿“§‡Õ°™π i
2553

ii
(Health
Intervention and Technology Assessment Program HITAP)
( .)
( .)
( .)
Health Intervention and Technology Assessment Program‚§√ß°“√ª√–‡¡‘π‡∑§‚π‚≈¬’·≈–π‚¬∫“¬¥â“π ÿ¢¿“æ

‚§√ß°“√»÷°…“°√Õ∫§«“¡√à«¡¡◊Õ√–À«à“ß‚√ß欓∫“≈„π —ß°—¥°√–∑√«ß “∏“√≥ ÿ¢·≈–¿“§‡Õ°™π iii
(1)
1 . . 2546 – 31 . . 2550
( .) (2)
decision tree
( 95)
1
52
22
200,000
( .)
200,000

iv
.
.
238
55
378
Health Intervention and Technology Assessment Program‚§√ß°“√ª√–‡¡‘π‡∑§‚π‚≈¬’·≈–π‚¬∫“¬¥â“π ÿ¢¿“æ

‚§√ß°“√»÷°…“°√Õ∫§«“¡√à«¡¡◊Õ√–À«à“ß‚√ß欓∫“≈„π —ß°—¥°√–∑√«ß “∏“√≥ ÿ¢·≈–¿“§‡Õ°™π v
Abstract
This study aims to evaluate the accessibility of cataract surgery as well as the
factors associated with accessibility, paying particular attention to the comparison
between two health insurance coverage schemes i.e. the Civil Servant Medical Benefit
scheme (CSMBS) and the Universal Coverage scheme (UC). Data was obtained from
the Central Office for Healthcare Information (CHI) and the National Health Security
Office (NHSO). Moreover, this study also assessed the value for money of foldable
intraocular lens insertion in cataract surgery compared to rigid intraocular lens insertion
under the Thai context. The model-based economic evaluation was conducted using a
healthcare provider’s perspective.
Regarding the accessibility of cataract surgery, there was an increasing number
of cataract surgeries performed each year over the last 5 years, especially among those
under the UC. Most UC patients (95%) undertook the surgery in the same provinces
where they were eligible for the treatment. It was found that larger provinces had a
higher cataract surgery rate per population. One ophthalmologist would significantly
increase the rate of cataract surgery (52 times). Furthermore, patients under the
CSMBS were 22 times more likely to undergo cataract surgery using foldable
intraocular lens compared to those under the UC scheme. The patients with rigid
intraocular lens insertion had significantly more surgical complications than those with
foldable intraocular lens. It was also noted that those patients undergoing cataract
surgery at teaching hospitals or private hospitals had a significantly higher rate of
surgical complications than those receiving treatment at provincial hospitals.
The cost-effectiveness analysis of cataract surgery indicated that foldable
intraocular lens insertion was not cost-effective given the willingness to pay threshold
(ceiling threshold) at 200,000 Baht per quality adjusted life year (QALY). The
Subcommittee for Development of Health Benefit Package and Service Delivery of the

vi
NHSO concurred with this judgment. Results of this study are in accordance with the
current NHSO policy which supports the use of a rigid intraocular lens.
In addition, this study shows that the current rate for reimbursement of both rigid
and foldable intraocular lens are much higher than the current market prices obtained
from the price survey conducted by the research team. It was estimated that the UC
scheme would save 238 million baht and the CSMBS would save 55 million baht per
year if they set the new reimbursement rate for the lens. Moreover, If the
reimbursement rate was set equally (using the rate of rigid intraocular lens) to support
the use of rigid intraocular lens as indicated in the cost-effectiveness analysis, both the
UC scheme and CSMBS would save the healthcare budget 378 million Baht annually.
Health Intervention and Technology Assessment Program‚§√ß°“√ª√–‡¡‘π‡∑§‚π‚≈¬’·≈–π‚¬∫“¬¥â“π ÿ¢¿“æ

‚§√ß°“√»÷°…“°√Õ∫§«“¡√à«¡¡◊Õ√–À«à“ß‚√ß欓∫“≈„π —ß°—¥°√–∑√«ß “∏“√≥ ÿ¢·≈–¿“§‡Õ°™π vii
i
ii
iii
Abstract v
1
3
1:
4
1.1 4
1.2 5
1.2.1 5
1.2.2
6
1.2.3 8
1.2.4
9
1.3 16
1.3.1
16
1.3.2 26
1.3.3
32
2: 47
2.1 47
2.2 47
2.2.1 47
2.3 58
2.3.1
58

viii
( )
61
3.1 61
3.2 65
3.3 65
66
72
Health Intervention and Technology Assessment Program‚§√ß°“√ª√–‡¡‘π‡∑§‚π‚≈¬’·≈–π‚¬∫“¬¥â“π ÿ¢¿“æ

‚§√ß°“√»÷°…“°√Õ∫§«“¡√à«¡¡◊Õ√–À«à“ß‚√ß欓∫“≈„π —ß°—¥°√–∑√«ß “∏“√≥ ÿ¢·≈–¿“§‡Õ°™π ix
1 (UC)
. . 2549
10
2
13
3 . .
2548 – 2550 19
4 27
5
29
6 31
7 Logistic regression 33
8 Logistic regression 33
9 Purulent endophthalmitis (H440) 35
10 Logistic regression 36
11 Choroidal hemorrhage and rupture (H313) 37
12 Logistic regression 38
13 Hyphema (H210) 39
14 Logistic regression 40
15 Other corneal edema (H182) 41
16 Logistic regression 42
17 Complication of procedures (T81) 43
18 Logistic regression 44
19 Mechanical complication of intraocular lens 45
20 Logistic regression 46
21
53
22 54
23 54
24 55
25 56

( )
26 56
27 58
28 59
29 64
30 72
31 73
32 ( )
( .)
74
33
78
34 . . 2546 – 2550
79
35 . . 2546 – 2550
80
36 . . 2548 – 2550
84
xHealth Intervention and Technology Assessment Program‚§√ß°“√ª√–‡¡‘π‡∑§‚π‚≈¬’·≈–π‚¬∫“¬¥â“π ÿ¢¿“æ

1
7
2
. . 2546 – 2550 17
3
. . 2546 – 2550 17
4 . . 2546 –
2550 18
5
. . 2548 – 2550 19
6 . . 2548 20
7 . . 2548 21
8 . . 2549 21
9 . . 2549 22
10 . . 2550 22
11 . . 2550 23
12 24
13 25
14 decision tree
48
15
60
16
. . 2548 81
17
. . 2549 82
18
. . 2550 83
‚§√ß°“√»÷°…“°√Õ∫§«“¡√à«¡¡◊Õ√–À«à“ß‚√ß欓∫“≈„π —ß°—¥°√–∑√«ß “∏“√≥ ÿ¢·≈–¿“§‡Õ°™π xi


√“¬ß“π°“√«‘®—¬ §«“¡§ÿâ¡§à“¢Õß°“√ºà“µ—¥µâÕ°√–®°‚¥¬„ à‡≈π 巰⫵“‡∑’¬¡™π‘¥π‘Ë¡‡ª√’¬∫‡∑’’¬∫°—∫™π‘¥·¢Áß„π∫√‘∫∑¢Õߪ√–‡∑»‰∑¬ 1
(Crystalline lens)
(1) . .
2545 17.6 47.83
. . 2537 74.6
. .2549 – 2550
(2)
(Blinding cataract)
100 100,000 (2)
. . 2537
5.77, 3.50, 3.16 1.69
1,000 60 94.34(3)
. .
2549 - 2550 (Cataract backlog)
(4,5)
10
(6-9)

2Health Intervention and Technology Assessment Program‚§√ß°“√ª√–‡¡‘π‡∑§‚π‚≈¬’·≈–π‚¬∫“¬¥â“π ÿ¢¿“æ
. . 2537 (10)
(Rigid non-foldable lens)
700 – 4,000 (11)
(12)
(Phacoemulsification) 3 - 4 .(13)
(Foldable lens)
( 6,000 )
40-59 40
59
(14)
(Multifocal intraocular lens)
(15)
4,000
2,000
6,000

√“¬ß“π°“√«‘®—¬ §«“¡§ÿâ¡§à“¢Õß°“√ºà“µ—¥µâÕ°√–®°‚¥¬„ à‡≈π 巰⫵“‡∑’¬¡™π‘¥π‘Ë¡‡ª√’¬∫‡∑’’¬∫°—∫™π‘¥·¢Áß„π∫√‘∫∑¢Õߪ√–‡∑»‰∑¬ 3
2
(16)
(Monofocal) (Multifocal)
(17)
( .) . . 2551
1.1
1.2
1.3
2
1. 1.1 1.2
2. 1.3

4Health Intervention and Technology Assessment Program‚§√ß°“√ª√–‡¡‘π‡∑§‚π‚≈¬’·≈–π‚¬∫“¬¥â“π ÿ¢¿“æ
1:
1.1
1.1.1
-
-
- (Complication)
1.1.2
-
-
-
1.1.3
-
-
-

√“¬ß“π°“√«‘®—¬ §«“¡§ÿâ¡§à“¢Õß°“√ºà“µ—¥µâÕ°√–®°‚¥¬„ à‡≈π 巰⫵“‡∑’¬¡™π‘¥π‘Ë¡‡ª√’¬∫‡∑’’¬∫°—∫™π‘¥·¢Áß„π∫√‘∫∑¢Õߪ√–‡∑»‰∑¬ 5
1.2
1.2.1
2
(1) ( .)
1
. . 2546 – 31 . . 2550
(Diagnosis related group;
DRGs)* ( 30 31 32
)
(2)
†
1 . .2549 (18)
DMIS 33
* ( 4,000 + DRGs) (Refer)
NHSO † 7,000 ( DRGs) active case finding
MOU Follow up
DMIS

6Health Intervention and Technology Assessment Program‚§√ß°“√ª√–‡¡‘π‡∑§‚π‚≈¬’·≈–π‚¬∫“¬¥â“π ÿ¢¿“æ
1.2.2
1.2.2.1
. . 2548 – 2550
( 31 )
1 20
‡ (bias)
Psi = i
Ps =
Ci = i
K = 1,000 ( 1,000 )
. .2548
– 2550 ArcView GIS
1. . .2548 - 2550
2. . .2548-2550
3.
‡ www.dopa.go.th
= [( Psi * Ci) / Ps] * K

√“¬ß“π°“√«‘®—¬ §«“¡§ÿâ¡§à“¢Õß°“√ºà“µ—¥µâÕ°√–®°‚¥¬„ à‡≈π 巰⫵“‡∑’¬¡™π‘¥π‘Ë¡‡ª√’¬∫‡∑’’¬∫°—∫™π‘¥·¢Áß„π∫√‘∫∑¢Õߪ√–‡∑»‰∑¬ 7
HMAIN
1
1
:
:
:
:
:
: = :
- - -

8Health Intervention and Technology Assessment Program‚§√ß°“√ª√–‡¡‘π‡∑§‚π‚≈¬’·≈–π‚¬∫“¬¥â“π ÿ¢¿“æ
1.2.2.2
. .2548 – 2550
. .2548 – 2550 (19)
No_oph =
Pp =
K = 100,000 ( 100,000 )
ArcView GIS
1.2.3
1.2.3.1
1 . . 2549 - 31
. . 2549
Chi - square
(UC= ; CSMBS=
) (0= ; 1= ) (2006= ; 2007=
)
= (No_oph / Pp) * K

√“¬ß“π°“√«‘®—¬ §«“¡§ÿâ¡§à“¢Õß°“√ºà“µ—¥µâÕ°√–®°‚¥¬„ à‡≈π 巰⫵“‡∑’¬¡™π‘¥π‘Ë¡‡ª√’¬∫‡∑’’¬∫°—∫™π‘¥·¢Áß„π∫√‘∫∑¢Õߪ√–‡∑»‰∑¬ 9
1.2.3.2
. . 2549 (7
1,000 )
(1 1,000 )
Chi - square
(0= ; 1= )
(2006= ; 2007= )
1.2.3.3
. . 2549
Chi-square t-test
(0= ; 1=
) ( ) (0=UC; 1=CSMBS)
1.2.4
(Complication)
1.2.4.1
. . 2549 20
20 ( 1)

10Health Intervention and Technology Assessment Program‚§√ß°“√ª√–‡¡‘π‡∑§‚π‚≈¬’·≈–π‚¬∫“¬¥â“π ÿ¢¿“æ
Logistic regression Forward Stepwise
1. / ( )§
2.
3.
4.
1 (UC) . .
2549
(Y=1)
UC
. (map)-
1,000
(Y=0)
UC
. (map)-
1,000
6.609 0.866
6.540 1.116
6.296 1.407
5.453 1.410
5.055 1.573
4.826 1.600
4.580 1.634
4.563 1.735
4.390 1.747
4.262 1.845
4.143 1.867
4.082 1.882
4.036 1.915
3.910 1.937
3.825 1.994
3.805 1.997
3.690 2.091
3.547 2.108
3.502 2.132
3.406 2.143
§ / www.nso.go.th

√“¬ß“π°“√«‘®—¬ §«“¡§ÿâ¡§à“¢Õß°“√ºà“µ—¥µâÕ°√–®°‚¥¬„ à‡≈π 巰⫵“‡∑’¬¡™π‘¥π‘Ë¡‡ª√’¬∫‡∑’’¬∫°—∫™π‘¥·¢Áß„π∫√‘∫∑¢Õߪ√–‡∑»‰∑¬ 11
1.2.4.2
. . 2549 (ICD9)
Logistic regression Forward Stepwise
1. (0= ; 1= )
2. ( )
3. (0=UC; 1=CSMBS)
4. 6
- ( ) (0)
- ( ) (1)
- (2)
- (3)
- (4)
- (5)**
1.2.4.3
. . 2549 – 2550
(Early complications)
1. (Purulent endophthalmitis)
2. (Choroidal hemorrhage and rupture)
3. (Hyphema)
4. (Other corneal edema)
5. (Complication of procedures)
6. (Mechanical complication of
intraocular lens)
** ( )

12Health Intervention and Technology Assessment Program‚§√ß°“√ª√–‡¡‘π‡∑§‚π‚≈¬’·≈–π‚¬∫“¬¥â“π ÿ¢¿“æ
(Logistic
regression) Forward Stepwise
1. (0= ; 1= )
2. ( )
3. (0=UC; 1=CSMBS)
4. (0=Non-Foldable; 1=Foldable)
5. 6
- ( ) (0)
- ( ) (1)
- (2)
- (3)
- (4)
- (5)
2

√“¬ß“π°“√«‘®—¬ §«“¡§ÿâ¡§à“¢Õß°“√ºà“µ—¥µâÕ°√–®°‚¥¬„ à‡≈π 巰⫵“‡∑’¬¡™π‘¥π‘Ë¡‡ª√’¬∫‡∑’’¬∫°—∫™π‘¥·¢Áß„π∫√‘∫∑¢Õߪ√–‡∑»‰∑¬ 13
2
Chi
- s
quar
e
:
1.
UC
=;
CSM
BS=
2.
(0=
; 1=
)
3.
4.
(20
06=
; 20
07=
)
..
2549
Chi
- s
quar
e
:
1.
(7
:.
1,00
0 )
(1
:.
1,00
0 )
2.
3.
()
4.

14Health Intervention and Technology Assessment Program‚§√ß°“√ª√–‡¡‘π‡∑§‚π‚≈¬’·≈–π‚¬∫“¬¥â“π ÿ¢¿“æ
2 (
)
Logi
stic
reg
ress
ion
:
(1)
(0)
( 2
0 )
:
1.
/
2.
3.
4.
Logi
stic
reg
ress
ion
: (0=
Non
-Fol
dabl
e; 1
=Fol
dabl
e)
:
1.
(0=
; 1=
)
2.
()
3.
(0=
UC
; 1=
CSM
BS)
4.
(0=
;
1=; 2=
;
3=; 4=
;
5=)

√“¬ß“π°“√«‘®—¬ §«“¡§ÿâ¡§à“¢Õß°“√ºà“µ—¥µâÕ°√–®°‚¥¬„ à‡≈π 巰⫵“‡∑’¬¡™π‘¥π‘Ë¡‡ª√’¬∫‡∑’’¬∫°—∫™π‘¥·¢Áß„π∫√‘∫∑¢Õߪ√–‡∑»‰∑¬ 15
2 (
)
(co
mpl
icat
ion)
Chi
- s
quar
e lo
gist
ic reg
ress
ion
:
1. Pur
ulen
t en
doph
thal
miti
s
2. C
horo
idal
hem
orrh
age
and
rupt
ure
3.
Hyp
hem
a
4.
Oth
er c
orne
al e
dem
a
5.
Com
plic
atio
n of
pro
cedu
res
6.
Mec
hani
cal c
ompl
icat
ion
of in
trao
cula
r le
ns
:
1.
(0=
; 1=
)
2.
()
3.
(0=
UC
; 1=
CSM
BS)
4.
(0=
Non
-Fol
dabl
e; 1
=Fol
dabl
e)
5.
(0=
;
1=; 2=
;
3=; 4=
;
5=)

16Health Intervention and Technology Assessment Program‚§√ß°“√ª√–‡¡‘π‡∑§‚π‚≈¬’·≈–π‚¬∫“¬¥â“π ÿ¢¿“æ
1.3
3
1.3.1
(Complication)
1.3.1.1
1
. .2546 – 31 . .2550
456,692
4 10
65 – 74 ( 42.6)
4 10
65 – 74 ( 41.4 45.3)
2 35

√“¬ß“π°“√«‘®—¬ §«“¡§ÿâ¡§à“¢Õß°“√ºà“µ—¥µâÕ°√–®°‚¥¬„ à‡≈π 巰⫵“‡∑’¬¡™π‘¥π‘Ë¡‡ª√’¬∫‡∑’’¬∫°—∫™π‘¥·¢Áß„π∫√‘∫∑¢Õߪ√–‡∑»‰∑¬ 17
2 . . 2546 -
2550
( 256,517
( 57.3) 191,175 ( 42.7) )
( 3)
3 . .2546 -
2550

18Health Intervention and Technology Assessment Program‚§√ß°“√ª√–‡¡‘π‡∑§‚π‚≈¬’·≈–π‚¬∫“¬¥â“π ÿ¢¿“æ
(CSMBS)
151,379 ( 33.2) (UC) 305,313
( 66.8)
1
2
. . 2549 ( 84,862 ) ( 4)
4 . . 2546 – 2550
. . 2548 - 2550
207,614 86,798
( 41.8) 120,816 ( 58.2)
130,820 106,480
( 81.4) 24,340 ( 18.6)
76,794 62,458 ( 81.3)
14,336 ( 18.7)
3

√“¬ß“π°“√«‘®—¬ §«“¡§ÿâ¡§à“¢Õß°“√ºà“µ—¥µâÕ°√–®°‚¥¬„ à‡≈π 巰⫵“‡∑’¬¡™π‘¥π‘Ë¡‡ª√’¬∫‡∑’’¬∫°—∫™π‘¥·¢Áß„π∫√‘∫∑¢Õߪ√–‡∑»‰∑¬ 19
5 . .
2548 - 2550
3 . .2548 – 2550
2548 2549 2550
UC CS UC CS UC CS UC CS
Foldable 2,356 14,558 10,169 21,769 11,815 26,131 24,340 62,458 86,798
(18.2) (78.3) (16.8) (81.8) (20.5) (82.7) (18.6) (81.3) (41.8)
non-foldable 10,577 4,029 50,223 4,852 45,680 5,455 10,6480 14,336 120,816
(81.8) (21.7) (83.2) (18.2) (79.5) (17.3) (81.4) (18.7) (58.2)
12,933 18,587 60,392 26,621 57,495 31,586 130,820 76,794 207,614

20Health Intervention and Technology Assessment Program‚§√ß°“√ª√–‡¡‘π‡∑§‚π‚≈¬’·≈–π‚¬∫“¬¥â“π ÿ¢¿“æ
1.3.1.2
. . 2549
1,000 5
(6.61 6.54 6.30 5.45 5.05
1,000 ) 6
(3.9 2.3 2.0 1.6 1.6
1.6 100,000 ) 6 -11
6 . . 2548

√“¬ß“π°“√«‘®—¬ §«“¡§ÿâ¡§à“¢Õß°“√ºà“µ—¥µâÕ°√–®°‚¥¬„ à‡≈π 巰⫵“‡∑’¬¡™π‘¥π‘Ë¡‡ª√’¬∫‡∑’’¬∫°—∫™π‘¥·¢Áß„π∫√‘∫∑¢Õߪ√–‡∑»‰∑¬ 21
7 . . 2548
8 . . 2549

22Health Intervention and Technology Assessment Program‚§√ß°“√ª√–‡¡‘π‡∑§‚π‚≈¬’·≈–π‚¬∫“¬¥â“π ÿ¢¿“æ
9 . . 2549
10 . . 2550

√“¬ß“π°“√«‘®—¬ §«“¡§ÿâ¡§à“¢Õß°“√ºà“µ—¥µâÕ°√–®°‚¥¬„ à‡≈π 巰⫵“‡∑’¬¡™π‘¥π‘Ë¡‡ª√’¬∫‡∑’’¬∫°—∫™π‘¥·¢Áß„π∫√‘∫∑¢Õߪ√–‡∑»‰∑¬ 23
11 . . 2550
. .2548 – 2550
. .2549 84,862
6,480 ( 7.6)
73,460 ( 86.6)
73,460
( 95)
( 5) 3
599 340
323 1,233
( 1.7) 452
201 161
( 16-18)

24Health Intervention and Technology Assessment Program‚§√ß°“√ª√–‡¡‘π‡∑§‚π‚≈¬’·≈–π‚¬∫“¬¥â“π ÿ¢¿“æ
1.3.1.3 (Complication)
1 (Complication of
procedures) 2.25 1.78
. .2549 . .
2550 ( 12 36)
12

√“¬ß“π°“√«‘®—¬ §«“¡§ÿâ¡§à“¢Õß°“√ºà“µ—¥µâÕ°√–®°‚¥¬„ à‡≈π 巰⫵“‡∑’¬¡™π‘¥π‘Ë¡‡ª√’¬∫‡∑’’¬∫°—∫™π‘¥·¢Áß„π∫√‘∫∑¢Õߪ√–‡∑»‰∑¬ 25
13

26Health Intervention and Technology Assessment Program‚§√ß°“√ª√–‡¡‘π‡∑§‚π‚≈¬’·≈–π‚¬∫“¬¥â“π ÿ¢¿“æ
1.3.2
. . 2549
1.3.2.1
. .2549 110,622
( 59.3 56.8)
60 – 74 ( 56.3 56.5 )
23,657
( 21.4)
20,020 ( 24.9) 3,637
( 12.0)
( 12.6)
( 72.0) (p-value < 0.05)
( 44.3)
( 28.4 25.0) 1 4
(p-value<0.05)
4

√“¬ß“π°“√«‘®—¬ §«“¡§ÿâ¡§à“¢Õß°“√ºà“µ—¥µâÕ°√–®°‚¥¬„ à‡≈π 巰⫵“‡∑’¬¡™π‘¥π‘Ë¡‡ª√’¬∫‡∑’’¬∫°—∫™π‘¥·¢Áß„π∫√‘∫∑¢Õߪ√–‡∑»‰∑¬ 27
4
Total p- Value*
( )
( )
32,696(40.7) 13,064(43.2) 45,760(41.4) 0.000*
47,682(59.3) 17,180(56.8) 64,862(58.6)
39 1,855(2.3) 152(0.5) 2,007(1.8) 0.000*
40 – 49 3,576(4.4) 731(2.4) 4,307(3.9)
50 – 59 12,057(15.0) 2,890(9.6) 14,947(13.5)
60 – 64 11,588(14.4) 3,491(11.5) 15,079(13.6)
65 – 69 16,884(21.0) 6,014(19.9) 22,898(20.7)
70 – 74 16,938(21.1) 7,518(24.9) 24,456(22.1)
75 – 79 11,185(13.9) 5,922(19.6) 17,107(15.5)
80 6,295(7.8) 3,526(11.7) 9,821(8.9)
Non-Foldable 50,206(62.5) 4,845(16.0) 55,051(49.8) 0.000*
Foldable 10,152(12.6) 21,762(72.0) 31,914(28.8)
20,020(24.9) 3,637(12.0) 23,657(21.4)
35,631(44.3) 8,598(28.4) 44,229(40.0) 0.000*
7,498(9.3) 1,000(3.3) 8,498(7.7)
26,465(32.9) 7,562(25.0) 34,027(30.8)
3,304(4.1) 5,180(17.1) 8,484(7.7)
2,266(2.8) 0(0.0) 2,266(2.0)
5,214(6.5) 7,904(26.1) 13,118(11.9)
*
28Health Intervention and Technology Assessment Program‚§√ß°“√ª√–‡¡‘π‡∑§‚π‚≈¬’·≈–π‚¬∫“¬¥â“π ÿ¢¿“æ
1.3.2.2
. . 2549
(7 1,000 )
(1 1,000 )
6,142
5,925
( 64.6 56.3) 1 3
70 – 74 ( 38.3 34.0 )
5,925
( 77.8)
(
59.6)
903
(p-value
<0.05) 5

√“¬ß“π°“√«‘®—¬ §«“¡§ÿâ¡§à“¢Õß°“√ºà“µ—¥µâÕ°√–®°‚¥¬„ à‡≈π 巰⫵“‡∑’¬¡™π‘¥π‘Ë¡‡ª√’¬∫‡∑’’¬∫°—∫™π‘¥·¢Áß„π∫√‘∫∑¢Õߪ√–‡∑»‰∑¬ 29
5
Total p- Value*
1,020(43.7) 1,356(35.6) 2,376(38.7) 0.000*
1,314(56.3) 2,452(64.4) 3,766(61.3)
39 19(0.8) 4(0.1) 23(0.4) 0.000*
40 – 49 30(1.3) 9(0.2) 39(0.6)
50 – 59 28(1.2) 25(0.7) 53(0.9)
60 – 64 70(3.0) 105(2.8) 175(2.8)
65 – 69 480(20.6) 656(17.2) 1,136(18.5)
70 – 74 794(34.0) 1,460(38.3) 2,254(36.7)
75 – 79 729(31.2) 1,298(34.1) 2,027(33.0)
80 184(7.9) 251(6.6) 435(7.1)
Non-Foldable 1,687(77.8) 968(25.8) 2,655(44.8) 0.000*
Foldable 128(5.9) 2,239(59.6) 2,367(39.9)
353(16.3) 550(14.6) 903(15.2)
*
30Health Intervention and Technology Assessment Program‚§√ß°“√ª√–‡¡‘π‡∑§‚π‚≈¬’·≈–π‚¬∫“¬¥â“π ÿ¢¿“æ
1.3.2.3
. . 2549
89,289 ( 52,520 36,769 )
2 4
10 ( 36.2 36.7 )
( 81.4) ( 18.6)
( 16.9 83.1 )
( 64.7 68.4 )
(p-value<0.05)
6

√“¬ß“π°“√«‘®—¬ §«“¡§ÿâ¡§à“¢Õß°“√ºà“µ—¥µâÕ°√–®°‚¥¬„ à‡≈π 巰⫵“‡∑’¬¡™π‘¥π‘Ë¡‡ª√’¬∫‡∑’’¬∫°—∫™π‘¥·¢Áß„π∫√‘∫∑¢Õߪ√–‡∑»‰∑¬ 31
6
*
Total t-test p-
Foldable
Non -
Foldable
Value*
13,325
(36.2)
23,444
(63.8)
36,769
(41.2)
1.835 0.176
19,266
(36.7)
33,254
(63.3)
52,520
(58.8)
UC 10,477
(16.9)
51,632
(83.1)
62,109
(69.6)
33927.809 0.000*
CSMBS 22,114
(81.4)
5,066
(18.6)
27,180
(30.4)
68.62 66.74 40.518 0.000*
10,878
(31.5)
23,624
(68.5)
34,502
(38.6)
11848.836 0.000*
1,803
(36.9)
3,087
(63.1)
4,890
(5.5)
5,785
(21.4)
21,224
(78.6)
27,009
(30.2)
5,241
(64.7)
2,857
(35.3)
8,098
(9.1)
290
(13.0)
1,937
(87.0)
2,227
(2.5)
8,594
(68.4)
3,969
(31.6)
12,563
(14.1)
2

32Health Intervention and Technology Assessment Program‚§√ß°“√ª√–‡¡‘π‡∑§‚π‚≈¬’·≈–π‚¬∫“¬¥â“π ÿ¢¿“æ
1.3.3
1.3.3.1
20
(Y=1)
20
(Y=0)
Logistic regression Forward
Stepwise 4
( ) (X11) (X12)
(X13) (X14)
(Goodness of fit) Logistic regression Hosmer and Lemeshow
Test p-value = 0.772 (p-value>0.05) Logistic regression
7
1
1
52

√“¬ß“π°“√«‘®—¬ §«“¡§ÿâ¡§à“¢Õß°“√ºà“µ—¥µâÕ°√–®°‚¥¬„ à‡≈π 巰⫵“‡∑’¬¡™π‘¥π‘Ë¡‡ª√’¬∫‡∑’’¬∫°—∫™π‘¥·¢Áß„π∫√‘∫∑¢Õߪ√–‡∑»‰∑¬ 33
7 Logistic regression
B Exp(B) Std.
Error
Wald df Sig. 95% CI
X13 .047 1.049 .024 3.979 1 .046 (1.001-1.098)
X12 3.947 51.802 1.385 8.122 1 .004 (3.430-782.271)
Constant -4.864 .008 1.872 6.753 1 .009
1.3.3.2
Logistic regression Forward Stepwise
4
(Goodness of fit) Logistic regression Hosmer and Lemeshow
Test p-value = 0.997 (p-value>0.05) Logistic regression
8
22
1.152
8 Logistic regression
B Exp(B) Std.
Error
Wald df Sig. 95% CI
CSMBS 3.076 21.666 .019 26322.479 1 .000 (20.876-22.486)
.142 1.152 .018 61.670 1 .000 (1.112-1.194)
Constant -1.681 .186 .015 11790.786 1 .000

34Health Intervention and Technology Assessment Program‚§√ß°“√ª√–‡¡‘π‡∑§‚π‚≈¬’·≈–π‚¬∫“¬¥â“π ÿ¢¿“æ
1.3.3.3 (Complication)
1 . . 2549 – 31 . . 2550 221,799
232,242
6
1. (Purulent endophthalmitis)
2. (Choroidal hemorrhage and rupture)
3. (Hyphema)
4. (Other corneal edema)
5. (Complication of procedures)
6. (Mechanical complication of intraocular
lens)
1. (Purulent endophthalmitis)
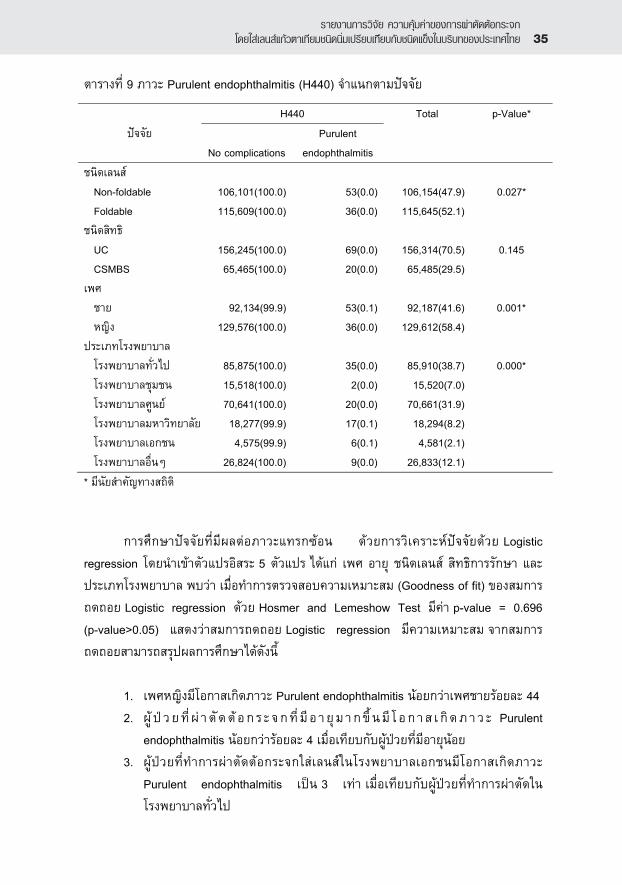
221,799 Purulent endophthalmitis 89
Purulent
endophthalmitis (p-value < 0.05)
Purulent
endophthalmitis ( 0.1 0.0 )
Purulent endophthalmitis
( 0.1
) 9
√“¬ß“π°“√«‘®—¬ §«“¡§ÿâ¡§à“¢Õß°“√ºà“µ—¥µâÕ°√–®°‚¥¬„ à‡≈π 巰⫵“‡∑’¬¡™π‘¥π‘Ë¡‡ª√’¬∫‡∑’’¬∫°—∫™π‘¥·¢Áß„π∫√‘∫∑¢Õߪ√–‡∑»‰∑¬ 35
9 Purulent endophthalmitis (H440)
*
Logistic
regression 5
(Goodness of fit)
Logistic regression Hosmer and Lemeshow Test p-value = 0.696
(p-value>0.05) Logistic regression
1. Purulent endophthalmitis 44
2. Purulent
endophthalmitis 4
3.
Purulent endophthalmitis 3
H440 Total p-Value*
No complications
Purulent
endophthalmitis
Non-foldable 106,101(100.0) 53(0.0) 106,154(47.9) 0.027*
Foldable 115,609(100.0) 36(0.0) 115,645(52.1)
UC 156,245(100.0) 69(0.0) 156,314(70.5) 0.145
CSMBS 65,465(100.0) 20(0.0) 65,485(29.5)
92,134(99.9) 53(0.1) 92,187(41.6) 0.001*
129,576(100.0) 36(0.0) 129,612(58.4)
85,875(100.0) 35(0.0) 85,910(38.7) 0.000*
15,518(100.0) 2(0.0) 15,520(7.0)
70,641(100.0) 20(0.0) 70,661(31.9)
18,277(99.9) 17(0.1) 18,294(8.2)
4,575(99.9) 6(0.1) 4,581(2.1)
26,824(100.0) 9(0.0) 26,833(12.1)

36Health Intervention and Technology Assessment Program‚§√ß°“√ª√–‡¡‘π‡∑§‚π‚≈¬’·≈–π‚¬∫“¬¥â“π ÿ¢¿“æ
10 Logistic regression
B Exp(B) Std.
Error
Wald df Sig. 95% CI
-.589 .555 .219 7.242 1 .007 (0.361-0.852)
-.044 .957 .006 58.196 1 .000 (0.946-0.968)
19.195 5 .002
-1.050 .350 .727 2.083 1 .149 (0.084-1.456)
-.389 .678 .281 1.918 1 .166 (0.391-1.175)
.574 1.776 .303 3.589 1 .058 (0.980-3.217)
1.191 3.289 .442 7.242 1 .007 (1.382-7.829)
-.215 .807 .374 .331 1 .565 (0.387-1.679)
Constant -4.669 .009 .384 147.595 1 .000
2. (Choroidal hemorrhage and rupture)
221,799 Choroidal hemorrhage and rupture 15
(p-value >
0.05) 7 8 11

√“¬ß“π°“√«‘®—¬ §«“¡§ÿâ¡§à“¢Õß°“√ºà“µ—¥µâÕ°√–®°‚¥¬„ à‡≈π 巰⫵“‡∑’¬¡™π‘¥π‘Ë¡‡ª√’¬∫‡∑’’¬∫°—∫™π‘¥·¢Áß„π∫√‘∫∑¢Õߪ√–‡∑»‰∑¬ 37
11 Choroidal hemorrhage and rupture (H313)
*
Logistic
regression 5
(Goodness of fit)
Logistic regression Hosmer and Lemeshow Test p-value = 0.619 (p-
value>0.05) Logistic regression
Choroidal
hemorrhage and rupture 42
H313 Total p-Value*
No complications
Choroidal
hemorrhage and
rupture
non-foldable 106,147(100.0) 7(0.0) 106,154(47.9) 0.926
Foldable 115,637(100.0) 8(0.0) 115,645(52.1)
UC 156,306(100.0) 8(0.0) 156,314(70.5) 0.146
CSMBS 65,478(100.0) 7(0.0) 65,485(29.5)
92,181(100.0) 6(0.0) 92,187(41.6) 0.902
129,603(100.0) 9(0.0) 129,612(58.4)
85,909(100.0) 1(0.0) 85,910(38.7)
15,520(100.0) 0(0.0) 15,520(7.0)
70,657(100.0) 4(0.0) 70,661(31.9)
18,285(99.9) 9(0.1) 18,294(8.2)
4,581(100.0) 0(0.0) 4,581(2.1)
26,832(100.0) 1(0.0) 26,833(12.1)

38Health Intervention and Technology Assessment Program‚§√ß°“√ª√–‡¡‘π‡∑§‚π‚≈¬’·≈–π‚¬∫“¬¥â“π ÿ¢¿“æ
12 Logistic regression
B Exp(B) Std.
Error
Wald df Sig. 95% CI
24.435 5 .000
-9.842 .000 322.631 .001 1 .976 (0.000-2.2E+270)
1.582 4.863 1.118 2.001 1 .157 (0.544-43.514)
3.744 42.285 1.054 12.618 1 .000 (5.357-333.778)
-9.842 .000 593.842 .000 1 .987 (0.000-0)
1.164 3.202 1.414 .677 1 .411 (0.200-51.190)
Constant -11.361 .000 1.000 129.072 1 .000
3. (Hyphema)
221,799 Hyphema (H210) 131
0.1
Hyphema (p-
value < 0.05)
Hyphema
(p-value > 0.05) ( 0.1 0.0 )
Hyphema
( 0.1 )
Hyphema
(p-value < 0.05) ( 0.2)
13

√“¬ß“π°“√«‘®—¬ §«“¡§ÿâ¡§à“¢Õß°“√ºà“µ—¥µâÕ°√–®°‚¥¬„ à‡≈π 巰⫵“‡∑’¬¡™π‘¥π‘Ë¡‡ª√’¬∫‡∑’’¬∫°—∫™π‘¥·¢Áß„π∫√‘∫∑¢Õߪ√–‡∑»‰∑¬ 39
13 Hyphema (H210)
*
Logistic
regression 5
(Goodness of fit)
Logistic regression Hosmer and Lemeshow Test p-value = 0.987
(p-value>0.05) Logistic regression
1. Hyphema
45
2. Hyphema
2
3.
Hyphema 2.8
4.
Hyphema 51
H210 Total p-Value*
No complications Hyphema
non-foldable 106,073(99.9) 81(0.1) 106,154(47.9) 0.001*
foldable 115,595(100.0) 50(0.0) 115,645(52.1)
UC 156,212(99.9) 102(0.1) 156,314(70.5) 0.064
CSMBS 65,456(100.0) 29(0.0) 65,485(29.5)
92,133(99.9) 54(0.1) 92,187(41.6) 0.937
129,535(99.9) 77(0.1) 129,612(58.4)
85,853(99.9) 57(0.1) 85,910(38.7) 0.000*
15,500(99.9) 20(0.1) 15,520(7.0)
70,637(100.0) 24(0.0) 70,661(31.9)
18,282(99.9) 12(0.1) 18,294(8.2)
4,571(99.8) 10(0.2) 4,581(2.1)
26,8251(100.0) 8(0.0) 26,833(12.1)

40Health Intervention and Technology Assessment Program‚§√ß°“√ª√–‡¡‘π‡∑§‚π‚≈¬’·≈–π‚¬∫“¬¥â“π ÿ¢¿“æ
14 Logistic regression
B Exp(B) Std.
Error
Wald df Sig. 95% CI
Foldable Lens -.605 .546 .186 10.589 1 .001 (0.379-0.786)
38.459 5 .000
.767 2.153 .262 8.568 1 .003 (1.288-3.597)
-.723 .485 .244 8.795 1 .003 (0.301-0.783)
.095 1.099 .319 .088 1 .767 (0.588-2.056)
1.029 2.797 .346 8.840 1 .003 (1.420-5.512)
-.674 .510 .380 3.155 1 .076 (0.242-1.072)
Constant -7.056 .001 .148 2259.218 1 .000
4. (Other corneal edema)
221,799 Other corneal edema 115
0.1
Other corneal edema
( 0.1 0.0 )
Other corneal edema 2 (
0.1 ) Other
corneal edema ( 0.1
0.0 )
Other corneal edema
(p-value < 0.05) ( 0.2)
15

√“¬ß“π°“√«‘®—¬ §«“¡§ÿâ¡§à“¢Õß°“√ºà“µ—¥µâÕ°√–®°‚¥¬„ à‡≈π 巰⫵“‡∑’¬¡™π‘¥π‘Ë¡‡ª√’¬∫‡∑’’¬∫°—∫™π‘¥·¢Áß„π∫√‘∫∑¢Õߪ√–‡∑»‰∑¬ 41
15 Other corneal edema (H182)
*
Logistic
regression 5
(Goodness of fit)
Logistic regression Hosmer and Lemeshow Test p-value = 0.798 (p-
value>0.05) Logistic regression
1. 1 Other
corneal edema 1
2. Other
corneal edema 4.8
H182 Total p-Value*
No complications Other corneal
edema
non-foldable 106,109(100.0) 45(0.0) 106,154(47.9) 0.061
foldable 115,575(99.9) 70(0.1) 115,645(52.1)
UC 156,233(99.9) 81(0.1) 156,314(70.5) 0.992
CSMBS 65,451(99.9) 34(0.1) 65,485(29.5)
92,145(100.0) 42(0.0) 92,187(41.6) 0.273
129,539(99.9) 73(0.1) 129,612(58.4)
85,872(100.0) 38(0.0) 85,910(38.7) 0.000*
15,486(99.8) 34(0.2) 15,520(7.0)
70,638(100.0) 23(0.0) 70,661(31.9)
18,289(100.0) 5(0.0) 18,294(8.2)
4,580(100.0) 1(0.0) 4,581(2.1)
26,819(99.9) 14(0.1) 26,833(12.1)

42Health Intervention and Technology Assessment Program‚§√ß°“√ª√–‡¡‘π‡∑§‚π‚≈¬’·≈–π‚¬∫“¬¥â“π ÿ¢¿“æ
16 Logistic regression
B Exp(B) Std.
Error
Wald df Sig. 95% CI
.035 1.035 .010 11.275 1 .001 (1.015-1.057)
70.378 5 .000
1.579 4.852 .236 44.686 1 .000 (3.054-7.710)
-.306 .736 .264 1.342 1 .247 (0.439-1.236)
-.460 .631 .476 .934 1 .334 (0.249-1.605)
-.670 .512 1.013 .437 1 .509 (0.070-3.729)
.155 1.168 .313 .245 1 .620 (0.632-2.155)
Constant -10.128 .000 .751 182.064 1 .000
5. (Complication of procedures)
221,799 Complication of procedures 1,924
0.9
Complication of procedures
( 0.9 )
Complication of procedures
( 1.0 0.8 )
Complication of procedures
( 1.0 0.8 )
Complication of procedures
( 3.3) 17

√“¬ß“π°“√«‘®—¬ §«“¡§ÿâ¡§à“¢Õß°“√ºà“µ—¥µâÕ°√–®°‚¥¬„ à‡≈π 巰⫵“‡∑’¬¡™π‘¥π‘Ë¡‡ª√’¬∫‡∑’’¬∫°—∫™π‘¥·¢Áß„π∫√‘∫∑¢Õߪ√–‡∑»‰∑¬ 43
17 Complication of procedures (T81)
*
Logistic
regression 5
(Goodness of fit)
Logistic regression Hosmer and Lemeshow Test p-value = 0.093 (p-
value>0.05) Logistic regression
1. Complication of procedures
28
2. Complication of procedures
17
3. 1 Complication
of procedures 1
T81 Total p-Value*
No complications Complication of
procedures
non-foldable 105,249(99.1) 905(0.9) 106,154(47.9) 0.468
foldable 114,626(99.1) 1,019(0.9) 115,645(52.1)
UC 155,023(99.2) 1,291(0.8) 156,314(70.5) 0.001*
CSMBS 64,852(99.0) 633(1.0) 65,485(29.5)
91,305(99.0) 882(1.0) 92,187(41.6) 0.000*
128,570(99.2) 1,042(0.8) 129,612(58.4)
85,109(99.1) 801(0.9) 85,910(38.7) 0.000*
15,469(99.7) 51(0.3) 15,520(7.0)
70,370(99.6) 291(0.4) 70,661(31.9)
17,695(96.7) 599(3.3) 18,294(8.2)
4,567(99.7) 14(0.3) 4,581(2.1)
26,665(99.4) 168(0.6) 26,833(12.1)

44Health Intervention and Technology Assessment Program‚§√ß°“√ª√–‡¡‘π‡∑§‚π‚≈¬’·≈–π‚¬∫“¬¥â“π ÿ¢¿“æ
4.
Complication of procedures
66
5.
Complication of procedures
56
6.
Complication of procedures
69
7.
Complication of procedures
25
8.
Complication of procedures 4
18 Logistic regression
B Exp(B) Std.
Error
Wald df Sig. 95% CI
CSMBS -.336 .715 .055 37.807 1 .000 (0.642-0.796)
-.184 .832 .046 15.824 1 .000 (0.760-0.911)
.017 1.017 .002 56.913 1 .000 (1.012-1.021)
1201.965 5 .000
-1.076 .341 .145 55.308 1 .000 (0.257-0.453)
-.813 .443 .069 140.384 1 .000 (0.388-0.507)
1.434 4.197 .059 589.522 1 .000 (3.738-4.712)
-1.162 .313 .270 18.480 1 .000 (0.184-0.532)
-.284 .753 .087 10.533 1 .001 (0.634-0.894)
Constant -5.629 .004 .155 1314.086 1 .000
6. (Mechanical complication of intraocular
lens)
221,799 Mechanical complication of intraocular lens

√“¬ß“π°“√«‘®—¬ §«“¡§ÿâ¡§à“¢Õß°“√ºà“µ—¥µâÕ°√–®°‚¥¬„ à‡≈π 巰⫵“‡∑’¬¡™π‘¥π‘Ë¡‡ª√’¬∫‡∑’’¬∫°—∫™π‘¥·¢Áß„π∫√‘∫∑¢Õߪ√–‡∑»‰∑¬ 45
528 0.2
Mechanical complication
of intraocular lens ( 0.2 )
Mechanical complication of intraocular
lens
( 0.3 0.2 )
Mechanical complication of intraocular lens
( 0.3 0.2 )
Mechanical complication of intraocular lens
( 0.7) 19
19 Mechanical complication of intraocular lens
*
T852 Total p-Value*
No complications Mechanical
complication of
intraocular lens
non-foldable 105,891(99.8) 263(0.2) 106,154(47.9) 0.369
foldable 115,380(99.8) 265(0.2) 115,645(52.1)
UC 155,957(99.8) 357(0.2) 156,314(70.5) 0.149
CSMBS 65,314(99.7) 171(0.3) 65,485(29.5)
91,927(99.7) 260(0.3) 92,187(41.6) 0.000*
129,344(99.8) 268(0.2) 129,612(58.4)
85,762(99.8) 148(0.2) 85,910(38.7) 0.000*
15,459(99.6) 61(0.4) 15,520(7.0)
70,536(99.8) 125(0.2) 70,661(31.9)
18,159(99.3) 135(0.7) 18,294(8.2)
4,577(99.9) 4(0.1) 4,581(2.1)
26,778(99.8) 55(0.2) 26,833(12.1)

46Health Intervention and Technology Assessment Program‚§√ß°“√ª√–‡¡‘π‡∑§‚π‚≈¬’·≈–π‚¬∫“¬¥â“π ÿ¢¿“æ
Logistic
regression 5
(Goodness of fit)
Logistic regression Hosmer and Lemeshow Test p-value = 0.043 (p-
value>0.01) Logistic regression
1. 1
Mechanical complication of intraocular lens 1
2. Mechanical complication of intraocular
lens 23
3.
Mechanical complication of intraocular lens 2.4
4.
Mechanical complication of intraocular lens 4.4
20 Logistic regression
B Exp(B) Std.
Error
Wald df Sig. 95% CI
-.009 .991 .003 7.116 1 .008 (0.984-0.998)
Foldable Lens -.257 .773 .090 8.134 1 .004 (0.648-0.923)
208.728 5 .000
.881 2.413 .153 33.042 1 .000 (1.787-3.258)
.002 1.002 .122 .000 1 .988 (0.789-1.272)
1.486 4.419 .121 151.513 1 .000 (3.488-5.599)
-.761 .467 .508 2.251 1 .134 (0.173-1.263)
.230 1.258 .159 2.080 1 .149 (0.921-1.719)
Constant -5.622 .004 .244 533.109 1 .000

√“¬ß“π°“√«‘®—¬ §«“¡§ÿâ¡§à“¢Õß°“√ºà“µ—¥µâÕ°√–®°‚¥¬„ à‡≈π 巰⫵“‡∑’¬¡™π‘¥π‘Ë¡‡ª√’¬∫‡∑’’¬∫°—∫™π‘¥·¢Áß„π∫√‘∫∑¢Õߪ√–‡∑»‰∑¬ 47
2:
2.1
2.2
2.2.1
(cost-utility analysis) decision tree
2.2.1.1
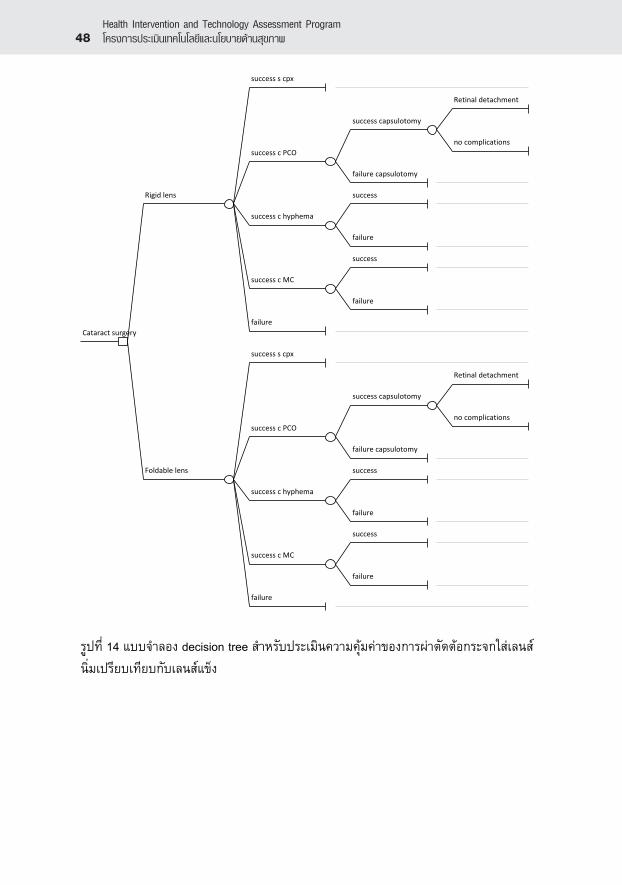
decision tree ( 14 )
(Phacoemulsification)
1) (posterior capsule opacification)
2) (hyphema) 3) (Mechanical
complication of intraocular lens)
(systematic review)
(meta-analysis)
1.3.3.3
(Nd:YAG laser capsulotomy) -
(retinal detachment)
48Health Intervention and Technology Assessment Program‚§√ß°“√ª√–‡¡‘π‡∑§‚π‚≈¬’·≈–π‚¬∫“¬¥â“π ÿ¢¿“æ
success s cpx
Retinal detachment
success capsulotomy
no complications
success c PCO
failure capsulotomy
Rigid lens success
success c hyphema
failure
success
success c MC
failure
failure
Cataract surgery
success s cpx
Retinal detachment
success capsulotomy
no complications
success c PCO
failure capsulotomy
Foldable lens success
success c hyphema
failure
success
success c MC
failure
failure
14 decision tree
√“¬ß“π°“√«‘®—¬ §«“¡§ÿâ¡§à“¢Õß°“√ºà“µ—¥µâÕ°√–®°‚¥¬„ à‡≈π 巰⫵“‡∑’¬¡™π‘¥π‘Ë¡‡ª√’¬∫‡∑’’¬∫°—∫™π‘¥·¢Áß„π∫√‘∫∑¢Õߪ√–‡∑»‰∑¬ 49
=
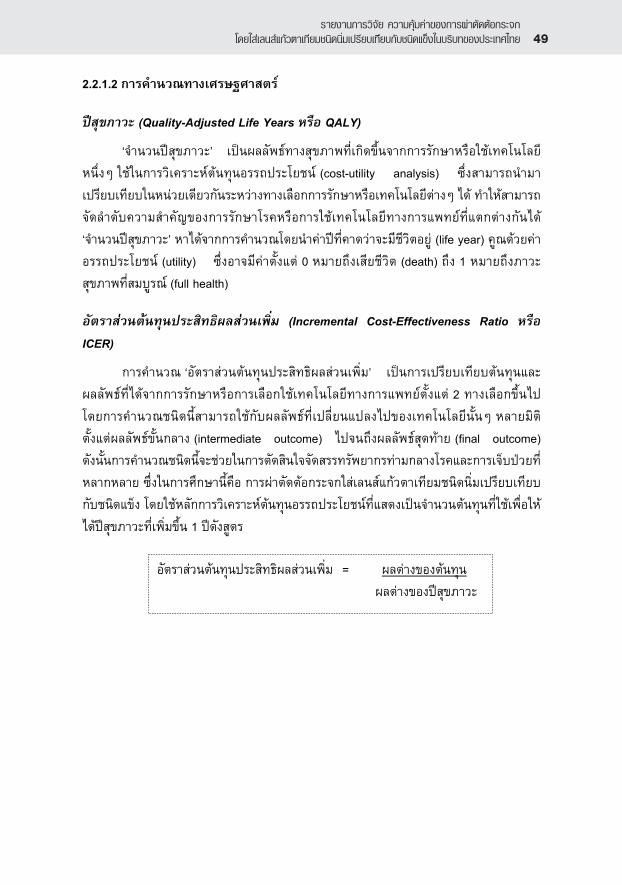
2.2.1.2
(Quality-Adjusted Life Years QALY)
‘ ’
(cost-utility analysis)
‘ ’ (life year)
(utility) 0 (death) 1
(full health)
(Incremental Cost-Effectiveness Ratio
ICER)
‘ ’
2
(intermediate outcome) (final outcome)
1

50Health Intervention and Technology Assessment Program‚§√ß°“√ª√–‡¡‘π‡∑§‚π‚≈¬’·≈–π‚¬∫“¬¥â“π ÿ¢¿“æ
2.2.1.3
Pubmed 12 . . 2552 “outcome of
cataract surgery”, “senile cataract”, “intraocular lens”, “rate of success cataract surgery”
136
1.
2.
1.
2.
3.
4.
3 (20,21,22)
1 (23)
(meta-analysis) fixed-effect model
0.09
Pubmed
(rigid and foldable or
silicone or acrylic intraocular lens) (PMMA and foldable or silicone or acrylic
intraocular lens) 20 . . 2552
. . 2552 10 1 . . 2541 1
. . 2552

√“¬ß“π°“√«‘®—¬ §«“¡§ÿâ¡§à“¢Õß°“√ºà“µ—¥µâÕ°√–®°‚¥¬„ à‡≈π 巰⫵“‡∑’¬¡™π‘¥π‘Ë¡‡ª√’¬∫‡∑’’¬∫°—∫™π‘¥·¢Áß„π∫√‘∫∑¢Õߪ√–‡∑»‰∑¬ 51
1. rigid PMMA
intraocular lens foldable, silicone acrylic
intraocular lens
2.
1.
2.
3.
4.
5.
172
30 (24-53)
(Posterior capsule opacification : PCO)
1 ( 1.3.3.3)
(Hyphema) (Mechanical complication of intraocular
lens)
(Posterior capsule opacification : PCO)
(Acrylic) (PMMA)
7
20
6 (48-53)
(meta-analysis)

52Health Intervention and Technology Assessment Program‚§√ß°“√ª√–‡¡‘π‡∑§‚π‚≈¬’·≈–π‚¬∫“¬¥â“π ÿ¢¿“æ
0.1834
0.5517
Nd:YAG laser
(capsulotomy)
2 (54,55)
0.05 0.01
Nd:YAG laser
(56)
0.03
(Hyphema) (Mechanical
complication of intraocular lens)
( 1.3.3.3)
(Hyphema)
45 (Mechanical complication of
intraocular lens) 23
1 . . 2549 – 31 . . 2550 221,799
81 106,154
50 115,645
263 106,154 265
115,645
21

√“¬ß“π°“√«‘®—¬ §«“¡§ÿâ¡§à“¢Õß°“√ºà“µ—¥µâÕ°√–®°‚¥¬„ à‡≈π 巰⫵“‡∑’¬¡™π‘¥π‘Ë¡‡ª√’¬∫‡∑’’¬∫°—∫™π‘¥·¢Áß„π∫√‘∫∑¢Õߪ√–‡∑»‰∑¬ 53
21
Rigid 0.0008 0.0001 Hyphema
Foldable 0.0004 0.0001
Rigid 0.0026 0.0025 Mechanical
complication of
intraocular lens Foldable 0.0021 0.0023
(Cost)
(provider’s perspective)
(direct medical cost)
5
(PMMA) (Acrylic)
100,000
3
22 23

54Health Intervention and Technology Assessment Program‚§√ß°“√ª√–‡¡‘π‡∑§‚π‚≈¬’·≈–π‚¬∫“¬¥â“π ÿ¢¿“æ
22
Code No.
Non Foldable Lens Foldable Lens
A A11 1,500
A12 1,500
A21 3,500
A13 590
A14 590
B B11 1,000
B21 4,000
B22 4,500
C C11 1,000
C21 5,500
Mean 1,030 4,375
Std.Error 166.413 426.956
Minimum - Maximum 590 – 1,500 3,500 – 5,500
23
( )
1,030 166
4,375 427
( .)
24

√“¬ß“π°“√«‘®—¬ §«“¡§ÿâ¡§à“¢Õß°“√ºà“µ—¥µâÕ°√–®°‚¥¬„ à‡≈π 巰⫵“‡∑’¬¡™π‘¥π‘Ë¡‡ª√’¬∫‡∑’’¬∫°—∫™π‘¥·¢Áß„π∫√‘∫∑¢Õߪ√–‡∑»‰∑¬ 55
24
( )
( )
13,473 24
13,550 20
3,730 11
14,147 1,553
13,499 2,785
15,353 908
17,161 1,147
(PCO)
Nd:YAG laser
capsulotomy
1
Nd:YAG
laser capsulotomy
. 25

56Health Intervention and Technology Assessment Program‚§√ß°“√ª√–‡¡‘π‡∑§‚π‚≈¬’·≈–π‚¬∫“¬¥â“π ÿ¢¿“æ
25
( )
Nd:YAG laser capsulotomy 3,730 11
31,488 10,433
(56)
. .
2545 26
26
0.92 0.05
(PCO)
Nd:YAG laser capsulotomy
0.92 0.05
Nd:YAG laser capsulotomy
0.75 0.06
(PCO)
0.84 0.04
(hyphema)
0.92 0.05

√“¬ß“π°“√«‘®—¬ §«“¡§ÿâ¡§à“¢Õß°“√ºà“µ—¥µâÕ°√–®°‚¥¬„ à‡≈π 巰⫵“‡∑’¬¡™π‘¥π‘Ë¡‡ª√’¬∫‡∑’’¬∫°—∫™π‘¥·¢Áß„π∫√‘∫∑¢Õߪ√–‡∑»‰∑¬ 57
0.92 0.05
0.74 0.05
2.2.1.4.
Probabilistic Sensitivity
Analysis (PSA) Monte Carlo simulation Microsoft
Excel® decision tree
(beta distribution)
(gamma or normal distribution)
1,000
(cost-effectiveness acceptability curves)
cRatio ( X)
( Y)

58Health Intervention and Technology Assessment Program‚§√ß°“√ª√–‡¡‘π‡∑§‚π‚≈¬’·≈–π‚¬∫“¬¥â“π ÿ¢¿“æ
2.3
2.3.1
18,105
421
(provider’s perspective) 1
15,434 269
27
27
( )
( )
(Hyphema)
15,114 1,564 17,887 2,750
(Mechanical complication of
intraocular lens)
16,394 915 21,583 1,232
(PCO) 18,201 169 21,663 418
49,194 9,987 52,656 9,979

√“¬ß“π°“√«‘®—¬ §«“¡§ÿâ¡§à“¢Õß°“√ºà“µ—¥µâÕ°√–®°‚¥¬„ à‡≈π 巰⫵“‡∑’¬¡™π‘¥π‘Ë¡‡ª√’¬∫‡∑’’¬∫°—∫™π‘¥·¢Áß„π∫√‘∫∑¢Õߪ√–‡∑»‰∑¬ 59
28
( )
(Standard error)
15,434
(269)
18,105
(421)
(Standard error)
9.02
(0.98)
9.04
(1.01)
( )
(Standard error)
2,681
(491)
( )
(Standard error)
0.005
(0.585)
ICER
(Standard error)
507,127
(820,526)
: Probabilistic Sensitivity Analysis (PSA)
Monte Carlo simulation 1,000
28
(Phacoemulsification)
2,681
(0.005 )
(ICER)
507,127
100,000

60Health Intervention and Technology Assessment Program‚§√ß°“√ª√–‡¡‘π‡∑§‚π‚≈¬’·≈–π‚¬∫“¬¥â“π ÿ¢¿“æ
0.00
0.10
0.20
0.30
0.40
0.50
0.60
0.70
0.80
0.90
1.00
0
100,000
300,000
500,000
700,000
900,000
1,500,000
2,500,000
3,500,000
4,500,000
5,500,000
6,500,000
7,500,000
8,500,000
9,500,000
15,000,000
25,000,000
35,000,000
45,000,000
60,000,000
80,000,000
100,000,000
120,000,000
140,000,000
160,000,000
180,000,000
200,000,000
220,000,000
( )
RIGID FOLDABLE
15
15
200,000
200,000
(
46)

√“¬ß“π°“√«‘®—¬ §«“¡§ÿâ¡§à“¢Õß°“√ºà“µ—¥µâÕ°√–®°‚¥¬„ à‡≈π 巰⫵“‡∑’¬¡™π‘¥π‘Ë¡‡ª√’¬∫‡∑’’¬∫°—∫™π‘¥·¢Áß„π∫√‘∫∑¢Õߪ√–‡∑»‰∑¬ 61
3.1
. . 2546 . . 2548
149 5,655 . . 2550
80
82,685
. .2551 (57)
95
1
52
3.9 100,000
1.45 100,000
22
81.4
16.9
( .) 4,000 6,000
700 – 4,000 (11)
6,000

62Health Intervention and Technology Assessment Program‚§√ß°“√ª√–‡¡‘π‡∑§‚π‚≈¬’·≈–π‚¬∫“¬¥â“π ÿ¢¿“æ
. . 2549 23,657 21.4
(Hyphema)
(Mechanical complication of intraocular lens)
(Choroidal
hemorrhage and rupture) (Mechanical complication of intraocular
lens) (Complication of procedures) (
)
(learning curve)
(Purulent endophthalmitis) (Hyphema)
.

√“¬ß“π°“√«‘®—¬ §«“¡§ÿâ¡§à“¢Õß°“√ºà“µ—¥µâÕ°√–®°‚¥¬„ à‡≈π 巰⫵“‡∑’¬¡™π‘¥π‘Ë¡‡ª√’¬∫‡∑’’¬∫°—∫™π‘¥·¢Áß„π∫√‘∫∑¢Õߪ√–‡∑»‰∑¬ 63
200,000
( .)
200,000
.
.
15
22 23
29

64Health Intervention and Technology Assessment Program‚§√ß°“√ª√–‡¡‘π‡∑§‚π‚≈¬’·≈–π‚¬∫“¬¥â“π ÿ¢¿“æ
29
.
V.1 V.2
( )
50,206 (1) 4,845 (1)
30,172 (2) 25,399 (2)
( )
4,000 (3) 4,000 (3)
4,000 (3) 6,000 (4)
( )
200,824,000 (1*3) 19,380,000 (1*3) 19,380,000 (1*3)
120,688,000 (2*3) 152,394,000 (2*4) 152,394,000 (2*4)
321,512,000 (5) 171,774,000 (5) 171,774,000 (5)
*
51,712,180 (1*7) 4,990,350 (1*7) 4,990,350 (1*7)
31,077,160 (2*7) 111,120,625 (2*8) 26,160,970 (2*7)
82,789,340 (6) 116,110,975 (6) 31,151,320 (6)
238,722,660 (5-6) 55,663,025 (5-6) 140,622,680 (5-6)
V.1
V.2
* Non Foldable Lens 1,030 (7)
* Foldable Lens 4,375 (8)
29
. 4,000 1,030
149,111,820
4,375 238,722,660
55,663,025
140,622,680

√“¬ß“π°“√«‘®—¬ §«“¡§ÿâ¡§à“¢Õß°“√ºà“µ—¥µâÕ°√–®°‚¥¬„ à‡≈π 巰⫵“‡∑’¬¡™π‘¥π‘Ë¡‡ª√’¬∫‡∑’’¬∫°—∫™π‘¥·¢Áß„π∫√‘∫∑¢Õߪ√–‡∑»‰∑¬ 65
3.2
1.
2.
3.
4
3.3
1.
2.
(cost)
. (charge)

66Health Intervention and Technology Assessment Program‚§√ß°“√ª√–‡¡‘π‡∑§‚π‚≈¬’·≈–π‚¬∫“¬¥â“π ÿ¢¿“æ
1. .
, 2549;1;1:51-57
2. .
10 ( . .2550-2554):
. . 2551. 14:
278-297.
3. Wongwetsawat Somchai, Blinding cataract in Thailand, 1994. Thai J Ophthalmol
1996;10;2:125-134
4. Chaidaroon W, Tungpakorn N, Puranitee P. Current trends in cataract surgery in
Thailand-2004 Survey J Med Assoc Thai 2005;88(supp 9):S43-50
5. Preoperative visual acuity and location of cataract patients in
Maharat Nakorn Ratchsima Hospital. Thai J PBl Hlth Ophthalmol 2004;18(1):49-56
6. Riaz Y, Mehta JS, Wormald R, Evans JR, Foster A, Ravilla T et al. Surgical
interventions for age-related cataract. Cochrane Database Syst Rev. 2007 Issue 4
Oct 18(4): CD001323 pub 2
7. Tabin G, Chen M, Espandar L. Cataract surgery for the developing world. Curr
Opin Ophthalmol 2008;19(1) : 55-9
8. Baltussen R, Sylla M, and Mariotti S. “Cost-Effectiveness of Cataract Surgery; A
Global and Regional Analysis.” Bulletin of the World Health Organization
2004;82(5):338-45
9. Cheng MA, Congdon NG, Baker SK, Bloem MW, Savage H, Sommer A. The
surgical management of cataract: barriers, best practices and outcomes. Int
Ophthalmol 2007 Aug 22 (Epub ahead of print)
10. Pongnumkul P. Intraocular lens. Thai J Publ Hlth Ophthalmol 1991;5:93-107

√“¬ß“π°“√«‘®—¬ §«“¡§ÿâ¡§à“¢Õß°“√ºà“µ—¥µâÕ°√–®°‚¥¬„ à‡≈π 巰⫵“‡∑’¬¡™π‘¥π‘Ë¡‡ª√’¬∫‡∑’’¬∫°—∫™π‘¥·¢Áß„π∫√‘∫∑¢Õߪ√–‡∑»‰∑¬ 67
11. , , , ,
, . :
.
2007;21(2):136-160
12. Yenjitr C, Tangcharoensathien V, Sornpaisan C, Jenchitr W. Vision and quality of
life in patients having intraocular lens for cataract surgery. Proceedings The 19th
Congress of Asia-Pacific Academy of Ophthalmology 2003:247-52
13. Clear corneal
phacoemulsification with conventional and new anesthetic techniques. Thai J
Ophthalmol 1993;7(2) : 167-87
14. Raiyawa S, Samaiporn S, Sirikul S, Jenchitr W, Yenjitr C, Tapunya M. Visual acuity
in patients having foldable and non-foldable intraocular lens for cataract surgery. J
Med Assoc Thai 2008;91 (Supp) : S
15. .
. 2551;3;1:53-56
16. Afsar, A.J., et al., Economic costs of cataract surgery using a rigid and a foldable
intraocular lens. Ophthalmic and Physiological Optics, 2001. 21(4): p. 262-267.
17. Dolders, M.G., et al., Cost effectiveness of foldable multifocal intraocular lenses
compared to foldable monofocal intraocular lenses for cataract surgery. Br J
Ophthalmol, 2004. 88(9): p. 1163-8.
18. .
( )
: ; 2549
19. . 2548 – 2550.
20. Dhaivadee Dulayajinda , Wirut Nukhaw, Suchada Kampanartsanyakorn, La-ongsri
Atchaneeyasakul, Thammanoon Surachatkumtonekul, Kayawan Srihiran. Outcomes
of Cataract Surgery in Senile Cataract Patients at Siriraj Hospital: A Prospective
Observational Study:J Med Assoc Thai 2005; 88 (Suppl 9): S82-8

68Health Intervention and Technology Assessment Program‚§√ß°“√ª√–‡¡‘π‡∑§‚π‚≈¬’·≈–π‚¬∫“¬¥â“π ÿ¢¿“æ
21. Jens Christian Norregaard, Charlotte Hindsberger, Jordi Alonso, Lorne Bellan,
Peter Bernth-Petersen, Charlyn Black, Elaine Dunn, Tavs Folmer Andersen, Mireia
Espallargues, Gerard F. Anderson. Visual outcome of cataract surgery in the United
states, Canada, Denmark, and Spain: Arch Ophthalmol.1998;116:1095-1100
22. Jonathan C. Javitt, M. Harvey Brenner, Barbara Curbow, Marcia W. Legro, Debra
A. Street. Outcome of cataract surgery: Arch Ophthalmol.1993:111:686-691
23. Das A, Khan M, Bandhopadhyay C, Ghosh A, Agarwal PK, Banerjee AR. Evaluation
of visual outcome following cataract surgery in a tertiary eye care hospital. J Indian
Med Assoc. 2006 Mar;104(3):116-8, 120.
24. Raiyawa S, Samaiporn S, Sirikul S, Jenchitr W, Yenjitr C, Tapunya M: Visual acuity
in patients having foldable and non-foldable intra-ocular lens for cataract surgery. J
Med Assoc Thai 2008, 91 Suppl 1:S102-110.
25. Fristrom B, Lundh BL: Colour contrast sensitivity in cataract and pseudophakia.
Acta Ophthalmol Scand 2000, 78:506-511.
26. Kuchle M, Lausen B, Gusek-Schneider GC: Results and complications of
hydrophobic acrylic vs PMMA posterior chamber lenses in children under 17 years
of age. Graefes Arch Clin Exp Ophthalmol 2003, 241:637-641.
27. Rowe NA, Biswas S, Lloyd IC: Primary IOL implantation in children: a risk analysis
of foldable acrylic v PMMA lenses. Br J Ophthalmol 2004, 88:481-485.
28. Gozum N, Unal ES, Altan-Yaycioglu R, Gucukoglu A, Ozgun C: Visual performance
of acrylic and PMMA intraocular lenses. Eye 2003, 17:238-242.
29. Monteiro M, Marinho A, Salgado-Borges J, Ribeiro L, Castro-Correia J: Evaluation
of a new scleral fixation foldable IOL in the absence of capsule support. J Fr
Ophtalmol 2007, 30:791-797.
30. Wilson ME, Elliott L, Johnson B, Peterseim MM, Rah S, Werner L, et al: AcrySof
acrylic intraocular lens implantation in children: clinical indications of
biocompatibility. J Aapos 2001, 5:377-380.
31. Negishi K, Ohnuma K, Hirayama N, Noda T: Effect of chromatic aberration on
contrast sensitivity in pseudophakic eyes. Arch Ophthalmol 2001, 119:1154-1158.

√“¬ß“π°“√«‘®—¬ §«“¡§ÿâ¡§à“¢Õß°“√ºà“µ—¥µâÕ°√–®°‚¥¬„ à‡≈π 巰⫵“‡∑’¬¡™π‘¥π‘Ë¡‡ª√’¬∫‡∑’’¬∫°—∫™π‘¥·¢Áß„π∫√‘∫∑¢Õߪ√–‡∑»‰∑¬ 69
32. Vilarrodona L, Barrett GD, Johnson B: High-order aberrations in pseudophakia with
different intraocular lenses. J Cataract Refract Surg 2004, 30:571-575.
33. Iwase T, Tanaka N, Sugiyama K: Postoperative refraction changes in
phacoemulsification cataract surgery with implantation of different types of
intraocular lens. Eur J Ophthalmol 2008, 18:371-376.
34. Pandey SK, Werner L, Wilson ME, Jr., Izak AM, Apple DJ: Capsulorhexis ovaling
and capsular bag stretch after rigid and foldable intraocular lens implantation:
experimental study in pediatric human eyes. J Cataract Refract Surg 2004, 30:2183-
2191.
35. Kurosaka D, Kato K: Membranous proliferation of lens epithelial cells on acrylic,
silicone, and poly(methyl methacrylate) lenses. J Cataract Refract Surg 2001,
27:1591-1595.
36. O'Keefe M, Mulvihill A, Yeoh PL: Visual outcome and complications of bilateral
intraocular lens implantation in children. J Cataract Refract Surg 2000, 26:1758-
1764.
37. Ram J, Brar GS, Kaushik S, Gupta A, Gupta A: Role of posterior capsulotomy with
vitrectomy and intraocular lens design and material in reducing posterior capsule
opacification after pediatric cataract surgery. J Cataract Refract Surg 2003, 29:1579-
1584.
38. Wejde G, Kugelberg M, Zetterstrom C: Posterior capsule opacification: comparison
of 3 intraocular lenses of different materials and design. J Cataract Refract Surg
2003, 29:1556-1559.
39. Zemaitiene R, Jasinskas V, Barzdziukas V, Auffarth GU: Prevention of posterior
capsule opacification using different intraocular lenses (results of one-year clinical
study). Medicina (Kaunas) 2004, 40:721-730.
40. Cheng JW, Wei RL, Cai JP, Xi GL, Zhu H, Li Y, et al: Efficacy of different
intraocular lens materials and optic edge designs in preventing posterior capsular
opacification: a meta-analysis. Am J Ophthalmol 2007, 143:428-436.

70Health Intervention and Technology Assessment Program‚§√ß°“√ª√–‡¡‘π‡∑§‚π‚≈¬’·≈–π‚¬∫“¬¥â“π ÿ¢¿“æ
41. Moreno-Montanes J, Alvarez A, Bes-Rastrollo M, Garcia-Layana A: Optical
coherence tomography evaluation of posterior capsule opacification related to
intraocular lens design. J Cataract Refract Surg 2008, 34:643-650.
42. Shah AR, Praveen MR, Vasavada AR: Posterior capsule opacification after extra
capsular cataract extraction in Indian rural population: foldable acrylic vs poly
(methyl-methacrylate) intraocular lenses a randomized clinical trial. Eye 2008,
22:889-894.
43. Michael Georgopoulos, Oliver Findl, Rupert Menapace, Wolf Buehl, Matthias
Wirtitsch, Georg Rainer. Influence of intraocular lens material on regeneratory
posterior capsule opacification after neodymium:YAG laser capsulotomy.J Cataract
Refract Surg 2003; 29:1560–1565
44. Nishi O, Nishi K, Akura J: Speed of capsular bend formation at the optic edge of
acrylic, silicone, and poly(methyl methacrylate) lenses. J Cataract Refract Surg
2002, 28:431-437.
45. Kodjikian L, Beby F, Rabilloud M, Bruslea D, Halphen I, Fleury J, et al: Influence of
intraocular lens material on the development of acute endophthalmitis after cataract
surgery? Eye 2008, 22:184-193.
46. Li N, Chen X, Zhang J, Zhou Y, Yao X, Du L, et al: Effect of AcrySof versus
silicone or polymethyl methacrylate intraocular lens on posterior capsule
opacification. Ophthalmology 2008, 115:830-838.
47. Apple DJ, Peng Q, Visessook N, Werner L, Pandey SK, Escobar-Gomez M, et al:
Eradication of posterior capsule opacification: documentation of a marked decrease
in Nd:YAG laser posterior capsulotomy rates noted in an analysis of 5416
pseudophakic human eyes obtained postmortem. Ophthalmology 2001, 108:505-
518.
48. Oner FH, Gunenc U, Ferliel ST: Posterior capsule opacification after
phacoemulsification: foldable acrylic versus poly(methyl methacrylate) intraocular
lenses. J Cataract Refract Surg 2000, 26:722-726.
√“¬ß“π°“√«‘®—¬ §«“¡§ÿâ¡§à“¢Õß°“√ºà“µ—¥µâÕ°√–®°‚¥¬„ à‡≈π 巰⫵“‡∑’¬¡™π‘¥π‘Ë¡‡ª√’¬∫‡∑’’¬∫°—∫™π‘¥·¢Áß„π∫√‘∫∑¢Õߪ√–‡∑»‰∑¬ 71
49. Hayashi K, Hayashi H, Nakao F, Hayashi F: Changes in posterior capsule
opacification after poly(methyl methacrylate), silicone, and acrylic intraocular lens
implantation. J Cataract Refract Surg 2001, 27:817-824.
50. Sundelin K, Friberg-Riad Y, Ostberg A, Sjostrand J: Posterior capsule opacification
with AcrySof and poly(methyl methacrylate) intraocular lenses. Comparative study
with a 3-year follow-up. J Cataract Refract Surg 2001, 27:1586-1590.
51. Auffarth GU, Brezin A, Caporossi A, Lafuma A, Mendicute J, Berdeaux G, et al:
Comparison of Nd : YAG capsulotomy rates following phacoemulsification with
implantation of PMMA, silicone, or acrylic intra-ocular lenses in four European
countries. Ophthalmic Epidemiol 2004, 11:319-329.
52. Emma J. Hollick, David J. Spalton, Paul G. Ursell, Milind V. Pande, Sarah A.
Barman, James F. Boyce, Kate Tilling: The Effect of Polymethylmethacrylate,
Silicone, and Polyacrylic Intraocular Lenses on Posterior Capsular Opacification 3
Years after Cataract Surgery. Ophthalmology 1999;106:49–55
53. Hayashi H, Hayashi K, Nakao F, Hayashi F: Quantitative comparison of posterior
capsule opacification after polymethylmethacrylate, silicone, and soft acrylic
intraocular lens implantation. Arch Ophthalmol. 1998 Dec; 116(12):1579-82.
54. EJAZ AHMAD JAVED, ZIA UD DIN AHMAD, MUHAMMAD SULTAN. ND: YAG
LASER CAPSULOTOMY AND COMPLICATIONS. Professional Med J Dec 2007;
14(4): 616-619.
55. Keith A. Skolnick, Jay I. Perlman, Doug M. Long, Jean M. Kernan. Neodymium:
YAG laser posterior capsulotomies performed by residents at a Veterans
Administration hospital. J Cataract Refract Surg 2000; 26:597-601
56. , , , .
. 2002; 16(2):
69 -94
57.
2551.
72Health Intervention and Technology Assessment Program‚§√ß°“√ª√–‡¡‘π‡∑§‚π‚≈¬’·≈–π‚¬∫“¬¥â“π ÿ¢¿“æ
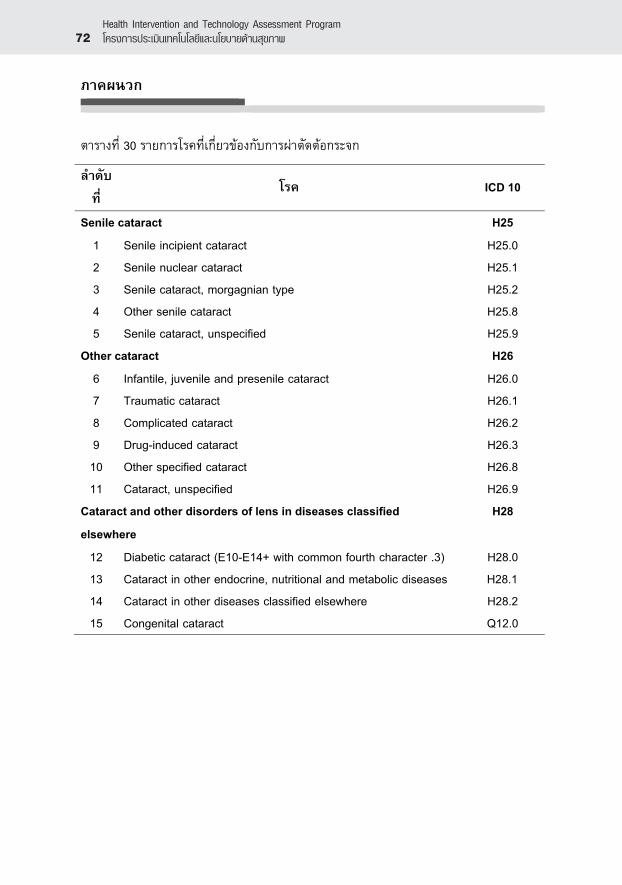
30
ICD 10
Senile cataract H25
1 Senile incipient cataract H25.0
2 Senile nuclear cataract H25.1
3 Senile cataract, morgagnian type H25.2
4 Other senile cataract H25.8
5 Senile cataract, unspecified H25.9
Other cataract H26
6 Infantile, juvenile and presenile cataract H26.0
7 Traumatic cataract H26.1
8 Complicated cataract H26.2
9 Drug-induced cataract H26.3
10 Other specified cataract H26.8
11 Cataract, unspecified H26.9
Cataract and other disorders of lens in diseases classified
elsewhere
H28
12 Diabetic cataract (E10-E14+ with common fourth character .3) H28.0
13 Cataract in other endocrine, nutritional and metabolic diseases H28.1
14 Cataract in other diseases classified elsewhere H28.2
15 Congenital cataract Q12.0

√“¬ß“π°“√«‘®—¬ §«“¡§ÿâ¡§à“¢Õß°“√ºà“µ—¥µâÕ°√–®°‚¥¬„ à‡≈π 巰⫵“‡∑’¬¡™π‘¥π‘Ë¡‡ª√’¬∫‡∑’’¬∫°—∫™π‘¥·¢Áß„π∫√‘∫∑¢Õߪ√–‡∑»‰∑¬ 73
31
ICD 9 CM
1 Intracapsular extraction of lens by temporal inferior route 13.11
2 Other intracapsular extraction of lens 13.19
3 Extracapsular extraction of lens by linear extraction technique 13.2
4 Extracapsular extraction of lens by simple aspiration (and
irrigation) technique
13.3
5 Phacoemulsification and aspiration of cataract 13.41
6 Mechanical phacofragmentation and aspiration of cataract by
posterior route
13.42
7 Mechanical phacofragmentation and other aspiration of cataract 13.43
8 Extracapsular extraction of lens by temporal inferior route 13.51
9 Other extracapsular extraction of lens 13.59
10 Insertion of pseudophakos, not otherwise specified 13.70
11 Insertion of intraocular lens prosthesis at time of cataract
extraction, one-stage
13.71
12 Secondary insertion of intraocular lens prosthesis 13.72

74Health Intervention and Technology Assessment Program‚§√ß°“√ª√–‡¡‘π‡∑§‚π‚≈¬’·≈–π‚¬∫“¬¥â“π ÿ¢¿“æ
32 ( )
( .)
1 CYRDSC
2 HMAIN
3 HCODE
4 HN HN (Hospital Number)
5 AN AN (Admission Number)
6 CPID / /
( )
7 DOB
8 SEX 1= 2=
9 DATEADM
10 DATEDSC
11 LEAVEDAY
12 DISCHS
1 = Complete recovery
2 = Improved
3 = Not improved
4 = Normal delivery
5 = Un-delivery
6 = Normal child discharge with mother
7 = Normal child discharge separately
8 = Stillbirth
9 = Dead
13 DISCHT
1 = With approval
2 = Against advice
3 = Escape
4 = By transfer
5 = Other
6 = Dead autopsy
7 = Dead no autopsy
14 DRG (Diagnosis Related Group)

√“¬ß“π°“√«‘®—¬ §«“¡§ÿâ¡§à“¢Õß°“√ºà“µ—¥µâÕ°√–®°‚¥¬„ à‡≈π 巰⫵“‡∑’¬¡™π‘¥π‘Ë¡‡ª√’¬∫‡∑’’¬∫°—∫™π‘¥·¢Áß„π∫√‘∫∑¢Õߪ√–‡∑»‰∑¬ 75
15 RW (Relative Weight)
16 ADJRW
(Adjusted Relative Weight)
17 AMOUNT
18 AMLIM /
19 AMOVLIM /
20 AMREIMB
21 AMNREIMB
22 TR1
23 TR2
24 TR3
25 TR4
26 TR5
27 TR6
28 TR7
29 TR8
30 TR9
31 TR10
32 TR11
33 TR12
34 TR13
35 TR14
36 TR15
37 PDX
38 SDX1 ( 1)
39 SDX2 ( 2)
40 SDX3 ( 3)
41 SDX4 ( 4)
42 SDX5 ( 5)

76Health Intervention and Technology Assessment Program‚§√ß°“√ª√–‡¡‘π‡∑§‚π‚≈¬’·≈–π‚¬∫“¬¥â“π ÿ¢¿“æ
43 SDX6 ( 6)
44 SDX7 ( 7)
45 SDX8 ( 8)
46 SDX9 ( 9)
47 SDX10 ( 10)
48 SDX11 ( 11)
49 SDX12 ( 12)
50 SDX13 ( 13)
51 SDX14 ( 14)
52 SDX15 ( 15)
53 SDX16 ( 16)
54 SDX17 ( 17)
55 SDX18 ( 18)
56 SDX19 ( 19)
57 SDX20 ( 20)
58 PROC1 ( 1)
59 PROC2 ( 2)
60 PROC3 ( 3)
61 PROC4 ( 4)
62 PROC5 ( 5)
63 PROC6 ( 6)
64 PROC7 ( 7)
65 PROC8 ( 8)
66 PROC9 ( 9)
67 PROC10 ( 10)
68 PROC11 ( 11)
69 PROC12 ( 12)
70 PROC13 ( 13)
71 PROC14 ( 14)
72 PROC15 ( 15)
73 PROC16 ( 16)
74 PROC17 ( 17)

√“¬ß“π°“√«‘®—¬ §«“¡§ÿâ¡§à“¢Õß°“√ºà“µ—¥µâÕ°√–®°‚¥¬„ à‡≈π 巰⫵“‡∑’¬¡™π‘¥π‘Ë¡‡ª√’¬∫‡∑’’¬∫°—∫™π‘¥·¢Áß„π∫√‘∫∑¢Õߪ√–‡∑»‰∑¬ 77
75 PROC18 ( 18)
76 PROC19 ( 19)
77 PROC20 ( 20)
78 C2006
79 C2007
80 TOTPAY2006 /
TOTCGD2006
81 TOTPAY2007 /
TOTCGD2007
82 TOTPAY / TOTGCD
83 TOTCPY06 / TOTPAT2006
84 TOTCPY07 / TOTPAT2007
85 TOTCPY / TOTPAT

78Health Intervention and Technology Assessment Program‚§√ß°“√ª√–‡¡‘π‡∑§‚π‚≈¬’·≈–π‚¬∫“¬¥â“π ÿ¢¿“æ
33
REG_HCODE
REG_HMAIN
REG_PROVINCE
REG_MAININS
REG_SEX 1= 2=
REG_AGE_Y ( )
REG_AGE_M
REG_AGE_D
REG_VARE VA
REG_VALE VA
REG_DATE
OPER_AN
OPER_VARE VA
OPER_VALE VA

√“¬ß“π°“√«‘®—¬ §«“¡§ÿâ¡§à“¢Õß°“√ºà“µ—¥µâÕ°√–®°‚¥¬„ à‡≈π 巰⫵“‡∑’¬¡™π‘¥π‘Ë¡‡ª√’¬∫‡∑’’¬∫°—∫™π‘¥·¢Áß„π∫√‘∫∑¢Õߪ√–‡∑»‰∑¬ 79
34
.. 25
46 –
255
0
25
46
2547
25
48
2549
25
50
U
C
CS
U
C
CS
U
C
CS
U
C
CS
U
C
CS
U
C
CS
4,
610
10,8
17
23,6
44
12,1
21
30,1
25
12,6
73
34,8
19
13,6
21
33,0
48
15,6
97
126,
246
64,9
29
(4
1.2)
(4
2.5)
(4
1.6)
(4
2.4)
(4
1.3)
(4
3.1)
(4
1.0)
(4
3.3)
(4
1.6)
(4
3.0)
(4
1.3)
(4
2.9)
6,
569
14,6
15
33,2
04
16,4
53
42,8
56
16,7
63
50,0
43
17,8
29
46,3
95
20,7
90
179,
067
86,4
50
(5
8.8)
(5
7.5)
(5
8.4)
(5
7.6)
(5
8.7)
(5
6.9)
(5
9.0)
(5
6.7)
(5
8.4)
(5
7.0)
(5
8.7)
(5
7.1)
11
,179
25
,432
56
,848
28
,574
72
,981
29
,436
84
,862
31
,450
79
,443
36
,487
30
5,31
3 15
1,37
9

80Health Intervention and Technology Assessment Program‚§√ß°“√ª√–‡¡‘π‡∑§‚π‚≈¬’·≈–π‚¬∫“¬¥â“π ÿ¢¿“æ
35
.. 25
46 –
255
0
25
46
2547
25
48
2549
25
50
U
C
CS
U
C
CS
U
C
CS
U
C
CS
U
C
CS
U
C
CS
0 - 39
405
184
1,90
5 19
2 2,
301
189
2,33
1 17
4 2,
321
166
405
184
(3
.6)
(0.7
) (3
.4)
(0.7
) (3
.2)
(0.6
) (2
.7)
(0.6
) (2
.9)
(0.5
) (3
.0)
(0.6
)
40 - 4
9
600
727
2,92
6 79
0 3,
500
852
3,81
7 76
7 3,
608
780
600
727
(5
.4)
(2.9
) (5
.1)
(2.8
) (4
.8)
(2.9
) (4
.5)
(2.4
) (4
.5)
(2.1
) (4
.7)
(2.6
)
50 - 5
9
1,65
5 2,
464
8,37
1 2,
738
10,6
33
2,88
0 12
,743
3,
029
11,9
50
3,45
2 1,
655
2,46
4
(1
4.8)
(9
.7)
(14.
7)
(9.6
) (1
4.6)
(9
.8)
(15.
0)
(9.6
) (1
5.0)
(9
.5)
(14.
9)
(9.6
)
60 - 6
4
1,58
9 2,
904
8,16
9 3,
188
10,4
32
3,38
6 12
,192
3,
614
11,3
18
4,11
7 1,
589
2,90
4
(1
4.2)
(1
1.4)
(1
4.4)
(1
1.2)
(1
4.3)
(1
1.5)
(1
4.4)
(1
1.5)
(1
4.2)
(1
1.3)
(1
4.3)
(1
1.4)
65 - 6
9
2,35
7 5,
518
11,8
23
6,10
5 15
,173
5,
922
17,6
75
6,22
1 16
,359
6,
941
2,35
7 5,
518
(2
1.1)
(2
1.7)
(2
0.8)
(2
1.4)
(2
0.8)
(2
0.1)
(2
0.8)
(1
9.8)
(2
0.6)
(1
9.0)
(2
0.8)
(2
0.3)
70 - 7
4
2,28
4 6,
367
11,3
04
7,19
4 15
,013
7,
230
17,7
01
7,80
5 16
,506
9,
187
2,28
4 6,
367
(2
0.4)
(2
5.0)
(1
9.9)
(2
5.2)
(2
0.6)
(2
4.6)
(2
0.9)
(2
4.8)
(2
0.8)
(2
5.2)
(2
0.6)
(2
5.0)
75 - 7
9
1,38
4 4,
537
7,46
4 5,
245
10,0
13
5,52
7 11
,754
6,
155
11,0
70
7,47
7 1,
384
4,53
7
(1
2.4)
(1
7.8)
(1
3.1)
(1
8.4)
(1
3.7)
(1
8.8)
(1
3.9)
(1
9.6)
(1
3.9)
(2
0.5)
(1
3.7)
(1
9.1)
80
90
5 2,
731
4,88
6 3,
122
5,91
6 3,
450
6,64
9 3,
685
6,31
1 4,
367
905
2,73
1
(8
.1)
(10.
7)
(8.6
) (1
0.9)
(8
.1)
(11.
7)
(7.8
) (1
1.7)
(7
.9)
(12.
0)
(8.1
) (1
1.5)
11
,179
25
,432
56
,848
28
,574
72
,981
29
,436
84
,862
31
,450
79
,443
36
,487
30
5,31
3 15
1,37
9

√“¬ß“π°“√«‘®—¬ §«“¡§ÿâ¡§à“¢Õß°“√ºà“µ—¥µâÕ°√–®°‚¥¬„ à‡≈π 巰⫵“‡∑’¬¡™π‘¥π‘Ë¡‡ª√’¬∫‡∑’’¬∫°—∫™π‘¥·¢Áß„π∫√‘∫∑¢Õߪ√–‡∑»‰∑¬ 81
16
.
.254
8
- N
SH
O - N
o-H
MAIN
: 2,
143(
2.9%
)
5,03
3 (6
.9%
)
65,9
05 (90
.16
%)
-: 4,
799
(95.
4%)
1.
733
(15
.0)
2.
446
(9.
3)
3.
415
(8.
6)
4.
410
(8.
5)
5.
356
(7.
4)
-: 23
4 (4
.6%
)
1.
103
(44
.0)
2.
61
(26.
1)
3.
12
(5.1
)
4.
10
(4.3
)
5.
4 (1.
7)
-: 1,
093
(1.7
%)
1.
368
(33
.7)
2.
355
(32
.5)
3.
130
(11
.9)
4.
77
(7.0
)
5.
51
(4.7
)
-: 3,
310
(5.0
%)
1.
352
(10
.6)
2.
318
(9.
6)
3.
213
(6.
4)
4.
199
(6.
0)
5.
184
(5.
6)
.
.254
8
72,9
81
:
38, 7
89( 6
3.1%
)
=
22,7
13 (36
.91%
)
–
: 27
7 (0
.4%
)
–
: 33
,278
(45
.6%
)
Mea
n=46
.1 S
D=29
.8 M
edia
n=40
Mod
e=45
Min
.=2
Max
=23
8
–
: 6,
293
(7.4
%)
-:
61,5
02 (93
.3%
)

82Health Intervention and Technology Assessment Program‚§√ß°“√ª√–‡¡‘π‡∑§‚π‚≈¬’·≈–π‚¬∫“¬¥â“π ÿ¢¿“æ
17
.
.254
9
- N
SH
O - N
o-H
MAIN
: 2,
312(
2.7%
)
6,48
0 (7
.6%
)
73,4
60 (86
.6 %
)
-: 6,
155
(95.
0%)
1.
781
(12
.7)
2.
586
(9.
5)
3.
539
(8.
8)
4.
508
(8.
3)
5.
455
(7.
4)
-: 32
5 (5
.0%
)
1.
171
(52
.6)
2.
85
(26.
2)
3.
22
(6.8
)
4.
4 (1.
2)
5.
4 (1.
2)
6.
3 (0.
9)
7.
3 (0.
9)
-: 1,
233
(1.7
%)
1.
452
(36
.7)
2.
201
(16
.3)
3.
161
(13
.1)
4.
135
(10
.9)
5.
93
(7.5
)
-: 3,
689
(5.0
%)
1.
599
(16
.2)
2.
340
(9.
2)
3.
323
(8.
8)
4.
241
(6.
5)
5.
230
(6.
2)
.
.254
9
84,8
62
:
40,2
20( 5
6.5%
)
=
27,2
89 (38
.3%
)
–
: 34
5 (0
.4%
)
–
: 37
,221
(43
.9%
)
Mea
n=46
.2 S
D=28
.6 M
edia
n=40
Mod
e=45
Min
.=2
Max
=238
–
: 6,
293
(7.4
%)
-:
71,1
63 (96
.9%
)

√“¬ß“π°“√«‘®—¬ §«“¡§ÿâ¡§à“¢Õß°“√ºà“µ—¥µâÕ°√–®°‚¥¬„ à‡≈π 巰⫵“‡∑’¬¡™π‘¥π‘Ë¡‡ª√’¬∫‡∑’’¬∫°—∫™π‘¥·¢Áß„π∫√‘∫∑¢Õߪ√–‡∑»‰∑¬ 83
18
.
.255
0
- N
SH
O:
188
(0.2
)
- N
o-H
MAIN
:
2,00
5(2.
5%)
-213
40:
77
2 (1
.0%
)
-118
94:
1
(0.0
%)
6,61
3 (8
.3%
)
69,8
64 (86
.0 %
)
-: 6,
392
(95.
0%)
1.
766
(12
.0)
2.
664
(10
.4)
3.
490
(7.
7)
4.
425
(6.
6)
5.
424
(6.
6)
-: 22
1 (3
.3%
)
1.
107
(48
.4)
2.
() 65
(29
.4)
3.
1
0 (4
.5)
4.
5 (2.
3)
5.
5 (2.
3)
6.
3 (0.
9)
7.
3 (1.
4)
-: 1,
517
(2.2
%)
1.
438
(28
.9)
2.
349
(23
.0)
3.
225
(14
.8)
4.
166
(10
.9)
5.
108
(7.
1)
-: 3,
650
(5.2
%)
1.
680
(9.
3)
2.
382
(5.
2)
3.
() 35
7 (4
.9)
4.
2
74 (3.
8)
5.
240
(3.
3)
.
.255
0
79,4
43
:
40,2
20(6
2.2%
)
=
24,4
77 (37
.8%
)
–
: 25
2 (0
.6%
)
–
: 39
,939
(99
.3%
)
Mea
n=46
.9 S
D=29
.1 M
edia
n=40
Mod
e=22
.0 M
in.=
2 M
ax=23
8
–
: 29
(0.
1%)
-:
64,6
97 (92
.6%
)

84Health Intervention and Technology Assessment Program‚§√ß°“√ª√–‡¡‘π‡∑§‚π‚≈¬’·≈–π‚¬∫“¬¥â“π ÿ¢¿“æ
36
.
.254
8 –
2550
U
C
CSM
BS
25
48
2549
25
50
2548
25
49
2550
fo
ldab
le
non-
fold
able
fo
ldab
le
non-
fold
able
fo
ldab
le
non-
fold
able
fo
ldab
le
non-
fold
able
fo
ldab
le
non-
fold
able
fo
ldab
le
non-
fold
able
()
59,0
00
10,5
77
30,1
72
50,2
06
30,2
70
45,6
66
24,3
98
4,01
9 25
,399
4,
845
29,8
04
5,42
9
Mec
hani
cal c
ompl
icat
ion
89(0
.15)
15
(0.1
4)
80(0
.27)
76
(0.1
5)
93(0
.31)
10
8(0.
24)
31(0
.13)
6(0.
15)
40(0
.16)
37
(0.7
6)
52(0
.17)
42
(0.7
7)
Com
plic
atio
ns o
f pr
oced
ures
34
2(0.
58)
46(0
.43)
28
7(0.
95)
257(
0.51
) 30
7(1.
01)
440(
0.96
) 11
8(0.
48)
41(1
.02)
15
6(0.
61)
86(1
.78)
26
9(0.
90)
122(
2.25
)
Ast
igm
tism
13
(0.0
2)
2(0.
02)
23(0
.08)
13
(0.0
3)
21(0
.07)
2(
0.00
) 8(
0.03
) 1(
0.02
) 25
(0.1
0)
0 47
(0.1
6)
2(0.
04)
Myo
pia
91(0
.15)
22
(0.2
1)
43(0
.14)
72
(0.1
4)
56(0
.19)
78
(0.1
7)
59(0
.24)
7(
0.17
) 94
(0.3
7)
5(0.
10)
90(0
.30)
3(
0.06
)
Hyp
erm
etro
pia
0 0
0 1(
0.00
) 0
0 0
0 3(
0.01
) 0
3(0.
01)
0
Pur
ulen
t en
doph
thal
miti
s 13
(0.0
2)
2(0.
02)
9(0.
03)
25(0
.05)
13
(0.0
4)
22(0
.05)
2(
0.01
) 2(
0.05
) 2(
0.01
) 2(
0.04
) 12
(0.0
4)
4(0.
07)
Vitr
eous
hae
mor
rhag
e 10
8(0.
18)
19(0
.18)
52
(0.1
7)
104(
0.21
) 53
(0.1
8)
83(0
.18)
35
(0.1
4)
11(0
.27)
45
(0.1
8)
5(0.
10)
65(0
.22)
12
(0.2
2)
Ret
inal
det
achm
ent w
ith ret
inal
brea
k
109(
0.18
) 17
(0.1
6)
42(0
.14)
83
(0.1
7)
70(0
.23)
11
0(0.
24)
39(0
.16)
5(
0.12
) 34
(0.1
3)
10(0
.21)
62
(0.2
1)
15(0
.28)
Cho
roid
al h
emor
rhag
e an
d ru
ptur
e 2(
0.00
) 2(
0.02
) 0
1(0.
00)
1(0.
00)
6(0.
01)
1(0.
00)
0 3(
0.01
) 0
4(0.
01)
0
Afte
r ca
tara
ct
27(0
.05)
9(
0.09
) 12
(0.0
4 )
28(0
.06)
14
(0.0
5)
28(0
.06)
36
(0.1
5)
3(0.
07)
24(0
.09)
4(
0.08
) 24
(0.0
8)
8(0.
15)
Hyp
hem
a 55
(0.0
9)
6(0.
06)
21(0
.07)
30
(0. 0
6)
12(0
.04)
39
(0.0
9)
12(0
.05)
5(
0.12
) 10
(0.0
4)
5(0.
10)
7(0.
02)
7(0.
13)
Oth
er c
orne
al e
dem
a 36
(0.0
6)
5(0.
05)
31(0
. 10)
17
(0.0
3)
15(0
.05)
18
(0.0
4)
14(0
.06)
3(
0.07
) 14
(0.0
6)
3(0.
06)
10(0
.03)
7(
0.13
)

√“¬ß“π°“√«‘®—¬ §«“¡§ÿâ¡§à“¢Õß°“√ºà“µ—¥µâÕ°√–®°‚¥¬„ à‡≈π 巰⫵“‡∑’¬¡™π‘¥π‘Ë¡‡ª√’¬∫‡∑’’¬∫°—∫™π‘¥·¢Áß„π∫√‘∫∑¢Õߪ√–‡∑»‰∑¬ 85

86Health Intervention and Technology Assessment Program‚§√ß°“√ª√–‡¡‘π‡∑§‚π‚≈¬’·≈–π‚¬∫“¬¥â“π ÿ¢¿“æ