actualizaciÓn en lipodistrofia. 2005 - xiv jornada de ... · actualizaciÓn en lipodistrofia 2005...
TRANSCRIPT

ACTUALIZACIÓN
EN LIPODISTROFIA
2005
Emilio Fumero
Servicio de Enfermedades Infecciosas
Hosp Clinic i Provincial

QUE ES LA
LIPODISTROFIA ?

LIPODISTROFIA
HIPERCOLESTEROLEMIA
• LDL-C
• HDL-C
HIPERTRIGLICERIDEMIA
• VLDL
INSULINO
RESISTENCIA
ALTERACIONES EN
LA MORFOLOGIA
CORPORAL

0
10
20
30
40
50
TG COL
LD-
LD+
* P<0.001 Martinez et al. Lancet 2001; 357: 592-598
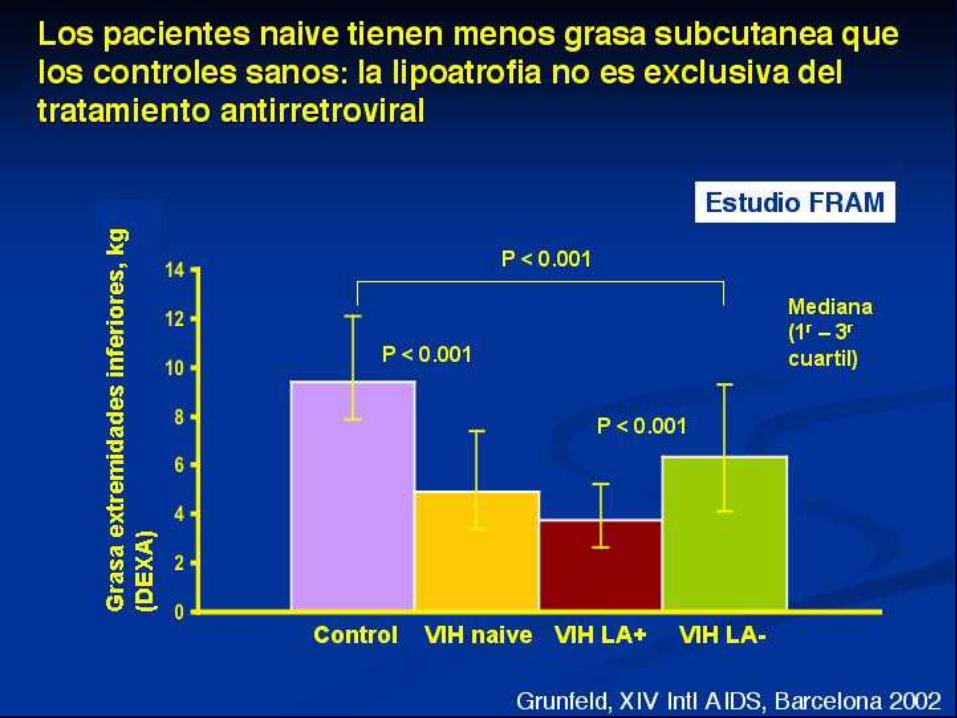
Los cambios lipídicos son más altos cuando
existe lipodistrofia
Cambios lipídicos en pacientes naive que
inician HAART
*
*

LipoSyndr_GLB602_32 5
Los antirretrovíricos (ARV) y las primeras
notificaciones de lipodistrofia (LD)
1Grunfeld. Am J Med 1989;86:27. 2Hengel. Lancet 1997;350:1596. 3Ruane. 37th ICAAC; 1997;
Toronto. Resumen 185. 4Carr. 5th CROI; 1998; Chicago. Resumen 410.
87 88 89 90 91 92 93 94 95 96 97 98 99 2000 82 83
AZT ddI ddC d4T 3TC ABC
EFV DLV NVP
SQV NFV APV
RTV IDV
Demacración, triglicéridos1 Cuello de búfalo2,3 LD4
LPV

• La Lipodistrofia se advierte como
problema clinico a finales de 1998.
• A Carr, 1999, describe el fenomeno e
intenta emitir una definicion.
• E Martinez, 2001, realiza la primera
descripcion epidemiologica del problema e
intenta encontrar factores de riesgo
(MULTIFACTORIAL).
• Distribucion geografica desigual: 15;83%
LIPODISTROFIA. Historia

Alteraciones corporales

• abdomen
• breasts
• buffalo hump
• fat of the face
• fat of the buttocks
• fat of the extremities
the more severe,
the more evident
Lipodystrophy is easy to diagnose ?
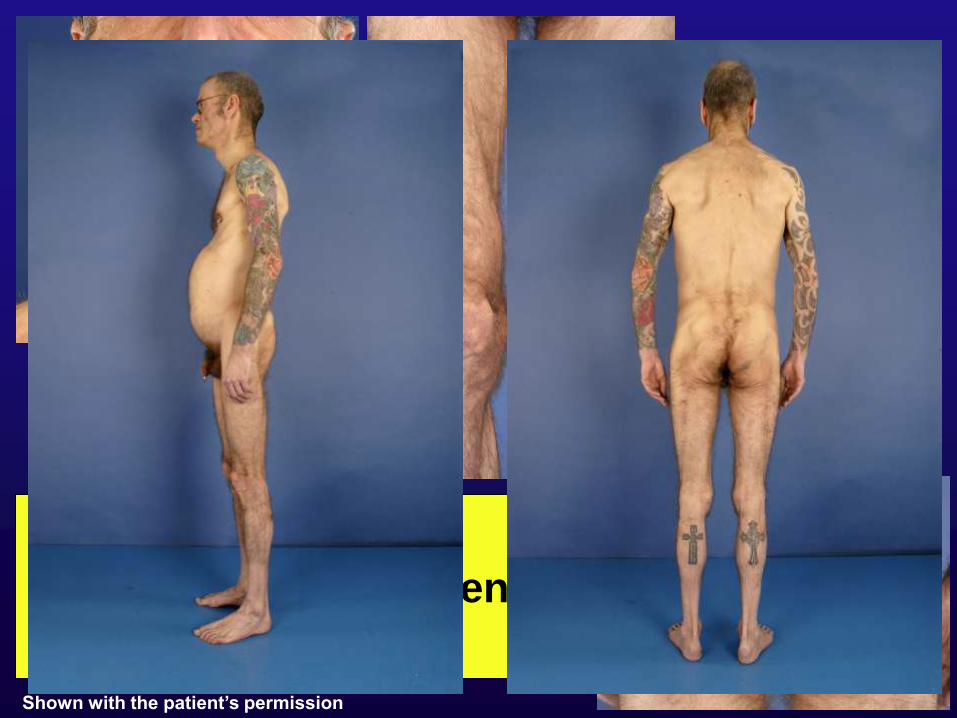
Seen in > 50% of patients
Shown with the patient’s permission
QuickTime™ and aTIFF (Uncompressed) decompressor
are needed to see this picture.

… y le preguntaron a un juez,
¿ Qué significa para Ud, Pornografía ?
“ Es algo que no puedo definir
bien, pero una vez que lo vea lo
sabré reconocer “

“ No quiero tomar tratamiento,
perdon quiero decir, esperar
lo mas que pueda.
No quiero que se deforme mi
cuerpo “

TARV VIH
HUESPED
LIPODISTROFIA

Risk Factors Lipoatrophy Fat accumulation
Host Age Age
White race
Female sex Female sex TNF- 238G>A? /ApoC3? Plasma triglyceride
Treatment Duration of d4T exposure
related (as compared to ZDV)
Exposure to NRTI
therapy prior to PI-HAART
Exposure to PI +/- Exposure to PI
HIV Related Low nadir CD4 count
Prior AIDS
Co-infection HCV ?
Risk Factors Contributing to
Changes in Body Fat Distribution
Mallal et al. AIDS 2000; 14: 1309; Lichtenstein et al. AIDS 2001;15:1389; Mulligan et al. J AIDS 2005; 38:18;
Saint-Marc et al.AIDS 1999;13:1659; Carr et al. Lancet 1999;353:2093; Galli et al. Arch Int Med 2002;162:2621
Zylberberg et al.AIDS 2000;14:2055; Duong et al.JAIDS 2001;27:245; Rodriguez-Guardado et al.JAIDS
2003;32:348; Maher et al, AIDS 2002;16:2013-18; Nolan et al, AIDS 2003;17:121-23; Tarr et al, JID 2005 in press


LIPODISTROPHY
HIV
Host Drugs NRTIs
PIs Environment
Genetics
Chronic
inflammation
Immune
reconstitution
Lipodystrophy: more than just an ART-related AE!!!

COMO SE HACE EL
DIAGNOSTICO DE
LIPODISTROFIA ?

1. EL DIAGNOSTICO SE REALIZA
ENTRE EL MEDICO Y EL
PACIENTE, A TRAVES DE UNA
CONCORDANCIA DE OPINION.
2. NO EXISTE UNA MEDIDA
OBJETIVA QUE PERMITA EL
DIAGNOSTICO DE LIPODISTROFIA

¿ CUANTA GRASA ES
LA NORMAL ?

N=37 (33 men) Median 25-75 IQR BMI, kg/m2 22.2 20.8-24.4 BIA Total fat, kg 12.7 10.0-16.1 % fat 19.7 15.3-25.8 DEXA Arm fat, kg 9.8 5.6-19.1 Leg fat, kg 4.0 2.7-5.9 Trunk fat, kg 6.0 4.3-11.5 Total fat, kg 10.7 7.6-21.2 SONOGRAPHY Intrabdominal fat, mm 15.50 12.30-17.90 SC abdomen fat, mm 13.20 9.35-20.88 SC arm fat, mm 5.20 3.63-6.20 SC face fat, mm 5.10 4.40-5.68 ABDOMINAL CT SCAN Intrabdominal fat, cm2 50.00 18.75-90.25 SC abdomen fat, cm2 81.80 56.20-171.58 Milinkovic A et al. 4th Lipo, San Diego 2002
What is “normal” fat?

Objective assessment of body fat
distribution DEXA
Limb
fat
Abdom (L4) CT
No LD
LD
SAT VAT
Shown with the patient’s permission Grinspoon & Carr, N Engl J Med 2005

DEXA
• It measures the amount of bone, fat, and
fat-free mass.
• Device similar to a CT scanner.
• Ionizing radiations (less than other x-ray
devices).
• Limitations:
1) interference with radiopaque objects
2) unable to distinguish between intra-
abdominal and subcutaneous fat
3)not standardised for regional fat
measurements.

CT scan
•L4 (umbilicus).
•Slice thickness 5-10 mm.
•Pixels reflecting fat: 20-
50 a 150-250 HU.
•Limitations:
1) Surface
2) Imprecise fat density
3) Imprecise compartment
4) Only standardised for
abdomen (intra-abdominal
obesity = V/S0.4)

• Ultrasound
>7.5 MHz (subcutaneous)
3.5-4 MHz (intra-abdominal)
• Limitations:
1) thickness
2) reference points not
standardised
3) variability
4) not useful for intra-abdominal
fat if severe obesity or
intraluminal gas
PS: 5 cm on the left of the umbilicus
BS: 10 cm above the right elbow
MS: on the right malar bone
IA: between the liver and the aorta
(minor omentum)
Sonography
PS
BS
MS
IA
PS
BS
MS
IA Martinez E et al. Lancet 2000
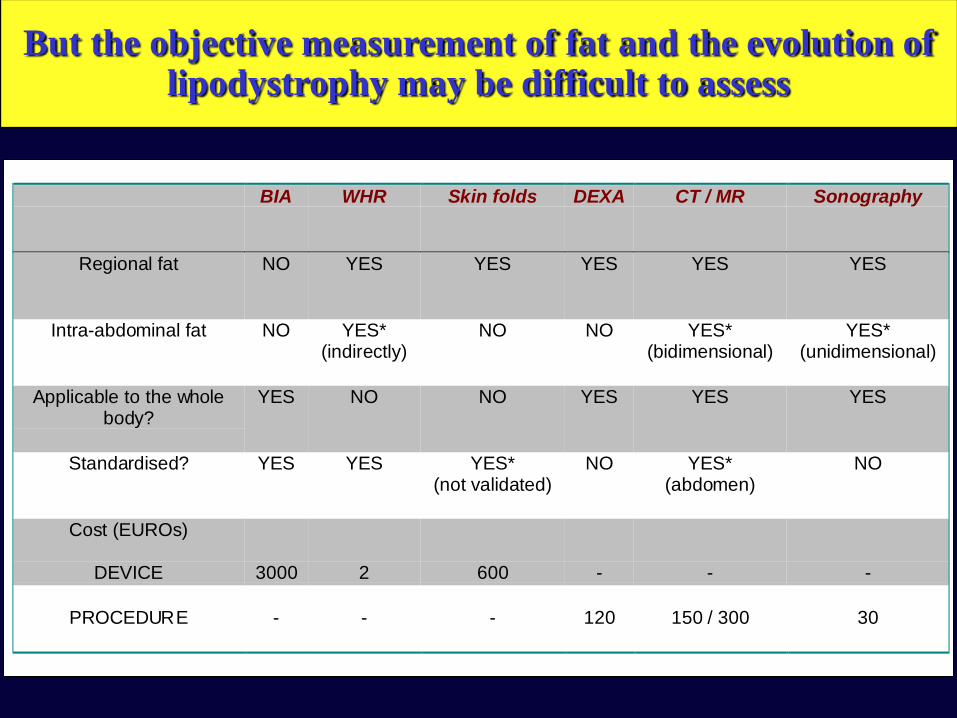
BIA WHR Skin folds DEXA CT / MR Sonography
Regional fat NO YES YES YES YES YES
Intra-abdominal fat NO YES*(indirectly)
NO NO YES*(bidimensional)
YES*(unidimensional)
Applicable to the wholebody?
YES NO NO YES YES YES
Standardised? YES YES YES*(not validated)
NO YES*(abdomen)
NO
Cost (EUROs)
DEVICE 3000 2 600 - - -
PROCEDURE - - - 120 150 / 300 30
But the objective measurement of fat and the evolution of lipodystrophy may be difficult to assess

Tecnica DEXA TAC RMN Ecografia
¿que mide? masa superficie / volumen espesor
¿que “grasa”? lipidos adipocitos + vasos + tejido conectivo
Radiacion si (baja) si no no
Variabilidad <5% <2% <2% <3% (subcutanea)
~10% (intraabdominal)
Adaptado de: Engelson 1999; Martinez 2000; Schwenk 2002
¿Como se miden los cambios de grasa?

y a los 3 meses,…
“MI CUERPO HA
CAMBIADO, CREO QUE
HE PERDIDO GRASA “

LipoSyndr_GLB602_32 29 Martínez E. The lancet vol 357 pp 592-598. 24 Feb. 2001
Riesgo de lipodistrofia en pacientes con HAART
Curva de Kaplan-Meyer mostrando la progresión a cualquier lipodistrofia
0
5
1 0
1 5
2 0
2 5
0 6 1 2 1 8 2 4 Pro
po
rció
n d
e p
acie
nte
s c
on
tip
o
de L
ipo
dis
tro
fia(
%)
Cualquier Lipodistrofia
Lipodistrofia con lipoatrofia
subcutánea
Lipodistrofia con obesidad
central
Tiempo tras comienzo HAART (meses)
Nº Pacientes 494 433 333 246 136
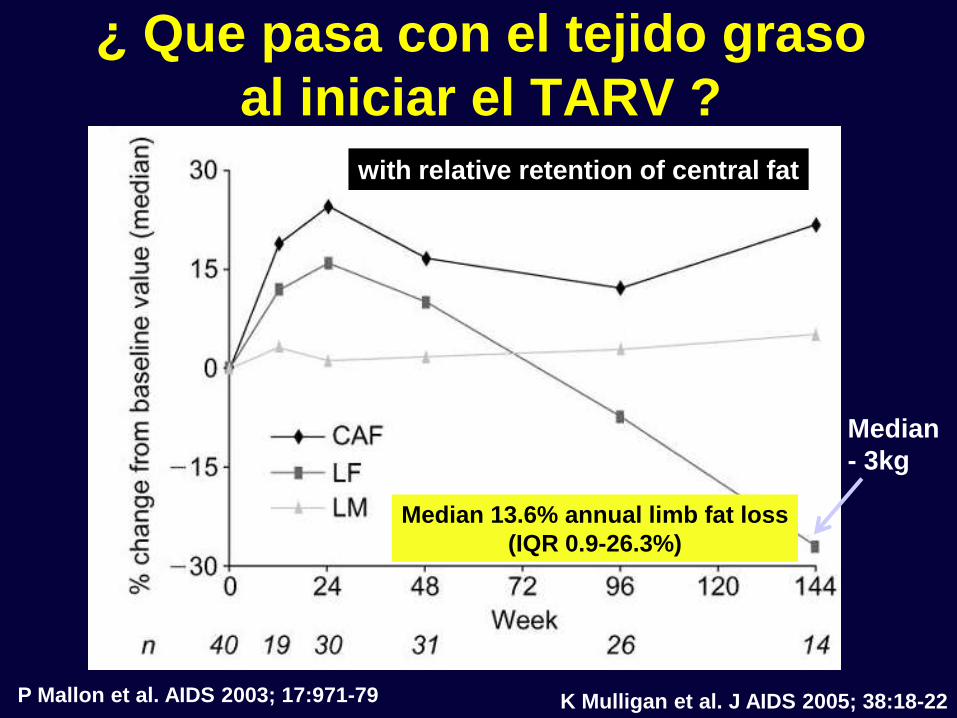
¿ Que pasa con el tejido graso
al iniciar el TARV ?
P Mallon et al. AIDS 2003; 17:971-79
Median
- 3kg
Median 13.6% annual limb fat loss
(IQR 0.9-26.3%)
with relative retention of central fat
K Mulligan et al. J AIDS 2005; 38:18-22

“…Dr, DAME UN
TRATAMIENTO QUE NO
ME DEFORME EL
CUERPO “

Time (days) to report of lipodystrophy
0,0
0,2
0,4
0,6
0,8
1,0
0 200 400 600 800 1000
RTV/SQV
RTV/SQV plus d4T
van der Valk et al. AIDS 2001; 15:847-855
Exposure to NRTI even in the absence of PI
may be sufficient for
lipoatrophy development!
• Saint-Marc T et al.AIDS 1999;13:1659-67
• Dubé et al. 4th Lipodystrophy Workshop, 2002.
Antivir Ther 2002:L18
• Gallant JE. XV Int AIDS Conf, July 2004, Bangkok, #4538
Exposure to NRTI rather than PI
more important contributor to the risk of
abnormal fat distribution

-30
-40
-50
-20
-10
0
10
20
16 32 48 64 80
*
* *
†
†
† †
†
†
AZT + 3TC
ddI + d4T
0
Med
ian
a d
e %
de c
am
bio
de
sd
e b
as
al
Semanas
Dube M et al. 4th Lipo, San Diego 2002
* p<0.05 intergrupos
† p <0.05 intragrupos
ACTG 384
Riesgo de lipoatrofia NO es igual
con diferentes NRTIs
Grasa extremidad inferior

Differential effects of NRTI therapy on lipoatrophy
risk: Stavudine (d4T) vs. Zidovudine (AZT)
57%
44%
54%
46%
12%
18% 19%
0%
20%
40%
60%
Fat wasting in
OZCOMBO (n=84)
Fat wasting in ALBI
(n=120)
Fat wasting in
NOVAVIR (IDV)
(n=100)
% p
ati
en
ts
d4T/3TC d4T/ ddI ZDV/3TC
30 months
Chene G, et al. Clin Infect
Dis. 2002;34:649-657
Joly V, et al. AIDS.
2002; 16:2447-54 Amin J, et al. HIV Clin Trials.
2003;4:252-261

• What is the role of non-thymidine NRTI therapy in lipoatrophy risk?
- TENOFOVIR: Gilead 903 trial
Total limb fat (mean):
96 weeks: TDF 7.9kg vs d4T 5.0kg ( p <0.001)
144 weeks: TDF 8.7kg vs d4T 4.4kg ( p <0.001)
Total limb fat (mean):
96 weeks: TDF 7.9kg vs d4T 5.0kg ( p <0.001)
144 weeks: TDF 8.7kg vs d4T 4.4kg ( p <0.001) Gallant JE, et al. JAMA. 2004;292:191 - 201 . Gallant JE, et al. JAMA. 2004;292:191 - 201 .
% p
ati
ents
wit
h
lip
od
yst
rop
hy
p <0.001
1 1
3 4
12
19
0
5
10
15
20
Week 48 Week 96 Week 144
TDF+3TC+EFV
d4T+3TC+EFV
% p
ati
ents
wit
h
lip
od
yst
rop
hy
p <0.001
1 1
3 4
12
19
0
5
10
15
20
Week 48 Week 96 Week 144
TDF+3TC+EFV
d4T+3TC+EFV
p <0.001
1 1
3 4
12
19
0
5
10
15
20
Week 48 Week 96 Week 144
TDF+3TC+EFV
d4T+3TC+EFV
Differential effects of NRTI therapy on
lipoatrophy risk

Podzamczer et al. 11th CROI 2004, Abstract 716
Arm
Leg
Trunk
Total
Weight
Physician/Patient Agreed
Moderate/Severe Fat Loss
Regional Fat Changes by DEXA
and Weight
-1500
-1000
-500
0
500
1000
1500
2000
2500
3000
3500
Ch
an
ge
in f
at
ma
ss (
g)
by
DE
XA
ABC
d4T
1.4 1.4 1.4
2.7
15.1
11.610.6
9.3
0
2
4
6
8
10
12
14
16
Face Arms Buttocks Legs
% w
tih
fat
loss
ABC/3TC/EFV
d4T/3TC/EFV
1.4 1.4 1.4
2.7
15.1
11.610.6
9.3
0
2
4
6
8
10
12
14
16
Face Arms Buttocks Legs
% w
tih
fat
loss
ABC/3TC/EFV
d4T/3TC/EFV
• What is the role of non-thymidine NRTI therapy in lipoatrophy risk?
ABCDE study: Week 48
Differential effects of NRTI therapy on
lipoatrophy risk

“ Dr, que tal si suspendo el
tratamiento o me lo cambia
por otro que no cambie la
grasa de mi cuerpo “

-10 -10
8
-6
-11
-9
-18
17
-10
-19
-25%
-20%
-15%
-10%
-5%
0%
5%
10%
15%
20%
Moderate/severe LD at
baseline
Remainder patients
TC Non-HDL-c
Triglycerides
TC/HDL-c
HDL-c
Comparison of the percentage of change in the lipid parameters between the
group of patients with moderate/severe lipodystrophy (LD) at baseline and the
remainder group.
*
Data are expressed as the median percentage change in the variables. TC, total
cholesterol; HDL-c, high-density lipoprotein cholesterol; TC/HDL-c, TC to HDL-c
ratio. * p<0.05 for the comparison between groups by the Willcoxon rank sum test.
NEFA: SIMPLIFICACION a ABC, EFV, NVP
Fumero et al. AIDS 2005
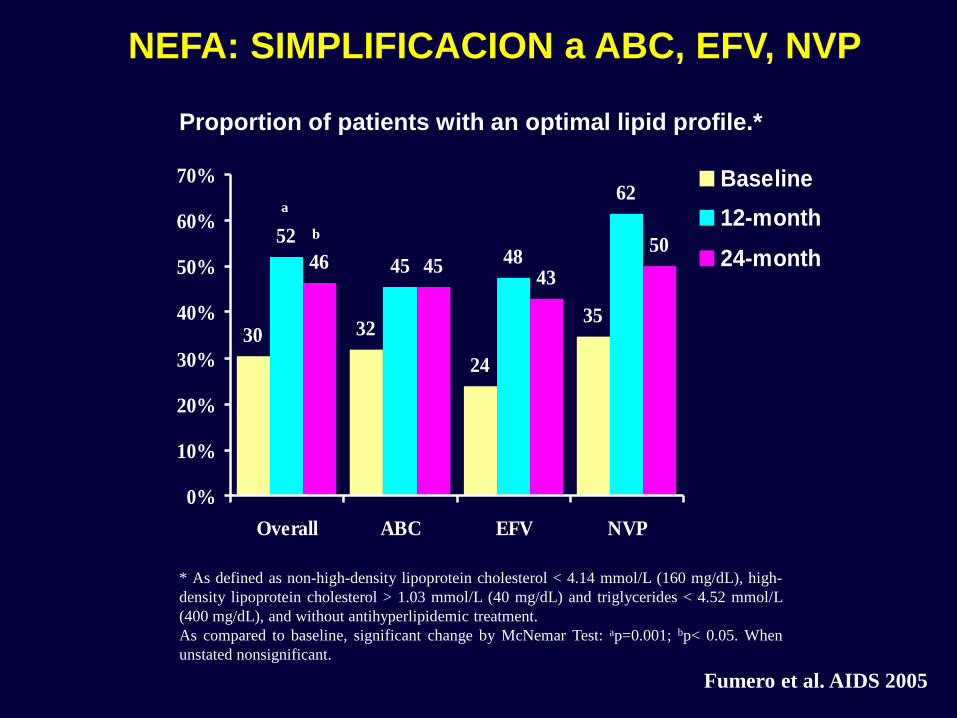
* As defined as non-high-density lipoprotein cholesterol < 4.14 mmol/L (160 mg/dL), high-
density lipoprotein cholesterol > 1.03 mmol/L (40 mg/dL) and triglycerides < 4.52 mmol/L
(400 mg/dL), and without antihyperlipidemic treatment.
As compared to baseline, significant change by McNemar Test: ap=0.001; bp< 0.05. When
unstated nonsignificant.
Proportion of patients with an optimal lipid profile.*
a
30 32
24
35
52
45 48
62
46 4543
50
0%
10%
20%
30%
40%
50%
60%
70%
Overall ABC EFV NVP
Baseline
12-month
24-monthb
Fumero et al. AIDS 2005
NEFA: SIMPLIFICACION a ABC, EFV, NVP

T otal bodyT runkLim bs
Fat
in K
g30
25
20
15
10
5
0
Baseline
12-m onth
Fat content as measured by DEXA for the limbs, trunk and total body in 23
patients at baseline and 12 months after protease inhibitor replacement.
*
Horizontal lines within boxes represent medians; box boundaries represent 25th and 75th percentiles; and bars extend
from the box to the highest and lowest values, excluding outliers. * Significantly different (p<0.05) from baseline by
Wilcoxon Signed Rank Test.
NEFA: SIMPLIFICACION a ABC, EFV, NVP
Fumero et al. AIDS 2005

PI Withdrawal Does Not Reverse Lipoatrophy
“ Of importance, no study
(including 5 studies employing DEXA scans)
showed any improvement
in fat loss after discontinuation
of the PI component of therapy ”

PI Withdrawal May However Reduce Visceral Fat Accumulation
“ Three of the 5 PI-switch studies that used
quantitative methods that directly assess
visceral fat accumulation (abdominal CT or MRI)
showed trends toward reduction of
visceral adipose tissue, whereas two
failed to document any changes “
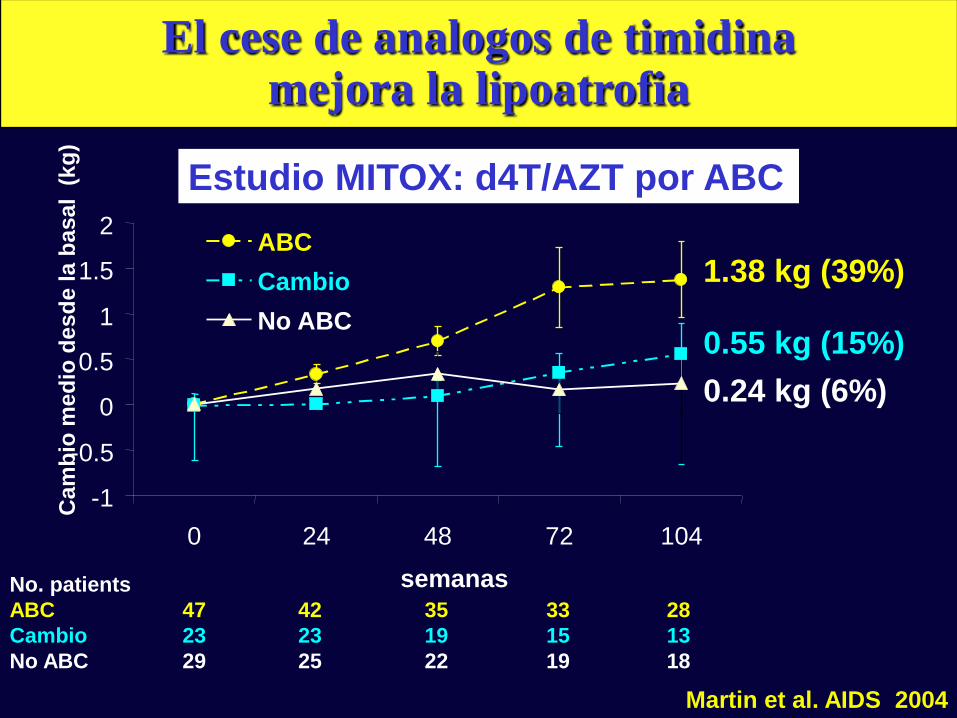
No. patients
ABC 47 42 35 33 28
Cambio 23 23 19 15 13
No ABC 29 25 22 19 18
-1
-0.5
0
0.5
1
1.5
2
0 24 48 72 104
semanas
Ca
mb
io m
ed
io d
es
de
la
ba
sa
l (
kg
)
ABC
Cambio
No ABC
1.38 kg (39%)
0.55 kg (15%)
0.24 kg (6%)
Estudio MITOX: d4T/AZT por ABC
Martin et al. AIDS 2004
El cese de analogos de timidina mejora la lipoatrofia

RAVE Design
Moderate Lipoatrophy
Stable on thymidine
anologue ART >24
weeks
(n = 105)
48 wks
48 wks
TDF QD
+ NRTI
+ PI, PI/r or NNRTI
No history of TDF or ABC use or resistance
Adequate Renal and Hepatic Function at baseline
ABC BD
+ NRTI
+ PI, PI/r or NNRTI

RAVE Median changes at week 48 in Limb Fat by
DEXA by baseline characteristics
393
66
529
374
432
316
210
357 363
247
0
100
200
300
400
500
600
All Subjects AZT at Baseline d4T at Baseline On PI No PI
TDF ABC
p=0.97
Ch
an
ge
in
fa
t m
as
s (
g)
by D
EX
A
n: 49 44 12 16 37 28 31 32 18 12
Median Baseline Limb Fat
3.0kg 2.9kg 2.91kg 2.74kg 5.12kg 2.97kg


... y que pasa con las
grasas de mi sangre ?

35
28
2
34 3533
26
3230
37
53
26
-3
350
0
10
20
30
40
50
60
70
80
% d
e c
am
bio
de
sd
e l
a b
asal
Determinaciones
después de 4
semanas de
tratamiento
1Drug Facts and Comparisons, April 2001; 2 Cahn P et al. IAS July 2001; 3 Moyle, Baldwin 1999; 4 Danner et al. 1995; 5 Rockstroh et al. 2000; 6 MicroMedEx-DrugDex
APV 1 NFV 2 ATV 2 SQV 3 RTV 4 IDV 5 LPV/r 6
Pacientes naïve durante su primera pauta que incluye IPs
Los cambios lipídicos difieren entre IPs
350 colesterol
triglicéridos

0
10
20
30
40
M98-863 M97-720 M97-765 M98-957
Col
TG
60 semana 144 semana 96 semana 48 semana
Naive No naive
LPV/r + d4T + 3TC LPV/r + NNRTI + NRTIs
Murphy. AIDS 2001;15:1.
Los cambios lipídicos son más altos si existe exposición previa al TAR
Cambios lipídicos en ensayos clínicos con
LPV/r
% d
e c
am
bio
desd
e l
a b
asal

… es cierto que puedo
sufrir del corazon, con el
tratamiento ?

Pero el seguimiento prospectivo y preciso de
poblaciones amplias muestra ECV
0
1
2
3
4
5
6
7
8
No TAR <1 1-2 2-3 3-4 >4
Nu
mero
de IA
M p
or
1.0
00
pa
cie
nte
s-a
ño
(IC
95
%)
No. IAM
No. pac-año
3 9 14 22 31 47
5.714 4.140 4.801 5.847 7.220 8.477
Años en TAR Total 126 36.199
Test for trend p<0.00001
Estudio D:A:D. N Engl J Med 2003; 349: 1993-2003

0.1 1 10
Riesgo relativo de IAM (IC 95%)
Modelos uni- and multivariado de Poisson Ajustado también por: historia familiar, IMC, vía de transmisión VIH, y raza
TAR (por año) Edad (por cada 5 años) Sexo masculino ECV previa
Tabaco
RR ajustado 1.26
(IC 95%: 1.12-1.41)
RR 13.8
(8.6-22.0)
TAR es un factor de riesgo para IAM… pero los factores “clasicos” siguen vigentes
Estudio D:A:D:
Estudio D:A:D. N Engl J Med 2003; 349: 1993-2003

Causas Cohorte VIH Poblacion Cataluña
de H. Clinic (97-01) 16-64 años (97-00)
muerte (n = 163) (n = 38.859)
Virus, parasitos,
hongos & micobacterias
no TB 30% 0.6%
Infeciones bacterianas 8% 0.5%
Tuberculosis 9% 0.2%
Neoplasia (excluyendo LNH) 27% 44%
Linfoma no-Hodgkin 13% 2%
Cardiovascular 5% 19%
Enf. hepatica terminal 15% 2%
Suicidio 2% 3%
Accidentes 4% 13%
Muertes por ECV en pacientes VIH menores que
en la poblacion general ajustada por edad
Milinkovic et al. XIV AIDS Barcelona, 2002
Factor riesgo Unidades
Sexo hombre o mujer h
Edad años 46
Colesterol total mg/dL 245
HDL-colesterol mg/dL 35
TA sistólica mmHg 125
Tratamiento anti-HTA (sólo si TAs >120) sí or no n
Fumador activo sí or no s
Estimación de riesgo a… 10 años 10
RIESGO 0,19 19%
0,00 0,05 0,10 0,15 0,20 0,25 0,30
Predicción de riesgo CV (Framingham Heart Study)

h
46
200
35
125
n y
10
12%
0,00 0,05 0,10 0,15 0,20 0,25 0,30
Factor riesgo Unidades
Sexo hombre o mujer
Edad años
Colesterol total mg/dL
HDL-colesterol mg/dL
TA sistólica mmHg
Tratamiento anti-HTA (sólo si TAs >120) sí or no
Fumador activo sí or no
Estimación de riesgo a… 10 años
RIESGO 0,19
Predicción de riesgo CV (Framingham Heart Study)
h
46
245
35
125
n n
10
6%
0,00 0,05 0,10 0,15 0,20 0,25 0,30
Factor riesgo Unidades
Sexo Hombre o mujer
Edad años
Colesterol total mg/dL
HDL-colesterol mg/dL
TA sistólica mmHg
Tratamiento anti-HTA (sólo si TAs >120) sí or no
Fumador activo sí or no
Estimación de riesgo a… 10 años
RIESGO 0,19
Predicción de riesgo CV (Framingham Heart Study)

0
5
10
15
20
25
30
no-ART
PI-ART
stopsmoking
+controlBP
+controllipids
NVP-ART
% 1
0 y
r C
AD
ris
k
www.CHD-taskforce.com
10 y
ear
ab
so
lute
ris
k o
f C
AD
NO-PI
ART
Prediccion de riesgo cardiovascular dado ciertas alternativas

Fibratos:
gemfibrozil 900mg/d - 600mg/12h
fenofibrato 200mg/24h
bezafibrato 400mg/24h
Estatinas:
pravastatina 20mg/d
atorvastatina 5mg/d
Combinaciones de ambos:
si no mejoria con farmacos individuales
precaucion, especialmente si IPs concomitantes
riesgo de miopatia: monitorizar CPK si sintomas
Intervencion farmacologica para la dislipemia
Dube et al. Guidelines for the evaluation and management of dyslipidemia in HIV-infected adults receiving ART. CID 2003

¿ QUE PUEDO HACER
PARA PREVENIR LA
LIPODISTROFIA ?

• La dieta no se ha asociado de forma consistente con las
alteraciones lipidicas en los pacientes VIH 1.
• Efecto escaso de la dieta sobre TG (11%) and colesterol total
(21%) comparado con dieta + TTO hipolipemiante 2.
• Dieta pobre en grasa saturada si:
– ingesta en grasa saturada
&
– TTO hipolipemiante
¿Resulta util la “dieta”?
1. Batterham et al. AIDS 2000; 14: 1839-1843
2. Henry et al. Lancet 1998; 352: 1031-1032

0
200
400
600
800
1000
Basal Mes 4
y…¿el “ejercicio”?
TG pueden disminuir con el ejercicio*
Pero…no efecto sobre colesterol total, HDL-, y LDL
* levantamiento de pesas, 1-1.5 h/dia, 4 dias/semana, 16 semanas
P=0.02
TG
en
ayu
nas
(m
g/d
L)
Yarasheski et al. J Appl Physiol 2001; 90: 133-138
n=18

Lipidos Resistencia OC LA
insulina
• Esteroides peor peor = /peor
• rGH peor peor mejor =
• Metformina mejor mejor mejor peor
• Glitazonas =peor mejor mejor
OC: obesidad central LA: lipoatrofia
Las intervenciones medicas tienen eficacia limitada e incluso pueden producir mas
problemas…

• NO IGNORAR EL PROBLEMA Y ESTAR
ATENTO A LO QUE DICE EL PACIENTE !!!
• Medidas generales :
– dieta
– Ejercicio físico
• Suspender los posibles causantes
– PIs ????
– NRTI: d4T
• Intervención:
– Médica: metformin, glitazones, rGH?
– Quirúrgico
Qué se puede hacer con la lipodistrofia?

• Cara
• Requiere cirujano plastico
• No cubierta por Seguridad Social
• No se conocen resultados a largo plazo
Infiltracion facial
La cirugia plastica puede ser cosmeticamente aceptable

Surgery may be cosmetically acceptable (in the absence of better solutions)
•Grasa autóloga
•Acido poliláctico
•Polimetil-
metacrilato
•Others
Resultados pobres o
Complicaciones serias:
Colágeno
Acido hialurónico
Silicone
Autologous fat transfer
(Coleman’s technique)
PROSPECTIVE, PARTIALLY RANDOMIZED, 24 WEEK STUDY TO
COMPARE INTERVENTIONS FOR HIV-RELATED FACIAL
LIPOATROPHY Guaraldi et al, Abstract 12
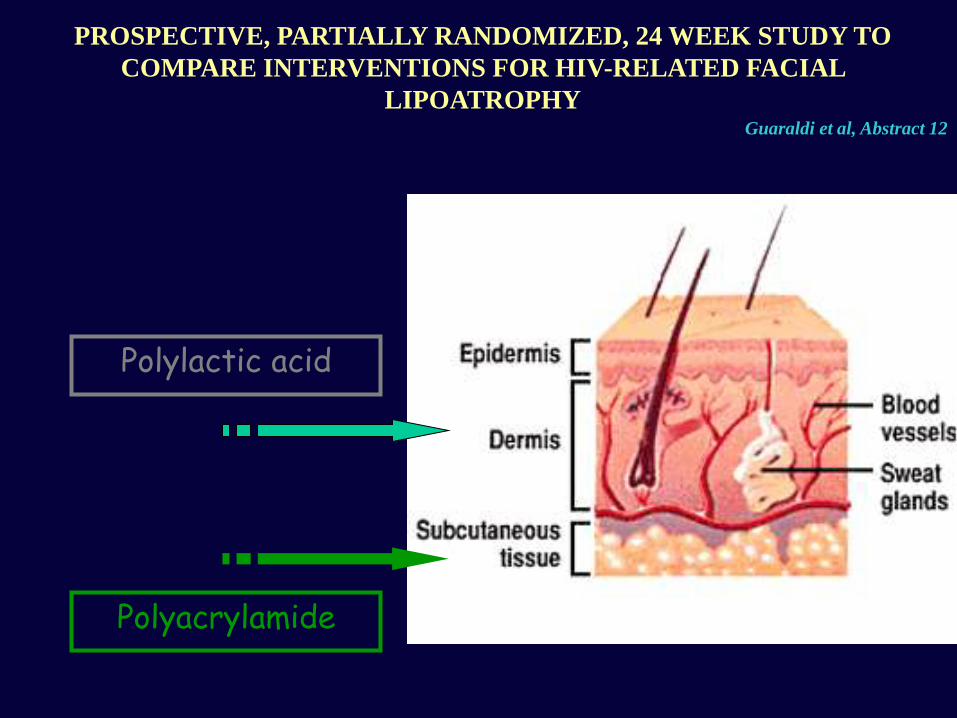
Polylactic acid
Polyacrylamide
PROSPECTIVE, PARTIALLY RANDOMIZED, 24 WEEK STUDY TO
COMPARE INTERVENTIONS FOR HIV-RELATED FACIAL
LIPOATROPHY Guaraldi et al, Abstract 12

Liposucción + Técnica de Colemann
Archivo personal Dr Fontdevila

Archivo personal Dr Fontdevila

Liposucción + Técnica de Colemann
Archivo personal Dr Fontdevila
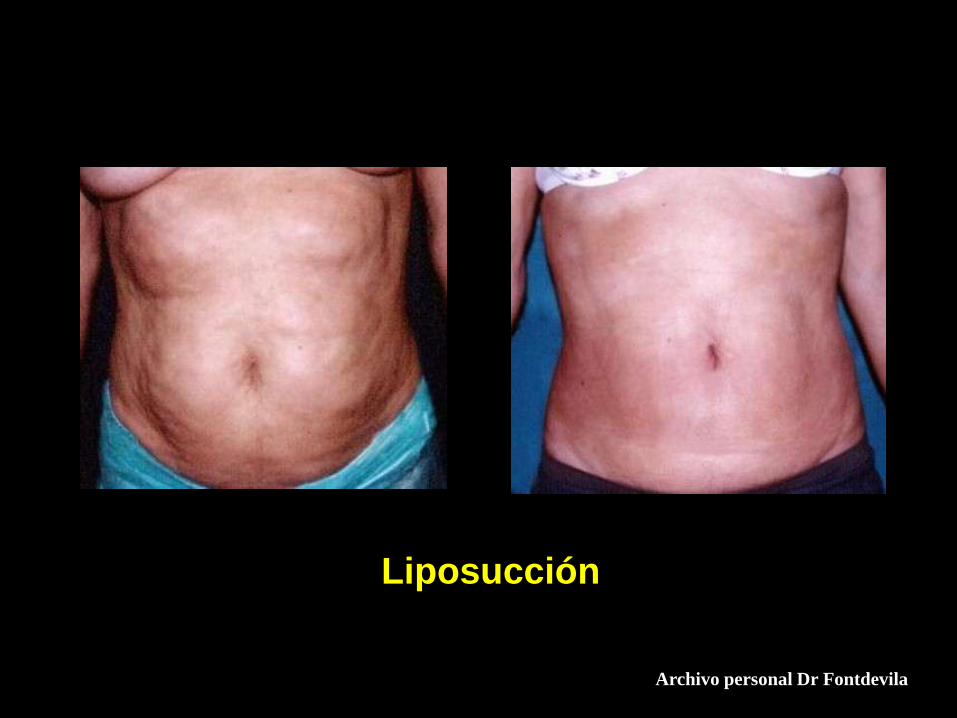
Liposucción
Archivo personal Dr Fontdevila

AquamidTM
Archivo personal Dr Fontdevila

New FillTM o SculptraTM
Archivo personal Dr Fontdevila