agent gtdf binds to - diabetes · 2014-09-15 · tion of diabetes and insulin resistance in vivo...
TRANSCRIPT
Abhishek Kumar Singh,1 Amit Arvind Joharapurkar,2 Mohd. Parvez Khan,3 Jay Sharan Mishra,1
Nidhi Singh,1 Manisha Yadav,1 Zakir Hossain,4 Kainat Khan,3 Sudhir Kumar,5 Nirav Anilkumar Dhanesha,2
Devendra Pratap Mishra,5 Rakesh Maurya,5 Sharad Sharma,6 Mukul Rameshchandra Jain,2
Arun Kumar Trivedi,1 Madan Madhav Godbole,7 Jiaur Rahaman Gayen,4 Naibedya Chattopadhyay,3
and Sabyasachi Sanyal1
Orally Active OsteoanabolicAgent GTDF Binds toAdiponectin Receptors, Witha Preference for AdipoR1,Induces Adiponectin-Associated Signaling, andImproves Metabolic Health ina Rodent Model of DiabetesDiabetes 2014;63:3530–3544 | DOI: 10.2337/db13-1619
Adiponectin is an adipocytokine that signals throughplasma membrane–bound adiponectin receptors 1 and2 (AdipoR1 and -2). Plasma adiponectin depletion isassociated with type 2 diabetes, obesity, and cardio-vascular diseases. Adiponectin therapy, however, is yetunavailable owing to its large size, complex multimeriza-tion, and functional differences of the multimers. We reportdiscovery and characterization of 6-C-b-D-glucopyranosyl-(2S,3S)-(+)-5,7,39,49-tetrahydroxydihydroflavonol (GTDF) asan orally active adiponectin mimetic. GTDF interactedwith both AdipoRs, with a preference for AdipoR1. It in-duced adiponectin-associated signaling and enhancedglucose uptake and fatty acid oxidation in vitro, whichwere augmented or abolished by AdipoR1 overexpres-sion or silencing, respectively. GTDF improved metabolichealth, characterized by elevated glucose clearance,b-cell survival, reduced steatohepatitis, browning ofwhite adipose tissue, and improved lipid profile in an
AdipoR1-expressing but not an AdipoR1-depleted strainof diabetic mice. The discovery of GTDF as an adiponec-tin mimetic provides a promising therapeutic tool for thetreatment of metabolic diseases.
The anti-inflammatory adipocytokine adiponectin (1,2)signals through adiponectin receptors 1 and 2 (AdipoR1and -2) (3). T-cadherin, a cadherin family member thatlacks transmembrane and cytoplasmic domains, alsobinds adiponectin and is proposed to affect its bioavail-ability (4). Plasma adiponectin depletion is associatedwith type 2 diabetes, obesity, and cardiovascular dis-eases (5–7). Adiponectin administration or overexpres-sion ameliorates insulin resistance, metabolic syndrome,and atherosclerosis in animals (3,8–12) and enhancespancreatic b-cell survival (13). This evidence makesAdipoRs important therapeutic targets for metabolicdiseases.
1Biochemistry Division, Council of Scientific and Industrial Research-Central DrugResearch Institute (CSIR-CDRI), Lucknow, Uttar Pradesh, India2Zydus Research Center, Moraiya, Ahmedabad, Gujarat, India3Division of Endocrinology, CSIR-CDRI, Lucknow, Uttar Pradesh, India4Division of Phramacokinetics, CSIR-CDRI, Lucknow, Uttar Pradesh, India5Division of Medicinal and Process Chemistry, CSIR-CDRI, Lucknow, UttarPradesh, India6Division of Toxicology, CSIR-CDRI, Lucknow, Uttar Pradesh, India7Department of Molecular Medicine, Sanjay Gandhi Postgraduate Institute ofMedical Sciences, Lucknow, Uttar Pradesh, India
Corresponding author: Sabyasachi Sanyal, [email protected].
Received 19 October 2013 and accepted 24 April 2014.
This article contains Supplementary Data online at http://diabetes.diabetesjournals.org/lookup/suppl/doi:10.2337/db13-1619/-/DC1.
A.K.S. and A.A.J. contributed equally to this work.
© 2014 by the American Diabetes Association. Readers may use this article aslong as the work is properly cited, the use is educational and not for profit, andthe work is not altered.
3530 Diabetes Volume 63, October 2014
PHARMACOLOGYAND
THERAPEUTIC
S
Structurally, adiponectin belongs to the complement1q family (1,14,15). Adiponectin monomer is a 30-kDaprotein consisting of an N-terminal collagenous domainand a COOH-terminal globular domain (1). Mammalianplasma adiponectin is present in several multimericforms, low-molecular-weight dimer or trimers, medium-molecular-weight hexamers, or high-molecular-weight(HMW) dodecamers and 18 mers (10,16–18). The globu-lar domain of adiponectin (gAd) can form trimers and wasinitially shown to exist as a proteolytic cleavage product inhuman plasma (10); although subsequent studies failed todetect it in circulation, its ability to modulate AdipoRs isundisputed. All these forms display different levels ofphysiological activity, and the HMW complex is consid-ered the most clinically relevant form (10,16–18). TheHMW full-length adiponectin and gAd preferentially sig-nal through AdipoR2 and AdipoR1, respectively (3). Giventhe multimerization-related complexities of adiponectinstructure and function, it appears that small moleculeAdipoR ligands may provide the only viable therapeuticoption against diseases associated with defects in adipo-nectin expression or action.
We have previously identified 6-C-b-D-glucopyranosyl-(2S,3S)-(+)-39,49,5,7-tetrahydroxyflavonol (GTDF), a novelnatural analog of the dietary flavonoid quercetin, as a po-tent orally bioavailable osteoanabolic compound that in-duced proliferation, differentiation, and mineralization ofcultured primary osteoblasts at a nanomolar concentrationthat was 1,000-fold less than the effective concentrationof quercetin or queretin-O-glucoside and restored trabec-ular bones of osteopenic rats on par with parathyroidhormone (19). While studying its mechanism of action,we found that GTDF induced rapid AMP-dependent pro-tein kinase (AMPK), AKT, and p38 phosphorylation andelevated PPARg coactivator-1a (PGC-1a) expression inosteoblasts. GTDF also deacetylated tumor suppressorP53 via indirect activation of NAD-dependent deacetylaseSirtuin1 (Sirt1) (S.Sa., N.C., unpublished observations, andKhan et al. [20]). Literature search revealed that adipo-nectin elicits similar cellular signaling (1,3,11). Interest-ingly, the quercetin group of compounds displayfunctional properties similar to adiponectin, such asAMPK activation, glucose uptake enhancement, induc-tion of fatty acid oxidation–related genes, and ameliora-tion of diabetes and insulin resistance in vivo (21,22). Wethus asked if GTDF, quercetin, or other naturally occurringquercetin analogs could be adiponectin mimetics. Here wereport detailed characterization of GTDF as an adiponectinmimetic that improves metabolic health in a rodent modelof diabetes.
RESEARCH DESIGN AND METHODS
Materials and KitsAll cell culture reagents were from Invitrogen, Life Tech-nologies (Carlsbad, CA). Fine chemicals were from Sigma-Aldrich (St. Louis, MO) unless otherwise indicated. Epoxyagarose beads conjugated with GTDF were constructed at
Shantani Biotech (Pune, India). gAd was purchased fromEnzo Life Sciences (Farmingdale, NY) and ATGen Global(Gyeonggi-do, South Korea) and compared. gAd from bothsources showed identical activity. gAd from ATGen Globalwas used in this study. GW7647 was from Sigma-Aldrich,and full-length human AdipoR1 and AdipoR2 mam-malian expression constructs were from Open Biosystems(Huntsville, AL). 125I-gAd was from Phoenix Pharmaceuti-cals (Burlingame, CA), and 125I (20 MBq) used for radio-labeling GTDF was from BARC (Mumbai, India). Glycogenassay kit was from Sigma-Aldrich. Serum concentrations oftriglycerides (TGs), nonesterified free fatty acids (NEFAs),HDL, LDL, VLDL, total cholesterol, b-hydroxybutyrate, andcreatinine were determined using kits purchased fromPointe Scientific (Canton, MI). Circulating glucagon, insulin,C-peptide, leptin, adiponectin, ghrelin, corticosterone, andmarkers of inflammation (monocyte/macrophage chemo-attractant protein-1 [MCP-1], tumor necrosis factor-a[TNF-a], and interleukin 6 [IL-6]) were estimated usingELISA assay kits (R&D Systems, Minneapolis, MN). Serumconcentrations of sodium and potassium were measuredusing a Cobas c system (Roche Diagnostics, Indianapolis,IN). TUNEL assay kit was from Roche Applied Science (Indi-anapolis, IN). Plasma membrane (PM) extraction kit wasfrom BioVision (Milpitas, CA).
Cell Culture and Induction of DifferentiationHEK-293, CHO, C2C12, and 3T3L-1 cell lines were culturedas previously reported (23). Mouse stromal vascular frac-tion (SVF) was prepared from epididymal fat pad by colla-genase digestion. Human SVFs were prepared from humanlipoaspirates (subcutaneous), collected after approval of theinstitutional ethics committee. Cells were differentiated inthe presence of GTDF or vehicle for 10 days (3T3L-1 andmouse SVF) or 21 days (human SVF) using standard pro-cedure and then analyzed by quantitative PCR (QPCR),immunoblotting, or microscopy.
Iodination and Purification of 125I-GTDFGTDF was radiolabeled as previously described forquercetin with minor modifications. In brief, 10 mL125I (20 MBq) was added to 100 mg GTDF in 5% aceticacid/methanol, chloramine-T (4 mg in Milli-Q H2O) wasadded, and the mixture was allowed to react at roomtemperature (24°C) for 5 min. The reaction was termi-nated by adding 60 mL sodium metabisulphite (4 mg/mLin Milli-Q H2O). The reaction mixture was dried by pass-ing nitrogen and was dissolved into methanol (100 mL).Reverse-phase thin-layer chromatography (TLC) (RP-18 F254s, 8 cm in length; Merck) was used to purify125I-GTDF from free iodine and unlabeled compound usingmethanol-water (40–60%) as mobile phase. After run, theTLC plate was cut into pieces of 0.5 mm each, and thedistribution of radioactivity along the plate was measuredin a gamma counter. TLC of the blank reaction suggestedthe location of free 125I in the TLC plate. The RF value of thelabeled compound was determined by gamma counting. Thearea showing maximum activity at distance of 40–60 mm
diabetes.diabetesjournals.org Singh and Associates 3531
was eluted from the TLC plate and was washed withmethanol, centrifuged, decanted, and dried under N2.
Overexpression and Silencing ExperimentsPlasmid transfections were performed with LipofectamineLTX (Life Technologies) reagent according to the manu-facturer’s protocols. For C2C12 transfections, C2C12 myo-blasts were trypsinized and transfected. The cells were thengrown until 60–70% confluence. They were then differen-tiated and assessed as required. For RNA interference,small interfering RNAs (siRNAs) (siAdipoR1; L-063377-01-0010 and siC; siRNA against luciferase GL3 duplexD-001400–01-50) were purchased from Thermo Scientific(Pittsburgh, PA). Cells were transfected with 0.1 mmol/L ofeach siRNA using DharmaFECT 1 transfection reagent(Thermo Scientific). Seventy-two hours after transfection,cells were treated and analyzed as required.
QPCR, Western Blotting, CoimmunoprecipitationThese studies were performed as previously described (23).The list of primer sequences for QPCR has been provided inSupplementary Table 5. Anti–PGC-1a (ST1202; Millipore,Billerica, MA) was used at 1:2,000 dilution, and anti-CD36 (18836-1-AP; Proteintech, Chicago, IL) was usedat 1:1,000 dilution. Anti–UCP-1 (ab10983), –UCP-3(ab3477), and –PPARa (ab8934) (Abcam, Cambridge, MA)were used at 1:1,000 dilutions. Phospho-AMPK (Thr172),AMPK, phospho-p38 (Thr 180/Tyr 182), p38, phospho-ACC, acetyl coA carboxylase (ACC), glucose transporter 4(Glut4), P53, acetyl-P53 (Lys 382), ccaat/enhancer proteinb (C/EBPb), and b-actin antibodies were from Cell Sig-naling Technology (Beverly, MA) and were used at1:1,000, except b-actin, which was used at 1:3,000 dilu-tion. Antibodies against AdipoR1 (sc-46748), AdipoR2 (sc-46755), and N-cadherin (sc-1502) were from Santa CruzBiotechnology (Dallas, TX) and used at 1:1,000 dilutions.For immunohistochemistry, insulin antibody (Cell SignalingTechnology) was used at a dilution of 1:200, phycoerythrin-tagged Ki-67 antibody (BD Biosciences, San Diego, CA) wasused at a dilution of 1:100, and anti–UCP-1 (ab10983) wasused at a dilution of 1:250. Following detection with oneantibody, Western blots were stripped and reprobed withother antibodies whenever possible.
Glucose UptakeFully differentiated C2C12 myotubes on 24-well plateswere treated with vehicle (0.1% DMSO) or 0.01 mmol/LGTDF for 24 h, after which the cells were serum starvedfor 3 h. The cells were then washed three times in warm(37°C) HEPES buffer solution (HBS; 140 mmol/L sodiumchloride, 20 mmol/L HEPES, 5 mmol/L potassium chlo-ride, 2.5 mmol/L magnesium sulfate, 1 mmol/L calciumchloride, pH 7.4) and then were treated with warm HBSor 0.1 mmol/L insulin (in HBS) for 20 min. Subsequently,cells were washed three times in warm HBS and thenincubated in 250 mL transport solution (HBS containing1 mCi 3H-deoxyglucose [PerkinElmer] and 10 mmol/L un-labeled 2-deoxyglucose [Sigma-Aldrich]) per well for5 min. Then the transport solution was aspirated and the
cells were washed three times with ice-cold stop solution(0.9% NaCl and 25 mmol/L dextrose). Subsequently, thecells were lysed in 100 mL 0.5 N NaOH, and 5 mL lysatewas used for determination of protein concentration (bybicinchoninic acid assay; Sigma-Aldrich), and the rest of thelysate was used to measure cellular radioactivity in a betacounter (Beckman Coulter, New Delhi, India).
Fatty Acid OxidationC2C12 myotubes plated in 12-well plates were treatedwith vehicle (0.1% DMSO) or 0.01 mmol/L GTDF for 2,24, or 120 h. After treatment, the cells were washed threetimes in warm HBS and were then incubated with me-dium containing 0.75 mmol/L palmitate (conjugated to2% fatty acid–free BSA/[14C]palmitate at 2 mCi/mL) for2 h. After this incubation period, 1 mL of the culturemedium was removed and transferred to a sealabletube, the cap of which housed a Whatman (GF/B) filterpaper disc that had been presoaked with 1 mol/L potas-sium hydroxide. 14CO2 trapped in the media was thenreleased by acidification of media using 60% (volume forvolume) perchloric acid and gently agitating the tubes at37°C for 2 h. Radioactivity that had become adsorbedonto the filter discs was then quantified by liquid scintil-lation counting in a beta counter.
Animal ExperimentsAnimal studies were approved by the Institutional AnimalEthics Committee of Zydus Research Center. This facilityis accredited by the Association for Assessment andAccreditation of Laboratory Animal Care International.Mice were individually housed at 21°C, in 12-h light/darkcycles. All animals had access to normal chow diet andwater ad libitum. Twelve-week-old male C57BL/6J (BL6)(25–30 g), db/db, or BKS-db/db (45–50 g) mice were di-vided into different treatment groups randomly (db/db,n = 8 per group; BKS-db/db, n = 6 per group). Vehiclegroups received 1% carboxymethylcellulose, and the othergroups received GTDF or pioglitazone (Pio; 10 mg/kg),once a day, by oral gavage for 30 days. Feed intake andbody weight were measured every day. Blood was obtainedfrom tail snips, and glucose levels were measured usinga glucometer. Glucose tolerance tests were performed onday 29 after overnight fasting. Pyruvate tolerance test(PTT) was performed on day 31, after an overnight fast.On day 32, the animals were fasted for 6 h and killed.Plasma and tissues were collected and stored at 280°Cuntil further analysis. Hepatic glycogen was estimatedusing a glycogen assay kit. Intraperitoneal glucose tolerancetest (IPGTT), intraperitoneal PTT, estimation of circulatingbiomarkers, histology, and immunohistochemistry wereperformed using standard procedures.
Extensor Digitorum Longus Muscle Culture andTreatmentExtensor digitorum longus (EDL) muscle strips along withtendons were dissected out from anesthetized mice andwere tied to stainless steel clutch pins by the tendons,without stretching. Muscles were preincubated for 30 min
3532 GTDF Is an Orally Active Adiponectin Mimetic Diabetes Volume 63, October 2014
at 37°C in oxygenated (95% O2/5% CO2) Krebs-Henseleitsolution (pH 7.4) and then again for 30 min in the samemedium with or without 2.5 mg/mL gAd or 0.1 mmol/LGTDF. The incubation media was gassed continuouslywith 95% O2/5% CO2 through hypodermic needle. At theend of this incubation, tendons were removed and themuscles were blotted on gauze pads, snap frozen in liquidN2, and stored at 280°C until further analysis.
Data Analysis and StatisticsResults are expressed as mean 6 SEM. All data wereanalyzed using GraphPad Prism 5.0 (GraphPad, SanDiego, CA). Animal data involving more than two groupswere analyzed using two-way ANOVA followed by Bonfer-roni post test or one-way ANOVA followed by Tukey mul-tiple comparison test as appropriate. In vitro or in vivodata involving two experimental groups were analyzed us-ing two-tailed unpaired Student t test or Mann-WhitneyU test as appropriate.
RESULTS
GTDF Binds to AdipoRs and Mimics Adiponectin-Associated Signaling Events In VitroWe assessed GTDF, quercetin, and its natural analogs(chemical structures in Fig. 1) in a peroxisome proliferator–activated receptor-a (PPARa) ligand activation assay, a pre-viously reported functional assay for AdipoRs (3), in HEK293cells that express endogenous AdipoR1 (3). All the quercetinanalogs tested enhanced PPARa activity in the presence ofPPARa agonist GW7647 (Fig. 2A). GTDFmaximally activatedthe reporter at 0.01 mmol/L, whereas dihydroquercetin(DHQ), an enantiomer of the aglycone form of GTDF andquercetin-6-C-b-D-glucopyranoside (QCG), did so at 0.1mmol/L, and quercetin, quercetin-3-O-b-D-glucopyranoside(QOG), or quercetin-3-O-a-L-rhamnopyranoside (QR)caused maximal activation at 1 mmol/L (Fig. 2A). Ampli-tudes of activation of PPARa ligand activity by GTDF andgAd were comparable (Fig. 2B). GTDF did not activatePPARa in the absence of GW7647, indicating that itwas not a PPARa agonist per se (Fig. 2C).
To assess if GTDF and AdipoRs could physically interact,we immobilized GTDF on agarose beads and performeda pull-down assay with purified PM from C2C12 myotubesthat expressed both AdipoR1 and -2 (3). GTDF beads butnot control beads successfully pulled down AdipoR1 and -2,and free GTDF or QCG competed with this binding (Fig.2D). Cold GTDF competed with 125I-adiponectin for bind-ing to C2C12 cells in a radioligand binding assay (Fig. 2E).Radioligand saturation assays with 125I-labeled GTDF(Fig. 2F) or 125I-gAd (Supplementary Fig. 2) revealed thatboth these ligands bound to AdipoR-deficient CHO cells(24) transfected with AdipoR1 or -2 but not empty expres-sion plasmids (Fig. 2G) (GTDF: Kd and BMAX, 4.90 nmol/Land 1,410 fmol/mg of protein for AdipoR1 and 326 nmol/Land 3,950 fmol/mg of protein for AdipoR2; gAd: Kd andBMAX, 0.25 mg/mL and 130 ng/mg for AdipoR1 and 0.526mg/mL and 200 ng/mg for AdipoR2). Thus GTDF displayed;70-fold more affinity toward AdipoR1 over AdipoR2.
Consistent with adiponectin-associated rapid signalingevents (1,25), GTDF induced AMPK, ACC, and p38 phos-phorylation in C2C12 myotubes (Fig. 2H). Whereas p38phosphorylation was rapid and sustained, AMPK and ACCphosphorylation peaked at 1 and 10 min, respectively,and returned to the basal level at 60 min (Fig. 2H). Asimilar pattern of AMPK and ACC phosphorylation byadiponectin has been reported earlier (11).
Apart from adiponectin, glutamate receptors also acti-vate AMPK and p38 (26), and we therefore assessed ifGTDF could modulate these receptors. However, GTDFfailed to bind to or activate/repress any of the ionotropicor metabotropic glutamate receptors (mGlu), whereas quer-cetin strongly activated mGlu2 and inhibited mGlu4, -6,and -8 (Supplementary Tables 1 and 2). To also assessif these signaling events were mediated through one ormore G protein–coupled receptors (GPCRs), GPCR modula-tion by GTDF was assessed, and it failed to activate orrepress any of the 158 GPCRs tested (Supplementary Tables3 and 4).
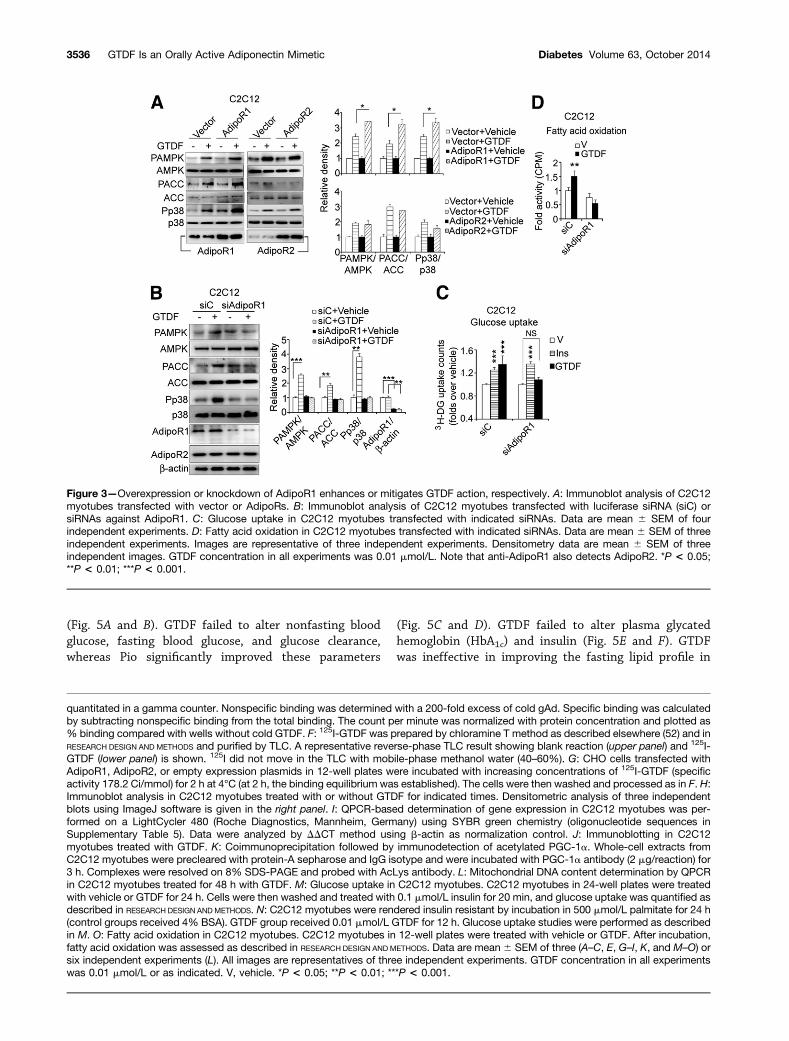
Consistent with its activation of adiponectin-associatedsignaling, GTDF enhanced mRNA and protein levels offactors associated with fatty acid transport (CD36 and fattyacid binding protein 3 [FABP3]), oxidation (carnityl palmi-toyl transferase 1b [CPT1B], long-chain fatty acyl CoAsynthetase [FACS], acetyl CoA oxidase [ACOX1], PPARa,and PPARd), mitochondrial biogenesis (PGC-1a), mitochon-drial uncoupling protein 3 [UCP-3], and Glut4, whereaslipoprotein lipase (LPL) and PPARg were unchanged (Fig.2I and J). Adiponectin deacetylates and activates PGC-1avia indirect activation of Sirt1 (25), and consistent with itsindirect Sirt1 activation (20), GTDF also deacetylated PGC-1a in C2C12 myotubes (Fig. 2K). This PGC-1a inductionand activation led to increased mitochondrial DNA copynumber (Fig. 2L). gAd enhances basal glucose uptake(3,11) and increases insulin sensitivity (27) in C2C12 myo-tubes, and in consistence, GTDF also enhanced basal andinsulin-stimulated glucose uptake in these cells (Fig. 2M).Further, GTDF also significantly enhanced basal andinsulin-dependent glucose uptake in a C2C12 myotubemodel of palmitate-induced insulin resistance (Fig. 2N).Similar to rapid enhancement of fatty acid oxidation byadiponectin (3,11,28), GTDF significantly enhanced[14C]palmitate oxidation in C2C12 myotubes within2 h, which increased further over time (Fig. 2O).Overexpression or Silencing of AdipoR1 Augments orMitigates GTDF Functions In VitroConsistent with the binding studies, AdipoR1 but notAdipoR2 overexpression in C2C12 myotubes significantlyenhanced GTDF-stimulated AMPK, ACC, and p38phosphorylation (Fig. 3A). siRNA for AdipoR1 (siAdipoR1)but not control siRNA against luciferase (siC) abolishedGTDF-induced AMPK, ACC, and p38 phosphorylation, with-out affecting AdipoR2 expression (Fig. 3B). Further, GTDF-stimulated glucose uptake and fatty acid oxidation wereabolished by siAdipoR1 (Fig. 3C and D), whereas insulin-stimulated glucose uptake was unaltered (Fig. 3D). Together
diabetes.diabetesjournals.org Singh and Associates 3533
with Fig. 1 and Supplementary Tables 1–4, these resultsdemonstrate that GTDF action indeed is AdipoR1 specific.
BKS.Cg-Dock7m+/+ Leprdb/db/J (BKS-db/db) Mice HaveSeverely Depleted Plasma Membrane–AssociatedAdipoR1 Compared With B6.BKS(D)-Leprdb/db/J(db/db) MiceA relevant animal model to test AdipoR specificity ofGTDF would have been AdipoR1/R2 knockout micesubjected to diet-induced obesity. However, our inabilityto obtain the knockout mice led us to search for analternate model. Since chronic high level of plasma insulincauses an AdipoR depletion–mediated adiponectin resis-tance (30), we systematically investigated AdipoR expressionin major adiponectin target organs, across differentage-groups in two different strains of leptin receptor–deficient obese and diabetic mice, db/db (in C57BL/6Jbackground) and BKS-db/db (in BLKS/J background),and wild-type healthy C57BL/6J (BL6).
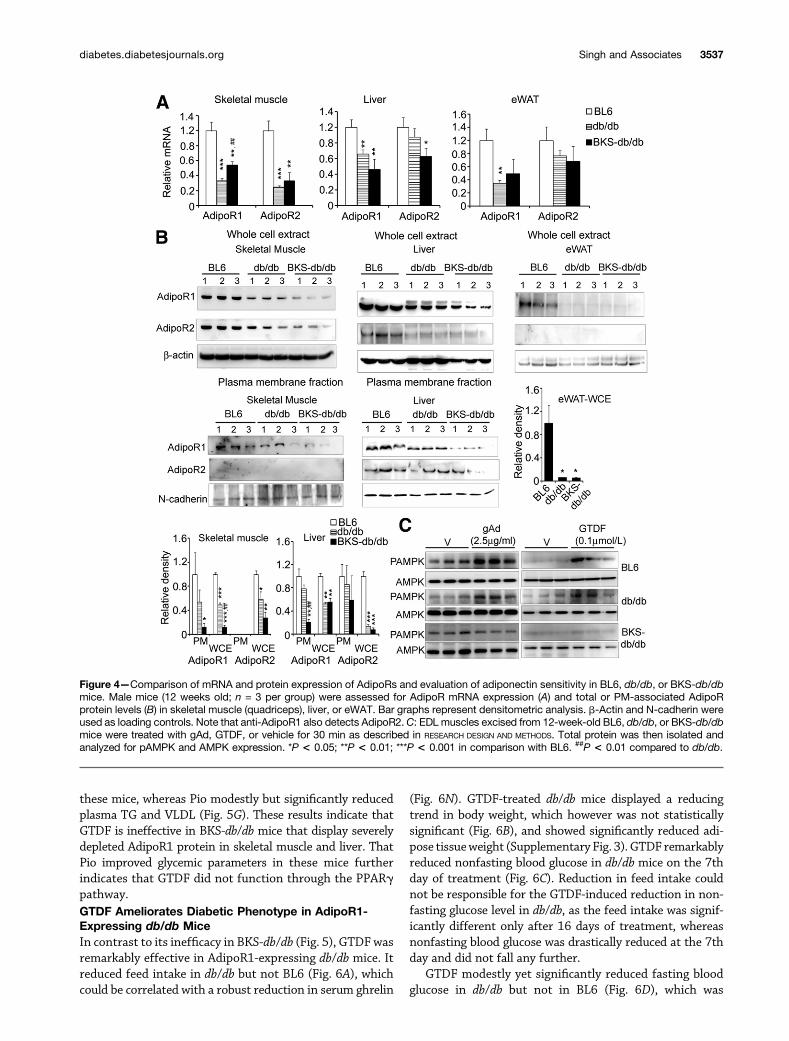
Comparison of 12-week-old male BL6, db/db, and BKS-db/db mice revealed that both diabetic mice had lowerAdipoR mRNAs in skeletal muscle, liver, and epididymalwhite adipose tissue (eWAT) compared with the healthyBL6 mice. However, between the diabetic strains, onlymodest differences were observed (Fig. 4A).
Examination of total and PM-associated AdipoR pro-tein levels however, revealed striking differences betweenthe two diabetic strains. Whereas BKS-db/db displayed.80% decrease in total and PM-associated and therefore
functional AdipoR1 expression in skeletal muscle, BL6and db/db did not show a significant difference (Fig. 4B).In liver, PM AdipoR1 but not AdipoR2 was strongly de-pleted ($80%) in BKS-db/db but not in db/db, whereascompared with BL6, total AdipoR1 and -2 proteins werediminished in both. In WAT, both diabetic strains dis-played.90% reduction in total AdipoR1 protein comparedwith BL6, whereas AdipoR2 protein was not detected(Fig. 4B). AdipoR2 could not be detected in the PM fractionof skeletal muscle (Fig. 4B), and we failed to generateenough PM extract from WAT for immunoblotting. To-gether, compared with db/db and BL6, BKS-db/db displayedseverely depleted total and PM AdipoR1 protein in skeletalmuscle and liver at 12 weeks of age. Consistent with thisobservation, gAd and GTDF failed to induce AMPK phos-phorylation in EDL muscles of BKS-db/db, whereas it did soin EDL muscles from both BL6 and db/db mice (Fig. 4C).Thus, based on above evidence, we selected 12-week-oldmale db/db mice as adiponectin-sensitive and age- andsex-matched BKS-db/db as adiponectin-resistant modelsfor the in vivo pharmacological studies.
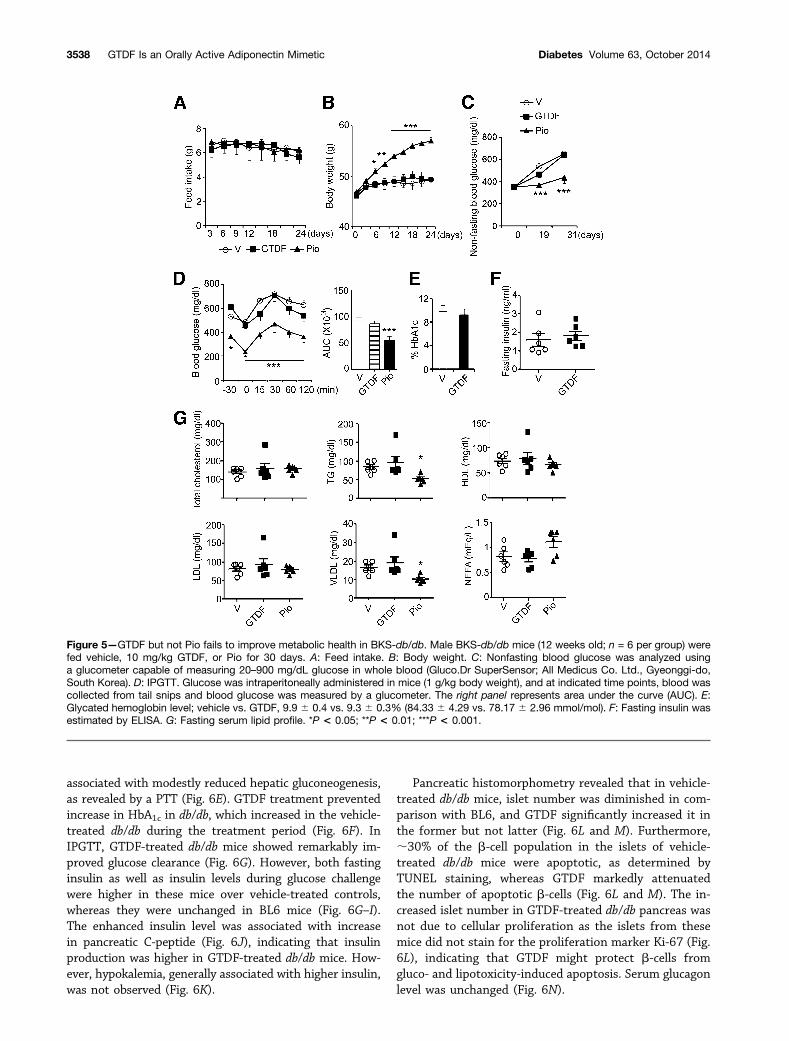
GTDF Fails to Improve Diabetic Phenotype inBKS-db/db MiceOver a 30-day treatment period, GTDF did not alter feedintake or body weight in BKS-db/db (Fig. 5A and B),whereas PPARg agonist Pio significantly enhanced bodyweight 6 days onwards without altering feed intake
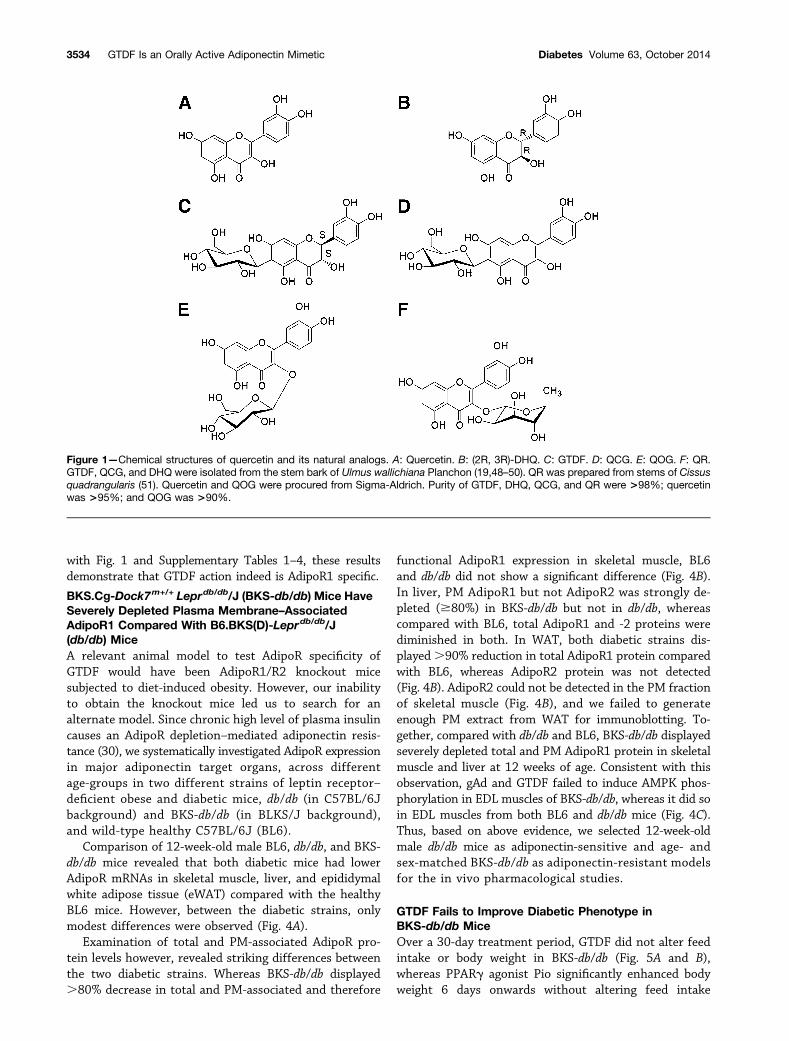
Figure 1—Chemical structures of quercetin and its natural analogs. A: Quercetin. B: (2R, 3R)-DHQ. C: GTDF. D: QCG. E: QOG. F: QR.GTDF, QCG, and DHQ were isolated from the stem bark of Ulmus wallichiana Planchon (19,48–50). QR was prepared from stems of Cissusquadrangularis (51). Quercetin and QOG were procured from Sigma-Aldrich. Purity of GTDF, DHQ, QCG, and QR were >98%; quercetinwas >95%; and QOG was >90%.
3534 GTDF Is an Orally Active Adiponectin Mimetic Diabetes Volume 63, October 2014
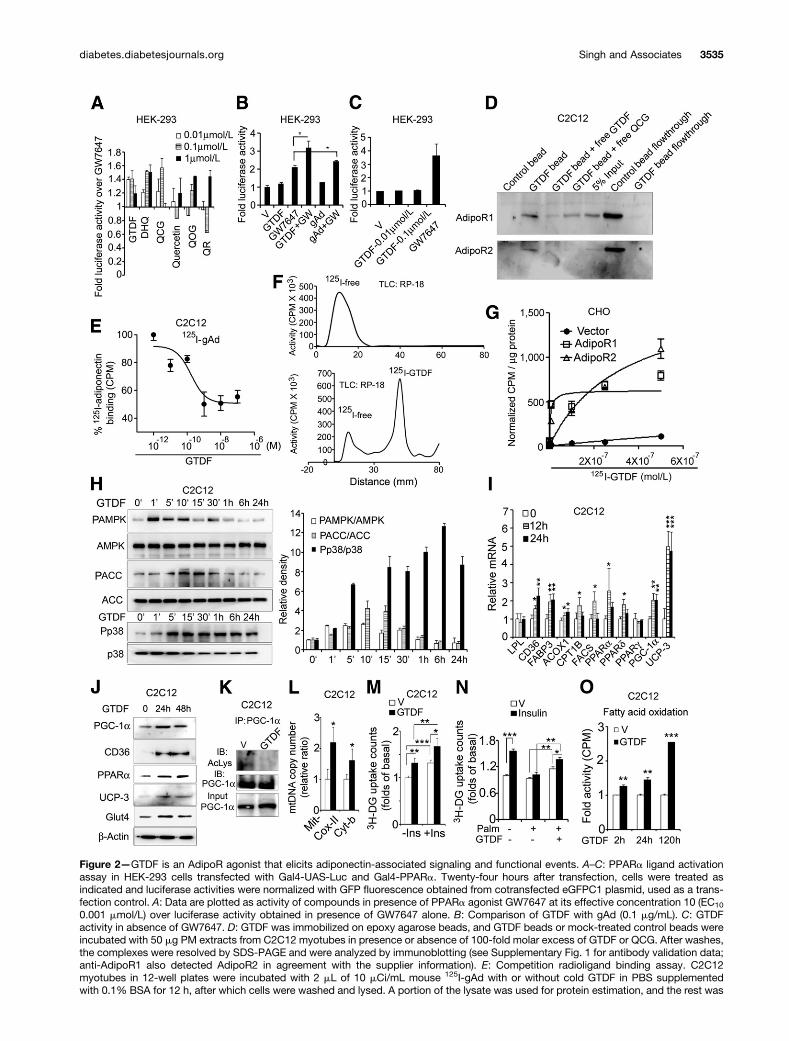
Figure 2—GTDF is an AdipoR agonist that elicits adiponectin-associated signaling and functional events. A–C: PPARa ligand activationassay in HEK-293 cells transfected with Gal4-UAS-Luc and Gal4-PPARa. Twenty-four hours after transfection, cells were treated asindicated and luciferase activities were normalized with GFP fluorescence obtained from cotransfected eGFPC1 plasmid, used as a trans-fection control. A: Data are plotted as activity of compounds in presence of PPARa agonist GW7647 at its effective concentration 10 (EC10
0.001 mmol/L) over luciferase activity obtained in presence of GW7647 alone. B: Comparison of GTDF with gAd (0.1 mg/mL). C: GTDFactivity in absence of GW7647. D: GTDF was immobilized on epoxy agarose beads, and GTDF beads or mock-treated control beads wereincubated with 50 mg PM extracts from C2C12 myotubes in presence or absence of 100-fold molar excess of GTDF or QCG. After washes,the complexes were resolved by SDS-PAGE and were analyzed by immunoblotting (see Supplementary Fig. 1 for antibody validation data;anti-AdipoR1 also detected AdipoR2 in agreement with the supplier information). E: Competition radioligand binding assay. C2C12myotubes in 12-well plates were incubated with 2 mL of 10 mCi/mL mouse 125I-gAd with or without cold GTDF in PBS supplementedwith 0.1% BSA for 12 h, after which cells were washed and lysed. A portion of the lysate was used for protein estimation, and the rest was
diabetes.diabetesjournals.org Singh and Associates 3535
(Fig. 5A and B). GTDF failed to alter nonfasting bloodglucose, fasting blood glucose, and glucose clearance,whereas Pio significantly improved these parameters
(Fig. 5C and D). GTDF failed to alter plasma glycatedhemoglobin (HbA1c) and insulin (Fig. 5E and F). GTDFwas ineffective in improving the fasting lipid profile in
quantitated in a gamma counter. Nonspecific binding was determined with a 200-fold excess of cold gAd. Specific binding was calculatedby subtracting nonspecific binding from the total binding. The count per minute was normalized with protein concentration and plotted as% binding compared with wells without cold GTDF. F: 125I-GTDF was prepared by chloramine T method as described elsewhere (52) and inRESEARCH DESIGN AND METHODS and purified by TLC. A representative reverse-phase TLC result showing blank reaction (upper panel) and 125I-GTDF (lower panel) is shown. 125I did not move in the TLC with mobile-phase methanol water (40–60%). G: CHO cells transfected withAdipoR1, AdipoR2, or empty expression plasmids in 12-well plates were incubated with increasing concentrations of 125I-GTDF (specificactivity 178.2 Ci/mmol) for 2 h at 4°C (at 2 h, the binding equilibrium was established). The cells were then washed and processed as in F. H:Immunoblot analysis in C2C12 myotubes treated with or without GTDF for indicated times. Densitometric analysis of three independentblots using ImageJ software is given in the right panel. I: QPCR-based determination of gene expression in C2C12 myotubes was per-formed on a LightCycler 480 (Roche Diagnostics, Mannheim, Germany) using SYBR green chemistry (oligonucleotide sequences inSupplementary Table 5). Data were analyzed by DDCT method using b-actin as normalization control. J: Immunoblotting in C2C12myotubes treated with GTDF. K: Coimmunoprecipitation followed by immunodetection of acetylated PGC-1a. Whole-cell extracts fromC2C12 myotubes were precleared with protein-A sepharose and IgG isotype and were incubated with PGC-1a antibody (2 mg/reaction) for3 h. Complexes were resolved on 8% SDS-PAGE and probed with AcLys antibody. L: Mitochondrial DNA content determination by QPCRin C2C12 myotubes treated for 48 h with GTDF. M: Glucose uptake in C2C12 myotubes. C2C12 myotubes in 24-well plates were treatedwith vehicle or GTDF for 24 h. Cells were then washed and treated with 0.1 mmol/L insulin for 20 min, and glucose uptake was quantified asdescribed in RESEARCH DESIGN ANDMETHODS. N: C2C12 myotubes were rendered insulin resistant by incubation in 500 mmol/L palmitate for 24 h(control groups received 4% BSA). GTDF group received 0.01 mmol/L GTDF for 12 h. Glucose uptake studies were performed as describedin M. O: Fatty acid oxidation in C2C12 myotubes. C2C12 myotubes in 12-well plates were treated with vehicle or GTDF. After incubation,fatty acid oxidation was assessed as described in RESEARCH DESIGN ANDMETHODS. Data are mean 6 SEM of three (A–C, E, G–I, K, and M–O) orsix independent experiments (L). All images are representatives of three independent experiments. GTDF concentration in all experimentswas 0.01 mmol/L or as indicated. V, vehicle. *P < 0.05; **P < 0.01; ***P < 0.001.
Figure 3—Overexpression or knockdown of AdipoR1 enhances or mitigates GTDF action, respectively. A: Immunoblot analysis of C2C12myotubes transfected with vector or AdipoRs. B: Immunoblot analysis of C2C12 myotubes transfected with luciferase siRNA (siC) orsiRNAs against AdipoR1. C: Glucose uptake in C2C12 myotubes transfected with indicated siRNAs. Data are mean 6 SEM of fourindependent experiments. D: Fatty acid oxidation in C2C12 myotubes transfected with indicated siRNAs. Data are mean 6 SEM of threeindependent experiments. Images are representative of three independent experiments. Densitometry data are mean 6 SEM of threeindependent images. GTDF concentration in all experiments was 0.01 mmol/L. Note that anti-AdipoR1 also detects AdipoR2. *P < 0.05;**P < 0.01; ***P < 0.001.
3536 GTDF Is an Orally Active Adiponectin Mimetic Diabetes Volume 63, October 2014
these mice, whereas Pio modestly but significantly reducedplasma TG and VLDL (Fig. 5G). These results indicate thatGTDF is ineffective in BKS-db/db mice that display severelydepleted AdipoR1 protein in skeletal muscle and liver. ThatPio improved glycemic parameters in these mice furtherindicates that GTDF did not function through the PPARgpathway.GTDF Ameliorates Diabetic Phenotype in AdipoR1-Expressing db/db MiceIn contrast to its inefficacy in BKS-db/db (Fig. 5), GTDFwasremarkably effective in AdipoR1-expressing db/db mice. Itreduced feed intake in db/db but not BL6 (Fig. 6A), whichcould be correlated with a robust reduction in serum ghrelin
(Fig. 6N). GTDF-treated db/db mice displayed a reducingtrend in body weight, which however was not statisticallysignificant (Fig. 6B), and showed significantly reduced adi-pose tissueweight (Supplementary Fig. 3). GTDF remarkablyreduced nonfasting blood glucose in db/db mice on the 7thday of treatment (Fig. 6C). Reduction in feed intake couldnot be responsible for the GTDF-induced reduction in non-fasting glucose level in db/db, as the feed intake was signif-icantly different only after 16 days of treatment, whereasnonfasting blood glucose was drastically reduced at the 7thday and did not fall any further.
GTDF modestly yet significantly reduced fasting bloodglucose in db/db but not in BL6 (Fig. 6D), which was
Figure 4—Comparison of mRNA and protein expression of AdipoRs and evaluation of adiponectin sensitivity in BL6, db/db, or BKS-db/dbmice. Male mice (12 weeks old; n = 3 per group) were assessed for AdipoR mRNA expression (A) and total or PM-associated AdipoRprotein levels (B) in skeletal muscle (quadriceps), liver, or eWAT. Bar graphs represent densitometric analysis. b-Actin and N-cadherin wereused as loading controls. Note that anti-AdipoR1 also detects AdipoR2.C: EDL muscles excised from 12-week-old BL6, db/db, or BKS-db/dbmice were treated with gAd, GTDF, or vehicle for 30 min as described in RESEARCH DESIGN AND METHODS. Total protein was then isolated andanalyzed for pAMPK and AMPK expression. *P < 0.05; **P < 0.01; ***P < 0.001 in comparison with BL6. ##P < 0.01 compared to db/db.
diabetes.diabetesjournals.org Singh and Associates 3537
associated with modestly reduced hepatic gluconeogenesis,as revealed by a PTT (Fig. 6E). GTDF treatment preventedincrease in HbA1c in db/db, which increased in the vehicle-treated db/db during the treatment period (Fig. 6F). InIPGTT, GTDF-treated db/db mice showed remarkably im-proved glucose clearance (Fig. 6G). However, both fastinginsulin as well as insulin levels during glucose challengewere higher in these mice over vehicle-treated controls,whereas they were unchanged in BL6 mice (Fig. 6G–I).The enhanced insulin level was associated with increasein pancreatic C-peptide (Fig. 6J), indicating that insulinproduction was higher in GTDF-treated db/db mice. How-ever, hypokalemia, generally associated with higher insulin,was not observed (Fig. 6K).
Pancreatic histomorphometry revealed that in vehicle-treated db/db mice, islet number was diminished in com-parison with BL6, and GTDF significantly increased it inthe former but not latter (Fig. 6L and M). Furthermore,;30% of the b-cell population in the islets of vehicle-treated db/db mice were apoptotic, as determined byTUNEL staining, whereas GTDF markedly attenuatedthe number of apoptotic b-cells (Fig. 6L and M). The in-creased islet number in GTDF-treated db/db pancreas wasnot due to cellular proliferation as the islets from thesemice did not stain for the proliferation marker Ki-67 (Fig.6L), indicating that GTDF might protect b-cells fromgluco- and lipotoxicity-induced apoptosis. Serum glucagonlevel was unchanged (Fig. 6N).
Figure 5—GTDF but not Pio fails to improve metabolic health in BKS-db/db. Male BKS-db/db mice (12 weeks old; n = 6 per group) werefed vehicle, 10 mg/kg GTDF, or Pio for 30 days. A: Feed intake. B: Body weight. C: Nonfasting blood glucose was analyzed usinga glucometer capable of measuring 20–900 mg/dL glucose in whole blood (Gluco.Dr SuperSensor; All Medicus Co. Ltd., Gyeonggi-do,South Korea). D: IPGTT. Glucose was intraperitoneally administered in mice (1 g/kg body weight), and at indicated time points, blood wascollected from tail snips and blood glucose was measured by a glucometer. The right panel represents area under the curve (AUC). E:Glycated hemoglobin level; vehicle vs. GTDF, 9.9 6 0.4 vs. 9.3 6 0.3% (84.33 6 4.29 vs. 78.17 6 2.96 mmol/mol). F: Fasting insulin wasestimated by ELISA. G: Fasting serum lipid profile. *P < 0.05; **P < 0.01; ***P < 0.001.
3538 GTDF Is an Orally Active Adiponectin Mimetic Diabetes Volume 63, October 2014
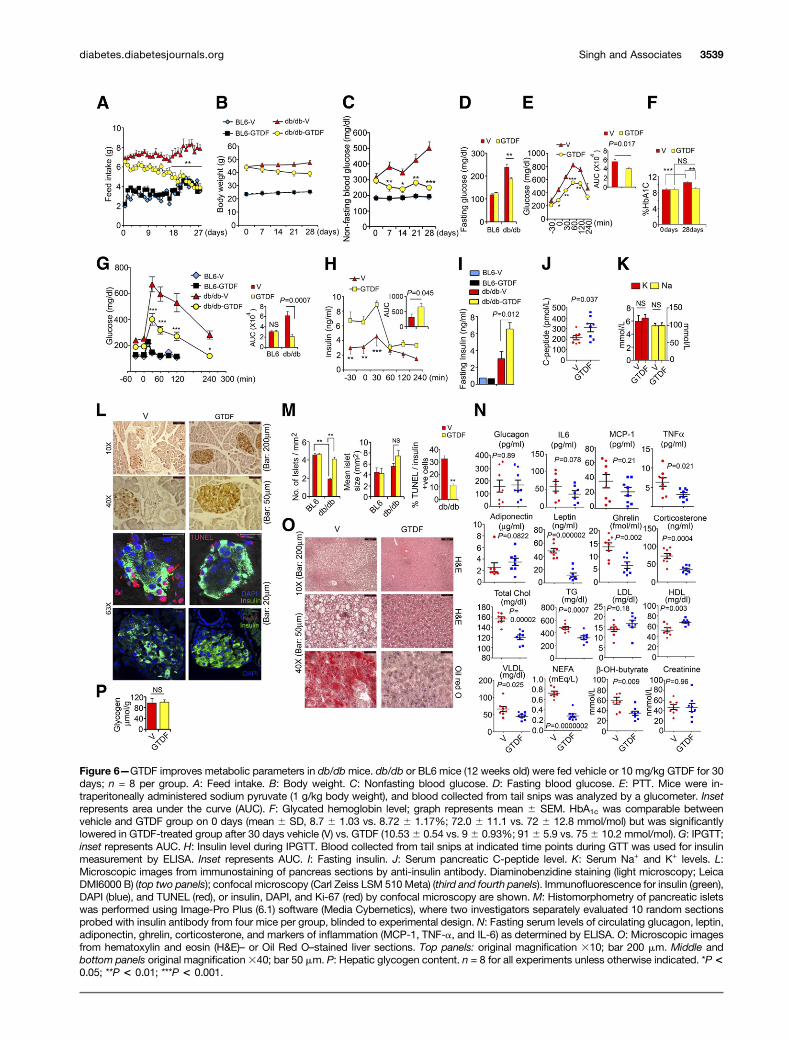
Figure 6—GTDF improves metabolic parameters in db/dbmice. db/db or BL6 mice (12 weeks old) were fed vehicle or 10 mg/kg GTDF for 30days; n = 8 per group. A: Feed intake. B: Body weight. C: Nonfasting blood glucose. D: Fasting blood glucose. E: PTT. Mice were in-traperitoneally administered sodium pyruvate (1 g/kg body weight), and blood collected from tail snips was analyzed by a glucometer. Insetrepresents area under the curve (AUC). F: Glycated hemoglobin level; graph represents mean 6 SEM. HbA1c was comparable betweenvehicle and GTDF group on 0 days (mean 6 SD, 8.7 6 1.03 vs. 8.72 6 1.17%; 72.0 6 11.1 vs. 72 6 12.8 mmol/mol) but was significantlylowered in GTDF-treated group after 30 days vehicle (V) vs. GTDF (10.536 0.54 vs. 96 0.93%; 916 5.9 vs. 756 10.2 mmol/mol). G: IPGTT;inset represents AUC. H: Insulin level during IPGTT. Blood collected from tail snips at indicated time points during GTT was used for insulinmeasurement by ELISA. Inset represents AUC. I: Fasting insulin. J: Serum pancreatic C-peptide level. K: Serum Na+ and K+ levels. L:Microscopic images from immunostaining of pancreas sections by anti-insulin antibody. Diaminobenzidine staining (light microscopy; LeicaDMI6000 B) (top two panels); confocal microscopy (Carl Zeiss LSM 510 Meta) (third and fourth panels). Immunofluorescence for insulin (green),DAPI (blue), and TUNEL (red), or insulin, DAPI, and Ki-67 (red) by confocal microscopy are shown. M: Histomorphometry of pancreatic isletswas performed using Image-Pro Plus (6.1) software (Media Cybernetics), where two investigators separately evaluated 10 random sectionsprobed with insulin antibody from four mice per group, blinded to experimental design. N: Fasting serum levels of circulating glucagon, leptin,adiponectin, ghrelin, corticosterone, and markers of inflammation (MCP-1, TNF-a, and IL-6) as determined by ELISA. O: Microscopic imagesfrom hematoxylin and eosin (H&E)– or Oil Red O–stained liver sections. Top panels: original magnification 310; bar 200 mm. Middle andbottom panels original magnification340; bar 50 mm. P: Hepatic glycogen content. n = 8 for all experiments unless otherwise indicated. *P<0.05; **P < 0.01; ***P < 0.001.
diabetes.diabetesjournals.org Singh and Associates 3539
Consistent with anti-inflammatory properties of adi-ponectin, GTDF treatment in db/db mice significantly low-ered serum TNF-a and IL-6 showed a reducing trend,whereas MCP-1 was unchanged (Fig. 6N). Whereas serumadiponectin showed an increasing trend upon GTDFtreatment (P = 0.082), leptin level was greatly diminished(Fig. 6N). We also found a robust fall in serum corticoste-rone (Fig. 6N), indicating that GTDF might be cardiopro-tective. Analysis of serum lipid profile revealed significantreductions in total cholesterol, TG, VLDL, NEFAs, andketone bodies (b-OH butyrate), which supports an en-hanced fatty acid oxidation rate, whereas it significantlyenhanced HDL level (Fig. 6N), reiterating its cardioprotec-tive promise. LDL and creatinine levels were unchanged(Fig. 6N). In light of the lipid profile data, we examinedthe hepatic histology, and sections from GTDF-treated db/dbmice displayed no vacuolation and lipid accumulation,whereas the vehicle-treated db/db exhibited robust lipidaccumulation (Fig. 6O). Hepatic glycogen level was un-changed (Fig. 6P). Together, Figs. 5 and 6 indicated thatGTDF stalls diabetes progression in AdipoR-expressing db/dbmice and improves their overall metabolic health, whereas itis ineffective in AdipoR1-depleted BKS-db/db.
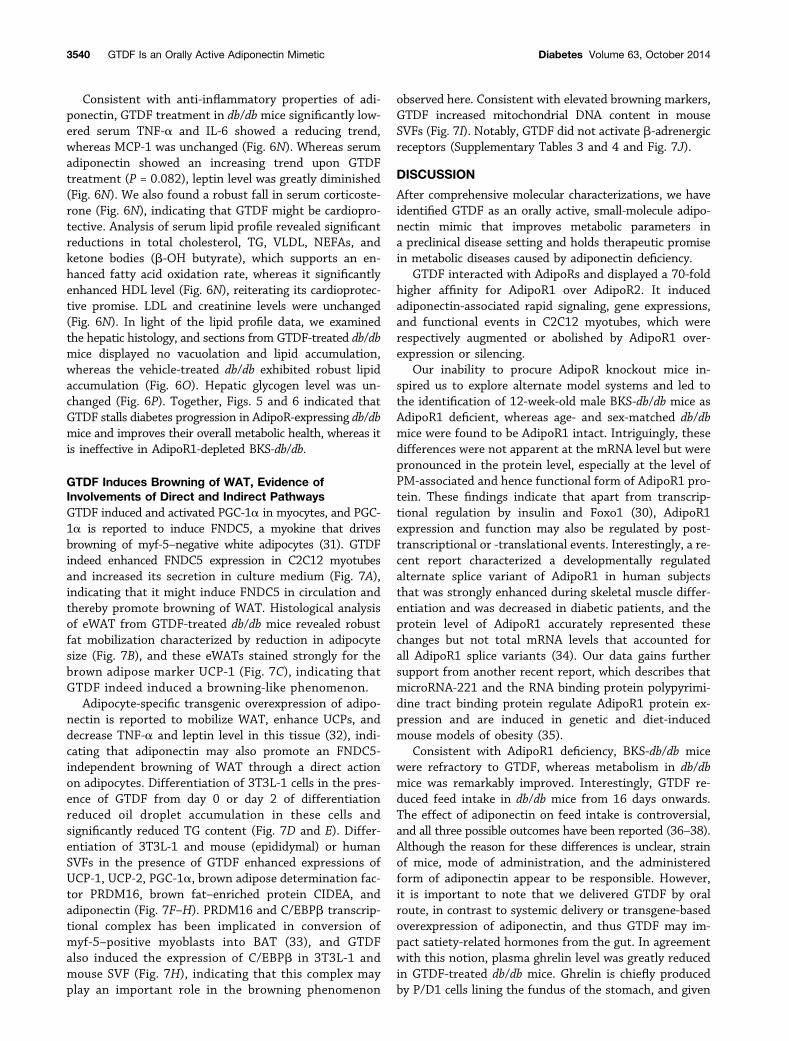
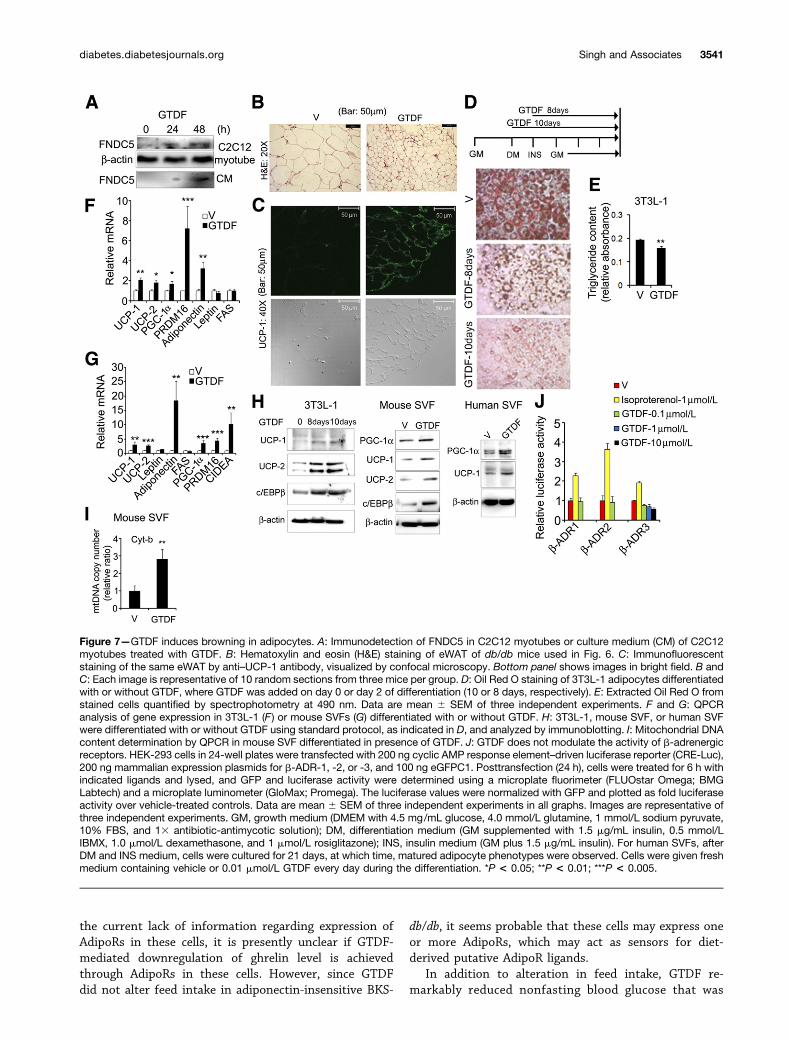
GTDF Induces Browning of WAT, Evidence ofInvolvements of Direct and Indirect PathwaysGTDF induced and activated PGC-1a in myocytes, and PGC-1a is reported to induce FNDC5, a myokine that drivesbrowning of myf-5–negative white adipocytes (31). GTDFindeed enhanced FNDC5 expression in C2C12 myotubesand increased its secretion in culture medium (Fig. 7A),indicating that it might induce FNDC5 in circulation andthereby promote browning of WAT. Histological analysisof eWAT from GTDF-treated db/db mice revealed robustfat mobilization characterized by reduction in adipocytesize (Fig. 7B), and these eWATs stained strongly for thebrown adipose marker UCP-1 (Fig. 7C), indicating thatGTDF indeed induced a browning-like phenomenon.
Adipocyte-specific transgenic overexpression of adipo-nectin is reported to mobilize WAT, enhance UCPs, anddecrease TNF-a and leptin level in this tissue (32), indi-cating that adiponectin may also promote an FNDC5-independent browning of WAT through a direct actionon adipocytes. Differentiation of 3T3L-1 cells in the pres-ence of GTDF from day 0 or day 2 of differentiationreduced oil droplet accumulation in these cells andsignificantly reduced TG content (Fig. 7D and E). Differ-entiation of 3T3L-1 and mouse (epididymal) or humanSVFs in the presence of GTDF enhanced expressions ofUCP-1, UCP-2, PGC-1a, brown adipose determination fac-tor PRDM16, brown fat–enriched protein CIDEA, andadiponectin (Fig. 7F–H). PRDM16 and C/EBPb transcrip-tional complex has been implicated in conversion ofmyf-5–positive myoblasts into BAT (33), and GTDFalso induced the expression of C/EBPb in 3T3L-1 andmouse SVF (Fig. 7H), indicating that this complex mayplay an important role in the browning phenomenon
observed here. Consistent with elevated browning markers,GTDF increased mitochondrial DNA content in mouseSVFs (Fig. 7I). Notably, GTDF did not activate b-adrenergicreceptors (Supplementary Tables 3 and 4 and Fig. 7J).
DISCUSSION
After comprehensive molecular characterizations, we haveidentified GTDF as an orally active, small-molecule adipo-nectin mimic that improves metabolic parameters ina preclinical disease setting and holds therapeutic promisein metabolic diseases caused by adiponectin deficiency.
GTDF interacted with AdipoRs and displayed a 70-foldhigher affinity for AdipoR1 over AdipoR2. It inducedadiponectin-associated rapid signaling, gene expressions,and functional events in C2C12 myotubes, which wererespectively augmented or abolished by AdipoR1 over-expression or silencing.
Our inability to procure AdipoR knockout mice in-spired us to explore alternate model systems and led tothe identification of 12-week-old male BKS-db/db mice asAdipoR1 deficient, whereas age- and sex-matched db/dbmice were found to be AdipoR1 intact. Intriguingly, thesedifferences were not apparent at the mRNA level but werepronounced in the protein level, especially at the level ofPM-associated and hence functional form of AdipoR1 pro-tein. These findings indicate that apart from transcrip-tional regulation by insulin and Foxo1 (30), AdipoR1expression and function may also be regulated by post-transcriptional or -translational events. Interestingly, a re-cent report characterized a developmentally regulatedalternate splice variant of AdipoR1 in human subjectsthat was strongly enhanced during skeletal muscle differ-entiation and was decreased in diabetic patients, and theprotein level of AdipoR1 accurately represented thesechanges but not total mRNA levels that accounted forall AdipoR1 splice variants (34). Our data gains furthersupport from another recent report, which describes thatmicroRNA-221 and the RNA binding protein polypyrimi-dine tract binding protein regulate AdipoR1 protein ex-pression and are induced in genetic and diet-inducedmouse models of obesity (35).
Consistent with AdipoR1 deficiency, BKS-db/db micewere refractory to GTDF, whereas metabolism in db/dbmice was remarkably improved. Interestingly, GTDF re-duced feed intake in db/db mice from 16 days onwards.The effect of adiponectin on feed intake is controversial,and all three possible outcomes have been reported (36–38).Although the reason for these differences is unclear, strainof mice, mode of administration, and the administeredform of adiponectin appear to be responsible. However,it is important to note that we delivered GTDF by oralroute, in contrast to systemic delivery or transgene-basedoverexpression of adiponectin, and thus GTDF may im-pact satiety-related hormones from the gut. In agreementwith this notion, plasma ghrelin level was greatly reducedin GTDF-treated db/db mice. Ghrelin is chiefly producedby P/D1 cells lining the fundus of the stomach, and given
3540 GTDF Is an Orally Active Adiponectin Mimetic Diabetes Volume 63, October 2014
the current lack of information regarding expression ofAdipoRs in these cells, it is presently unclear if GTDF-mediated downregulation of ghrelin level is achievedthrough AdipoRs in these cells. However, since GTDFdid not alter feed intake in adiponectin-insensitive BKS-
db/db, it seems probable that these cells may express oneor more AdipoRs, which may act as sensors for diet-derived putative AdipoR ligands.
In addition to alteration in feed intake, GTDF re-markably reduced nonfasting blood glucose that was
Figure 7—GTDF induces browning in adipocytes. A: Immunodetection of FNDC5 in C2C12 myotubes or culture medium (CM) of C2C12myotubes treated with GTDF. B: Hematoxylin and eosin (H&E) staining of eWAT of db/db mice used in Fig. 6. C: Immunofluorescentstaining of the same eWAT by anti–UCP-1 antibody, visualized by confocal microscopy. Bottom panel shows images in bright field. B andC: Each image is representative of 10 random sections from three mice per group. D: Oil Red O staining of 3T3L-1 adipocytes differentiatedwith or without GTDF, where GTDF was added on day 0 or day 2 of differentiation (10 or 8 days, respectively). E: Extracted Oil Red O fromstained cells quantified by spectrophotometry at 490 nm. Data are mean 6 SEM of three independent experiments. F and G: QPCRanalysis of gene expression in 3T3L-1 (F ) or mouse SVFs (G) differentiated with or without GTDF. H: 3T3L-1, mouse SVF, or human SVFwere differentiated with or without GTDF using standard protocol, as indicated in D, and analyzed by immunoblotting. I: Mitochondrial DNAcontent determination by QPCR in mouse SVF differentiated in presence of GTDF. J: GTDF does not modulate the activity of b-adrenergicreceptors. HEK-293 cells in 24-well plates were transfected with 200 ng cyclic AMP response element–driven luciferase reporter (CRE-Luc),200 ng mammalian expression plasmids for b-ADR-1, -2, or -3, and 100 ng eGFPC1. Posttransfection (24 h), cells were treated for 6 h withindicated ligands and lysed, and GFP and luciferase activity were determined using a microplate fluorimeter (FLUOstar Omega; BMGLabtech) and a microplate luminometer (GloMax; Promega). The luciferase values were normalized with GFP and plotted as fold luciferaseactivity over vehicle-treated controls. Data are mean 6 SEM of three independent experiments in all graphs. Images are representative ofthree independent experiments. GM, growth medium (DMEM with 4.5 mg/mL glucose, 4.0 mmol/L glutamine, 1 mmol/L sodium pyruvate,10% FBS, and 13 antibiotic-antimycotic solution); DM, differentiation medium (GM supplemented with 1.5 mg/mL insulin, 0.5 mmol/LIBMX, 1.0 mmol/L dexamethasone, and 1 mmol/L rosiglitazone); INS, insulin medium (GM plus 1.5 mg/mL insulin). For human SVFs, afterDM and INS medium, cells were cultured for 21 days, at which time, matured adipocyte phenotypes were observed. Cells were given freshmedium containing vehicle or 0.01 mmol/L GTDF every day during the differentiation. *P < 0.05; **P < 0.01; ***P < 0.005.
diabetes.diabetesjournals.org Singh and Associates 3541
significant from day 7 onwards and did not fall thereafter.GTDF also stalled the increase in HbA1c that was observedin vehicle-treated db/db mice. Reduction in feed intakecould not account for these changes as earlier reportshave demonstrated that caloric restriction not only failsto decrease nonfasting blood glucose or HbA1c in db/dbmice with manifested diabetes (39–41) but also fails toprevent onset of hyperglycemia in db/db mice pair fed for5 weeks since weaning (42). That GTDF decreased feedintake in db/db only but not in BL6 and BKS-db/dbclearly indicates that toxicity was not involved. It is fur-ther supported by our earlier study where GTDF not onlynormalized feed intake in high-dose dexamethasone–treatedWistar rats but also prevented dexamethsone-inducedmortality (20).
Although the effect of GTDF on nonfasting bloodglucose and glucose clearance was robust, it caused asignificant but modest decrease in fasting blood glucoseand hepatic gluconeogenesis. Since GTDF showed a pref-erence for AdipoR1, and AdipoR2 is the principal AdipoRin liver, it appears that GTDF-mediated reduction ofblood glucose might be principally achieved by skeletalmuscle AdipoR1-mediated glucose disposal, which issupported by the fact that fasting hepatic glycogen wasunaltered upon GTDF treatment. However, a robust re-duction in ketone bodies in GTDF-treated db/db miceindicates that in these animals, the liver may efficientlyoxidize them.
BKS-db/db display more severe hyperglycemia thandb/db and are susceptible to terminal diabetes, charac-terized by pancreatic b-cell degranulation and death,whereas db/db mice are protected from terminal diabetesdue to the unique proliferation capacity of their b-cells(43). Thus, in older db/db mice, hyperglycemia is cor-rected through a higher plasma insulin level, althoughthese mice remain severely dyslipidemic (43). In our ex-perimental setup, consistent with a lower plasma insulin(which was still much higher than healthy BL6) thandb/db, the BKS-db/db mice indeed exhibited higher fast-ing and nonfasting blood glucose. However, b-cell pro-liferation was not yet apparent in db/db as evidenced bylack of Ki-67 staining, indicating that during the exper-imental period, the db/db b-cells did not yet go on a pro-liferative drive. Further, ;30% of b-cells from db/dbmice were apoptotic, and GTDF strongly mitigated thisapoptosis without increasing proliferation, indicatingthat GTDF may protect these cells from gluco- and lip-otoxic stresses, and a similar finding has been reportedfor adiponectin (44).
Despite higher plasma insulin, GTDF-treated db/dbmice were not hypokalemic and displayed a remarkablyimproved lipid profile, evidenced by decreased serum totalcholesterol, TG, VLDL, and NEFA and increased HDL,which, together with a marked decline in plasma cor-ticosterone in these mice, indicates that GTDF mayhave cardioprotective properties. NEFAs are breakdownproducts of TG that are released from adipocytes after
lipolysis and are important in diabetic pathogenesis(45). The marked decline in plasma NEFAs suggests thatin GTDF-treated db/db mice, NEFAs were either used withrobust efficiency in liver and skeletal muscle or adiposeTG were efficiently oxidized in situ, or a combination ofboth. These postulates could be corroborated by the factsthat livers of GTDF-treated db/db were free from vacuo-lation and oil droplets, which were characteristicallypresent in vehicle-treated db/db mice, and eWAT depotin GTDF-treated db/db mice showed robust mobiliza-tion and increased UCP-1 expression. Since both db/dband BKS-db/db displayed depleted AdipoR1 protein ineWAT, it is possible that GTDF caused browning of eWATthrough an indirect mechanism involving the previouslydescribed PGC-1a–induced myokine, FNDC5/irisin (31).Consistent with PGC-1a induction and activation, GTDFinduced FNDC5 expression in C2C12 myotubes and itsrelease in culture medium. In addition, GTDF was alsocapable of directly inducing brown adipose markers andincreasing mitochondrial content in 3T3L-1 and mouseand human SVFs differentiated in its presence, indicatingthat GTDF may protect against energy imbalance–relatedmetabolic diseases. However, further studies includingGTDF’s effect on energy expenditure are needed to fullyunderstand and realize its potential.
While this article was under review, Okada-Iwabu et al.(46) reported identification and characterization of a small-molecule AdipoR agonist, AdipoRon. AdipoRon is 2-(4-benzoylphenoxy)-N-[1-(phenylmethyl)-4-piperidinyl]acetamideand GTDF is a flavone c-glucoside, and these compounds donot share any structural homology. Functionally, Adi-poRon showed comparable affinity to both AdipoR1 and-2 and acted through both these receptors to bring aboutphysiological improvements in diabetic mice, whereasGTDF showed a stronger affinity for AdipoR1, and givenits modest effects on hepatic gluconeogenesis, appears toact mainly via AdipoR1. Incidentally, another recent re-port identified DHQ (also known as taxifoliol) as one ofnine small-molecule AdipoR agonists from a library of10,000 compounds by a fluorescent polarization–basedscreen; however, the in vivo efficacy of DHQ is yet tobe elucidated (47). DHQ is an enantiomer of the aglyconeform of GTDF and was active in our PPARa ligand acti-vation as well, albeit at a 10-fold higher concentrationthan GTDF. In contrast to GTDF, DHQ displays a strongeraffinity for AdipoR2 (47), and thus studies with DHQalone or in combination with GTDF will be needed tofurther explore their therapeutic potential in metabolicdiseases.
In conclusion, discovery of GTDF as a small-moleculeadiponectin mimetic that remarkably improves metabolichealth in diabetic mice provides a promising therapeutictool for treatment of adiponectin deficiency–associatedmetabolic diseases. However, given the lack of AdipoRknockout animal models in this study, it remains to beconfirmed if all the beneficial metabolic effects of GTDFwere indeed routed through AdipoRs alone.
3542 GTDF Is an Orally Active Adiponectin Mimetic Diabetes Volume 63, October 2014
Acknowledgments. The authors acknowledge the Sophisticated Analyt-ical Instrument Facility in CSIR-CDRI for help with confocal microscopy. Theauthors acknowledge Prem N. Yadav (Division of Pharmacology, CSIR-CDRI) forhelp with designing of the radioligand binding assays and Durga Prasad Mishra(Division of Endocrinology, CSIR-CDRI) for sharing antibodies. CSIR-CDRI com-munication number for this article is 8700.Funding. This work was supported by CSIR grant BSC0201 to N.C. and S.Sa.A.K.S. was supported by a fellowship from CSIR. M.P.K. and M.Y. were supportedby Indian Council for Medical Research fellowships. J.S.M., N.S., and Z.H. weresupported by fellowships from University Grants Commission. K.K. was supportedby a Department of Biotechnology fellowship.Duality of Interest. A.K.S., M.P.K., J.S.M., N.S., M.Y., K.K., D.P.M., R.M.,S.Sh., A.K.T., J.R.G., N.C., and S.Sa. have a pending patent pertaining to some ofthe work in this article. A.A.J., N.A.D., and M.R.J. are employees of ZydusResearch Center, the research and development arm of Cadila Healthcare Ltd.,Ahmedabad, India. No other potential conflicts of interest relevant to this articlewere reported.Author Contributions. A.K.S. and A.A.J. designed and performedexperiments. M.P.K., J.S.M., N.S., M.Y., Z.H., K.K., S.K., N.A.D., and D.P.M.performed experiments. R.M. and M.R.J. supervised experiments. S.Sh. providedmaterials and contributed to discussion. A.K.T. supervised experiments andcontributed to discussion. M.M.G. designed, performed, and supervised experi-ments. J.R.G. designed and supervised experiments and contributed to discus-sion. N.C. designed and supervised experiments, contributed to discussion, andwrote, edited, and reviewed the manuscript. S.Sa. conceived the study, designedand supervised experiments, contributed to discussion, and wrote, edited, andreviewed the manuscript. All authors analyzed data. S.Sa. is the guarantor of thiswork and, as such, had full access to all the data in the study and takesresponsibility for the integrity of the data and the accuracy of the data analysis.Prior Presentation. Part of this work was presented as an abstract at theInternational Symposium on Molecular Signaling, Santiniketan, India, 18–21February 2013.
References1. Kadowaki T, Yamauchi T. Adiponectin and adiponectin receptors. EndocrRev 2005;26:439–4512. Robinson K, Prins J, Venkatesh B. Clinical review: adiponectin biology andits role in inflammation and critical illness. Crit Care 2011;15:2213. Yamauchi T, Kamon J, Ito Y, et al. Cloning of adiponectin receptors thatmediate antidiabetic metabolic effects. Nature 2003;423:762–7694. Hug C, Wang J, Ahmad NS, Bogan JS, Tsao TS, Lodish HF. T-cadherin is areceptor for hexameric and high-molecular-weight forms of Acrp30/adiponectin.Proc Natl Acad Sci U S A 2004;101:10308–103135. Hotta K, Funahashi T, Arita Y, et al. Plasma concentrations of a novel,adipose-specific protein, adiponectin, in type 2 diabetic patients. ArteriosclerThromb Vasc Biol 2000;20:1595–15996. Li S, Shin HJ, Ding EL, van Dam RM. Adiponectin levels and risk oftype 2 diabetes: a systematic review and meta-analysis. JAMA 2009;302:179–1887. Weyer C, Funahashi T, Tanaka S, et al. Hypoadiponectinemia in obesity andtype 2 diabetes: close association with insulin resistance and hyperinsulinemia. JClin Endocrinol Metab 2001;86:1930–19358. Berg AH, Combs TP, Du X, Brownlee M, Scherer PE. The adipocyte-secretedprotein Acrp30 enhances hepatic insulin action. Nat Med 2001;7:947–9539. Yamauchi T, Kamon J, Waki H, et al. The fat-derived hormone adiponectinreverses insulin resistance associated with both lipoatrophy and obesity. Nat Med2001;7:941–94610. Fruebis J, Tsao TS, Javorschi S, et al. Proteolytic cleavage product of30-kDa adipocyte complement-related protein increases fatty acid oxidation inmuscle and causes weight loss in mice. Proc Natl Acad Sci U S A 2001;98:2005–2010
11. Yamauchi T, Kamon J, Minokoshi Y, et al. Adiponectin stimulates glucoseutilization and fatty-acid oxidation by activating AMP-activated protein kinase. NatMed 2002;8:1288–129512. Yamauchi T, Kamon J, Waki H, et al. Globular adiponectin protected ob/obmice from diabetes and ApoE-deficient mice from atherosclerosis. J Biol Chem2003;278:2461–246813. Holland WL, Miller RA, Wang ZV, et al. Receptor-mediated activation ofceramidase activity initiates the pleiotropic actions of adiponectin. Nat Med 2011;17:55–6314. Hu E, Liang P, Spiegelman BM. AdipoQ is a novel adipose-specific genedysregulated in obesity. J Biol Chem 1996;271:10697–1070315. Scherer PE, Williams S, Fogliano M, Baldini G, Lodish HF. A novel serumprotein similar to C1q, produced exclusively in adipocytes. J Biol Chem 1995;270:26746–2674916. Shapiro L, Scherer PE. The crystal structure of a complement-1q familyprotein suggests an evolutionary link to tumor necrosis factor. Curr Biol 1998;8:335–33817. Tsao TS, Murrey HE, Hug C, Lee DH, Lodish HF. Oligomerization state-dependent activation of NF-kappa B signaling pathway by adipocyte complement-related protein of 30 kDa (Acrp30). J Biol Chem 2002;277:29359–2936218. Tsao TS, Tomas E, Murrey HE, et al. Role of disulfide bonds in Acrp30/adiponectin structure and signaling specificity. Different oligomers activate dif-ferent signal transduction pathways. J Biol Chem 2003;278:50810–5081719. Sharan K, Mishra JS, Swarnkar G, et al. A novel quercetin analogue froma medicinal plant promotes peak bone mass achievement and bone healing afterinjury and exerts an anabolic effect on osteoporotic bone: the role of aryl hydrocarbonreceptor as a mediator of osteogenic action. J Bone Miner Res 2011;26:2096–211120. Khan MP, Mishra JS, Sharan K, et al. A novel flavonoid C-glucoside fromUlmus wallichiana preserves bone mineral density, microarchitecture and bio-mechanical properties in the presence of glucocorticoid by promoting osteoblastsurvival: A comparative study with human parathyroid hormone. Phytomedicine2013;20:1256–126621. Nieman DC, Williams AS, Shanely RA, et al. Quercetin’s influence on ex-ercise performance and muscle mitochondrial biogenesis. Med Sci Sports Exerc2010;42:338–34522. Jeong SM, Kang MJ, Choi HN, Kim JH, Kim JI. Quercetin ameliorates hy-perglycemia and dyslipidemia and improves antioxidant status in type 2 diabeticdb/db mice. Nutr Res Pract 2012;6:201–20723. Dwivedi SK, Singh N, Kumari R, et al. Bile acid receptor agonist GW4064regulates PPARg coactivator-1a expression through estrogen receptor-relatedreceptor a. Mol Endocrinol 2011;25:922–93224. Neumeier M, Weigert J, Schäffler A, et al. Regulation of adiponectin re-ceptor 1 in human hepatocytes by agonists of nuclear receptors. Biochem Bio-phys Res Commun 2005;334:924–92925. Iwabu M, Yamauchi T, Okada-Iwabu M, et al. Adiponectin and AdipoR1regulate PGC-1alpha and mitochondria by Ca(2+) and AMPK/SIRT1. Nature 2010;464:1313–131926. Kim JH, Lee JO, Lee SK, et al. The glutamate agonist homocysteine sulfinicacid stimulates glucose uptake through the calcium-dependent AMPK-p38MAPK-protein kinase C zeta pathway in skeletal muscle cells. J Biol Chem 2011;286:7567–757627. Wang C, Mao X, Wang L, et al. Adiponectin sensitizes insulin signaling byreducing p70 S6 kinase-mediated serine phosphorylation of IRS-1. J Biol Chem2007;282:7991–799628. Yoon MJ, Lee GY, Chung JJ, Ahn YH, Hong SH, Kim JB. Adiponectin in-creases fatty acid oxidation in skeletal muscle cells by sequential activation ofAMP-activated protein kinase, p38 mitogen-activated protein kinase, and per-oxisome proliferator-activated receptor alpha. Diabetes 2006;55:2562–257029. Wilden PA, Backer JM, Kahn CR, Cahill DA, Schroeder GJ, White MF. Theinsulin receptor with phenylalanine replacing tyrosine-1146 provides evidence forseparate signals regulating cellular metabolism and growth. Proc Natl Acad SciU S A 1990;87:3358–3362
diabetes.diabetesjournals.org Singh and Associates 3543
30. Tsuchida A, Yamauchi T, Ito Y, et al. Insulin/Foxo1 pathway regulates ex-pression levels of adiponectin receptors and adiponectin sensitivity. J Biol Chem2004;279:30817–3082231. Boström P, Wu J, Jedrychowski MP, et al. A PGC1-a-dependent myokinethat drives brown-fat-like development of white fat and thermogenesis. Nature2012;481:463–46832. Bauche IB, El Mkadem SA, Pottier AM, et al. Overexpression of adiponectintargeted to adipose tissue in transgenic mice: impaired adipocyte differentiation.Endocrinology 2007;148:1539–154933. Kajimura S, Seale P, Kubota K, et al. Initiation of myoblast to brown fat switchby a PRDM16-C/EBP-beta transcriptional complex. Nature 2009;460:1154–115834. Ashwal R, Hemi R, Tirosh A, et al. Differential expression of novel adipo-nectin receptor-1 transcripts in skeletal muscle of subjects with normal glucosetolerance and type 2 diabetes. Diabetes 2011;60:936–94635. Lustig Y, Barhod E, Ashwal-Fluss R, et al. RNA-binding protein PTB andmicroRNA-221 coregulate AdipoR1 translation and adiponectin signaling. Di-abetes 2014;63:433–44536. Kubota N, Terauchi Y, Yamauchi T, et al. Disruption of adiponectin causesinsulin resistance and neointimal formation. J Biol Chem 2002;277:25863–2586637. Qi Y, Takahashi N, Hileman SM, et al. Adiponectin acts in the brain todecrease body weight. Nat Med 2004;10:524–52938. Shklyaev S, Aslanidi G, Tennant M, et al. Sustained peripheral expression oftransgene adiponectin offsets the development of diet-induced obesity in rats.Proc Natl Acad Sci U S A 2003;100:14217–1422239. Tonra JR, Ono M, Liu X, et al. Brain-derived neurotrophic factor improvesblood glucose control and alleviates fasting hyperglycemia in C57BLKS-Lepr(db)/lepr(db) mice. Diabetes 1999;48:588–59440. Chen D, Liao J, Li N, et al. A nonpeptidic agonist of glucagon-like peptide 1receptors with efficacy in diabetic db/db mice. Proc Natl Acad Sci U S A 2007;104:943–94841. Sleeman MW, Garcia K, Liu R, et al. Ciliary neurotrophic factor improvesdiabetic parameters and hepatic steatosis and increases basal metabolic rate indb/db mice. Proc Natl Acad Sci U S A 2003;100:14297–14302
42. Bates SH, Kulkarni RN, Seifert M, Myers MG Jr. Roles for leptin receptor/STAT3-dependent and -independent signals in the regulation of glucose ho-meostasis. Cell Metab 2005;1:169–17843. Davis RC, Castellani LW, Hosseini M, et al. Early hepatic insulin resistanceprecedes the onset of diabetes in obese C57BLKS-db/db mice. Diabetes 2010;59:1616–162544. Wijesekara N, Krishnamurthy M, Bhattacharjee A, Suhail A, Sweeney G,Wheeler MB. Adiponectin-induced ERK and Akt phosphorylation protects againstpancreatic beta cell apoptosis and increases insulin gene expression and se-cretion. J Biol Chem 2010;285:33623–3363145. Karpe F, Dickmann JR, Frayn KN. Fatty acids, obesity, and insulin re-sistance: time for a reevaluation. Diabetes 2011;60:2441–244946. Okada-Iwabu M, Yamauchi T, Iwabu M, et al. A small-molecule AdipoRagonist for type 2 diabetes and short life in obesity. Nature 2013;503:493–49947. Sun Y, Zang Z, Zhong L, et al. Identification of adiponectin receptor agonistutilizing a fluorescence polarization based high throughput assay. PLoS ONE2013;8:e6335448. Sharan K, Swarnkar G, Siddiqui JA, et al. A novel flavonoid, 6-C-beta-d-glucopyranosyl-(2S,3S)-(+)-39,49,5,7-tetrahydroxyflavanone, isolated from Ulmuswallichiana Planchon mitigates ovariectomy-induced osteoporosis in rats. Men-opause 2010;17:577–58649. Siddiqui JA, Sharan K, Swarnkar G, et al. Quercetin-6-C-b-D-glucopyr-anoside isolated from Ulmus wallichiana Planchon is more potent than quercetinin inhibiting osteoclastogenesis and mitigating ovariectomy-induced bone loss inrats. Menopause 2011;18:198–20750. Siddiqui JA, Swarnkar G, Sharan K, et al. A naturally occurring rare analogof quercetin promotes peak bone mass achievement and exerts anabolic effecton osteoporotic bone. Osteoporos Int 2011;22:3013–302751. Kumar M, Rawat P, Dixit P, et al. Anti-osteoporotic constituents from Indianmedicinal plants. Phytomedicine 2010;17:993–99952. Hosseinimehr SJ, Tolmachev V, Stenerlöw B. 125I-labeled quercetin asa novel DNA-targeted radiotracer. Cancer Biother Radiopharm 2011;26:469–475
3544 GTDF Is an Orally Active Adiponectin Mimetic Diabetes Volume 63, October 2014