akamai state internet q4 2009
TRANSCRIPT
8/8/2019 Akamai State Internet Q4 2009
http://slidepdf.com/reader/full/akamai-state-internet-q4-2009 1/32
4th Quarter, 2009
Volume 2, Number 4
The State of
the Internet
8/8/2019 Akamai State Internet Q4 2009
http://slidepdf.com/reader/full/akamai-state-internet-q4-2009 2/32
The “spinning globe” eatured in the Akamai NOCC represents where Akamai servers are located and how much trafc they are seeing.
8/8/2019 Akamai State Internet Q4 2009
http://slidepdf.com/reader/full/akamai-state-internet-q4-2009 3/32
Each quarter, Akamai publishes a “State of the Internet” report. This report includes
data gathered from across Akamai’s global server network about attack trafc, broadband
adoption, and mobile connectivity, as well as trends seen in this data over time. Periodically,
it also aggregates publicly available news and information about notable events seen throughout
the quarter, including Denial of Service attacks, Web site hacks, and network events, including
outages and new connections. (In this quarter’s edition, due to time constraints, this aggregated
information has not been included.)
During the fourth quarter of 2009, Akamai observed attack trafc originating from 198
unique countries around the world. Russia remained the top attack trafc source, accounting
for 13% of observed attack trafc in total. The United States and China bumped Brazil back
down into fourth place, returning to the second and third place spots respectively, and accounting
for nearly 20% of observed attack trafc. Akamai observed attack trafc targeted at more than
10,000 unique ports, with the top 10 ports once again seeing nearly 92% of the observed attack
trafc, down slightly from 95% in the third quarter. (We believe that the increase in unique
targeted ports is due to “noise” related to random port scanning activity.)
Akamai observed a 4.7% increase (from the third quarter of 2009) globally in the number
of unique IP addresses connecting to Akamai’s network. Ending 2009 at 465 million unique
IPs, the metric grew 16% from the end of 2008, and nearly 54% from the end of 2007. From
a global connection speed perspective, South Korea continued to have the highest level of “high
broadband” (>5 Mbps) connectivity and also maintained the highest average connection speed,
at nearly 12 Mbps. In the United States, Delaware remained in the top position, growing to 72%
of connections to Akamai occurring at 5 Mbps or greater. Delaware also maintained the highest
average connection speed in the United States, increasing to 7.6 Mbps.
In the fourth quarter, average measured connection speeds on mobile network providers around
the world ranged from 3.2 Mbps on an Austrian mobile provider, down to 106 Kbps on a mobile
provider in Slovakia. Over 40 of the mobile network providers listed in the report achieved average
connection speeds above 1 Mbps. Among the three mobile network providers in the United States
that were included in the 3rd Quarter, 2009 State o the Internet report, two saw quarterly speed
declines, while a quarterly increase was seen on the third.
Executive Summary
8/8/2019 Akamai State Internet Q4 2009
http://slidepdf.com/reader/full/akamai-state-internet-q4-2009 4/32
2 © 2010 Akamai Technologies, Inc. All Rights Reserved
1: IntroductIon 3
2: SecrIty 4
2.1 Attack Trafc, Top Originating Countries 4
2.2 Attack Trafc, Top Target Ports 5
3: Internet PenetratIon 6
3.1 Unique IP Addresses Seen By Akamai 6
3.2 Global Internet Penetration 8
3.3 United States Internet Penetration 9
4: GeoGraPhy 10
4.1 Global Average Connection Speeds 11
4.2 Global Average Connection Speeds, City View 13
4.3 United States Average Connection Speeds 13
4.4 United States Average Connection Speeds, City View 14
4.5 Global High Broadband Connectivity 15
4.6 Global High Broadband Connectivity: Speed Distribution 17
4.7 United States High Broadband Connectivity 18
4.8 United States High Broadband Connectivity: Speed Distribution 19
4.9 Global Broadband Connectivity 20
4.10 United States Broadband Connectivity 21
4.11 Global Narrowband Connectivity 23
4.12 United States Narrowband Connectivity 24
5: MobIle 256: aPPendIx 27
7: endnoteS 28
Table of Contents
8/8/2019 Akamai State Internet Q4 2009
http://slidepdf.com/reader/full/akamai-state-internet-q4-2009 5/32
3© 2010 Akamai Technologies, Inc. All Rights Reserved
Akamai’s globally distributed network of servers allows us to gather massive amounts
of information on many metrics, including connection speeds, attack trafc, and network
connectivity/availability/latency problems, as well as trafc patterns on leading Web sites.
In the fourth quarter of 2009, observed attack trafc continued to target a consistent set
of ports, and attacks targeting port 445 continued to be responsible for an overwhelming
percentage of the observed attacks. Russia remained the top source of observed attack
trafc, followed very closely by the United States – in aggregate, the two countries were
responsible for a quarter of the observed attack trafc.
In the fourth quarter of 2009, the quarterly change in average connection speeds amongcountries around the world was generally positive, and most countries continued to see
increasing speeds on a year-over-year basis as well. In addition, the quarterly change in
high broadband (connections to Akamai’s network at speeds in excess of 5 Mbps) adoption
was generally positive, with many countries seeing increased high broadband adoption
on a year-over-year basis as well. Globally, the percentage of connections to Akamai at
narrowband (below 256 Kbps) speeds increased an unexpected 41% in the fourth quarter
of 2009. However, in some countries, we believe that growing trafc from slower mobile
connections is having a measurable impact on average speed calculations. While the growth
in mobile usage likely does not impact the countries that historically have the highest levels
of narrowband adoption, it may serve to inate narrowband percentages within developednations. This quarterly increase in narrowband connections does not necessarily presage
a shift towards reduced availability of higher speed Internet connections, as other measures
continue to point to continued growth of high-speed Internet connectivity.
In response to the growing amount of Internet content being accessed through mobile
devices such as smartphones and laptops equipped with mobile broadband connection
technologies, and also in response to multiple inquiries for such data, Akamai has begun
publishing insights into metrics collected from connections to Akamai that have been
identied as coming from networks associated with mobile providers. During the fourth
quarter of 2009, average connection speeds from three of the leading mobile providers
within the United States were analyzed and determined to be in the 600-800 Kbps range,
while speeds across a global distribution of mobile network providers ranged from
100 Kbps to 3.2 Mbps.
Due to production time constraints, the 4th Quarter, 2009 State o the Internet report
does not include aggregated publicly available news and information about notable events
seen throughout the quarter, including Denial of Service attacks, Web site hacks, and
network events, including outages and new connections. However, we plan to return
to including this information in future reports.
Introduction
8/8/2019 Akamai State Internet Q4 2009
http://slidepdf.com/reader/full/akamai-state-internet-q4-2009 6/32
4 © 2010 Akamai Technologies, Inc. All Rights Reserved
Akamai maintains a distributed set of agents deployed across the Internet
that serve to monitor attack trafc. Based on the data collected by theseagents, Akamai is able to identify the top countries from which attack
trafc originates, as well as the top ports targeted by these attacks. (Ports
are network layer protocol identiers.) This section, in part, provides insight
into Internet attack trafc, as observed and measured by Akamai, during
the fourth quarter of 2009. While some quarter-over-quarter trending may
be discussed, it is expected that both the top countries and top ports will
change on a quarterly basis.
SECTION 2: Security
2.1 Attack Trafc, Top Originating Countries
Akamai observed
attack trafc
originating rom
198 unique countries
around the world.
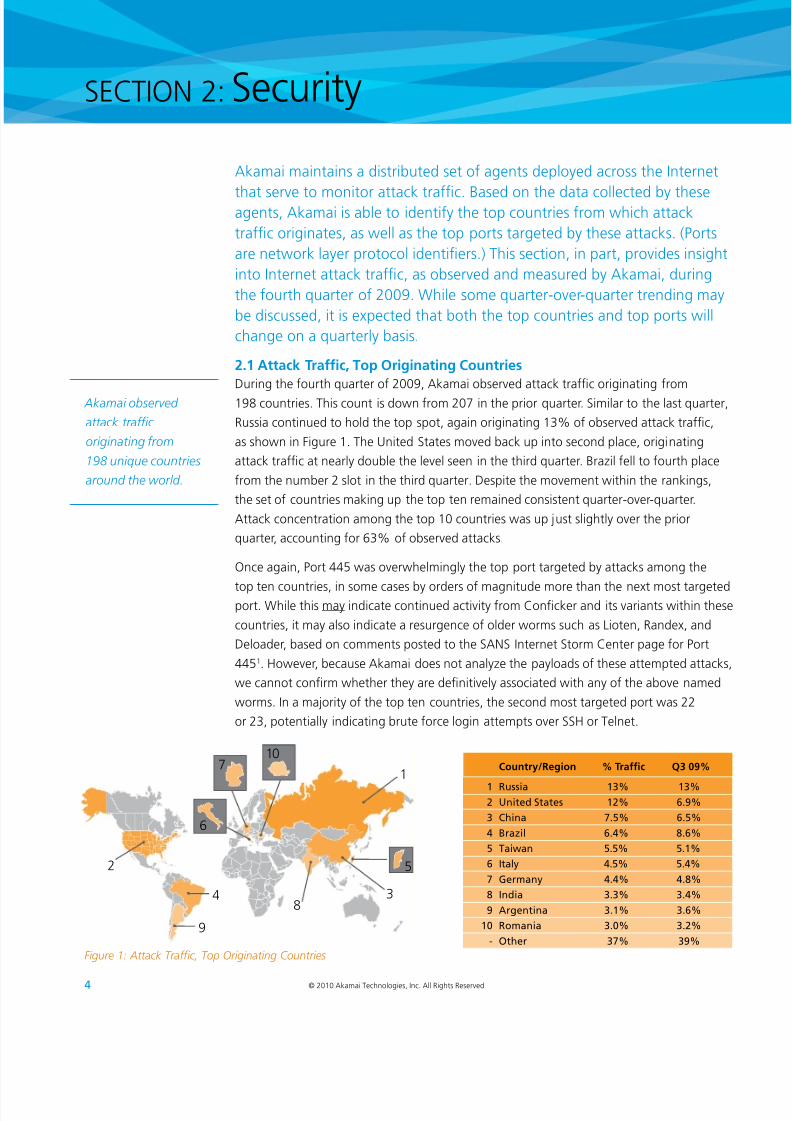
During the fourth quarter of 2009, Akamai observed attack trafc originating from
198 countries. This count is down from 207 in the prior quarter. Similar to the last quarter,
Russia continued to hold the top spot, again originating 13% of observed attack trafc,
as shown in Figure 1. The United States moved back up into second place, originating
attack trafc at nearly double the level seen in the third quarter. Brazil fell to fourth place
from the number 2 slot in the third quarter. Despite the movement within the rankings,
the set of countries making up the top ten remained consistent quarter-over-quarter.
Attack concentration among the top 10 countries was up just slightly over the prior
quarter, accounting for 63% of observed attacks.
Once again, Port 445 was overwhelmingly the top port targeted by attacks among the
top ten countries, in some cases by orders of magnitude more than the next most targetedport. While this may indicate continued activity from Concker and its variants within these
countries, it may also indicate a resurgence of older worms such as Lioten, Randex, and
Deloader, based on comments posted to the SANS Internet Storm Center page for Port
4451. However, because Akamai does not analyze the payloads of these attempted attacks,
we cannot conrm whether they are denitively associated with any of the above named
worms. In a majority of the top ten countries, the second most targeted port was 22
or 23, potentially indicating brute force login attempts over SSH or Telnet.
52
1
4
9
83
710
6
Figure 1: Attack Trafc, Top Originating Countries
Country/Region % Trafc Q3 09%
1 russi 13% 13%2 i Ss 12% 6.9%
3 ci 7.5% 6.5%
4 bzi 6.4% 8.6%
5 tiw 5.5% 5.1%
6 I 4.5% 5.4%
7 Gm 4.4% 4.8%
8 Ii 3.3% 3.4%
9 agi 3.1% 3.6%
10 rmi 3.0% 3.2%
- o 37% 39%
8/8/2019 Akamai State Internet Q4 2009
http://slidepdf.com/reader/full/akamai-state-internet-q4-2009 7/32
5© 2010 Akamai Technologies, Inc. All Rights Reserved
2.2 Attack Trafc, Top Target Ports
During the fourth quarter of 2009, Akamai observed attack trafc targeted at morethan 10,000 unique ports, which is a signicant increase from the 3,800 observed in
the third quarter. However, more than half of these ports saw only a single attempted
attack (connection attempt), which likely indicates that they were the target of a port
scan, rather than the targets of intentional attacks. Similar to the 1st Quarter, 2009 State
o the Internet report, when observed attack trafc targeted over 20,000 unique ports,
we can attempt to lter out some of this “noise” from what are likely random port scans
by applying threshold lters. If we look at ports that had more than one attempted at-
tack, we would be left with approximately 4,800 unique ports, discarding over half of the
original set, as mentioned above. At a threshold of 10 attempted attacks, we are left with
just 222 unique ports, and increasing the threshold to 100 attempted attacks thins the
eld signicantly, leaving only 32 unique ports. Looking at the source data, it appears that
the top source of what was likely port scan trafc was the United States, which originated
single connection attempts to over 4100 unique ports. A distant second was India, which
originated single connection attempts to just over 600 unique ports.
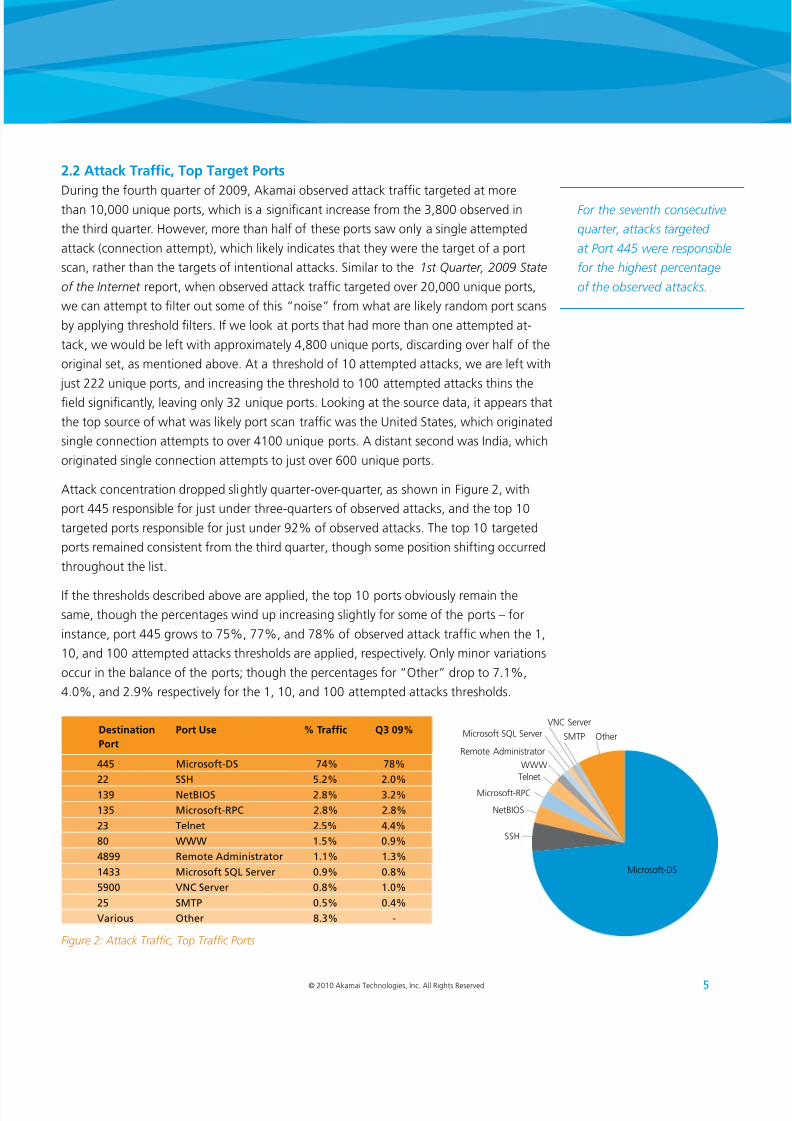
Attack concentration dropped slightly quarter-over-quarter, as shown in Figure 2, with
port 445 responsible for just under three-quarters of observed attacks, and the top 10
targeted ports responsible for just under 92% of observed attacks. The top 10 targeted
ports remained consistent from the third quarter, though some position shifting occurred
throughout the list.
If the thresholds described above are applied, the top 10 ports obviously remain the
same, though the percentages wind up increasing slightly for some of the ports – for
instance, port 445 grows to 75%, 77%, and 78% of observed attack trafc when the 1,
10, and 100 attempted attacks thresholds are applied, respectively. Only minor variations
occur in the balance of the ports; though the percentages for “Other” drop to 7.1%,
4.0%, and 2.9% respectively for the 1, 10, and 100 attempted attacks thresholds.
For the seventh consecutive
quarter, attacks targeted
at Port 445 were responsible
or the highest percentage
o the observed attacks.
Destination Port Use % Trafc Q3 09%
Port
445 Misf-dS 74% 78%
22 SSh 5.2% 2.0%
139 nbIoS 2.8% 3.2%
135 Misf-rPc 2.8% 2.8%
23 t 2.5% 4.4%
80 WWW 1.5% 0.9%
4899 rm amiis 1.1% 1.3%
1433 Misf SQl Sv 0.9% 0.8%
5900 Vnc Sv 0.8% 1.0%
25 SMtP 0.5% 0.4%
Vius o 8.3% -
Figure 2: Attack Trafc, Top Trafc Ports
SSH
NetBIOS
Microsoft-RPC
Telnet
OtherSMTP
VNC ServerMicrosoft SQL Server
WWW
Remote Administrator
Microsoft-DS
8/8/2019 Akamai State Internet Q4 2009
http://slidepdf.com/reader/full/akamai-state-internet-q4-2009 8/32
6 © 2010 Akamai Technologies, Inc. All Rights Reserved
3.1 Unique IP Addresses Seen By Akamai
Through a globally-deployed server network, and by virtue of the billions of requests forWeb content that it services on a daily basis, Akamai has unique visibility into the levels
of Internet penetration around the world. In the fourth quarter of 2009, slightly more than
465 million unique IP addresses, from 234 countries, connected to the Akamai network–
4.7% more than in the third quarter of 2009, and 16% more than in the same quarter
a year ago. These quarterly and yearly changes were roughly consistent with the growth
levels seen in the third quarter of 2009 as well.
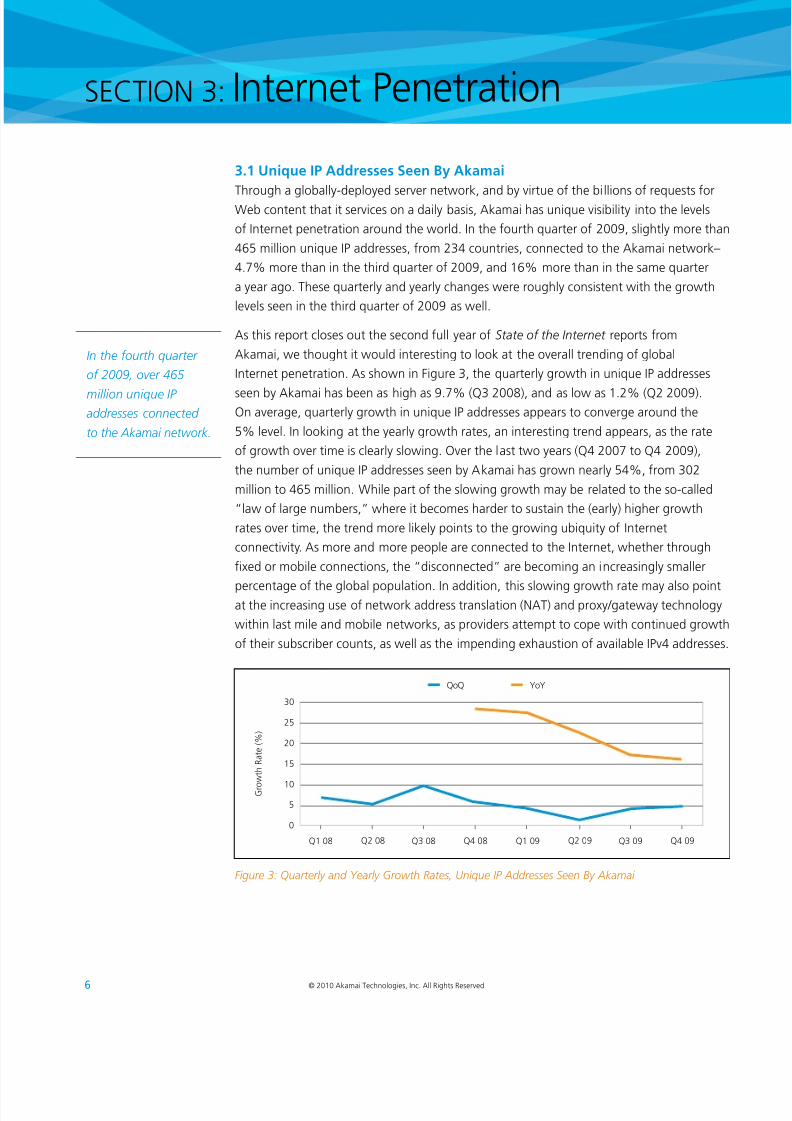
As this report closes out the second full year of State o the Internet reports from
Akamai, we thought it would interesting to look at the overall trending of global
Internet penetration. As shown in Figure 3, the quarterly growth in unique IP addresses
seen by Akamai has been as high as 9.7% (Q3 2008), and as low as 1.2% (Q2 2009).On average, quarterly growth in unique IP addresses appears to converge around the
5% level. In looking at the yearly growth rates, an interesting trend appears, as the rate
of growth over time is clearly slowing. Over the last two years (Q4 2007 to Q4 2009),
the number of unique IP addresses seen by Akamai has grown nearly 54%, from 302
million to 465 million. While part of the slowing growth may be related to the so-called
“law of large numbers,” where it becomes harder to sustain the (early) higher growth
rates over time, the trend more likely points to the growing ubiquity of Internet
connectivity. As more and more people are connected to the Internet, whether through
xed or mobile connections, the “disconnected” are becoming an increasingly smaller
percentage of the global population. In addition, this slowing growth rate may also pointat the increasing use of network address translation (NAT) and proxy/gateway technology
within last mile and mobile networks, as providers attempt to cope with continued growth
of their subscriber counts, as well as the impending exhaustion of available IPv4 addresses.
SECTION 3: Internet Penetration
In the ourth quarter
o 2009, over 465
million unique IP addresses connected
to the Akamai network.
Q1 08
G r o
w t h R a t e ( % )
30
25
20
15
10
5
0
Q3 08 Q3 09Q2 08 Q2 09Q4 08 Q4 09Q1 09
QoQ YoY
Figure 3: Quarterly and Yearly Growth Rates, Unique IP Addresses Seen By Akamai
8/8/2019 Akamai State Internet Q4 2009
http://slidepdf.com/reader/full/akamai-state-internet-q4-2009 9/32
7© 2010 Akamai Technologies, Inc. All Rights Reserved
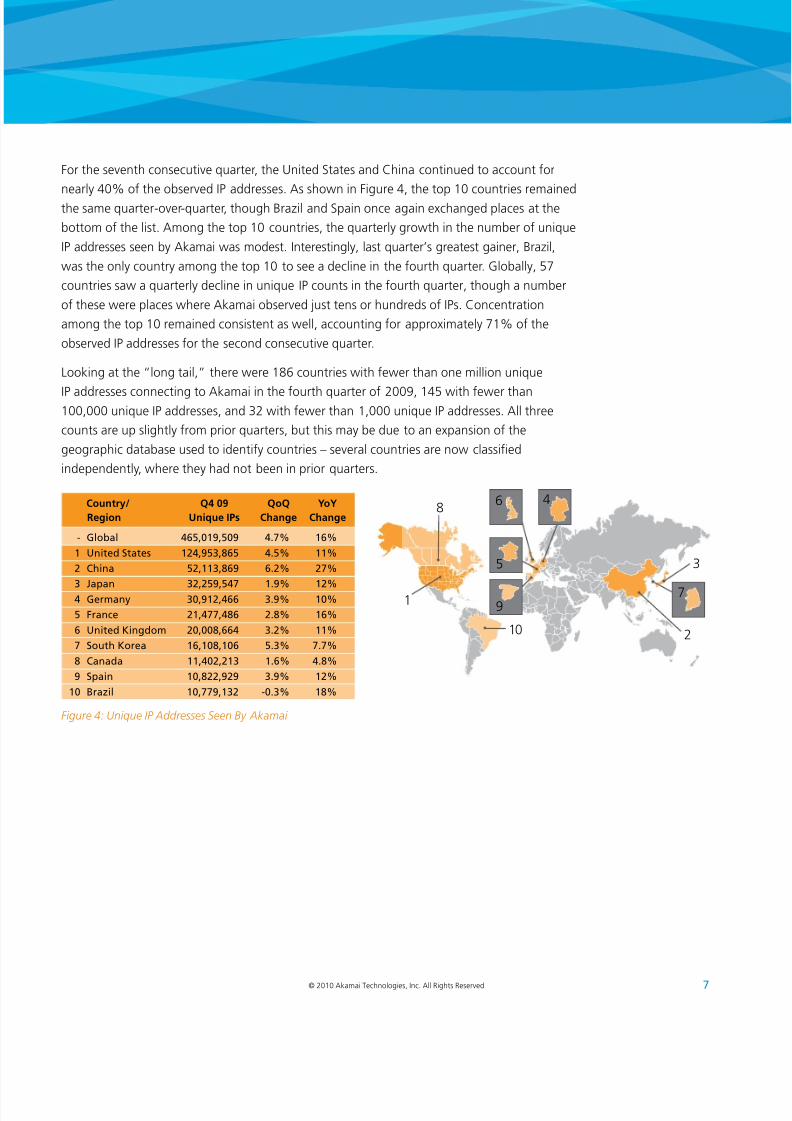
For the seventh consecutive quarter, the United States and China continued to account for
nearly 40% of the observed IP addresses. As shown in Figure 4, the top 10 countries remainedthe same quarter-over-quarter, though Brazil and Spain once again exchanged places at the
bottom of the list. Among the top 10 countries, the quarterly growth in the number of unique
IP addresses seen by Akamai was modest. Interestingly, last quarter’s greatest gainer, Brazil,
was the only country among the top 10 to see a decline in the fourth quarter. Globally, 57
countries saw a quarterly decline in unique IP counts in the fourth quarter, though a number
of these were places where Akamai observed just tens or hundreds of IPs. Concentration
among the top 10 remained consistent as well, accounting for approximately 71% of the
observed IP addresses for the second consecutive quarter.
Looking at the “long tail,” there were 186 countries with fewer than one million unique
IP addresses connecting to Akamai in the fourth quarter of 2009, 145 with fewer than100,000 unique IP addresses, and 32 with fewer than 1,000 unique IP addresses. All three
counts are up slightly from prior quarters, but this may be due to an expansion of the
geographic database used to identify countries – several countries are now classied
independently, where they had not been in prior quarters.
Country/ Q4 09 QoQ YoY
Region Unique IPs Change Change
- G 465,019,509 4.7% 16%
1 i Ss 124,953,865 4.5% 11%
2 ci 52,113,869 6.2% 27%
3 Jp 32,259,547 1.9% 12%4 Gm 30,912,466 3.9% 10%
5 F 21,477,486 2.8% 16%
6 i Kigm 20,008,664 3.2% 11%
7 Su K 16,108,106 5.3% 7.7%
8 c 11,402,213 1.6% 4.8%
9 Spi 10,822,929 3.9% 12%
10 bzi 10,779,132 -0.3% 18%
Figure 4: Unique IP Addresses Seen By Akamai
1
8
10 2
3
46
7
5
9
8/8/2019 Akamai State Internet Q4 2009
http://slidepdf.com/reader/full/akamai-state-internet-q4-2009 10/32
8 © 2010 Akamai Technologies, Inc. All Rights Reserved
SECTION 3: Internet Penetration (continued)
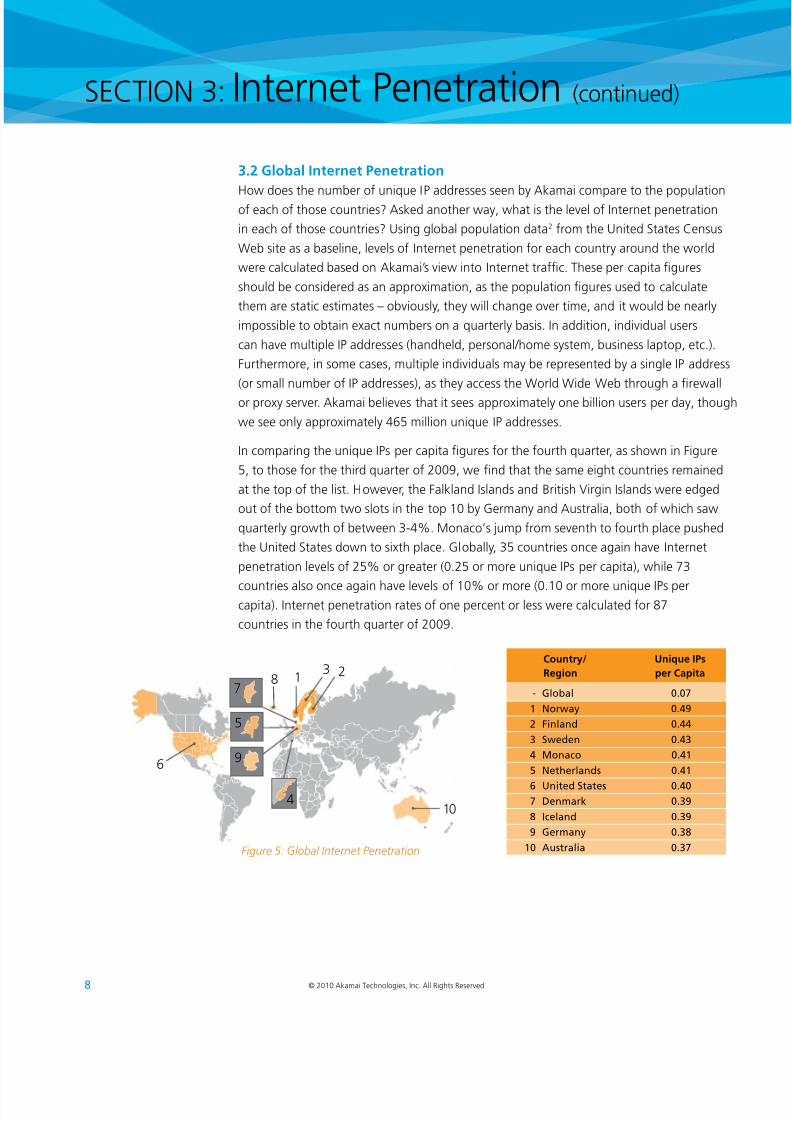
3.2 Global Internet Penetration
How does the number of unique IP addresses seen by Akamai compare to the populationof each of those countries? Asked another way, what is the level of Internet penetration
in each of those countries? Using global population data2 from the United States Census
Web site as a baseline, levels of Internet penetration for each country around the world
were calculated based on Akamai’s view into Internet trafc. These per capita gures
should be considered as an approximation, as the population gures used to calculate
them are static estimates – obviously, they will change over time, and it would be nearly
impossible to obtain exact numbers on a quarterly basis. In addition, individual users
can have multiple IP addresses (handheld, personal/home system, business laptop, etc.).
Furthermore, in some cases, multiple individuals may be represented by a single IP address
(or small number of IP addresses), as they access the World Wide Web through a rewall
or proxy server. Akamai believes that it sees approximately one billion users per day, though
we see only approximately 465 million unique IP addresses.
In comparing the unique IPs per capita gures for the fourth quarter, as shown in Figure
5, to those for the third quarter of 2009, we nd that the same eight countries remained
at the top of the list. However, the Falkland Islands and British Virgin Islands were edged
out of the bottom two slots in the top 10 by Germany and Australia, both of which saw
quarterly growth of between 3-4%. Monaco’s jump from seventh to fourth place pushed
the United States down to sixth place. Globally, 35 countries once again have Internet
penetration levels of 25% or greater (0.25 or more unique IPs per capita), while 73
countries also once again have levels of 10% or more (0.10 or more unique IPs percapita). Internet penetration rates of one percent or less were calculated for 87
countries in the fourth quarter of 2009.
Figure 5: Global Internet Penetration
Country/ Unique IPs
Region per Capita
- G 0.07
1 nw 0.49
2 Fi 0.44
3 Sw 0.43
4 M 0.41
5 ns 0.41
6 i Ss 0.407 dmk 0.39
8 I 0.39
9 Gm 0.38
10 ausi 0.37
6
10
183 2
5
9
7
4
8/8/2019 Akamai State Internet Q4 2009
http://slidepdf.com/reader/full/akamai-state-internet-q4-2009 11/32
9© 2010 Akamai Technologies, Inc. All Rights Reserved
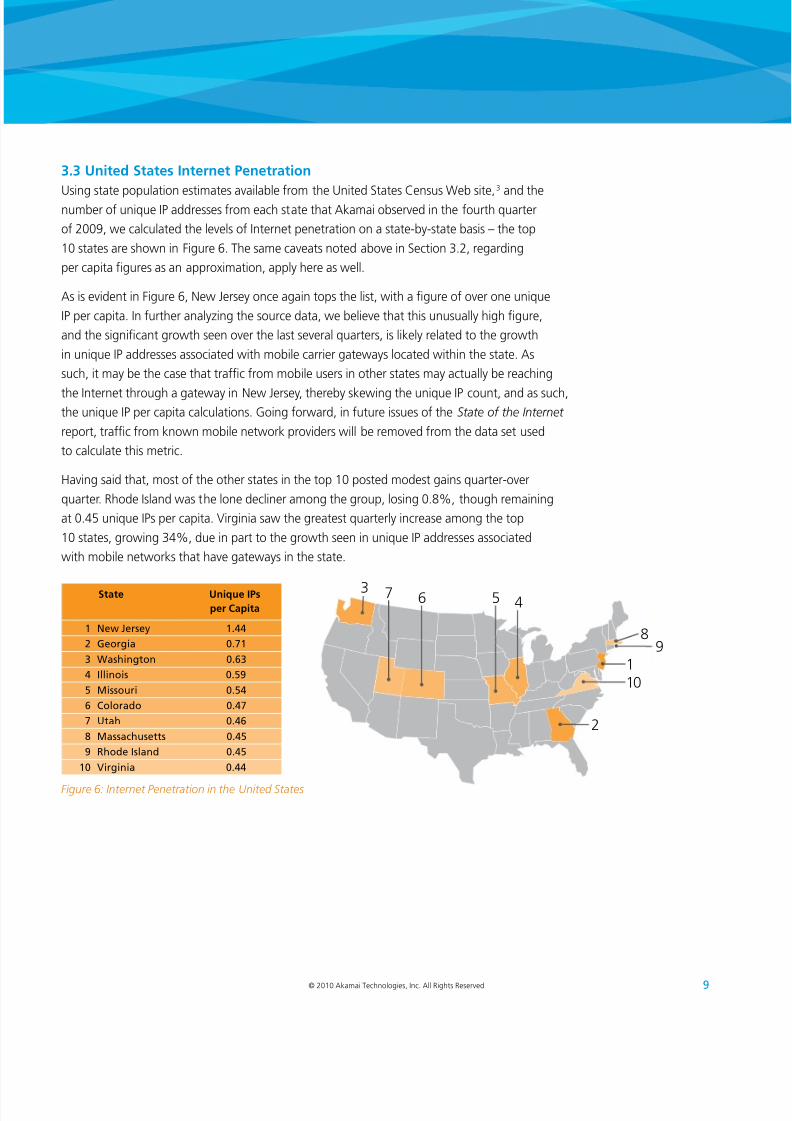
3.3 United States Internet Penetration
Using state population estimates available from the United States Census Web site,3
and thenumber of unique IP addresses from each state that Akamai observed in the fourth quarter
of 2009, we calculated the levels of Internet penetration on a state-by-state basis – the top
10 states are shown in Figure 6. The same caveats noted above in Section 3.2, regarding
per capita gures as an approximation, apply here as well.
As is evident in Figure 6, New Jersey once again tops the list, with a gure of over one unique
IP per capita. In further analyzing the source data, we believe that this unusually high gure,
and the signicant growth seen over the last several quarters, is likely related to the growth
in unique IP addresses associated with mobile carrier gateways located within the state. As
such, it may be the case that trafc from mobile users in other states may actually be reaching
the Internet through a gateway in New Jersey, thereby skewing the unique IP count, and as such,the unique IP per capita calculations. Going forward, in future issues of the State o the Internet
report, trafc from known mobile network providers will be removed from the data set used
to calculate this metric.
Having said that, most of the other states in the top 10 posted modest gains quarter-over
quarter. Rhode Island was the lone decliner among the group, losing 0.8%, though remaining
at 0.45 unique IPs per capita. Virginia saw the greatest quarterly increase among the top
10 states, growing 34%, due in part to the growth seen in unique IP addresses associated
with mobile networks that have gateways in the state.
Figure 6: Internet Penetration in the United States
State Unique IPs
per Capita
1 nw Js 1.44
2 Ggi 0.71
3 Wsig 0.63
4 Iiis 0.59
5 Missui 0.54
6 c 0.47
7 0.46
8 Mssuss 0.45
9 r Is 0.45
10 Vigii 0.44
110
89
2
567 43
8/8/2019 Akamai State Internet Q4 2009
http://slidepdf.com/reader/full/akamai-state-internet-q4-2009 12/32
10 © 2010 Akamai Technologies, Inc. All Rights Reserved
SECTION 4: Geography
Through its globally-deployed server network and by virtue of the billions of
requests for Web content that it services on a daily basis, Akamai has a uniqulevel of visibility into the connection speeds of the systems issuing the request
and as such, of broadband adoption around the globe. Because Akamai has
implemented a distributed network model, deploying servers within edge
networks, it can deliver content more reliably and more consistently at those
speeds, in contrast to centralized competitors that rely on fewer deployments
in large data centers. For more information on why this is possible, please see
Akamai’s How Will The Internet Scale? White Paper4 or the video explanation
at http://www.akamai.com/whytheedge.
The data presented within this section was collected during the fourth quarter of 2009 througAkamai’s globally-deployed server network and includes all countries and U.S. states that had
more than 1,000 average monthly unique IP addresses make requests to Akamai’s network
during the second quarter. For purposes of classication in this report, the “broadband”
data included below is for connections greater than 2 Mbps, and “high broadband” is for
connections of 5 Mbps or greater. In contrast, the “narrowband” data included below is
for connections slower than 256 Kbps. Note that the percentage changes reected below
are not additive – they are relative to the prior quarter(s). (That is, a Q3 value of 50% and
a Q4 value of 51% would be reected here as a 2% change.) A quarter-over-quarter change
is shown within the tables in several sections below in an effort to highlight general trends. A
year-over-year change is also shown in some tables in an effort to highlight longer-term trends
As the quantity of HD-quality media increases over time, and the consumption of that media
increases, end users are likely to require ever-increasing amounts of bandwidth. A connection
speed of 2 Mbps is arguably sufcient for standard denition TV-quality video content, and
5 Mbps for standard-denition DVD quality video content, while Blu-Ray (1080p) video conten
has a maximum video bit rate of 40 Mbps, according to the Blu-Ray FAQ 5. As we have done
in prior quarters, in order to provide additional insight into where users have connection speed
that would allow them to be able to effectively consume this higher quality media, we will
continue to examine how the “high broadband” connections are distributed across speed
groupings ranging from 5 to >25 Mbps. In addition, we will continue to look at which cities
around the world have the highest average measured connection speeds, and the highestlevels of high broadband and broadband adoption.
Finally, we believe that mobile usage in many geographies around the world may be growing
to the point where it is skewing average speed calculations, resulting in signicant declines in
[high] broadband metrics, or unusually large gains in narrowband metrics. Therefore, starting
with the 1st Quarter, 2010 State o the Internet report, trafc from known mobile network
providers will be removed from the data set used to calculate the metrics reported in this
section. (Mobile trafc will continue to be analyzed and reviewed in a separate section
of the report.)
8/8/2019 Akamai State Internet Q4 2009
http://slidepdf.com/reader/full/akamai-state-internet-q4-2009 13/32
11© 2010 Akamai Technologies, Inc. All Rights Reserved
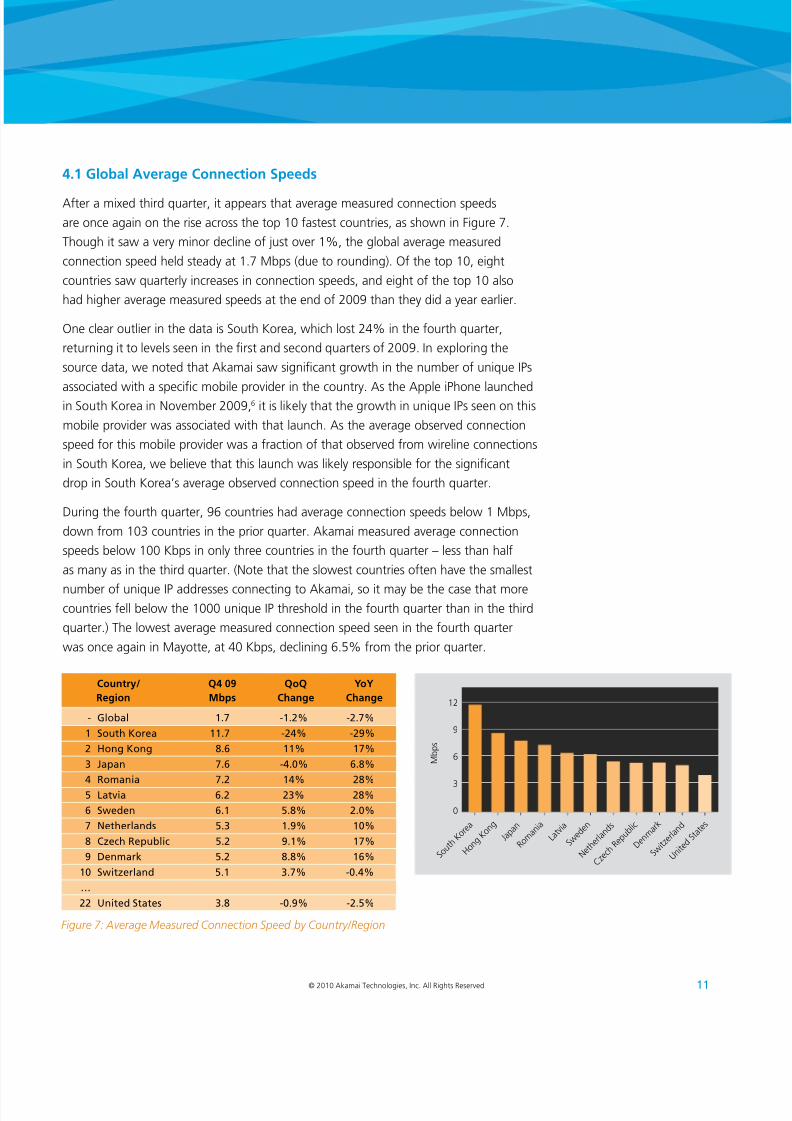
4.1 Global Average Connection Speeds
After a mixed third quarter, it appears that average measured connection speeds
are once again on the rise across the top 10 fastest countries, as shown in Figure 7.
Though it saw a very minor decline of just over 1%, the global average measured
connection speed held steady at 1.7 Mbps (due to rounding). Of the top 10, eight
countries saw quarterly increases in connection speeds, and eight of the top 10 also
had higher average measured speeds at the end of 2009 than they did a year earlier.
One clear outlier in the data is South Korea, which lost 24% in the fourth quarter,
returning it to levels seen in the rst and second quarters of 2009. In exploring the
source data, we noted that Akamai saw signicant growth in the number of unique IPs
associated with a specic mobile provider in the country. As the Apple iPhone launchedin South Korea in November 2009,6 it is likely that the growth in unique IPs seen on this
mobile provider was associated with that launch. As the average observed connection
speed for this mobile provider was a fraction of that observed from wireline connections
in South Korea, we believe that this launch was likely responsible for the signicant
drop in South Korea’s average observed connection speed in the fourth quarter.
During the fourth quarter, 96 countries had average connection speeds below 1 Mbps,
down from 103 countries in the prior quarter. Akamai measured average connection
speeds below 100 Kbps in only three countries in the fourth quarter – less than half
as many as in the third quarter. (Note that the slowest countries often have the smallest
number of unique IP addresses connecting to Akamai, so it may be the case that morecountries fell below the 1000 unique IP threshold in the fourth quarter than in the third
quarter.) The lowest average measured connection speed seen in the fourth quarter
was once again in Mayotte, at 40 Kbps, declining 6.5% from the prior quarter.
Figure 7: Average Measured Connection Speed by Country/Region
Country/ Q4 09 QoQ YoY
Region Mbps Change Change
- G 1.7 -1.2% -2.7%
1 Su K 11.7 -24% -29%
2 hg Kg 8.6 11% 17%
3 Jp 7.6 -4.0% 6.8%
4 rmi 7.2 14% 28%
5 lvi 6.2 23% 28%
6 Sw 6.1 5.8% 2.0%
7 ns 5.3 1.9% 10%
8 cz rpui 5.2 9.1% 17%
9 dmk 5.2 8.8% 16%
10 Swiz 5.1 3.7% -0.4%
…
22 i Ss 3.8 -0.9% -2.5%
M b p s
S o u t h K
o r e a
L a t v i a
J a p a n
N e t h e r l a n d s
S w i t z
e r l a n d
H o n g
K o n
g
S w e d e n
D e n m
a r k
R o m a
n i a
C z e c h R
e p u b l i c
U n i t e
d S t a t
e s
12
9
6
3
0
8/8/2019 Akamai State Internet Q4 2009
http://slidepdf.com/reader/full/akamai-state-internet-q4-2009 14/32
12 © 2010 Akamai Technologies, Inc. All Rights Reserved
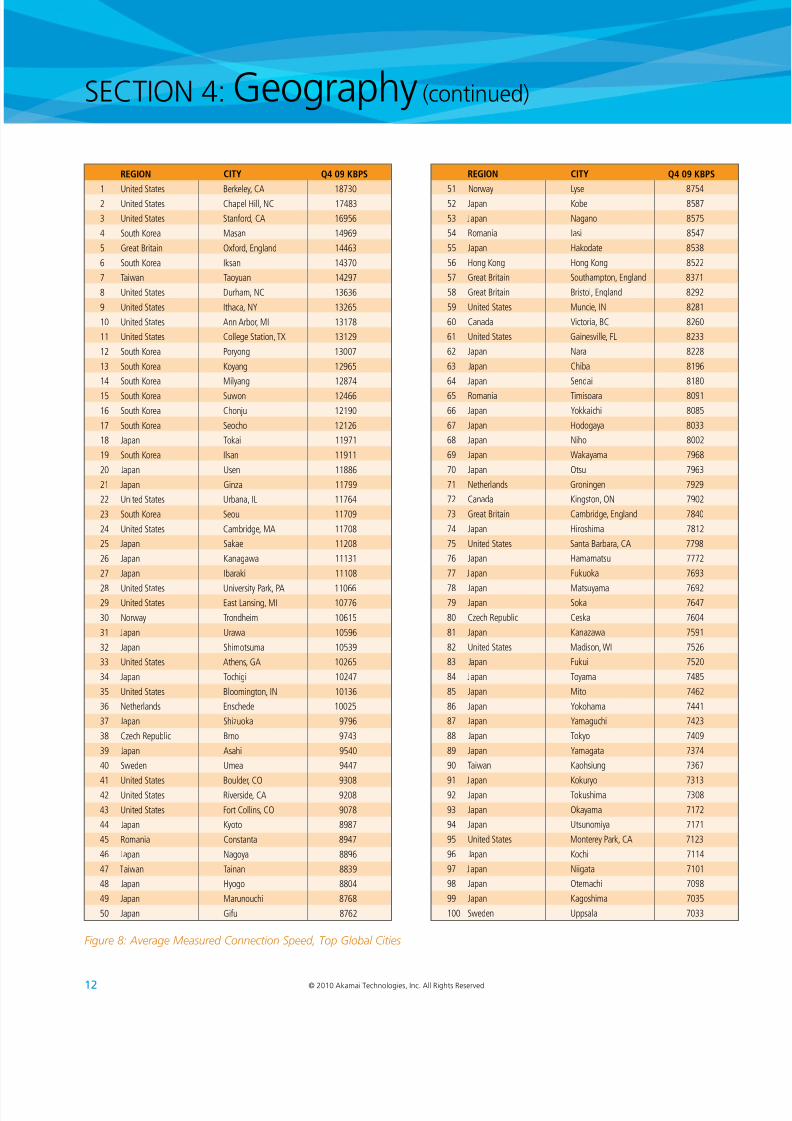
Figure 8: Average Measured Connection Speed, Top Global Cities
REGION
1 UnitedStates Berkeley,CA 18730
2 UnitedStates ChapelHill,NC 17483
3 UnitedStates Stanford,CA 16956
4 SouthKorea Masan 14969
5 GreatBritain Oxford,England 14463
6 SouthKorea Iksan 14370
7 Taiwan Taoyuan 14297
8 UnitedStates Durham,NC 13636
9 UnitedStates Ithaca,NY 13265
10 UnitedStates AnnArbor,MI 13178
11 UnitedStates CollegeStation,TX 13129
12 SouthKorea Poryong 13007
13 SouthKorea Koyang 12965
14 SouthKorea Milyang 12874
15 SouthKorea Suwon 12466
16 SouthKorea Chonju 12190
17 SouthKorea Seocho 12126
18 Japan Tokai 11971
19 SouthKorea Ilsan 11911
20 Japan Usen 11886
21 Japan Ginza 11799
22 UnitedStates Urbana,IL 11764
23 SouthKorea Seoul 11709
24 UnitedStates Cambridge,MA 11708
25 Japan Sakae 11208
26 Japan Kanagawa 11131
27 Japan Ibaraki 11108
28 UnitedStates UniversityPark,PA 1106629 UnitedStates EastLansing,MI 10776
30 Norway Trondheim 10615
31 Japan Urawa 10596
32 Japan Shimotsuma 10539
33 UnitedStates Athens,GA 10265
34 Japan Tochigi 10247
35 UnitedStates Bloomington,IN 10136
36 Netherlands Enschede 10025
37 Japan Shizuoka 9796
38 CzechRepublic Brno 9743
39 Japan Asahi 9540
40 Sweden Umea 9447
41 UnitedStates Boulder,CO 9308
42 UnitedStates Riverside,CA 9208
43 UnitedStates FortCollins,CO 9078
44 Japan Kyoto 8987
45 Romania Constanta 8947
46 Japan Nagoya 8896
47 Taiwan Tainan 8839
48 Japan Hyogo 8804
49 Japan Marunouchi 8768
50 Japan Gifu 8762
REGION
51 Norway Lyse 8754
52 Japan Kobe 8587
53 Japan Nagano 8575
54 Romania Iasi 8547
55 Japan Hakodate 8538
56 HongKong HongKong 8522
57 GreatBritain Southampton,England 8371
58 GreatBritain Bristol,England 8292
59 UnitedStates Muncie,IN 8281
60 Canada Victoria,BC 8260
61 UnitedStates Gainesville,FL 8233
62 Japan Nara 8228
63 Japan Chiba 8196
64 Japan Sendai 8180
65 Romania Timisoara 8091
66 Japan Yokkaichi 8085
67 Japan Hodogaya 8033
68 Japan Niho 8002
69 Japan Wakayama 7968
70 Japan Otsu 7963
71 Netherlands Groningen 7929
72 Canada Kingston,ON 7902
73 GreatBritain Cambridge,England 7840
74 Japan Hiroshima 7812
75 UnitedStates SantaBarbara,CA 7798
76 Japan Hamamatsu 7772
77 Japan Fukuoka 7693
78 Japan Matsuyama 769279 Japan Soka 7647
80 CzechRepublic Ceska 7604
81 Japan Kanazawa 7591
82 UnitedStates Madison,WI 7526
83 Japan Fukui 7520
84 Japan Toyama 7485
85 Japan Mito 7462
86 Japan Yokohama 7441
87 Japan Yamaguchi 7423
88 Japan Tokyo 7409
89 Japan Yamagata 7374
90 Taiwan Kaohsiung 7367
91 Japan Kokuryo 7313
92 Japan Tokushima 7308
93 Japan Okayama 7172
94 Japan Utsunomiya 7171
95 UnitedStates MontereyPark,CA 7123
96 Japan Kochi 7114
97 Japan Niigata 7101
98 Japan Otemachi 7098
99 Japan Kagoshima 7035
100 Sweden Uppsala 7033
Q409KBPS Q409KBPSCITY CITY
SECTION 4: Geography (continued)
8/8/2019 Akamai State Internet Q4 2009
http://slidepdf.com/reader/full/akamai-state-internet-q4-2009 15/32
13© 2010 Akamai Technologies, Inc. All Rights Reserved
4.2 Global Average Connection Speeds, City View
Following the initial review published in the 3rd Quarter, 2009 State o the Internet report, we are once again examining the average measured connection speeds at a city
level. However, in an effort lter out some of the particularly small cities that may have
been included in the third quarter’s report, we applied a “lter” of 50,000 unique IP
addresses to qualify for inclusion in the list. The top 100 fastest cities around the world,
based on this lter, are shown in Figure 8. Once again, some very interesting clustering
patterns can be seen when looking at this dataset:
• Nearly half (48) of the top cities are
in Japan, and 62 of them are in Asia
• The 15 top cities that are located in
Europe are spread across six countries
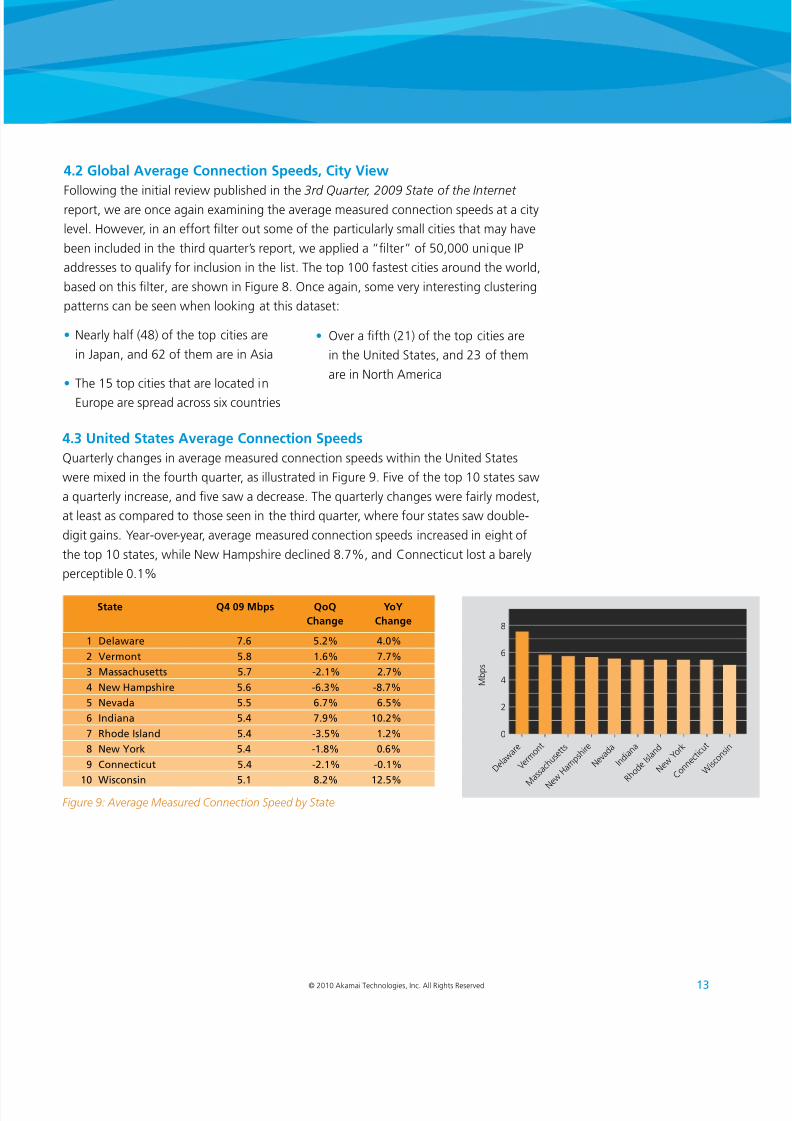
4.3 United States Average Connection Speeds
Quarterly changes in average measured connection speeds within the United States
were mixed in the fourth quarter, as illustrated in Figure 9. Five of the top 10 states saw
a quarterly increase, and ve saw a decrease. The quarterly changes were fairly modest,
at least as compared to those seen in the third quarter, where four states saw double-
digit gains. Year-over-year, average measured connection speeds increased in eight of
the top 10 states, while New Hampshire declined 8.7%, and Connecticut lost a barely
perceptible 0.1%
• Over a fth (21) of the top cities are
in the United States, and 23 of them
are in North America
Figure 9: Average Measured Connection Speed by State
State Q4 09 Mbps QoQ YoY
Change Change
1 dw 7.6 5.2% 4.0%
2 Vm 5.8 1.6% 7.7%
3 Mssuss 5.7 -2.1% 2.7%
4 nw hmpsi 5.6 -6.3% -8.7%
5 nv 5.5 6.7% 6.5%
6 Ii 5.4 7.9% 10.2%
7 r Is 5.4 -3.5% 1.2%
8 nw yk 5.4 -1.8% 0.6%
9 ciu 5.4 -2.1% -0.1%
10 Wissi 5.1 8.2% 12.5%
M b p s
D e l a w
a r e
N e v a d a
M
a s s a c h u s e t t
s
R h o d e I s l a n d
W i s c
o n s i n
V e r m
o n t
I n d i a n
a
C o n n
e c t i c u t
N e
w H a
m p s h i r e
N e w Y o
r k
8
6
4
2
0
8/8/2019 Akamai State Internet Q4 2009
http://slidepdf.com/reader/full/akamai-state-internet-q4-2009 16/32
14 © 2010 Akamai Technologies, Inc. All Rights Reserved
SECTION 4: Geography (continued)
Overall, 31 states saw average connection speeds increase in the fourth quarter –
up from 25 the prior quarter. Gains ranged from Oregon’s slight 0.3% increase(to 4.3 Mbps) to South Dakota’s 18% jump (to 4.5 Mbps). Fourth quarter decreases
in average connection speeds were seen in 19 states and the District of Columbia,
and ranged from West Virginia’s 0.1% decline (to 4.1 Mbps) to Virginia’s 13% drop
(to 4.0 Mbps). Annual trending was roughly similar, with 21 states and the District
of Columbia declining year-over year, from Connecticut’s barely perceptible 0.1%
drop (to 5.4 Mbps) to New Jersey’s 25% loss (to 1.9 Mbps). Increased speeds year-
over-year were seen in 29 states, from Kentucky’s half-percent growth (to 3.3 Mbps)
to the 33% growth seen in Hawaii (to 4.7 Mbps). We believe that the signicant
declines noted above in Virginia and New Jersey were likely due, in part, to increased
trafc seen from lower speed mobile connections that entered the Internet through
gateways within those states.
4.4 United States Average Connection Speeds, City View
In reviewing the “city view” average connection speed data published in the 3rd
Quarter, 2009 State o the Internet report, it was noted that many of the top cities
listed for the United States had one or more colleges/universities within, or close to,
the city. As was done for the global city view, for the fourth quarter United States data,
we applied a “lter” of 50,000 unique IP addresses to qualify for inclusion in the list
in an effort to lter out some of the particularly small cities that may have been included
in the third quarter. Interestingly, the results once again show, as seen in Figure 10,
that so-called “college towns” (cities) are some of the best connected in the UnitedStates. However, what this likely represents is the extremely high speed connections
these university/college campuses have to the Internet, as opposed to particularly high
speed consumer broadband services available to local residents. (However, it may also
be the case that the speed of local consumer broadband offerings is potentially higher
than average.)
In an effort to identify the fastest “big cities” within the United States, we also sorted
the source data based on the number of unique IP addresses seen by Akamai. The data
in Figure 11 represents the average measured connection speeds observed in the ten
cities with the most unique IP addresses seen by Akamai. While Internet connections
in these “big cities” are not quite as fast as the ones observed in “college towns”,we can see that the connections from all of these cities are in the high broadband range,
exceeding 5 Mbps. As such, users in these cities are likely prime candidates for the
consumption of high-quality digital media, such as that available from companies that
leverage Akamai’s HD Network to deliver video streams encoded at HD quality.
“College towns”
are some o the best
connected cities in
the United States.
8/8/2019 Akamai State Internet Q4 2009
http://slidepdf.com/reader/full/akamai-state-internet-q4-2009 17/32
15© 2010 Akamai Technologies, Inc. All Rights Reserved
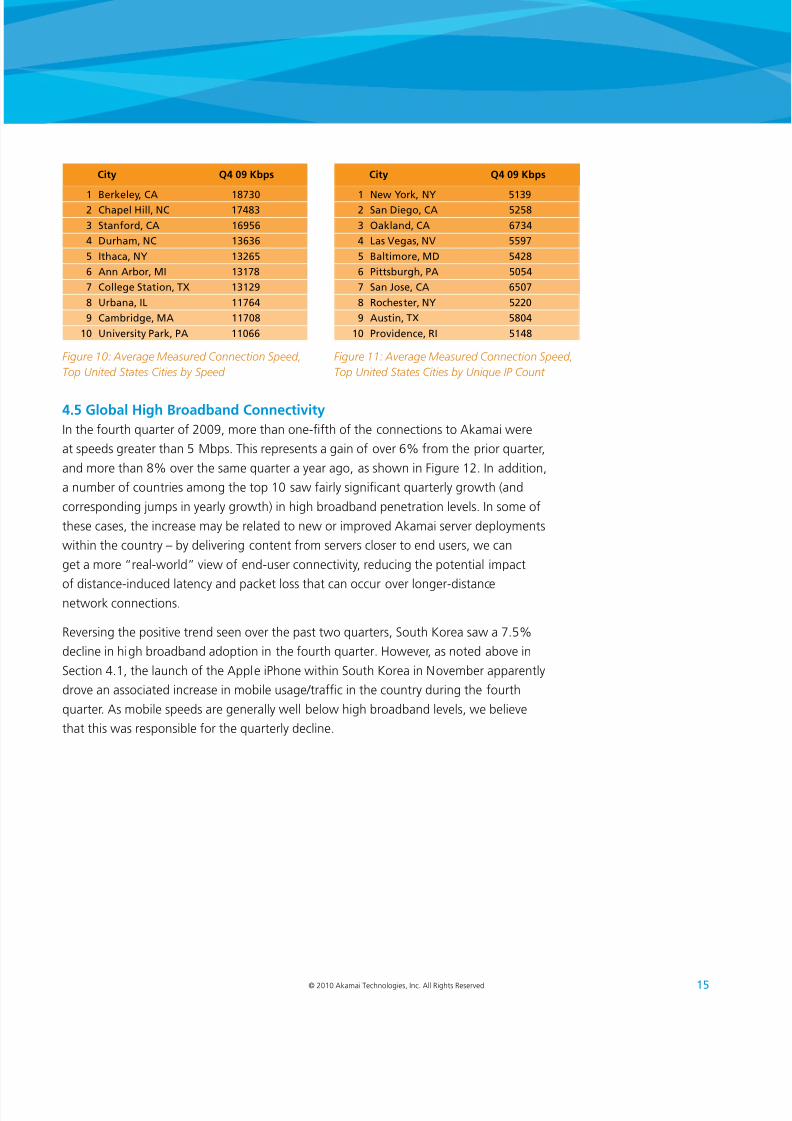
4.5 Global High Broadband Connectivity
In the fourth quarter of 2009, more than one-fth of the connections to Akamai were
at speeds greater than 5 Mbps. This represents a gain of over 6% from the prior quarter,
and more than 8% over the same quarter a year ago, as shown in Figure 12. In addition,
a number of countries among the top 10 saw fairly signicant quarterly growth (and
corresponding jumps in yearly growth) in high broadband penetration levels. In some of
these cases, the increase may be related to new or improved Akamai server deployments
within the country – by delivering content from servers closer to end users, we can
get a more “real-world” view of end-user connectivity, reducing the potential impact
of distance-induced latency and packet loss that can occur over longer-distancenetwork connections.
Reversing the positive trend seen over the past two quarters, South Korea saw a 7.5%
decline in high broadband adoption in the fourth quarter. However, as noted above in
Section 4.1, the launch of the Apple iPhone within South Korea in November apparently
drove an associated increase in mobile usage/trafc in the country during the fourth
quarter. As mobile speeds are generally well below high broadband levels, we believe
that this was responsible for the quarterly decline.
Figure 10: Average Measured Connection Speed,
Top United States Cities by Speed
City Q4 09 Kbps
1 bk, ca 187302 cp hi, nc 17483
3 Sf, ca 16956
4 dum, nc 13636
5 I, ny 13265
6 a a, MI 13178
7 cg Si, tx 13129
8 , Il 11764
9 cmig, Ma 11708
10 ivsi Pk, Pa 11066
Figure 11: Average Measured Connection Speed,
Top United States Cities by Unique IP Count
City Q4 09 Kbps
1 nw yk, ny 51392 S dig, ca 5258
3 ok, ca 6734
4 ls Vgs, nV 5597
5 bim, Md 5428
6 Pisug, Pa 5054
7 S Js, ca 6507
8 rs, ny 5220
9 ausi, tx 5804
10 Pvi, rI 5148
8/8/2019 Akamai State Internet Q4 2009
http://slidepdf.com/reader/full/akamai-state-internet-q4-2009 18/32
16 © 2010 Akamai Technologies, Inc. All Rights Reserved
SECTION 4: Geography (continued)
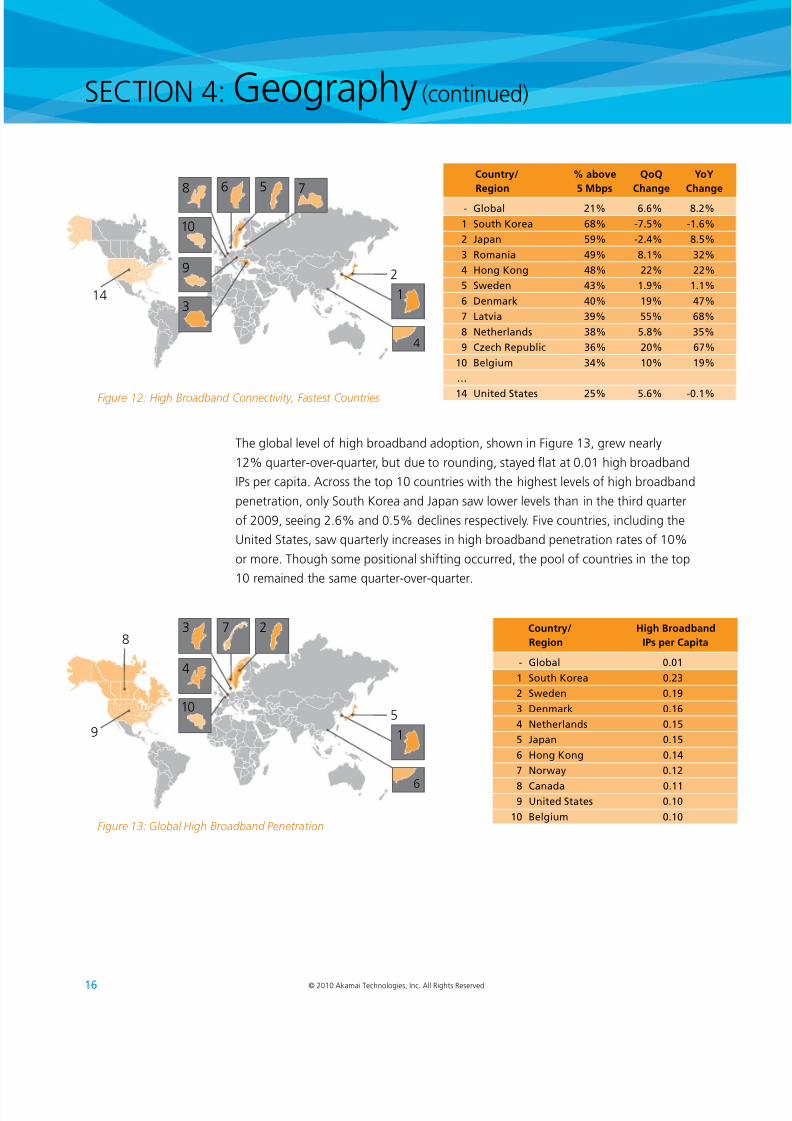
The global level of high broadband adoption, shown in Figure 13, grew nearly
12% quarter-over-quarter, but due to rounding, stayed at at 0.01 high broadband
IPs per capita. Across the top 10 countries with the highest levels of high broadband
penetration, only South Korea and Japan saw lower levels than in the third quarter
of 2009, seeing 2.6% and 0.5% declines respectively. Five countries, including the
United States, saw quarterly increases in high broadband penetration rates of 10%
or more. Though some positional shifting occurred, the pool of countries in the top
10 remained the same quarter-over-quarter.
Figure 12: High Broadband Connectivity, Fastest Countries
Country/ % above QoQ YoY
Region 5 Mbps Change Change
- G 21% 6.6% 8.2%
1 Su K 68% -7.5% -1.6%
2 Jp 59% -2.4% 8.5%
3 rmi 49% 8.1% 32%
4 hg Kg 48% 22% 22%
5 Sw 43% 1.9% 1.1%
6 dmk 40% 19% 47%
7 lvi 39% 55% 68%
8 ns 38% 5.8% 35%
9 cz rpui 36% 20% 67%
10 bgium 34% 10% 19%
…
14 i Ss 25% 5.6% -0.1%
14
2
3
568
10
7
9
1
4
Figure 13: Global High Broadband Penetration
Country/ High Broadband
Region IPs per Capita
- G 0.01
1 Su K 0.23
2 Sw 0.19
3 dmk 0.16
4 ns 0.15
5 Jp 0.15
6 hg Kg 0.14
7 nw 0.12
8 c 0.119 i Ss 0.10
10 bgium 0.10
9
8
5
23 7
4
10
1
6
8/8/2019 Akamai State Internet Q4 2009
http://slidepdf.com/reader/full/akamai-state-internet-q4-2009 19/32
17© 2010 Akamai Technologies, Inc. All Rights Reserved
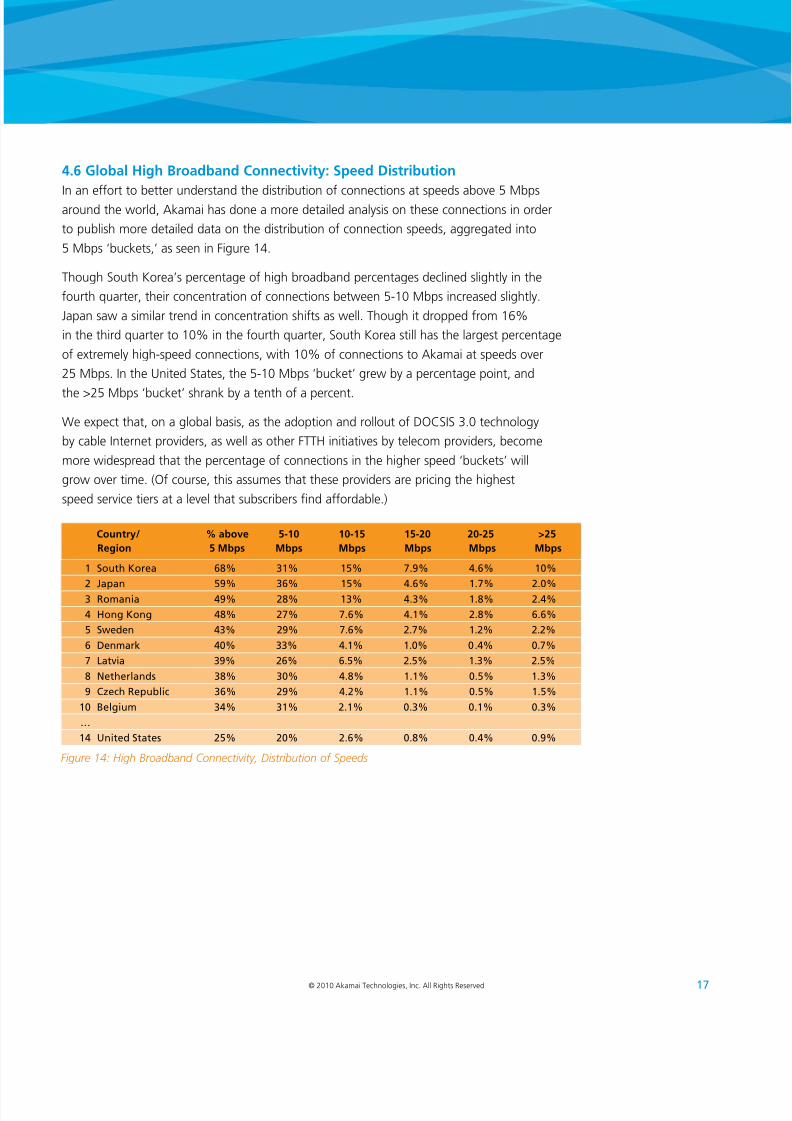
4.6 Global High Broadband Connectivity: Speed Distribution
In an effort to better understand the distribution of connections at speeds above 5 Mbpsaround the world, Akamai has done a more detailed analysis on these connections in order
to publish more detailed data on the distribution of connection speeds, aggregated into
5 Mbps ‘buckets,’ as seen in Figure 14.
Though South Korea’s percentage of high broadband percentages declined slightly in the
fourth quarter, their concentration of connections between 5-10 Mbps increased slightly.
Japan saw a similar trend in concentration shifts as well. Though it dropped from 16%
in the third quarter to 10% in the fourth quarter, South Korea still has the largest percentage
of extremely high-speed connections, with 10% of connections to Akamai at speeds over
25 Mbps. In the United States, the 5-10 Mbps ‘bucket’ grew by a percentage point, and
the >25 Mbps ‘bucket’ shrank by a tenth of a percent.
We expect that, on a global basis, as the adoption and rollout of DOCSIS 3.0 technology
by cable Internet providers, as well as other FTTH initiatives by telecom providers, become
more widespread that the percentage of connections in the higher speed ‘buckets’ will
grow over time. (Of course, this assumes that these providers are pricing the highest
speed service tiers at a level that subscribers nd affordable.)
Figure 14: High Broadband Connectivity, Distribution o Speeds
Country/ % above 5-10 10-15 15-20 20-25 >25
Region 5 Mbps Mbps Mbps Mbps Mbps Mbps
1 Su K 68% 31% 15% 7.9% 4.6% 10%
2 Jp 59% 36% 15% 4.6% 1.7% 2.0%3 rmi 49% 28% 13% 4.3% 1.8% 2.4%
4 hg Kg 48% 27% 7.6% 4.1% 2.8% 6.6%
5 Sw 43% 29% 7.6% 2.7% 1.2% 2.2%
6 dmk 40% 33% 4.1% 1.0% 0.4% 0.7%
7 lvi 39% 26% 6.5% 2.5% 1.3% 2.5%
8 ns 38% 30% 4.8% 1.1% 0.5% 1.3%
9 cz rpui 36% 29% 4.2% 1.1% 0.5% 1.5%
10 bgium 34% 31% 2.1% 0.3% 0.1% 0.3%
…
14 i Ss 25% 20% 2.6% 0.8% 0.4% 0.9%
8/8/2019 Akamai State Internet Q4 2009
http://slidepdf.com/reader/full/akamai-state-internet-q4-2009 20/32
18 © 2010 Akamai Technologies, Inc. All Rights Reserved
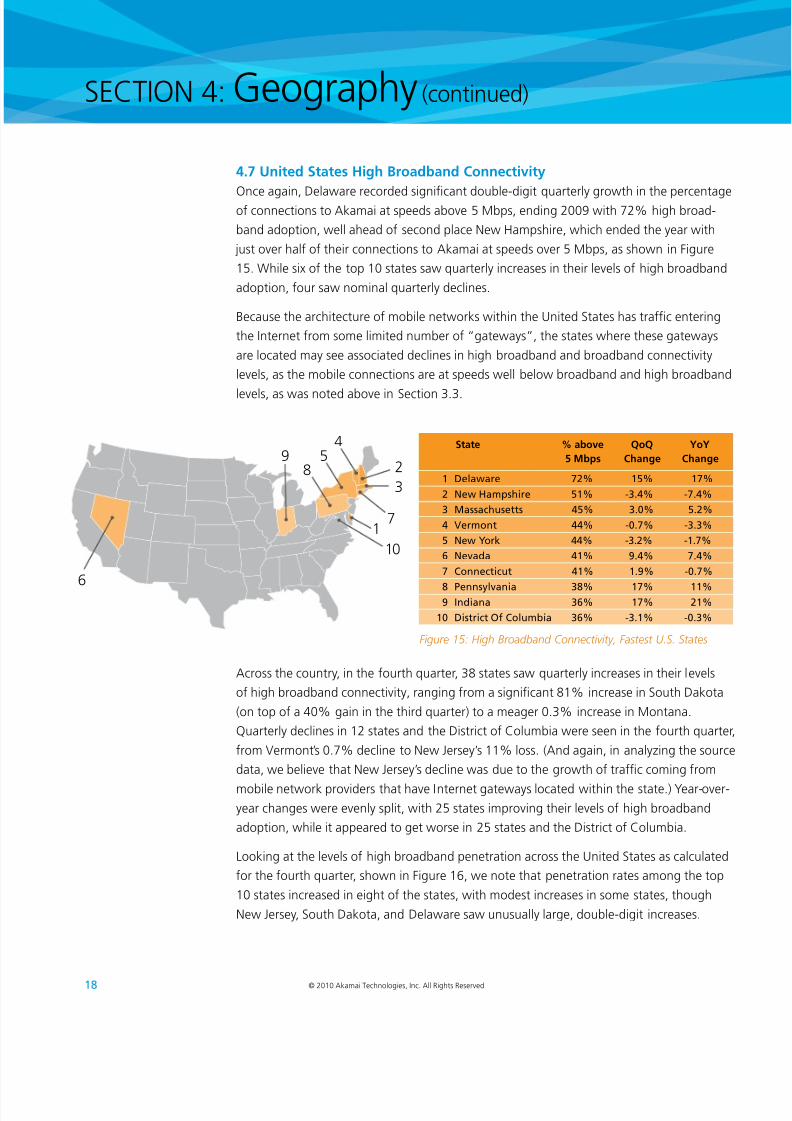
4.7 United States High Broadband Connectivity
Once again, Delaware recorded signicant double-digit quarterly growth in the percentageof connections to Akamai at speeds above 5 Mbps, ending 2009 with 72% high broad-
band adoption, well ahead of second place New Hampshire, which ended the year with
just over half of their connections to Akamai at speeds over 5 Mbps, as shown in Figure
15. While six of the top 10 states saw quarterly increases in their levels of high broadband
adoption, four saw nominal quarterly declines.
Because the architecture of mobile networks within the United States has trafc entering
the Internet from some limited number of “gateways”, the states where these gateways
are located may see associated declines in high broadband and broadband connectivity
levels, as the mobile connections are at speeds well below broadband and high broadband
levels, as was noted above in Section 3.3.
SECTION 4: Geography (continued)
Across the country, in the fourth quarter, 38 states saw quarterly increases in their levels
of high broadband connectivity, ranging from a signicant 81% increase in South Dakota
(on top of a 40% gain in the third quarter) to a meager 0.3% increase in Montana.
Quarterly declines in 12 states and the District of Columbia were seen in the fourth quarter,
from Vermont’s 0.7% decline to New Jersey’s 11% loss. (And again, in analyzing the source
data, we believe that New Jersey’s decline was due to the growth of trafc coming from
mobile network providers that have Internet gateways located within the state.) Year-over-
year changes were evenly split, with 25 states improving their levels of high broadband
adoption, while it appeared to get worse in 25 states and the District of Columbia.
Looking at the levels of high broadband penetration across the United States as calculated
for the fourth quarter, shown in Figure 16, we note that penetration rates among the top
10 states increased in eight of the states, with modest increases in some states, though
New Jersey, South Dakota, and Delaware saw unusually large, double-digit increases.
1
10
6
3
2
7
45
89
Figure 15: High Broadband Connectivity, Fastest U.S. States
State % above QoQ YoY
5 Mbps Change Change
1 dw 72% 15% 17%
2 nw hmpsi 51% -3.4% -7.4%
3 Mssuss 45% 3.0% 5.2%
4 Vm 44% -0.7% -3.3%
5 nw yk 44% -3.2% -1.7%
6 nv 41% 9.4% 7.4%
7 ciu 41% 1.9% -0.7%
8 Psvi 38% 17% 11%9 Ii 36% 17% 21%
10 disi of cumi 36% -3.1% -0.3%
8/8/2019 Akamai State Internet Q4 2009
http://slidepdf.com/reader/full/akamai-state-internet-q4-2009 21/32
19© 2010 Akamai Technologies, Inc. All Rights Reserved
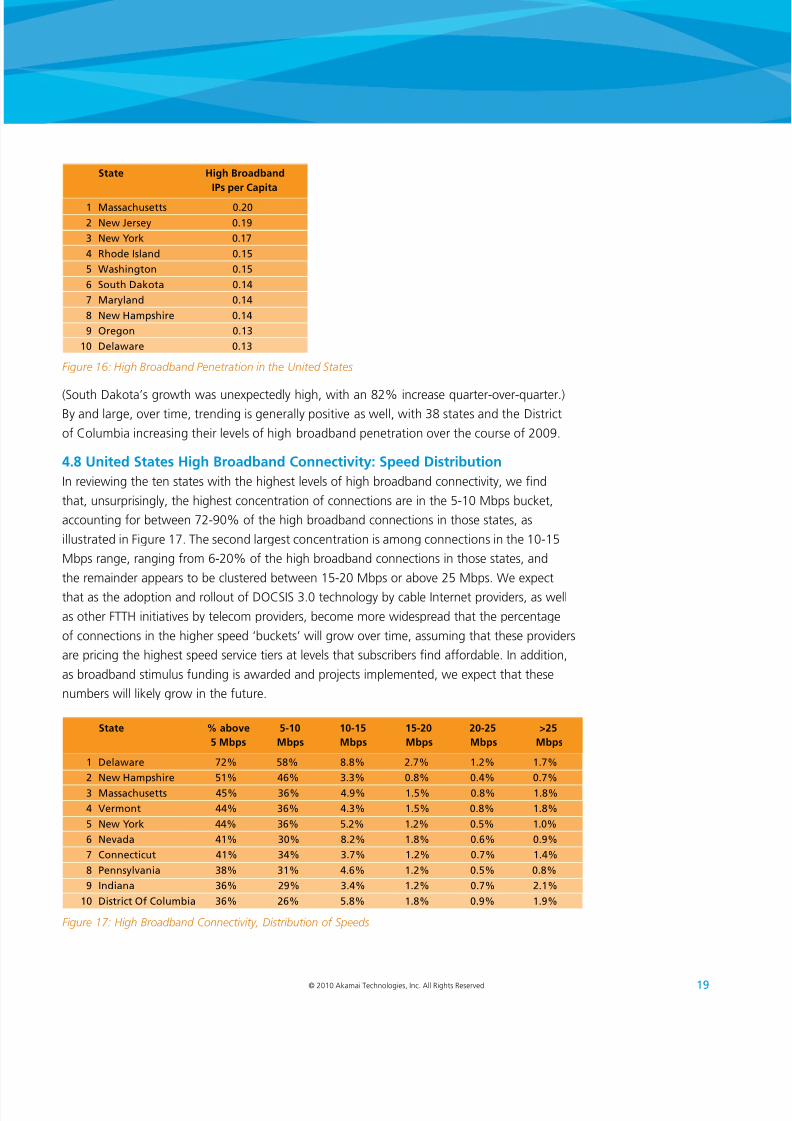
(South Dakota’s growth was unexpectedly high, with an 82% increase quarter-over-quarter.)By and large, over time, trending is generally positive as well, with 38 states and the District
of Columbia increasing their levels of high broadband penetration over the course of 2009.
4.8 United States High Broadband Connectivity: Speed Distribution
In reviewing the ten states with the highest levels of high broadband connectivity, we nd
that, unsurprisingly, the highest concentration of connections are in the 5-10 Mbps bucket,
accounting for between 72-90% of the high broadband connections in those states, as
illustrated in Figure 17. The second largest concentration is among connections in the 10-15
Mbps range, ranging from 6-20% of the high broadband connections in those states, and
the remainder appears to be clustered between 15-20 Mbps or above 25 Mbps. We expect
that as the adoption and rollout of DOCSIS 3.0 technology by cable Internet providers, as well
as other FTTH initiatives by telecom providers, become more widespread that the percentage
of connections in the higher speed ‘buckets’ will grow over time, assuming that these providers
are pricing the highest speed service tiers at levels that subscribers nd affordable. In addition,
as broadband stimulus funding is awarded and projects implemented, we expect that these
numbers will likely grow in the future.
Figure 16: High Broadband Penetration in the United States
State High Broadband
IPs per Capita
1 Mssuss 0.20
2 nw Js 0.19
3 nw yk 0.17
4 r Is 0.15
5 Wsig 0.15
6 Su dk 0.14
7 M 0.14
8 nw hmpsi 0.14
9 og 0.13
10 dw 0.13
Figure 17: High Broadband Connectivity, Distribution o Speeds
State % above 5-10 10-15 15-20 20-25 >25
5 Mbps Mbps Mbps Mbps Mbps Mbps
1 dw 72% 58% 8.8% 2.7% 1.2% 1.7%
2 nw hmpsi 51% 46% 3.3% 0.8% 0.4% 0.7%
3 Mssuss 45% 36% 4.9% 1.5% 0.8% 1.8%
4 Vm 44% 36% 4.3% 1.5% 0.8% 1.8%
5 nw yk 44% 36% 5.2% 1.2% 0.5% 1.0%
6 nv 41% 30% 8.2% 1.8% 0.6% 0.9%
7 ciu 41% 34% 3.7% 1.2% 0.7% 1.4%
8 Psvi 38% 31% 4.6% 1.2% 0.5% 0.8%
9 Ii 36% 29% 3.4% 1.2% 0.7% 2.1%
10 disi of cumi 36% 26% 5.8% 1.8% 0.9% 1.9%
8/8/2019 Akamai State Internet Q4 2009
http://slidepdf.com/reader/full/akamai-state-internet-q4-2009 22/32
20 © 2010 Akamai Technologies, Inc. All Rights Reserved
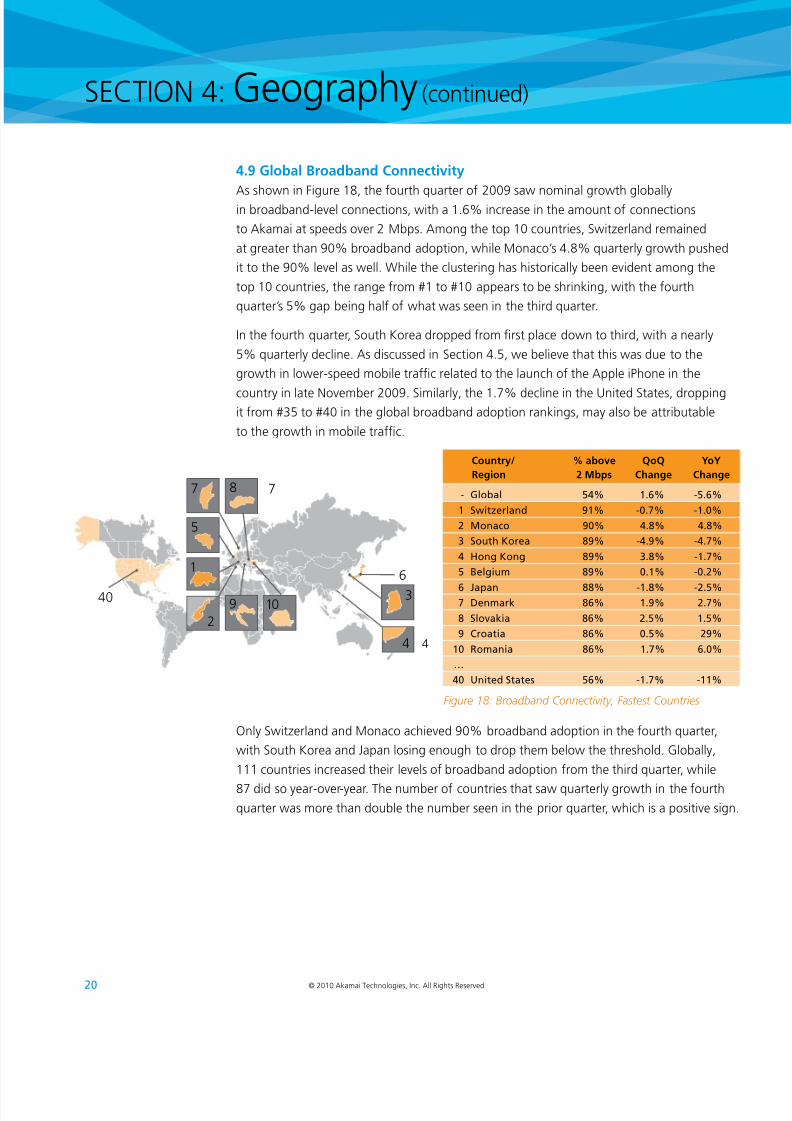
Only Switzerland and Monaco achieved 90% broadband adoption in the fourth quarter,
with South Korea and Japan losing enough to drop them below the threshold. Globally,
111 countries increased their levels of broadband adoption from the third quarter, while
87 did so year-over-year. The number of countries that saw quarterly growth in the fourth
quarter was more than double the number seen in the prior quarter, which is a positive sign.
SECTION 4: Geography (continued)
4.9 Global Broadband Connectivity
As shown in Figure 18, the fourth quarter of 2009 saw nominal growth globallyin broadband-level connections, with a 1.6% increase in the amount of connections
to Akamai at speeds over 2 Mbps. Among the top 10 countries, Switzerland remained
at greater than 90% broadband adoption, while Monaco’s 4.8% quarterly growth pushed
it to the 90% level as well. While the clustering has historically been evident among the
top 10 countries, the range from #1 to #10 appears to be shrinking, with the fourth
quarter’s 5% gap being half of what was seen in the third quarter.
In the fourth quarter, South Korea dropped from rst place down to third, with a nearly
5% quarterly decline. As discussed in Section 4.5, we believe that this was due to the
growth in lower-speed mobile trafc related to the launch of the Apple iPhone in the
country in late November 2009. Similarly, the 1.7% decline in the United States, droppingit from #35 to #40 in the global broadband adoption rankings, may also be attributable
to the growth in mobile trafc.
Figure 18: Broadband Connectivity, Fastest Countries
Country/ % above QoQ YoY
Region 2 Mbps Change Change
- G 54% 1.6% -5.6%
1 Swiz 91% -0.7% -1.0%
2 M 90% 4.8% 4.8%
3 Su K 89% -4.9% -4.7%
4 hg Kg 89% 3.8% -1.7%
5 bgium 89% 0.1% -0.2%
6 Jp 88% -1.8% -2.5%7 dmk 86% 1.9% 2.7%
8 Svki 86% 2.5% 1.5%
9 ci 86% 0.5% 29%
10 rmi 86% 1.7% 6.0%
…
40 i Ss 56% -1.7% -11%
40
6
10
87
5
7
3
4
9
1
4
2
8/8/2019 Akamai State Internet Q4 2009
http://slidepdf.com/reader/full/akamai-state-internet-q4-2009 23/32
21© 2010 Akamai Technologies, Inc. All Rights Reserved
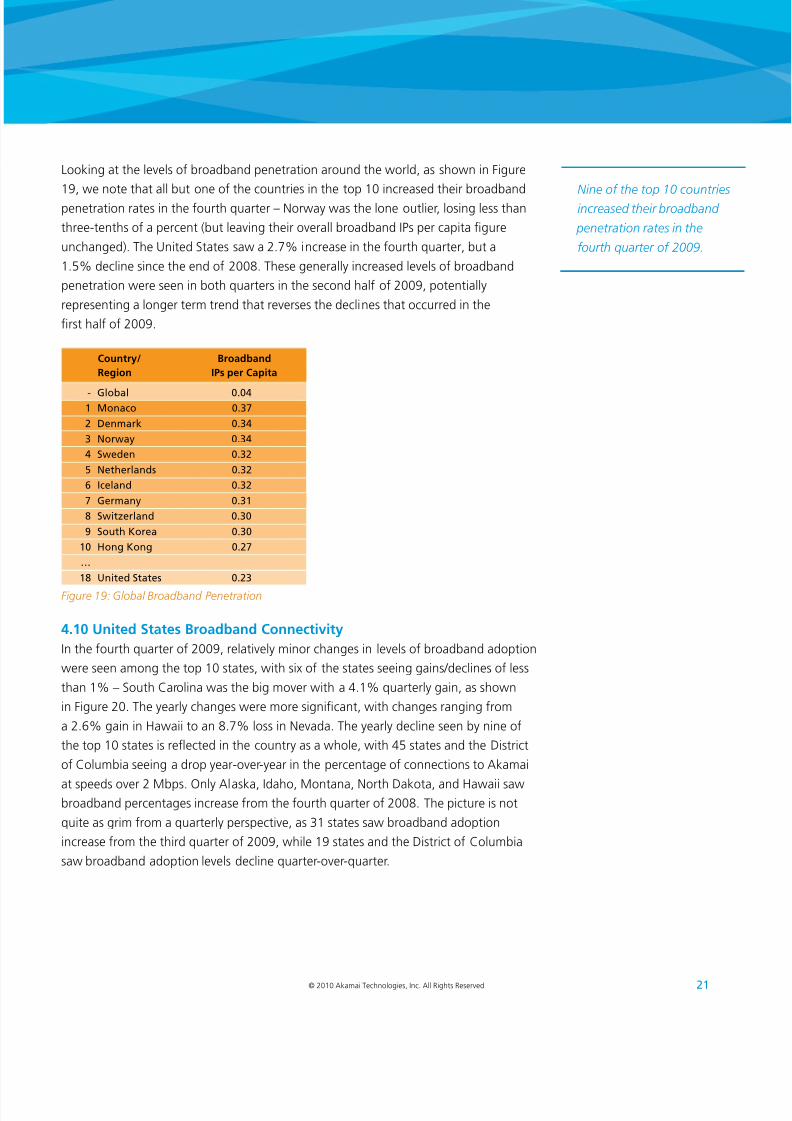
Looking at the levels of broadband penetration around the world, as shown in Figure
19, we note that all but one of the countries in the top 10 increased their broadbandpenetration rates in the fourth quarter – Norway was the lone outlier, losing less than
three-tenths of a percent (but leaving their overall broadband IPs per capita gure
unchanged). The United States saw a 2.7% increase in the fourth quarter, but a
1.5% decline since the end of 2008. These generally increased levels of broadband
penetration were seen in both quarters in the second half of 2009, potentially
representing a longer term trend that reverses the declines that occurred in the
rst half of 2009.
Figure 19: Global Broadband Penetration
Country/ Broadband
Region IPs per Capita
- G 0.041 M 0.37
2 dmk 0.34
3 nw 0.34
4 Sw 0.32
5 ns 0.32
6 I 0.32
7 Gm 0.31
8 Swiz 0.30
9 Su K 0.30
10 hg Kg 0.27
…
18 i Ss 0.23
4.10 United States Broadband Connectivity
In the fourth quarter of 2009, relatively minor changes in levels of broadband adoption
were seen among the top 10 states, with six of the states seeing gains/declines of less
than 1% – South Carolina was the big mover with a 4.1% quarterly gain, as shown
in Figure 20. The yearly changes were more signicant, with changes ranging from
a 2.6% gain in Hawaii to an 8.7% loss in Nevada. The yearly decline seen by nine of
the top 10 states is reected in the country as a whole, with 45 states and the District
of Columbia seeing a drop year-over-year in the percentage of connections to Akamai
at speeds over 2 Mbps. Only Alaska, Idaho, Montana, North Dakota, and Hawaii sawbroadband percentages increase from the fourth quarter of 2008. The picture is not
quite as grim from a quarterly perspective, as 31 states saw broadband adoption
increase from the third quarter of 2009, while 19 states and the District of Columbia
saw broadband adoption levels decline quarter-over-quarter.
Nine o the top 10 countriesincreased their broadband
penetration rates in the
ourth quarter o 2009.
8/8/2019 Akamai State Internet Q4 2009
http://slidepdf.com/reader/full/akamai-state-internet-q4-2009 24/32
22 © 2010 Akamai Technologies, Inc. All Rights Reserved
SECTION 4: Geography (continued)
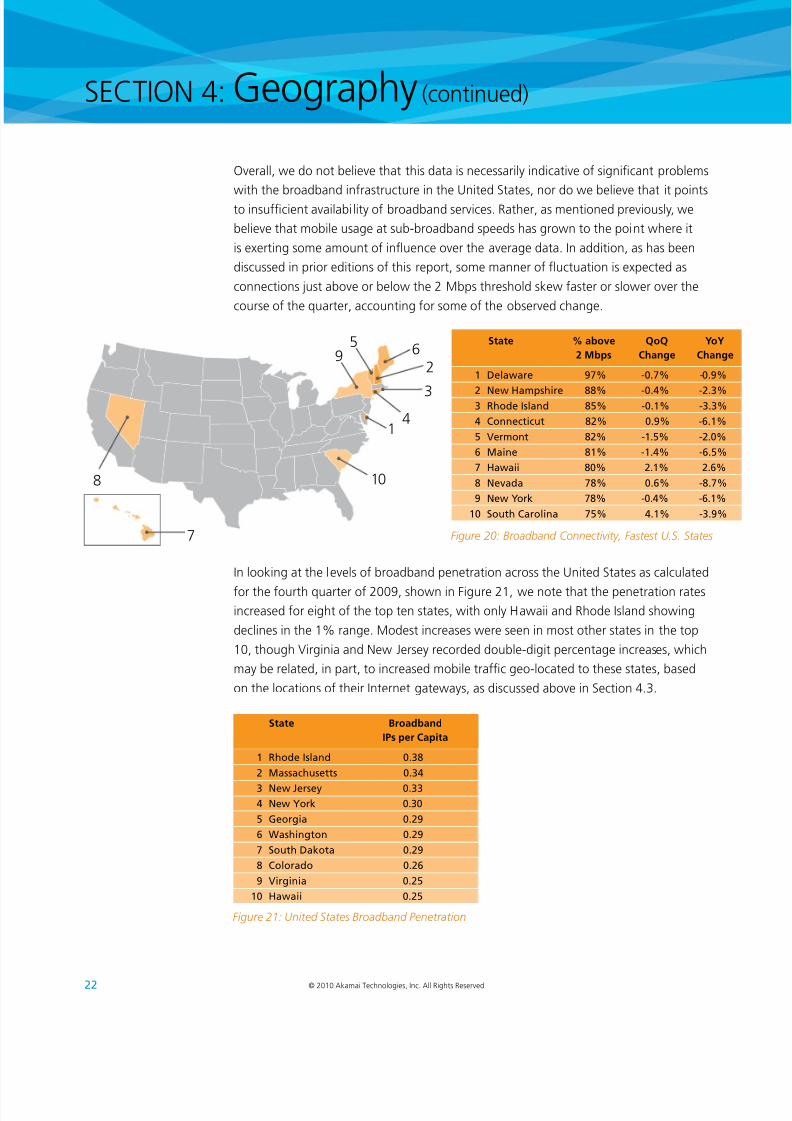
Overall, we do not believe that this data is necessarily indicative of signicant problems
with the broadband infrastructure in the United States, nor do we believe that it pointsto insufcient availability of broadband services. Rather, as mentioned previously, we
believe that mobile usage at sub-broadband speeds has grown to the point where it
is exerting some amount of inuence over the average data. In addition, as has been
discussed in prior editions of this report, some manner of uctuation is expected as
connections just above or below the 2 Mbps threshold skew faster or slower over the
course of the quarter, accounting for some of the observed change.
In looking at the levels of broadband penetration across the United States as calculated
for the fourth quarter of 2009, shown in Figure 21, we note that the penetration ratesincreased for eight of the top ten states, with only Hawaii and Rhode Island showing
declines in the 1% range. Modest increases were seen in most other states in the top
10, though Virginia and New Jersey recorded double-digit percentage increases, which
may be related, in part, to increased mobile trafc geo-located to these states, based
on the locations of their Internet gateways, as discussed above in Section 4.3.
Figure 20: Broadband Connectivity, Fastest U.S. States
State % above QoQ YoY
2 Mbps Change Change
1 dw 97% -0.7% -0.9%
2 nw hmpsi 88% -0.4% -2.3%3 r Is 85% -0.1% -3.3%
4 ciu 82% 0.9% -6.1%
5 Vm 82% -1.5% -2.0%
6 Mi 81% -1.4% -6.5%
7 hwii 80% 2.1% 2.6%
8 nv 78% 0.6% -8.7%
9 nw yk 78% -0.4% -6.1%
10 Su ci 75% 4.1% -3.9%
1
108
3
26
4
59
7
Figure 21: United States Broadband Penetration
State Broadband
IPs per Capita
1 r Is 0.38
2 Mssuss 0.34
3 nw Js 0.33
4 nw yk 0.30
5 Ggi 0.29
6 Wsig 0.29
7 Su dk 0.29
8 c 0.26
9 Vigii 0.25
10 hwii 0.25
8/8/2019 Akamai State Internet Q4 2009
http://slidepdf.com/reader/full/akamai-state-internet-q4-2009 25/32
23© 2010 Akamai Technologies, Inc. All Rights Reserved
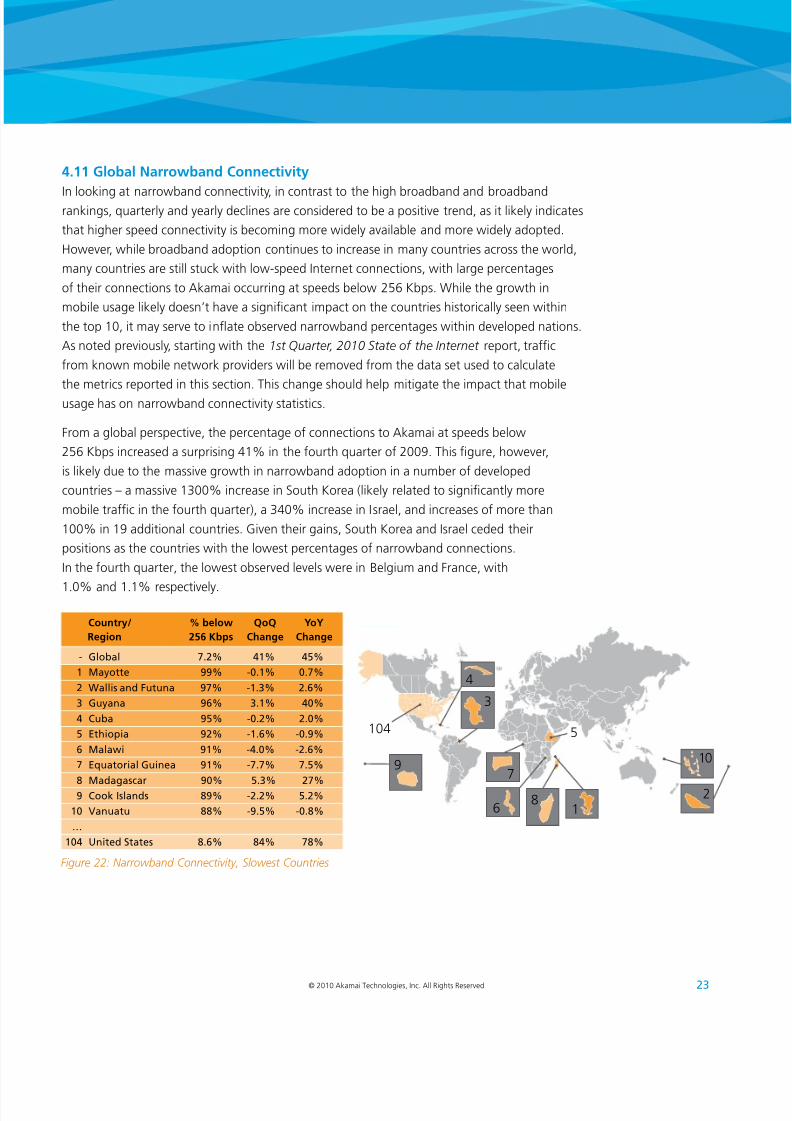
4.11 Global Narrowband Connectivity
In looking at narrowband connectivity, in contrast to the high broadband and broadbandrankings, quarterly and yearly declines are considered to be a positive trend, as it likely indicates
that higher speed connectivity is becoming more widely available and more widely adopted.
However, while broadband adoption continues to increase in many countries across the world,
many countries are still stuck with low-speed Internet connections, with large percentages
of their connections to Akamai occurring at speeds below 256 Kbps. While the growth in
mobile usage likely doesn’t have a signicant impact on the countries historically seen within
the top 10, it may serve to inate observed narrowband percentages within developed nations.
As noted previously, starting with the 1st Quarter, 2010 State o the Internet report, trafc
from known mobile network providers will be removed from the data set used to calculate
the metrics reported in this section. This change should help mitigate the impact that mobile
usage has on narrowband connectivity statistics.
From a global perspective, the percentage of connections to Akamai at speeds below
256 Kbps increased a surprising 41% in the fourth quarter of 2009. This gure, however,
is likely due to the massive growth in narrowband adoption in a number of developed
countries – a massive 1300% increase in South Korea (likely related to signicantly more
mobile trafc in the fourth quarter), a 340% increase in Israel, and increases of more than
100% in 19 additional countries. Given their gains, South Korea and Israel ceded their
positions as the countries with the lowest percentages of narrowband connections.
In the fourth quarter, the lowest observed levels were in Belgium and France, with
1.0% and 1.1% respectively.
Figure 22: Narrowband Connectivity, Slowest Countries
Country/ % below QoQ YoY
Region 256 Kbps Change Change
- G 7.2% 41% 45%
1 M 99% -0.1% 0.7%
2 Wis Fuu 97% -1.3% 2.6%
3 Gu 96% 3.1% 40%
4 cu 95% -0.2% 2.0%
5 eipi 92% -1.6% -0.9%
6 Mwi 91% -4.0% -2.6%
7 equi Gui 91% -7.7% 7.5%
8 Mgs 90% 5.3% 27%9 ck Iss 89% -2.2% 5.2%
10 Vuu 88% -9.5% -0.8%
…
104 i Ss 8.6% 84% 78%
104
1
7
4
10
26
8
9
3
5
8/8/2019 Akamai State Internet Q4 2009
http://slidepdf.com/reader/full/akamai-state-internet-q4-2009 26/32
24 © 2010 Akamai Technologies, Inc. All Rights Reserved
SECTION 4: Geography (continued)
Within the top 10 countries, as shown in Figure 22, Mayotte held essentially steady
at 99% narrowband adoption, with a tiny 0.1% decline. Declines were also seen inseven other countries in the top 10, while only two recorded quarterly increases. Similar
to the signicant growth in the global gure, the United States saw an 84% increase in
narrowband connectivity levels quarter over quarter. Consistent with prior quarters, many
of the countries with the highest percentages of connections to Akamai at speeds below
256 Kbps were either island nations or on the African continent. In addition, Akamai sees
comparatively few unique IP addresses from these countries, so their high percentage
of narrowband connections is not entirely unexpected.
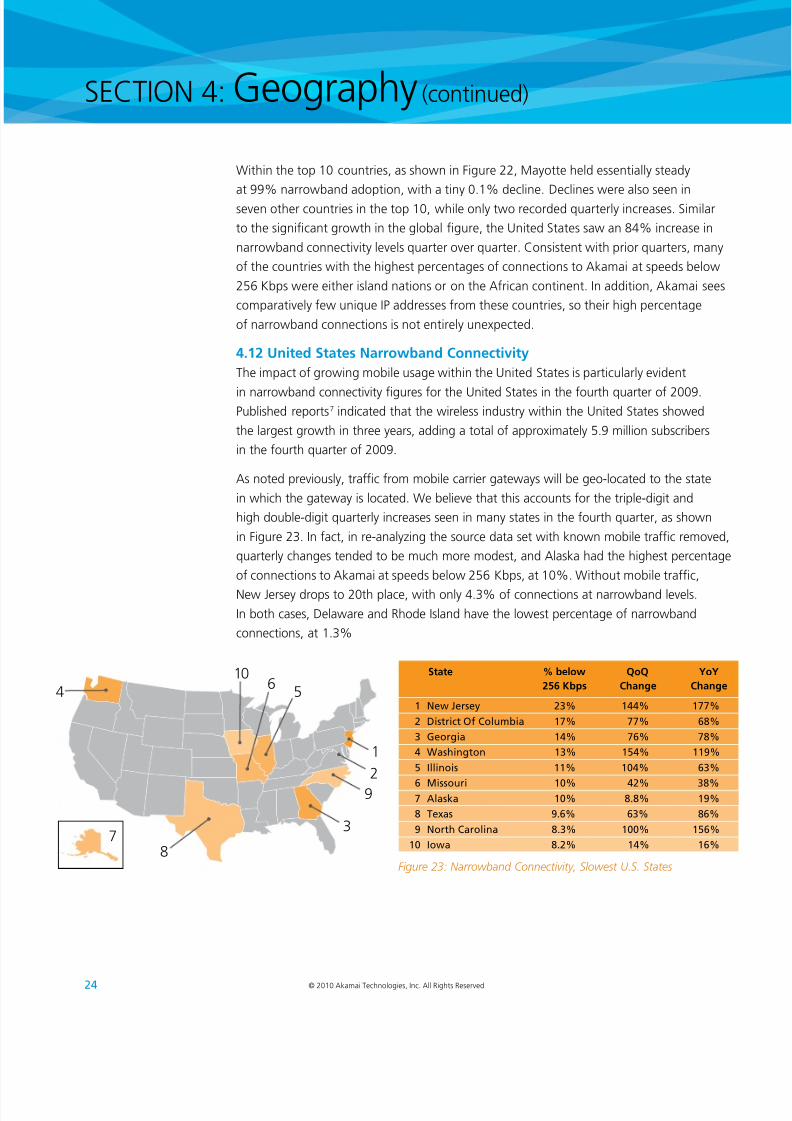
4.12 United States Narrowband Connectivity
The impact of growing mobile usage within the United States is particularly evident
in narrowband connectivity gures for the United States in the fourth quarter of 2009.Published reports7 indicated that the wireless industry within the United States showed
the largest growth in three years, adding a total of approximately 5.9 million subscribers
in the fourth quarter of 2009.
As noted previously, trafc from mobile carrier gateways will be geo-located to the state
in which the gateway is located. We believe that this accounts for the triple-digit and
high double-digit quarterly increases seen in many states in the fourth quarter, as shown
in Figure 23. In fact, in re-analyzing the source data set with known mobile trafc removed,
quarterly changes tended to be much more modest, and Alaska had the highest percentage
of connections to Akamai at speeds below 256 Kbps, at 10%. Without mobile trafc,
New Jersey drops to 20th place, with only 4.3% of connections at narrowband levels.
In both cases, Delaware and Rhode Island have the lowest percentage of narrowband
connections, at 1.3%
Figure 23: Narrowband Connectivity, Slowest U.S. States
State % below QoQ YoY
256 Kbps Change Change
1 nw Js 23% 144% 177%
2 disi of cumi 17% 77% 68%
3 Ggi 14% 76% 78%
4 Wsig 13% 154% 119%
5 Iiis 11% 104% 63%
6 Missui 10% 42% 38%7 ask 10% 8.8% 19%
8 ts 9.6% 63% 86%
9 n ci 8.3% 100% 156%
10 Iw 8.2% 14% 16%
1
4
2
9
3
87
610
5
8/8/2019 Akamai State Internet Q4 2009
http://slidepdf.com/reader/full/akamai-state-internet-q4-2009 27/32
25© 2010 Akamai Technologies, Inc. All Rights Reserved
SECTION 5: Mobile
Building on the average measured connection speed data for three of
the top mobile network providers in the United States published in the 3rd Quarter, 2009 State o the Internet report, the data presented in this edition
of the report is more global in nature. Average measured connection speeds
on mobile network providers around the world for the fourth quarter
of 2009 are shown, subject to the following constraints:
• Similar to Section 4, a minimum of 1,000
unique IP addresses connecting to Akamai
in the fourth quarter was required to be
considered for inclusion in the list.
• In countries where Akamai had data formultiple network providers, only the top
three are listed, based on unique IP count.
• The names of specic mobile network
providers have been anonymized, and
providers will be identied by a unique ID.
• Data is included only for networks where
Akamai believes that the entire Autonomous
System (AS) is mobile – that is, if a network
provider mixes trafc from xed/wireline
(DSL, etc.) connections with trafc from
mobile connections on a single network
identier, that AS was not included in the
source data set.
• Akamai’s EdgeScape database was used
for the continental assignments.
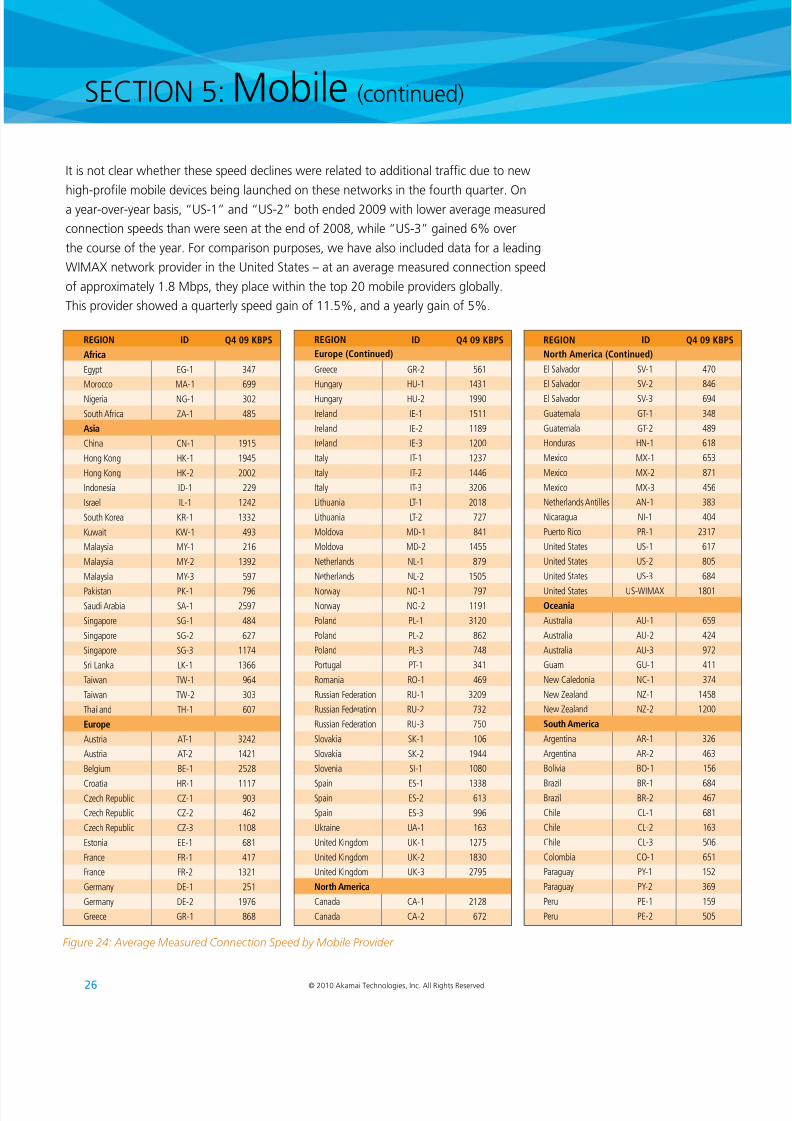
In examining the data shown in Figure 24, we see that there is a fairly wide range in average
measured connection speeds, ranging from 3.2 Mbps on an Austrian mobile provider, down
to 106 Kbps on a mobile provider in Slovakia. It is important to note that connection speeds
on mobile networks can vary based on a number of factors, including device distance
from mobile towers, device design (internal vs. external antennae), and ground speed
of the devices (use in a moving vehicle vs. stationary use), as well as wireless data standards
used (LTE, HSDPA, EV-DO, etc.).8 Akamai has not cross-referenced the data standards used
by the listed providers against the measured speeds.
Of the 109 mobile providers listed in Figure 24, over 40 had average measured connection
speeds of over 1 Mbps in the fourth quarter, while 11 had broadband-level connectivity
(connections to Akamai at speeds of 2 Mbps or greater). It is also interesting to observe
the variances among multiple providers in selected countries – in Malaysia, the gap between
the two listed providers is over 1 Mbps, while in Italy, there is a 2 Mbps gap between thefastest and slowest listed providers. (Though at an average measured connection speed
of over 1 Mbps, mobile provider “IT-1” is still faster than many other mobile providers
around the world.)
Looking at the results from the three mobile providers in the United States that were
included in last quarter’s report, we nd that quarterly changes were mixed – mobile
providers “US-1” and “US-3” saw average speeds decline 12% and 8% respectively,
while the average speed on mobile provider “US-2” increased by just over 7%
quarter-over-quarter.
8/8/2019 Akamai State Internet Q4 2009
http://slidepdf.com/reader/full/akamai-state-internet-q4-2009 28/32
26 © 2010 Akamai Technologies, Inc. All Rights Reserved
SECTION 5: Mobile (continued)
It is not clear whether these speed declines were related to additional trafc due to new
high-prole mobile devices being launched on these networks in the fourth quarter. Ona year-over-year basis, “US-1” and “US-2” both ended 2009 with lower average measured
connection speeds than were seen at the end of 2008, while “US-3” gained 6% over
the course of the year. For comparison purposes, we have also included data for a leading
WIMAX network provider in the United States – at an average measured connection speed
of approximately 1.8 Mbps, they place within the top 20 mobile providers globally.
This provider showed a quarterly speed gain of 11.5%, and a yearly gain of 5%.
Figure 24: Average Measured Connection Speed by Mobile Provider
Q409KBPSIDREGION
Africa
Egypt EG-1 347
Morocco MA-1 699
Nigeria NG-1 302
SouthAfrica ZA-1 485
Asia
China CN-1 1915
HongKong HK-1 1945
HongKong HK-2 2002
Indonesia ID-1 229
Israel IL-1 1242
SouthKorea KR-1 1332
Kuwait KW-1 493
Malaysia MY-1 216
Malaysia MY-2 1392
Malaysia MY-3 597
Pakistan PK-1 796
SaudiArabia SA-1 2597
Singapore SG-1 484
Singapore SG-2 627
Singapore SG-3 1174
SriLanka LK-1 1366
Taiwan TW-1 964
Taiwan TW-2 303
Thailand TH-1 607
Europe
Austria AT-1 3242
Austria AT-2 1421
Belgium BE-1 2528
Croatia HR-1 1117CzechRepublic CZ-1 903
CzechRepublic CZ-2 462
CzechRepublic CZ-3 1108
Estonia EE-1 681
France FR-1 417
France FR-2 1321
Germany DE-1 251
Germany DE-2 1976
Greece GR-1 868
Q409KBPSID
Greece GR-2 561
Hungary HU-1 1431
Hungary HU-2 1990
Ireland IE-1 1511
Ireland IE-2 1189
Ireland IE-3 1200
Italy IT-1 1237
Italy IT-2 1446
Italy IT-3 3206
Lithuania LT-1 2018
Lithuania LT-2 727
Moldova MD-1 841
Moldova MD-2 1455
Netherlands NL-1 879
Netherlands NL-2 1505
Norway NO-1 797
Norway NO-2 1191
Poland PL-1 3120
Poland PL-2 862
Poland PL-3 748
Portugal PT-1 341
Romania RO-1 469
RussianFederation RU-1 3209
RussianFederation RU-2 732
RussianFederation RU-3 750
Slovakia SK-1 106
Slovakia SK-2 1944
Slovenia SI-1 1080
Spain ES-1 1338Spain ES-2 613
Spain ES-3 996
Ukraine UA-1 163
UnitedKingdom UK-1 1275
UnitedKingdom UK-2 1830
UnitedKingdom UK-3 2795
NorthAmerica
Canada CA-1 2128
Canada CA-2 672
REGION
Europe(Continued)
Q409KBPSID
ElSalvador SV-1 470
ElSalvador SV-2 846
ElSalvador SV-3 694
Guatemala GT-1 348
Guatemala GT-2 489
Honduras HN-1 618
Mexico MX-1 653
Mexico MX-2 871
Mexico MX-3 456
NetherlandsAntilles AN-1 383
Nicaragua NI-1 404
PuertoRico PR-1 2317
UnitedStates US-1 617
UnitedStates US-2 805
UnitedStates US-3 684
UnitedStates US-WIMAX 1801
Oceania
Australia AU-1 659
Australia AU-2 424
Australia AU-3 972
Guam GU-1 411
NewCaledonia NC-1 374
NewZealand NZ-1 1458
NewZealand NZ-2 1200
SouthAmerica
Argentina AR-1 326
Argentina AR-2 463
Bolivia BO-1 156
Brazil BR-1 684Brazil BR-2 467
Chile CL-1 681
Chile CL-2 163
Chile CL-3 506
Colombia CO-1 651
Paraguay PY-1 152
Paraguay PY-2 369
Peru PE-1 159
Peru PE-2 505
REGION
NorthAmerica(Continued)
8/8/2019 Akamai State Internet Q4 2009
http://slidepdf.com/reader/full/akamai-state-internet-q4-2009 29/32
27© 2010 Akamai Technologies, Inc. All Rights Reserved
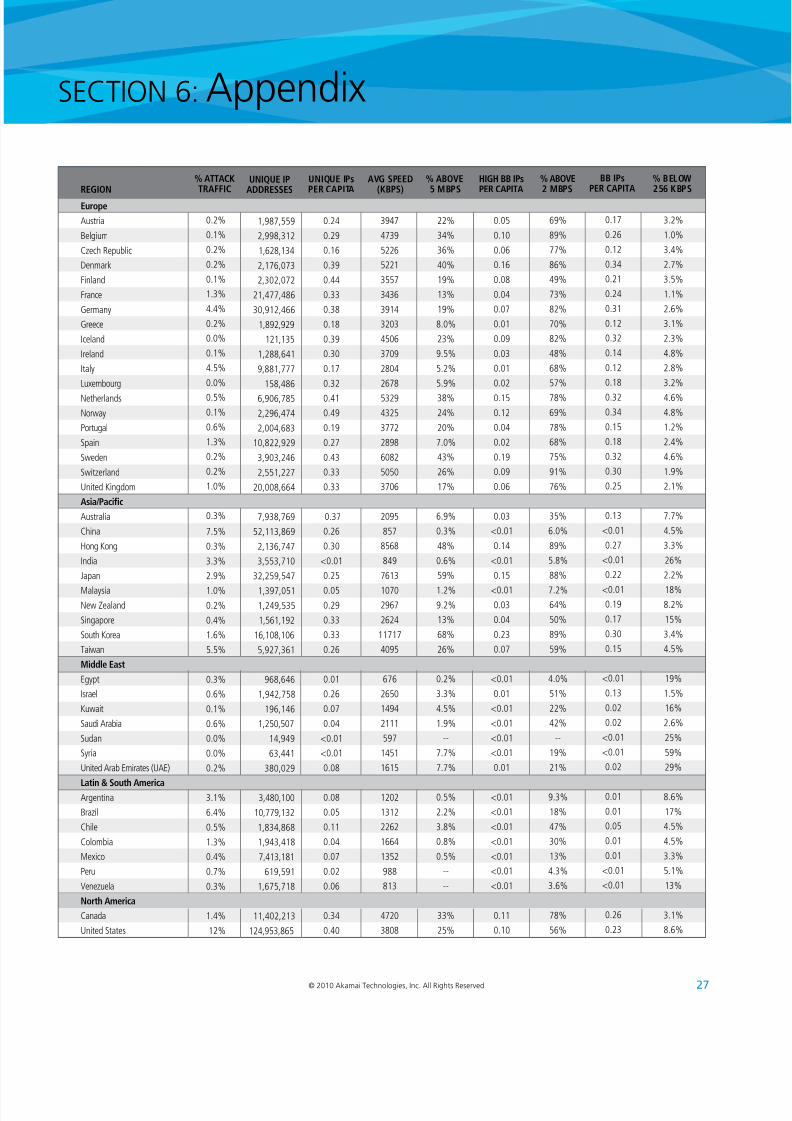
SECTION 6: Appendix
REGION
Europe
Austria
Belgium
CzechRepublic
Denmark
Finland
France
Germany
Greece
Iceland
Ireland
Italy
Luxembourg
Netherlands
Norway
Portugal
Spain
Sweden
Switzerland
UnitedKingdom
Asia/Pacic
Australia
China
HongKong
India
Japan
MalaysiaNewZealand
Singapore
SouthKorea
Taiwan
MiddleEast
Egypt
Israel
Kuwait
SaudiArabia
Sudan
Syria
UnitedArabEmirates(UAE)
Latin&SouthAmericaArgentina
Brazil
Chile
Colombia
Mexico
Peru
Venezuela
NorthAmerica
Canada
UnitedStates
UNIQUEIPADDRESSES
1,987,559
2,998,312
1,628,134
2,176,073
2,302,072
21,477,486
30,912,466
1,892,929
121,135
1,288,641
9,881,777
158,486
6,906,785
2,296,474
2,004,683
10,822,929
3,903,246
2,551,227
20,008,664
7,938,769
52,113,869
2,136,747
3,553,710
32,259,547
1,397,051
1,249,535
1,561,192
16,108,106
5,927,361
968,646
1,942,758
196,146
1,250,507
14,949
63,441
380,029
3,480,100
10,779,132
1,834,868
1,943,418
7,413,181
619,591
1,675,718
11,402,213
124,953,865
UNIQUEIPs PERCAPITA
0.24
0.29
0.16
0.39
0.44
0.33
0.38
0.18
0.39
0.30
0.17
0.32
0.41
0.49
0.19
0.27
0.43
0.33
0.33
0.37
0.26
0.30
<0.01
0.25
0.050.29
0.33
0.33
0.26
0.01
0.26
0.07
0.04
<0.01
<0.01
0.08
0.08
0.05
0.11
0.04
0.07
0.02
0.06
0.34
0.40
AVGSPEED (KBPS)
3947
4739
5226
5221
3557
3436
3914
3203
4506
3709
2804
2678
5329
4325
3772
2898
6082
5050
3706
2095
857
8568
849
7613
10702967
2624
11717
4095
676
2650
1494
2111
597
1451
1615
1202
1312
2262
1664
1352
988
813
4720
3808
%ABOVE 5MBPS
22%
34%
36%
40%
19%
13%
19%
8.0%
23%
9.5%
5.2%
5.9%
38%
24%
20%
7.0%
43%
26%
17%
6.9%
0.3%
48%
0.6%
59%
1.2%9.2%
13%
68%
26%
0.2%
3.3%
4.5%
1.9%
--
7.7%
7.7%
0.5%
2.2%
3.8%
0.8%
0.5%
--
--
33%
25%
HIGHBBIPsPERCAPITA
0.05
0.10
0.06
0.16
0.08
0.04
0.07
0.01
0.09
0.03
0.01
0.02
0.15
0.12
0.04
0.02
0.19
0.09
0.06
0.03
<0.01
0.14
<0.01
0.15
<0.010.03
0.04
0.23
0.07
<0.01
0.01
<0.01
<0.01
<0.01
<0.01
0.01
<0.01
<0.01
<0.01
<0.01
<0.01
<0.01
<0.01
0.11
0.10
%ABOVE 2MBPS
69%
89%
77%
86%
49%
73%
82%
70%
82%
48%
68%
57%
78%
69%
78%
68%
75%
91%
76%
35%
6.0%
89%
5.8%
88%
7.2%64%
50%
89%
59%
4.0%
51%
22%
42%
--
19%
21%
9.3%
18%
47%
30%
13%
4.3%
3.6%
78%
56%
BBIPsPERCAPITA
0.17
0.26
0.12
0.34
0.21
0.24
0.31
0.12
0.32
0.14
0.12
0.18
0.32
0.34
0.15
0.18
0.32
0.30
0.25
0.13
<0.01
0.27
<0.01
0.22
<0.010.19
0.17
0.30
0.15
<0.01
0.13
0.02
0.02
<0.01
<0.01
0.02
0.01
0.01
0.05
0.01
0.01
<0.01
<0.01
0.26
0.23
%BELOW 256KBPS
3.2%
1.0%
3.4%
2.7%
3.5%
1.1%
2.6%
3.1%
2.3%
4.8%
2.8%
3.2%
4.6%
4.8%
1.2%
2.4%
4.6%
1.9%
2.1%
7.7%
4.5%
3.3%
26%
2.2%
18%8.2%
15%
3.4%
4.5%
19%
1.5%
16%
2.6%
25%
59%
29%
8.6%
17%
4.5%
4.5%
3.3%
5.1%
13%
3.1%
8.6%
0.2%
0.1%
0.2%
0.2%
0.1%
1.3%
4.4%
0.2%
0.0%
0.1%
4.5%
0.0%
0.5%
0.1%
0.6%
1.3%
0.2%
0.2%
1.0%
0.3%
7.5%
0.3%
3.3%
2.9%
1.0%
0.2%
0.4%
1.6%
5.5%
0.3%
0.6%
0.1%
0.6%
0.0%
0.0%
0.2%
3.1%
6.4%
0.5%
1.3%
0.4%
0.7%
0.3%
1.4%
12%
%ATTACKTRAFFIC
8/8/2019 Akamai State Internet Q4 2009
http://slidepdf.com/reader/full/akamai-state-internet-q4-2009 30/32
28 © 2010 Akamai Technologies, Inc. All Rights Reserved
1 http://isc.sans.org/port.html?port=4452 http://www.census.gov/ipc/www/idb/
3 http://www.census.gov/popest/states/states.html4 http://www.akamai.com/dl/whitepapers/How_will_the_internet_scale.pdf5 http://www.blu-ray.com/faq/ 6 http://iphoneinkorea.com/iphone-in-korea-launch-party-2009/ 7 http://www.electronista.com/articles/10/03/04/59.million.subscribers.added.in.q4/ 8 http://en.wikipedia.org/wiki/Comparison_of_wireless_data_standards
SECTION 7: Endnotes
8/8/2019 Akamai State Internet Q4 2009
http://slidepdf.com/reader/full/akamai-state-internet-q4-2009 31/32
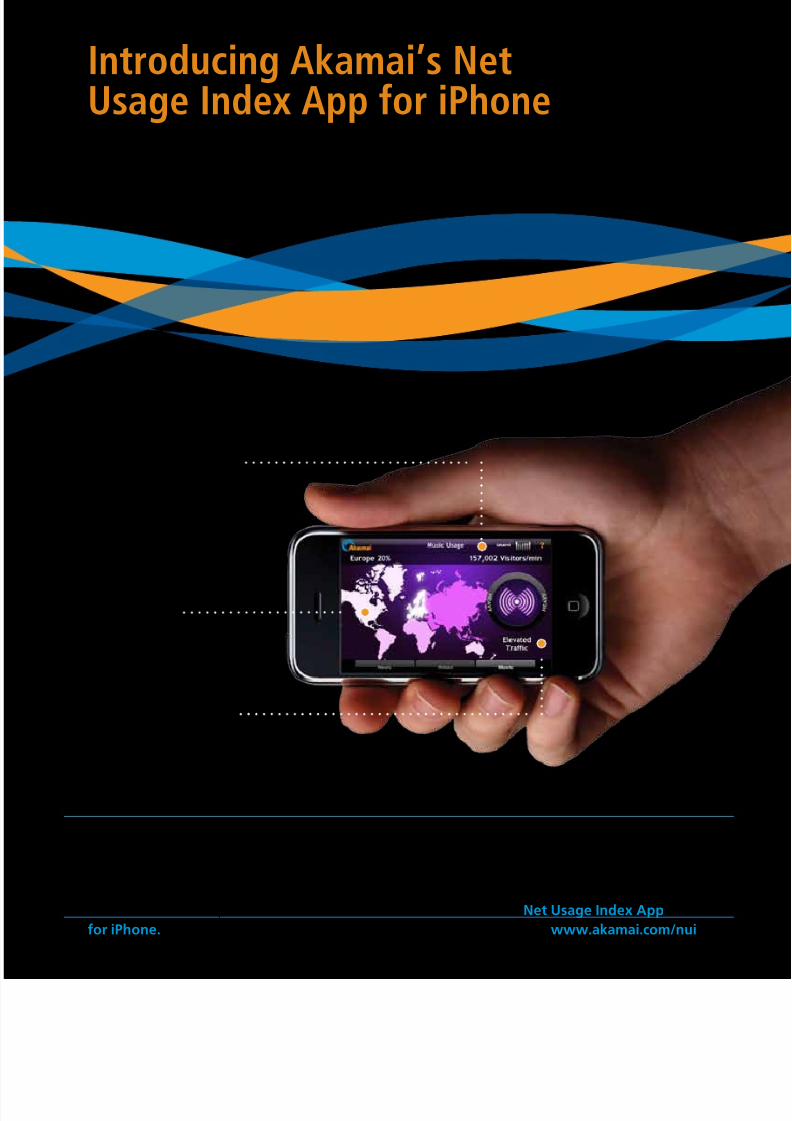
IntroducingAkamai’sNetUsageIndexAppforiPhone
Akamai’s Net Usage Index enables users to monitor the world’s online music, news and retail
consumption habits 24 x 7, providing real-time insight into where consumers are spending their time
on the Web. This unique view into Web trafc is available with our new Net Usage Index App
or iPhone. To learn more and download Net Usage Index for iPhone, go to www.akamai.com/nui
Learn how many visitors
per minute are online
See current trafc levels
Monitor trafc
by geography
TracktheconsumptionofNews,MusicandRetailcontentrightfromyouriPhone–inrealtime!
8/8/2019 Akamai State Internet Q4 2009
http://slidepdf.com/reader/full/akamai-state-internet-q4-2009 32/32
Akamai® provides market-leading managed services for powering rich media, dynamic
transactions, and enterprise applications online. Having pioneered the content delivery
market one decade ago, Akamai’s services have been adopted by the world’s most recognized
brands across diverse industries. The alternative to centralized Web infrastructure, Akamai’s
global network of tens of thousands of distributed servers provides the scale, reliability, insight
and performance for businesses to succeed online. Akamai has transformed the Internet into
a more viable place to inform, entertain, advertise, interact, and collaborate. To experience
The Akamai Difference, visit www.akamai.com.
Akamai | Powering A Better Internet™
For more information, visit www.akamai.com
The Akamai Difference
EDITOR: David Belson
CONTRIBUTOR: Jon Thompson
CONTRIBUTOR: Patrick Gilmore
CONTRIBUTOR: Alloysius GideonEXECUTIVE EDITOR: Brad Rinklin
EXECUTIVE EDITOR: Tom Leighton
Please send comments, questions, and corrections to [email protected]
Follow @akamai and @akamai_soti on
Acknowledgements
©2010 Akamai Technologies, Inc. All Rights Reserved. Reproduction
in whole or in part in any form or medium without express written
permission is prohibited. Akamai and the Akamai wave logo
are registered trademarks of Akamai Technologies, Inc. Other
trademarks used herein may be owned by other companies and
International Ofces
Unterfoehring, Germany
Paris, France
Milan, Italy
London, England
Madrid, Spain
Bangalore, India
Sydney, Australia
Beijing, China
Tokyo, Japan
Seoul, Korea
Akamai Technologies, Inc.
U.S. Headquarters
8 Cambridge Center
Cambridge, MA 02142
Tel 617.444.3000
Fax 617.444.3001
U.S. toll-free 877.4AKAMAI