all about infographics
DESCRIPTION
TRANSCRIPT
Infographics
교육/홍보팀 정희경
All about
인포그래픽이란?
Infographics
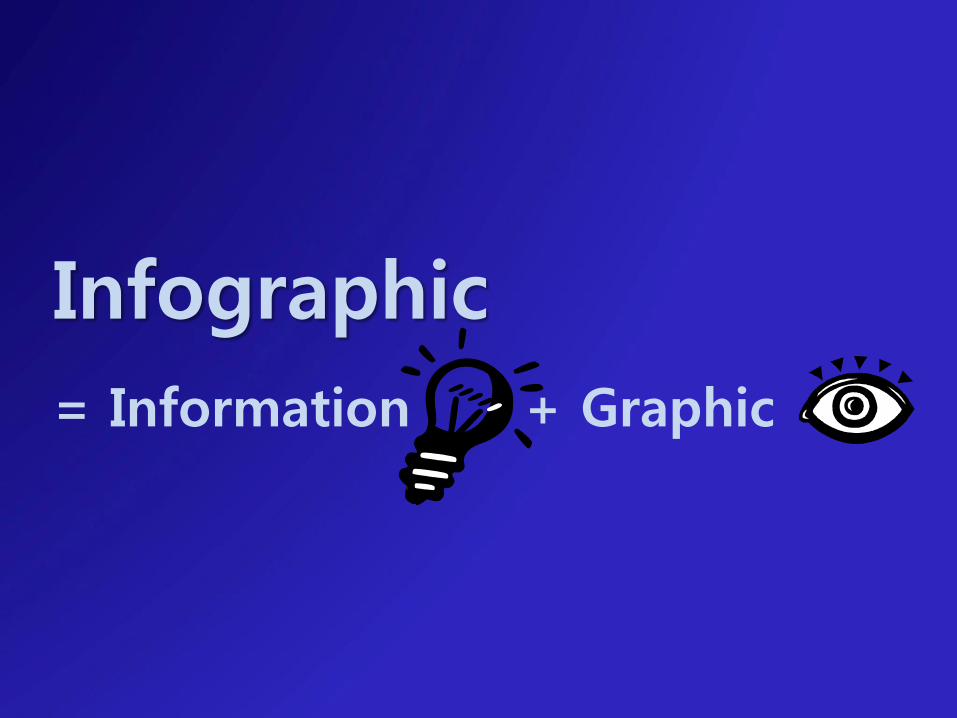
Infographic
= Information + Graphic
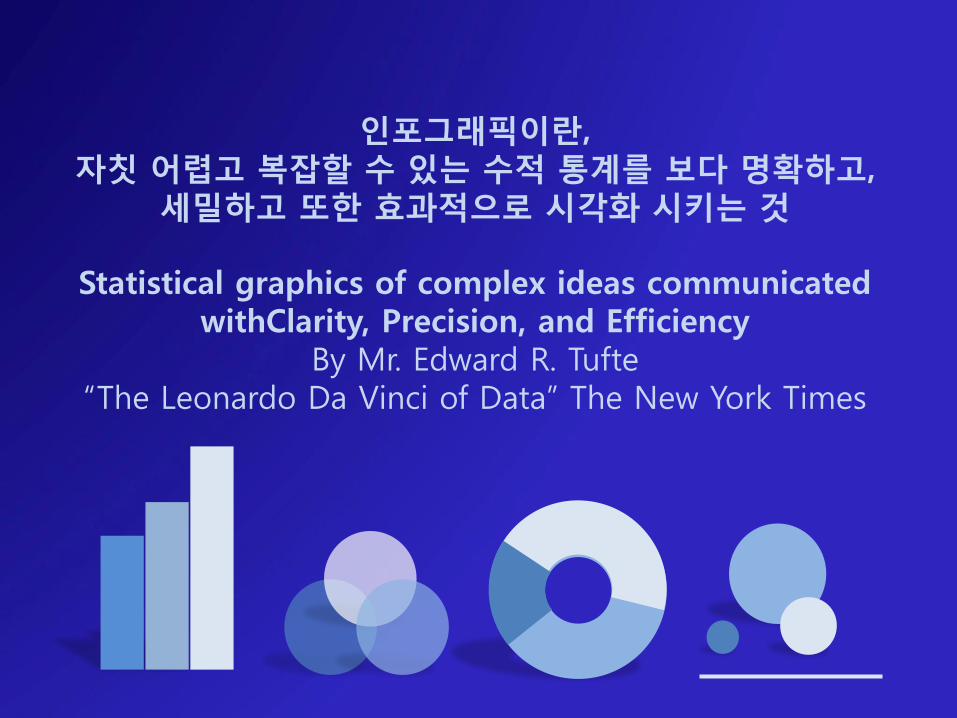
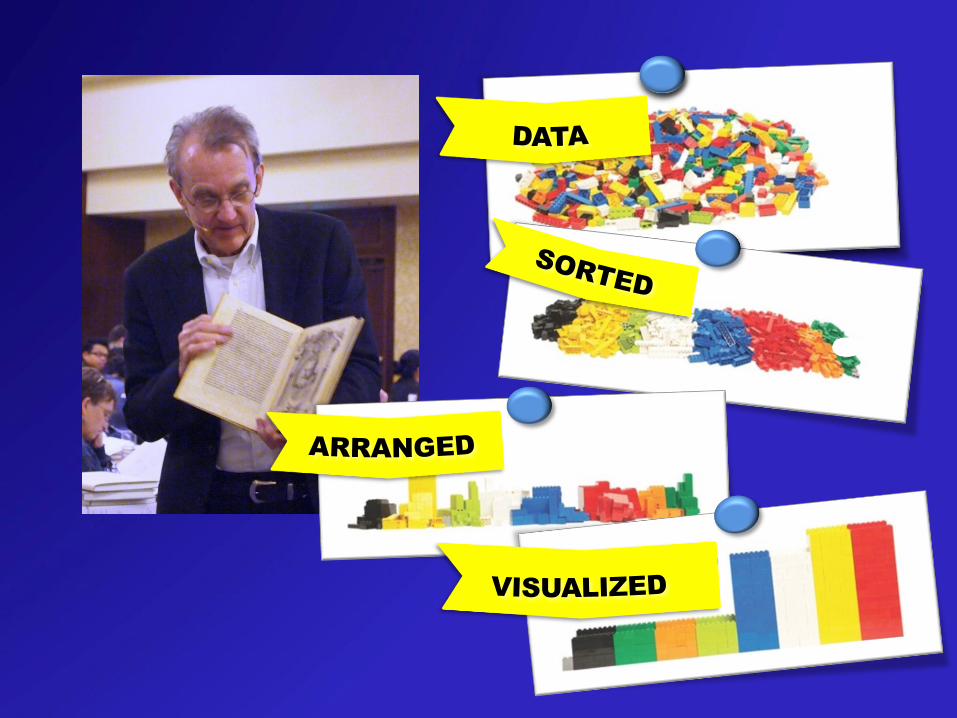
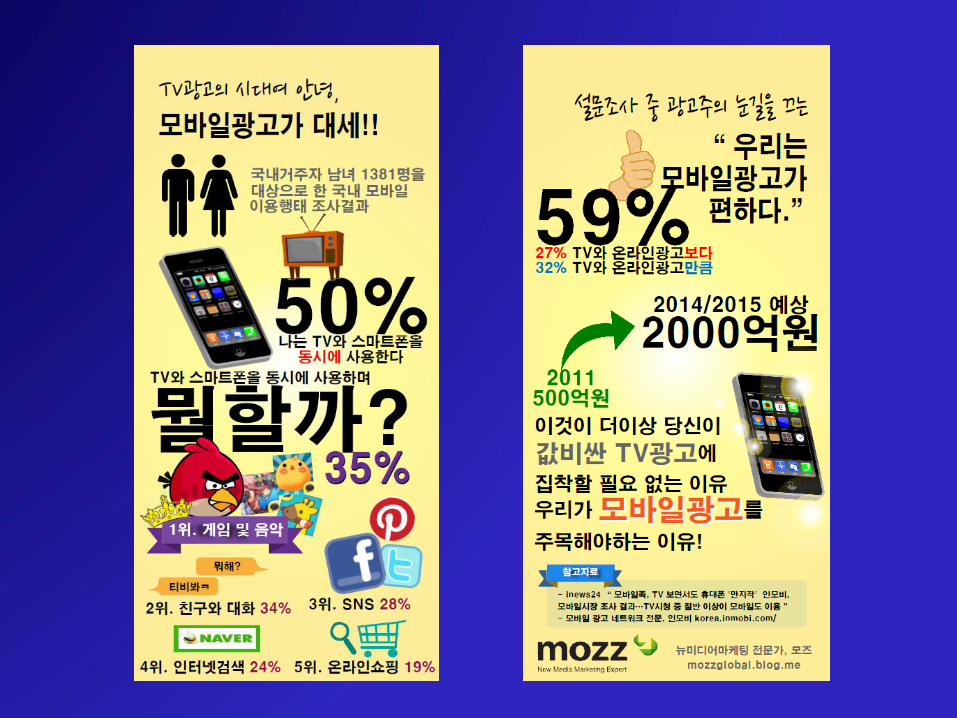
인포그래픽이란,자칫 어렵고 복잡할 수 있는 수적 통계를 보다 명확하고,
세밀하고 또한 효과적으로 시각화 시키는 것
Statistical graphics of complex ideas communicated withClarity, Precision, and Efficiency
By Mr. Edward R. Tufte“The Leonardo Da Vinci of Data” The New York Times
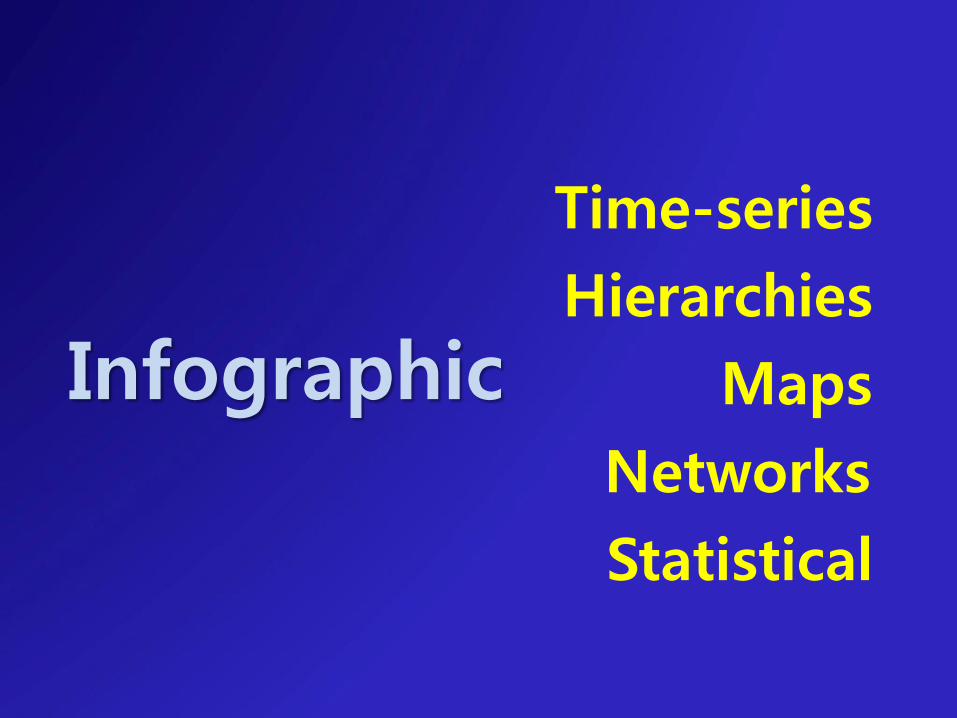
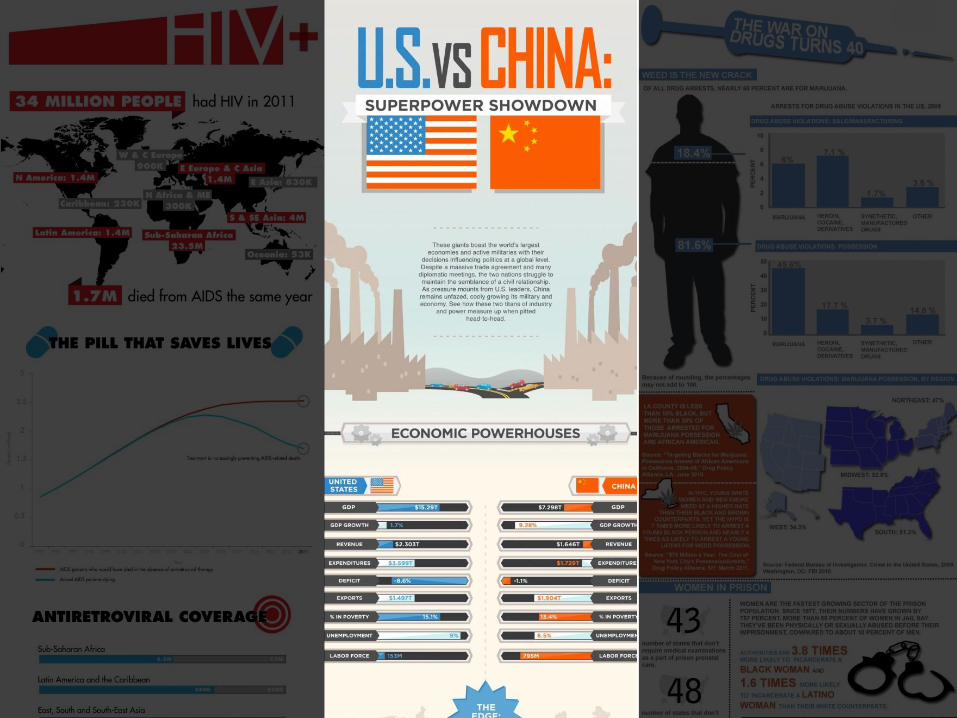
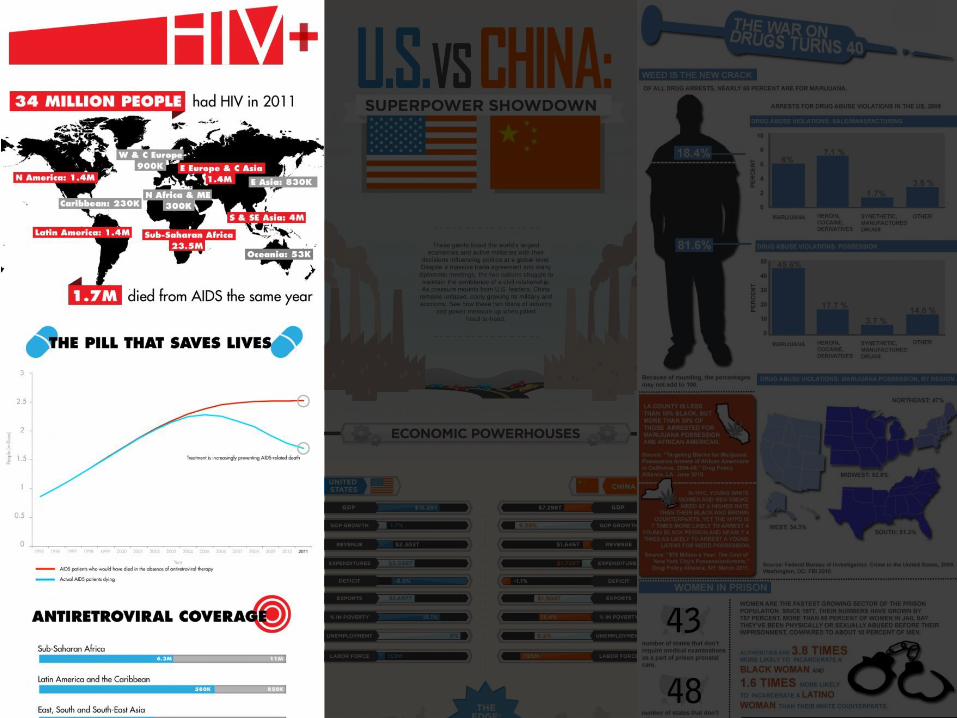
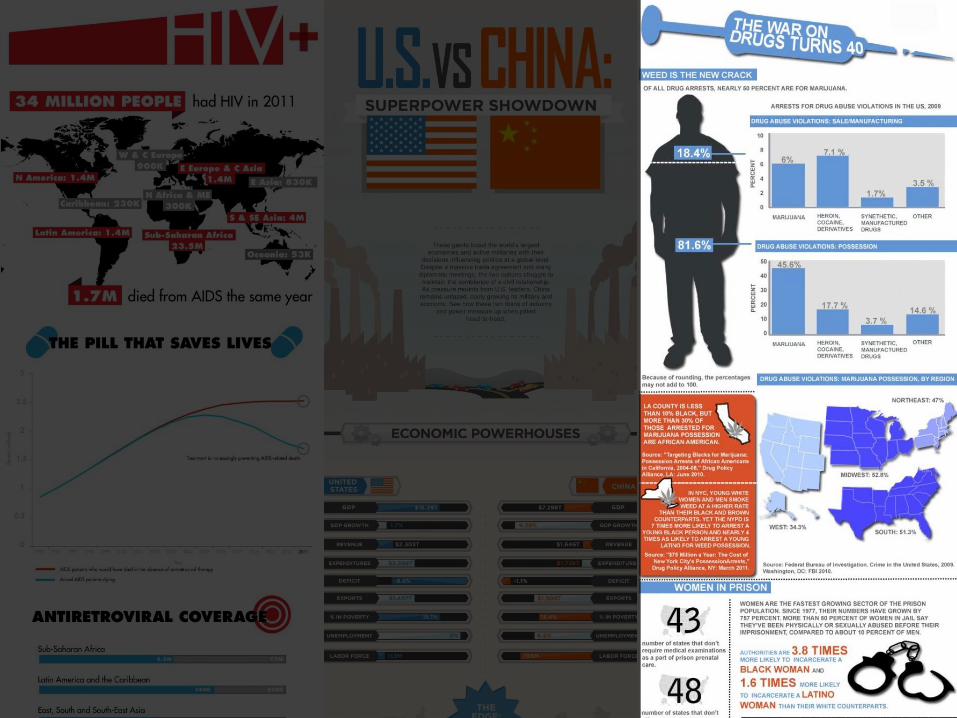
Infographic
Time-series
Statistical
Maps
Hierarchies
Networks
왜 인포그래픽에 주목해야하는가?
Infographics
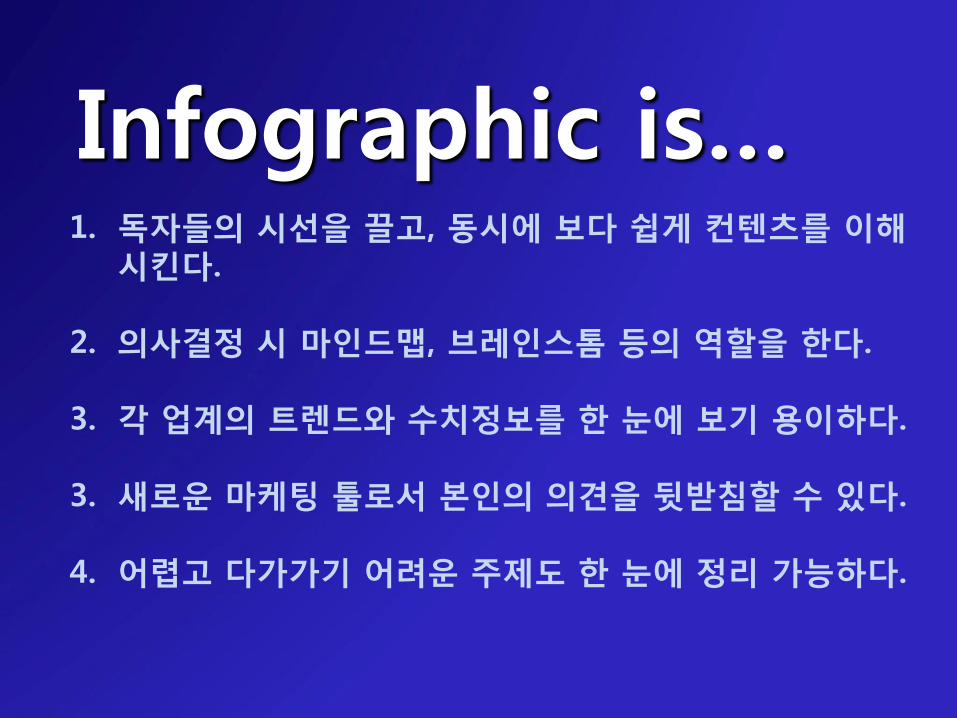
1. 독자들의 시선을 끌고, 동시에 보다 쉽게 컨텐츠를 이해시킨다.
2. 의사결정 시 마인드맵, 브레인스톰 등의 역할을 한다.
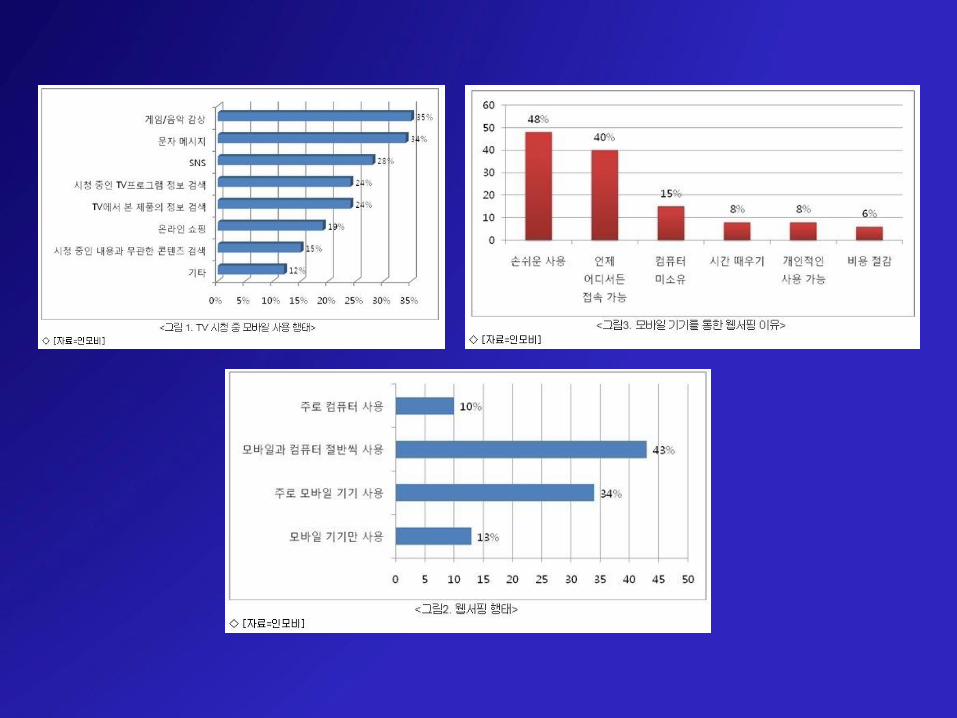
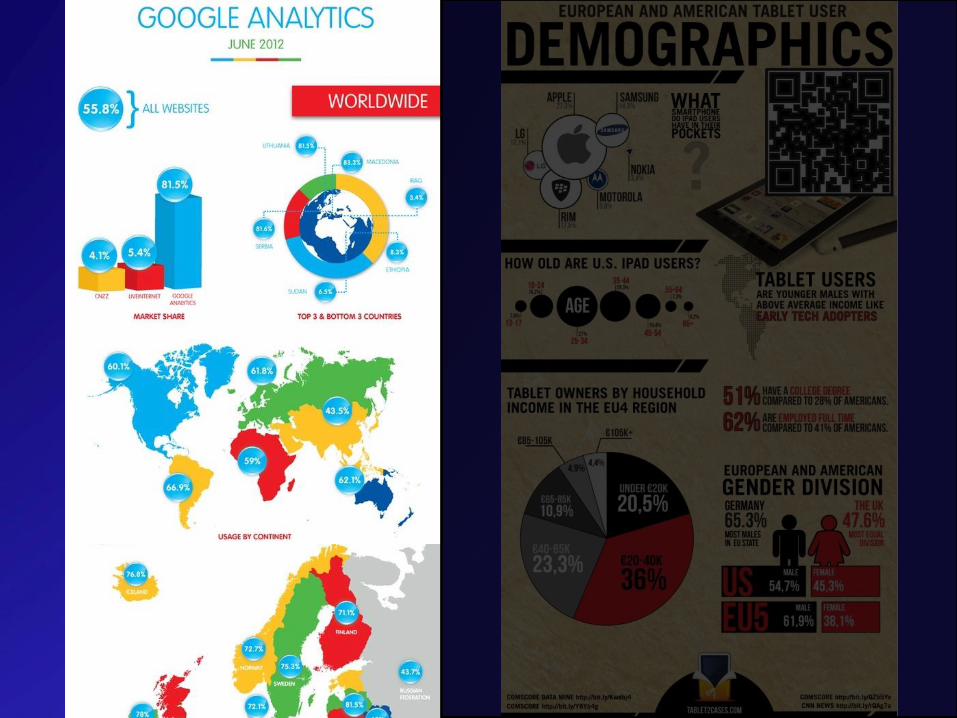
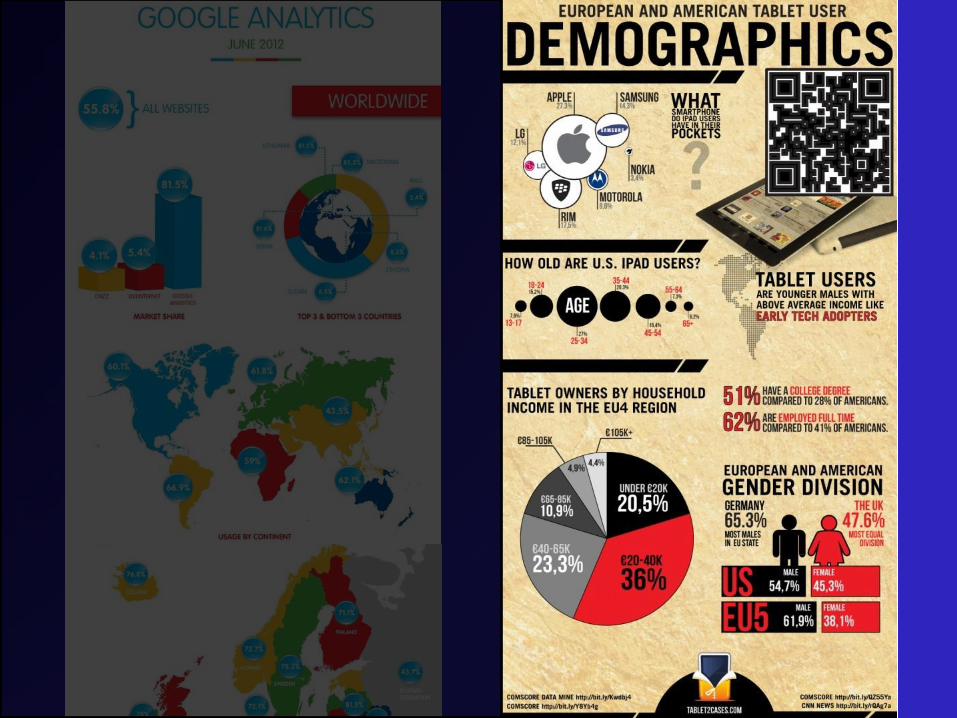
3. 각 업계의 트렌드와 수치정보를 한 눈에 보기 용이하다.
3. 새로운 마케팅 툴로서 본인의 의견을 뒷받침할 수 있다.
4. 어렵고 다가가기 어려운 주제도 한 눈에 정리 가능하다.
Infographic is…
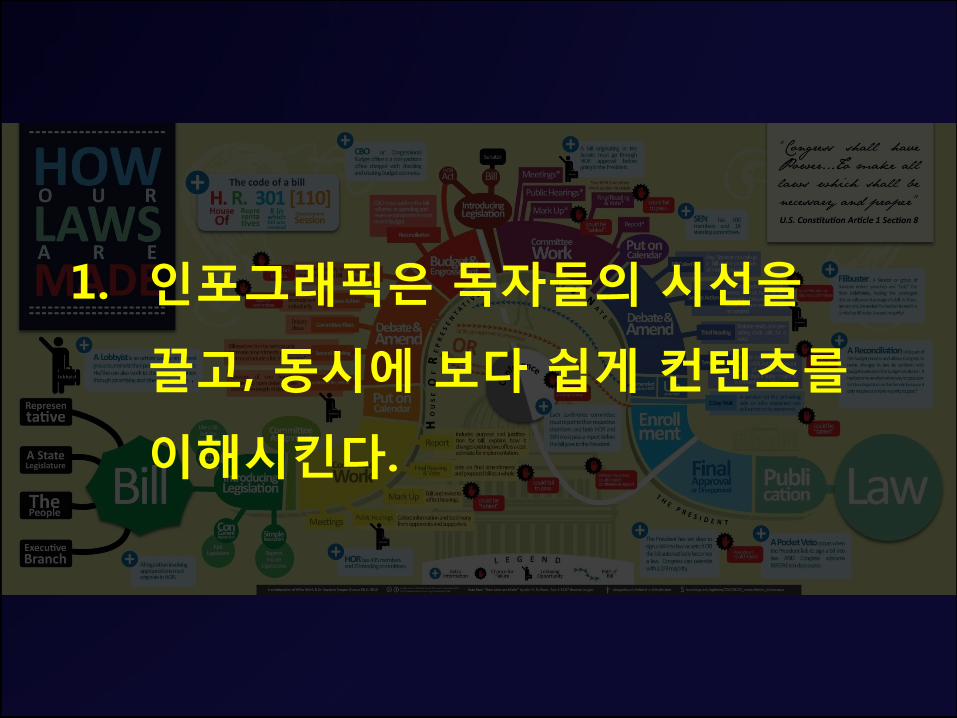
1. 인포그래픽은 독자들의 시선을
끌고, 동시에 보다 쉽게 컨텐츠를
이해시킨다.
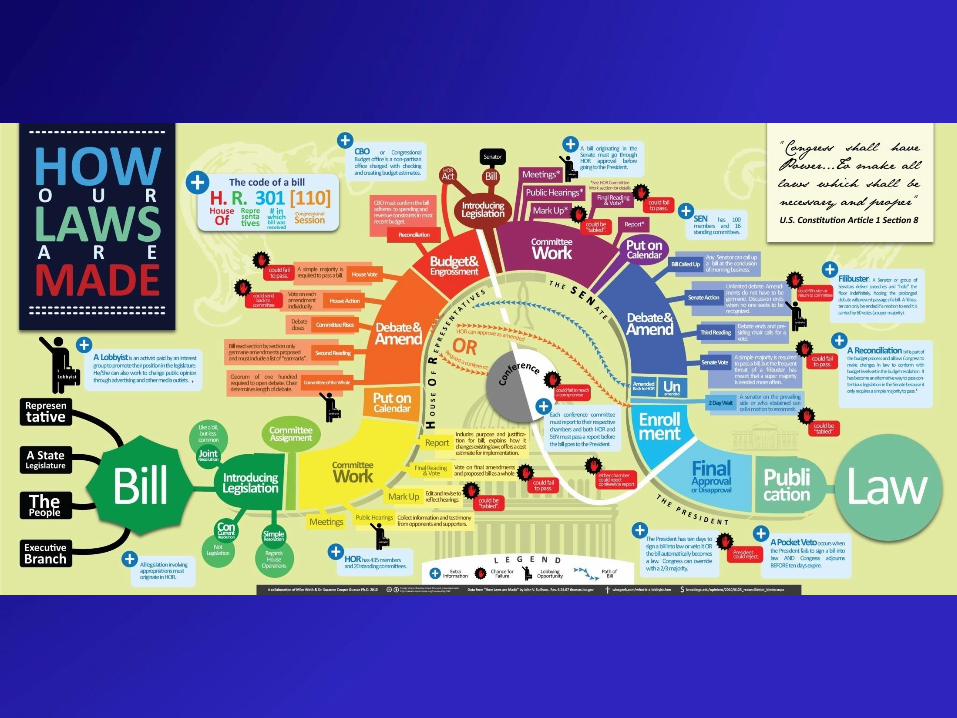
독자들의 시선을 끌고, 동시에 보다 쉽게이해시킨다.
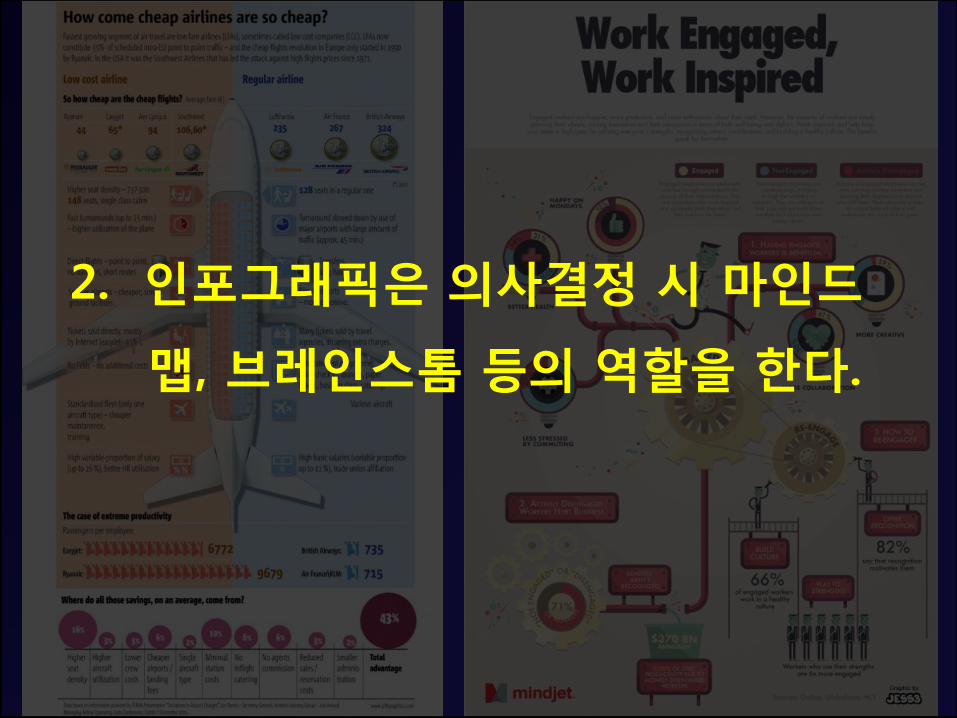
2. 인포그래픽은 의사결정 시 마인드
맵, 브레인스톰 등의 역할을 한다.
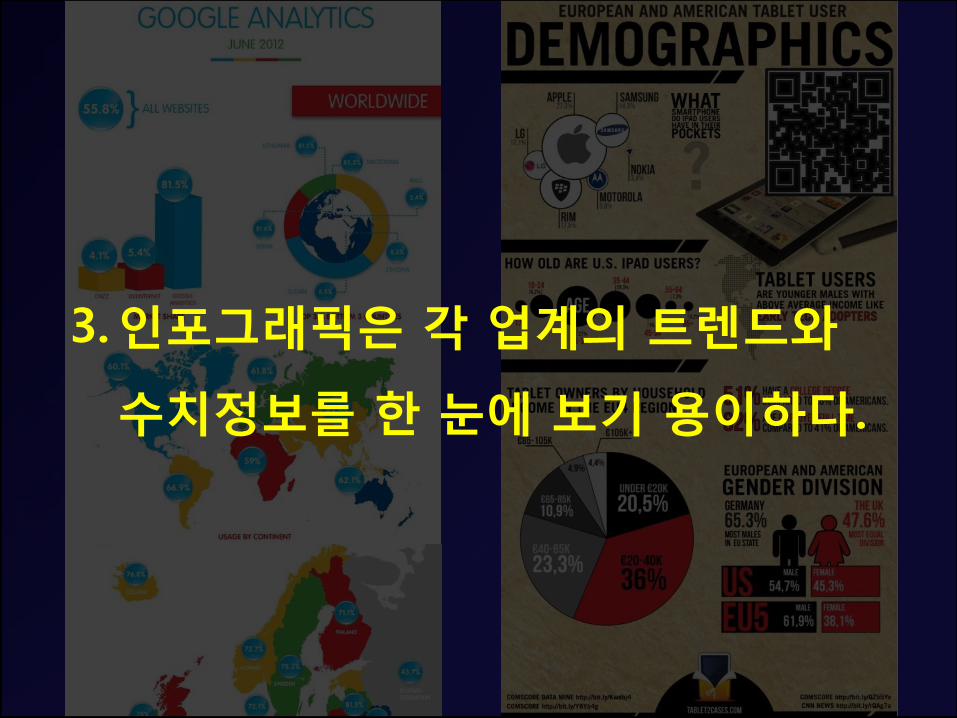
3.인포그래픽은 각 업계의 트렌드와
수치정보를 한 눈에 보기 용이하다.
4. 새로운 마케팅 툴로서 본인의 의견을 뒷받침할 수 있다.
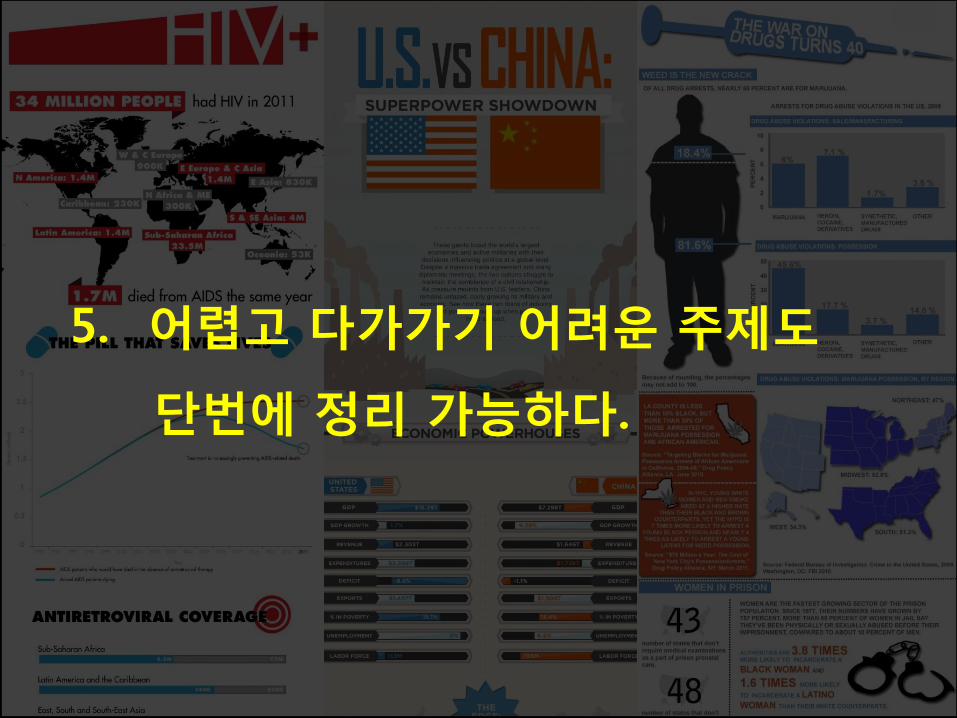
5. 어렵고 다가가기 어려운 주제도
단번에 정리 가능하다.
5.
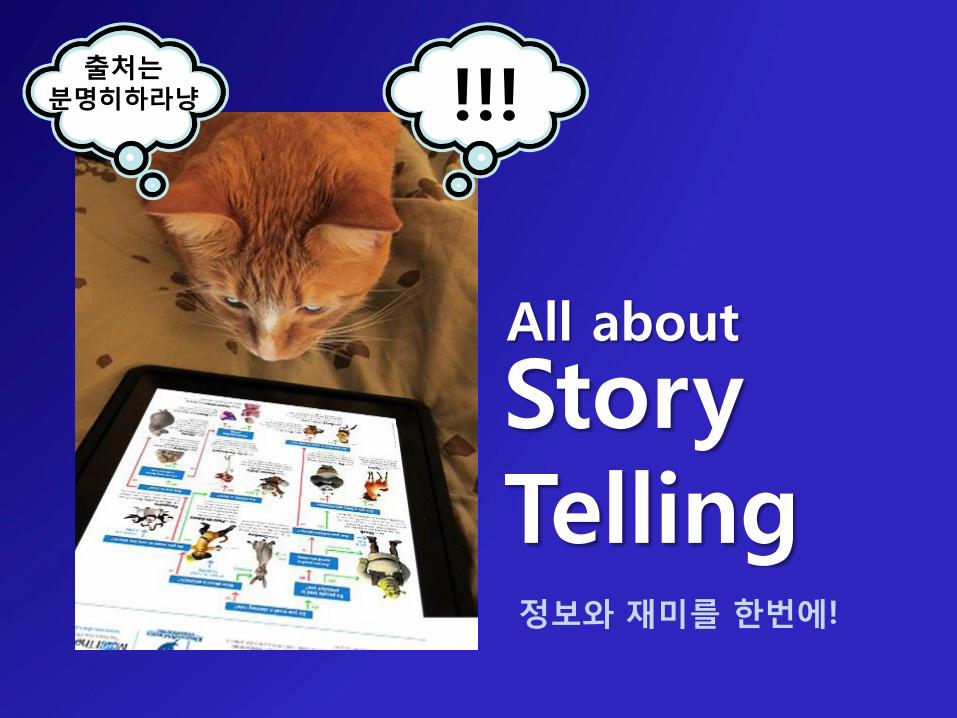
StoryTelling
All about
정보와 재미를 한번에!
!!!출처는
분명히하라냥
인포그래픽과 뉴미디어마케팅
Infographics
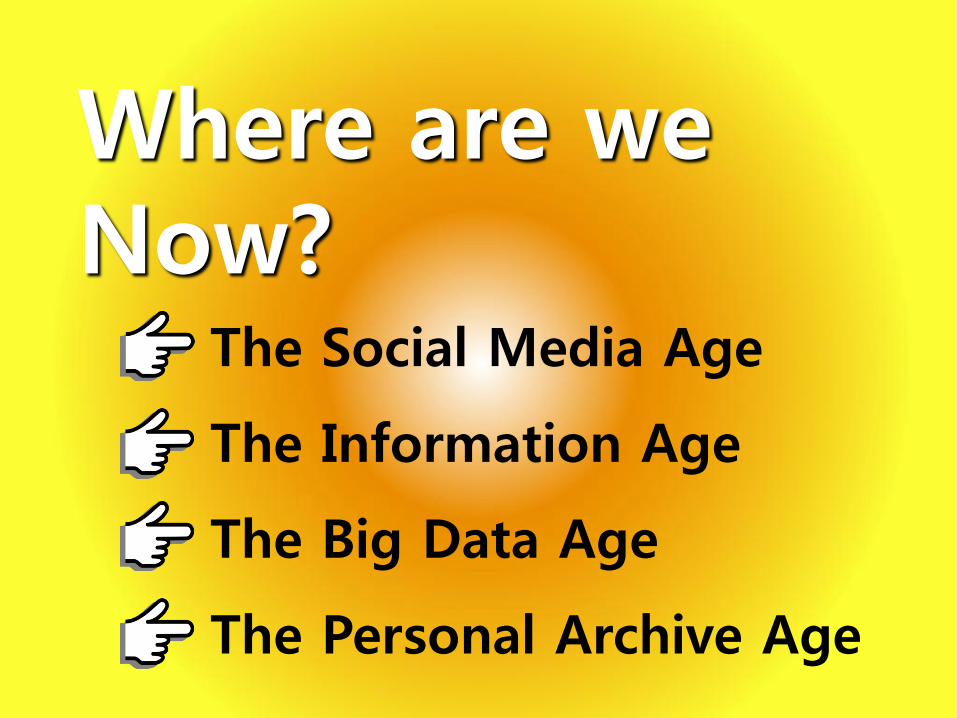
Where are we Now?
The Social Media Age
The Information Age
The Big Data Age
The Personal Archive Age
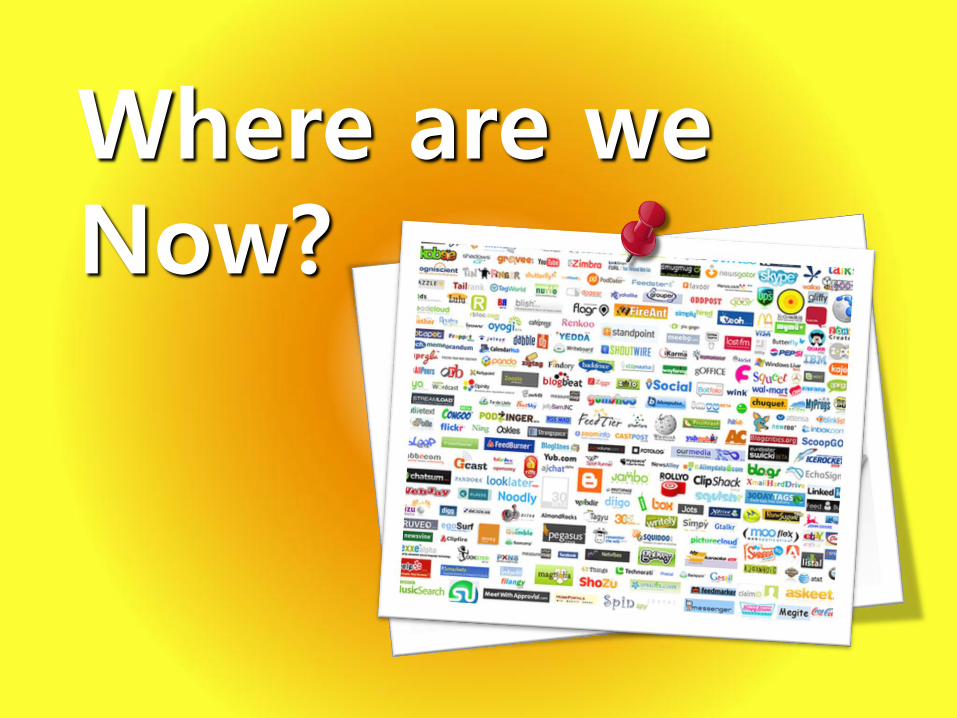
Where are we Now?
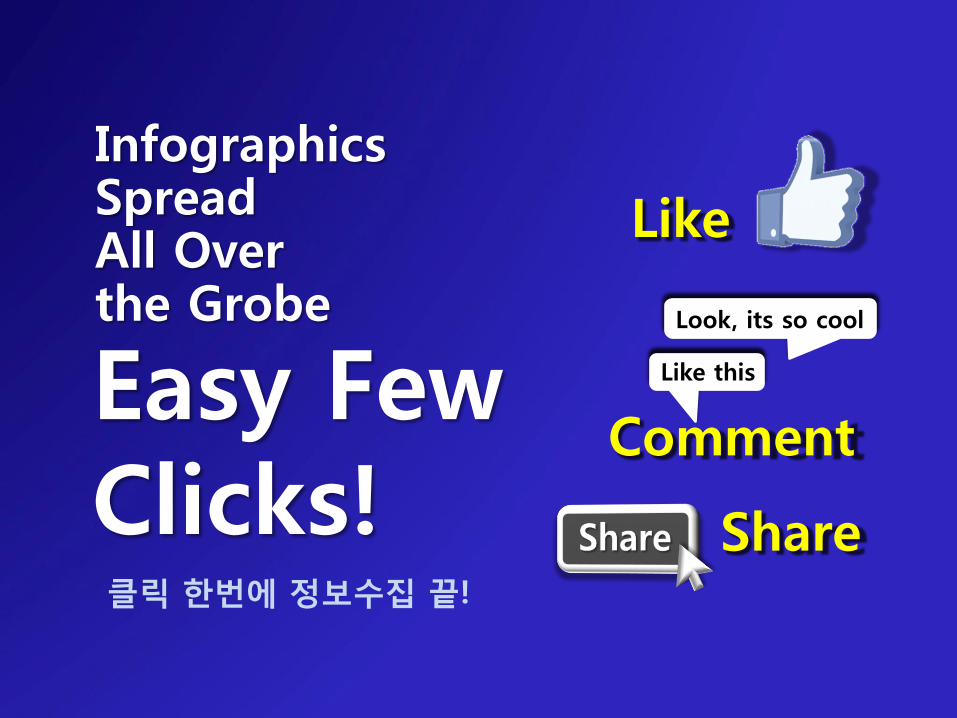
Like
Comment
Look, its so cool
Like thisEasy Few Clicks!
InfographicsSpread All Over the Grobe
클릭 한번에 정보수집 끝!
Share
인포그래픽 참고사이트
Infographics
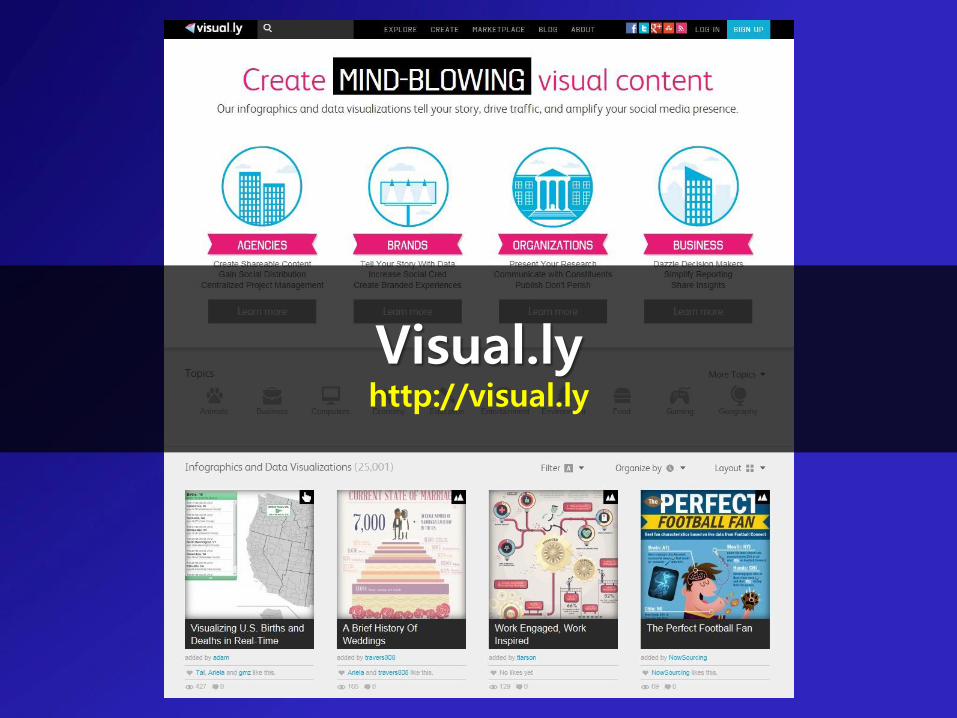
Visual.lyhttp://visual.ly
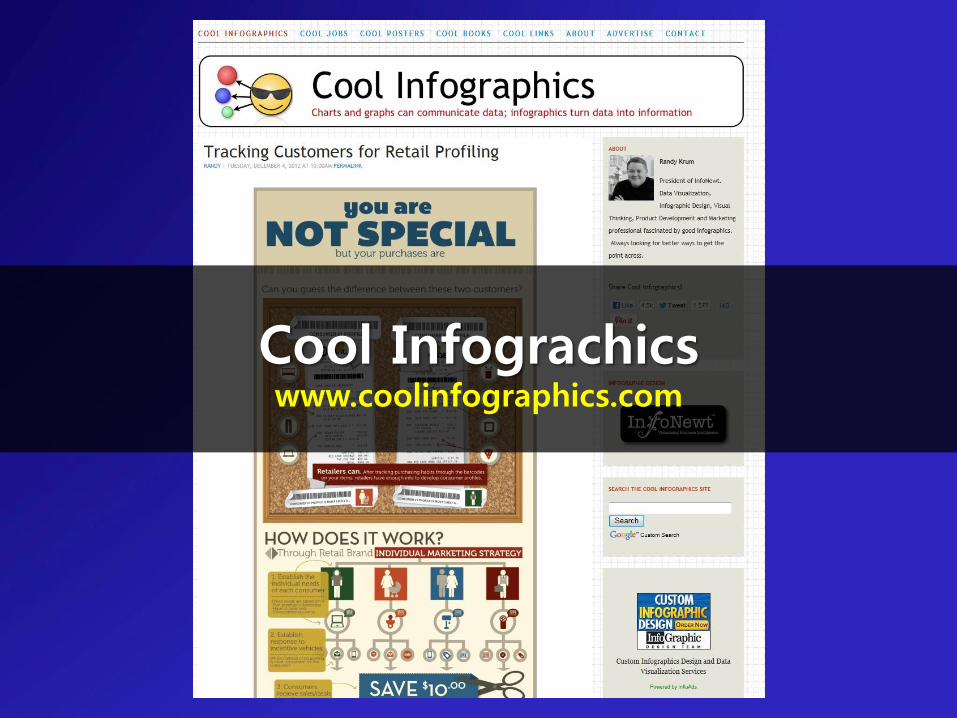
Cool Infograchicswww.coolinfographics.com
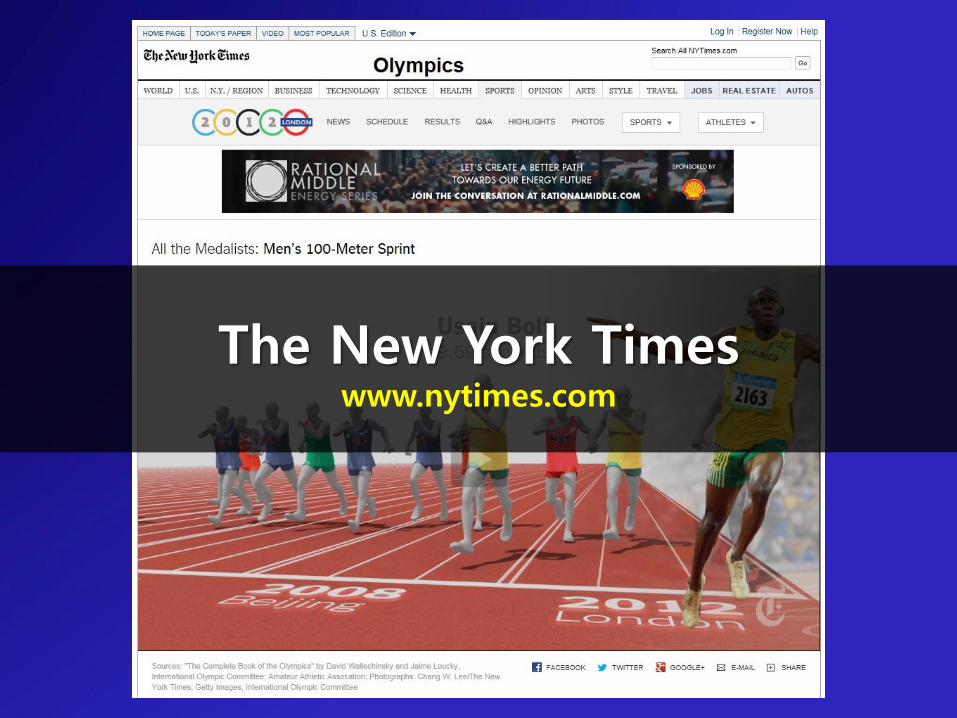
The New York Timeswww.nytimes.com
Flowing Datahttp://flowingdata.com
Good Infographicswww.good.is/infographics
Visualizing.orgwww.visualizing.org
Visual Loophttp://visualoop.com
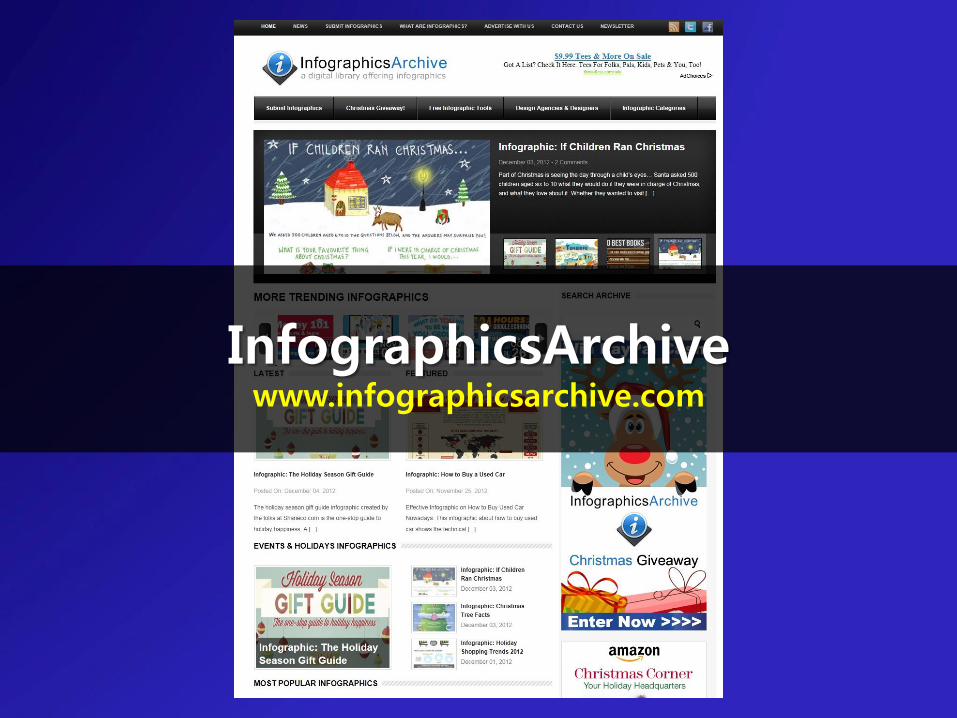
InfographicsArchivewww.infographicsarchive.com
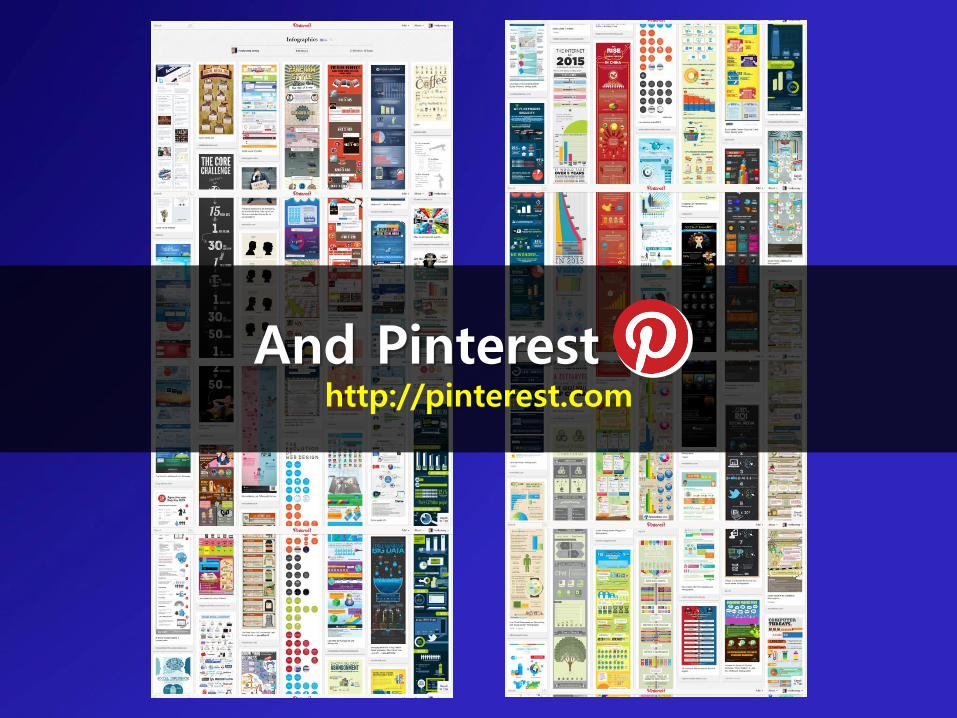
And Pinteresthttp://pinterest.com
Reference- Why are infographics important.pdf
(By Robin Richards, Slideshare)- www.diigo.com/list/rhennessey/infographics
(By Rita Hennessey, Diigo)

Thank You!

Find me on
정희경(鄭熙暻 )Heekyeong Louise Jeong
facebook.com/heekyeong.louise
pinterest.com/louisejeong