annual report 2014 of fanuc business・・・・・ 4 business report ・・・・・ 5 history of...
TRANSCRIPT

Year ended March 31, 2014
ANNUAL REPORT 2014
ロボット ロボマシン
010_0738001372610.indd 2 2014/11/05 18:49:06

010_0738001372610.indd 3 2014/11/05 18:49:06

CONTENTSFinancial Highlights (Consolidated) ・・・・・・・・・・・・2A Message from the President ・・・・・・・・・・・・・・・・3Summary of FANUC Business ・・・・・・・・・・・・・・・・・4Business Report ・・・・・・・・・・・・・・・・・・・・・・・・・・・・・・5History of FANUC ・・・・・・・・・・・・・・・・・・・・・・・・・・・・8Financial Section ・・・・・・・・・・・・・・・・・・・・・・・・・・・・・9 Global Network ・・・・・・・・・・・・・・・・・・・・・・・・・・・・ 30
1
010_0738001372610.indd 1 2014/11/05 18:49:07

2012 2013 2014
138,819
120,484
110,930
Net Income
1,343,904
2012 2013 2014
1,130,625
1,219,113
Total Assets
Financial Highlights (Consolidated)
Note : The U.S. dollar amounts shown above and elsewhere in this annual report are converted from yen, for convenience only, at the rate of ¥103 = U.S. $1.00.
Millions of yen Thousands ofU.S. dollars
Years ended March 31 2012 2013 2014 2014For the year:
Net sales ¥ 538,492 ¥ 498,395 ¥ 450,976 $ 4,378,408
Net income 138,819 120,484 110,930 1,076,990 At the year end:
Total assets ¥ 1,130,625 ¥ 1,219,113 ¥ 1,343,904 $ 13,047,612 Net assets 985,322 1,094,129 1,199,863 11,649,155
Yen U.S. dollars
Per share data:
Net income ¥ 709.20 ¥ 615.59 ¥ 566.86 $ 5.50
Cash dividends 212.77 184.68 170.06 1.65
2012 2013 2014
538,492
498,395
450,976
Net Sales (Millions of yen) (Millions of yen) (Millions of yen)
2
010_0738001372610.indd 2 2014/11/05 18:49:07

FANUC CORPORATION ANNUAL REPORT 2014
A Message from the President
The business environment surround-ing the FANUC Group was generally unfavorable in the first half of the year with the slow recovery of the Chinese market and stagnant Japanese and European markets, despite lively ac-tivity in some areas such as the U.S. market, which remained robust. Busi-ness gradually picked up in the second half as markets recovered due to the effects of the depreciation of the yen and increase in facility investments in the manufacturing industry. Amidst such a climate, the FANUC Group set up a new scheme in which business divisions were established for each product line consisting of FA, ROBOTs and ROBOMACHINEs. The rel-evant research laboratories and sales force were placed under the supervi-sion of each division, which is headed by a general manager who oversees the entire division. FANUC applies this back-to-basics approach, whereby re-search laboratories collaborate closely with sales staff, focusing on the mar-kets of individual products, to under-stand customers’ requirements quickly and correctly and immediately reflect these in product development. The new organizational structure contrib-utes to the further promotion of high performance and intelligence of prod-ucts while sticking to the basics of high reliability in research and development. As for manufacturing, FANUC contin-ues to enhance productivity through robotization. Through such activities, maximum efforts are made to improve competitiveness.
During the year ended March 31, 2014, FANUC posted consolidated net sales totaling ¥450,976 million (down 9.5%), consolidated ordinary income totaling ¥174,360 million (down 8.8%), and con-solidated net income totaling ¥110,930 million (down 7.9%). (Percentages in parentheses are comparisons with the previous fiscal year) For the year ending March 31, 2 015, it is anticipated that the first half will show good results due to the increase in short-term demands from the IT in-dustry, but in the second half, the spe-cial demands are expected to subside, and there is also concern about the slowdown in emerging economies, ob-scuring the outlook for the entire year. Under the scheme of the three business
divisions of FA, ROBOT and ROBOMA-CHINE, the FANUC Group, together with its overseas affiliated companies, will as a whole strive to speedily and accurately identify customer needs, so as to further enhance product devel-opment capabilities and facilitate the higher performance and intelligence of our highly reliable products. Produc-tion efficiency will be pursued as well, through robotization in manufacturing. By continuing such steadfast efforts, we will increase shares and sales, while re-taining a strong company constitution. Thank you for your continued support.
President and Chief Executive OfficerYoshiharu Inaba
3
010_0738001372610.indd 3 2014/11/05 18:49:09
Summary of FANUC Business
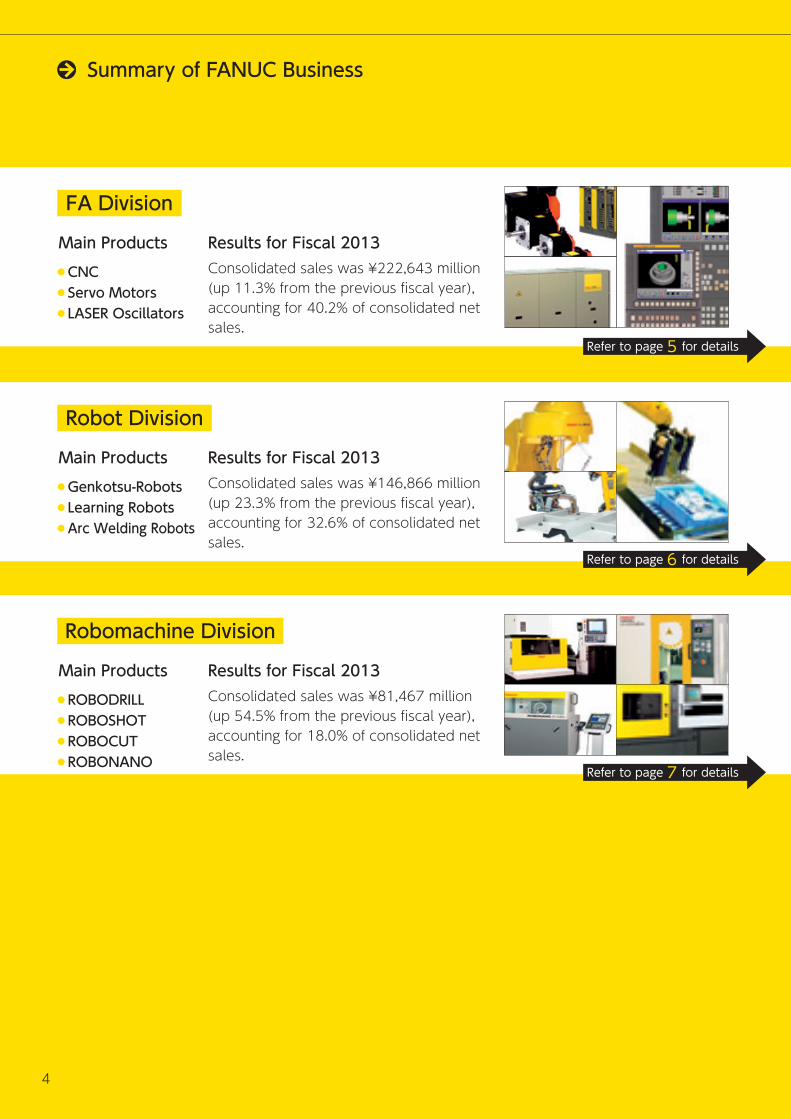
FA Division
Robot Division
Robomachine Division
Main Products● Genkotsu-Robots● Learning Robots● Arc Welding Robots
Main Products● CNC● Servo Motors● LASER Oscillators
Main Products● ROBODRILL● ROBOSHOT● ROBOCUT● ROBONANO
Results for Fiscal 2013Consolidated sales was ¥222,643 million (up 11.3% from the previous fiscal year), accounting for 40.2% of consolidated net sales.
Results for Fiscal 2013Consolidated sales was ¥146,866 million (up 23.3% from the previous fiscal year), accounting for 32.6% of consolidated net sales.
Results for Fiscal 2013Consolidated sales was ¥81,467 million (up 54.5% from the previous fiscal year), accounting for 18.0% of consolidated net sales.
Refer to page 5 for details
Refer to page 6 for details
Refer to page 7 for details
4
010_0738001372610.indd 4 2014/11/05 18:49:09

Business Report
FANUC CORPORATION ANNUAL REPORT 2014
FA Business Division
The machine tool industry, the primary market for FANUC CNC systems, generally remained in a dif-ficult condition domestically and abroad. In the second half of the period, however, demand picked up due to factors including depreciation of the yen, and sales of FANUC CNC systems, which had continued to face difficult conditions, also showed moderate signs of recovery.New developments in FANUC CNC include the “FA-NUC Series 0i -MODEL F”, with greatly enhanced basic performance and improved operability and reliability. This series is the successor of the FANUC Series 0i-MODEL D, which is renowned throughout the world as a global standard CNC. Furthermore, addition of new functions and enhancements were made to the FANUC Series 30i/31i/32i/35i -MODEL B, one of the world’s highest class performance CNCs, and the Pow-er Motion i -MODEL A, a CNC for general industrial machinery.
With regards to Servo, new servo motor models, the αi and βi Series, were introduced, which can accom-modate axis feeds of all kinds of machine tools with improvements in feeding smoothness and water resistance. Furthermore, the “SERVO HRV+ Control” was newly developed, which realizes high quality and high precision in machining dies and parts.The all-in-one servo amplifier, βiSVSP-B, with 3 axes for servos and 1 axis for spindles, was also developed to be used with the Series 0i -MODEL F. Improvements in machining performance, operability rate, and us-ability made possible system configuration which is highly cost effective. FANUC laser sales remained stagnant domestically and abroad, but showed signs of recovery in the second half of the period.New developments in laser included the enhance-ment of control functions, such as enhancements in power-saving functions of the high-performance, high-functionality, and high-reliability CO2 laser os-cillator, “FANUC Laser C series.”
Series0i -MODEL F
αi series SERVO
FANUC LASER C4000i -MODEL C
5
010_0738001372610.indd 5 2014/11/05 18:49:12
ROBOT Business Division
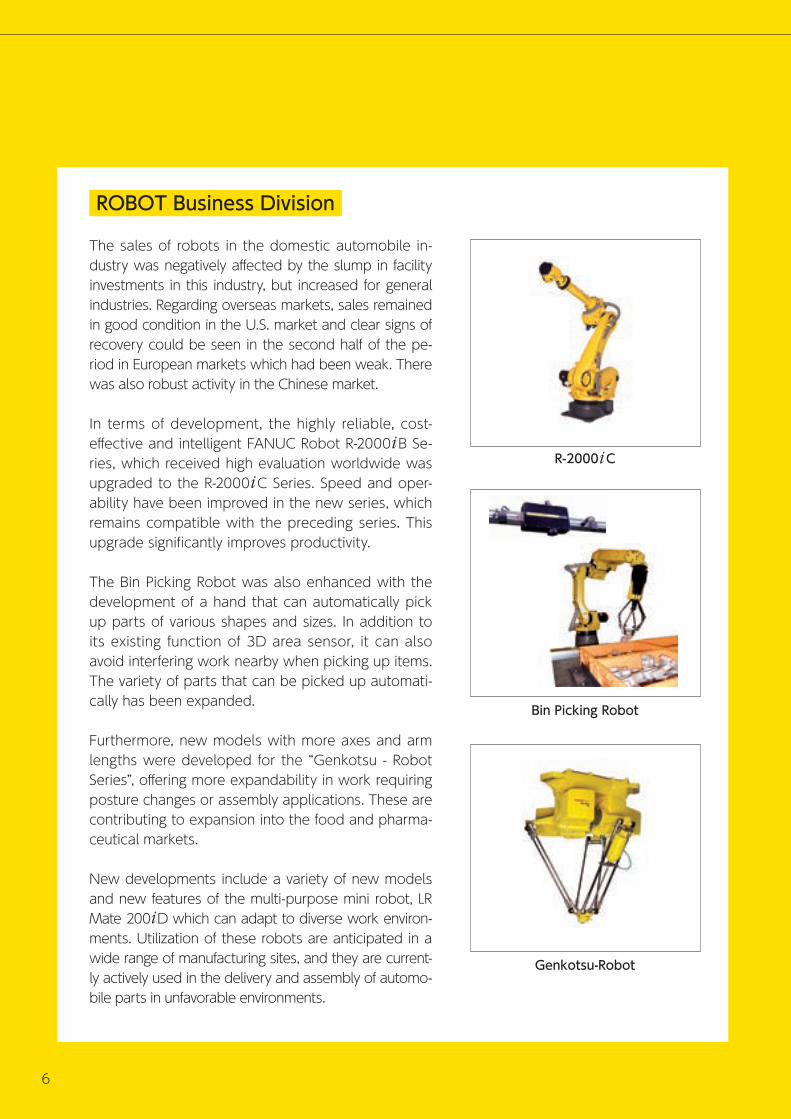
The sales of robots in the domestic automobile in-dustry was negatively affected by the slump in facility investments in this industry, but increased for general industries. Regarding overseas markets, sales remained in good condition in the U.S. market and clear signs of recovery could be seen in the second half of the pe-riod in European markets which had been weak. There was also robust activity in the Chinese market.
In terms of development, the highly reliable, cost-effective and intelligent FANUC Robot R-2000iB Se-ries, which received high evaluation worldwide was upgraded to the R-2000iC Series. Speed and oper-ability have been improved in the new series, which remains compatible with the preceding series. This upgrade significantly improves productivity.
The Bin Picking Robot was also enhanced with the development of a hand that can automatically pick up parts of various shapes and sizes. In addition to its existing function of 3D area sensor, it can also avoid interfering work nearby when picking up items. The variety of parts that can be picked up automati-cally has been expanded.
Furthermore, new models with more axes and arm lengths were developed for the “Genkotsu - Robot Series”, offering more expandability in work requiring posture changes or assembly applications. These are contributing to expansion into the food and pharma-ceutical markets.
New developments include a variety of new models and new features of the multi-purpose mini robot, LR Mate 200iD which can adapt to diverse work environ-ments. Utilization of these robots are anticipated in a wide range of manufacturing sites, and they are current-ly actively used in the delivery and assembly of automo-bile parts in unfavorable environments.
R-2000iC
Bin Picking Robot
Genkotsu-Robot
6
010_0738001372610.indd 6 2014/11/05 18:49:12

FANUC ROBODRILL α-D21MiA5
FANUC ROBOSHOT α-S250iA
FANUC ROBOCUT α-C600iA
FANUC ROBONANO α-0iB
FANUC CORPORATION ANNUAL REPORT 2014
ROBOMACHINE Business Division
The sales of ROBODRILL (small machining center) was stable in the Japanese market and was in good condition overseas, yet compared to last year where there was a momentary rise in demand from a seg-ment in the IT industry, annual sales decreased sharply. Amidst such circumstances, from the end of the current fiscal year, there was another substantial increase in demand from the IT industry, and a tem-porary and short-term rise in sales became appar-ent.In terms of development, functionalities were ex-panded to satisfy overseas safety regulations and a wider range of customer needs.
The sales of ROBOSHOT, an electric injection mold-ing machine, increased steadily both in Japan and abroad.New developments in FANUC ROBOSHOT included the completion of the “FANUC ROBOSHOTα-SiA se-ries”, a lineup of electric injection molding machines. The α-S250iA with ultra-high speed injection speci-fications, optimal for molding light-guiding plates (IT related parts), was also developed as a high-end machine.
The sales of the ROBOCUT, a wire-cut electric dis-charge machine, also increased steadily both in Ja-pan and abroad.New developments included the “FANUC ROBOCUT CCR” which is a high precision and compact turn-table for the “FANUC ROBOCUT α-CiA series.” With this turntable, machining of a wide range of parts, such as medical equipment, is made possible.
As to the ROBONANO, an ultra precision nano ma-chine, sales activities were reinforced for expansion into overseas markets, and progress has been made. In terms of development, development of function-alities were made to satisfy overseas safety regula-tions and to enhance operatability.
7
010_0738001372610.indd 7 2014/11/05 18:49:13
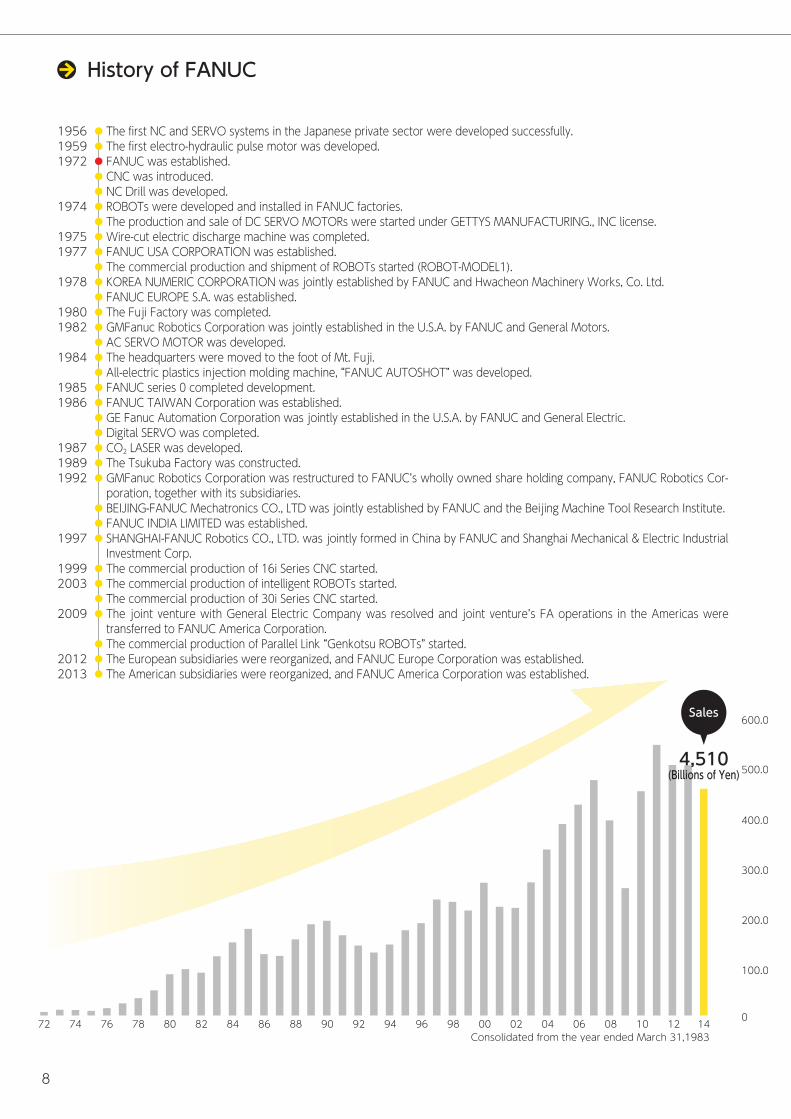
1956 The first NC and SERVO systems in the Japanese private sector were developed successfully.1959 The first electro-hydraulic pulse motor was developed.1972 FANUC was established. CNC was introduced. NC Drill was developed.1974 ROBOTs were developed and installed in FANUC factories. The production and sale of DC SERVO MOTORs were started under GETTYS MANUFACTURING., INC license.1975 Wire-cut electric discharge machine was completed.1977 FANUC USA CORPORATION was established. The commercial production and shipment of ROBOTs started (ROBOT-MODEL1).1978 KOREA NUMERIC CORPORATION was jointly established by FANUC and Hwacheon Machinery Works, Co. Ltd. FANUC EUROPE S.A. was established.1980 The Fuji Factory was completed.1982 GMFanuc Robotics Corporation was jointly established in the U.S.A. by FANUC and General Motors. AC SERVO MOTOR was developed.1984 The headquarters were moved to the foot of Mt. Fuji. All-electric plastics injection molding machine, “FANUC AUTOSHOT” was developed.1985 FANUC series 0 completed development.1986 FANUC TAIWAN Corporation was established. GE Fanuc Automation Corporation was jointly established in the U.S.A. by FANUC and General Electric. Digital SERVO was completed.1987 CO2 LASER was developed.1989 The Tsukuba Factory was constructed.1992 GMFanuc Robotics Corporation was restructured to FANUC’s wholly owned share holding company, FANUC Robotics Cor-
poration, together with its subsidiaries. BEIJING-FANUC Mechatronics CO., LTD was jointly established by FANUC and the Beijing Machine Tool Research Institute. FANUC INDIA LIMITED was established.1997 SHANGHAI-FANUC Robotics CO., LTD. was jointly formed in China by FANUC and Shanghai Mechanical & Electric Industrial
Investment Corp.1999 The commercial production of 16i Series CNC started.2003 The commercial production of intelligent ROBOTs started. The commercial production of 30i Series CNC started.2009 The joint venture with General Electric Company was resolved and joint venture’s FA operations in the Americas were
transferred to FANUC America Corporation. The commercial production of Parallel Link “Genkotsu ROBOTs” started.2012 The European subsidiaries were reorganized, and FANUC Europe Corporation was established.2013 The American subsidiaries were reorganized, and FANUC America Corporation was established.
72 74 76 78 80 82 84 86 88 90 92 94 96 98 00 02 04 06 08 12 1410 0
100.0
200.0
300.0
400.0
500.0
600.0
Consolidated from the year ended March 31,1983
4,510(Billions of Yen)
Sales
History of FANUC
8
010_0738001372610.indd 8 2014/11/05 18:49:13
FANUC CORPORATION ANNUAL REPORT 2014
Financial Section
TEN-YEAR FINANCIAL SUMMARY ・・・・・・・・・・・・・・・・・・・・・・・・・・・・・・ 10CONSOLIDATED STATEMENTS OF INCOME ・・・・・・・・・・・・・・・・・・・ 12CONSOLIDATED STATEMENTS OF COMPREHENSIVE INCOME ・・ 13CONSOLIDATED BALANCE SHEETS ・・・・・・・・・・・・・・・・・・・・・・・・・・・・ 14CONSOLIDATED STATEMENTS OF CHANGES IN NET ASSETS ・・ 15CONSOLIDATED STATEMENTS OF CASH FLOWS ・・・・・・・・・・・・・・ 16NOTES TO THE CONSOLIDATED FINANCIAL STATEMENTS ・・・・ 17NON-CONSOLIDATED STATEMENTS OF INCOME ・・・・・・・・・・・・・ 28NON-CONSOLIDATED BALANCE SHEETS ・・・・・・・・・・・・・・・・・・・・・・ 29
9
010_0738001372610.indd 9 2014/11/05 18:49:13
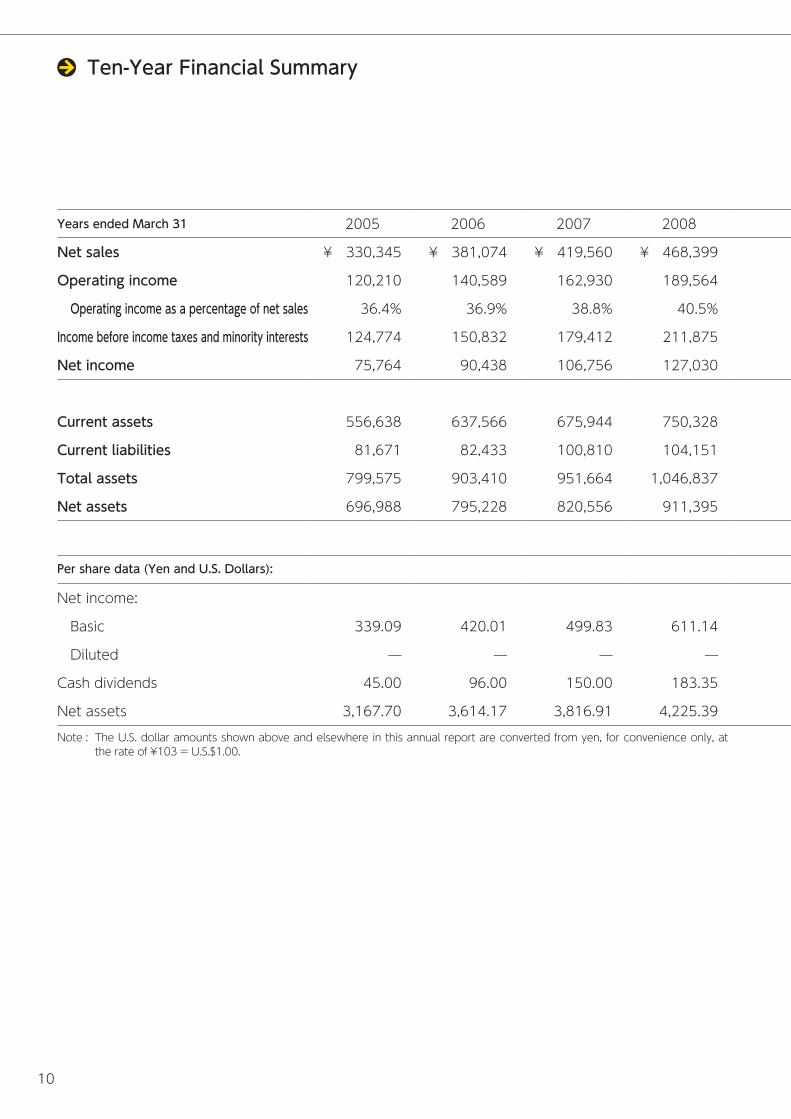
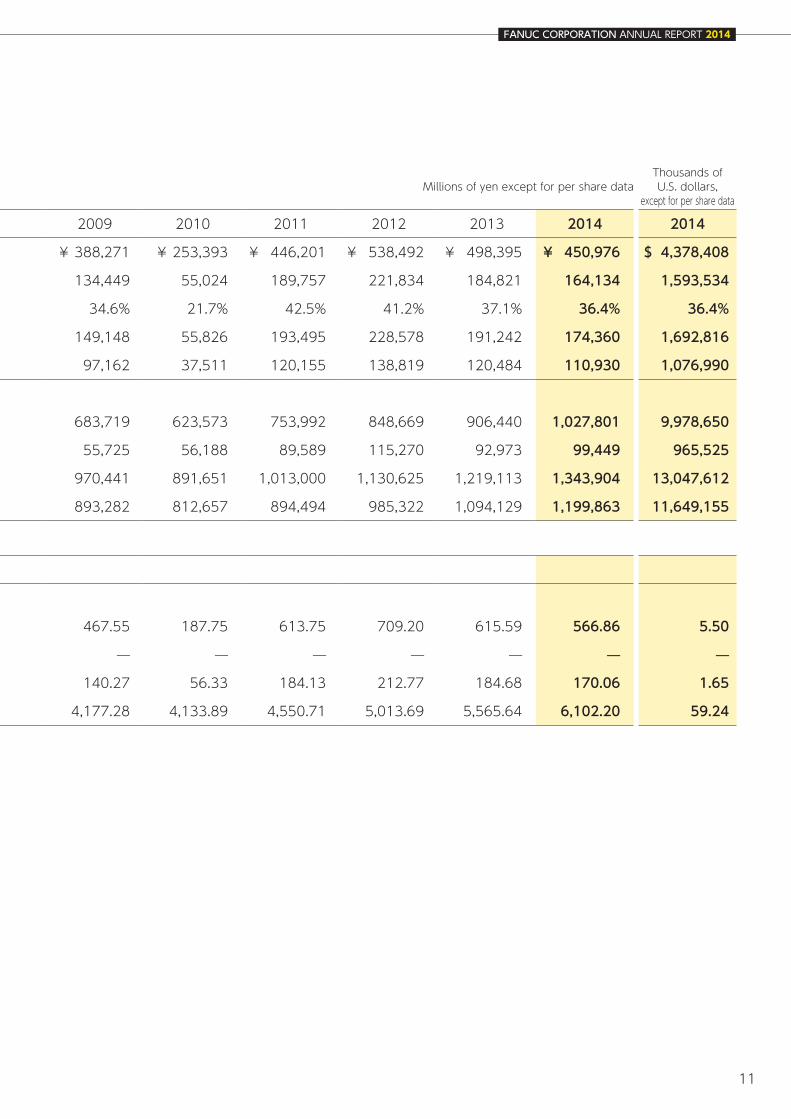
Ten-Year Financial Summary
Millions of yen except for per share data Thousands of U.S. dollars,
except for per share data
Years ended March 31 2005 2006 2007 2008 2009 2010 2011 2012 2013 2014 2014
Net sales ¥ 330,345 ¥ 381,074 ¥ 419,560 ¥ 468,399 ¥ 388,271 ¥ 253,393 ¥ 446,201 ¥ 538,492 ¥ 498,395 ¥ 450,976 $ 4,378,408
Operating income 120,210 140,589 162,930 189,564 134,449 55,024 189,757 221,834 184,821 164,134 1,593,534
Operating income as a percentage of net sales 36.4% 36.9% 38.8% 40.5% 34.6% 21.7% 42.5% 41.2% 37.1% 36.4% 36.4%
Income before income taxes and minority interests 124,774 150,832 179,412 211,875 149,148 55,826 193,495 228,578 191,242 174,360 1,692,816
Net income 75,764 90,438 106,756 127,030 97,162 37,511 120,155 138,819 120,484 110,930 1,076,990
Current assets 556,638 637,566 675,944 750,328 683,719 623,573 753,992 848,669 906,440 1,027,801 9,978,650
Current liabilities 81,671 82,433 100,810 104,151 55,725 56,188 89,589 115,270 92,973 99,449 965,525
Total assets 799,575 903,410 951,664 1,046,837 970,441 891,651 1,013,000 1,130,625 1,219,113 1,343,904 13,047,612
Net assets 696,988 795,228 820,556 911,395 893,282 812,657 894,494 985,322 1,094,129 1,199,863 11,649,155
Note : The U.S. dollar amounts shown above and elsewhere in this annual report are converted from yen, for convenience only, at the rate of ¥103 = U.S.$1.00.
Per share data (Yen and U.S. Dollars):
Net income:
Basic 339.09 420.01 499.83 611.14 467.55 187.75 613.75 709.20 615.59 566.86 5.50
Diluted — — — — — — — — — — —
Cash dividends 45.00 96.00 150.00 183.35 140.27 56.33 184.13 212.77 184.68 170.06 1.65
Net assets 3,167.70 3,614.17 3,816.91 4,225.39 4,177.28 4,133.89 4,550.71 5,013.69 5,565.64 6,102.20 59.24
10
010_0738001372610.indd 10 2014/11/05 18:49:13
FANUC CORPORATION ANNUAL REPORT 2014
Millions of yen except for per share data Thousands of U.S. dollars,
except for per share data
Years ended March 31 2005 2006 2007 2008 2009 2010 2011 2012 2013 2014 2014
Net sales ¥ 330,345 ¥ 381,074 ¥ 419,560 ¥ 468,399 ¥ 388,271 ¥ 253,393 ¥ 446,201 ¥ 538,492 ¥ 498,395 ¥ 450,976 $ 4,378,408
Operating income 120,210 140,589 162,930 189,564 134,449 55,024 189,757 221,834 184,821 164,134 1,593,534
Operating income as a percentage of net sales 36.4% 36.9% 38.8% 40.5% 34.6% 21.7% 42.5% 41.2% 37.1% 36.4% 36.4%
Income before income taxes and minority interests 124,774 150,832 179,412 211,875 149,148 55,826 193,495 228,578 191,242 174,360 1,692,816
Net income 75,764 90,438 106,756 127,030 97,162 37,511 120,155 138,819 120,484 110,930 1,076,990
Current assets 556,638 637,566 675,944 750,328 683,719 623,573 753,992 848,669 906,440 1,027,801 9,978,650
Current liabilities 81,671 82,433 100,810 104,151 55,725 56,188 89,589 115,270 92,973 99,449 965,525
Total assets 799,575 903,410 951,664 1,046,837 970,441 891,651 1,013,000 1,130,625 1,219,113 1,343,904 13,047,612
Net assets 696,988 795,228 820,556 911,395 893,282 812,657 894,494 985,322 1,094,129 1,199,863 11,649,155
Per share data (Yen and U.S. Dollars):
Net income:
Basic 339.09 420.01 499.83 611.14 467.55 187.75 613.75 709.20 615.59 566.86 5.50
Diluted — — — — — — — — — — —
Cash dividends 45.00 96.00 150.00 183.35 140.27 56.33 184.13 212.77 184.68 170.06 1.65
Net assets 3,167.70 3,614.17 3,816.91 4,225.39 4,177.28 4,133.89 4,550.71 5,013.69 5,565.64 6,102.20 59.24
11
010_0738001372610.indd 11 2014/11/05 18:49:13
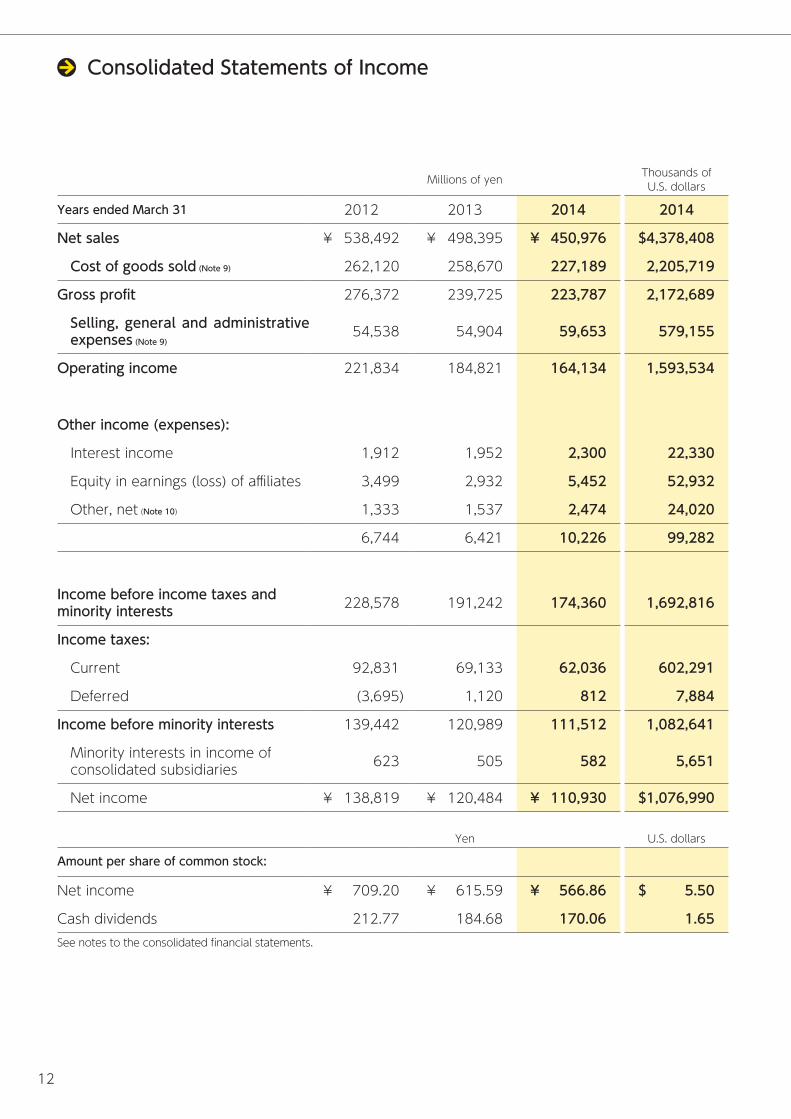
Consolidated Statements of Income
See notes to the consolidated financial statements.
Millions of yen Thousands of U.S. dollars
Years ended March 31 2012 2013 2014 2014
Net sales ¥ 538,492 ¥ 498,395 ¥ 450,976 $ 4,378,408
Cost of goods sold (Note 9) 262,120 258,670 227,189 2,205,719
Gross profit 276,372 239,725 223,787 2,172,689
Selling, general and administrative expenses (Note 9)
54,538 54,904 59,653 579,155
Operating income 221,834 184,821 164,134 1,593,534
Other income (expenses):
Interest income 1,912 1,952 2,300 22,330
Equity in earnings (loss) of affiliates 3,499 2,932 5,452 52,932
Other, net (Note 10) 1,333 1,537 2,474 24,020
6,744 6,421 10,226 99,282
Income before income taxes and minority interests 228,578 191,242 174,360 1,692,816
Income taxes:
Current 92,831 69,133 62,036 602,291
Deferred (3,695) 1,120 812 7,884
Income before minority interests 139,442 120,989 111,512 1,082,641
Minority interests in income of consolidated subsidiaries 623 505 582 5,651
Net income ¥ 138,819 ¥ 120,484 ¥ 110,930 $ 1,076,990
Yen U.S. dollars
Amount per share of common stock:
Net income ¥ 709.20 ¥ 615.59 ¥ 566.86 $ 5.50
Cash dividends 212.77 184.68 170.06 1.65
12
010_0738001372610.indd 12 2014/11/05 18:49:13
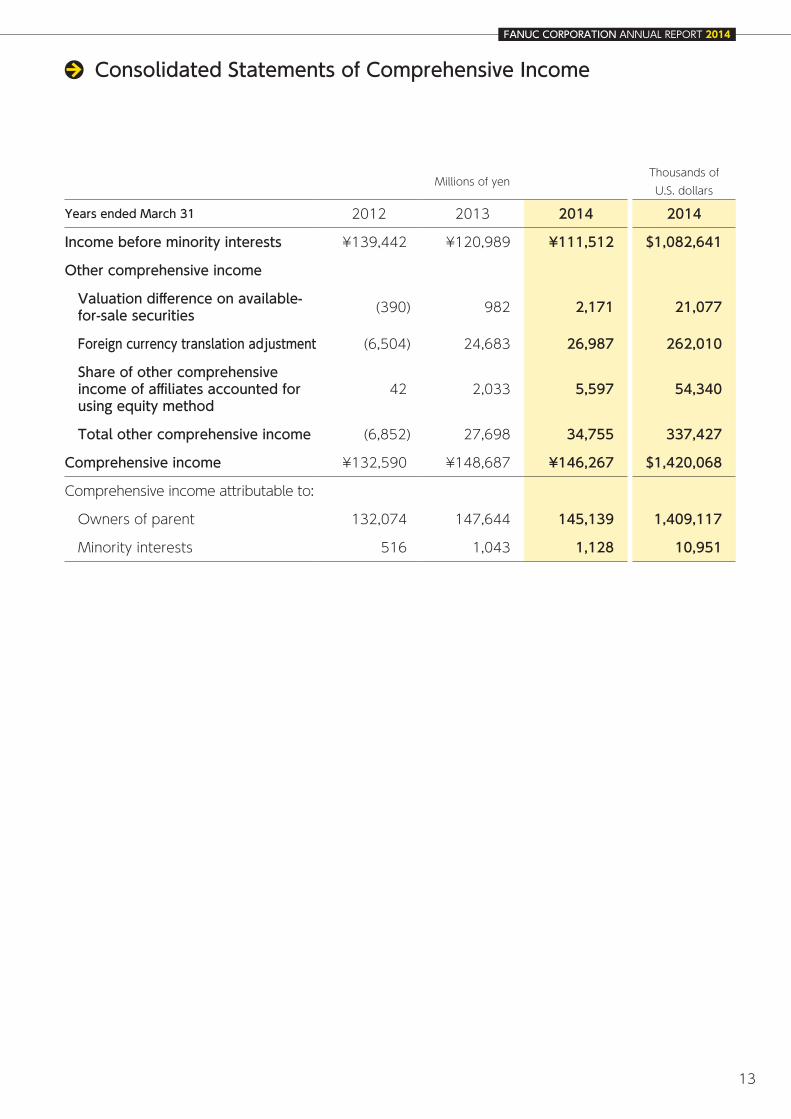
Millions of yenThousands of U.S. dollars
Years ended March 31 2012 2013 2014 2014
Income before minority interests ¥139,442 ¥120,989 ¥111,512 $1,082,641
Other comprehensive income
Valuation difference on available-for-sale securities (390) 982 2,171 21,077
Foreign currency translation adjustment (6,504) 24,683 26,987 262,010
Share of other comprehensive income of affiliates accounted for using equity method
42 2,033 5,597 54,340
Total other comprehensive income (6,852) 27,698 34,755 337,427
Comprehensive income ¥132,590 ¥148,687 ¥146,267 $1,420,068
Comprehensive income attributable to:
Owners of parent 132,074 147,644 145,139 1,409,117
Minority interests 516 1,043 1,128 10,951
FANUC CORPORATION ANNUAL REPORT 2014
Consolidated Statements of Comprehensive Income
13
010_0738001372610.indd 13 2014/11/05 18:49:13

Consolidated Balance SheetsMillions of yen Thousands of
U.S. dollars
As of March 31 2013 2014 2014ASSETSCurrent assets:
Cash and cash equivalents ¥727,753 ¥823,670 $7,996,796 Receivables, trade:
Accounts and notes 81,318 91,698 890,272 Allowance for doubtful accounts (1,628) (1,920) (18,641)
Finished goods 37,053 43,857 425,796 Work in progress 27,724 35,559 345,233 Raw materials and supplies 7,407 8,079 78,437 Deferred income taxes (Note 11) 19,035 20,706 201,029 Other current assets 7,778 6,152 59,728
Total current assets 906,440 1,027,801 9,978,650 Investments (Note 5) 39,105 49,417 479,777 Property, plant and equipment, at cost:
Land 116,452 117,543 1,141,194 Buildings 214,329 224,764 2,182,175 Machinery and equipment 125,631 140,998 1,368,913 Construction in progress 21,889 6,395 62,087 Less accumulated depreciation (213,480) (227,227) (2,206,087)
Property, plant and equipment, net 264,821 262,473 2,548,282 Intangible assets:
Goodwill 8,286 3,689 35,816 Other intangible assets 461 524 5,087
Total intangible assets 8,747 4,213 40,903 Total assets ¥1,219,113 ¥1,343,904 $13,047,612 LIABILITIES AND NET ASSETSCurrent liabilities:
Payables, trade ¥22,044 ¥26,192 $254,291 Accrued income taxes 30,637 30,787 298,903 Warranty reserves 4,937 5,409 52,515 Other current liabilities 35,355 37,061 359,816
Total current liabilities 92,973 99,449 965,525 Long-term liabilities:
Allowance for employees' retirement benefits (Note 6) 28,172 — —Net defined benefit liability (Note 6) — 40,456 392,777 Other long-term liabilities 3,839 4,136 40,155
Total long-term liabilities 32,011 44,592 432,932 NET ASSETSShareholders' equity:
Common stock:Authorized - 400,000,000 sharesIssued - 239,508,317 shares 69,014 69,014 670,039
Capital surplus 96,268 96,270 934,660 Retained earnings 1,261,572 1,340,809 13,017,563 Treasury stock, at cost :
2013 - 43,796,678 shares (311,636) — —2014 - 43,836,033 shares — (312,299) (3,032,030)Total shareholders' equity 1,115,218 1,193,794 11,590,232
Accumulated other comprehensive income:Valuation difference on available-for-sale securities 2,941 5,112 49,631 Foreign currency translation adjustment (28,899) 3,138 30,466 Remeasurements of defined benefit plans — (8,012) (77,786)
Total accumulated other comprehensive income (25,958) 238 2,311 Minority interests 4,869 5,831 56,612
Total net assets 1,094,129 1,199,863 11,649,156 Total liabilities and net assets ¥1,219,113 ¥1,343,904 $13,047,612 See notes to the consolidated financial statements.
14
010_0738001372610.indd 14 2014/11/05 18:49:13

FANUC CORPORATION ANNUAL REPORT 2014
Consolidated Statements of Changes in Net Assets
See notes to the consolidated financial statements.
Millions of yen
Common stock
Capital surplus
Retained earnings
Treasury stock,at cost
Valuation difference on available-for-sale securities
Foreign currency
translation adjustment
Remeasure-ments
of defined benefit plans
Minority interests
Totalnet assets
Balance at March 31, 2011 ¥69,014 ¥96,261 ¥1,082,997 (¥311,094) ¥2,349 (¥48,723) — ¥3,690 ¥894,494 Cash dividends (41,566) (41,566)Net income 138,819 138,819 Purchase of treasury stock (304) (304)Disposal of treasury stock 4 4 8 Change of scope of consolidation 306 306 Net change excluding shareholder's equity during the year (390) (6,354) 309 (6,435)
Balance at March 31, 2012 ¥69,014 ¥96,265 ¥1,180,556 (¥311,394) ¥1,959 (¥55,077) — ¥3,999 ¥985,322 Cash dividends (39,468) (39,468)Net income 120,484 120,484 Purchase of treasury stock (246) (246)Disposal of treasury stock 3 4 7 Net change excluding shareholder's equity during the year 982 26,178 870 28,030
Balance at March 31, 2013 ¥69,014 ¥96,268 ¥1,261,572 (¥311,636) ¥2,941 (¥28,899) — ¥4,869 ¥1,094,129 Cash dividends (31,086) (31,086)Net income 110,930 110,930 Change caused by merger (607) (607)Purchase of treasury stock (665) (665)Disposal of treasury stock 2 2 4 Net change excluding shareholder's equity during the year 2,171 32,037 (8,012) 962 27,158
Balance at March 31, 2014 ¥69,014 ¥96,270 ¥1,340,809 (¥312,299) ¥5,112 ¥3,138 (¥8,012) ¥5,831 ¥1,199,863
Thousands of U.S. dollars
Common stock
Capital surplus
Retained earnings
Treasury stock,at cost
Valuation difference on available-for-sale securities
Foreign currency
translation adjustment
Remeasure-ments
of defined benefit plans
Minority interests
Totalnet assets
Balance at March 31, 2013 $670,039 $934,641 $12,248,272 ($3,025,592) $28,553 ($280,573) — $47,272 $10,622,612
Cash dividends (301,806) (301,806)
Net income 1,076,990 1,076,990
Change caused by merger (5,893) (5,893)
Purchase of treasury stock (6,456) (6,456)
Disposal of treasury stock 19 19 38
Net change excluding shareholder's equity during the year 21,078 311,039 (77,786) 9,340 263,671
Balance at March 31, 2014 $670,039 $934,660 $13,017,563 ($3,032,030) $49,631 $30,466 ($77,786) $56,612 $11,649,156
15
010_0738001372610.indd 15 2014/11/05 18:49:14
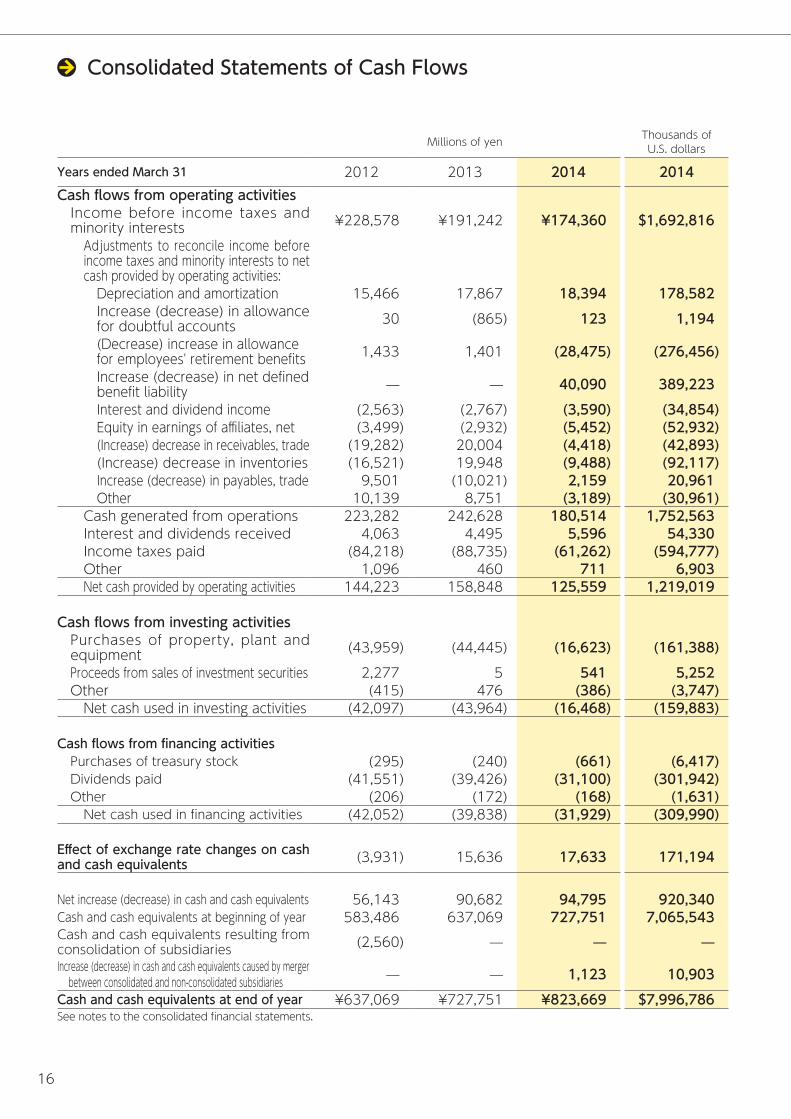
Consolidated Statements of Cash Flows
See notes to the consolidated financial statements.
Millions of yen Thousands of U.S. dollars
Years ended March 31 2012 2013 2014 2014Cash flows from operating activities
Income before income taxes and minority interests ¥228,578 ¥191,242 ¥174,360 $1,692,816
Adjustments to reconcile income before income taxes and minority interests to net cash provided by operating activities:
Depreciation and amortization 15,466 17,867 18,394 178,582 Increase (decrease) in allowance for doubtful accounts 30 (865) 123 1,194 (Decrease) increase in allowance for employees' retirement benefits 1,433 1,401 (28,475) (276,456)Increase (decrease) in net defined benefit liability — — 40,090 389,223 Interest and dividend income (2,563) (2,767) (3,590) (34,854)Equity in earnings of affiliates, net (3,499) (2,932) (5,452) (52,932)(Increase) decrease in receivables, trade (19,282) 20,004 (4,418) (42,893)(Increase) decrease in inventories (16,521) 19,948 (9,488) (92,117)Increase (decrease) in payables, trade 9,501 (10,021) 2,159 20,961 Other 10,139 8,751 (3,189) (30,961)
Cash generated from operations 223,282 242,628 180,514 1,752,563 Interest and dividends received 4,063 4,495 5,596 54,330 Income taxes paid (84,218) (88,735) (61,262) (594,777)Other 1,096 460 711 6,903 Net cash provided by operating activities 144,223 158,848 125,559 1,219,019
Cash flows from investing activitiesPurchases of property, plant and equipment (43,959) (44,445) (16,623) (161,388)Proceeds from sales of investment securities 2,277 5 541 5,252 Other (415) 476 (386) (3,747)
Net cash used in investing activities (42,097) (43,964) (16,468) (159,883)
Cash flows from financing activitiesPurchases of treasury stock (295) (240) (661) (6,417)Dividends paid (41,551) (39,426) (31,100) (301,942)Other (206) (172) (168) (1,631)
Net cash used in financing activities (42,052) (39,838) (31,929) (309,990)
Effect of exchange rate changes on cash and cash equivalents (3,931) 15,636 17,633 171,194
Net increase (decrease) in cash and cash equivalents 56,143 90,682 94,795 920,340 Cash and cash equivalents at beginning of year 583,486 637,069 727,751 7,065,543 Cash and cash equivalents resulting from consolidation of subsidiaries (2,560) — — —Increase (decrease) in cash and cash equivalents caused by merger
between consolidated and non-consolidated subsidiaries — — 1,123 10,903 Cash and cash equivalents at end of year ¥637,069 ¥727,751 ¥823,669 $7,996,786
16
010_0738001372610.indd 16 2014/11/05 18:49:14
FANUC CORPORATION ANNUAL REPORT 2014
Notes to the Consolidated Financial Statements
1. Basis of preparationThe accompanying consolidated financial statements of FANUC CORPORATION (the "Company") and its consoli-dated subsidiaries (together, the "Group") are prepared in accordance to accounting principles generally accepted in Japan, which are different in certain respects as to the application and disclosure requirements of International Financial Reporting Standards, and have been compiled from the consolidated financial statements prepared by the Company as required by the Financial Instruments and Exchange Act of Japan.
In addition, the notes to the consolidated financial statements include information which is not required under accounting principles generally accepted in Japan but is presented herein as additional information.
In preparing the consolidated financial statements, the Company has made certain reclassifications and re-arrangements to the consolidated financial statements prepared in Japan in order to present them in a format which is more familiar to readers outside Japan.
2. Summary of significant accounting policies(a) Principles of consolidationThe consolidated financial statements include the accounts of the Company and its subsidiaries except for those that are low in significance. Sig-nificant intercompany accounts transactions have been eliminated in consolidation.
The investments in unconsolidated subsidiaries and affiliated companies over which the Company exerts substantial influence are, except for those that are low in significance, accounted for under the equity method.
Goodwill is amortized over a period of five years.
(b) Cash equivalentsThe Group considers all highly liquid investments
with a maturity of three months or less at the time of purchase as cash equivalents.
(c) Translation of foreign currency accountsAll monetary receivables and payables denomi-nated in foreign currencies are translated into Japanese yen at the exchange rates as of the balance sheet date. Foreign exchange gain or loss upon translation is recognized in the con-solidated statements of income.
Assets and liabilities of the consolidated subsidiaries outside Japan are translated into Japanese yen at the exchange rates as of their respective balance sheet dates except for share-holders' equity which is translated at historical rates. Differences arising from translation are reflected as "foreign currency translation ad-justments" as a part of net assets. Income and expense accounts are translated at the average rates for the year.
(d) Valuation of securitiesSecurities other than investments in affiliates are classified as available-for-sale securities ("Other securities") and include securities other than trading securities and securities held to maturity. Other securities whose fair value is readily de-terminable are stated at fair value with the cor-responding unrealized gain or loss, net of taxes, recorded directly as a separate component of net assets. Other securities whose fair value is not readily determinable are stated at moving average cost. The cost of other securities sold is calculated by the moving average method.
(e) Allowance for doubtful accountsAllowance for doubtful accounts is provided at an amount deemed sufficient to cover estimated future losses.
17
010_0738001372610.indd 17 2014/11/05 18:49:14
(f) InventoriesRaw materials and purchased components are stated primarily at cost determined by the most recent purchase price method.
Work in progress is stated at actual cost which includes direct costs for materials and labor as well as overhead manufacturing costs including depreciation.
Finished goods are stated principally at cost (method of reducing book value due to decline in profitability) by the average method.
(g) Property, plant and equipment and depreciationProperty, plant and equipment, including signifi-cant renewals and additions, is stated at cost.
Depreciation is computed principally by the declining-balance method at rates based on the estimated useful lives of the respective assets which vary according to general classification, type of construction, and use.
Maintenance and repairs, including minor renewals and improvements, are charged to in-come as incurred.
(h) Warranty reservesThe Group provides warranty reserves for goods sold under warranty agreements. Estimates for these warranty reserves are based primarily on historical performance. In addition, they are cal-culated with reference to current information concerning specific issues.
(i) Retirement benefitsThe Company adopted the "Accounting Standard for Retirement Benefits" (Accounting Standards Board of Japan ("ASBJ") Statement No. 26, issued on May 17, 2012; hereinafter the "Standard") and "Guidance on Accounting Standard for Retirement Benefits" (ASBJ Guidance No. 25, issued on May 17, 2012; hereinafter the "Guidance") from the current
fiscal year (except for provisions described in Section 35 of the Standard and in Section 67 of the Guidance.), whereby the method has been changed to where retirement benefit obligation, net of plan assets, is recorded as net defined benefit liability, and unrecognized actuarial gain or loss and unrecognized past service cost are re-corded as net defined benefit liability.
Concerning the application of the "Accounting Standards for Retirement Benefits", based on the provisional treatment set out in Section 37 of the Standard, the effects of such changes in the current fiscal year have been reflected in remeasurements of defined benefit plans.
The straight-line basis is applied as the meth-od for attributing the expected retirement ben-efits to periods up to the current fiscal year for the caluculation of retirement benefit obligation.
Actuarial gain or loss is amortized in the year following the year in which the gain or loss is recognized primarily by the straight-line method over a period (10-11 years) within the estimated average remaining years of service of the eligible employees.
Past service cost is being amortized as incurred by the straight-line method over a period (10-11 years) within the estimated average remaining years of service of the eligible employees.
(j) Revenue recognitionIn general, sales of products, other than those exported, are recognized in the accounts upon acceptance by customers. Export sales are rec-ognized as of the date of shipment.
(k) Income taxesDeferred income taxes are recognized by the asset and liability method, whereby deferred income tax assets and liabilities are determined based on the temporary differences between
18
010_0738001372610.indd 18 2014/11/05 18:49:14
the financial statements and the tax bases of the assets and liabilities, using the enacted tax rates which will be in effect during the years in which the differences are expected to be eliminated.
(l) Net income per shareNet income per share is calculated based on the net income available for distribution to share-holders of common stock and the weighted-average number of shares of common stock out-standing during the year.
(m) Shareholders' equityAs prescribed by the Companies Act of Japan, a minimum of 1 0% from the amount expended as appropriation of surplus shall be allotted to legal retained earnings until the sum of legal capital surplus and legal retained earnings is equivalent to 25% of capital stock. In addition, the part of the sum of legal capital surplus and legal retained earn-ings that exceeds 25% of capital stock can be dis-tributed as dividends upon resolution at a shareholder's meeting.
3. U.S. dollar amountsThe Company and its domestic consolidated sub-sidiaries maintain their books of account in yen. The U.S. dollar amounts included in the consolidated fi-nancial statements and the notes thereto represent the arithmetic results of translating yen into dollars at ¥103 = U.S.$1.00, the rate of exchange prevailing on March 31, 2014.
U.S. dollar amounts are presented solely for the convenience of the reader and the transla-tion is not intended to imply that assets and li-abilities which denominated in yen have been or could readily be converted, realized or settled in U.S. dollars at the above or any other rate.
FANUC CORPORATION ANNUAL REPORT 2014
4. Financial instrumentsBasic policy to manage financial instruments and related risk(1) Group policy for financial instrumentsThe Company and its consolidated subsidiaries rely on their own resources to finance operations and do not raise funds from external sources. In addition, they do not enter into any derivative contracts.
(2) Nature and extent of risks arising from finan-cial instrumentsReceivables such as trade notes and trade ac-counts are exposed to customer credit risk and receivables in foreign currencies that arises from overseas operations are exposed to the market risk of fluctuation in foreign currency exchange rates. Investment securities, which mainly consist of stocks in business partners, are exposed to the risk of market price fluctuations.Payables such as trade notes and trade accounts are mostly due within one year.
(3) Risk management for financial instruments( i ) Management of credit risk
The Group monitors due dates and manages balances of receivables by customer in accor-dance to internal guidelines and periodically checks credit risks of key customers taking into account their financial position and other fac-tors.
( ii ) Management of market riskThe Group regularly monitors the market price and the financial condition of the issuer with respect to its securities and continuously re-views the investments made in each company, taking into account its relationship with the counterparty.
19
010_0738001372610.indd 19 2014/11/05 18:49:14

5. Other securities and investmentsOther securities whose fair value was determinable at March 31, 2013 and 2014 are summarized as follows:2013 Millions of yen
Type of securities
Book value reflected in the balance sheet
Acquisition cost Net
Other securities Equity securities ¥6,459 ¥3,280 ¥3,179 with unrealized gain Subtotal 6,459 3,280 3,179 Other securities Equity securities 18 19 (1)with unrealized loss Bonds 82 82 —
Subtotal 100 101 (1)Total ¥6,559 ¥3,381 ¥3,178
2014 Millions of yen
Type of securities
Book value reflected in the balance sheet
Acquisition cost Net
Other securities Equity securities ¥9,414 ¥3,299 ¥6,115 with unrealized gain Subtotal 9,414 3,299 6,115 Other securities Equity securities — — —with unrealized loss Bonds 1 1 —
Subtotal 1 1 —Total ¥9,415 ¥3,300 ¥6,115
2014 Thousands of U.S. dollars
Type of securities
Book value reflected in the balance sheet
Acquisition cost Net
Other securities Equity securities $91,398 $32,029 $59,369 with unrealized gain Subtotal 91,398 32,029 59,369 Other securities Equity securities — — —with unrealized loss Bonds 10 10 —
Subtotal 10 10 —Total $91,408 $32,039 $59,369
Other securities sold during the years ended March 31, 2013 and 2014 are not presented since they are insignificant.Investments at March 31, 2013 and 2014 consisted of the following:
Millions of yenThousands of U.S. dollars
2013 2014 2014Investments in affiliates ¥ 25,144 ¥ 32,252 $ 313,126 Other securities 6,635 9,491 92,146 Allowance for doubtful accounts (1) (1) (10)Other 7,327 7,675 74,515 Total ¥ 39,105 ¥ 49,417 $ 479,777
20
010_0738001372610.indd 20 2014/11/05 18:49:14
FANUC CORPORATION ANNUAL REPORT 2014
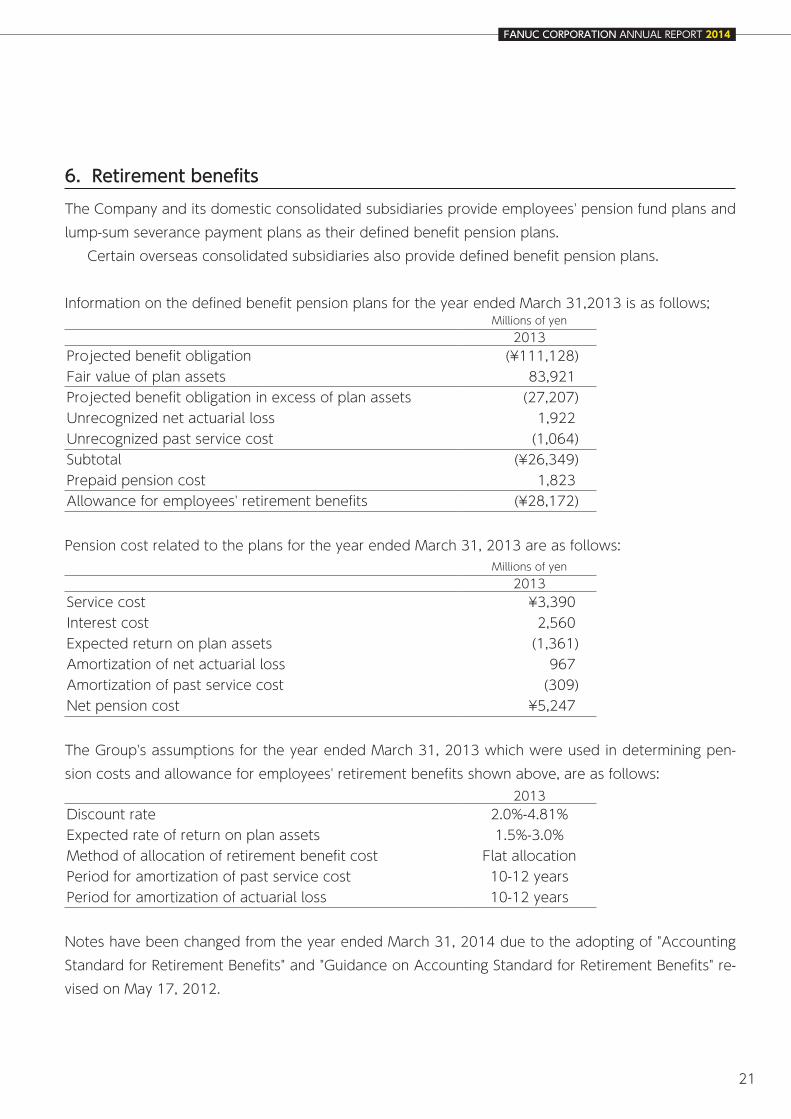
6. Retirement benefitsThe Company and its domestic consolidated subsidiaries provide employees' pension fund plans and lump-sum severance payment plans as their defined benefit pension plans.
Certain overseas consolidated subsidiaries also provide defined benefit pension plans.
Information on the defined benefit pension plans for the year ended March 31,2013 is as follows;Millions of yen
2013Projected benefit obligation (¥111,128)Fair value of plan assets 83,921 Projected benefit obligation in excess of plan assets (27,207)Unrecognized net actuarial loss 1,922 Unrecognized past service cost (1,064)Subtotal (¥26,349)Prepaid pension cost 1,823 Allowance for employees' retirement benefits (¥28,172)
Pension cost related to the plans for the year ended March 31, 2013 are as follows:Millions of yen
2013Service cost ¥3,390 Interest cost 2,560 Expected return on plan assets (1,361)Amortization of net actuarial loss 967 Amortization of past service cost (309)Net pension cost ¥5,247
The Group's assumptions for the year ended March 31, 2013 which were used in determining pen-sion costs and allowance for employees' retirement benefits shown above, are as follows:
2013Discount rate 2.0%-4.81%Expected rate of return on plan assets 1.5%-3.0%Method of allocation of retirement benefit cost Flat allocationPeriod for amortization of past service cost 10-12 yearsPeriod for amortization of actuarial loss 10-12 years
Notes have been changed from the year ended March 31, 2014 due to the adopting of "Accounting Standard for Retirement Benefits" and "Guidance on Accounting Standard for Retirement Benefits" re-vised on May 17, 2012.
21
010_0738001372610.indd 21 2014/11/05 18:49:14

The Company and its domestic consolidated subsidiaries provide employees' pension fund plans and lump-sum severance payment plans as their defined benefit pension plans.
Certain overseas consolidated subsidiaries also provide defined benefit pension plans and/or de-fined contribution pension plans.
Information on the pension plans for the year ended March 31, 2014 is as follows;
1. Defined Benefit Pension Plans(1) Changes in the projected benefit obligation (PBO)
Millions of yenThousands of U.S. dollars
2014 2014PBO at beginning of year ¥111,128 $1,078,913
Service cost 3,711 36,029 Interest cost 2,756 26,757 Actuarial gain or loss 8,809 85,524 Benefit payments (2,141) (20,786)Influence of exchange 2,524 24,505 Other 1,554 15,087
PBO at end of year ¥128,341 $1,246,029
(2) Changes in the fair value of plan assets
Millions of yenThousands of U.S. dollars
2014 2014Fair value of plan assets at beginning of year ¥83,921 $814,767
Expected return on plan assets 1,501 14,573 Actuarial gain or loss (1,294) (12,563)Employer contribution 3,618 35,126 Benefit payments (1,247) (12,107)Influence of exchange 1,410 13,689 Other (24) (233)
Fair value of plan assets at end of year ¥87,885 $853,252
22
010_0738001372610.indd 22 2014/11/05 18:49:14

FANUC CORPORATION ANNUAL REPORT 2014
(3) Amount recognized in consolidated balance sheet at end of year
Millions of yenThousands of U.S. dollars
2014 2014PBO in savings-type pension plan ¥ 124,484 $ 1,208,582 Fair value of plan assets (87,885) (853,252)
36,599 355,330 PBO in non-savings-type pension plan 3,857 37,447 Net amount of liability and asset recognized in consolidated balance sheets 40,456 392,777
Net defined benefit liability 40,456 392,777 Net amount of liability and asset recognized in consolidated balance sheets ¥ 40,456 $ 392,777
(4) Components of pension cost
Millions of yenThousands of U.S. dollars
2014 2014Service cost ¥ 3,711 $ 36,029 Interest cost 2,756 26,757 Expected return on plan assets (1,501) (14,573)Amortization of actuarial gain or loss (173) (1,679)Amortization of past service cost (302) (2,932)Other 13 126 Defined benefit cost ¥ 4,504 $ 43,728
(5) Remeasurements of defined benefit plansThe components (before adjustment of tax effect) are as follows:
Millions of yenThousands of U.S. dollars
2014 2014Unrecognized actuarial gain or loss ¥ (749) $ (7,272)Unrecognized past service cost 13,370 129,806 Total ¥ 12,621 $ 122,534
(6) Plan assets 1) Components of plan assets The components are as follows:
2014Debt securities 80%Cash and deposits 19%Other 1%Total 100%
23
010_0738001372610.indd 23 2014/11/05 18:49:15
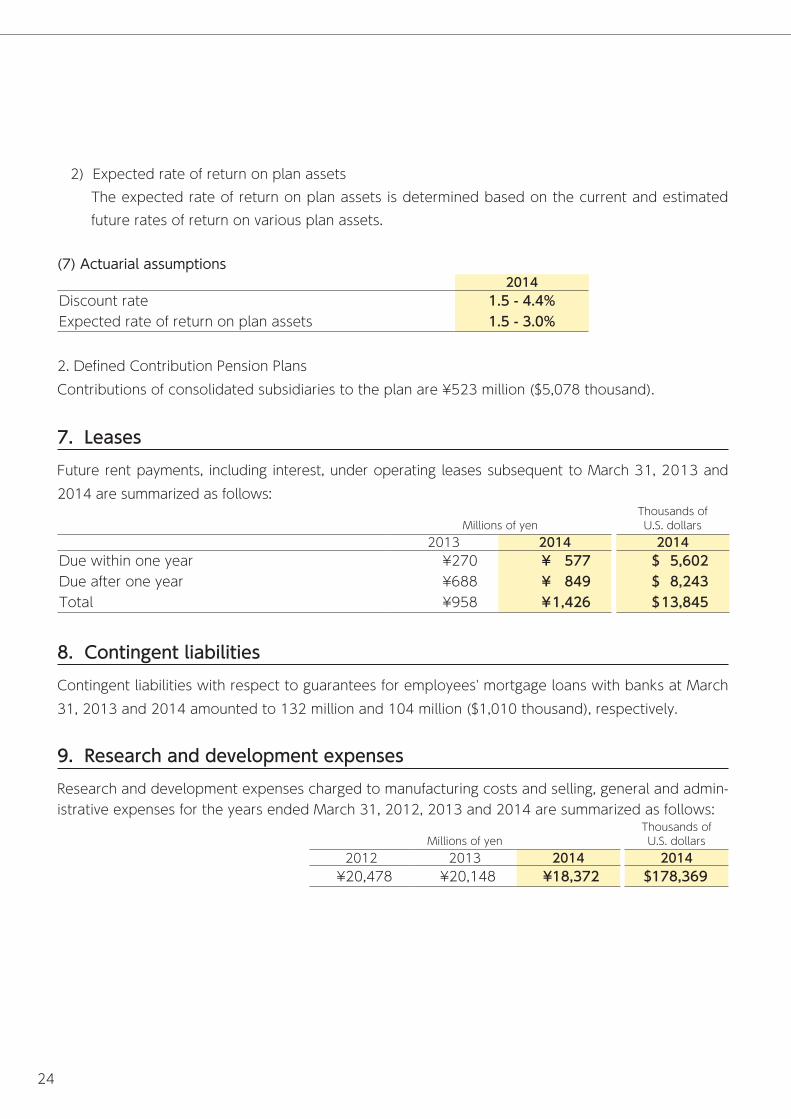
7. LeasesFuture rent payments, including interest, under operating leases subsequent to March 31, 2013 and 2014 are summarized as follows:
Millions of yenThousands of U.S. dollars
2013 2014 2014Due within one year ¥270 ¥ 577 $ 5,602 Due after one year ¥688 ¥ 849 $ 8,243 Total ¥958 ¥ 1,426 $ 13,845
8. Contingent liabilitiesContingent liabilities with respect to guarantees for employees' mortgage loans with banks at March 31, 2013 and 2014 amounted to 132 million and 104 million ($1,010 thousand), respectively.
9. Research and development expensesResearch and development expenses charged to manufacturing costs and selling, general and admin-istrative expenses for the years ended March 31, 2012, 2013 and 2014 are summarized as follows:
Millions of yenThousands of U.S. dollars
2012 2013 2014 2014¥20,478 ¥20,148 ¥18,372 $178,369
2) Expected rate of return on plan assetsThe expected rate of return on plan assets is determined based on the current and estimated future rates of return on various plan assets.
(7) Actuarial assumptions2014
Discount rate 1.5 - 4.4%Expected rate of return on plan assets 1.5 - 3.0%
2. Defined Contribution Pension PlansContributions of consolidated subsidiaries to the plan are ¥523 million ($5,078 thousand).
24
010_0738001372610.indd 24 2014/11/05 18:49:15
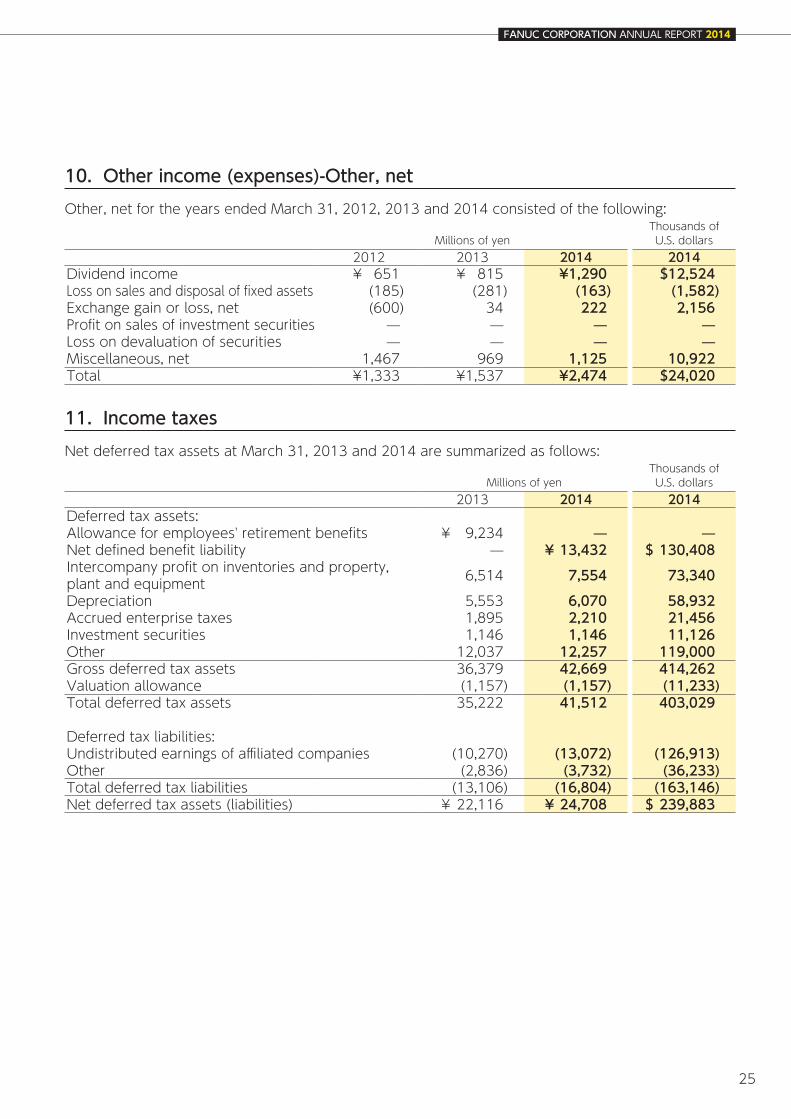
10. Other income (expenses)-Other, netOther, net for the years ended March 31, 2012, 2013 and 2014 consisted of the following:
Millions of yenThousands of U.S. dollars
2012 2013 2014 2014Dividend income ¥ 651 ¥ 815 ¥1,290 $12,524 Loss on sales and disposal of fixed assets (185) (281) (163) (1,582)Exchange gain or loss, net (600) 34 222 2,156 Profit on sales of investment securities — — — —Loss on devaluation of securities — — — —Miscellaneous, net 1,467 969 1,125 10,922 Total ¥1,333 ¥1,537 ¥2,474 $24,020
11. Income taxesNet deferred tax assets at March 31, 2013 and 2014 are summarized as follows:
Millions of yenThousands of U.S. dollars
2013 2014 2014Deferred tax assets:Allowance for employees' retirement benefits ¥ 9,234 — —Net defined benefit liability — ¥ 13,432 $ 130,408 Intercompany profit on inventories and property, plant and equipment 6,514 7,554 73,340 Depreciation 5,553 6,070 58,932 Accrued enterprise taxes 1,895 2,210 21,456 Investment securities 1,146 1,146 11,126 Other 12,037 12,257 119,000 Gross deferred tax assets 36,379 42,669 414,262 Valuation allowance (1,157) (1,157) (11,233)Total deferred tax assets 35,222 41,512 403,029
Deferred tax liabilities:Undistributed earnings of affiliated companies (10,270) (13,072) (126,913)Other (2,836) (3,732) (36,233)Total deferred tax liabilities (13,106) (16,804) (163,146)Net deferred tax assets (liabilities) ¥ 22,116 ¥ 24,708 $ 239,883
FANUC CORPORATION ANNUAL REPORT 2014
25
010_0738001372610.indd 25 2014/11/05 18:49:15
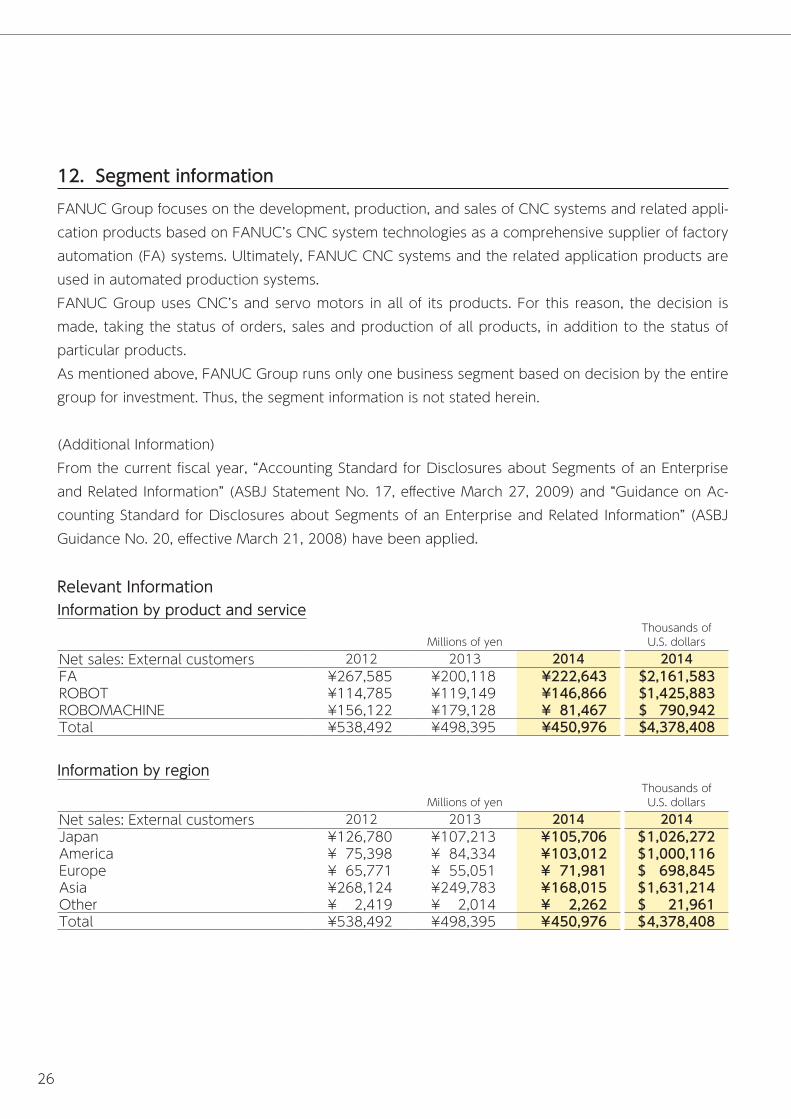
12. Segment informationFANUC Group focuses on the development, production, and sales of CNC systems and related appli-cation products based on FANUC’s CNC system technologies as a comprehensive supplier of factory automation (FA) systems. Ultimately, FANUC CNC systems and the related application products are used in automated production systems. FANUC Group uses CNC’s and servo motors in all of its products. For this reason, the decision is made, taking the status of orders, sales and production of all products, in addition to the status of particular products. As mentioned above, FANUC Group runs only one business segment based on decision by the entire group for investment. Thus, the segment information is not stated herein.
(Additional Information)From the current fiscal year, “Accounting Standard for Disclosures about Segments of an Enterprise and Related Information” (ASBJ Statement No. 17, effective March 27, 2009) and “Guidance on Ac-counting Standard for Disclosures about Segments of an Enterprise and Related Information” (ASBJ Guidance No. 20, effective March 21, 2008) have been applied.
Relevant InformationInformation by product and service
Millions of yenThousands of U.S. dollars
Net sales: External customers 2012 2013 2014 2014FA ¥267,585 ¥200,118 ¥222,643 $2,161,583 ROBOT ¥114,785 ¥119,149 ¥146,866 $1,425,883 ROBOMACHINE ¥156,122 ¥179,128 ¥ 81,467 $ 790,942 Total ¥538,492 ¥498,395 ¥450,976 $4,378,408
Information by region
Millions of yenThousands of U.S. dollars
Net sales: External customers 2012 2013 2014 2014Japan ¥ 126,780 ¥ 107,213 ¥ 105,706 $ 1,026,272 America ¥ 75,398 ¥ 84,334 ¥ 103,012 $ 1,000,116 Europe ¥ 65,771 ¥ 55,051 ¥ 71,981 $ 698,845 Asia ¥ 268,124 ¥ 249,783 ¥ 168,015 $ 1,631,214 Other ¥ 2,419 ¥ 2,014 ¥ 2,262 $ 21,961 Total ¥ 538,492 ¥ 498,395 ¥ 450,976 $ 4,378,408
26
010_0738001372610.indd 26 2014/11/05 18:49:15

FANUC CORPORATION ANNUAL REPORT 2014
13. DerivativesThe Group does not enter into any derivative contracts.
14. Related-party transactionsNo related-party transactions were recorded for the years ended March 31, 2013 and 2014.
27
010_0738001372610.indd 27 2014/11/05 18:49:15

NON-CONSOLIDATED STATEMENTS OF INCOME
Millions of yenThousands of U.S. dollars
Years ended March 31 2012 2013 2014 2014
Net sales ¥464,108 ¥407,289 ¥324,469 $3,150,184 Cost of goods sold 233,739 216,747 176,679 1,715,330
Gross profit 230,369 190,542 147,790 1,434,854 Selling, general and administrative expenses 29,862 27,921 25,596 248,505
Operating income 200,507 162,621 122,194 1,186,349
Other income (expenses):Interest income 166 212 275 2,670 Dividend income 22,646 8,597 9,932 96,427 Other, net 1,324 972 1,027 9,971
24,136 9,781 11,234 109,068
Income before income taxes 224,643 172,402 133,428 1,295,417Income taxes:
Current 83,284 60,881 45,984 446,447 Deferred (662) 339 446 4,330
82,622 61,220 46,430 450,777 Net income ¥142,021 ¥111,182 ¥ 86,998 $ 844,640
Yen U.S. dollars
Net income per share of common stock: ¥ 725.57 ¥ 568.06 ¥ 444.56 $ 4.32
Note: The U.S. dollar amounts are converted from yen, for convenience only, at the rate of ¥103 = U.S.$1.00.
28
010_0738001372610.indd 28 2014/11/05 18:49:15

FANUC CORPORATION ANNUAL REPORT 2014
NON-CONSOLIDATED BALANCE SHEETS
Millions of yenThousands of U.S. dollars
As of March 31 2013 2014 2014ASSETSCurrent assets:
Cash and cash equivalents ¥ 587,931 ¥ 634,111 $ 6,156,417 Receivables, trade:
Accounts and notes 38,285 39,688 385,320 Subsidiaries and affiliates 15,863 18,888 183,379 Allowance for doubtful accounts (539) (545) (5,291)
Inventories 39,628 50,699 492,223 Deferred income taxes 8,692 8,336 80,932 Other current assets 5,006 3,681 35,738
Total current assets 694,866 754,858 7,328,718 Investments and long-term loans:
Subsidiaries and affiliates 108,539 107,337 1,042,107 Deferred income taxes 11,265 10,251 99,524 Other 6,663 9,586 93,068
Total investments and long-term loans 126,467 127,174 1,234,699 Property, plant and equipment, at cost:
Land 106,836 106,945 1,038,301 Buildings 194,148 202,592 1,966,913 Machinery and equipment 113,439 127,476 1,237,631 Construction in progress 21,736 6,153 59,738
436,159 443,166 4,302,583 Accumulated depreciation (195,690) (206,938) (2,009,107)
Property, plant and equipment, net 240,469 236,228 2,293,476 Intangible assets 268 263 2,554 Total assets ¥ 1,062,070 ¥ 1,118,523 $ 10,859,447
LIABILITIES AND NET ASSETSCurrent liabilities:
Payables, trade:Accounts ¥ 16,684 ¥ 19,684 $ 191,107 Subsidiaries and affiliates 578 823 7,990
Accrued expenses 16,305 13,279 128,922 Accrued income taxes 28,061 26,863 260,806 Warranty reserves 1,970 2,012 19,534 Other current liabilities 2,284 2,374 23,049
Total current liabilities 65,882 65,035 631,408 Long-term liabilities:
Allowance for employees' retirement benefits 25,403 25,410 246,699 Asset retirement obligations 2,796 2,825 27,427
Total long-term liabilities 28,199 28,235 274,126
NET ASSETSShareholders' equity:
Common stock:Authorized - 400,000,000 sharesIssued - 239,508,317 shares 69,014 69,014 670,039
Capital surplus 96,119 96,122 933,223 Retained earnings 1,111,551 1,167,462 11,334,583 Treasury stock, at cost (311,636) (312,299) (3,032,029)
Total shareholders' equity 965,048 1,020,299 9,905,816 Valuation and translation adjustments:
Net unrealized holding gain on other securities 2,941 4,954 48,097 Total net assets 967,989 1,025,253 9,953,913
Total liabilities and net assets ¥ 1,062,070 ¥ 1,118,523 $ 10,859,447 Note: The U.S. dollar amounts are converted from yen, for convenience only, at the rate of ¥103 = U.S.$1.00. 29
010_0738001372610.indd 29 2014/11/05 18:49:15

Global Network
FANUC CORPORATION (Headquarters)Oshino-Mura, Yamanashi, Japan
FANUC AmericaDetroit, U.S.A.
FANUC EuropeThe Grand Duchy of Luxembourg
BEIJING-FANUCBeijing, China
FANUC Global Service NetworkOver 230 Offices in 45 Countries and Growing
Stuttgart
Odenso Tuusula
Saint-PetersburgMoscow
Wrociaw
Gurgaon
Beijing
Wohan
Shen zhen
Chengdu
Bangkok
RajkotMumbai
PuneCoimbatore Bangalore
Kuata LumpurSingapore
Jakarta
Adelaide
Melbourne
Sydney
Brisbane
Ho Chi Minh
Hanoi
Manila
TaichungShanghai
Changwon
Chennai
Tmava
IstanbulSofia
Praha
Budapost
Johannesburg
Durban
Port Elizabeth
Milan
Bologna
Biel
Lyon
Barcelona
Oslo
Stockholm
Dusseidorf
Luxembourg
London
Coventry
Paris
ElgoibarVigo
Porto
30
010_0738001372610.indd 30 2014/11/05 18:49:16

Dallas
FANUC INDIABangalore, India
SHANGHAI-FANUC RoboticsShanghai, China
TAIWAN FANUC FATaichung, Taiwan
KOREA FANUCChangwon, Korea
Auckland Buenos Aires
Sao Paulo
Manaus
San Francisco
Los Angeles
Mexico City
Atlanta
Cincinnati
Chariotte
ClevelandNew Jersey
Boston
Toronto
Detroit
Chicago
Minneapolis
Headquarters
ロボット ロボマシン
FANUC CORPORATION ANNUAL REPORT 2014
31
010_0738001372610.indd 31 2014/11/05 18:49:16

FANUC CORPORATIONWeb Site: http://www.fanuc.co.jp/
010_0738001372610.indd 1 2014/11/05 18:49:06