automatic detection of conserved rna structure elements in
TRANSCRIPT
1998 Oxford University Press 3825–3836Nucleic Acids Research, 1998, Vol. 26, No. 16
Automatic detection of conserved RNA structureelements in complete RNA virus genomesIvo L. Hofacker 1, Martin F ekete1, Christoph Flamm 1, Martijn A. Huynen 2,3, Susanne Rauscher 1, Paul E. Stolorz 4 and Peter F. Stadler 1,5,*
1Institut für Theoretische Chemie, Universität Wien, Wien, Austria, 2EMBL, Heidelberg, Germany, 3Max DelbrückCenter, Berlin, Germany, 4Jet Propulsion Laboratory, California Institute of Technology, Pasadena, CA, USA and5The Santa Fe Institute, Santa Fe, NM, USA
Received March 13, 1998; Revised and Accepted June 25, 1998
ABSTRACT
We propose a new method for detecting conservedRNA secondary structures in a family of related RNAsequences. Our method is based on a combination ofthermodynamic structure prediction and phylogeneticcomparison. In contrast to purely phylogeneticmethods, our algorithm can be used for small data setsof ∼10 sequences, efficiently exploiting the informationcontained in the sequence variability. The procedureconstructs a prediction only for those parts ofsequences that are consistent with a single conservedstructure. Our implementation produces reasonableconsensus structures without user interference. As anexample we have analysed the complete HIV-1 andhepatitis C virus (HCV) genomes as well as the smallsegment of hantavirus. Our method confirms theknown structures in HIV-1 and predicts previouslyunknown conserved RNA secondary structures in HCV.
INTRODUCTION
One of the major problems facing computational molecularbiology is the fact that sequence information is available in fargreater quantities than information about the three-dimensionalstructure of biopolymers. While the prediction of three-dimensionalRNA structures from sequence data is unfeasible at present (see,however, 1 for a promising approach), the prediction of secondarystructure is in principle tractable even for large molecules.Functional secondary structures are conserved in evolution (seefor instance 2) and they represent a qualitatively importantdescription of the molecules, as documented by their applicationto the interpretation of molecular evolution data.
Almost all RNA molecules and, consequently, also almost allsub-sequences of a large RNA molecule form secondarystructures. The presence of secondary structure in itself thereforedoes not indicate any functional significance. In this contributionwe show that potentially functional RNA structures can beidentified by a purely computational procedure that combinesstructure prediction and sequence comparison. RNA viruses arean ideal proving ground for testing such a method.(i) Distant groups of RNA viruses have very little or no detectablesequence homology and often very different genomic organiz-
ation. Thus we can test our approach on essentially independentdata sets.(ii) RNA viruses show an extremely high mutation rate, of theorder of 10–5–10–3 mutations per nucleotide and replication. Dueto this high mutation rate they form quasi-species, i.e. diffuse‘clouds’ in sequence space (3), and their sequences evolve at avery high rate. In contrast, functional secondary structures arestrongly conserved. Due to the high sequence variation, theapplication of classical methods of sequence analysis is, therefore,difficult or outright impossible. Indeed, except for the familyMononegavirales (negative-stranded RNA viruses), there is noaccepted taxonomy above the genus level.(iii) The high mutation rate of RNA viruses also explains theirshort genomes, of less than ∼20 000 nt (3). A large number ofcomplete genomic sequences is available in databases. Thenon-coding regions are most likely functionally important, sincethe high selection pressure acting on viral replication rates makes‘junk RNA’ very unlikely. So far, a number of relevant secondarystructures have been determined that play a role during thevarious stages of the viral life cycle in a variety of different classesof viruses, for instance lentiviruses (4–6), RNA phages (7,8),flaviviruses (9), pestiviruses (10,11), picorna viruses (12–17),hepatitis C viruses (10,18) and hepatitis D virus (19).
Three unrelated groups of viruses, which contain a variety ofhuman pathogens of global medical importance, will serve asexamples (see Fig. 1 for details). HIV-1 is a highly complexretrovirus. Its genome is dense with information for coding ofproteins and biologically significant RNA secondary structures. Thelatter play a role in both the entire genomic HIV-1 sequence and inthe separate HIV-1 mRNAs, which are basically (combined)fragments of the entire genome. Flaviviridae are small envelopedparticles with an unsegmented, plus-stranded RNA genome. Thisvirus family contains the genera flavivirus (which includes theviruses causing Japanese encephalitis, dengue fever, yellow feverand tick-borne encephalitis), pestivirus, hepatitis C and the recentlydiscovered hepatitis G viruses (see 20 for a recent summary).Hantaviruses are serologically related members of the familyBunyaviridae (21). They are enveloped viruses with a tripartitenegative sense RNA genome. The three genome segments are calledL, M and S, encoding the viral transcriptase, envelope glyco-proteins and nucleocapsid protein respectively. In this contributionwe shall be concerned only with the small (S) segment. Hantaviruses
*To whom correspondence should be addressed at: Institut für Theoretische Chemie, Universität Wien, Währingerstrasse 17, A-1090 Wien, Austria.Tel: +43 1 40480 665; Fax: +43 1 40480 660; Email: [email protected]
Dow
nloaded from https://academ
ic.oup.com/nar/article/26/16/3825/1022402 by guest on 28 N
ovember 2021

Nucleic Acids Research, 1998, Vol. 26, No. 163826
Figure 1. (Top) Organization of a retrovirus genome (HIV-1) and a Flaviviridae genome (hepatitis C). Proteins are shown on top, known features of the RNA areindicated below. The major genes of HIV-1 are gag, pol, env, tat and rev. The gag gene codes for structural proteins for the viral core. The pol gene codes among othersfor the reverse transcriptase and the protein that integrates the viral DNA (after reverse transcription) into the host DNA. The env gene codes for the envelope proteins.The tat and rev genes code for regulatory proteins, Tat and Rev, that can bind to TAR and the RRE respectively. INS1, INS2 and CRS are RNA sequences that destabilizethe transcript in the absence of the Rev protein. FSH refers to the hairpin that is involved in the ribosomal frameshift from gag to pol during translation. Poly(A) refersto the polyadenylation signal. PBS is the primer binding site. For references see Huynen and Konings (67). (Bottom) About 90% of the ∼10 kb genomes of flaviviridaeis taken up by a single long open reading frame that encodes a polyprotein which is co- and post-translationally cleaved by viral and cellular proteases into 10 viralproteins (for a review see 68). The flanking NCRs are believed to contain cis-acting elements important for replication, translation and packaging. The X-tail, a highlyconserved sequence of 98 nt beyond a poly(U) stretch of variable length, might play an important role in the initiation of genomic replication (18). A and B denotethe location of the two structural elements shown in Figures 5 and 6 respectively.
have been implicated as aetiological agents for two acute diseases:hemorrhagic fever with renal syndrome (HFRS) and hantaviruspulmonary syndrome (HPS). Both diseases are carried by rodentvectors.
The total length of the genomic sequences of HIV-1 and hepatitisC virus (HCV), of the order of 10 000 nt, makes experimentalanalysis of the secondary structure of full genomes unfeasible. ForRNAs of this size, structure prediction based on thermodynamicconstraints is the only approach that is available at present.
MATERIALS AND METHODS
RNA structure prediction
RNA secondary structures are predicted as minimum energystructures by means of dynamic programming techniques(22–25). An efficient implementation of this algorithm is part ofthe Vienna RNA Package (available at http://www.tbi.univie.ac.at/∼ivo/RNA/ ; 26). Complete HIV and HCV genomes were foldedon CalTech’s Delta using the message-passing version of theminimum folding algorithm described by Hofacker et al. (5,27).This version uses energy parameters based on Freier et al. (28),Jaeger et al. (29) and He et al. (30), but ignores dangling ends.The parameters are identical to those in Michael Zuker’s mfold2.2 with the exception that stacking energies involving GU pairswere taken from He et al. (30). All other foldings were performedusing version 1.2 of the package, which uses an updatedparameter set described in Walter et al. (31).
Sequence and structure comparison
While computation of the secondary structures is a straight-forward (yet computationally demanding) task, their comparisonis less obvious.
A variety of combined alignment plus structure predictionprocedures have been proposed (32–34). The problem with thisapproach is three-fold for our task. (i) The computational effortsbecome prohibitive for longer sequences: CPU time scales of theorder of n4 in the approximate algorithm (32) and n3m in the exactversion (33), where n is the length of the sequence and m thenumber of sequences, by far exceed the available resources.(ii) Viral sequences show a large variation in sequence similarityalong the chain. Furthermore, we do not expect a conservedsecondary structure for all parts of the sequence, even if there isa significant level of sequence conservation. Combined foldingand alignment algorithms will, therefore, produce poor alignmentsin such cases. (iii) The use of a combined algorithm for predictingstructure and alignment would not allow independent verificationof the predicted structural elements. The possibility of verifyingthe predicted structures, however, is particularly important whendealing with the relatively sparse data sets that are available.
We start the comparison procedure with an alignment of thesequences that is obtained without any reference to the predictedstructures. The multiple sequence alignments are calculated usingCLUSTAL W (35). A good alignment is a prerequisite for thesuccess of our method. We find, however, that regions withconserved structures tend to align well, at least locally. We did notfind it necessary to improve the alignments based on visualinspection. A modification of the alignment taking into accountalready predicted structures might increase the number ofcompensatory mutations and possibly also the number of detectedstructural elements. However, it would compromise the use of thesequence data for verifying the predicted structures.
The sequence alignment is then used to produce an alignmentof the secondary structures by introducing the appropriate gapsinto the minimum energy foldings. Up to this point our procedureis essentially the same as Riesner’s ConStruct (36), although we
Dow
nloaded from https://academ
ic.oup.com/nar/article/26/16/3825/1022402 by guest on 28 N
ovember 2021
3827
Nucleic Acids Research, 1994, Vol. 22, No. 1Nucleic Acids Research, 1998, Vol. 26, No. 163827
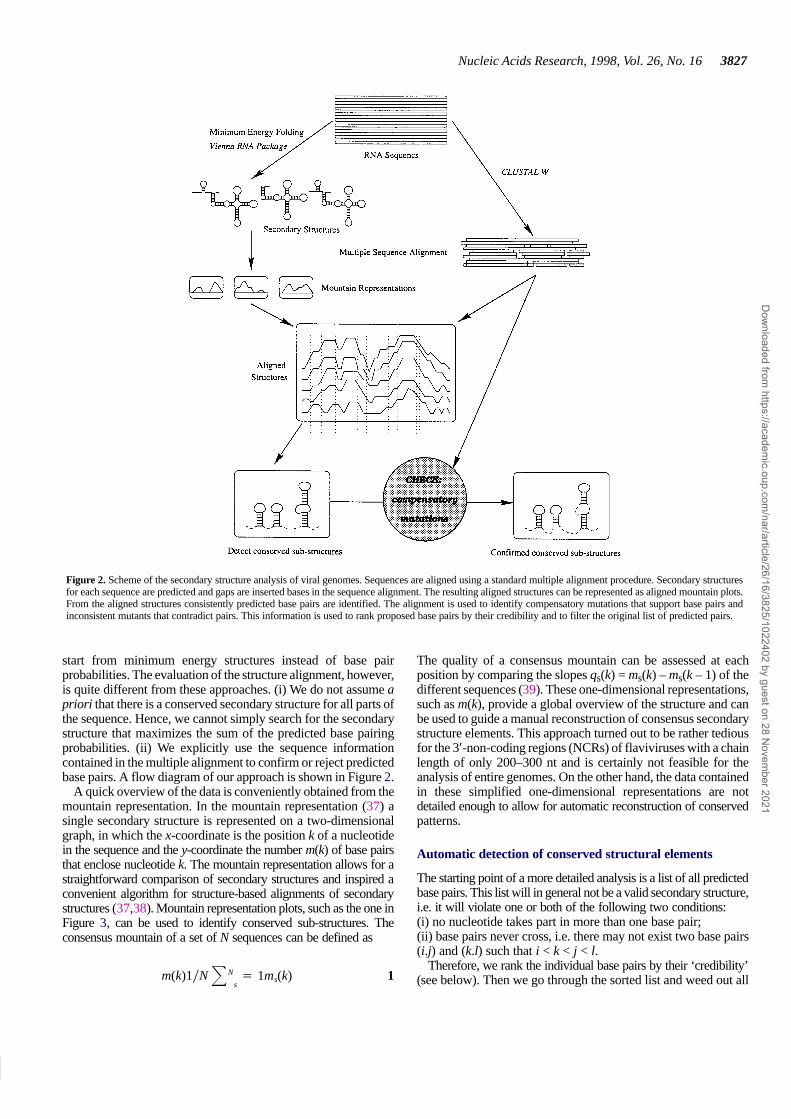
Figure 2. Scheme of the secondary structure analysis of viral genomes. Sequences are aligned using a standard multiple alignment procedure. Secondary structuresfor each sequence are predicted and gaps are inserted bases in the sequence alignment. The resulting aligned structures can be represented as aligned mountain plots.From the aligned structures consistently predicted base pairs are identified. The alignment is used to identify compensatory mutations that support base pairs andinconsistent mutants that contradict pairs. This information is used to rank proposed base pairs by their credibility and to filter the original list of predicted pairs.
start from minimum energy structures instead of base pairprobabilities. The evaluation of the structure alignment, however,is quite different from these approaches. (i) We do not assume apriori that there is a conserved secondary structure for all parts ofthe sequence. Hence, we cannot simply search for the secondarystructure that maximizes the sum of the predicted base pairingprobabilities. (ii) We explicitly use the sequence informationcontained in the multiple alignment to confirm or reject predictedbase pairs. A flow diagram of our approach is shown in Figure 2.
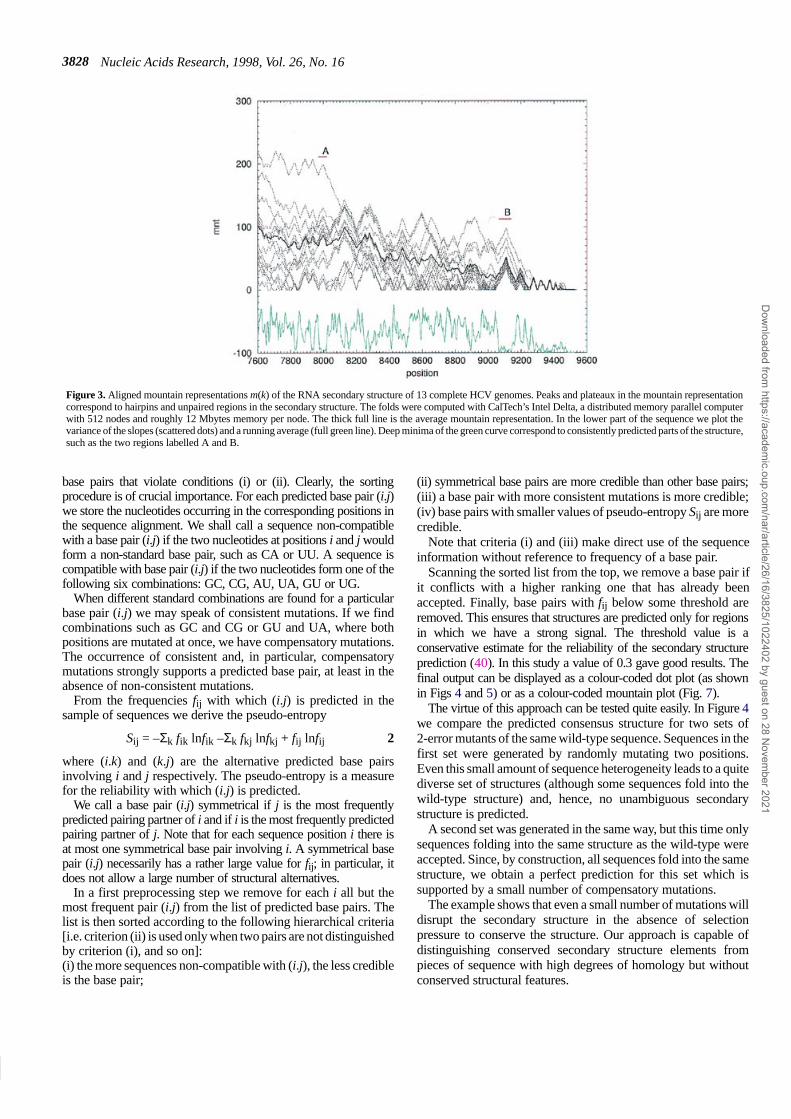
A quick overview of the data is conveniently obtained from themountain representation. In the mountain representation (37) asingle secondary structure is represented on a two-dimensionalgraph, in which the x-coordinate is the position k of a nucleotidein the sequence and the y-coordinate the number m(k) of base pairsthat enclose nucleotide k. The mountain representation allows for astraightforward comparison of secondary structures and inspired aconvenient algorithm for structure-based alignments of secondarystructures (37,38). Mountain representation plots, such as the one inFigure 3, can be used to identify conserved sub-structures. Theconsensus mountain of a set of N sequences can be defined as
m(k)1�N�N
s� 1ms(k) 1
The quality of a consensus mountain can be assessed at eachposition by comparing the slopes qs(k) = ms(k) – ms(k – 1) of thedifferent sequences (39). These one-dimensional representations,such as m(k), provide a global overview of the structure and canbe used to guide a manual reconstruction of consensus secondarystructure elements. This approach turned out to be rather tediousfor the 3′-non-coding regions (NCRs) of flaviviruses with a chainlength of only 200–300 nt and is certainly not feasible for theanalysis of entire genomes. On the other hand, the data containedin these simplified one-dimensional representations are notdetailed enough to allow for automatic reconstruction of conservedpatterns.
Automatic detection of conserved structural elements
The starting point of a more detailed analysis is a list of all predictedbase pairs. This list will in general not be a valid secondary structure,i.e. it will violate one or both of the following two conditions:(i) no nucleotide takes part in more than one base pair;(ii) base pairs never cross, i.e. there may not exist two base pairs(i.j) and (k.l) such that i < k < j < l.
Therefore, we rank the individual base pairs by their ‘credibility’(see below). Then we go through the sorted list and weed out all
Dow
nloaded from https://academ
ic.oup.com/nar/article/26/16/3825/1022402 by guest on 28 N
ovember 2021
Nucleic Acids Research, 1998, Vol. 26, No. 163828
Figure 3. Aligned mountain representations m(k) of the RNA secondary structure of 13 complete HCV genomes. Peaks and plateaux in the mountain representationcorrespond to hairpins and unpaired regions in the secondary structure. The folds were computed with CalTech’s Intel Delta, a distributed memory parallel computerwith 512 nodes and roughly 12 Mbytes memory per node. The thick full line is the average mountain representation. In the lower part of the sequence we plot thevariance of the slopes (scattered dots) and a running average (full green line). Deep minima of the green curve correspond to consistently predicted parts of the structure,such as the two regions labelled A and B.
base pairs that violate conditions (i) or (ii). Clearly, the sortingprocedure is of crucial importance. For each predicted base pair (i.j)we store the nucleotides occurring in the corresponding positions inthe sequence alignment. We shall call a sequence non-compatiblewith a base pair (i.j) if the two nucleotides at positions i and j wouldform a non-standard base pair, such as CA or UU. A sequence iscompatible with base pair (i.j) if the two nucleotides form one of thefollowing six combinations: GC, CG, AU, UA, GU or UG.
When different standard combinations are found for a particularbase pair (i.j) we may speak of consistent mutations. If we findcombinations such as GC and CG or GU and UA, where bothpositions are mutated at once, we have compensatory mutations.The occurrence of consistent and, in particular, compensatorymutations strongly supports a predicted base pair, at least in theabsence of non-consistent mutations.
From the frequencies fij with which (i.j) is predicted in thesample of sequences we derive the pseudo-entropy
Sij = –Σk fik lnfik –Σk fkj lnfkj + fij lnfij 2
where (i.k) and (k.j) are the alternative predicted base pairsinvolving i and j respectively. The pseudo-entropy is a measurefor the reliability with which (i.j) is predicted.
We call a base pair (i.j) symmetrical if j is the most frequentlypredicted pairing partner of i and if i is the most frequently predictedpairing partner of j. Note that for each sequence position i there isat most one symmetrical base pair involving i. A symmetrical basepair (i.j) necessarily has a rather large value for fij; in particular, itdoes not allow a large number of structural alternatives.
In a first preprocessing step we remove for each i all but themost frequent pair (i.j) from the list of predicted base pairs. Thelist is then sorted according to the following hierarchical criteria[i.e. criterion (ii) is used only when two pairs are not distinguishedby criterion (i), and so on]:(i) the more sequences non-compatible with (i.j), the less credibleis the base pair;
(ii) symmetrical base pairs are more credible than other base pairs;(iii) a base pair with more consistent mutations is more credible;(iv) base pairs with smaller values of pseudo-entropy Sij are morecredible.
Note that criteria (i) and (iii) make direct use of the sequenceinformation without reference to frequency of a base pair.
Scanning the sorted list from the top, we remove a base pair ifit conflicts with a higher ranking one that has already beenaccepted. Finally, base pairs with fij below some threshold areremoved. This ensures that structures are predicted only for regionsin which we have a strong signal. The threshold value is aconservative estimate for the reliability of the secondary structureprediction (40). In this study a value of 0.3 gave good results. Thefinal output can be displayed as a colour-coded dot plot (as shownin Figs 4 and 5) or as a colour-coded mountain plot (Fig. 7).
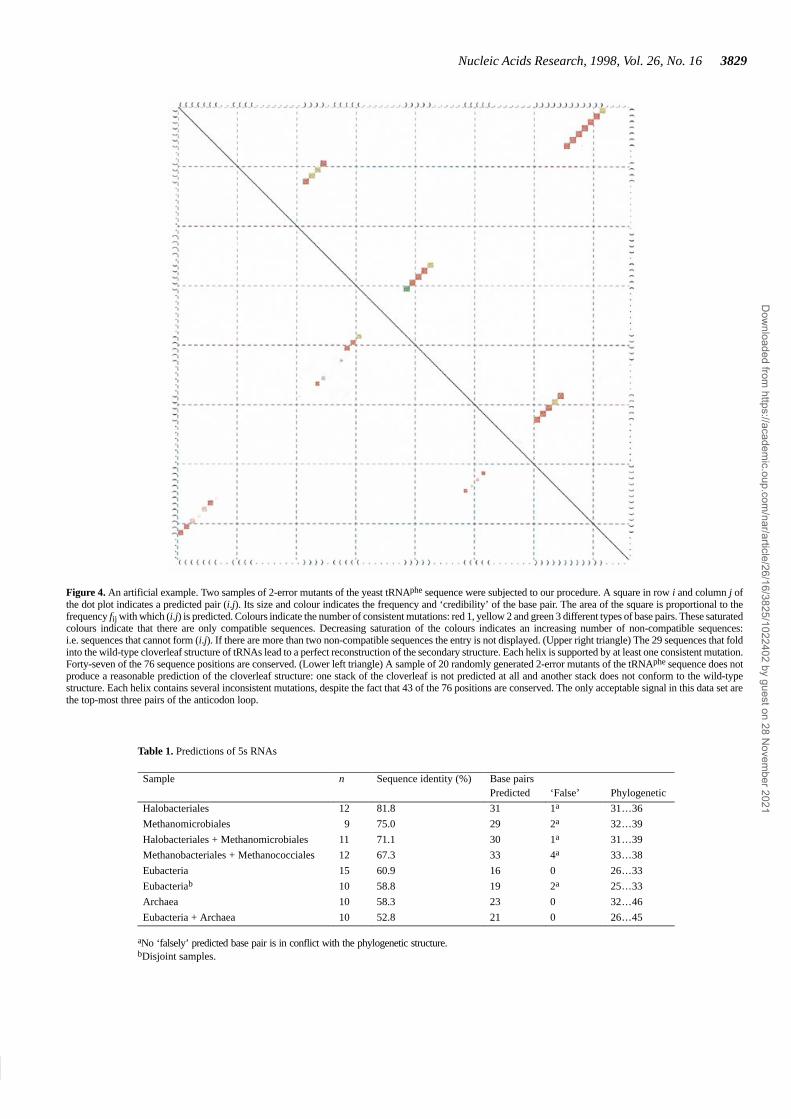
The virtue of this approach can be tested quite easily. In Figure 4we compare the predicted consensus structure for two sets of2-error mutants of the same wild-type sequence. Sequences in thefirst set were generated by randomly mutating two positions.Even this small amount of sequence heterogeneity leads to a quitediverse set of structures (although some sequences fold into thewild-type structure) and, hence, no unambiguous secondarystructure is predicted.
A second set was generated in the same way, but this time onlysequences folding into the same structure as the wild-type wereaccepted. Since, by construction, all sequences fold into the samestructure, we obtain a perfect prediction for this set which issupported by a small number of compensatory mutations.
The example shows that even a small number of mutations willdisrupt the secondary structure in the absence of selectionpressure to conserve the structure. Our approach is capable ofdistinguishing conserved secondary structure elements frompieces of sequence with high degrees of homology but withoutconserved structural features.
Dow
nloaded from https://academ
ic.oup.com/nar/article/26/16/3825/1022402 by guest on 28 N
ovember 2021
3829
Nucleic Acids Research, 1994, Vol. 22, No. 1Nucleic Acids Research, 1998, Vol. 26, No. 163829
Figure 4. An artificial example. Two samples of 2-error mutants of the yeast tRNAphe sequence were subjected to our procedure. A square in row i and column j ofthe dot plot indicates a predicted pair (i.j). Its size and colour indicates the frequency and ‘credibility’ of the base pair. The area of the square is proportional to thefrequency fij with which (i.j) is predicted. Colours indicate the number of consistent mutations: red 1, yellow 2 and green 3 different types of base pairs. These saturatedcolours indicate that there are only compatible sequences. Decreasing saturation of the colours indicates an increasing number of non-compatible sequences:i.e. sequences that cannot form (i.j). If there are more than two non-compatible sequences the entry is not displayed. (Upper right triangle) The 29 sequences that foldinto the wild-type cloverleaf structure of tRNAs lead to a perfect reconstruction of the secondary structure. Each helix is supported by at least one consistent mutation.Forty-seven of the 76 sequence positions are conserved. (Lower left triangle) A sample of 20 randomly generated 2-error mutants of the tRNAphe sequence does notproduce a reasonable prediction of the cloverleaf structure: one stack of the cloverleaf is not predicted at all and another stack does not conform to the wild-typestructure. Each helix contains several inconsistent mutations, despite the fact that 43 of the 76 positions are conserved. The only acceptable signal in this data set arethe top-most three pairs of the anticodon loop.
Table 1. Predictions of 5s RNAs
Sample n Sequence identity (%) Base pairsPredicted ‘False’ Phylogenetic
Halobacteriales 12 81.8 31 1a 31…36
Methanomicrobiales 9 75.0 29 2a 32…39
Halobacteriales + Methanomicrobiales 11 71.1 30 1a 31…39
Methanobacteriales + Methanococciales 12 67.3 33 4a 33…38
Eubacteria 15 60.9 16 0 26…33
Eubacteriab 10 58.8 19 2a 25…33
Archaea 10 58.3 23 0 32…46
Eubacteria + Archaea 10 52.8 21 0 26…45
aNo ‘falsely’ predicted base pair is in conflict with the phylogenetic structure.bDisjoint samples.
Dow
nloaded from https://academ
ic.oup.com/nar/article/26/16/3825/1022402 by guest on 28 N
ovember 2021
Nucleic Acids Research, 1998, Vol. 26, No. 163830
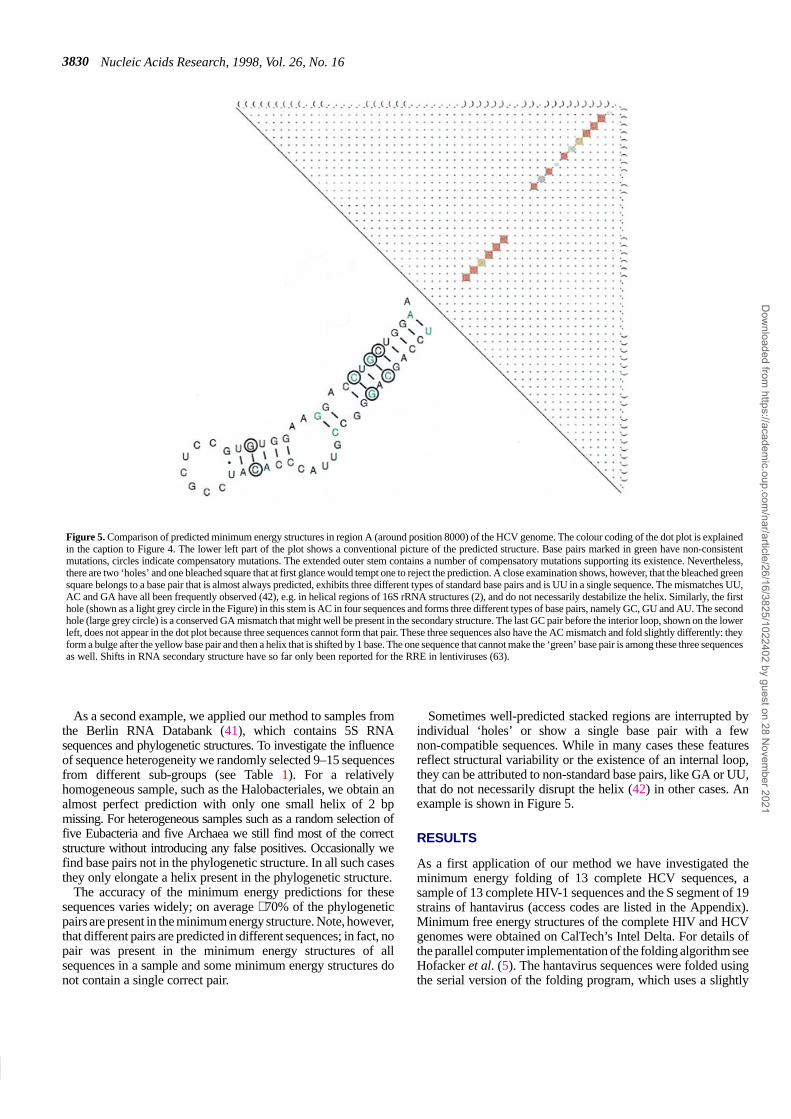
Figure 5. Comparison of predicted minimum energy structures in region A (around position 8000) of the HCV genome. The colour coding of the dot plot is explainedin the caption to Figure 4. The lower left part of the plot shows a conventional picture of the predicted structure. Base pairs marked in green have non-consistentmutations, circles indicate compensatory mutations. The extended outer stem contains a number of compensatory mutations supporting its existence. Nevertheless,there are two ‘holes’ and one bleached square that at first glance would tempt one to reject the prediction. A close examination shows, however, that the bleached greensquare belongs to a base pair that is almost always predicted, exhibits three different types of standard base pairs and is UU in a single sequence. The mismatches UU,AC and GA have all been frequently observed (42), e.g. in helical regions of 16S rRNA structures (2), and do not necessarily destabilize the helix. Similarly, the firsthole (shown as a light grey circle in the Figure) in this stem is AC in four sequences and forms three different types of base pairs, namely GC, GU and AU. The secondhole (large grey circle) is a conserved GA mismatch that might well be present in the secondary structure. The last GC pair before the interior loop, shown on the lowerleft, does not appear in the dot plot because three sequences cannot form that pair. These three sequences also have the AC mismatch and fold slightly differently: theyform a bulge after the yellow base pair and then a helix that is shifted by 1 base. The one sequence that cannot make the ‘green’ base pair is among these three sequencesas well. Shifts in RNA secondary structure have so far only been reported for the RRE in lentiviruses (63).
As a second example, we applied our method to samples fromthe Berlin RNA Databank (41), which contains 5S RNAsequences and phylogenetic structures. To investigate the influenceof sequence heterogeneity we randomly selected 9–15 sequencesfrom different sub-groups (see Table 1). For a relativelyhomogeneous sample, such as the Halobacteriales, we obtain analmost perfect prediction with only one small helix of 2 bpmissing. For heterogeneous samples such as a random selection offive Eubacteria and five Archaea we still find most of the correctstructure without introducing any false positives. Occasionally wefind base pairs not in the phylogenetic structure. In all such casesthey only elongate a helix present in the phylogenetic structure.
The accuracy of the minimum energy predictions for thesesequences varies widely; on average ∼70% of the phylogeneticpairs are present in the minimum energy structure. Note, however,that different pairs are predicted in different sequences; in fact, nopair was present in the minimum energy structures of allsequences in a sample and some minimum energy structures donot contain a single correct pair.
Sometimes well-predicted stacked regions are interrupted byindividual ‘holes’ or show a single base pair with a fewnon-compatible sequences. While in many cases these featuresreflect structural variability or the existence of an internal loop,they can be attributed to non-standard base pairs, like GA or UU,that do not necessarily disrupt the helix (42) in other cases. Anexample is shown in Figure 5.
RESULTS
As a first application of our method we have investigated theminimum energy folding of 13 complete HCV sequences, asample of 13 complete HIV-1 sequences and the S segment of 19strains of hantavirus (access codes are listed in the Appendix).Minimum free energy structures of the complete HIV and HCVgenomes were obtained on CalTech’s Intel Delta. For details ofthe parallel computer implementation of the folding algorithm seeHofacker et al. (5). The hantavirus sequences were folded usingthe serial version of the folding program, which uses a slightly
Dow
nloaded from https://academ
ic.oup.com/nar/article/26/16/3825/1022402 by guest on 28 N
ovember 2021
3831
Nucleic Acids Research, 1994, Vol. 22, No. 1Nucleic Acids Research, 1998, Vol. 26, No. 163831
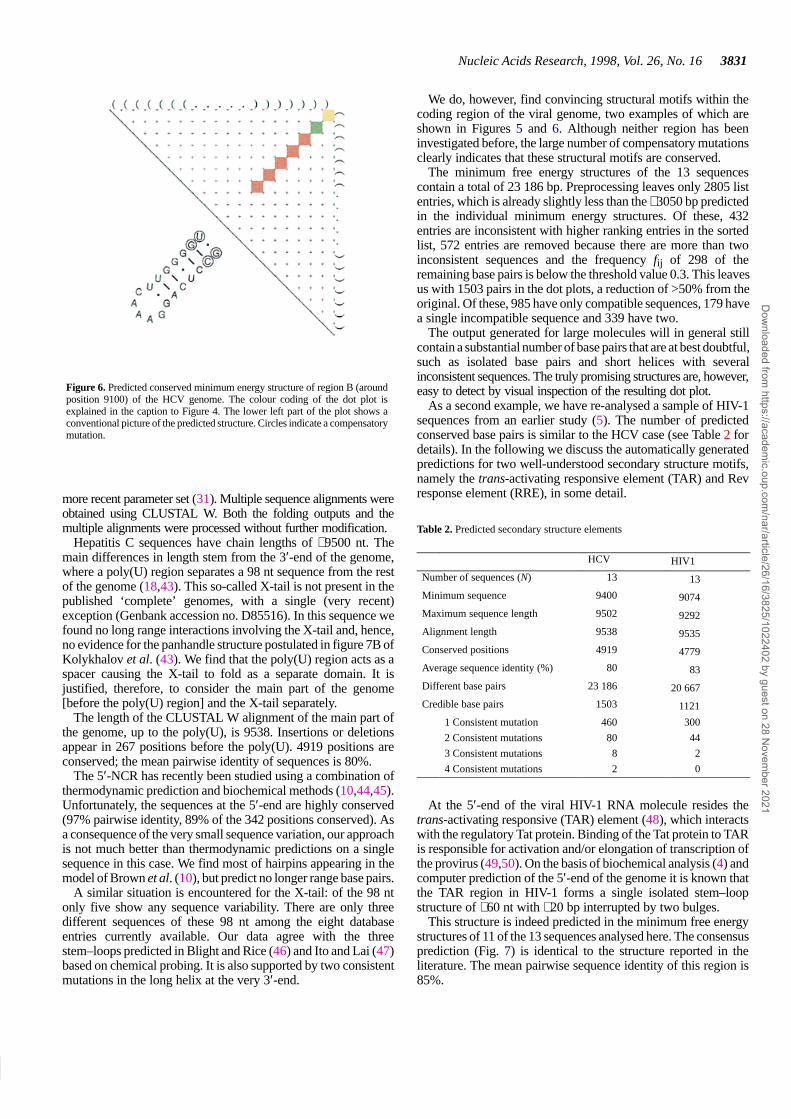
Figure 6. Predicted conserved minimum energy structure of region B (aroundposition 9100) of the HCV genome. The colour coding of the dot plot isexplained in the caption to Figure 4. The lower left part of the plot shows aconventional picture of the predicted structure. Circles indicate a compensatorymutation.
more recent parameter set (31). Multiple sequence alignments wereobtained using CLUSTAL W. Both the folding outputs and themultiple alignments were processed without further modification.
Hepatitis C sequences have chain lengths of ∼9500 nt. Themain differences in length stem from the 3′-end of the genome,where a poly(U) region separates a 98 nt sequence from the restof the genome (18,43). This so-called X-tail is not present in thepublished ‘complete’ genomes, with a single (very recent)exception (Genbank accession no. D85516). In this sequence wefound no long range interactions involving the X-tail and, hence,no evidence for the panhandle structure postulated in figure 7B ofKolykhalov et al. (43). We find that the poly(U) region acts as aspacer causing the X-tail to fold as a separate domain. It isjustified, therefore, to consider the main part of the genome[before the poly(U) region] and the X-tail separately.
The length of the CLUSTAL W alignment of the main part ofthe genome, up to the poly(U), is 9538. Insertions or deletionsappear in 267 positions before the poly(U). 4919 positions areconserved; the mean pairwise identity of sequences is 80%.
The 5′-NCR has recently been studied using a combination ofthermodynamic prediction and biochemical methods (10,44,45).Unfortunately, the sequences at the 5′-end are highly conserved(97% pairwise identity, 89% of the 342 positions conserved). Asa consequence of the very small sequence variation, our approachis not much better than thermodynamic predictions on a singlesequence in this case. We find most of hairpins appearing in themodel of Brown et al. (10), but predict no longer range base pairs.
A similar situation is encountered for the X-tail: of the 98 ntonly five show any sequence variability. There are only threedifferent sequences of these 98 nt among the eight databaseentries currently available. Our data agree with the threestem–loops predicted in Blight and Rice (46) and Ito and Lai (47)based on chemical probing. It is also supported by two consistentmutations in the long helix at the very 3′-end.
We do, however, find convincing structural motifs within thecoding region of the viral genome, two examples of which areshown in Figures 5 and 6. Although neither region has beeninvestigated before, the large number of compensatory mutationsclearly indicates that these structural motifs are conserved.
The minimum free energy structures of the 13 sequencescontain a total of 23 186 bp. Preprocessing leaves only 2805 listentries, which is already slightly less than the ∼3050 bp predictedin the individual minimum energy structures. Of these, 432entries are inconsistent with higher ranking entries in the sortedlist, 572 entries are removed because there are more than twoinconsistent sequences and the frequency fij of 298 of theremaining base pairs is below the threshold value 0.3. This leavesus with 1503 pairs in the dot plots, a reduction of >50% from theoriginal. Of these, 985 have only compatible sequences, 179 havea single incompatible sequence and 339 have two.
The output generated for large molecules will in general stillcontain a substantial number of base pairs that are at best doubtful,such as isolated base pairs and short helices with severalinconsistent sequences. The truly promising structures are, however,easy to detect by visual inspection of the resulting dot plot.
As a second example, we have re-analysed a sample of HIV-1sequences from an earlier study (5). The number of predictedconserved base pairs is similar to the HCV case (see Table 2 fordetails). In the following we discuss the automatically generatedpredictions for two well-understood secondary structure motifs,namely the trans-activating responsive element (TAR) and Revresponse element (RRE), in some detail.
Table 2. Predicted secondary structure elements
HCV HIV1
Number of sequences (N) 13 13
Minimum sequence 9400 9074
Maximum sequence length 9502 9292
Alignment length 9538 9535
Conserved positions 4919 4779
Average sequence identity (%) 80 83
Different base pairs 23 186 20 667
Credible base pairs 1503 1121
1 Consistent mutation 460 300
2 Consistent mutations 80 44
3 Consistent mutations 8 2
4 Consistent mutations 2 0
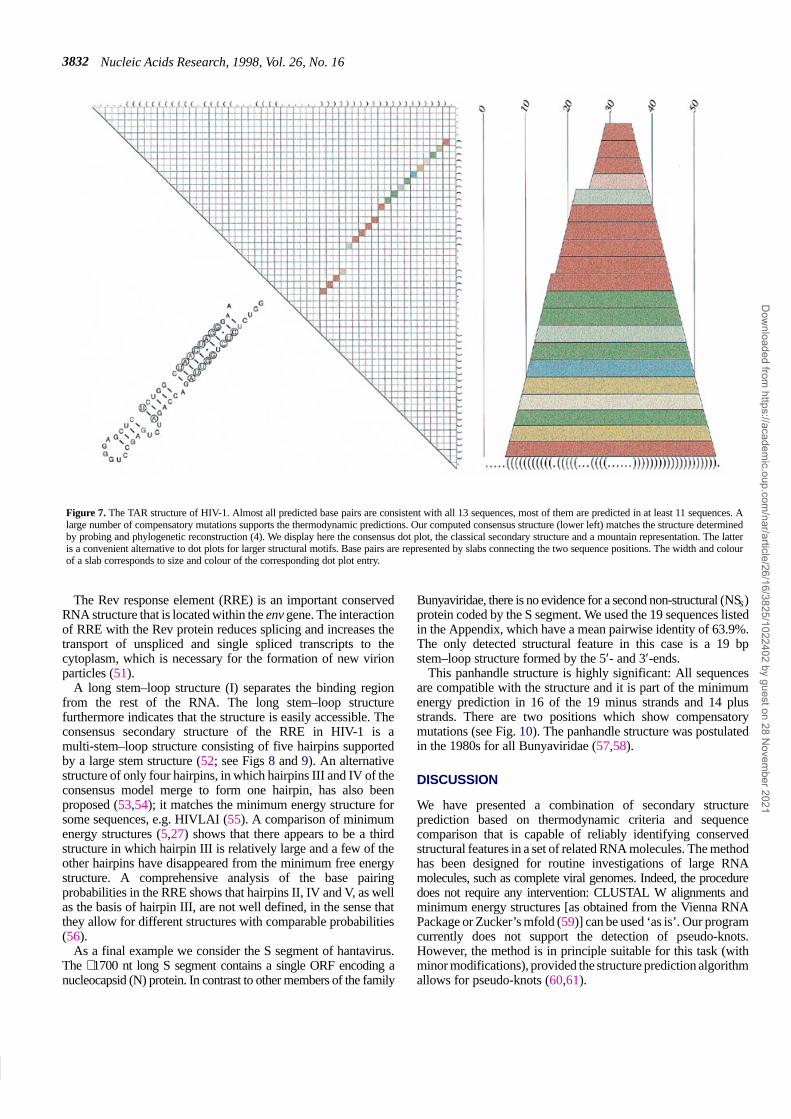
At the 5′-end of the viral HIV-1 RNA molecule resides thetrans-activating responsive (TAR) element (48), which interactswith the regulatory Tat protein. Binding of the Tat protein to TARis responsible for activation and/or elongation of transcription ofthe provirus (49,50). On the basis of biochemical analysis (4) andcomputer prediction of the 5′-end of the genome it is known thatthe TAR region in HIV-1 forms a single isolated stem–loopstructure of ∼60 nt with ∼20 bp interrupted by two bulges.
This structure is indeed predicted in the minimum free energystructures of 11 of the 13 sequences analysed here. The consensusprediction (Fig. 7) is identical to the structure reported in theliterature. The mean pairwise sequence identity of this region is85%.
Dow
nloaded from https://academ
ic.oup.com/nar/article/26/16/3825/1022402 by guest on 28 N
ovember 2021
Nucleic Acids Research, 1998, Vol. 26, No. 163832
Figure 7. The TAR structure of HIV-1. Almost all predicted base pairs are consistent with all 13 sequences, most of them are predicted in at least 11 sequences. Alarge number of compensatory mutations supports the thermodynamic predictions. Our computed consensus structure (lower left) matches the structure determinedby probing and phylogenetic reconstruction (4). We display here the consensus dot plot, the classical secondary structure and a mountain representation. The latteris a convenient alternative to dot plots for larger structural motifs. Base pairs are represented by slabs connecting the two sequence positions. The width and colourof a slab corresponds to size and colour of the corresponding dot plot entry.
The Rev response element (RRE) is an important conservedRNA structure that is located within the env gene. The interactionof RRE with the Rev protein reduces splicing and increases thetransport of unspliced and single spliced transcripts to thecytoplasm, which is necessary for the formation of new virionparticles (51).
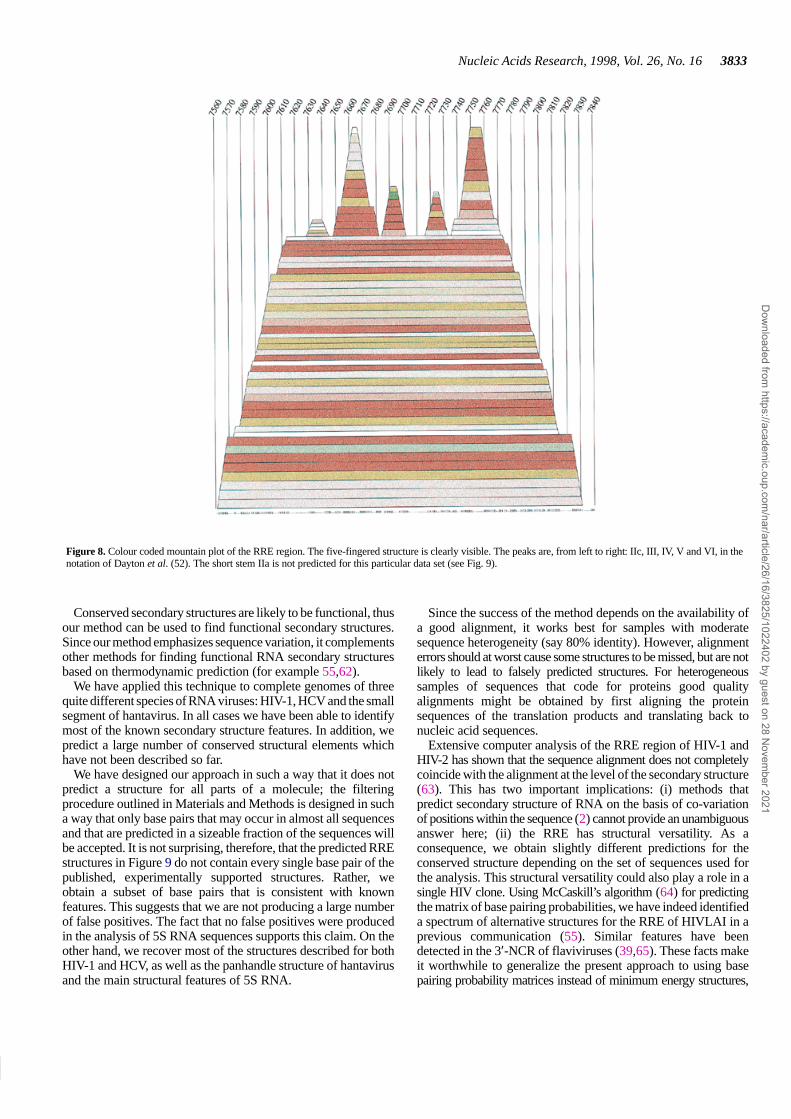
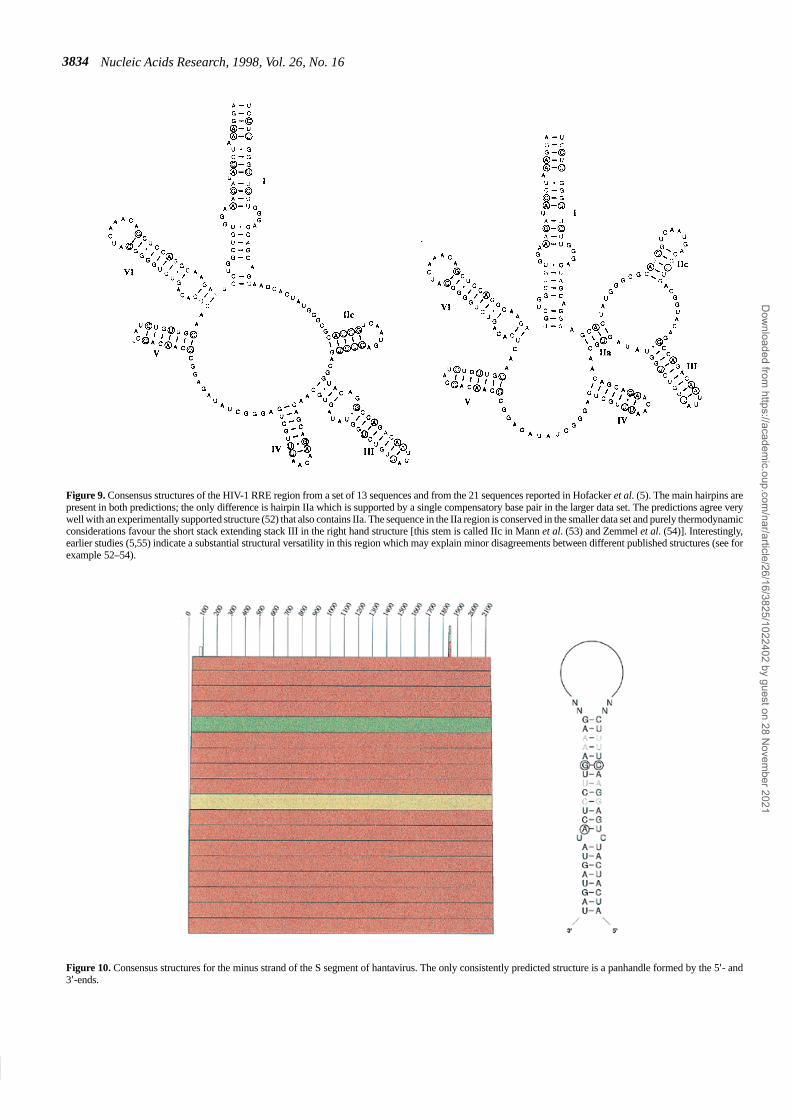
A long stem–loop structure (I) separates the binding regionfrom the rest of the RNA. The long stem–loop structurefurthermore indicates that the structure is easily accessible. Theconsensus secondary structure of the RRE in HIV-1 is amulti-stem–loop structure consisting of five hairpins supportedby a large stem structure (52; see Figs 8 and 9). An alternativestructure of only four hairpins, in which hairpins III and IV of theconsensus model merge to form one hairpin, has also beenproposed (53,54); it matches the minimum energy structure forsome sequences, e.g. HIVLAI (55). A comparison of minimumenergy structures (5,27) shows that there appears to be a thirdstructure in which hairpin III is relatively large and a few of theother hairpins have disappeared from the minimum free energystructure. A comprehensive analysis of the base pairingprobabilities in the RRE shows that hairpins II, IV and V, as wellas the basis of hairpin III, are not well defined, in the sense thatthey allow for different structures with comparable probabilities(56).
As a final example we consider the S segment of hantavirus.The ∼1700 nt long S segment contains a single ORF encoding anucleocapsid (N) protein. In contrast to other members of the family
Bunyaviridae, there is no evidence for a second non-structural (NSs)protein coded by the S segment. We used the 19 sequences listedin the Appendix, which have a mean pairwise identity of 63.9%.The only detected structural feature in this case is a 19 bpstem–loop structure formed by the 5′- and 3′-ends.
This panhandle structure is highly significant: All sequencesare compatible with the structure and it is part of the minimumenergy prediction in 16 of the 19 minus strands and 14 plusstrands. There are two positions which show compensatorymutations (see Fig. 10). The panhandle structure was postulatedin the 1980s for all Bunyaviridae (57,58).
DISCUSSION
We have presented a combination of secondary structureprediction based on thermodynamic criteria and sequencecomparison that is capable of reliably identifying conservedstructural features in a set of related RNA molecules. The methodhas been designed for routine investigations of large RNAmolecules, such as complete viral genomes. Indeed, the proceduredoes not require any intervention: CLUSTAL W alignments andminimum energy structures [as obtained from the Vienna RNAPackage or Zucker’s mfold (59)] can be used ‘as is’. Our programcurrently does not support the detection of pseudo-knots.However, the method is in principle suitable for this task (withminor modifications), provided the structure prediction algorithmallows for pseudo-knots (60,61).
Dow
nloaded from https://academ
ic.oup.com/nar/article/26/16/3825/1022402 by guest on 28 N
ovember 2021
3833
Nucleic Acids Research, 1994, Vol. 22, No. 1Nucleic Acids Research, 1998, Vol. 26, No. 163833
Figure 8. Colour coded mountain plot of the RRE region. The five-fingered structure is clearly visible. The peaks are, from left to right: IIc, III, IV, V and VI, in thenotation of Dayton et al. (52). The short stem IIa is not predicted for this particular data set (see Fig. 9).
Conserved secondary structures are likely to be functional, thusour method can be used to find functional secondary structures.Since our method emphasizes sequence variation, it complementsother methods for finding functional RNA secondary structuresbased on thermodynamic prediction (for example 55,62).
We have applied this technique to complete genomes of threequite different species of RNA viruses: HIV-1, HCV and the smallsegment of hantavirus. In all cases we have been able to identifymost of the known secondary structure features. In addition, wepredict a large number of conserved structural elements whichhave not been described so far.
We have designed our approach in such a way that it does notpredict a structure for all parts of a molecule; the filteringprocedure outlined in Materials and Methods is designed in sucha way that only base pairs that may occur in almost all sequencesand that are predicted in a sizeable fraction of the sequences willbe accepted. It is not surprising, therefore, that the predicted RREstructures in Figure 9 do not contain every single base pair of thepublished, experimentally supported structures. Rather, weobtain a subset of base pairs that is consistent with knownfeatures. This suggests that we are not producing a large numberof false positives. The fact that no false positives were producedin the analysis of 5S RNA sequences supports this claim. On theother hand, we recover most of the structures described for bothHIV-1 and HCV, as well as the panhandle structure of hantavirusand the main structural features of 5S RNA.
Since the success of the method depends on the availability ofa good alignment, it works best for samples with moderatesequence heterogeneity (say 80% identity). However, alignmenterrors should at worst cause some structures to be missed, but are notlikely to lead to falsely predicted structures. For heterogeneoussamples of sequences that code for proteins good qualityalignments might be obtained by first aligning the proteinsequences of the translation products and translating back tonucleic acid sequences.
Extensive computer analysis of the RRE region of HIV-1 andHIV-2 has shown that the sequence alignment does not completelycoincide with the alignment at the level of the secondary structure(63). This has two important implications: (i) methods thatpredict secondary structure of RNA on the basis of co-variationof positions within the sequence (2) cannot provide an unambiguousanswer here; (ii) the RRE has structural versatility. As aconsequence, we obtain slightly different predictions for theconserved structure depending on the set of sequences used forthe analysis. This structural versatility could also play a role in asingle HIV clone. Using McCaskill’s algorithm (64) for predictingthe matrix of base pairing probabilities, we have indeed identifieda spectrum of alternative structures for the RRE of HIVLAI in aprevious communication (55). Similar features have beendetected in the 3′-NCR of flaviviruses (39,65). These facts makeit worthwhile to generalize the present approach to using basepairing probability matrices instead of minimum energy structures,
Dow
nloaded from https://academ
ic.oup.com/nar/article/26/16/3825/1022402 by guest on 28 N
ovember 2021
Nucleic Acids Research, 1998, Vol. 26, No. 163834
Figure 9. Consensus structures of the HIV-1 RRE region from a set of 13 sequences and from the 21 sequences reported in Hofacker et al. (5). The main hairpins arepresent in both predictions; the only difference is hairpin IIa which is supported by a single compensatory base pair in the larger data set. The predictions agree verywell with an experimentally supported structure (52) that also contains IIa. The sequence in the IIa region is conserved in the smaller data set and purely thermodynamicconsiderations favour the short stack extending stack III in the right hand structure [this stem is called IIc in Mann et al. (53) and Zemmel et al. (54)]. Interestingly,earlier studies (5,55) indicate a substantial structural versatility in this region which may explain minor disagreements between different published structures (see forexample 52–54).
Figure 10. Consensus structures for the minus strand of the S segment of hantavirus. The only consistently predicted structure is a panhandle formed by the 5′- and3′-ends.
Dow
nloaded from https://academ
ic.oup.com/nar/article/26/16/3825/1022402 by guest on 28 N
ovember 2021

3835
Nucleic Acids Research, 1994, Vol. 22, No. 1Nucleic Acids Research, 1998, Vol. 26, No. 163835
as in ConStruct (1), despite the substantial increase in requiredcomputer resources. Preliminary data indicate a promising increasein the accuracy of predicted structures.
ACKNOWLEDGEMENTS
This research was performed in part using the CACR parallelcomputer system operated by CalTech on behalf of the Center forAdvanced Computing Research. Access to this facility wasprovided by the California Institute of Technology. Partialfinancial support by the Austrian Fonds zur Förderung derWissenschaftlichen Forschung, project no. P 12591-INF, isgratefully acknowledged. We would like to thank AndreasWagner for his comments.
REFERENCES
1 Major,F., Turcotte,M., Gautheret,D., Lapalme,G., Fillion,E. andCedergren,R. (1991) Science, 253, 1255–1260.
2 Gutell,R.R. (1993) Curr. Opin. Struct. Biol., 3, 313–322.3 Eigen,M., McCaskill,J. and Schuster,P. (1989) Adv. Chem. Phys., 75,
149–263.4 Baudin,F., Marquet,R., Isel,C., Darlix,J.L., Ehresmann,B. and
Ehresmann,C. (1993) J. Mol. Biol., 229, 382–397.5 Hofacker,I.L., Huynen,M.A., Stadler,P.F. and Stolorz,P.E. (1996) In
Proceedings of the 2nd International Conference on Knowledge Discoveryand Data Mining, Portland, OR. AAAI Press, Portland, OR, pp. 20–25.
6 Wills,P.R. and Hughes,A.J. (1990) J. AIDS, 3, 95–97.7 Biebricher,C. (1994) Ber. Bunsenges. Phys .Chem., 98, 1122–1126.8 Olsthoorn,R.C.L., Garde,G., Dayhuff,T., Atkins,J.F. and van Duin,J. (1995)
Virology, 206, 611–625.9 Shi,P.-Y., Brinton,M.A., Veal,J.M., Zhong,Y.Y. and Wilson,W.D. (1996)
Biochemistry, 35, 4222–4230.10 Brown,E.A., Zhang,H., Ping,L.-H. and Lemon,S.M. (1992)
Nucleic Acids Res., 20, 5041–5045.11 Deng,R. and Brock,K.V. (1993) Nucleic Acids Res., 21, 1949–1957.12 Duke,G.M., Hoffman,M.A. and Palmenberg,A.C. (1992) J. Virol., 66,
1602–1609.13 Hoffman,M.A. and Palmenberg,A.C. (1995) J. Virol., 69, 4399–406.14 Jackson,R.J. and Kaminski,A. (1995) RNA, 1, 985–1000.15 Le,S.Y., Chen,J.H., Sonenberg,N. and Maizel,J.V.,Jr (1993)
Nucleic Acids Res., 21, 2445–2451.16 Pilipenko,E.V., Blinov,V.M., Romanova,L.I., Sinyakov,A.N., Maslova,S.V.
and Agol,V.I. (1989) Virology, 168, 201–209.17 Rivera,V.M., Welsh,J.D. and Maizel,J.V. (1988) Virology, 165, 42–50.18 Tanaka,T., Kato,N., Cho,M.-J., Sugiyama,K. and Shimotohno,K. (1996)
J. Virol., 70, 3307–3312, 199.19 Wang,K., Choo,Q., Weiner,A., Ou,J., Najarian,R., Thayer,R., Mullenbach,G.,
Denniston,K., Gerin,J. and Houghton,M. (1986) Nature, 323, 508–514.20 Monath,T.P. and Heinz,F.X. (1996) In Fields,B.N., Knipe,D.M.,
Howley,P.M., Chanock,R.M., Melnick,J.L., Monath,T.P., Roizmann,B. andStraus,S.E. (eds), Fields Virology, 3rd Edn. Lippincott-Raven, Philadelphia,PA, pp. 961–1034.
21 Elliott,R.M., Schmaljohn,C.S. and Collett,M.S. (1991) Curr. TopicsMicrobiol. Immunol., 169, 91–141.
22 Nussinov,R., Piecznik,G., Griggs,J.R. and Kleitman,D.J. (1978) SIAM J.Appl. Math., 35, 68–82.
23 Waterman,M.S. (1978) Adv. Math. Suppl. Studies, 1, 167–212.24 Zuker,M. and Sankoff,D. (1984) Bull. Math. Biol., 46, 591–621.25 Zuker,M. and Stiegler,P. (1981) Nucleic Acids Res., 9, 133–148.26 Hofacker,I.L., Fontana,W., Stadler,P.F., Bonhoeffer,S., Tacker,M. and
Schuster,P. (1994) Monatsh. Chem., 125, 167–188.27 Hofacker,I.L., Huynen,M.A., Stadler,P.F. and Stolorz,P.E. (1996)
Technical Report no. 95-10-089. SFI, Santa Fe, NM.28 Freier,S.M., Kierzek,R., Jaeger,J.A., Sugimoto,N., Caruthers,M.H.,
Neilson,T. and Turner,D.H. (1986) Proc. Natl Acad. Sci. USA, 83,9373–9377.
29 Jaeger,J.A., Turner,D.H. and Zuker,M. (1989) Proc. Natl Acad. Sci. USA,86, 7706–7710.
30 He,L., Kierzek,R., SantaLucia,J., Walter,A.E. and Turner,D.H. (1991)Biochemistry, 30, 11124–11132.
31 Walter,A.E., Turner,D.H., Kim,J., Lyttle,M.H., Müller,P., Mathews,D.H.and Zuker,M. (1994) Proc. Natl Acad. Sci. USA, 91, 9218–9222.
32 Corodkin,J., Heyer,L.J. and Stormo,G.D. (1997) In Gaasterland,T., Karp,P.,Karplus,K., Ouzounis,C., Sander,C. and Valencia,A. (eds), Proceedings ofthe ISMB-97. AAAI Press, Menlo Park, CA, pp. 120–123.
33 Sankoff,D. (1985) SIAM J. Appl. Math., 45, 810–825.34 Tabaska,J.E. and Stormo,G.D. (1997) In Gaasterland,T., Karp,P.,
Karplus,K., Ouzounis,C., Sander,C. and Valencia,A. (eds), Proceedings ofthe ISMB-97. AAAI Press, Menlo Park, CA, pp. 311–318.
35 Thompson,J.D., Higgs,D.G. and Gibson,T.J. (1994) Nucleic Acids Res., 22,4673–4680.
36 Lück,R., Steger,G. and Riesner,D. (1996) J. Mol. Biol., 258, 813–826.37 Hogeweg,P. and Hesper,B. (1984) Nucleic Acids Res., 12, 67–74.38 Konings,D.A.M. and Hogeweg,P. (1989) J. Mol. Biol., 207, 597–614.39 Rauscher,S., Flamm,C., Mandl,C., Heinz,F.X. and Stadler,P.F. (1997) RNA,
3, 779–791.40 Huynen,M.A., Gutell,R. and Konings,D.A.M. (1997) J. Mol. Biol., 265,
1104–1112.41 Specht,T., Wolters,J. and Erdmann,V.A. (1991) Nucleic Acids Res., 19
(suppl.), 2189–2191. http //userpage.chemie.fu-berlin.de/fb chemie/ibc/agerdmann/5S rRNA.html
42 Limmer,S. (1997) Prog. Nucleic Acid Res. Mol. Biol., 57, 1–39.43 Kolykhalov,A., Feinstone,S. and Rice,C.M. (1996) J. Virol., 70,
3363–3371.44 Smith,D.B., Mellor,J., Jarvis,L.M., Davidson,F., Kolberg,J., Urdea,M.,
Yap,P., Simmonds,P. and The International HCV Collaborative StudyGroup (1995) J. Gen. Virol., 76, 1749–1761.
45 Honda,M. Brown,E.A. and Lemon,S.M. (1996) RNA, 2, 955–968.46 Blight,K.J. and Rice,C.M. (1997) J. Virol., 71, 7345–7352.47 Ito,T. and Lai,M.M.C. (1997) J. Virol., 71, 8698–8706.48 Berkhout,B. (1992) Nucleic Acids Res., 20, 27–31.49 Feng,S. and Holland,E. (1988) Nature, 334, 165–167.50 Klaver,B. and Berkhout,B. (1994) EMBO J., 13, 2650–2659.51 Malim,M.H., Hauber,J., Le,S.Y., Maizel,J.V. and Cullen,B. (1989) Nature,
338, 254–257.52 Dayton,E.T., Konings,D.A.M., Powell,D.M., Shapiro,B.A., Butini,L.,
Maizel,J.V. and Dayton,A.I. (1992) J. Virol., 66, 1139–1151.53 Mann,D., Mikaelian,I., Zemmel,R., Green,S., Lowe,A., Kimura,T.,
Singh,M., Butler,P., Gait,M. and Karn,J. (1994) J. Mol. Biol., 241, 193–207.54 Zemmel,R.W., Kelley,A.C., Karn,J. and Butler,P.J.G. (1996) J. Mol. Biol.,
258, 763–777.55 Huynen,M.A., Perelson,A.S., Viera,W.A. and Stadler,P.F. (1996)
J. Comp. Biol., 3, 253–274.56 Huynen,M.A., Stadler,P.F. and Fontana,W. (1996) Proc. Natl Acad. Sci.
USA, 93, 397–401.57 Paradigon,P.V.N., Girard,M. and Bouloy,M. (1982) Virology, 122, 191–197.58 Schmaljohn,C.S., Jennings,G.B., Hay,J. and Dalrymple,J.M. (1986)
Virology, 155, 633–643.59 Zuker,M. (1996) mfold-2.3. ftp, //snark.wustl.edu/ (free software).60 Abrahams,J.P., van den Berg,M., van Batenburg,E. and Pleij,C. (1990)
Nucleic Acids Res., 18, 3035–3044.61 Gultyaev,A.P. (1991) Nucleic Acids Res., 19, 2489–2493.62 Le,S.-Y., Chen,J.-H., Currey,K. and Maizel,J. (1988) CABIOS, 4, 153–159.63 Konings,D.A.M. (1992) Comput. Chem., 16, 153–163.64 McCaskill,J.S. (1990) Biopolymers, 29, 1105–1119.65 Mandl,C.W., Holzmann,H., Meixner,T., Rauscher,S., Stadler,P.F.,
Allison,S.L. and Heinz,F.X. (1998) J. Virol., 72, 2132–2140.66 Weiser,B. and Noller,H. (1997) XRNA. ftp, //fangio.ucsc.edu/pub/XRNA/
(public domain software).67 Huynen,M. and Konings,D. (1998) In Myers,G.L. (ed.), Viral Regulatory
Structures and Their Degeneracy, Vol. XXVIII, Santa Fe Institute Studiesin the Sciences of Complexity. Addison Wesley Longman, Reading, MA,pp. 69–82.
68 Rice,C.M. (1996) In Fields,B.N., Knipe,D.M., Howley,P.M., Chanock,R.M.,Melnick,J.L., Monath,T.P., Roizmann,B. and Straus,S.E. (eds), FieldsVirology, 3rd Edn. Lippincott-Raven, Philadelphia, PA, pp. 931–959.
APPENDIX
In this study we have used the following viral RNA sequences(Genbank accession nos are given in parentheses).
HIV-1: HIVANT70 (M31171, L20587), HIVBCSG3C(L02317), HIVCAM1 (D10112, D00917), HIVD31 (X61240,
Dow
nloaded from https://academ
ic.oup.com/nar/article/26/16/3825/1022402 by guest on 28 N
ovember 2021
Nucleic Acids Research, 1998, Vol. 26, No. 163836
X16109 U23487), HIVELI (K03454, X04414), HIVLAI(K02013), HIVMAL (K03456), HIVMVP5180 (L20571),HIVNDK (M27323), HIVOYI (M26727), HIVRF (M17451,M12508), HIVU455 (M62320) and HIVZ2Z6 (M22639).
HCV: complete genomes (except for the X-tail): HCU16362(U16362), HCU45476 (U45476), HPCCGAA (M67463),HPCCGENOM (L02836), HPCCGS (D14853), HPCEGS(D17763), HPCHCJ1 (D10749), HPCJ483 (D13558, D01217),HPCJRNA (D14484, D01173), HPCJTA (D11168, D01171),HPCK3A (D28917), HPCPP (D30613) and HPCRNA (D10934).
X-tail sequences (accession numbers only): D63922, D67091,D67092, D67093, D67094, D67095, D67096, D85516 (the lastsequence is a complete genome including the X-tail).
Hantavirus sequences: AF004660, HNVNPSS, HVU37768,HMU32591, HSU29210, KHU35255, AF005727, PHU47136,PHVSSEG, PSU47135, PUUSNP, PUVSVIN83, PUVSVIRRT,PVSZ84204, PVU22423, VRANICAS, RMU52136, HPSNUPRand TUVS5302.
The comparison algorithm described is implemented as anANSI C program alidot. It generates a text file with information onall predicted base pairs and a postscript file of the dot plot of thepredicted conserved base pairs. Alternative representations, such asthe aligned mountain plots, input files for XRNA (66) andpost-processing of XRNA output is handled by a collection of perlscripts. This software is available upon request from the authors.
Dow
nloaded from https://academ
ic.oup.com/nar/article/26/16/3825/1022402 by guest on 28 N
ovember 2021