biologia (pakistan) biologia · biologia (pakistan) issn 0006-3096 biologia (pakistan) vol. 59,...
TRANSCRIPT
BIOLOGIA (PAKISTAN) ISSN 0006-3096
BIOLOGIA
(PAKISTAN) Vol. 59, No.1, 2013
Editor-in-Chief
Dr. AZIZULLAH
Editors
PAKISTAN FOREIGN
Nusrat Jahan Jonathan Palmer (New Zealand) Ghazala Yasmeen Athar Tariq (U.S.A.) Ikram-ul-Haq C.J. Secombes (U.K.) M. R. Mirza B. Faye (France) A.U.Khan Salih Dogan (Turkey) Zaheer-ud-din Khan Wolfgang Von Engelhardt M.Sharif Mughal (Germany) Qi Bin Zhang (China)
BIOLOGICAL SOCIETY OF PAKISTAN Biological Laboratories, GC University, Lahore, Pakistan
www.biosoc.pk
BIOLOGIA (PAKISTAN) ISSN 0006-3096
BIOLOGIA
(PAKISTAN) Vol. 59, No.1, 2013
Editor-in-Chief
AZIZULLAH
Editors
PAKISTAN FOREIGN
Nusrat Jahan Jonathan Palmer (New Zealand) Ghazala Yasmeen Athar Tariq (U.S.A.) Ikram-ul-Haq C.J. Secombes (U.K.) M. R. Mirza B. Faye (France) A.U.Khan Salih Dogan (Turkey) Zaheer-ud-din Khan Wolfgang Von Engelhardt M.Sharif Mughal (Germany) Qi Bin Zhang (China)
BIOLOGICAL SOCIETY OF PAKISTAN Biological Laboratories, GC University, Lahore, Pakistan
www.biosoc.pk
BIOLOGICAL SOCIETY OF PAKISTAN Biological Laboratories, GC University, Lahore, Pakistan
PRESIDENT
M. Anwar Malik Department of Zoology,
GC University, Lahore, Pakistan
VICE PRESIDENTS
Zaheer-ud-din Khan Department of Botany,
GC University, Lahore, Pakistan
Anjum Perveen Department of Botany,
University of Karachi, Karachi, Pakistan
Rehana Asghar
Department of Biology
Mirpur, University, AJK
Nusrat Jahan
Department of Zoology
GC University, Lahore, Pakistan
Syed Akram Shah Department of Zoology,
Peshawar University, Peshawar, Pakistan
Asmatulla Kakar Department of Zoology,
University of Balochistan, Quetta, Pakistan
GENERAL SECRETARY
Ikram-ul-Haq, SI Institute of Industrial Biotechnology,
GC University, Lahore, Pakistan
JOINT SECRETARY
Muhammad Afzal Agricultural University, Faisalabad
Pakistan
MANAGING EDITORS Abdul Qayyum Khan Sulehria
Department of Zoology
GC University, Lahore. Pakistan.
Safdar Ali Mirza
Department of Botany
GC University, Lahore. Pakistan.
EDITOR-IN-CHIEF
Azizullah Department of Zoology,
GC University, Lahore, Pakistan
ADVISORY BOARD Tasneem Farasat (LCU for Women, Lahore) M. Fiaz Qamar (GC University, Lahore) Altaf Dasti (B. Z. U., Multan) Wazir Ali Baloch (University of Sindh, Jamshoro) Muhammad Ayub (DG, Fisheries Punjab) Sana Ullah Khan Khattak (University of Peshawar, Peshawar) Zahid Hussain Malik (University of AJK, Muzaffarabad) Tahira Aziz Mughal (LCU for Women, Lahore) Atta Muhammad (Univ. of Balochistan, Quetta) Aliya Rehman (karachi University) Moin-ud-Din Ahmad (Urdu Uni., of Sci. Tech., Karachi)
Pei Sheng-Ji (China) Kazuo N. Watanabe (Japan) Jin Zou (U. K.) Mary Tatnar (U. K.) William Bill Radke (U. S. A.) David B. Wilson (U. S. A.) Lee A. Meserve (U. S. A.) Fabrizio Rueca (Italy) Silvana Diverio (Italy) Giorgia Della Rocca (Italy) R. Pabst (Germany)
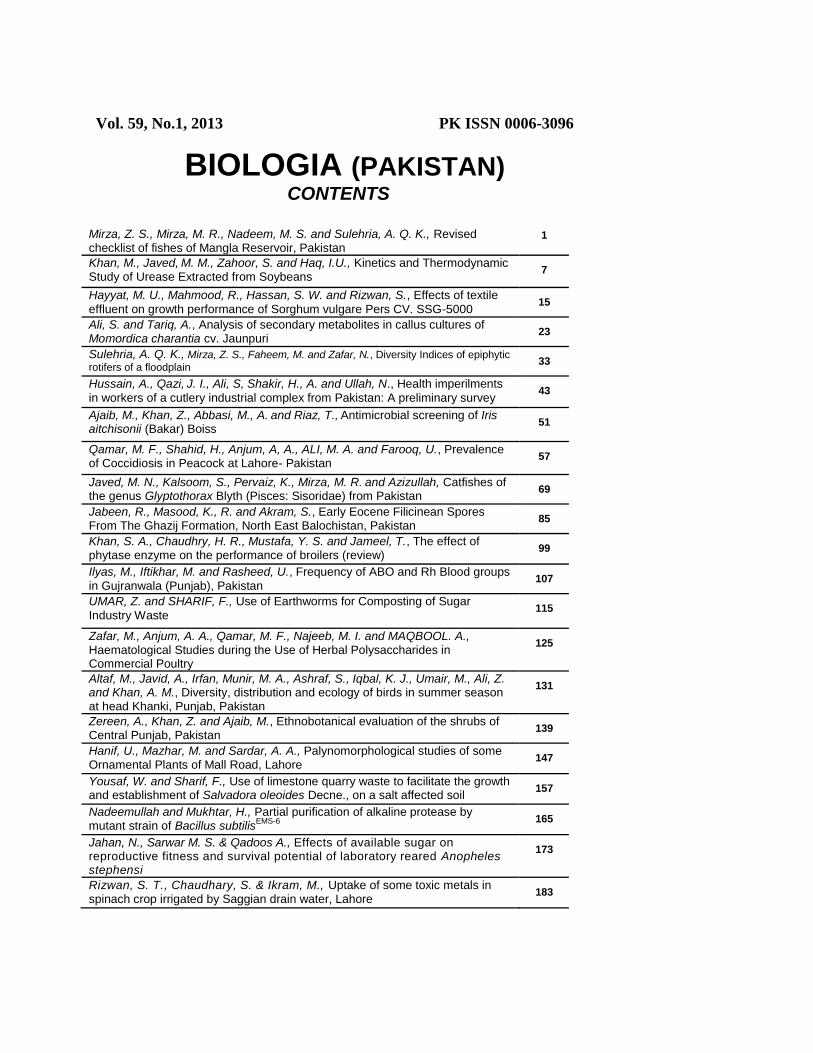
Vol. 59, No.1, 2013 PK ISSN 0006-3096
BIOLOGIA (PAKISTAN) CONTENTS
Mirza, Z. S., Mirza, M. R., Nadeem, M. S. and Sulehria, A. Q. K., Revised checklist of fishes of Mangla Reservoir, Pakistan
1
Khan, M., Javed, M. M., Zahoor, S. and Haq, I.U., Kinetics and Thermodynamic
Study of Urease Extracted from Soybeans 7
Hayyat, M. U., Mahmood, R., Hassan, S. W. and Rizwan, S., Effects of textile
effluent on growth performance of Sorghum vulgare Pers CV. SSG-5000 15
Ali, S. and Tariq, A., Analysis of secondary metabolites in callus cultures of Momordica charantia cv. Jaunpuri
23
Sulehria, A. Q. K., Mirza, Z. S., Faheem, M. and Zafar, N., Diversity Indices of epiphytic
rotifers of a floodplain 33
Hussain, A., Qazi, J. I., Ali, S, Shakir, H., A. and Ullah, N., Health imperilments
in workers of a cutlery industrial complex from Pakistan: A preliminary survey 43
Ajaib, M., Khan, Z., Abbasi, M., A. and Riaz, T.,
Antimicrobial screening of Iris
aitchisonii (Bakar) Boiss 51
Qamar, M. F., Shahid, H., Anjum, A, A., ALI, M. A. and Farooq, U., Prevalence of Coccidiosis in Peacock at Lahore- Pakistan
57
Javed, M. N., Kalsoom, S., Pervaiz, K., Mirza, M. R. and Azizullah, Catfishes of
the genus Glyptothorax Blyth (Pisces: Sisoridae) from Pakistan 69
Jabeen, R., Masood, K., R. and Akram, S., Early Eocene Filicinean Spores From The Ghazij Formation, North East Balochistan, Pakistan
85
Khan, S. A., Chaudhry, H. R., Mustafa, Y. S. and Jameel, T., The effect of phytase enzyme on the performance of broilers (review)
99
Ilyas, M., Iftikhar, M. and Rasheed, U., Frequency of ABO and Rh Blood groups
in Gujranwala (Punjab), Pakistan 107
UMAR, Z. and SHARIF, F., Use of Earthworms for Composting of Sugar
Industry Waste 115
Zafar, M., Anjum, A. A., Qamar, M. F., Najeeb, M. I. and MAQBOOL. A., Haematological Studies during the Use of Herbal Polysaccharides in Commercial Poultry
125
Altaf, M., Javid, A., Irfan, Munir, M. A., Ashraf, S., Iqbal, K. J., Umair, M., Ali, Z. and Khan, A. M., Diversity, distribution and ecology of birds in summer season at head Khanki, Punjab, Pakistan
131
Zereen, A., Khan, Z. and Ajaib, M., Ethnobotanical evaluation of the shrubs of Central Punjab, Pakistan
139
Hanif, U., Mazhar, M. and Sardar, A. A., Palynomorphological studies of some Ornamental Plants of Mall Road, Lahore
147
Yousaf, W. and Sharif, F., Use of limestone quarry waste to facilitate the growth and establishment of Salvadora oleoides Decne., on a salt affected soil
157
Nadeemullah and Mukhtar, H., Partial purification of alkaline protease by mutant strain of Bacillus subtilis
EMS-6
165
Jahan, N., Sarwar M. S. & Qadoos A., Effects of available sugar on reproductive fitness and survival potential of laboratory reared Anopheles stephensi
173
Rizwan, S. T., Chaudhary, S. & Ikram, M., Uptake of some toxic metals in spinach crop irrigated by Saggian drain water, Lahore
183
BIOLOGICAL SOCIETY OF PAKISTAN Biological Laboratories, GC University, Lahore, Pakistan
www.biosoc.pk
INSTRUCTIONS TO THE CONTRIBUTORS IN BIOLOGIA- PAKISTAN
1. (a) Manuscripts should be computer typed (in double spacing on one side of the paper
only). Two hard copies and a soft copy should be submitted, following the format of the latest volumes of Biologia-Pakistan. However, the articles can also be submitted online at [email protected].
(b) Nothing in the text should be underlined, except the scientific names which should be written in italics or underlined. (c) The manuscripts should have following margins: Paper size=11 inch (letter); Top=0.5"; Bottom=2.8"; left=1.75"; right=1.75". Manuscript must be typed according to the format
of Biologia-Pakistan, that includes (i) Complete title of the paper with the author/s name/s and addresses, (ii) corresponding author’s email address and running title. i and ii must be on first page. Start from 2
nd page iii) Abstract, (iii) Key words, (iv) Introduction, (v) Materials and Methods,
(vi) Results, (vii) Discussion. (Results and Discussion may be one heading), (viii) References. 2. The manuscripts will be charged @ Rs. 300 per page. However, for members of the Society, first page will be free and the subsequent pages will be charged at the usual basis. 3. The abstract should not exceed 250 words. It should be printed in small font. 4. The author/ s may suggest a running title not exceeding four words, for their papers. It should be indicated on the title page. 5. (a) Tables should be numbered as Table I: Table 2: Footnotes should be avoided as far as possible.
(b) Figures should be numbered as Fig.,1; Fig., 2: etc. 6. (a) Diagrams should be either original photographs, or if hand drawn, should be inked with black Indian ink.
(b) The size of an illustration, after reduction, should not exceed 4.5 x 6.5 inches. 7. (a) There will be no extra charges for black and white photographs.
(b) Colored photographs will be charged @ actual cost of the positives, plates, printing etc., involved.
8. (a) References should be cited in the text by giving the author’s name followed by the year of publication. The abbreviations of journals or books should be in italics. In case of journal, the volume number and issue number should be more bold than the
other parts of the reference. Baker, E. W., 1949. A review of the mite family Cheyletidae in the United States National Museum. Proc. U.
S. Nat. Mus., 99: 267-320.
David, L. & Weiser, J., 1994. Role of hemocytes in the propagation of a microsporidian infection in larvae of Galleria mellonella. J. Invertebr. Pathol., 63: 212-213.
Wiegand, M. D., 1992. Vitellogenesis in fish. In: Proc. Internat. Symp. Reprod. Physiol. Fish. (eds Riether, C. J. J. and Goose, H. J.), pp. 136-146.
Ward, H. B. & Whipple, G. C., 1959. Fresh Water Biology.2nd
ed. John Wiley and Sons. New York. 1248 pp.
Haq, R., Rehman, A. & Shakoori, A. R., 2001. Survival, culturing, adaptation and metal resistance of various rotifers and a gastrotrich (Minor phyla) isolated from heavily polluted industrial effluents. Pakistan J. Zool., 33(3):247-253.
Theses
Sulehria, A.Q.K., 2010. Planktonic rotifers and their role in fish growth and farm fisheries. Ph.D. Thesis. GC University, Lahore. Pakistan. 130 pp.
(b) The names of the journals and books should be abbreviated according to the latest edition of the World List of Scientific Periodicals.
9. (a) Galley-proofs will be sent to the author/ s for correction, which should be returned within a week of their receipt. 10. Author/s will receive ecopy.
ANNUAL MEMBERSHIP
PAKISTAN Life Fellow Rs. 5000.00 Fellow Rs. 1000.00 (per annum) Student Member Rs. 500.00 (Will not receive free copy (per annum) of journal)
FOREIGN Fellow US $ 30.00 (per annum)
JOURNAL SUBSCRIPTION Complete Volume Single Copy
PAKISTAN Rs. 1000.00 Rs. 500.00
FOREIGN
Surface mail US $ 100.00 US $ 60.00
Air Mail US $ 120.00 US $ 70.00
All correspondence relating to membership and publication should be addressed to:
MANAGING EDITORS Abdul Qayyum Khan Sulehria
Department of Zoology GC University, Lahore. Pakistan.
Safdar Ali Mirza Department of Botany
GC University, Lahore. Pakistan.
E-mail: [email protected] or [email protected]
BIOLOGICAL SOCIETY OF PAKISTAN Biological Laboratories, GC University, Lahore, Pakistan
www.biosoc.pk
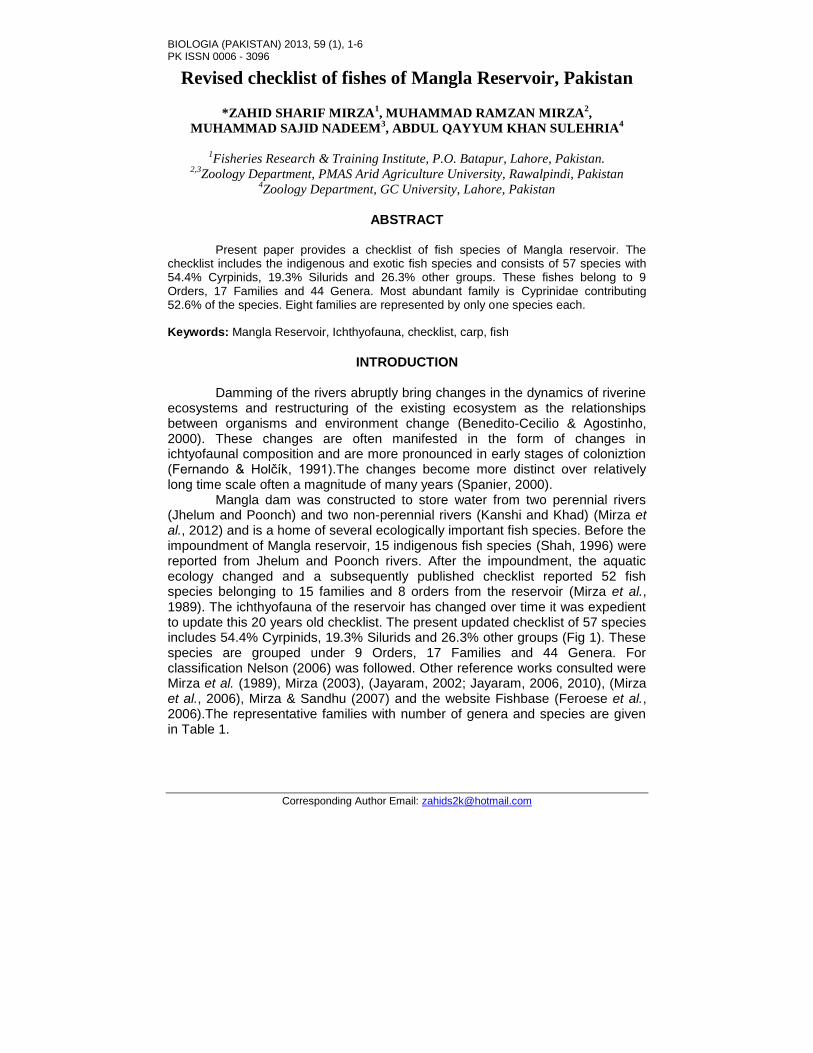
BIOLOGIA (PAKISTAN) 2013, 59 (1), 1-6 PK ISSN 0006 - 3096
Corresponding Author Email: [email protected]
Revised checklist of fishes of Mangla Reservoir, Pakistan
*ZAHID SHARIF MIRZA1, MUHAMMAD RAMZAN MIRZA
2,
MUHAMMAD SAJID NADEEM3, ABDUL QAYYUM KHAN SULEHRIA
4
1Fisheries Research & Training Institute, P.O. Batapur, Lahore, Pakistan.
2,3Zoology Department, PMAS Arid Agriculture University, Rawalpindi, Pakistan
4Zoology Department, GC University, Lahore, Pakistan
ABSTRACT
Present paper provides a checklist of fish species of Mangla reservoir. The checklist includes the indigenous and exotic fish species and consists of 57 species with 54.4% Cyrpinids, 19.3% Silurids and 26.3% other groups. These fishes belong to 9 Orders, 17 Families and 44 Genera. Most abundant family is Cyprinidae contributing 52.6% of the species. Eight families are represented by only one species each. Keywords: Mangla Reservoir, Ichthyofauna, checklist, carp, fish
INTRODUCTION
Damming of the rivers abruptly bring changes in the dynamics of riverine
ecosystems and restructuring of the existing ecosystem as the relationships between organisms and environment change (Benedito-Cecilio & Agostinho, 2000). These changes are often manifested in the form of changes in ichtyofaunal composition and are more pronounced in early stages of coloniztion (Fernando & Holčík, 1991).The changes become more distinct over relatively long time scale often a magnitude of many years (Spanier, 2000).
Mangla dam was constructed to store water from two perennial rivers (Jhelum and Poonch) and two non-perennial rivers (Kanshi and Khad) (Mirza et al., 2012) and is a home of several ecologically important fish species. Before the impoundment of Mangla reservoir, 15 indigenous fish species (Shah, 1996) were reported from Jhelum and Poonch rivers. After the impoundment, the aquatic ecology changed and a subsequently published checklist reported 52 fish species belonging to 15 families and 8 orders from the reservoir (Mirza et al., 1989). The ichthyofauna of the reservoir has changed over time it was expedient to update this 20 years old checklist. The present updated checklist of 57 species includes 54.4% Cyrpinids, 19.3% Silurids and 26.3% other groups (Fig 1). These species are grouped under 9 Orders, 17 Families and 44 Genera. For classification Nelson (2006) was followed. Other reference works consulted were Mirza et al. (1989), Mirza (2003), (Jayaram, 2002; Jayaram, 2006, 2010), (Mirza et al., 2006), Mirza & Sandhu (2007) and the website Fishbase (Feroese et al., 2006).The representative families with number of genera and species are given in Table 1.
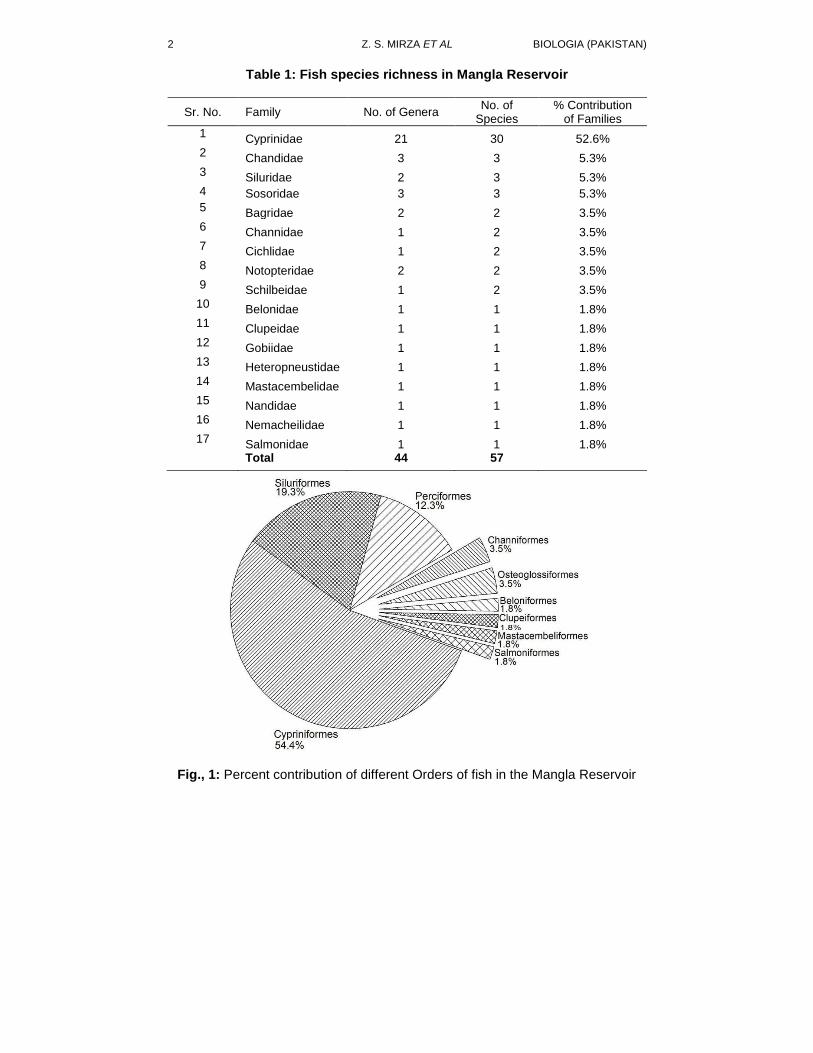
2 Z. S. MIRZA ET AL BIOLOGIA (PAKISTAN)
Table 1: Fish species richness in Mangla Reservoir
Sr. No. Family No. of Genera No. of
Species % Contribution
of Families
1 Cyprinidae 21 30 52.6% 2 Chandidae 3 3 5.3% 3 Siluridae 2 3 5.3% 4 Sosoridae 3 3 5.3% 5 Bagridae 2 2 3.5% 6 Channidae 1 2 3.5% 7 Cichlidae 1 2 3.5% 8 Notopteridae 2 2 3.5% 9 Schilbeidae 1 2 3.5%
10 Belonidae 1 1 1.8% 11 Clupeidae 1 1 1.8% 12 Gobiidae 1 1 1.8% 13 Heteropneustidae 1 1 1.8% 14 Mastacembelidae 1 1 1.8% 15 Nandidae 1 1 1.8% 16 Nemacheilidae 1 1 1.8% 17 Salmonidae 1 1 1.8%
Total 44 57
Fig., 1: Percent contribution of different Orders of fish in the Mangla Reservoir
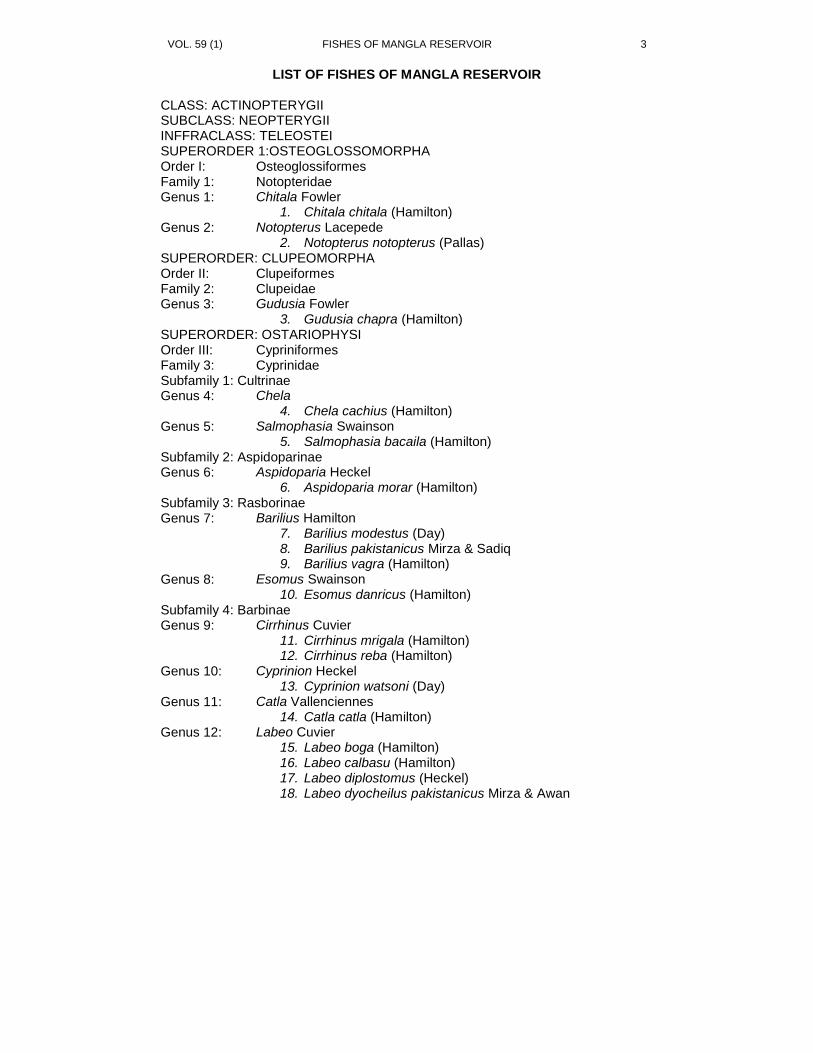
VOL. 59 (1) FISHES OF MANGLA RESERVOIR 3
LIST OF FISHES OF MANGLA RESERVOIR
CLASS: ACTINOPTERYGII SUBCLASS: NEOPTERYGII INFFRACLASS: TELEOSTEI SUPERORDER 1:OSTEOGLOSSOMORPHA Order I: Osteoglossiformes Family 1: Notopteridae Genus 1: Chitala Fowler 1. Chitala chitala (Hamilton) Genus 2: Notopterus Lacepede 2. Notopterus notopterus (Pallas) SUPERORDER: CLUPEOMORPHA Order II: Clupeiformes Family 2: Clupeidae Genus 3: Gudusia Fowler 3. Gudusia chapra (Hamilton) SUPERORDER: OSTARIOPHYSI Order III: Cypriniformes Family 3: Cyprinidae Subfamily 1: Cultrinae Genus 4: Chela 4. Chela cachius (Hamilton) Genus 5: Salmophasia Swainson 5. Salmophasia bacaila (Hamilton) Subfamily 2: Aspidoparinae Genus 6: Aspidoparia Heckel 6. Aspidoparia morar (Hamilton) Subfamily 3: Rasborinae Genus 7: Barilius Hamilton 7. Barilius modestus (Day) 8. Barilius pakistanicus Mirza & Sadiq 9. Barilius vagra (Hamilton) Genus 8: Esomus Swainson 10. Esomus danricus (Hamilton) Subfamily 4: Barbinae Genus 9: Cirrhinus Cuvier 11. Cirrhinus mrigala (Hamilton) 12. Cirrhinus reba (Hamilton) Genus 10: Cyprinion Heckel 13. Cyprinion watsoni (Day) Genus 11: Catla Vallenciennes 14. Catla catla (Hamilton) Genus 12: Labeo Cuvier 15. Labeo boga (Hamilton) 16. Labeo calbasu (Hamilton) 17. Labeo diplostomus (Heckel) 18. Labeo dyocheilus pakistanicus Mirza & Awan
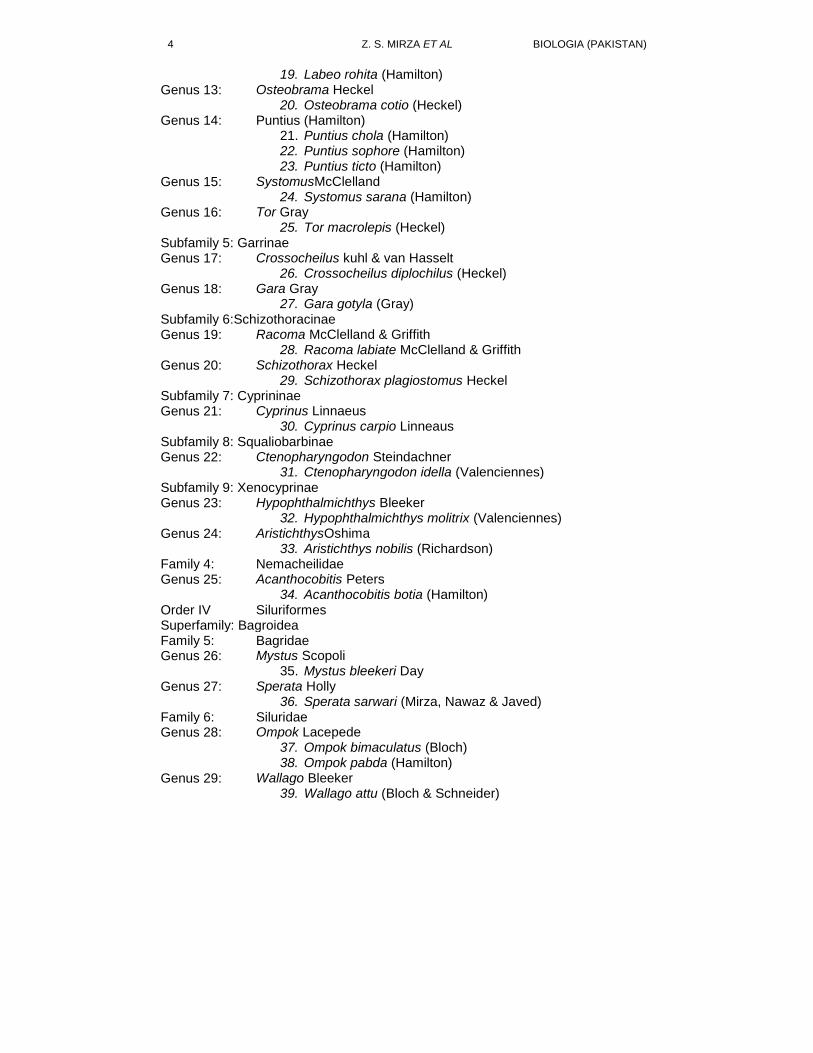
4 Z. S. MIRZA ET AL BIOLOGIA (PAKISTAN)
19. Labeo rohita (Hamilton) Genus 13: Osteobrama Heckel 20. Osteobrama cotio (Heckel) Genus 14: Puntius (Hamilton) 21. Puntius chola (Hamilton) 22. Puntius sophore (Hamilton) 23. Puntius ticto (Hamilton) Genus 15: SystomusMcClelland 24. Systomus sarana (Hamilton) Genus 16: Tor Gray 25. Tor macrolepis (Heckel) Subfamily 5: Garrinae Genus 17: Crossocheilus kuhl & van Hasselt 26. Crossocheilus diplochilus (Heckel) Genus 18: Gara Gray 27. Gara gotyla (Gray) Subfamily 6:Schizothoracinae Genus 19: Racoma McClelland & Griffith 28. Racoma labiate McClelland & Griffith Genus 20: Schizothorax Heckel 29. Schizothorax plagiostomus Heckel Subfamily 7: Cyprininae Genus 21: Cyprinus Linnaeus 30. Cyprinus carpio Linneaus Subfamily 8: Squaliobarbinae Genus 22: Ctenopharyngodon Steindachner 31. Ctenopharyngodon idella (Valenciennes) Subfamily 9: Xenocyprinae Genus 23: Hypophthalmichthys Bleeker 32. Hypophthalmichthys molitrix (Valenciennes) Genus 24: AristichthysOshima 33. Aristichthys nobilis (Richardson) Family 4: Nemacheilidae Genus 25: Acanthocobitis Peters 34. Acanthocobitis botia (Hamilton) Order IV Siluriformes Superfamily: Bagroidea Family 5: Bagridae Genus 26: Mystus Scopoli 35. Mystus bleekeri Day Genus 27: Sperata Holly 36. Sperata sarwari (Mirza, Nawaz & Javed) Family 6: Siluridae Genus 28: Ompok Lacepede 37. Ompok bimaculatus (Bloch) 38. Ompok pabda (Hamilton) Genus 29: Wallago Bleeker 39. Wallago attu (Bloch & Schneider)
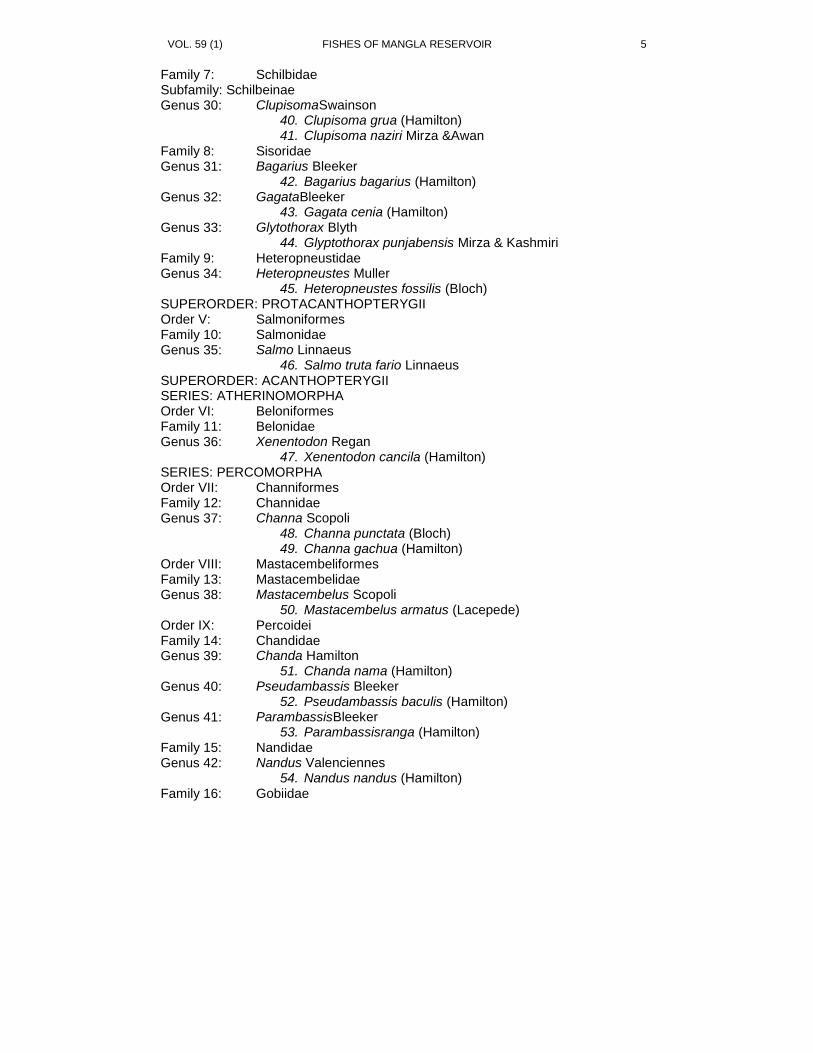
VOL. 59 (1) FISHES OF MANGLA RESERVOIR 5
Family 7: Schilbidae Subfamily: Schilbeinae Genus 30: ClupisomaSwainson 40. Clupisoma grua (Hamilton) 41. Clupisoma naziri Mirza &Awan Family 8: Sisoridae Genus 31: Bagarius Bleeker 42. Bagarius bagarius (Hamilton) Genus 32: GagataBleeker 43. Gagata cenia (Hamilton) Genus 33: Glytothorax Blyth 44. Glyptothorax punjabensis Mirza & Kashmiri Family 9: Heteropneustidae Genus 34: Heteropneustes Muller 45. Heteropneustes fossilis (Bloch) SUPERORDER: PROTACANTHOPTERYGII Order V: Salmoniformes Family 10: Salmonidae Genus 35: Salmo Linnaeus 46. Salmo truta fario Linnaeus SUPERORDER: ACANTHOPTERYGII SERIES: ATHERINOMORPHA Order VI: Beloniformes Family 11: Belonidae Genus 36: Xenentodon Regan 47. Xenentodon cancila (Hamilton) SERIES: PERCOMORPHA Order VII: Channiformes Family 12: Channidae Genus 37: Channa Scopoli 48. Channa punctata (Bloch) 49. Channa gachua (Hamilton) Order VIII: Mastacembeliformes Family 13: Mastacembelidae Genus 38: Mastacembelus Scopoli 50. Mastacembelus armatus (Lacepede) Order IX: Percoidei Family 14: Chandidae Genus 39: Chanda Hamilton 51. Chanda nama (Hamilton) Genus 40: Pseudambassis Bleeker 52. Pseudambassis baculis (Hamilton) Genus 41: ParambassisBleeker 53. Parambassisranga (Hamilton) Family 15: Nandidae Genus 42: Nandus Valenciennes 54. Nandus nandus (Hamilton) Family 16: Gobiidae
6 Z. S. MIRZA ET AL BIOLOGIA (PAKISTAN)
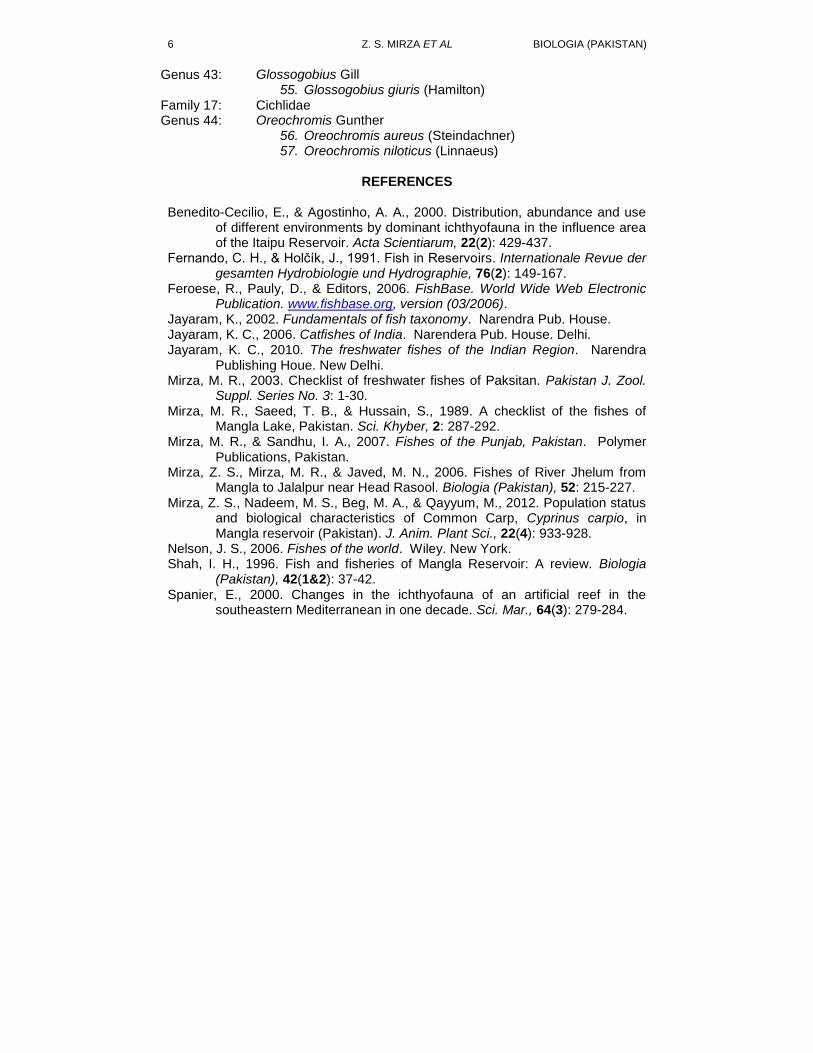
Genus 43: Glossogobius Gill 55. Glossogobius giuris (Hamilton) Family 17: Cichlidae Genus 44: Oreochromis Gunther 56. Oreochromis aureus (Steindachner) 57. Oreochromis niloticus (Linnaeus)
REFERENCES
Benedito-Cecilio, E., & Agostinho, A. A., 2000. Distribution, abundance and use of different environments by dominant ichthyofauna in the influence area of the Itaipu Reservoir. Acta Scientiarum, 22(2): 429-437.
Fernando, C. H., & Holčík, J., 1991. Fish in Reservoirs. Internationale Revue der gesamten Hydrobiologie und Hydrographie, 76(2): 149-167.
Feroese, R., Pauly, D., & Editors, 2006. FishBase. World Wide Web Electronic Publication. www.fishbase.org, version (03/2006).
Jayaram, K., 2002. Fundamentals of fish taxonomy. Narendra Pub. House. Jayaram, K. C., 2006. Catfishes of India. Narendera Pub. House. Delhi. Jayaram, K. C., 2010. The freshwater fishes of the Indian Region. Narendra
Publishing Houe. New Delhi. Mirza, M. R., 2003. Checklist of freshwater fishes of Paksitan. Pakistan J. Zool.
Suppl. Series No. 3: 1-30. Mirza, M. R., Saeed, T. B., & Hussain, S., 1989. A checklist of the fishes of
Mangla Lake, Pakistan. Sci. Khyber, 2: 287-292. Mirza, M. R., & Sandhu, I. A., 2007. Fishes of the Punjab, Pakistan. Polymer
Publications, Pakistan. Mirza, Z. S., Mirza, M. R., & Javed, M. N., 2006. Fishes of River Jhelum from
Mangla to Jalalpur near Head Rasool. Biologia (Pakistan), 52: 215-227. Mirza, Z. S., Nadeem, M. S., Beg, M. A., & Qayyum, M., 2012. Population status
and biological characteristics of Common Carp, Cyprinus carpio, in Mangla reservoir (Pakistan). J. Anim. Plant Sci., 22(4): 933-928.
Nelson, J. S., 2006. Fishes of the world. Wiley. New York. Shah, I. H., 1996. Fish and fisheries of Mangla Reservoir: A review. Biologia
(Pakistan), 42(1&2): 37-42. Spanier, E., 2000. Changes in the ichthyofauna of an artificial reef in the
southeastern Mediterranean in one decade. Sci. Mar., 64(3): 279-284.
BIOLOGIA (PAKISTAN) 2013, 59 (1), 7-14 PK ISSN 0006 - 3096
*Corresponding author: [email protected]
Kinetics and Thermodynamic Study of Urease Extracted
from Soybeans
MADIHA KHAN, MUHAMMAD MOHSIN JAVED*, SANA ZAHOOR AND
IKRAM-UL-HAQ
Institute of Industrial Biotechnology, GC University, Lahore, Pakistan
ABSTRACT
The present study is concerned with the kinetics and thermodynamic study of
urease extracted from soybeans. The effect of pH, temperature, concentration of substrate and incubation time on the urease activity was examined. Maximum urease activity (86.79 ± 2.43 U/g) was obtained at 30
oC and pH 8.0 after 60 sec of incubation. Kinetics constants
i.e. Km and Vmax were estimated by using Lineweaver-Burk plot and were found to be 36.49 mM and 87.72 U/g, respectively. Thermodynamic constants i.e. Activation energy (Ea), change in enthalpy (ΔH) and change in entropy (ΔS) were calculated using Arrhenius plot and were found to be 5.7 KJ/mol, 3.468 KJ/mol and -4.57 KJ/mol respectively. Keywords: Urease, Activation energy, enthalpy, entropy, Kinetics constants.
INTRODUCTION
Urease is an enzyme, responsible for the hydrolysis of urea and converts
it into carbon dioxide and ammonia (Barrios & Lippard, 2000).Urease is abundantly present in different seeds, microorganisms as well as in certain invertebrates. In case of soybeans, the urease enzyme plays an important role during the process of germination and the protein stored within the seed is mobilized in order to nourish the seedlings (Goldraij et al., 2003). The urea that is naturally present in commercial wines can be reduced to a significant level when urease enzyme is applied for the degradation of urea (Liu et al., 2012). All fermented foods contain a naturally occurring compound, ethyl carbamate, which is carcinogenic in nature and it is removed by using urease (Andrich et al., 2009). Urease also plays an essential role in the defense mechanism of plants as it has antifungal property and provides protection against phytopathogens and predators (Becker-Ritt et al., 2007; Menegassi et al., 2008). Urease is also used to estimate the amount of urea present in blood or urine samples (Kumar et al., 2009). The enzyme can be used to detect the presence of urea in the milk sample (Sharma et al., 2008), to detect the presence and quantity of As
+3, as the
activity of urease decreases with an increase in the concentration of As+3
(Prakash et al., 2009). In polluted water, the presence of different heavy metals can be detected by using conductometric biosensors of urease (Rodriguez et al., 2004). Urease plays an essential role in the treatment of urinary tract infection caused by Proteus mirabilis (Liang et al., 2000).
The main objectives of the present study were to characterize urease extracted from soybeans with respect to temperature and pH. Kinetics and thermodynamic constants were also determined.
8 M. KHAN ET AL BIOLOGIA (PAKISTAN)
MATERIALS AND METHODS
All the chemicals were of analytical grade and were purchased from Sigma Chemical Company, USA. Soybeans were purchased from local market.
Enzyme extraction preparation
Ten grams of soybeans grinded to fine powder. This powder was then mixed with 100 ml of the 0.02 M phosphate buffer (pH 8.0) and kept at 4
oC for 3-
4 hrs. After incubation, the mixture was centrifuged at 6000 rpm for 15 min. The supernatant was used as enzyme extract and was stored at 4
oC where as the
pellets were discarded.
Urease assay The urease assay was performed following the method described by
Sharma et al., (2009). Enzyme extract (0.25 μl) was added to 10 ml of urea solution (0.4g urea in 25 ml of phosphate buffer). One ml of the solution was added to the test tubes containing 5 ml of Nessler„s reagent. Incubated at 30
oC
followed by the addition of 1.0 M HCl thus terminating the reaction.The absorbance was taken at 405 nm using a spectrophotometer.One unit of urease activity is defined as “the amount of enzyme required to liberate 1.0 μM of NH3
from urea per min at pH 8.0 and temperature 30oC”.The estimation of urease was
carried out using the standard curve of ammonium sulphate.
Enzyme characterization The extracted enzyme was characterized as the function of temperature,
pH, incubation time and concentration of substrate.
Effect of temperature The optimum temperature for urease activity was determined over the
temperature ranging from 10oC to 40
oC using the standard conditions of the
assay.
Effect of pH The optimum pH was detected over the pH ranging from 6.0 to 8.5 with
an increment of 0.5 while keeping other parameters constant.
Effect of incubation time To determine the optimum incubation time for maximum urease activity,
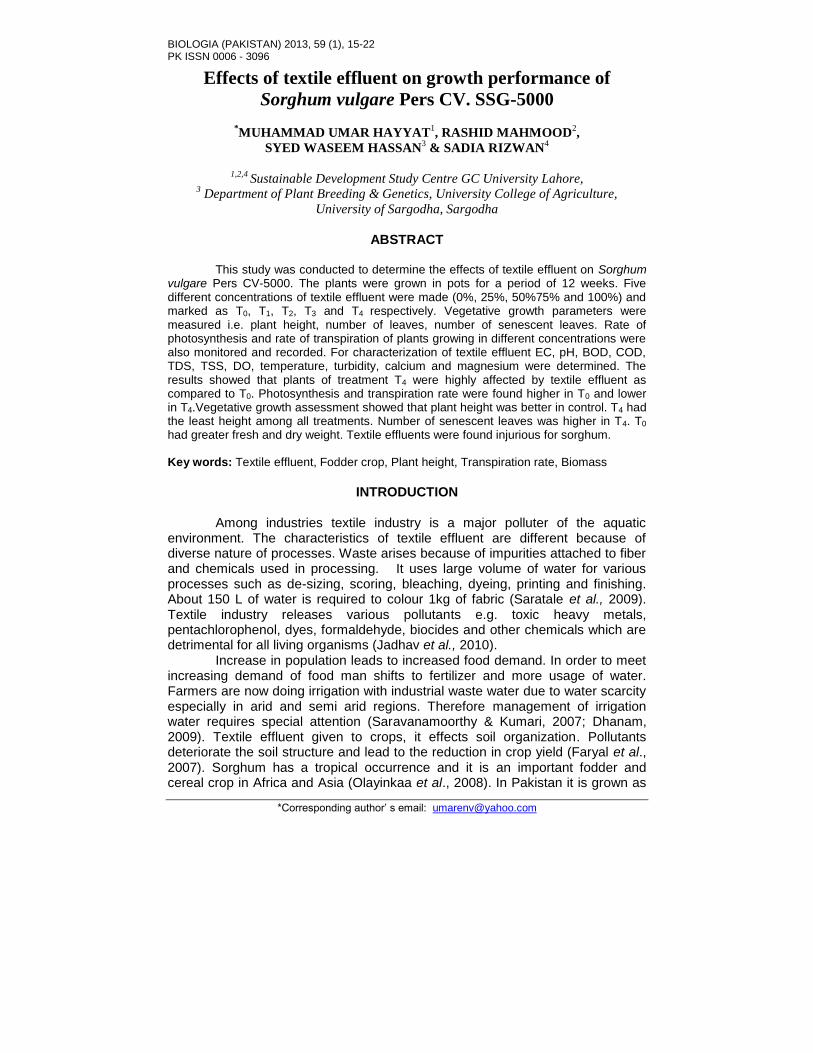
the estimation was done by incubating the enzyme at different time intervals ranging from 30 to 300 sec by keeping other parameters unaltered.
Effect of different concentration of substrates
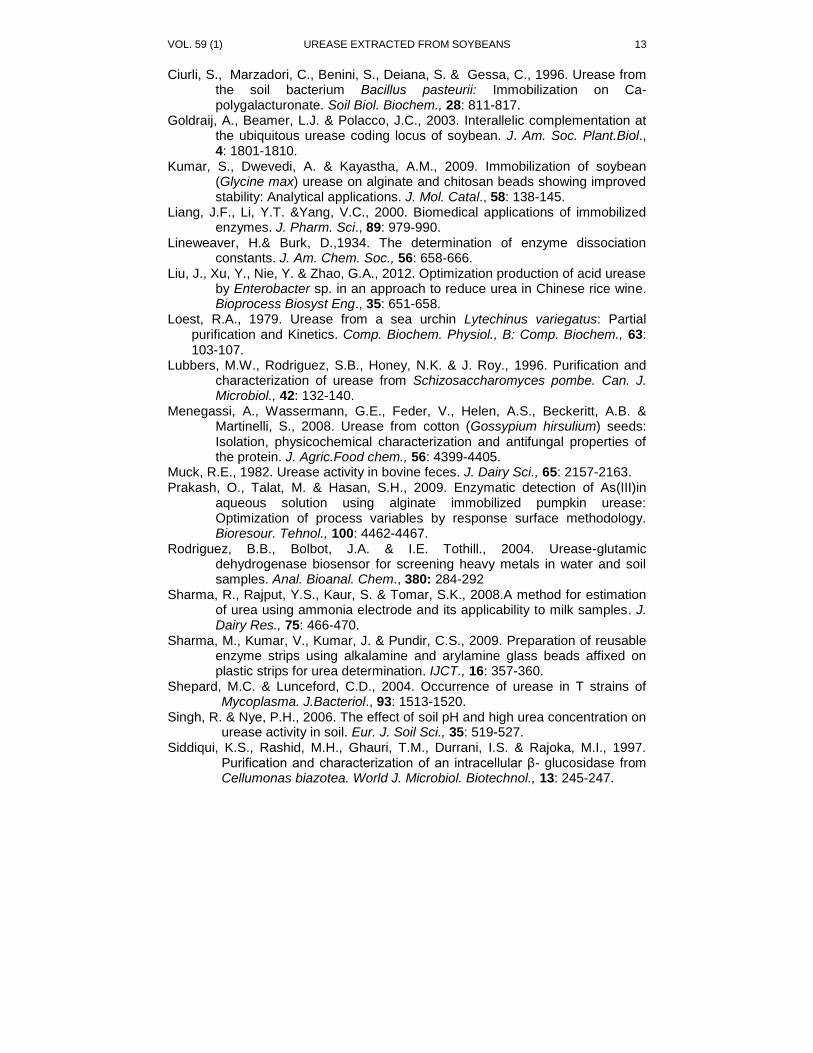
For the selection of optimum concentration, varying amount of urea solution (8-80 mM) was used. Km and Vmax for urease were calculated using Lineweaver-Burk double reciprocal plot (Lineweaver & Burk, 1934).
VOL. 59 (1) UREASE EXTRACTED FROM SOYBEANS 9
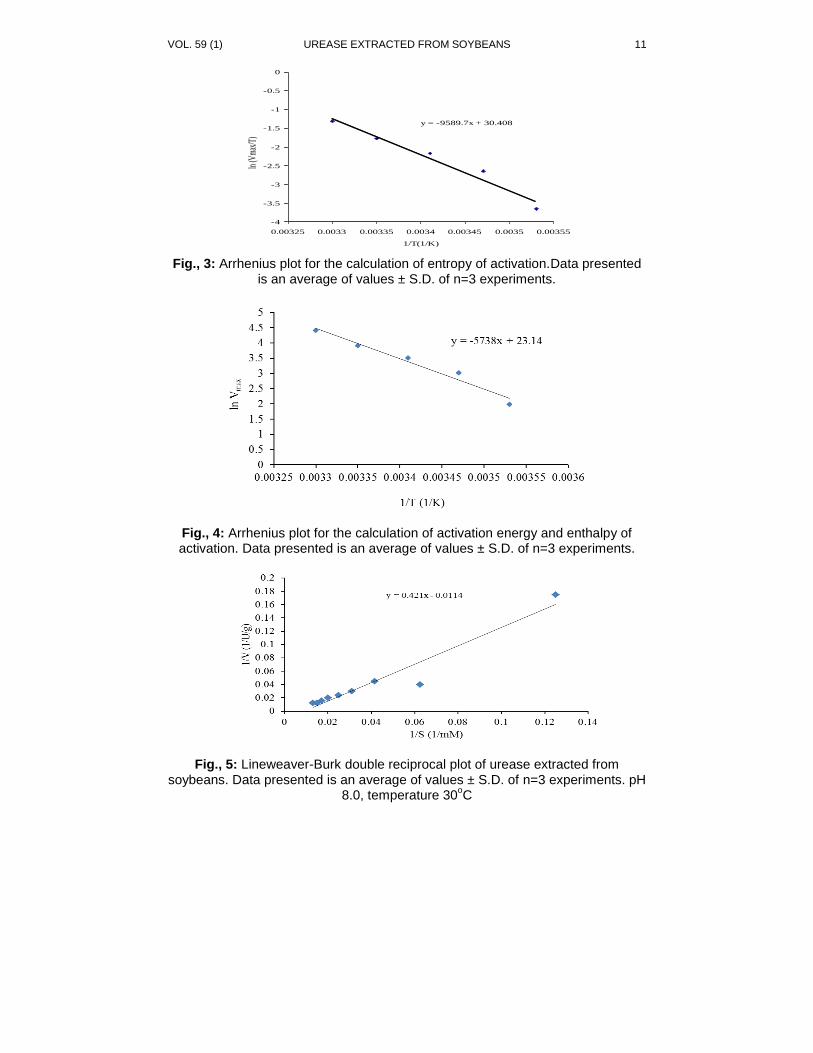
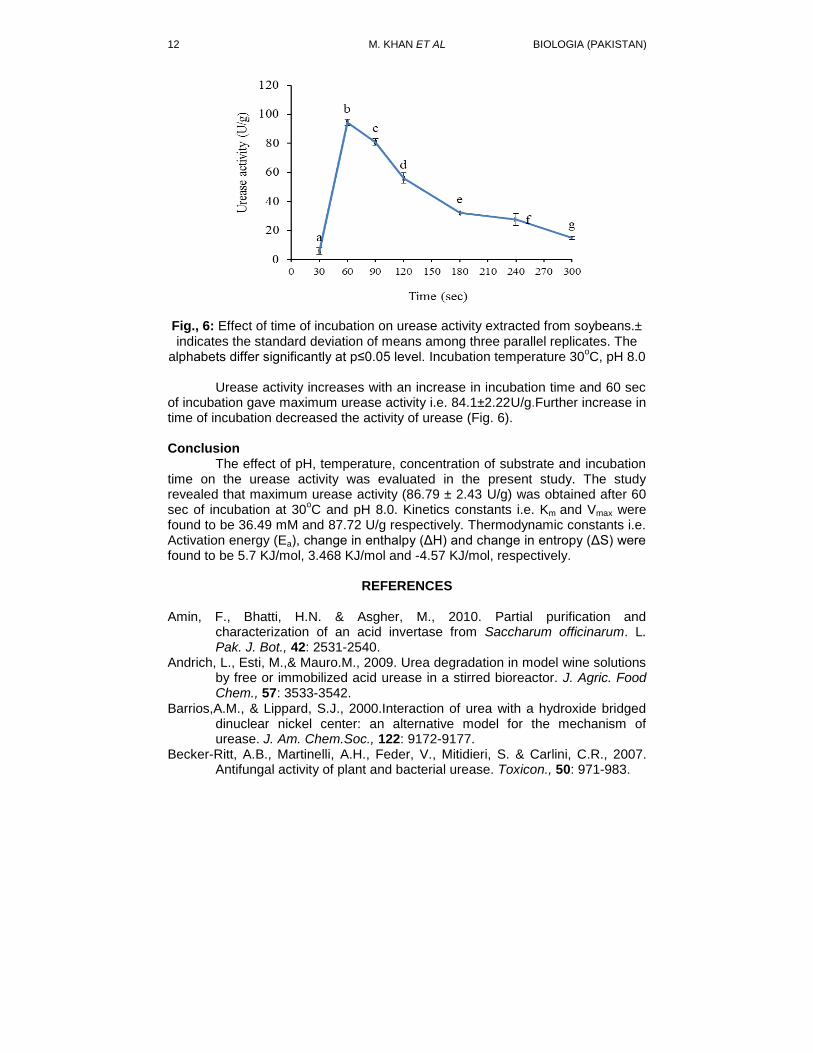
Thermodynamic studies Thermodynamic constants, Ea, ∆S and ∆ H were calculated using
Arrhenius plot after Siddique et al., (1997). Activation energy of urease is given by equation:
Ea = - slope (R)……………………………… (1) ∆ H was calculated from relationship. ∆ H= Ea - RT…………………………………. (2) While ∆S was calculated from relationship ln(V max /T) = ln (KB /h) + ∆S/R – (∆ H/R)1/T…(3) where slope = ∆ H/R and intercept= ln (KB /h) + ∆S/R ∆S = R [Intercept – ln (KB /h)]…………. (4)
T, KB, h, R, Ea, ∆S and ∆H are absolute temperature, Boltzmann constant, Planck constant, gas constant activation energy, enthalpy of activation and entropy of activation respectively. The value of KB, h and R are 1.38 × 10
-23JK
-1, 6.63× 10
-
34Js and 8.314 J/K
-1 mol
-1, respectively.
Statistical analysis
Treatment effects were compared after Snedecor & Cochrane (1980) using computer Software Costat, cs6204W.exe. Significance difference among replicates has been presented as Duncan„s multiple range tests in the form of probability (p) value.
RESULTS AND DISCUSSION
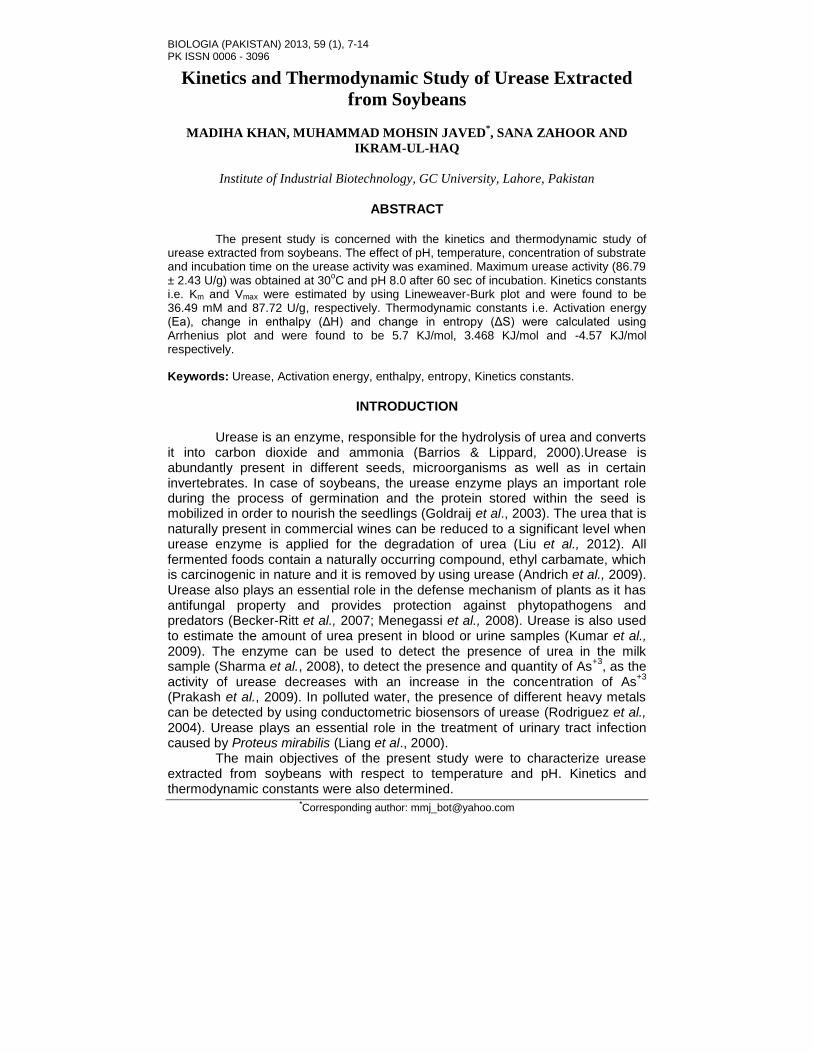
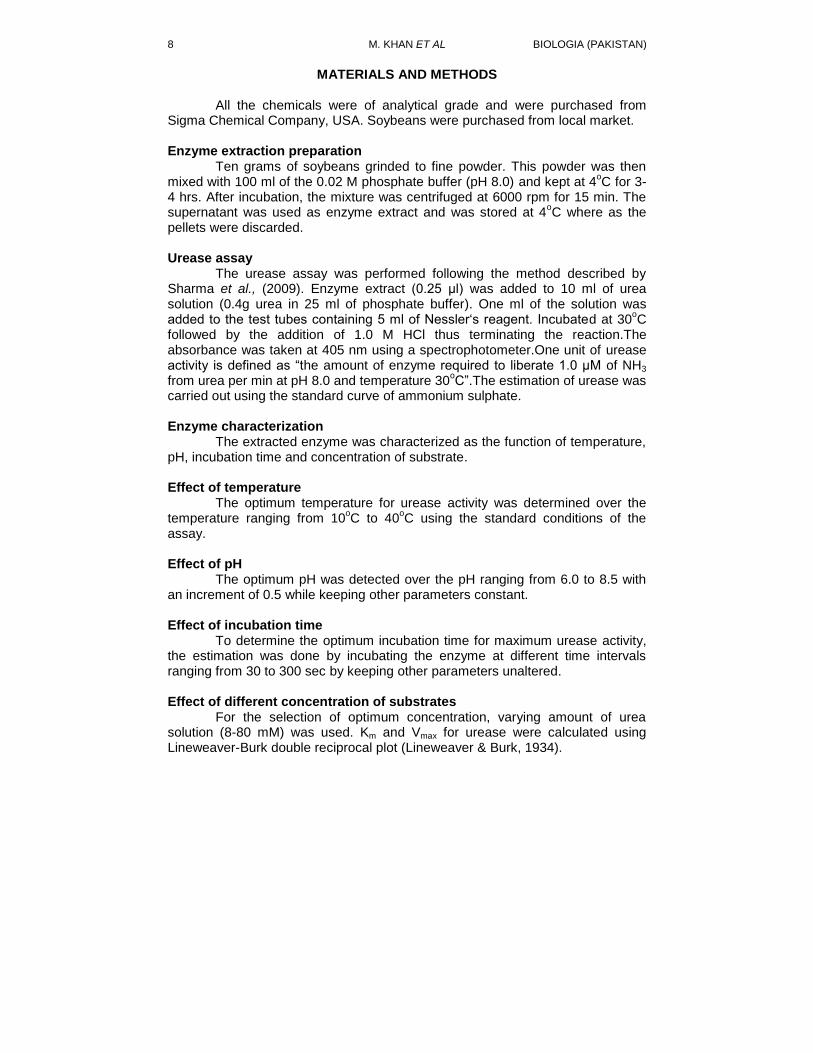
Maximum urease activity (60.2±2.21U/g) was obtained when initial pH of the reaction mixture was kept at 8.0. Initial pH of the reaction mixture lower or higher than 8.0, gave relatively less amount of urease activity. So, an initial pH value of 8.0 was optimized for urease activity for further studies (Fig.,1).This might be because acidic pH has an inhibitory effect on the enzyme thus reducing its activity. The active sites of essential amino acids are affected by a change in pH. This change influences the ionization of these amino acids that are involved in the formation of products by catalyzing the substrate (Amin et al., 2010). This is in accordance to the findings of Smith et al., (1993) and Ciurli (1996) who obtained maximum urease activity at pH 8.0 from Aspergillus niger and Bacillus pasteurii, respectively. Maximum urease activity (86.79± 2.43 U/g) was obtained at 30
oC.
Further increase in temperature resulted in decrease of urease activity. So, an incubation temperature of 30
oC was optimized for further studies.Activation
energy (Ea), enthalpy of activation (∆H) and entropy of activation (∆S) were calculated using Arrhenius plot and were found to be 5.7 KJ/mol,3.468KJ/mol and -4.571 KJ/mol respectively (Fig., 2-4). The Kinetic energy of molecules increases with an increase in temperature that results in the increase of rate of reaction. When the temperature was further increased, the molecules of enzyme exceed the barrier of energy. This causes breakage of hydrogen and hydrophobic bonds that are responsible for the maintaining the 3D structure of enzyme. This is in accordance to the findings of Lubber et al., (1996) and Muck, (1982) who obtained maximum urease activity at 30
oC from
Schizosaccharomyces pombe and Canavalia ensiformis seeds.
10 M. KHAN ET AL BIOLOGIA (PAKISTAN)
Fig., 1: Effect of pH on urease activity extracted from soybeans.± indicates the standard deviation of means among three parallel replicates. The alphabets differ significantly at p≤0.05 level. Incubation temperature 35
oC, incubation time 60 sec
The Kinetics constants (Km and Vmax) for urease activity extracted from
soybeans were determined by incubating fixed amount of enzyme with varied concentrations of urea solution (8.0-80mM) as a substrate. Km and Vmax for urea were calculated using Lineweaver-Burk double reciprocal plot and were found to be 36.92 mM and 87.72 U/g respectively (Fig., 5).Maximum urease activity was obtained at (urea concentration 64 mM). Further increase or decrease in urea concentration resulted in the gradual decrease in enzyme activity. This might be because at high concentration of urea, the activity of urease decreased due to the substrate inhibition. At low concentration, the enzyme exhibited high affinity for the substrate (Singh & Nye, 2006). This finding is in contrast to Loest (1979) and Shepard & Lunceford (2004) who obtained maximum urease activity at 0.25 M and 0.008 M concentration of urea respectively.
Fig., 2: Effect of temperature on urease activity extracted from soybeans. ± indicates the standard deviation of means among three parallel replicates. The
alphabets differ significantly at p≤0.05 level. pH 8.0, incubation time 60 sec
VOL. 59 (1) UREASE EXTRACTED FROM SOYBEANS 11
y = -9589.7x + 30.408
-4
-3.5
-3
-2.5
-2
-1.5
-1
-0.5
0
0.00325 0.0033 0.00335 0.0034 0.00345 0.0035 0.00355
1/T(1/K)
ln (V
max
/T)
.
Fig., 3: Arrhenius plot for the calculation of entropy of activation.Data presented is an average of values ± S.D. of n=3 experiments.
Fig., 4: Arrhenius plot for the calculation of activation energy and enthalpy of activation. Data presented is an average of values ± S.D. of n=3 experiments.
Fig., 5: Lineweaver-Burk double reciprocal plot of urease extracted from
soybeans. Data presented is an average of values ± S.D. of n=3 experiments. pH 8.0, temperature 30
oC
12 M. KHAN ET AL BIOLOGIA (PAKISTAN)
Fig., 6: Effect of time of incubation on urease activity extracted from soybeans.± indicates the standard deviation of means among three parallel replicates. The
alphabets differ significantly at p≤0.05 level. Incubation temperature 30oC, pH 8.0
Urease activity increases with an increase in incubation time and 60 sec of incubation gave maximum urease activity i.e. 84.1±2.22U/g.Further increase in time of incubation decreased the activity of urease (Fig. 6). Conclusion The effect of pH, temperature, concentration of substrate and incubation time on the urease activity was evaluated in the present study. The study revealed that maximum urease activity (86.79 ± 2.43 U/g) was obtained after 60 sec of incubation at 30
oC and pH 8.0. Kinetics constants i.e. Km and Vmax were
found to be 36.49 mM and 87.72 U/g respectively. Thermodynamic constants i.e. Activation energy (Ea), change in enthalpy (ΔH) and change in entropy (ΔS) were found to be 5.7 KJ/mol, 3.468 KJ/mol and -4.57 KJ/mol, respectively.
REFERENCES Amin, F., Bhatti, H.N. & Asgher, M., 2010. Partial purification and
characterization of an acid invertase from Saccharum officinarum. L. Pak. J. Bot., 42: 2531-2540.
Andrich, L., Esti, M.,& Mauro.M., 2009. Urea degradation in model wine solutions by free or immobilized acid urease in a stirred bioreactor. J. Agric. Food Chem., 57: 3533-3542.
Barrios,A.M., & Lippard, S.J., 2000.Interaction of urea with a hydroxide bridged dinuclear nickel center: an alternative model for the mechanism of urease. J. Am. Chem.Soc., 122: 9172-9177.
Becker-Ritt, A.B., Martinelli, A.H., Feder, V., Mitidieri, S. & Carlini, C.R., 2007. Antifungal activity of plant and bacterial urease. Toxicon., 50: 971-983.
VOL. 59 (1) UREASE EXTRACTED FROM SOYBEANS 13
Ciurli, S., Marzadori, C., Benini, S., Deiana, S. & Gessa, C., 1996. Urease from the soil bacterium Bacillus pasteurii: Immobilization on Ca-polygalacturonate. Soil Biol. Biochem., 28: 811-817.
Goldraij, A., Beamer, L.J. & Polacco, J.C., 2003. Interallelic complementation at the ubiquitous urease coding locus of soybean. J. Am. Soc. Plant.Biol., 4: 1801-1810.
Kumar, S., Dwevedi, A. & Kayastha, A.M., 2009. Immobilization of soybean (Glycine max) urease on alginate and chitosan beads showing improved stability: Analytical applications. J. Mol. Catal., 58: 138-145.
Liang, J.F., Li, Y.T. &Yang, V.C., 2000. Biomedical applications of immobilized enzymes. J. Pharm. Sci., 89: 979-990.
Lineweaver, H.& Burk, D.,1934. The determination of enzyme dissociation constants. J. Am. Chem. Soc., 56: 658-666.
Liu, J., Xu, Y., Nie, Y. & Zhao, G.A., 2012. Optimization production of acid urease by Enterobacter sp. in an approach to reduce urea in Chinese rice wine. Bioprocess Biosyst Eng., 35: 651-658.
Loest, R.A., 1979. Urease from a sea urchin Lytechinus variegatus: Partial purification and Kinetics. Comp. Biochem. Physiol., B: Comp. Biochem., 63: 103-107.
Lubbers, M.W., Rodriguez, S.B., Honey, N.K. & J. Roy., 1996. Purification and characterization of urease from Schizosaccharomyces pombe. Can. J. Microbiol., 42: 132-140.
Menegassi, A., Wassermann, G.E., Feder, V., Helen, A.S., Beckeritt, A.B. & Martinelli, S., 2008. Urease from cotton (Gossypium hirsulium) seeds: Isolation, physicochemical characterization and antifungal properties of the protein. J. Agric.Food chem., 56: 4399-4405.
Muck, R.E., 1982. Urease activity in bovine feces. J. Dairy Sci., 65: 2157-2163. Prakash, O., Talat, M. & Hasan, S.H., 2009. Enzymatic detection of As(III)in
aqueous solution using alginate immobilized pumpkin urease: Optimization of process variables by response surface methodology. Bioresour. Tehnol., 100: 4462-4467.
Rodriguez, B.B., Bolbot, J.A. & I.E. Tothill., 2004. Urease-glutamic dehydrogenase biosensor for screening heavy metals in water and soil samples. Anal. Bioanal. Chem., 380: 284-292
Sharma, R., Rajput, Y.S., Kaur, S. & Tomar, S.K., 2008.A method for estimation of urea using ammonia electrode and its applicability to milk samples. J. Dairy Res., 75: 466-470.
Sharma, M., Kumar, V., Kumar, J. & Pundir, C.S., 2009. Preparation of reusable enzyme strips using alkalamine and arylamine glass beads affixed on plastic strips for urea determination. IJCT., 16: 357-360.
Shepard, M.C. & Lunceford, C.D., 2004. Occurrence of urease in T strains of Mycoplasma. J.Bacteriol., 93: 1513-1520.
Singh, R. & Nye, P.H., 2006. The effect of soil pH and high urea concentration on urease activity in soil. Eur. J. Soil Sci., 35: 519-527.
Siddiqui, K.S., Rashid, M.H., Ghauri, T.M., Durrani, I.S. & Rajoka, M.I., 1997. Purification and characterization of an intracellular β- glucosidase from Cellumonas biazotea. World J. Microbiol. Biotechnol., 13: 245-247.

14 M. KHAN ET AL BIOLOGIA (PAKISTAN)
Smith, P.T., King, A.D. & Goodman, N., 1993. Isolation and characterization of urease from Aspergillus niger. J. Gen. Microbiol., 139: 957-962.
Snedecor, G. & W.G. Cochrane, W.G., 1980. Statistical Methods. 7th ed. Iowa
State Univ., PP: 80-86.
BIOLOGIA (PAKISTAN) 2013, 59 (1), 15-22 PK ISSN 0006 - 3096
*Corresponding author’ s email: [email protected]
Effects of textile effluent on growth performance of
Sorghum vulgare Pers CV. SSG-5000
*MUHAMMAD UMAR HAYYAT
1, RASHID MAHMOOD
2,
SYED WASEEM HASSAN3 & SADIA RIZWAN
4
1,2,4
Sustainable Development Study Centre GC University Lahore, 3 Department of Plant Breeding & Genetics, University College of Agriculture,
University of Sargodha, Sargodha
ABSTRACT
This study was conducted to determine the effects of textile effluent on Sorghum vulgare Pers CV-5000. The plants were grown in pots for a period of 12 weeks. Five different concentrations of textile effluent were made (0%, 25%, 50%75% and 100%) and marked as T0, T1, T2, T3 and T4 respectively. Vegetative growth parameters were measured i.e. plant height, number of leaves, number of senescent leaves. Rate of photosynthesis and rate of transpiration of plants growing in different concentrations were also monitored and recorded. For characterization of textile effluent EC, pH, BOD, COD, TDS, TSS, DO, temperature, turbidity, calcium and magnesium were determined. The results showed that plants of treatment T4 were highly affected by textile effluent as compared to T0. Photosynthesis and transpiration rate were found higher in T0 and lower in T4.Vegetative growth assessment showed that plant height was better in control. T4 had the least height among all treatments. Number of senescent leaves was higher in T4. T0 had greater fresh and dry weight. Textile effluents were found injurious for sorghum. Key words: Textile effluent, Fodder crop, Plant height, Transpiration rate, Biomass
INTRODUCTION
Among industries textile industry is a major polluter of the aquatic
environment. The characteristics of textile effluent are different because of diverse nature of processes. Waste arises because of impurities attached to fiber and chemicals used in processing. It uses large volume of water for various processes such as de-sizing, scoring, bleaching, dyeing, printing and finishing. About 150 L of water is required to colour 1kg of fabric (Saratale et al., 2009). Textile industry releases various pollutants e.g. toxic heavy metals, pentachlorophenol, dyes, formaldehyde, biocides and other chemicals which are detrimental for all living organisms (Jadhav et al., 2010).
Increase in population leads to increased food demand. In order to meet increasing demand of food man shifts to fertilizer and more usage of water. Farmers are now doing irrigation with industrial waste water due to water scarcity especially in arid and semi arid regions. Therefore management of irrigation water requires special attention (Saravanamoorthy & Kumari, 2007; Dhanam, 2009). Textile effluent given to crops, it effects soil organization. Pollutants deteriorate the soil structure and lead to the reduction in crop yield (Faryal et al., 2007). Sorghum has a tropical occurrence and it is an important fodder and cereal crop in Africa and Asia (Olayinkaa et al., 2008). In Pakistan it is grown as
16 M. U. HAYYAT ET AL BIOLOGIA (PAKISTAN)
irrigated and rain fed crops in summer. Tall varieties are used as fodder and small varieties are used for grain production that can tolerate drought and high temperature. The fodder potential is 100 tons per hectare while the current yield reaches only 50 tons per hectare. Several factors contribute to its low production such as deficiency of quality seeds, farming on marginal land and use of mixed effluent water (Amanullah et al., 2007; Khan et al., 2010) the last one of them having severe role. The present study was designed to assess pollution role of a local textile industry by measuring physiochemical parameters of effluent and to analyze the effect of different dilutions of textile effluent on sorghum. Finally the plant biomass, photosynthetic activity and transpiration rate in different dilutions of textile effluent were measured to asses yield reduction.
MATERIALS AND METHODS
The textile waste water was collected from Nishat Textile Mill Limited in
30 liters plastic cans and transported to GC University Botanic Garden Lahore. Some of the water parameters were tested at the spot while other parameters were tested in SDSC laboratory of GCU which include COD, BOD, TDS, TSS, chlorides, bicarbonates, calcium and magnesium (APHA, 2005). Certified seeds of sorghum (Sorghum vulgare Pers CV. SSG-5000) were obtained from Department of Federal Seed Certification, Lahore. Five different concentrations of textile effluent were made (0%, 25%, 50%75% and 100%) and marked as T0, T1, T2, T3 and T4 respectively to irrigate sorghum. Each treatment had 7 replicates. There were total 35 pots. Their vegetative growth parameters were measured i.e. plant height, number of leaves and number of senescent leaves on weekly basis for a period of twelve weeks. Rate of photosynthesis and rate of transpiration of sorghum plants growing in different concentrations were also monitored and recorded by IRGA (Infra Red Gas Analyzer LCA4). At the time of final harvest the plant fresh and dry weights were determined. Statistical analysis was carried out by using software co-stat version 3.03 (Steel & Torrie, 1980).
RESULTS
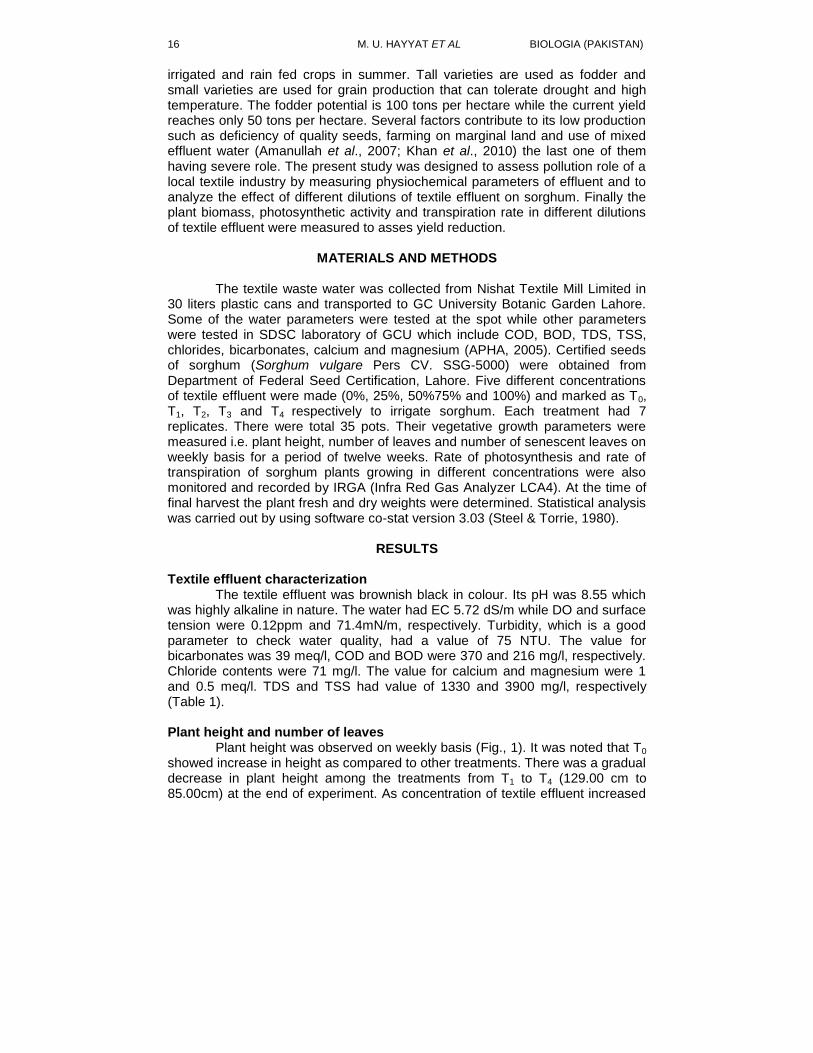
Textile effluent characterization The textile effluent was brownish black in colour. Its pH was 8.55 which
was highly alkaline in nature. The water had EC 5.72 dS/m while DO and surface tension were 0.12ppm and 71.4mN/m, respectively. Turbidity, which is a good parameter to check water quality, had a value of 75 NTU. The value for bicarbonates was 39 meq/l, COD and BOD were 370 and 216 mg/l, respectively. Chloride contents were 71 mg/l. The value for calcium and magnesium were 1 and 0.5 meq/l. TDS and TSS had value of 1330 and 3900 mg/l, respectively (Table 1).
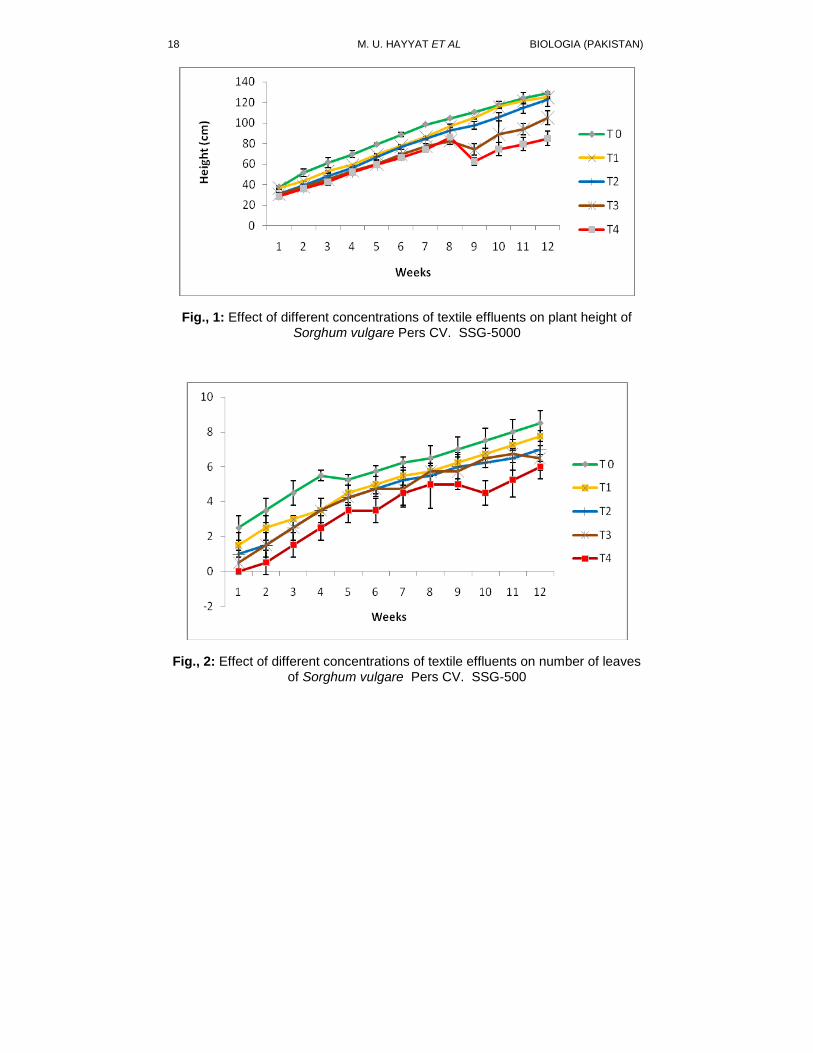
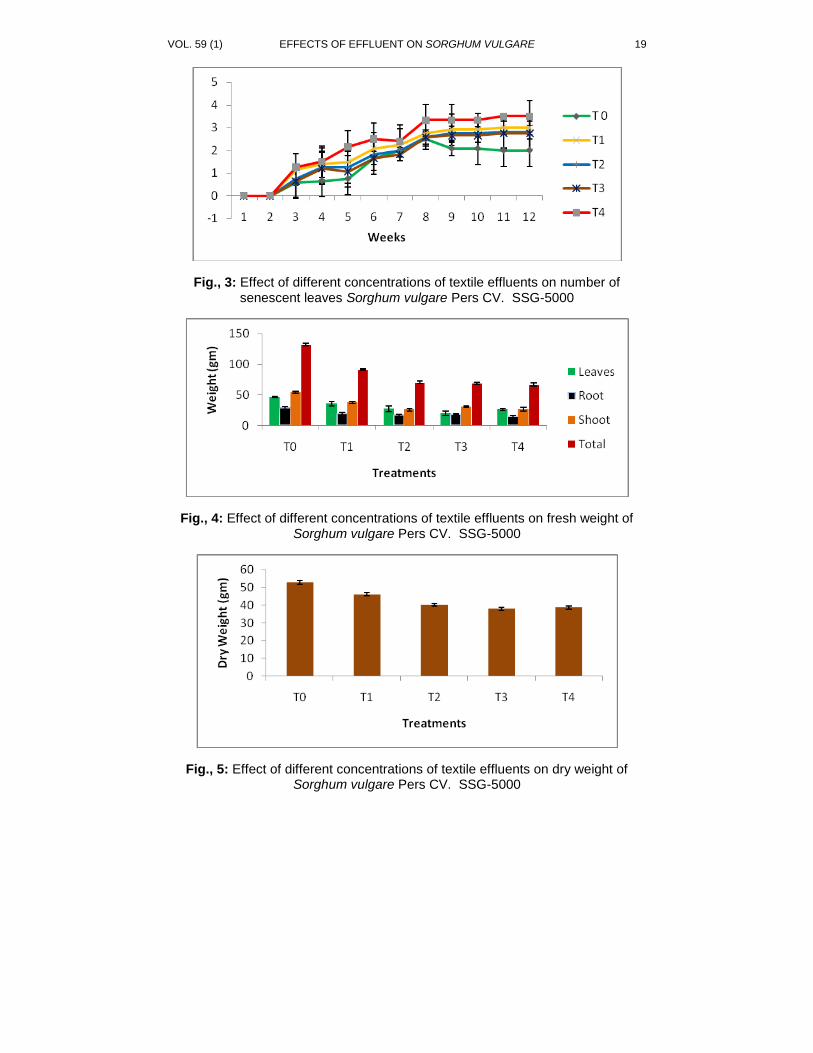
Plant height and number of leaves Plant height was observed on weekly basis (Fig., 1). It was noted that T0 showed increase in height as compared to other treatments. There was a gradual decrease in plant height among the treatments from T1 to T4 (129.00 cm to 85.00cm) at the end of experiment. As concentration of textile effluent increased
VOL. 59 (1) EFFECTS OF EFFLUENT ON SORGHUM VULGARE 17
the plant height was decreased. Treatment T0 also showed greater number of leaves per plant from other treatments (Fig., 2). The greater number of senescent leaves was noticed in T4 which was significant from the other treatments (Fig., 3).
Table 1: Characteristics of textile effluent
Parameters Textile Effluent NEQS
Colour Brownish black -
pH 8.55 6.00-10.00
Temperature (0C) 35.6 40.00
EC (dS/m) 5.72 ‹ 1.25
DO (ppm) 0.12 2.00
Surface tension (mN/m) 71.4 -
Turbidity (NTU) 75.0 -
Bicarbonates (meq/l) 39 -
COD (mg/l) 216 150
BOD (mg/l) 370 80
Chlorides (mg/l) 71 1000
Calcium (meq/l) 1.00 -
Magnesium (meq/l) 0.5 -
TDS(mg/l) 1330 3500
TSS(mg/l) 3900 150
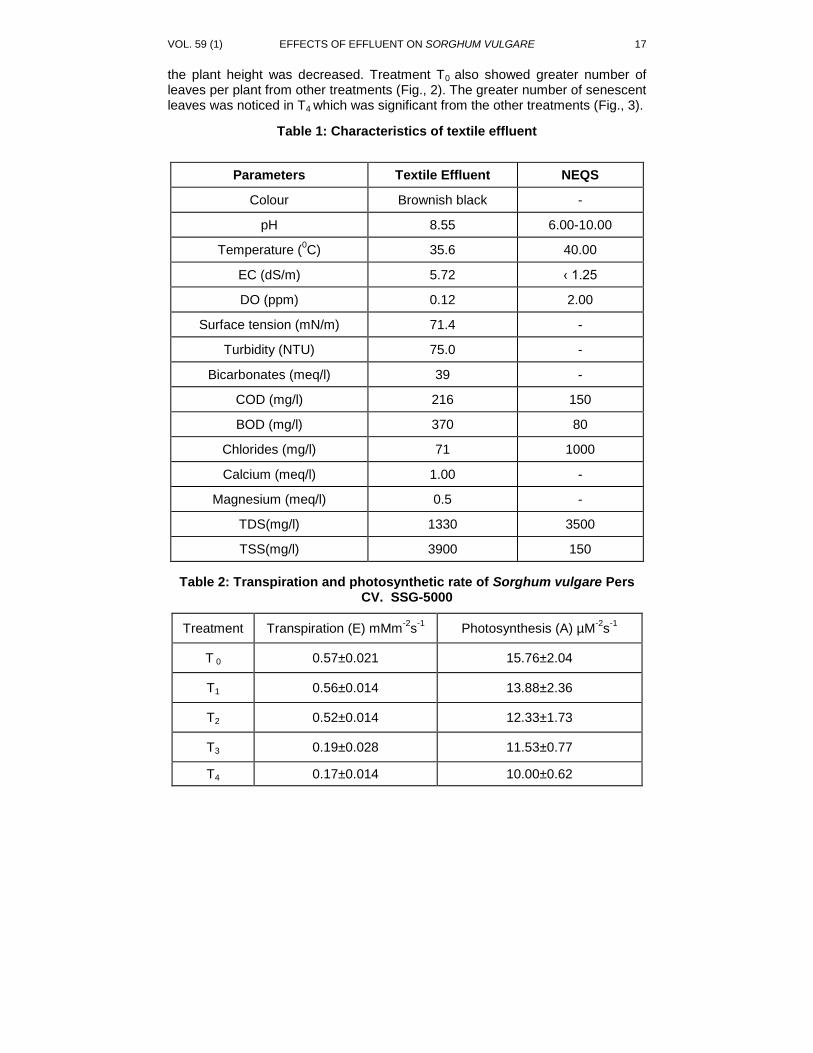
Table 2: Transpiration and photosynthetic rate of Sorghum vulgare Pers CV. SSG-5000
Treatment Transpiration (E) mMm-2
s-1
Photosynthesis (A) µM-2
s-1
T 0 0.57±0.021 15.76±2.04
T1 0.56±0.014 13.88±2.36
T2 0.52±0.014 12.33±1.73
T3 0.19±0.028 11.53±0.77
T4 0.17±0.014 10.00±0.62
18 M. U. HAYYAT ET AL BIOLOGIA (PAKISTAN)
Fig., 1: Effect of different concentrations of textile effluents on plant height of Sorghum vulgare Pers CV. SSG-5000
Fig., 2: Effect of different concentrations of textile effluents on number of leaves of Sorghum vulgare Pers CV. SSG-500
VOL. 59 (1) EFFECTS OF EFFLUENT ON SORGHUM VULGARE 19
Fig., 3: Effect of different concentrations of textile effluents on number of senescent leaves Sorghum vulgare Pers CV. SSG-5000
Fig., 4: Effect of different concentrations of textile effluents on fresh weight of Sorghum vulgare Pers CV. SSG-5000
Fig., 5: Effect of different concentrations of textile effluents on dry weight of Sorghum vulgare Pers CV. SSG-5000
20 M. U. HAYYAT ET AL BIOLOGIA (PAKISTAN)
Photosynthesis and transpiration rate Treatment T0 had higher rate of transpiration and higher rate of photosynthesis (0.57mMm
-2s
-1; 15.76 µM
-2s
-1 respectively). Photosynthesis and
transpiration are both important parameter of plants. T4 had decreased values of transpiration and photosynthesis rate (Table 2). Plant fresh and dry weight
It was observed that the highest fresh weight was shown by T0 as it received no waste water. The plant fresh weight was reduced significantly in T2, T3 and T4. The lowest weight was observed in T4 irrigated with 100% waste water. The results indicate that waste water had a toxic effect upon sorghum plant (Fig., 4). Plant dry weight was also highest in treatmentT0 followed by progressive decrease in weight in T1.T2, T3 and T4 respectively (Fig., 5).
DISCUSSION
The temperature, pH, and chloride values of the textile effluent were
within NEQS. But values of BOD, COD were above the standards values for effluents. The temperature of textile wastewater was 35.6
0C. The average
temperature of water bodies in Pakistan ranges from 22-25OC. The normal pH of
textile water must range from 6-9. In this study the pH of present textile effluent is 8.55 which is within the limits. As the values of EC and DO, are 5.72 dS/m, 0.12 ppm respectively they are above the NEQS which have a limit of ‹ 1.25 dS/m and 2mg/l. The values of BOD (216mg/l), COD (370 mg/l) and turbidity (75NTU) were above the NEQS. Although TDS (1330 mg/l) were within limits while TSS (3900 mg/l) were not within limits of the standards described (Nasir et al., 2012). Chloride value (71mg/l) was within the NEQs of chloride which was 1000mg/l. While the values of calcium and magnesium were 1meq/l and o.5 meq/l respectively (Lone et al., 2003, Manzoor et al., 2006).
Effect of textile effluents on sorghum in terms of growth assessment, transpiration and photosynthetic rate along with biomass of plant were investigated. Although the growth was slow during early period but it increased afterwards (El-Sawaf, 2005). The results of different concentration of textile water 0,25, 50,75 and 100% on plant height of sorghum showed that control had better plant height because there was no stress of effluents (Akbar et al., 2007).
Other vegetative growth parameter such as number of senescent leaves per plant was higher in T4..Control plants had lesser number of senescent leaves. Healthy plants T0 retained more leaves as compared to other treatments. The fresh and dry weight of control was greater than those in the other treatments. The fresh weight exhibited an increased trend in control plants, obviously because of greater growth and number of leaves per plant. The similar was true for dry weight of the plants of other treatments (Kaushik et al., 2005). Photosynthesis is the rate of CO2 accumulation in plants in unit time. Transpiration is the loss of water from the leaf area. It depends upon stomata opening and light amount, precipitation and wind speed. The highest rate had been observed in control followed by reduction in other treatments in order of T2<T3< T4.
VOL. 59 (1) EFFECTS OF EFFLUENT ON SORGHUM VULGARE 21
Conclusion
Most of the physicochemical parameters of textile effluent exceeded the prescribed National Environment Quality Standards. Based on data for plant growth in the present study it can be concluded that irrigation with textile effluent without proper treatment may lead to reduction in yield of fodder crops, because it contains appreciable amounts of pollutants. Long term experiments are required to explore the effects of textile effluent on soil health, fodder quality and health of consumers aspects before its use for irrigation.
REFERENCES Akbar, F., Hadi, F., Zakir.Ullah, & Zia, M. A., 2007. Effect of marble industry on
seed germination, post germinative growth and productivity of Zea mays L. Pak. J. Biol. Sci., 10(22): 4148-4151.
Amanullah, A.K., Asad, N., Khalid, K., Ahmad & Badshah, I., 2007. Growth chacters and fodder production potential of sorghum varities under irrigated conditions. Sarhad J. Agric,. 23(2):265-268.
APHA (American Public Health Association). 2005. Standard Methods for the Examination of Water and Wastewater. American Public Health Association. Washington, D. C., USA.1-874.
Dhanam, S., 2009. Effect of Dairy Effluent on Seed Germination, Seedling Growth and Biochemical Parameter in Paddy. Bot. Res. Int., 2(2):61-63.
El-Sawaf, N., 2005. Response of Sorghum spp. to Sewage Waste-water Irrigation. I.J.A.B., 7 (6): 869-874.
Faryal, R., Tahir, F. & Hameed, A., 2007. Effect of wastewater irrigation on soil along with its micro and macro flora. Pak. J. Bot., 39(1): 193-204.
Jadhav, J. P., Phugare, S. S., Dhanve, R. S. & Jadhav, S. B., 2010. Rapid biodegradation and decolorization of direct orange 39 (orange TGLL) by an isolated bacterium Pseudomonas aeruginosa strain BCH. Biodegradation, 21: 453–463.
Kaushik, P., Garg, V.K. & Singh, B., 2005. Effect of textile effluents on growth performance of wheat cultivars. Bioresour. Technol., 96: 1189-1193.
Khan, M. A., Shaukat, S.S., Hany, O. & Jabeen, S., 2010. Irrigation of sorghum crop with waste stabilization pond effluent: growth and yield responses. Pak. J. Bot., 42(3): 1665-1674.
Lone, M.I., Saleem, S., Mahmood, T., Saifullah, K. & Hussain, G., 2003. Heavy Metal Contents of Vegetables Irrigated by Sewage/Tubewell Water. I.J.A.B., 5 (4): 533-535.
Manzoor, S., Shah, M.H., Shaheen, N., Khalique, A. & Jaffar, M., 2006. Multivariate analysis of trace metals in textile effluents in relation to soil and groundwater. J. Hazard Mater., 137(1): 31-37.
Nasir, A., Arslan, C., Khan, M. A., Nazir, N. A., Usman K., Ali, M. A. & Waqas, U., 2012. Industrial waste water management in district Gujranwala, Pakistan- current status and future. Pak. J. Agri. Sci., 9(1):79-85.
Olayinkaa, O.O., Adebowaleb, K.O. & Olu-Owolabi, B. I., 2008. Effect of heat-moisture treatment on physicochemical properties of white sorghum starch. Food Hydrocolloid., 22: 225-230.

22 M. U. HAYYAT ET AL BIOLOGIA (PAKISTAN)
Saratale, R. G., Saratale, G. D., Kalyani, D. C., Chang, J. S. & Govindwar, S. P., 2009. Enhanced decolorization and biodegradation of textile azo dye Scarlet R by using developed microbial consortium-GR. Bioresource Technol., 100: 2493–2500.
Saravanamoorthy, M.D. & Kumari, B. D. R., 2007. Effect of textile waste water on morphophysiology and yield on two varieties of peanut (Arachis hypogaea L.). J. Agr. Sci., 3(2): 335-343.
Steel, R. G. D., & Torrie, J. H., 1980. Principles and Procedures of Statistics. A Biometrical Approach. McGraw Hill Inter. Book Co. Tokyo, Japan. 1-633.
BIOLOGIA (PAKISTAN) 2013, 59 (1), 23-32 PK ISSN 0006 - 3096
*Corresponding author: [email protected]
Analysis of secondary metabolites in callus cultures of
Momordica charantia cv. Jaunpuri
*SAFDAR ALI & ALVEENA TARIQ
Department of Botany, GC University, Lahore, Pakistan.
ABSTRACT
Present research work was carried out to analyze secondary metabolites in
callus cultures of Momordica charantia L. cultivar i.e. Jaunpuri. Conditions were optimized to foster establishment of callus cultures. In vitro grown seedlings were used as explant source. Different parts of in vitro grown seedlings were employed in MS medium supplemented different PGRs to raise callus cultures. Among various combinations of PGRs supplemented (BAP, IAA, 2,4-D) in MS medium, BAP/2,4-D was found to be the most suitable combination with different concentrations for callus induction in different explants from in vitro grown seedlings of M. charantia cv. Jaunpuri. Paramount calli were analyzed through GC-MS and it was found that plant tissues from field grown plants contain relatively more secondary metabolites than the calluses of related plant parts. Secondary metabolites detected and estimated in callus cultures of cotyledon explant of cv. Jaunpuri were comparatively similar with slight variations. Alpha-eleostearic acid a specific fatty acid of Momordica was found in internodes of field grown plants and in callus cultures of M. charantia cv. Jaunpuri. Keywords: Secondary Metabolites, Momordica, Jaunpuri, Alpha-eleostearic Acid
INTRODUCTION
Momordica charantia L. frequently known as bitter gourd in the world and
Krella as local name in Pakistan. M. charantia, a herbaceous plant of family Cucurbitaceae, is biochemically and morphologically different (Welman, 2000). The fully ripe fruit turns orange and mushy, is too bitter to eat, and splits into segments which curl back dramatically to expose seeds covered in bright red pulp (Kumar et al., 2010).
Krella contains important metabolites and has excellent medicinal virtues. In subcontinent, it is cropped for its fruits used as vegetable (Platel & Srinivasan 1997) and for ritual and ethno-medicinal practices in some countries of Western Africa (Beloina et al., 2005). The plant extracts and juices have been found suitable for different diseases/problems (Nadkarni, 1982). Krella is also used in native medicines of Asia and Africa. In Brazil, krella is used in the preparation of herbal medicines for tumors, wounds, rheumatism, vaginal discharge, inflammation, diabetes etc. In Mexico, the entire plant is used for diabetes and dysentery (Ng, 1993).
The search for new plant derived chemicals should remain a priority in current and future efforts toward sustainable conservation and rational utilization of biodiversity (Phillipson, 1990). Different chemical compounds in the plant material can be detected and analyzed by Gas Chromatography/Mass Spectrometry (GC/MS). The GC-MS instrument separates chemical mixtures and identifies the components at a molecular level (Helmja et al., 2007). In the search
24 S. ALI & A. TARIQ BIOLOGIA (PAKISTAN)
for alternatives of desirable medicinal compounds from plants, biotechnological approaches, specifically, plant tissue cultures has been found to have potential as a supplement to traditional agriculture in the industrial production of bioactive plant metabolites (Ramachandra & Ravishankar 2000). This study was undertaken to optimize protocol for callus induction using various explants of Krella in vitro grown seedlings and analysis of explant tissues and respective callus cultures for production of secondary metabolites.
MATERIALS AND METHODS
Procurement and germination of seeds
Seeds were procured from Seed Certification Department near Jain Mandar, Old Anarkali, Lahore. Seeds of Krella cv. Jaunpuri were surface sterilized and employed for germination in Petri plates (100 mm) containing cotton pads moistened with distilled water in aseptic conditions. The lab grown in vitro seedlings were used as explant source for callus induction.
Culture medium
MS Medium (Murashige & Skoog 1962) was prepared and different plant growth regulators such as auxins, 2,4-Dichlorophenoxyacetic acid (2,4-D), Indolacetic acid (IAA) and cytokinins such as 6-Benzylaminopurine (BAP) were added in the medium in different combinations like BAP with 2,4-D. BAP and 2,4-D were applied in range from 0.5 to 2.0 and 0.5 to 3.5 mg/L respectively in different concentrations.
Callus induction
Different explants from in vitro grown seedlings of cv. Jaunpuri like leaf, cotyledon, internode and apical bud were employed for callus induction in culture vessels (jars of 100 ml) containing MS medium supplemented with different PGRs. The culture jars were incubated in culture room maintaing temprature at 25°C ± 2 and florescent tube light of 2000 to 3000 lux (Digital Lux Meter Model, TES 1330) with 16h photoperiod.
Callus Index
Callus index (CI) was calculated by the following formula (Khosh & Singh, 1982).
CI = 100n x G/N where n = Number of explants initiating callus; G = Visual callus rating of initiated explants; N = Total number of explants planted
A visual rating of 1 to 4 was assigned from smallest to largest of each callus mass respective. Anaysis of callus cultures
The calli obtained from explants like leaf, cotyledon, internode and apical bud of cv. Jaunpuri from in vitro grown seedlings and explant tissues from field grown seedlings were subjected to analysis through GC-MS (Model, Ajilent 6890) to assess different types of SMs (Hina et. al., 2012). The objective was to compare types and amounts of secondary metabolites produced in naturally
VOL. 59 (1) SECONDARY METABOLITES IN M. CHARANTIA 25
growing seedling plant tissues and respective callus cultures as an alternate source.
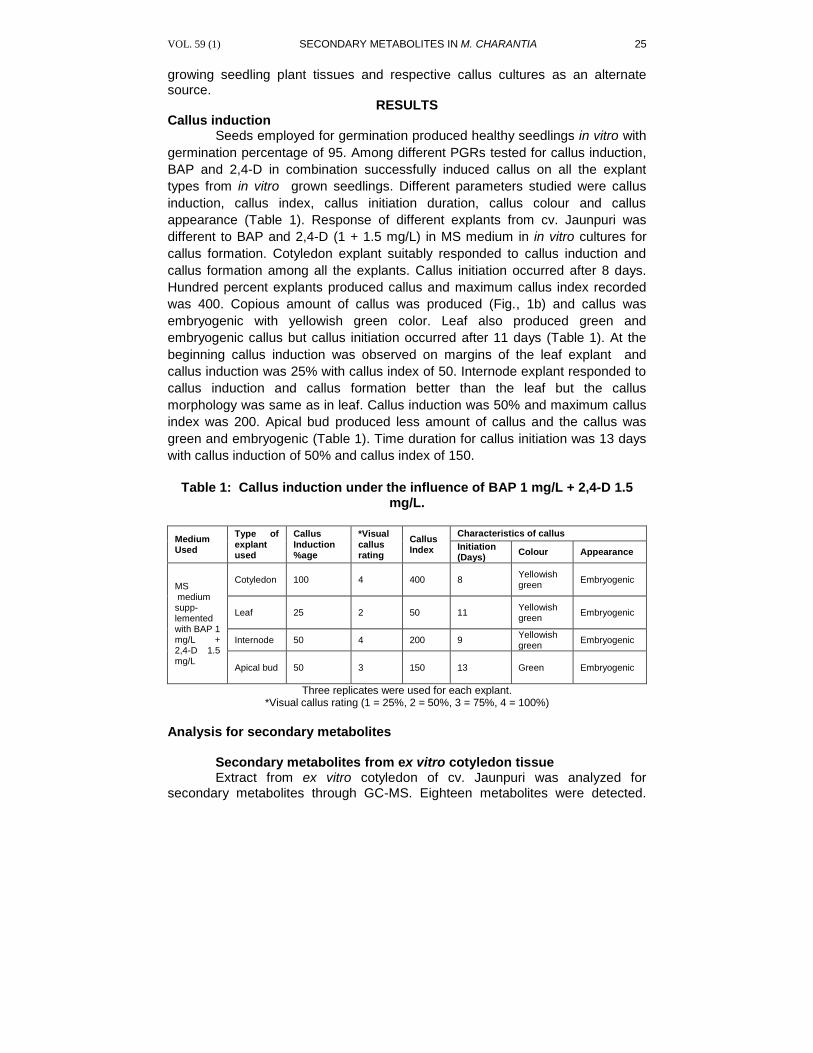
RESULTS Callus induction
Seeds employed for germination produced healthy seedlings in vitro with
germination percentage of 95. Among different PGRs tested for callus induction,
BAP and 2,4-D in combination successfully induced callus on all the explant
types from in vitro grown seedlings. Different parameters studied were callus
induction, callus index, callus initiation duration, callus colour and callus
appearance (Table 1). Response of different explants from cv. Jaunpuri was
different to BAP and 2,4-D (1 + 1.5 mg/L) in MS medium in in vitro cultures for
callus formation. Cotyledon explant suitably responded to callus induction and
callus formation among all the explants. Callus initiation occurred after 8 days.
Hundred percent explants produced callus and maximum callus index recorded
was 400. Copious amount of callus was produced (Fig., 1b) and callus was
embryogenic with yellowish green color. Leaf also produced green and
embryogenic callus but callus initiation occurred after 11 days (Table 1). At the
beginning callus induction was observed on margins of the leaf explant and
callus induction was 25% with callus index of 50. Internode explant responded to
callus induction and callus formation better than the leaf but the callus
morphology was same as in leaf. Callus induction was 50% and maximum callus
index was 200. Apical bud produced less amount of callus and the callus was
green and embryogenic (Table 1). Time duration for callus initiation was 13 days
with callus induction of 50% and callus index of 150.
Table 1: Callus induction under the influence of BAP 1 mg/L + 2,4-D 1.5
mg/L.
Medium Used
Type of explant used
Callus Induction %age
*Visual callus rating
Callus Index
Characteristics of callus
Initiation (Days)
Colour Appearance
MS medium supp- lemented with BAP 1 mg/L + 2,4-D 1.5 mg/L
Cotyledon 100 4 400 8 Yellowish green
Embryogenic
Leaf 25 2 50 11 Yellowish green
Embryogenic
Internode 50 4 200 9 Yellowish green
Embryogenic
Apical bud 50 3 150 13 Green Embryogenic
Three replicates were used for each explant. *Visual callus rating (1 = 25%, 2 = 50%, 3 = 75%, 4 = 100%)
Analysis for secondary metabolites
Secondary metabolites from ex vitro cotyledon tissue Extract from ex vitro cotyledon of cv. Jaunpuri was analyzed for
secondary metabolites through GC-MS. Eighteen metabolites were detected.
26 S. ALI & A. TARIQ BIOLOGIA (PAKISTAN)
Percentage compositions of different metabolites obtained from cotyledon tissue of cv. Jaunpuri (Table 2) were as follows: two compounds more than 10% which are β-Phellandrene = 32.156 and Benzene,1,2,3-trimethoxy-5-[2-propenyl] = 10.354. Eight compounds were evaluated between1 to 10% like Bicyclo | 3,1,0 | hexane,4-methyl-1-[1-methylethyl]-, didehydro derive. = 4.573, 1R-α-Pinene = 5.690, Benzene,1-methyl-4-[1-methylethyl]- = 4.936, o-Xylene = 4.330, Cyclohexene,1-methyl-4-[1-methylethyldene]- = 5.769, Heptanoic acid, methyl ester = 3.175, Benzenamine,N,N,Diamine = 6.750 and Heptadecane = 4.337. Eight compounds less than 1% which are Toluene = 0.939, Benzene acetic acid, heptyl ester = 0.773, 1,4-Cyclohexadiene,1-methyl-4-[1-methylethyl]- = 0.793, Benzene,1,2-dimethoxy-4-[2-propenyl]- = 0.675, Tetradecane,2,6,10-trimethyl = 0.559, Ethylbenzene = 0.063, Diethyltoluamide = 0.359 and Eicosane = 0.211.
A B
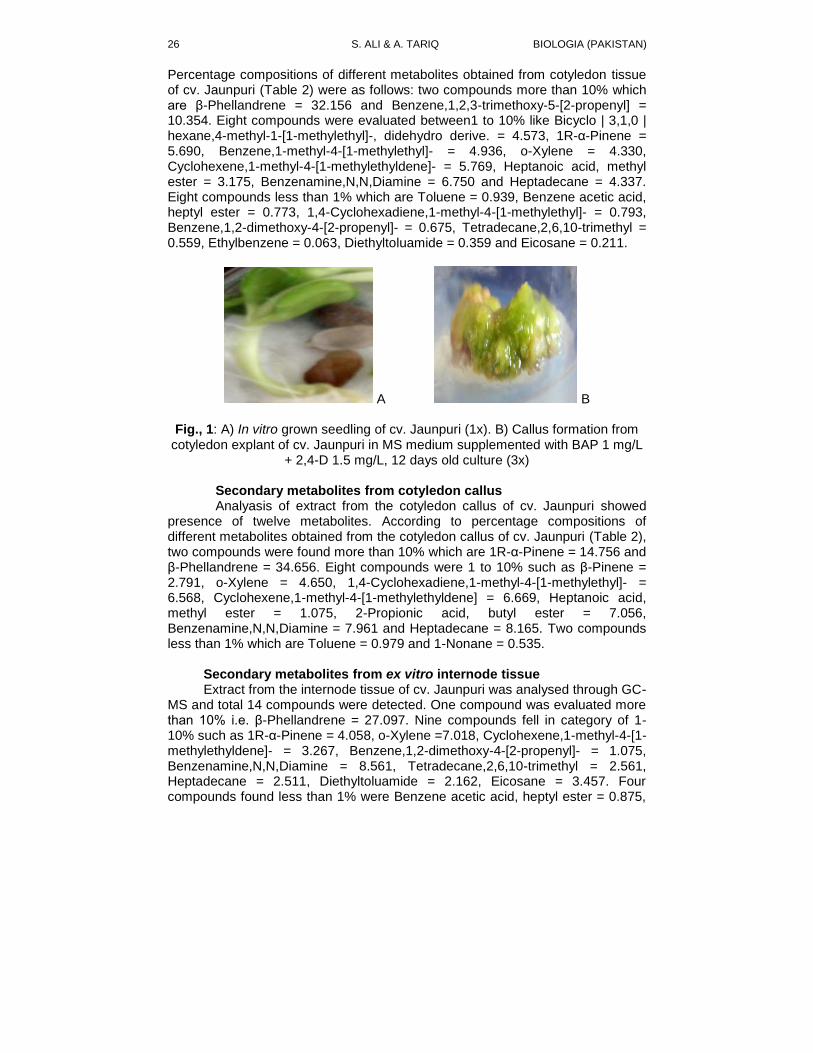
Fig., 1: A) In vitro grown seedling of cv. Jaunpuri (1x). B) Callus formation from cotyledon explant of cv. Jaunpuri in MS medium supplemented with BAP 1 mg/L
+ 2,4-D 1.5 mg/L, 12 days old culture (3x)
Secondary metabolites from cotyledon callus Analyasis of extract from the cotyledon callus of cv. Jaunpuri showed
presence of twelve metabolites. According to percentage compositions of different metabolites obtained from the cotyledon callus of cv. Jaunpuri (Table 2), two compounds were found more than 10% which are 1R-α-Pinene = 14.756 and β-Phellandrene = 34.656. Eight compounds were 1 to 10% such as β-Pinene = 2.791, o-Xylene = 4.650, 1,4-Cyclohexadiene,1-methyl-4-[1-methylethyl]- = 6.568, Cyclohexene,1-methyl-4-[1-methylethyldene] = 6.669, Heptanoic acid, methyl ester = 1.075, 2-Propionic acid, butyl ester = 7.056, Benzenamine,N,N,Diamine = 7.961 and Heptadecane = 8.165. Two compounds less than 1% which are Toluene = 0.979 and 1-Nonane = 0.535.
Secondary metabolites from ex vitro internode tissue Extract from the internode tissue of cv. Jaunpuri was analysed through GC-
MS and total 14 compounds were detected. One compound was evaluated more than 10% i.e. β-Phellandrene = 27.097. Nine compounds fell in category of 1-10% such as 1R-α-Pinene = 4.058, o-Xylene =7.018, Cyclohexene,1-methyl-4-[1-methylethyldene]- = 3.267, Benzene,1,2-dimethoxy-4-[2-propenyl]- = 1.075, Benzenamine,N,N,Diamine = 8.561, Tetradecane,2,6,10-trimethyl = 2.561, Heptadecane = 2.511, Diethyltoluamide = 2.162, Eicosane = 3.457. Four compounds found less than 1% were Benzene acetic acid, heptyl ester = 0.875,
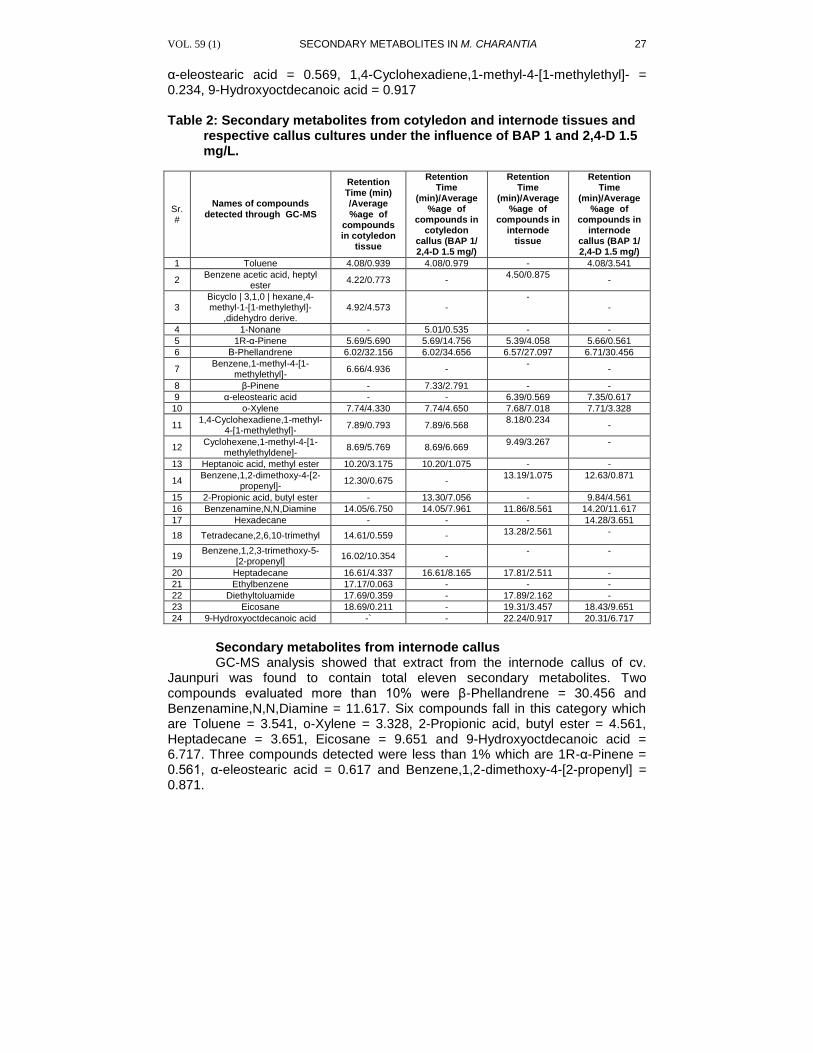
VOL. 59 (1) SECONDARY METABOLITES IN M. CHARANTIA 27
α-eleostearic acid = 0.569, 1,4-Cyclohexadiene,1-methyl-4-[1-methylethyl]- = 0.234, 9-Hydroxyoctdecanoic acid = 0.917 Table 2: Secondary metabolites from cotyledon and internode tissues and
respective callus cultures under the influence of BAP 1 and 2,4-D 1.5 mg/L.
Sr. #
Names of compounds detected through GC-MS
Retention Time (min) /Average %age of
compounds in cotyledon
tissue
Retention Time
(min)/Average %age of
compounds in cotyledon
callus (BAP 1/ 2,4-D 1.5 mg/)
Retention Time
(min)/Average %age of
compounds in internode
tissue
Retention Time
(min)/Average %age of
compounds in internode
callus (BAP 1/ 2,4-D 1.5 mg/)
1 Toluene 4.08/0.939 4.08/0.979 - 4.08/3.541
2 Benzene acetic acid, heptyl
ester 4.22/0.773 -
4.50/0.875 -
3 Bicyclo | 3,1,0 | hexane,4-methyl-1-[1-methylethyl]-
,didehydro derive. 4.92/4.573 -
- -
4 1-Nonane - 5.01/0.535 - -
5 1R-α-Pinene 5.69/5.690 5.69/14.756 5.39/4.058 5.66/0.561
6 Β-Phellandrene 6.02/32.156 6.02/34.656 6.57/27.097 6.71/30.456
7 Benzene,1-methyl-4-[1-
methylethyl]- 6.66/4.936 -
- -
8 β-Pinene - 7.33/2.791 - -
9 α-eleostearic acid - - 6.39/0.569 7.35/0.617
10 o-Xylene 7.74/4.330 7.74/4.650 7.68/7.018 7.71/3.328
11 1,4-Cyclohexadiene,1-methyl-
4-[1-methylethyl]- 7.89/0.793 7.89/6.568
8.18/0.234 -
12 Cyclohexene,1-methyl-4-[1-
methylethyldene]- 8.69/5.769 8.69/6.669
9.49/3.267 -
13 Heptanoic acid, methyl ester 10.20/3.175 10.20/1.075 - -
14 Benzene,1,2-dimethoxy-4-[2-
propenyl]- 12.30/0.675 -
13.19/1.075 12.63/0.871
15 2-Propionic acid, butyl ester - 13.30/7.056 - 9.84/4.561
16 Benzenamine,N,N,Diamine 14.05/6.750 14.05/7.961 11.86/8.561 14.20/11.617
17 Hexadecane - - - 14.28/3.651
18 Tetradecane,2,6,10-trimethyl 14.61/0.559 - 13.28/2.561 -
19 Benzene,1,2,3-trimethoxy-5-
[2-propenyl] 16.02/10.354 -
- -
20 Heptadecane 16.61/4.337 16.61/8.165 17.81/2.511 -
21 Ethylbenzene 17.17/0.063 - - -
22 Diethyltoluamide 17.69/0.359 - 17.89/2.162 -
23 Eicosane 18.69/0.211 - 19.31/3.457 18.43/9.651
24 9-Hydroxyoctdecanoic acid -` - 22.24/0.917 20.31/6.717
Secondary metabolites from internode callus GC-MS analysis showed that extract from the internode callus of cv.
Jaunpuri was found to contain total eleven secondary metabolites. Two compounds evaluated more than 10% were β-Phellandrene = 30.456 and Benzenamine,N,N,Diamine = 11.617. Six compounds fall in this category which are Toluene = 3.541, o-Xylene = 3.328, 2-Propionic acid, butyl ester = 4.561, Heptadecane = 3.651, Eicosane = 9.651 and 9-Hydroxyoctdecanoic acid = 6.717. Three compounds detected were less than 1% which are 1R-α-Pinene = 0.561, α-eleostearic acid = 0.617 and Benzene,1,2-dimethoxy-4-[2-propenyl] = 0.871.
28 S. ALI & A. TARIQ BIOLOGIA (PAKISTAN)
0
5
10
15
20
25
30
35
40
1 2 3 4 5 6 7 8 9
No. of Compounds
% C
om
po
sit
ion
of
Co
mp
ou
nd
s
cotyledon cotyledon callus
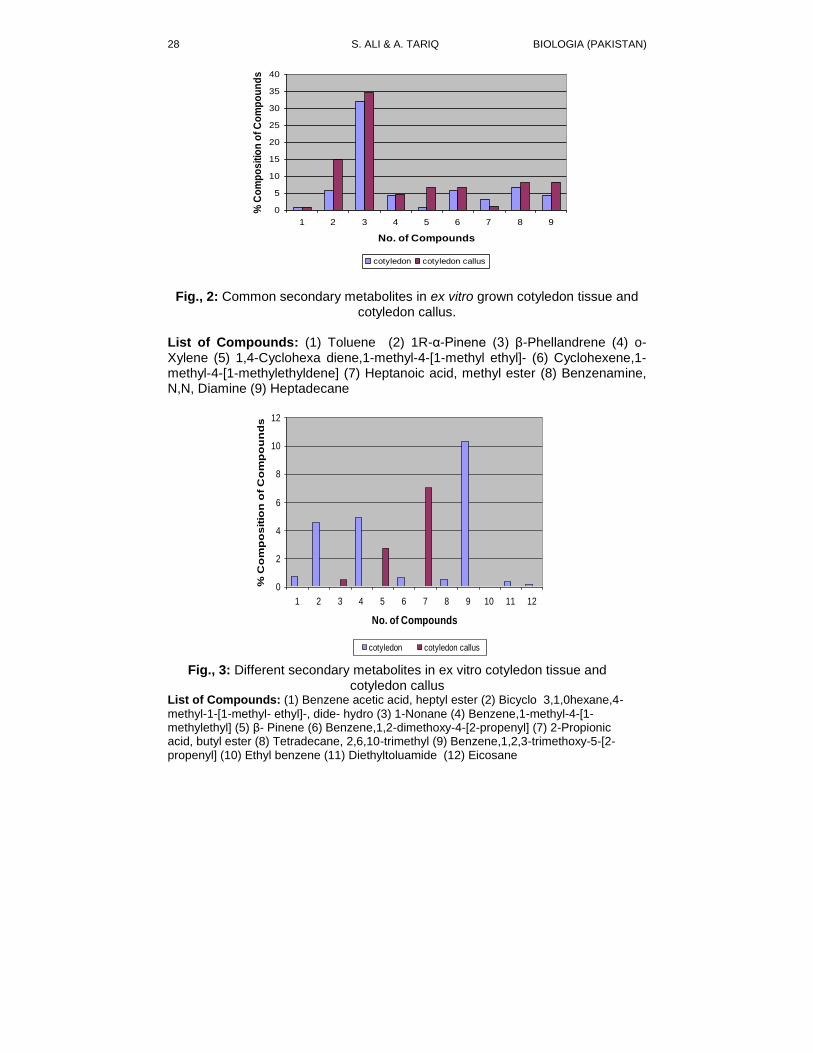
Fig., 2: Common secondary metabolites in ex vitro grown cotyledon tissue and cotyledon callus.
List of Compounds: (1) Toluene (2) 1R-α-Pinene (3) β-Phellandrene (4) o-Xylene (5) 1,4-Cyclohexa diene,1-methyl-4-[1-methyl ethyl]- (6) Cyclohexene,1-methyl-4-[1-methylethyldene] (7) Heptanoic acid, methyl ester (8) Benzenamine, N,N, Diamine (9) Heptadecane
0
2
4
6
8
10
12
1 2 3 4 5 6 7 8 9 10 11 12
No. of Compounds
% C
om
po
sit
ion
of
Co
mp
ou
nd
s
cotyledon cotyledon callus
Fig., 3: Different secondary metabolites in ex vitro cotyledon tissue and
cotyledon callus List of Compounds: (1) Benzene acetic acid, heptyl ester (2) Bicyclo 3,1,0hexane,4-
methyl-1-[1-methyl- ethyl]-, dide- hydro (3) 1-Nonane (4) Benzene,1-methyl-4-[1- methylethyl] (5) β- Pinene (6) Benzene,1,2-dimethoxy-4-[2-propenyl] (7) 2-Propionic acid, butyl ester (8) Tetradecane, 2,6,10-trimethyl (9) Benzene,1,2,3-trimethoxy-5-[2- propenyl] (10) Ethyl benzene (11) Diethyltoluamide (12) Eicosane
VOL. 59 (1) SECONDARY METABOLITES IN M. CHARANTIA 29
0
5
10
15
20
25
30
35
1 2 3 4 5 6 7 8 9
No. of Compounds
% C
om
po
sit
ion
of
Co
mp
ou
nd
s
internode internode callus
Fig., 4: Common secondary metabolites found in ex vitro internode tissue and
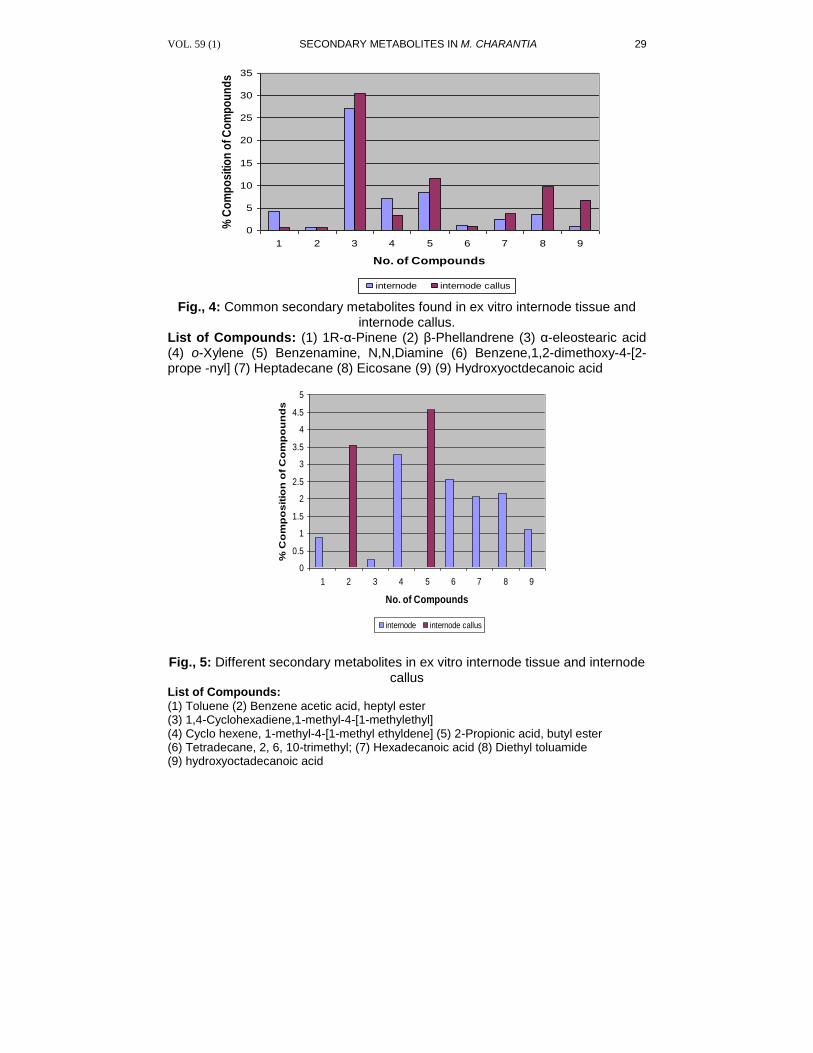
internode callus. List of Compounds: (1) 1R-α-Pinene (2) β-Phellandrene (3) α-eleostearic acid (4) o-Xylene (5) Benzenamine, N,N,Diamine (6) Benzene,1,2-dimethoxy-4-[2-prope -nyl] (7) Heptadecane (8) Eicosane (9) (9) Hydroxyoctdecanoic acid
0
0.5
1
1.5
2
2.5
3
3.5
4
4.5
5
1 2 3 4 5 6 7 8 9
No. of Compounds
% C
om
po
sit
ion
of
Co
mp
ou
nd
s
internode internode callus
Fig., 5: Different secondary metabolites in ex vitro internode tissue and internode
callus List of Compounds:
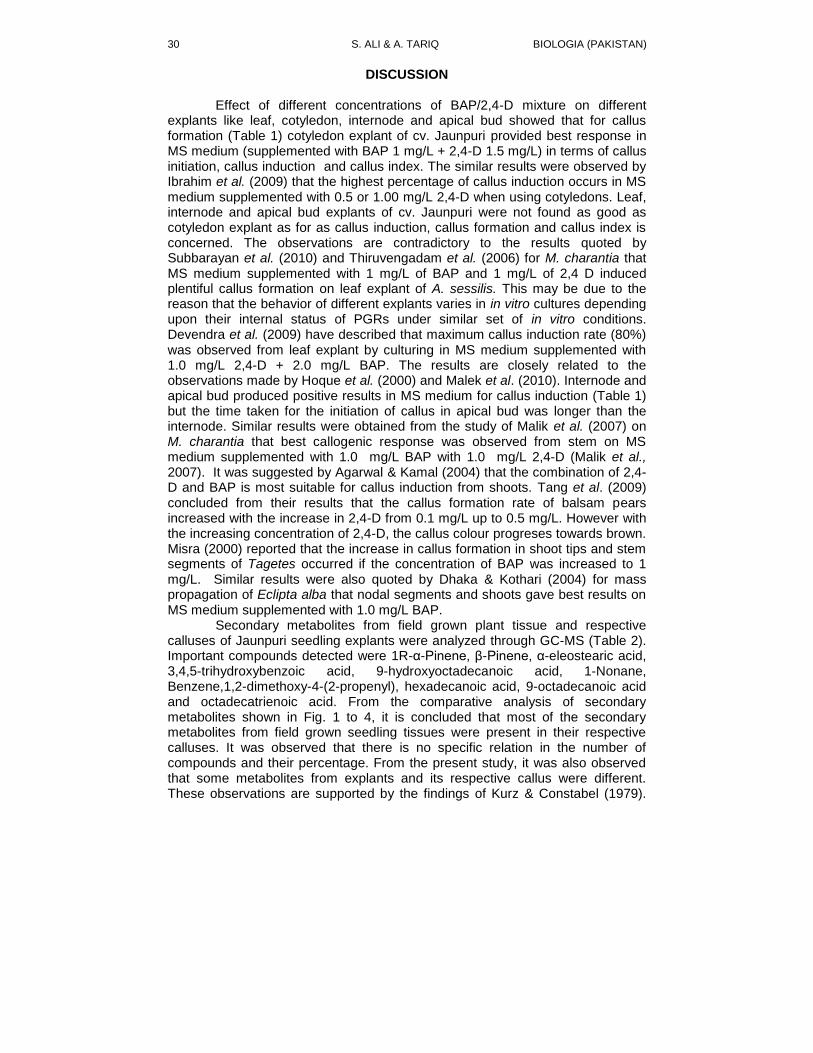
(1) Toluene (2) Benzene acetic acid, heptyl ester (3) 1,4-Cyclohexadiene,1-methyl-4-[1-methylethyl] (4) Cyclo hexene, 1-methyl-4-[1-methyl ethyldene] (5) 2-Propionic acid, butyl ester (6) Tetradecane, 2, 6, 10-trimethyl; (7) Hexadecanoic acid (8) Diethyl toluamide (9) hydroxyoctadecanoic acid
30 S. ALI & A. TARIQ BIOLOGIA (PAKISTAN)
DISCUSSION
Effect of different concentrations of BAP/2,4-D mixture on different explants like leaf, cotyledon, internode and apical bud showed that for callus formation (Table 1) cotyledon explant of cv. Jaunpuri provided best response in MS medium (supplemented with BAP 1 mg/L + 2,4-D 1.5 mg/L) in terms of callus initiation, callus induction and callus index. The similar results were observed by Ibrahim et al. (2009) that the highest percentage of callus induction occurs in MS medium supplemented with 0.5 or 1.00 mg/L 2,4-D when using cotyledons. Leaf, internode and apical bud explants of cv. Jaunpuri were not found as good as cotyledon explant as for as callus induction, callus formation and callus index is concerned. The observations are contradictory to the results quoted by Subbarayan et al. (2010) and Thiruvengadam et al. (2006) for M. charantia that MS medium supplemented with 1 mg/L of BAP and 1 mg/L of 2,4 D induced plentiful callus formation on leaf explant of A. sessilis. This may be due to the reason that the behavior of different explants varies in in vitro cultures depending upon their internal status of PGRs under similar set of in vitro conditions. Devendra et al. (2009) have described that maximum callus induction rate (80%) was observed from leaf explant by culturing in MS medium supplemented with 1.0 mg/L 2,4-D + 2.0 mg/L BAP. The results are closely related to the observations made by Hoque et al. (2000) and Malek et al. (2010). Internode and apical bud produced positive results in MS medium for callus induction (Table 1) but the time taken for the initiation of callus in apical bud was longer than the internode. Similar results were obtained from the study of Malik et al. (2007) on M. charantia that best callogenic response was observed from stem on MS medium supplemented with 1.0 mg/L BAP with 1.0 mg/L 2,4-D (Malik et al., 2007). It was suggested by Agarwal & Kamal (2004) that the combination of 2,4-D and BAP is most suitable for callus induction from shoots. Tang et al. (2009) concluded from their results that the callus formation rate of balsam pears increased with the increase in 2,4-D from 0.1 mg/L up to 0.5 mg/L. However with the increasing concentration of 2,4-D, the callus colour progreses towards brown. Misra (2000) reported that the increase in callus formation in shoot tips and stem segments of Tagetes occurred if the concentration of BAP was increased to 1 mg/L. Similar results were also quoted by Dhaka & Kothari (2004) for mass propagation of Eclipta alba that nodal segments and shoots gave best results on MS medium supplemented with 1.0 mg/L BAP.
Secondary metabolites from field grown plant tissue and respective calluses of Jaunpuri seedling explants were analyzed through GC-MS (Table 2). Important compounds detected were 1R-α-Pinene, β-Pinene, α-eleostearic acid, 3,4,5-trihydroxybenzoic acid, 9-hydroxyoctadecanoic acid, 1-Nonane, Benzene,1,2-dimethoxy-4-(2-propenyl), hexadecanoic acid, 9-octadecanoic acid and octadecatrienoic acid. From the comparative analysis of secondary metabolites shown in Fig. 1 to 4, it is concluded that most of the secondary metabolites from field grown seedling tissues were present in their respective calluses. It was observed that there is no specific relation in the number of compounds and their percentage. From the present study, it was also observed that some metabolites from explants and its respective callus were different. These observations are supported by the findings of Kurz & Constabel (1979).
VOL. 59 (1) SECONDARY METABOLITES IN M. CHARANTIA 31
Gamborg et al. (1971) also suggested that the metabolites produced in in vitro cultures may be different from the metabolites produced in in vivo.
Various studies showed that alkaloids and saponins are present in Momordica and volatile components are released during cooking which enhance the flavor (Binder et al., 1989; Schultes, 1990). Xiao-ru et al. (2010) found that the seed oil of M. charantia contained saturated fatty acids mainly stearic acid, monounsaturated fatty acids like linoleic acid and polyunsaturated fatty acids. The alpha-eleostearic acid was the main fatty acids of all. The alpha-eleostearic acid leads to strong effects of inhibiting tumor cell proliferation, lowering blood fat, anti-inflammatory and preventing cardiovascular diseases.
Alpha-eleostearic acid detected in internode tissue as well as in internode callus cultures can be produced in in vitro cultures in a relatively short period of time by-passing the seasonal pressure round the year.
REFERENCES
Agarwal, M. & Kamal, R., 2004. In vitro clonal propagation of Momordica charantia L. Ind. J. Biotechnol., 3(3): 426-430.
Beloina, N., Gbeassorb, M., Akpaganab, K., Hudsonc, J., de Soussab, K., Koumaglob, K. & Arnasona, J. T., 2005. Ethnomedicinal uses of Momordica charantia (Cucurbitaceae) in Togo and relation to its phytochemistry and biological activity. J. Ethnopharmacol., 96(1-2): 49-55.
Binder, R. G., Flath R. A. & Mon, T. R., 1989. Volatile components of bittermelon. J. Agr. Food Chem., 37: 418-420.
Devendra, N. K., Subhash B. & Seetharam, Y. N., 2009. Callus growth and plant regeneration in Momordica dioica (Roxb.) Willd. Cucurbitaceae. Am-Euras. J. Sustain. Agric., 3(4): 743-748.
Dhaka, N. & Kothari, S.L., 2004. Micropopagation of Elipta alba L. an important medicinal plant. In vitro- cell Dev. Biol. Plant, pp. 658-661.
Gamborg, O. L., Constabel, F., Rue, T. L., Miller, R. A. & Steck, W., 1971. The influence of hormones on secondary metabolite formation in plant cell cultures. Colloq. Int., 193: 335.
Helmja, K., Vaher, M., Gorbatsova J. & Kaljurand, M., 2007. Characterization of bioactive compounds contained in vegetables of the Solanaceae family by capillary electrophoresis. Proc.Estonian Acad. of Sci. Chem., 172-186.
Tanveer, H., Ali S. & Asi, M.R., 2012. Appraisal of an important flavonoid, quercetin in callus cultures of Citrullus colocynthis. Int. J. Agric. Biol., 14: 528–532.
Hoque, A., Islam, R. & Arima, S., 2000. High frequency plant regeneration from cotyledon derived callus of M. dioica (Roxb.) Willd. Phytomorph., 50(3&4): 267- 272.
Ibrahim, A. I., Ahmed, A. N., Awatef, M. B. E. & Tamer, M. A. E., 2009. High Efficiency Plant Regeneration and Transformation of Watermelon (Citrulus lanatus cv. Giza1). J. Agric. Biol. Sci., 5(5): 689-697.
Khosh, M. & Singh, K., 1982. Callus induction and culture of roses. Sci. Hort., 17: 361.
32 S. ALI & A. TARIQ BIOLOGIA (PAKISTAN)
Kumar, D., Sathish, K., Sharathnath V., Yogeswaran, P., Harani, A., Sudhakar, K., Sudha P. & Banji D., 2010. A medicinal potency of Momordica charantia. Int. J. Pharm. Sci. Review & Research., 1(2): 95-100.
Kurz, W. G. W. & Constabel, F., 1979. Plant cell cultures, a potential source of pharmaceuticals. Adv. App. Microbiol., 25: 209-240.
Malek, M. A., Mannan, M. A., Khanum, D., Molla, M. H. & Khatun, M., 2010. In vitro regeneration through callus in pointed gourd (Trichosanthes dioica Roxb.). Bangladesh J. Agril. Res., 35(3): 465-473.
Malik, S., Zia, M., Riaz-ur-Rehman & Chaudhary, M. F., 2007. In vitro plant regeneration from direct and indirect organogenesis of Momordica charantia. Pak. J. Biol. Sci., 10(22): 4118-22.
Misra, P., 2000. In vitro maintenance of Tagetes F1 hybrid. Current Sci., 78(4): 383-384.
Murashige, T., & Skoog F., 1962. A revised medium for rapid growth and bioassays with tobacco tissue culture. Physiol. Plants., 15: 437-496.
Nadakarni, K. M., 1982. Momordica charantia L. Indian. Material. Medica., Vol. I, part II, pp. 805-807.
Ng, T. J., 1993. New opportunities in the Cucurbitaceae. In: J. Janick and J.E. Simon (eds.), New crops. Wiley, New York, pp. 538-546.
Phillipson, J. D., 1990. Plants as source of valuable products. In. Secondary Products from Plant Tissue Culture. B. V. Charlwood, & M. J. C. Rhodes (eds.), Oxford: Clarendon Press, pp. 1-21.
Platel, K. & Srinivasan, K., 1997. Plants food in the management of diabetes mellitus: vegetables as potential hypoglycaemic agents. Nahrung., 41(2): 68-74.
Ramachandra Rao, S. & Ravishankar, G. A., 2000. Biotransformation of protocatechuic aldehyde and caffeic acid to vanillin and capsaicin in freely suspended and immobilized cell cultures of Capsicum frutescens. J. Biotechnol., 76: 137-146.
Schultes, R.E., 1990. Biodynamic cucurbits in the New World tropics. In: Biology and utilization of the Cucurbitaceae. D. M. Bates, R. W. Robinson, & C. Jeffrey (eds.), pp. 307-317.
Subbarayan, K., Varadharajan N. & Kalyanaraman, R., 2010. Indole-3-acetic acid from contaminant fungus and potential application for cell cultures of Alternanthera sessilis. Int. J. Pharma Bio Sci., 1(4): 257-262.
Tang, Y., Li, H., Liu, J., Liu B. & Luo, H. P., 2009. Callus formation from Anther Culture in Balsam Pear (Momordica charantia L.). Am-Euras. J. Agric. and Environ. Sci., 6(3): 308-312.
Thiruvengadam, M., Mohamed, S. V., Yang C.H. & Jayabalan, N., 2006. Development of an embryogenic suspension culture of bitter melon (Momordica charantia L.). Sci. Horticulturae. 109(2): 123-129.
Welman, W.G., 2000. Cucurbitaceae. In: Seed Plants of Southern Africa. O.A. Leistner (ed.), Strelitzia., 10: 237-241.
Xiao-ru, L., Ze-yuan, D., Ya-wei, F., Jing, L. & Zhi-han, L., 2010. Mineral elements analysis of Momordica charantia seeds by ICP-AES and fatty acid profile identification of seed oil by GC-MS. Guang Pu Xue Yu Guang Pu Fen Xi., 30(8): 2265-8.
BIOLOGIA (PAKISTAN) 2013, 59 (1), 33-41 PK ISSN 0006 - 3096
*Corresponding author: [email protected]
Diversity Indices of epiphytic rotifers of a floodplain
*ABDUL QAYYUM KHAN SULEHRIA1, ZAHID SHARIF MIRZA
2,
MEHWISH FAHEEM3 & NIMRA ZAFAR
4
1,3,4
Department of Zoology, GC University, Lahore. 2Fisheries Research & Training Institute, P.O. Batapur , Lahore, Pakistan.
ABSTRACT
Present study was conducted to determine the diversity of epiphytic rotifers of a
floodplain, using diversity indices. Epiphytic rotifers were collected from January 2012 to June 2012. This study registered 12 genera and 33 rotifer species. Shannon-Weaver diversity index (H) showed high species diversity of epiphytic rotifers of floodplain. These results were supported by Simpson index of dominance, Simpson Index of diversity and Simpson reciprocal index. The species evenness was 0.9889 which indicated their even distribution. Species richness was 2.9139 that showed larger food chains. Key words: Floodplain, Epiphytic rotifers, floodplain, Physico-chemical parameters,
Diversity indices
INTRODUCTION
Biodiversity is the diversity of organisms present at all stages. These
organisms vary both in genetics and ecosystem, and consist of communities and populations having a variety of families, genera and species living in specific habitats and physical environments (Wilson, 1992).The floodplains show richest diversity and density of rotifers as well as other zooplanktons that may be due to high stability, minimum current velocity, and the widespread macrophytes in littoral zone of these water bodies, in contrast to, those of the rivers (Serafim et al., 2003).
Floodplains are known for the prevalence of periodic turbulence, due to change in water level. They demonstrate variety of habitats having particular organisms enjoying these environments, and exhibiting great biodiversity (Aoyagui & Bonecker, 2004). The understanding of the biodiversity is very important to combat the pollution. Rotifers are really an imperative charming group of micro-invertebrates living in the shallow and open waters (Wallace & Snell, 2010). Certain rotifer species are thought to have an important character in energy shifting from producers to consumers, and indicating the quality and eutrofication levels of the water (Ustaoğlu et al., 2004, Sulehria et al., 2013). Some rotifers are highly specialized but most rotifers are opportunistic organisms, show rapid rate of consumption and assimilation of various types of foods, possibly inhabit even in erratic conditions and exhibit high population dynamics (Allan, 1976, Bozelli, 2000; Neves et al., 2003, Wallace et al., 2006). The impact of physico-chemical parameters of water on the seasonal appearance of planktonic rotifers has been documented from certain areas of Pakistan (Mahar et al., 2000; Malik & Sulehria, 2003, 2004; Baloch, et al., 2008;
34 A. Q. K. SULEHRIA ET AL BIOLOGIA (PAKISTAN)
Sulehria et al., 2009a, 2009b, Sulehria & Malik, 2012). The present study was carried out to explore the physico-chemical characteristics of water, rotifer diversity, richness and evenness; and the influence of limnological factors on the rotifer population. The aim of the present study was to investigate:
Diversity indices of epiphytic rotifers to quantify them.
Relationship of rotifer density and diversity with various physico-chemical parameters.
MATERIALS AND METHODS
The study was conducted in Dhan No. 3, a floodplain of The River Ravi,
near Balloki Head works showing latitude of 31.22 (31o 13’ 10 N) and a longitude
of 73.86 (73o 51’ 35 E). Balloki Head Works is about 65 km (42 miles) away from
Lahore in South West direction near Phool Nagar on Multan road. Water samples and epiphytic rotifers were collected monthly from 5 different selected sites of the floodplain from January to June 2012. Water samples were used to determine the concentration of Physico-chemical parameters at the spot using various meters.
Macrophytes, along with sample water, were collected in order to get the epiphytic rotifers. Soft bristle brush was used to remove epiphytic rotifers from live macrophytes. Epiphytic rotifers were squeezed through a plankton net having mesh size of 30 µm. The rotifers were fixed with Lugol’s solution in 100 mL bottles and then a few drops of 4% formalin were put into bottles. (Koste, 1978; Ejsmont-Karabin, & Hutorowicz, 2011; Sulehria, et al., 2012).
Rotifers were identified by studying their behavior and appearance (Ward & Whipple, 1959; Pennak, 1978; Segers, 1995, 2007). Rotifers were analyzed quantitatively at 60-100 x magnification with Sedgewick-Rafter chamber or cell. The rotifers were classified up to species level. Photographs of specimens were taken with the help of LAICA HC 50/50 microscope having 5.0 megapixel Cannon camera fitted on it.
Two diversity indices i.e., Shannon –Weaver (H) and Simpson were chosen to enumerate the biodiversity of this floodplain. These indices are concerned with the number of species present, as well as relative abundance of each species. Species richness (SR), the number of species recorded from a region, and species evenness or equitability (E) were also calculated (Sulehria et al., 2009b).
Shannon Weaver Index (H) was worked out by following equation:
H = - Pi(lnPi) (Shannon & Weaver, 1949) Here Pi shows the proportion of each species in the sample. Pi = ni/N
(Omori & Ikeda, 1984), whereas ni indicates the number of individuals of a specific species and N denotes the total number of individuals of all the species in the sample. Simpson’s Index of Dominance (D) was reckoned by using Simpson equation (Simpson, 1949):
D = Σ n (n-1) / N (N-1)
VOL. 59 (1) DIVERSITY INDICES OF EPIPHYTIC ROTIFERS 35
Here D denotes Simpson’s Index of Dominance; N denotes Total No. of individuals of all species; n denotes No. of individuals of particular species per samples; and Σ = sum Simpson’s Index of Diversity (SID) and Simpson’s Reciprocal Index (SRI) were also evaluated by equations SID=1-D and SRI=1/D respectively. Species richness (SR), the number of species found in a region, was computed by Margalef’s formula (Margalef, 1951):
SR =(S – 1)/logn N, where S = total number of species and N = total number of individuals present in the sample. Species evenness or equitability (E) was determined by Pielou’s equation (Pielou, 1966):
E = H / Logn S, where S is total number of species and H is the Shannon-Weaver diversity index.
Pearson’s correlation test was performed to evaluate the relationships between the rotifer species with various observed physical-chemical parameters of water that may be regulating their population. Analysis of variance (ANOVA) was applied to the data of rotifers obtained in various months from different sampling sites in order to find the differences. Pearson’s correlation and ANOVA were performed using the software the Minitab 13 for windows. Graphs were plotted with the help of MS Excel 2010 for Windows.
RESULTS AND DISCUSSION
In the present study 33 rotifer species belonging to 12 genera and 9
families were identified from the month of January to June (Table 1). The highest population density of rotifers 66.2 ± 4.22/L was observed during the month of June while the lowest mean number of rotifers 37.0 ± 1.81/L was found during the month of January (Fig., 1).
The most prominent genera in the present work were Lecane, Lepadella Cephalodella, having relative (%) representation of species 38.70%, 28.44%, and 5.64% respectively. Genus Lecane and Cephalodella had already been described in different studies in Pakistan (Mahar et al., 2000, Malik & Sulehria, 2003, Sulehria et al., 2009a). In the present study, the most diverse and prominent genus is Lecane which has 13 species: These include Lecane aculeata (Jakubski), L. bulla (Gosse), L. curvicornis (Murray), L. furcata (Murray), L. inermis (Bryce), L. inopinata (Harring & Myers), L. ludwigii (Eckstein), L. luna (Müller), L. lunaris (Ehrb), L. pyriformis (Daday), L. quadridentata (Ehrb), L. signifera (Jennings), L. ungulata (Gosse).
Second most prominent genus is Lepadella which have 9 species: Lepadella acuminata (Ehrb), L. biloba Hauer, L. eurysterna Myers, L. heterostyla (Murray), L. ovalis (Müller), L. patella (Müller), L. quinquecostata (Lucks), L. quadricarinata (Stenroos), L. triba Myers.
ANOVA (F=12.08, df=5, p=0.000) indicated that there was statistically significant difference in the density of rotifers from January to June 2012. However, no significant difference was observed regarding sampling sites (F=0.80, df=4, p=0.540).

36 A. Q. K. SULEHRIA ET AL BIOLOGIA (PAKISTAN)
Table 1: List of epiphytic rotifer species collected from floodplain (R = Roots, L = Leaves).
Family Genus Species
Brachionidae Brachionus Keratella Plationus
Brachionus falcatus Zacharias: L Keratella cochlearis (Gosse): R, L Plationus patulus Müller : R
Euchlanidae Euchlanis Euchlanis dilatata Ehrb : R, L
Flosculariidae Beauchampia Floscularia
Beauchampia crucigera Dutrochet : R, L Floscularia ringens Linnaeus : R
Lecanidae Lecane
Lecane aculeata (Jakubski): R L. bulla (Gosse): R, L L. curvicornis (Murray): R, L L. furcata (Murray): R, L L. inermis (Bryce): R, L L. inopinata (Harring & Myers): R L. ludwigii (Eckstein): R, L L. luna (Müller): R, L L. lunaris (Ehrb): R, L L. pyriformis (Daday): R, L L. quadridentata (Ehrb): R, L L. signifera (Jennings): R, L L. ungulata (Gosse): R, L
Lepadellidae Lepadella
Lepadella acuminata (Ehrb): R, L L. biloba Hauer : R, L L. eurysterna Myers : R, L L. heterostyla (Murray): R, L L. ovalis (Müller): R, L L. patella (Müller): R, L L. quinquecostata (Lucks): R, L L. quadricarinata (Stenroos):R, L L. triba Myers: R, L
Notommatidae Cephalodella Cephalodella gibba (Ehrb): R, L C. obtusa (Gosse): R, L
Testudinellidae Testudinella Testudinella patina (Hermann): R, L
Trichocercidae Trichocerca Trichocerca porcellus (Gosse): L
Trichotriidae Trichotria Trichotria tetractis (Ehrb): R, L
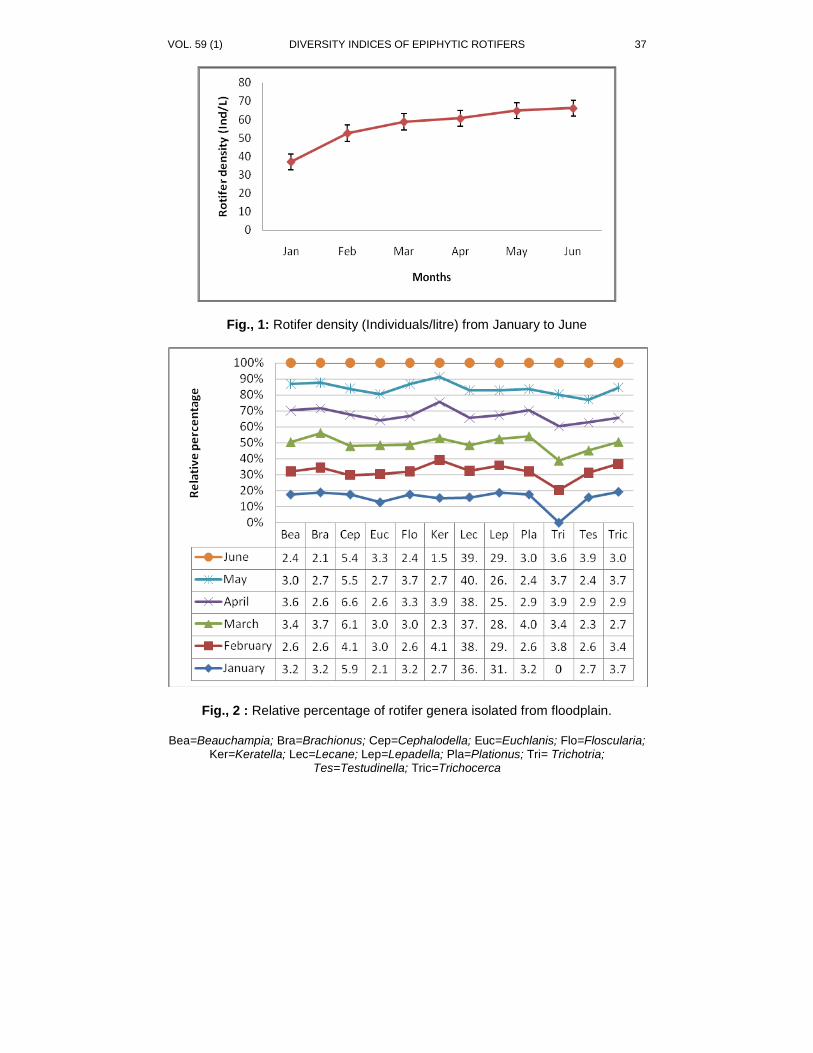
VOL. 59 (1) DIVERSITY INDICES OF EPIPHYTIC ROTIFERS 37
Fig., 1: Rotifer density (Individuals/litre) from January to June
Fig., 2 : Relative percentage of rotifer genera isolated from floodplain.
Bea=Beauchampia; Bra=Brachionus; Cep=Cephalodella; Euc=Euchlanis; Flo=Floscularia; Ker=Keratella; Lec=Lecane; Lep=Lepadella; Pla=Plationus; Tri= Trichotria;
Tes=Testudinella; Tric=Trichocerca
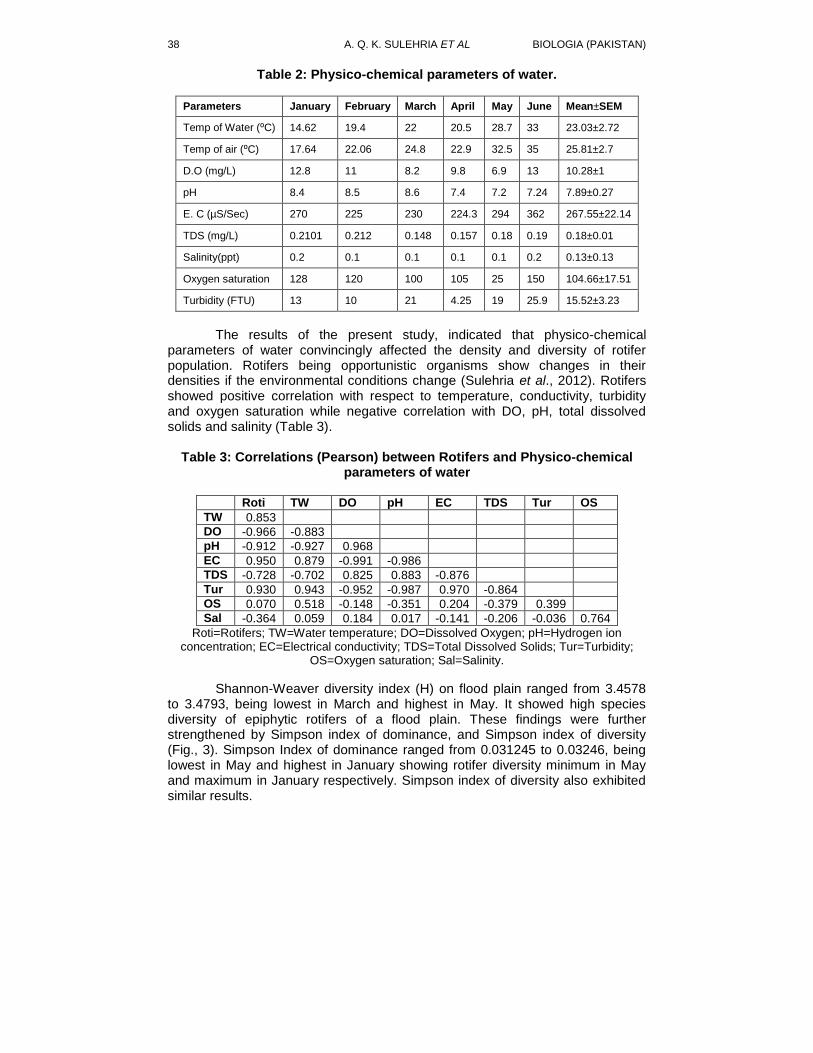
38 A. Q. K. SULEHRIA ET AL BIOLOGIA (PAKISTAN)
Table 2: Physico-chemical parameters of water.
Parameters January February March April May June Mean±SEM
Temp of Water (⁰C) 14.62 19.4 22 20.5 28.7 33 23.03±2.72
Temp of air (⁰C) 17.64 22.06 24.8 22.9 32.5 35 25.81±2.7
D.O (mg/L) 12.8 11 8.2 9.8 6.9 13 10.28±1
pH 8.4 8.5 8.6 7.4 7.2 7.24 7.89±0.27
E. C (µS/Sec) 270 225 230 224.3 294 362 267.55±22.14
TDS (mg/L) 0.2101 0.212 0.148 0.157 0.18 0.19 0.18±0.01
Salinity(ppt) 0.2 0.1 0.1 0.1 0.1 0.2 0.13±0.13
Oxygen saturation 128 120 100 105 25 150 104.66±17.51
Turbidity (FTU) 13 10 21 4.25 19 25.9 15.52±3.23
The results of the present study, indicated that physico-chemical
parameters of water convincingly affected the density and diversity of rotifer population. Rotifers being opportunistic organisms show changes in their densities if the environmental conditions change (Sulehria et al., 2012). Rotifers showed positive correlation with respect to temperature, conductivity, turbidity and oxygen saturation while negative correlation with DO, pH, total dissolved solids and salinity (Table 3).
Table 3: Correlations (Pearson) between Rotifers and Physico-chemical
parameters of water
Roti TW DO pH EC TDS Tur OS
TW 0.853
DO -0.966 -0.883
pH -0.912 -0.927 0.968
EC 0.950 0.879 -0.991 -0.986
TDS -0.728 -0.702 0.825 0.883 -0.876
Tur 0.930 0.943 -0.952 -0.987 0.970 -0.864
OS 0.070 0.518 -0.148 -0.351 0.204 -0.379 0.399
Sal -0.364 0.059 0.184 0.017 -0.141 -0.206 -0.036 0.764
Roti=Rotifers; TW=Water temperature; DO=Dissolved Oxygen; pH=Hydrogen ion concentration; EC=Electrical conductivity; TDS=Total Dissolved Solids; Tur=Turbidity;
OS=Oxygen saturation; Sal=Salinity.
Shannon-Weaver diversity index (H) on flood plain ranged from 3.4578 to 3.4793, being lowest in March and highest in May. It showed high species diversity of epiphytic rotifers of a flood plain. These findings were further strengthened by Simpson index of dominance, and Simpson index of diversity (Fig., 3). Simpson Index of dominance ranged from 0.031245 to 0.03246, being lowest in May and highest in January showing rotifer diversity minimum in May and maximum in January respectively. Simpson index of diversity also exhibited similar results.
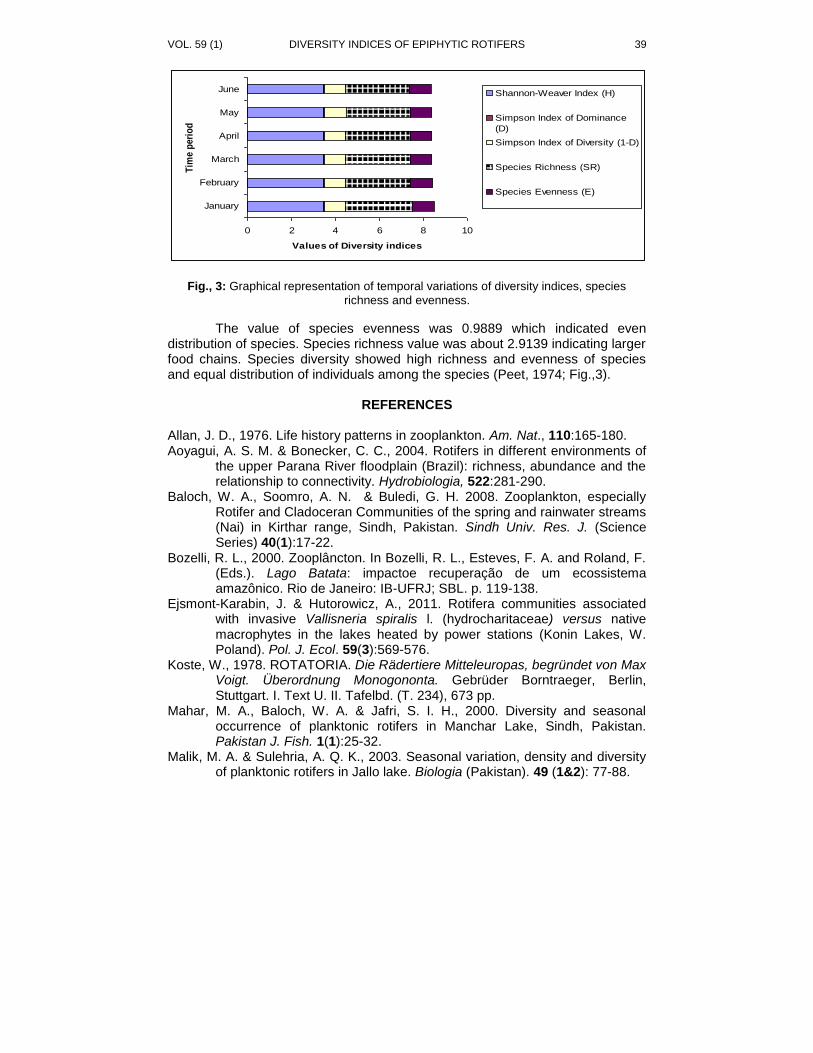
VOL. 59 (1) DIVERSITY INDICES OF EPIPHYTIC ROTIFERS 39
0 2 4 6 8 10
January
February
March
April
May
June
Tim
e p
erio
d
Values of Diversity indices
Shannon-Weaver Index (H)
Simpson Index of Dominance
(D)
Simpson Index of Diversity (1-D)
Species Richness (SR)
Species Evenness (E)
Fig., 3: Graphical representation of temporal variations of diversity indices, species
richness and evenness.
The value of species evenness was 0.9889 which indicated even distribution of species. Species richness value was about 2.9139 indicating larger food chains. Species diversity showed high richness and evenness of species and equal distribution of individuals among the species (Peet, 1974; Fig.,3).
REFERENCES
Allan, J. D., 1976. Life history patterns in zooplankton. Am. Nat., 110:165-180. Aoyagui, A. S. M. & Bonecker, C. C., 2004. Rotifers in different environments of
the upper Parana River floodplain (Brazil): richness, abundance and the relationship to connectivity. Hydrobiologia, 522:281-290.
Baloch, W. A., Soomro, A. N. & Buledi, G. H. 2008. Zooplankton, especially Rotifer and Cladoceran Communities of the spring and rainwater streams (Nai) in Kirthar range, Sindh, Pakistan. Sindh Univ. Res. J. (Science Series) 40(1):17-22.
Bozelli, R. L., 2000. Zooplâncton. In Bozelli, R. L., Esteves, F. A. and Roland, F. (Eds.). Lago Batata: impactoe recuperação de um ecossistema amazônico. Rio de Janeiro: IB-UFRJ; SBL. p. 119-138.
Ejsmont-Karabin, J. & Hutorowicz, A., 2011. Rotifera communities associated with invasive Vallisneria spiralis l. (hydrocharitaceae) versus native macrophytes in the lakes heated by power stations (Konin Lakes, W. Poland). Pol. J. Ecol. 59(3):569-576.
Koste, W., 1978. ROTATORIA. Die Rädertiere Mitteleuropas, begründet von Max Voigt. Überordnung Monogononta. Gebrüder Borntraeger, Berlin, Stuttgart. I. Text U. II. Tafelbd. (T. 234), 673 pp.
Mahar, M. A., Baloch, W. A. & Jafri, S. I. H., 2000. Diversity and seasonal occurrence of planktonic rotifers in Manchar Lake, Sindh, Pakistan. Pakistan J. Fish. 1(1):25-32.
Malik, M. A. & Sulehria, A. Q. K., 2003. Seasonal variation, density and diversity of planktonic rotifers in Jallo lake. Biologia (Pakistan). 49 (1&2): 77-88.
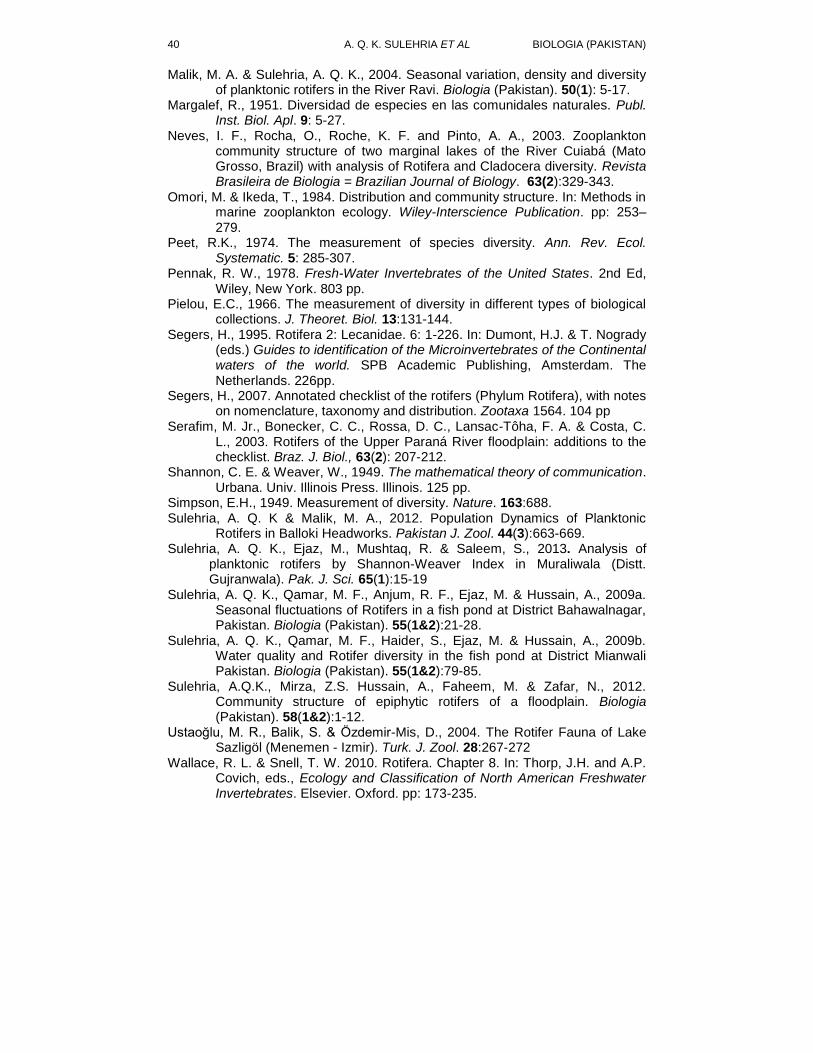
40 A. Q. K. SULEHRIA ET AL BIOLOGIA (PAKISTAN)
Malik, M. A. & Sulehria, A. Q. K., 2004. Seasonal variation, density and diversity of planktonic rotifers in the River Ravi. Biologia (Pakistan). 50(1): 5-17.
Margalef, R., 1951. Diversidad de especies en las comunidales naturales. Publ. Inst. Biol. Apl. 9: 5-27.
Neves, I. F., Rocha, O., Roche, K. F. and Pinto, A. A., 2003. Zooplankton community structure of two marginal lakes of the River Cuiabá (Mato Grosso, Brazil) with analysis of Rotifera and Cladocera diversity. Revista Brasileira de Biologia = Brazilian Journal of Biology. 63(2):329-343.
Omori, M. & Ikeda, T., 1984. Distribution and community structure. In: Methods in marine zooplankton ecology. Wiley-Interscience Publication. pp: 253–279.
Peet, R.K., 1974. The measurement of species diversity. Ann. Rev. Ecol. Systematic. 5: 285-307.
Pennak, R. W., 1978. Fresh-Water Invertebrates of the United States. 2nd Ed, Wiley, New York. 803 pp.
Pielou, E.C., 1966. The measurement of diversity in different types of biological collections. J. Theoret. Biol. 13:131-144.
Segers, H., 1995. Rotifera 2: Lecanidae. 6: 1-226. In: Dumont, H.J. & T. Nogrady (eds.) Guides to identification of the Microinvertebrates of the Continental waters of the world. SPB Academic Publishing, Amsterdam. The Netherlands. 226pp.
Segers, H., 2007. Annotated checklist of the rotifers (Phylum Rotifera), with notes on nomenclature, taxonomy and distribution. Zootaxa 1564. 104 pp
Serafim, M. Jr., Bonecker, C. C., Rossa, D. C., Lansac-Tôha, F. A. & Costa, C. L., 2003. Rotifers of the Upper Paraná River floodplain: additions to the checklist. Braz. J. Biol., 63(2): 207-212.
Shannon, C. E. & Weaver, W., 1949. The mathematical theory of communication. Urbana. Univ. Illinois Press. Illinois. 125 pp.
Simpson, E.H., 1949. Measurement of diversity. Nature. 163:688. Sulehria, A. Q. K & Malik, M. A., 2012. Population Dynamics of Planktonic
Rotifers in Balloki Headworks. Pakistan J. Zool. 44(3):663-669. Sulehria, A. Q. K., Ejaz, M., Mushtaq, R. & Saleem, S., 2013. Analysis of
planktonic rotifers by Shannon-Weaver Index in Muraliwala (Distt. Gujranwala). Pak. J. Sci. 65(1):15-19
Sulehria, A. Q. K., Qamar, M. F., Anjum, R. F., Ejaz, M. & Hussain, A., 2009a. Seasonal fluctuations of Rotifers in a fish pond at District Bahawalnagar, Pakistan. Biologia (Pakistan). 55(1&2):21-28.
Sulehria, A. Q. K., Qamar, M. F., Haider, S., Ejaz, M. & Hussain, A., 2009b. Water quality and Rotifer diversity in the fish pond at District Mianwali Pakistan. Biologia (Pakistan). 55(1&2):79-85.
Sulehria, A.Q.K., Mirza, Z.S. Hussain, A., Faheem, M. & Zafar, N., 2012. Community structure of epiphytic rotifers of a floodplain. Biologia (Pakistan). 58(1&2):1-12.
Ustaoğlu, M. R., Balik, S. & Özdemir-Mis, D., 2004. The Rotifer Fauna of Lake Sazligöl (Menemen - Izmir). Turk. J. Zool. 28:267-272
Wallace, R. L. & Snell, T. W. 2010. Rotifera. Chapter 8. In: Thorp, J.H. and A.P. Covich, eds., Ecology and Classification of North American Freshwater Invertebrates. Elsevier. Oxford. pp: 173-235.

VOL. 59 (1) DIVERSITY INDICES OF EPIPHYTIC ROTIFERS 41
Wallace, R. L., Snell, T. W., Ricci, C., and Nogrady, T. 2006. Rotifera: Volume 1 Biology, Ecology and Systematics (2
nd ed.). Guides to the Identification
of the Microinvertebrates of the Continental Waters of the World 23 (Segers, H., ed.). Kenobi Productions, Ghent and Backhuys Publishers, Leiden.
Ward, H. B. & Whipple, G. C. 1959. W. T. Fresh Water Biology. 2nd
Ed. John Wiley and Sons. New York. 1248 pp.
Wilson, E. O., 1992. The diversity of life. Allen Lane. The Penguin Press, London, 434 pp.
BIOLOGIA (PAKISTAN) 2013, 59 (1), 43-50 PK ISSN 0006 - 3096
*Corresponding author:[email protected]
Health imperilments in workers of a cutlery industrial
complex from Pakistan: A preliminary survey
*ALI HUSSAIN1, JAVED IQBAL QAZI
2, SHAHID ALI
3,
HAFIZ ABDULLAH SHAKIR4 & NADEEM ULLAH
5.
1,2,4
Microbial Biotechnology Laboratory, Department of Zoology,
University of the Punjab, Lahore-54590, Pakistan. 3,5
Dendrochronology Laboratory, Department of Botany, Government
College University, Lahore-54000. Pakistan.
ABSTRACT
Industrial health is a burning issue of developing countries where safety measures are practiced, if at all, at very low profile. Such a situation has been affecting health of workers employed in whetting and cleansing units of cutlery industries localized in different clusters at Wazirabad, a city of Pakistan. This paper reports a questionnaire based data of 270 workers for the first time in this regard. Cough was the major threat found in a highly significant proportion of workers (81%) of both working units. Overall ratio of cough patients dominated in whetting units (96%) over cleansing units (65%), whereas, productive cough was more prevalent among workers of both working units than dry cough. Symptoms of pulmonary tissue damage were more frequent (9%) in workers of whetting units who were found discharging blood in sputum. Other common disorders among workers of whetting units included dizziness (40%), headache (26%), backache (48%), occupational fatigue (47%), eye irritation (31%), vision difficulty (19%), skin allergy (20%) and persistent itch (28%). The corresponding figures for these ailments appeared as 27%, 19%, 43%, 51%, 28%, 19%, 22% and 21%, respectively in workers of cleansing units. Health problems in this industry possibly resulted from experiencing multi-metallic dust exposures. This alarming situation needs attention of public health welfare authorities. Key words: Cleansing unit, Cutlery industry, Metallic dust, Occupational exposure,
Whetting unit, Work stress.
INTRODUCTION
Billions of people are employed in different industries throughout the
world and are directly related to the production. Injured and sick workers are not only a source of morbidity to themselves and their families but also affect the economy as a whole (Malik & Cheema, 2010). Despite considerable improvements in work place environment in developed countries, significant amount of money is spent on costs associated with work injuries and illnesses (Spiegal & Yassi, 1991). It is estimated that 2.2 million people die every year due to fatal injuries and illnesses caused by occupational hazards (ILO, 2005).
Most of the occupational diseases arise among workers as a result of exposures to airborne agents either in the form of particulates or dusts (Churg, 1988; Ohar, et al., 2004). Inhaled particulates are either deposited in the respiratory system or entered the circulatory system. Adverse health effects of
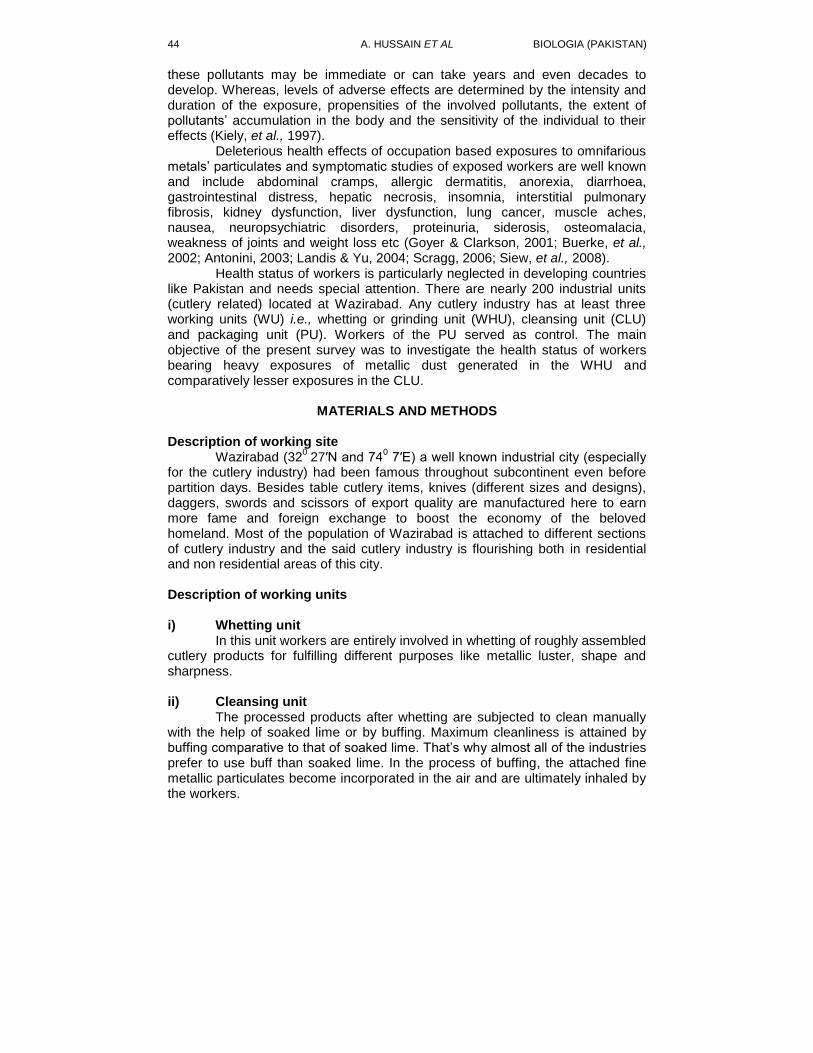
44 A. HUSSAIN ET AL BIOLOGIA (PAKISTAN)
these pollutants may be immediate or can take years and even decades to develop. Whereas, levels of adverse effects are determined by the intensity and duration of the exposure, propensities of the involved pollutants, the extent of pollutants’ accumulation in the body and the sensitivity of the individual to their effects (Kiely, et al., 1997).
Deleterious health effects of occupation based exposures to omnifarious metals’ particulates and symptomatic studies of exposed workers are well known and include abdominal cramps, allergic dermatitis, anorexia, diarrhoea, gastrointestinal distress, hepatic necrosis, insomnia, interstitial pulmonary fibrosis, kidney dysfunction, liver dysfunction, lung cancer, muscle aches, nausea, neuropsychiatric disorders, proteinuria, siderosis, osteomalacia, weakness of joints and weight loss etc (Goyer & Clarkson, 2001; Buerke, et al., 2002; Antonini, 2003; Landis & Yu, 2004; Scragg, 2006; Siew, et al., 2008).
Health status of workers is particularly neglected in developing countries like Pakistan and needs special attention. There are nearly 200 industrial units (cutlery related) located at Wazirabad. Any cutlery industry has at least three working units (WU) i.e., whetting or grinding unit (WHU), cleansing unit (CLU) and packaging unit (PU). Workers of the PU served as control. The main objective of the present survey was to investigate the health status of workers bearing heavy exposures of metallic dust generated in the WHU and comparatively lesser exposures in the CLU.
MATERIALS AND METHODS
Description of working site
Wazirabad (320
27′N and 740 7′E) a well known industrial city (especially
for the cutlery industry) had been famous throughout subcontinent even before partition days. Besides table cutlery items, knives (different sizes and designs), daggers, swords and scissors of export quality are manufactured here to earn more fame and foreign exchange to boost the economy of the beloved homeland. Most of the population of Wazirabad is attached to different sections of cutlery industry and the said cutlery industry is flourishing both in residential and non residential areas of this city.
Description of working units i) Whetting unit
In this unit workers are entirely involved in whetting of roughly assembled cutlery products for fulfilling different purposes like metallic luster, shape and sharpness.
ii) Cleansing unit
The processed products after whetting are subjected to clean manually with the help of soaked lime or by buffing. Maximum cleanliness is attained by buffing comparative to that of soaked lime. That’s why almost all of the industries prefer to use buff than soaked lime. In the process of buffing, the attached fine metallic particulates become incorporated in the air and are ultimately inhaled by the workers.
VOL. 59 (1) HEALTH IMPERILMENTS IN WORKERS OF CUTLERY 45
iii) Packaging unit The cleaned and finally furnished products from CLU are brought in PU
where these are packed into different sized packings.
Working condition Workers attached to different branches of the cutlery industry have to
work at least 8 hours a day in any WU. It was noticed during the survey that there were no proper arrangements for the metal-dust waste exhaust in both WU and the workers didn’t wear masks and use no protective glasses to save their chests and eyes, respectively.
Nature of metallic dust
Different alloys (mostly stainless steel and brass) which themselves are compounds of different metals are used to manufacture different parts of the said products. For example, stainless steel of cutlery purposes is the compound product of chromium, iron and nickel. Similarly, brass is a product of copper, lead, iron and zinc mixed in different proportions. Use of aluminium is also noticed in these industries. Thus as a whole dust exposure to Al, Cr, Cu, Fe, Ni, Pb and Zn is just possible.
Plan of work and methodology
A preliminary survey of 31 cutlery industries in which 270 workers were employed was carried out to define the plan of work. A questionnaire was designed to document thorough occupational history and symptoms associated with exposures to metallic dust of all monitored workers. Health assessment of workers was made by categorizing data on the basis of health hazards with respect to duration of jobs. For comparison, data of 90 individuals relevant to prescribed age groups from PU of cutlery industry were obtained and used as control as there was no any dust exposure in this WU. The collected data were tabulated and analyzed statistically to assess the occupational hazards present in these units and ultimately affecting the health of workers.
RESULTS AND DISCUSSION
Purpose of the present survey was to investigate the health status of
workers employed in WHU and CLU of cutlery industries. Risk of various suspected and prevailing infections was assessed by categorizing data with respect to age of workers as well as longevity of exposure. In general, signs of workers of both WU were not too bad but the symptomatic pictures of these were amazingly the worst. Comparative analysis of disorders among workers of both WU is shown in the Fig., 1.
Both types of cough i.e., dry (non-productive) and productive were the major threats found in all age groups of workers and the latter became a key threat for above 40 years old workers of cutlery industries. The overall ratio of cough patients was significantly higher reaching up to 96% in WHU than that of CLU, where it was 65%. It was found that productive cough was more common among the workers of both WU than dry cough. Almost 65% of the workers of WHU were suffering from productive cough as shown in the Table 1, whereas the
46 A. HUSSAIN ET AL BIOLOGIA (PAKISTAN)
corresponding figure was 45 for the workers of CLU (Table 2). The percentage of workers suffering from dry cough was much lesser and was noted 31% for WHU and 20% in case of CLU. Prevalence of cough in occupationally exposed workers to metallic dust and fumes has also been reported previously (Jindal, et al., 2001).
0
10
20
30
40
50
60
70
Diz
zine
ss
Hea
dach
es
Bac
kach
es
Occ
upat
iona
l fat
igue
Per
sist
ent d
ry c
ough
Per
sist
ent p
rodu
ctiv
e co
ugh
Blo
od in
spu
tum
Eye
irrit
atio
n
Vis
ion
diffi
culty
Ski
n al
lerg
y
Per
sist
ent i
tch
Disorders
Ove
rall
per
cen
tag
e o
f d
iso
rder
s Control Cleansing unit Whetting unit
Fig., 1: Comparative analysis of disorders among workers of both WU.
Presence of blood in the sputum of workers is an indication towards bronchial / pulmonary tissue damage. The ratio of this symptom was higher in workers of WHU and observed only in the age of above 40 years and the overall value reached up to 9% in this age group. It was noticed that almost all of the workers of WHU lying in age between 40 and 50 years have been linked to the profession since they started to earn around the age of 20 years. So, it can be deduced that long term exposures of these workers to metallic dust might be the cause of such pulmonary disorders. Comparable studies have also been reported by different researchers (Moulin, et al., 2000; Ahn, et al., 2006; Hoshuyama, et al., 2006).
Symptoms of dizziness and headache were also more frequent among workers of WHU where their ratios reached up to 40% and 26%, respectively. While in CLU the corresponding figures were 27 and 19, respectively. Monat-Descamps & Deschamps (2012) have reviewed nervous system disorders including dizziness and headaches induced by occupational and environmental toxic exposures. Of these exposures metals were considered to be the key causative agents of such troubles. According to Pruss-ustun, et al. (2004) long-term exposure to copper can result in dizziness, headaches and vomiting. Occupational exposures to metals including Al, Cr, Cu, Fe, Ni, Pb and Zn and their detrimental health effects have also been reported by other researchers
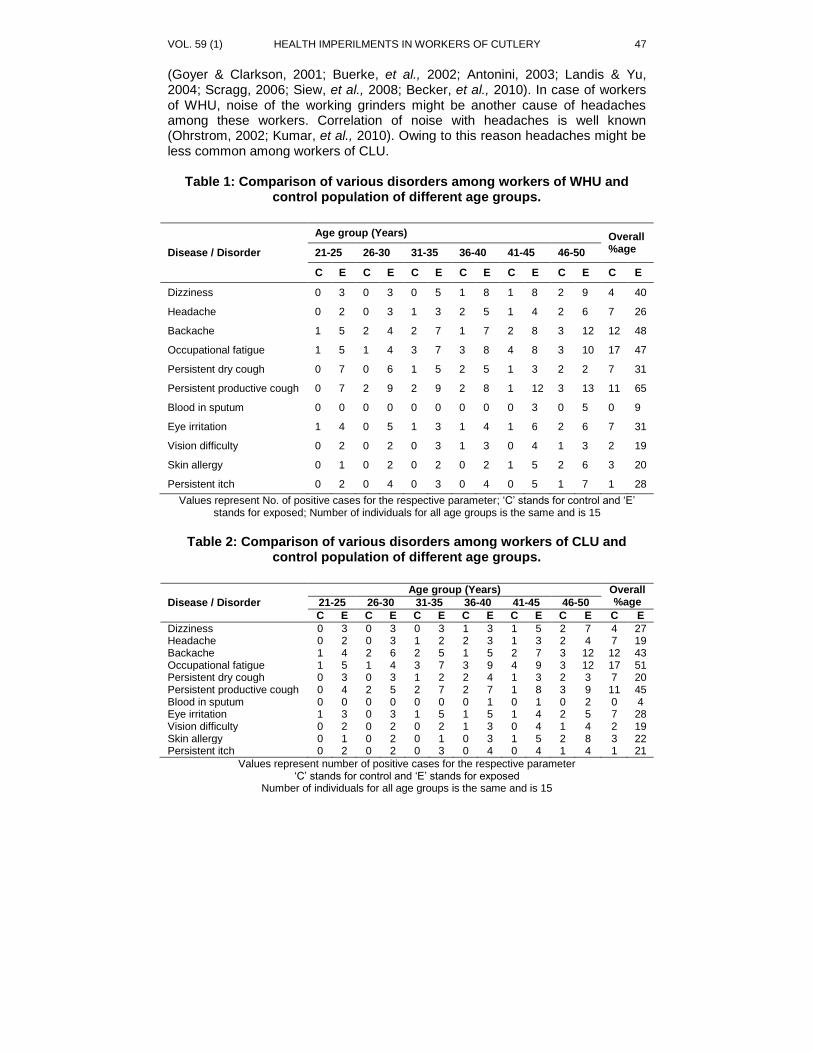
VOL. 59 (1) HEALTH IMPERILMENTS IN WORKERS OF CUTLERY 47
(Goyer & Clarkson, 2001; Buerke, et al., 2002; Antonini, 2003; Landis & Yu, 2004; Scragg, 2006; Siew, et al., 2008; Becker, et al., 2010). In case of workers of WHU, noise of the working grinders might be another cause of headaches among these workers. Correlation of noise with headaches is well known (Ohrstrom, 2002; Kumar, et al., 2010). Owing to this reason headaches might be less common among workers of CLU.
Table 1: Comparison of various disorders among workers of WHU and
control population of different age groups.
Disease / Disorder
Age group (Years) Overall %age 21-25 26-30 31-35 36-40 41-45 46-50
C E C E C E C E C E C E C E
Dizziness 0 3 0 3 0 5 1 8 1 8 2 9 4 40
Headache 0 2 0 3 1 3 2 5 1 4 2 6 7 26
Backache 1 5 2 4 2 7 1 7 2 8 3 12 12 48
Occupational fatigue 1 5 1 4 3 7 3 8 4 8 3 10 17 47
Persistent dry cough 0 7 0 6 1 5 2 5 1 3 2 2 7 31
Persistent productive cough 0 7 2 9 2 9 2 8 1 12 3 13 11 65
Blood in sputum 0 0 0 0 0 0 0 0 0 3 0 5 0 9
Eye irritation 1 4 0 5 1 3 1 4 1 6 2 6 7 31
Vision difficulty 0 2 0 2 0 3 1 3 0 4 1 3 2 19
Skin allergy 0 1 0 2 0 2 0 2 1 5 2 6 3 20
Persistent itch 0 2 0 4 0 3 0 4 0 5 1 7 1 28
Values represent No. of positive cases for the respective parameter; ‘C’ stands for control and ‘E’ stands for exposed; Number of individuals for all age groups is the same and is 15
Table 2: Comparison of various disorders among workers of CLU and
control population of different age groups.
Disease / Disorder
Age group (Years) Overall %age 21-25 26-30 31-35 36-40 41-45 46-50
C E C E C E C E C E C E C E
Dizziness 0 3 0 3 0 3 1 3 1 5 2 7 4 27 Headache 0 2 0 3 1 2 2 3 1 3 2 4 7 19 Backache 1 4 2 6 2 5 1 5 2 7 3 12 12 43 Occupational fatigue 1 5 1 4 3 7 3 9 4 9 3 12 17 51 Persistent dry cough 0 3 0 3 1 2 2 4 1 3 2 3 7 20 Persistent productive cough 0 4 2 5 2 7 2 7 1 8 3 9 11 45 Blood in sputum 0 0 0 0 0 0 0 1 0 1 0 2 0 4 Eye irritation 1 3 0 3 1 5 1 5 1 4 2 5 7 28 Vision difficulty 0 2 0 2 0 2 1 3 0 4 1 4 2 19 Skin allergy 0 1 0 2 0 1 0 3 1 5 2 8 3 22 Persistent itch 0 2 0 2 0 3 0 4 0 4 1 4 1 21
Values represent number of positive cases for the respective parameter ‘C’ stands for control and ‘E’ stands for exposed
Number of individuals for all age groups is the same and is 15
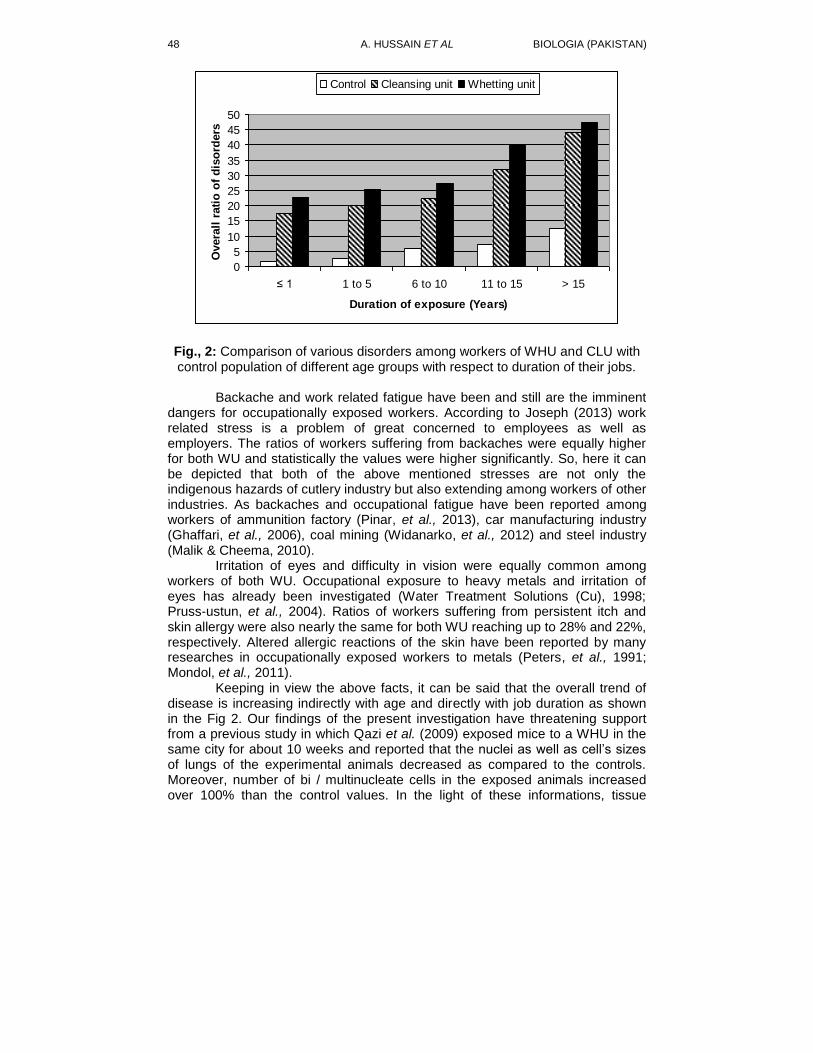
48 A. HUSSAIN ET AL BIOLOGIA (PAKISTAN)
0
5
10
15
20
25
30
35
40
45
50
≤ 1 1 to 5 6 to 10 11 to 15 > 15
Duration of exposure (Years)
Overa
ll r
ati
o o
f d
iso
rders
Control Cleansing unit Whetting unit
Fig., 2: Comparison of various disorders among workers of WHU and CLU with control population of different age groups with respect to duration of their jobs.
Backache and work related fatigue have been and still are the imminent
dangers for occupationally exposed workers. According to Joseph (2013) work related stress is a problem of great concerned to employees as well as employers. The ratios of workers suffering from backaches were equally higher for both WU and statistically the values were higher significantly. So, here it can be depicted that both of the above mentioned stresses are not only the indigenous hazards of cutlery industry but also extending among workers of other industries. As backaches and occupational fatigue have been reported among workers of ammunition factory (Pinar, et al., 2013), car manufacturing industry (Ghaffari, et al., 2006), coal mining (Widanarko, et al., 2012) and steel industry (Malik & Cheema, 2010).
Irritation of eyes and difficulty in vision were equally common among workers of both WU. Occupational exposure to heavy metals and irritation of eyes has already been investigated (Water Treatment Solutions (Cu), 1998; Pruss-ustun, et al., 2004). Ratios of workers suffering from persistent itch and skin allergy were also nearly the same for both WU reaching up to 28% and 22%, respectively. Altered allergic reactions of the skin have been reported by many researches in occupationally exposed workers to metals (Peters, et al., 1991; Mondol, et al., 2011).
Keeping in view the above facts, it can be said that the overall trend of disease is increasing indirectly with age and directly with job duration as shown in the Fig 2. Our findings of the present investigation have threatening support from a previous study in which Qazi et al. (2009) exposed mice to a WHU in the same city for about 10 weeks and reported that the nuclei as well as cell’s sizes of lungs of the experimental animals decreased as compared to the controls. Moreover, number of bi / multinucleate cells in the exposed animals increased over 100% than the control values. In the light of these informations, tissue
VOL. 59 (1) HEALTH IMPERILMENTS IN WORKERS OF CUTLERY 49
health of chronically exposed workers thus needs to be assessed. On the other hand, purpose of industrialists should not only minting money but they must have to spend significant proportions of their earnings towards the work safety and workers’ welfare. In addition, workers’ welfare societies / authorities should have a proper check and balance of the industries for keeping the workers and working condition safe.
REFERENCES
Ahn, Y.S., Park, R.M., Stayner, L., Kang, S.K. & Jang, J.K., 2006. Cancer morbidity in iron and steel workers in Korea. Am. J. Ind. Med., 49(8): 647-57.
Antonini, J.M., 2003. Health effects of welding. Crit. Rev. Toxicol., 33(1): 61-103. Becker, M., Edwards, S. & Massey, R.I., 2010. Toxic chemicals in toys and
children’s products: limitations of current responses and recommendations for government and industry. Environ. Sci. Technol., 44: 7986-7991.
Buerke, U., Schneider, J., Rosler, J. & Woitowitz, H.J., 2002. Interstitial pulmonary fibrosis after severe exposure to welding fumes. Am. J. Ind. Med., 41(4): 259-68.
Churg, A., 1988. Non-neoplastic diseases caused by asbestos. In: Pathology of occupational lung disease (eds. Churg, A. & Green, F.), New York, USA, pp. 213-277.
Ghaffari, M., Alipour, A., Jensen, I., Farshad, A.A. & Vingard, E., 2006. Low back pain among Iranian industrial workers. Occupational Medicine., 56: 455-460.
Goyer, R.A. & Clarkson, T.W., 2001. Toxic effects of metals. In: Casarett and Doull’s toxicology: The basic science of poisons (ed. Klaassen, C.D.), McGraw-Hill, New York, pp. 811-867.
Hoshuyama, T., Pan, G., Tanaka, C., Feng, Y., Yu, L., Liu, T., Hanaoka, T. & Takahashi, K., 2006. Mortality of iron-steel workers in Anshan, China: a retrospective cohort study. Int. J. Occup. Environ. Health., 12(3): 193-202.
ILO, International Labour in Organization., 2005. Proceedings of the Economic Evaluation of Occupational Health and Safety Interventions at the Company Level Conference. Geneva, Switzerland.
Jindal, S.K., Aggarwal, A.N. & Gupta, D., 2001. Dust-induced interstitial lung disease in the tropics. Curr. Opin. Pulm. Med., 7(5): 272-277.
Joseph, T.D., 2013. Work related stress. European Journal of Business and Social Sciences., 1(10): 73-80.
Kiely, P., Yap, D., Brou, G.B., Fraser, D. & Dong, W., 1997. A comparative study of Toronto.s air quality and selected world cities. The 90th Air and Waste Management Association, Toronto, Ontario. http://www.ene.gov.on.ca.
Kumar, A., Mathew, K., Alexander, S.A. & Kiran, C., 2010. Output sound pressure levels of personal music systems and their effect on hearing. Noise Health., 11(44): 132-140.
Landis, W.G. & Yu, M-H., 2004. Introduction to environmental toxicology. Lewis publishers. USA.
50 A. HUSSAIN ET AL BIOLOGIA (PAKISTAN)
Malik, H.J. & Cheema, K.J., 2010. Preliminary survey to assess the health status of iron and steel industry workers. Pakistan Journal of Science., 62(1): 22-29.
Monat-Descamps, C. & Deschamps, F., 2012. Nervous system disorders induced by occupational and environmental toxic exposure. Open Journal of Preventive Medicine., 2(3): 272-278. doi:10.4236/ojpm.2012.23039
Mondol, M.N., Chamon, A.S., Faiz, B. & Elahi, S.F., 2011. Seasonal variation of heavy metal concentrations in Water and plant samples around Tejgaon industrial Area of Bangladesh. J. Bangladesh Acad. Sci., 35: 19-41.
Moulin, J.J., Clavel, T., Roy, D., Dananche, B., Marquis, N., Fevotte, J. & Fontana, J.M., 2000. Risk of lung cancer in workers producing stainless steel and metallic alloys. Int. Arch. Occup. Environ. Health., 73(3): 171-80.
Ohar, J., Sterling, D., Bleecker, E. & Donohue, J., 2004. Changing patterns in asbestos-induced lung disease. Chest., 125: 744-753.
Ohrstrom, E., 2002. Sleep studies before and after results and comparison of different methods. Noise health., 15(4): 65-67.
Peters, k., Gammelgaard, B. & Menne, T., 1991. Nickel concentrations in fingernails as a measure of occupational exposure to nickel. Contact Dermatitis., 25: 237-241.
Pinar, T., Cakmak, Z.A., Saygun, M., Akdur, R., Ulu, N., Keles, I. & Saylam, H.S., 2013. Symptoms of Musculoskeletal Disorders Among Ammunition Factory Workers in Turkey. Archives of Environmental & Occupational Health., 68(1): 13-21.
Pruss-Ustun, A., Fewtrell, L., Landrigan, P.J. & Ayuso-Mateos, J.L., 2004. Lead Exposure. In: Comparative Quantification of Health Risks: Global and Regional Burden of Disease Attributable to Selected Major Risk Factors (eds. Ezzati, M., Lopez, A.D., Rodgers, A. & Murray., C.J.L.), World Health Organization, Geneva, pp. 1495-1552.
Qazi, J.I., Nasreen, Z. & Nazir, S., 2009. Effects of inhalation of iron emission particles on some lung cellular parameters in mice. Pakistan J. Zool., 41(2): 149-153.
Scragg, A., 2006. Environmental Biotechnology. Oxford University Press. Oxford. Siew, S.S., Kauppinen, T., Kyyrönen, P., Heikkilä, P. & Pukkala, E., 2008.
Exposure to iron and welding fumes and the risk of lung cancer. Scand. J. Work Environ. Health., 34(6): 444-450.
Spiegal, J. & Yassi, A., 1991. Occupational disease surveillance in Canada: a framework for considering options and opportunities. Can. J. Public Health., 82: 294-299.
Water Treatment Solutions (Cu)., 1998. http://www.lenntech.com/periodic/elements/cu.htm.
Widanarko, B., Legg, S., Stevenson, M. & Devereux, J., 2012. Interaction between physical, psychosocial, and organisational work factors for low back symptoms and its consequences amongst In-donesian coal mining workers. Work., 41: 6112-6119. doi: 10.3233/WOR-2012-1070-6112.
BIOLOGIA (PAKISTAN) 2013, 59 (1), 51-55 PK ISSN 0006 - 3096
*Corresponding author: [email protected]
Antimicrobial screening of Iris aitchisonii (Bakar) Boiss.
*MUHAMMAD AJAIB
1, ZAHEER-UD-DIN KHAN
2,
MUHAMMAD ATHAR ABBASI3 & TAUHEEDA RIAZ
4
1,2Department of Botany, GC University, Lahore, Pakistan
3,4Department of Chemistry, GC University, Lahore, Pakistan
ABTRACT
The present study was an attempt to verify the ethnobotanical knowledge of Iris
aitchisonii (Bakar) Boiss., a local plant, on scientific lines by evaluating the antimicrobial activity including Minimum Inhibitory Concentration (MIC) of its crude extracts. The plant material after its collection from District Kotli Azad Jammu & Kashmir was subjected to maceration for obtaining its crude extracts in petroleum ether, chloroform, methanol and water. The results indicated highest antibacterial and antifungal potential, i.e. 45±1.73mm and 57±1.0mm against Pseudomonas aeruginosa and Aspergillus niger respectively. MIC value of the methanolic extract against Staphylococcus aureus and Pseudomonas aeruginosa was 0.002μg/mL.
Key words: Iris aitchisonii (Bakar) Boiss., antibacterial and antifungal activity, MIC
INTRODUCTION
Plants play an important role in our lives more than animals generally due to their extraordinary array of diverse class of biochemicals with a variety of biological compounds (Buckingham, 1999).
Despite of modernizations in human and veterinary medicines, bacteria and fungi are still causing infectious diseases in humans as well as in animals. In developing countries their impact is predominantly very huge, because of the shortage of medicines and drugs. Bacteria have the ability to transmit from cell to cell and gain resistance to drugs that are used against them as remedial agents. With the emergence of new bacterial strains with multi-resistance ability, steps must be taken to decrease the effect of these bacteria by understanding the genetic mechanism and introduction of new drugs either synthetic or natural. The plants having phytochemicals such as polyphenols with identified antimicrobial activity against microorganism are of great importance in remedial treatments. Bacterial growth is also inhibited by other oxidized polyphenols (Field and Lettinga, 1992). Naturally occurring polyphenols present in the plants are Hydroxycoumarins, flavanols, flavones, anthocyanins, tannins, aurones, etc. and are significantly effective towards pathogenic bacteria (Scalbert, 1991; Cowan, 1999).
A great variety of plants are used as antimicrobial agents because of the secondary metabolites present in them. In developing countries about 40% people lead to death by infectious microorganisms. These microorganisms are
Fig., 1: Iris aitchisonii
52 M. AJAIB ET AL BIOLOGIA (PAKISTAN)
also responsible for the spoilage of food (Marino et al., 2001). The food products and human health can be protected by antimicrobial compounds produced by the plants (Mitscher et al., 1987). Iris aitchisonii (Bakar) Boiss., belonging to the family Iridaceae used locally to cure various diseases. It is a herb, about 35 cm long and commonly found in grassy fields of Brooth village near Khuiratta and flowering during March-April. Locally this plant is called as Sanp Buti (Snake Buti) and is used as anticancerous, diuretic, cathartic and antidote in snakebite (Ajaib, 2012). In Pakistan and Azad Jammu & Kashmir the medicinal plants have immense potential but, unfortunately, little is known about the actual production, size and potential of various species, their conservation status, trade and production areas.
MATERIAL AND METHODS Collection and preparation of samples: The plant Iris aitchisonii was
obtained from Khui-Ratta, District Kotli, Azad Jammu & Kashmir (Fig. 1). The plant specimen, preserved mounted on sheet properly was deposited in Dr. Sultan Ahmad Herbarium Department of Botany, GC University Lahore after pasting voucher number, GC.Bot.Herb.0701.Two Gram +ve bacteria, i.e. Streptococcus faecalis and Staphylococcus aureus and two Gram –ve, i.e. Escherichia coli and Pseudomonas aeruginosa, were obtained from PCSIR Laboratories Lahore while two pathogenic fungi, i.e. Aspergillus niger and A. oryzae were obtained from Institute of Biotechnology, GC University, Lahore used as test organisms. About 250gm powdered plant material was extracted successively with polar and non-polar solvents, like petroleum ether, chloroform, methanol and water by maceration for 8 days in each of the solvents.
Antibacterial and antifungal activity: All the crude extracts were studied for their antibacterial and antifungal activity which was carried out by well diffusion method according to Ortega and Julian (1996) and Ferreira et al. (1996). Two series of experiments were carried out in the present study. In the first, crude extracts were tested for their antibacterial activity against bacteria and fungi, while in second series of experiments, commercially available antibiotic discs, such as Erythromycin (15µg) and Amikacin (30µg) were used to compare their antimicrobial activity with that of crude extracts. All the experiments were performed triplicate and in aseptic conditions. MIC of methanolic extract was carried out according to Murray et al. (1999) by modified Broth dilution assay with the help of Spectrophotometer at absorbance of 595nm in mg/ml.
RESULTS AND DISCUSSION
The results for antibacterial and antifungal activities of various extracts of
the plant (Table 1) showed that the highest zone of inhibition was developed by aqueous extract, i.e. 45±1.73 mm against Pseudomonas aeruginosa. It also showed good activity against Streptococcus faecalis (35±1.03 mm), Staphylococcus aureus (40±0.53 mm) and E. coli (32±1.33 mm). Methanol extract showed good activity against Staphylococcus aureus (37±0.73 mm) and E. coli (40±1.0 mm). Aqueous extract showed highest antifungal activity with
VOL. 59 (1) ANTIMICROBIAL SCREENING OF IRIS AITCHISONII 53
zone of inhibition 57±1.0 mm against Aspergillus niger. Aqueous extract also showed good activity against Aspergillus oryzae i.e. 45±1.3 mm. All the other results were found moderate or non-significant. The results thus obtained were compared with zone of inhibition developed by standard antibiotic discs (Table 2). The MIC results revealed that the methanolic extract were comparatively more resistant to S. aureus and P. aeruginosa, i.e. 0.002 μg/ml.
DISCUSSION
In the present study, the antimicrobial activity was found higher in almost
all the extracts especially methnolic and aqueous extracts against Gram-negative and Gram-positive bacteria. This might be due to the presence of different alkaloids or other polar antimicrobial compounds in these extracts. It was observed that antimicrobial activity of most of the plant extracts was higher than standard discs (Table 1), a finding which is much similar to Ajaib et al. (2013).
Table-1: Zone of inhibition produced by various extracts of Iris aitchisonii
(Bakar) Boiss. against bacteria and fungi.
Bacteria
Zone of inhibition (mm)
Petroleum ether extract
Chloroform extract
Methanol extract
Aqueous extract
i) Gram-Positive Bacteria
Streptococcus faecelis
11±1.03 8±1.67 10±1.0 35±1.03
Staphylococcus aureus
14±0.71 21±0.31 37±0.73 40±0.53
ii) Gram-Negative Bacteria ii) Gram-Negative Bacteria
Escherichia coli 12±0.44 5±1.34 40±1.0 32±1.33
Pseudomonas aeruginosa
20±1.09 20±1.1 22±1.73 45±1.73
Fungi
Aspergillus niger
10±0.63 37±1.0 35±1.09
57±1.0
Aspergillus oryzae
10±1.0 0±1.55 27±1.11
45±1.3
The petroleum ether and chloroform extracts showed poor results
against bacteria and fungi, except chloroform extract against A. niger, which might be due to the presence specific antifungal compound in chloroform extract and absence of antibacterial and other antifungal compounds in petroleum ether extracts. Mackeen et al., (2000) and Ajaib et al., (2011) while studying the antimicrobial and antioxidant activities of Garcinia atroviridis and Sauromatum venosum also reported that the bacterial strains were more sensitive than fungal strains.
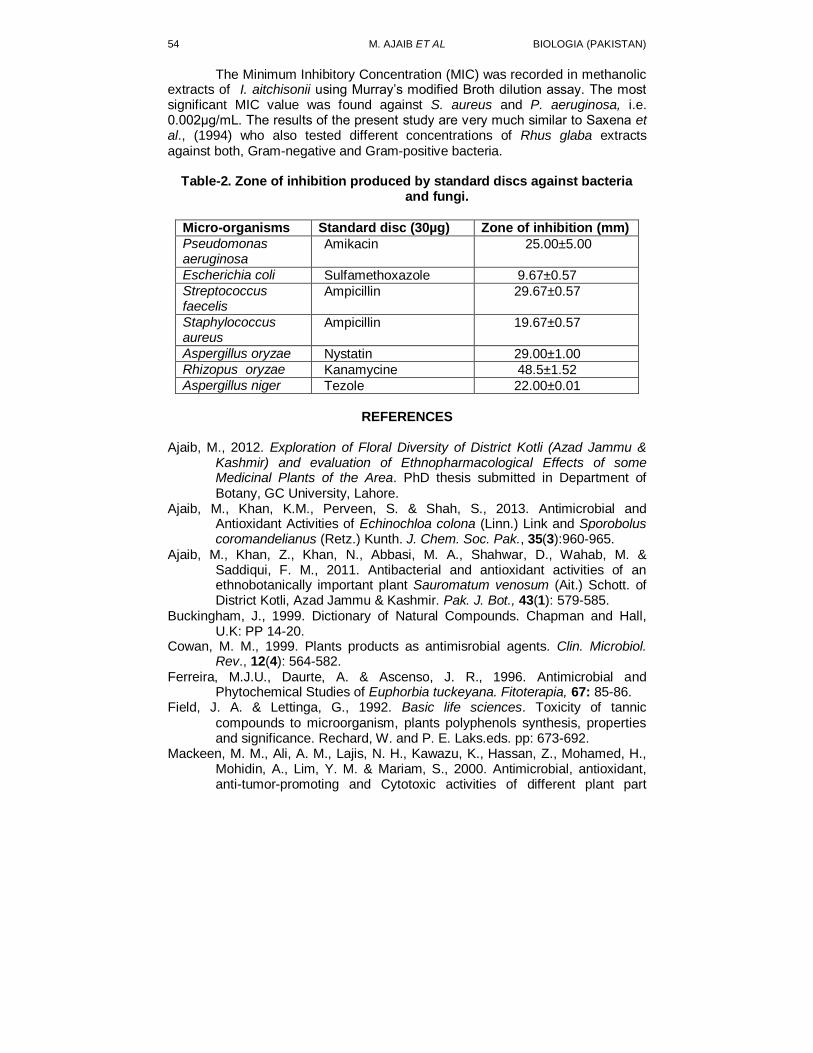
54 M. AJAIB ET AL BIOLOGIA (PAKISTAN)
The Minimum Inhibitory Concentration (MIC) was recorded in methanolic extracts of I. aitchisonii using Murray’s modified Broth dilution assay. The most significant MIC value was found against S. aureus and P. aeruginosa, i.e. 0.002μg/mL. The results of the present study are very much similar to Saxena et al., (1994) who also tested different concentrations of Rhus glaba extracts against both, Gram-negative and Gram-positive bacteria.
Table-2. Zone of inhibition produced by standard discs against bacteria
and fungi.
Micro-organisms Standard disc (30µg) Zone of inhibition (mm)
Pseudomonas aeruginosa
Amikacin 25.00±5.00
Escherichia coli Sulfamethoxazole 9.67±0.57 Streptococcus faecelis
Ampicillin 29.67±0.57
Staphylococcus aureus
Ampicillin 19.67±0.57
Aspergillus oryzae Nystatin 29.00±1.00 Rhizopus oryzae Kanamycine 48.5±1.52 Aspergillus niger Tezole 22.00±0.01
REFERENCES
Ajaib, M., 2012. Exploration of Floral Diversity of District Kotli (Azad Jammu &
Kashmir) and evaluation of Ethnopharmacological Effects of some Medicinal Plants of the Area. PhD thesis submitted in Department of Botany, GC University, Lahore.
Ajaib, M., Khan, K.M., Perveen, S. & Shah, S., 2013. Antimicrobial and Antioxidant Activities of Echinochloa colona (Linn.) Link and Sporobolus coromandelianus (Retz.) Kunth. J. Chem. Soc. Pak., 35(3):960-965.
Ajaib, M., Khan, Z., Khan, N., Abbasi, M. A., Shahwar, D., Wahab, M. & Saddiqui, F. M., 2011. Antibacterial and antioxidant activities of an ethnobotanically important plant Sauromatum venosum (Ait.) Schott. of District Kotli, Azad Jammu & Kashmir. Pak. J. Bot., 43(1): 579-585.
Buckingham, J., 1999. Dictionary of Natural Compounds. Chapman and Hall, U.K: PP 14-20.
Cowan, M. M., 1999. Plants products as antimisrobial agents. Clin. Microbiol. Rev., 12(4): 564-582.
Ferreira, M.J.U., Daurte, A. & Ascenso, J. R., 1996. Antimicrobial and Phytochemical Studies of Euphorbia tuckeyana. Fitoterapia, 67: 85-86.
Field, J. A. & Lettinga, G., 1992. Basic life sciences. Toxicity of tannic compounds to microorganism, plants polyphenols synthesis, properties and significance. Rechard, W. and P. E. Laks.eds. pp: 673-692.
Mackeen, M. M., Ali, A. M., Lajis, N. H., Kawazu, K., Hassan, Z., Mohamed, H., Mohidin, A., Lim, Y. M. & Mariam, S., 2000. Antimicrobial, antioxidant, anti-tumor-promoting and Cytotoxic activities of different plant part
VOL. 59 (1) ANTIMICROBIAL SCREENING OF IRIS AITCHISONII 55
extracts of Garcinia atroviridis Griff ex T. Anders. J. Ethnopharmacol., 72: 395-402.
Mitscher, L. A., Drake, S., Gollipudi, S. R. & Okwute, S. K., 1987. A modern look at folkloric use of anti infective agents. J. Nat. Prod., 50(6): 1025-1040.
Murray, P.R., E. J. Baron, M. A. Pfaller, F. C. Tenevor & R. H. Yolke. 1999. Manual of Clinical Microbiology. 7
th ed. Washington, pp: 1527-1539.
Ortega, M.G. & Julian, H.R., 1996. Antimicrobial Agents in Dalea elegant. Fitoterapia, 67(1): 81.
Saxena, G., McCutcheon, A.R., Farmer, S., Towers, G.H.N. & Hancock, R.E.W., 1994. Antimicrobial constituents of Rhus glabra. J. Ethnopharmacol., 42: 95–99.
Scalbert, A., 1991. Antimicrobial activities of tannins. J. Phytochem., 30(12): 3875-3883.
BIOLOGIA (PAKISTAN) 2013, 59 (1), 57-68 PK ISSN 0006 - 3096
*Corresponding author: [email protected]
Prevalence of Coccidiosis in Peacock at Lahore-
Pakistan
*MUHAMMAD FIAZ QAMAR1, HUMAIRA SHAHID
1 AFTAB AHMAD
ANJUM2, MUHAMMAD ASAD ALI
2 AND UMAR FAROOQ
3
1 Department of Zoology, GC University, Lahore 2 University of Veterinary & Animal Sciences, Lahorer
3University College of Veterinary & Animal Sciences, The Islamia University of
Bahawalpur, Pakistan
ABSTRACT
The aim of the study was to evaluate the prevalence of coccidiosis in peacocks
(Pavo cristatus). Freshly egested fecal samples of adult peacocks (n=30) belonging to different locations in Lahore (Jallo park, Safari park, Bahria town park, Lahore Zoo, University of Veterinary and Animal Sciences, Lahore and Household peacocks) were collected from January to June 2012. The average prevalence of the disease was reported to be 22% from January to June and was found to be more prevalent during the month of June (30%). Male samples showed higher prevalence of coccidiosis (28.57%) than female samples (20%). The disease was found more prevalent (26%) in peacocks of University of Veterinary and Animal Sciences, Lahore and Household peacocks. The differences were attributed to the managerial and environmental conditions. Key Words: Prevalence, Coccidiosis, Peacock, Pakistan.
INTRODUCTION
The peacock originated in India and was later introduced in Europe in VII-VIII century B.C, through Greece and Italy. It is also designated as a national bird of India and the provincial bird of Punjab. They are wild birds but are also raised as ornamental birds Titilincu et al., (2009). Only three species of peacocks are recognized namely, Pavo cristatus (Indian Peafowl); Pavo muticus (Green Peafowl) and Afropavo congensis (Congo Peafowl). The Congo peafowl is the only species that is distributed outside Asia Jackson, (2006). All peacocks have splendid plumage with attractive displays, small heads, long necked strong spurred legs (unusually, the females also have spurs). The most impressive characteristic of the blue and green peacock is their ability to raise their train feathers into a huge arc, 1.8-2.1 meters wide and walk around with this display, rattling and shimmering the feathers. It is an attractive display for human viewers, although the behavior of peahen is somewhat different. She behaves as if she has seen this display many times before. The peahen carefully selects the more splendid and mature male Jackson, (2006).
A peacock has weight of about 10 pounds. The male can be 6-8 feet long, including 4-6 feet of colorful feathers Berman, (1996). In south Asia, it is found mainly below an altitude of 1800m and in rare cases seen at about 2000m, Dodsworth, (1912). Peafowl prefers to live in hot places. However they can live in frosty cold weather too. Peafowl prefers to live in open areas like parks and
58 M. F. QAMAR ET AL BIOLOGIA (PAKISTAN)
grassy land with few trees and shrubs. Some even live in people’s backyards Berman, (1996). Peafowl are polygamous. A polygamous family of a peafowl is made up of one adult male and four to 6 peahens. In a family, the group of peahens is called a harem. The peafowl roost high in the trees Berman, (1996). The breeding season of the peafowl is spread out but it appears to be dependent upon the rains Petrie, (1999). In Southern India, the peak season of breeding is April to May, January to March in Sri Lanka and June in Northern India. The nest is made in the ground which is a shallow scarpe lined with leaves, sticks and debris Vyas, (1994). The clutch comprises of 4-8 fawn to buff white eggs which are incubated only by the female. The eggs hatch after about 28 days. The chicks after hatching follow the mother Whistler et al., (1949). An unusual instance of male incubating the eggs has been reported Ali et al., (1980); Shivrajkumar, (1957).
The blue or Indian peacock is recognized and accepted as the most glamorous bird around the world however it is much less known that green peacock is even more splendid. Its hardiness, beauty and adaptability has made it an inhabitant of our gardens and barnyards. It is a bird having distinctive characters. It is thought that peacock is a masculine bird, proud, showing off, flamboyant and aggressive Jackson, (2006). Peafowl are omnivorous and feed on insects, seeds, fruits, small mammals and reptiles. They feed on small snakes and stay away from the larger ones Johnsingh, (1976). In the Gir forest of Gujarat, the food of peafowl largely consists of fallen berries of Zizyphus Trivedi, (1995). Around cultivated areas, they also feed on wide range of crops tomato, groundnut, paddy, chilly and even bananas Johnsingh & Murali, (1978). Around human habitation, they feed upon different food scraps and even human excreta Ali et al., (1980). In captivity, peafowl can live for about 23 years but it is estimated that they live only for about 15 years in the wild Flower, (1938). Adult peafowl usually escape ground predators by flying into the trees. In some regions such as Gir forest, peafowl are common prey for large predators like leopards, tigers and dholes Parasharya, (1999). The peafowl are provided with more safety when they forage in groups as there are more eyes to look for predators Yasmin et al., (2000). Sometimes large birds such as Crested Hawk-Eagle and Rock Eagle-owl also hunt them Dhanwatey et al., (1986); Tehsin et al., (1990). Chicks are more susceptible to predation than adult peafowl. The adults are sometimes hunted by the humans and domestic dogs in some human nearby areas. In some areas like Southern Tamil Nadu the “peacock oil” is used for folk remedies Johnsingh & Murali, (1978). In South Asia, particularly India has the highest diversity of Indian peacock species El-shahawy, (2010). Indian peacocks (Pavo cristatus), predominantly the males are distinctively large colorful birds. These are among the most marvelous birds of the entire poultry world El-shahawy, (2010). Domesticated peacocks and other fancy birds develop a variety of infections due to unnatural habitat and suboptimal management conditions Athar et al., (2001). Regrettably, like other captive birds, they are also suffering from potential stress and frequent cases of parasitic infections, which are among the most prevailing diseases that affect them El-shahawy, (2010). The major stress factor that can lead to lowered performance and malnutrition is intestinal parasitism Badran & Lukesova, (2006). Parasitic infections are among the most common sanitary
VOL. 59 (1) COCCIDIOSIS IN PEACOCK 59
problems affecting wild birds and become either a sub clinical condition or even a cause of death, they have attention only when they have threatened agriculture or human health. Among parasitic diseases caused by protozoa, coccidiosis, is common and causes the most rigorous health and economic problems throughout the world El-Shahawy, (2010). Coccidiosis is considered to be a commonest depreciator or even a potential cause of death of poultry Jadhav et al., (2012). It is a disease which develop within the intestine of most domesticated and wild animals and birds Badran & Lukesova, (2006). The coccidia comprise of a large variety of unicellular parasitic organisms in the subkingdom protozoa of the phylum Apicomplexa Conway & McKenzie, (2007). These parasites infect the intestinal tracts of animals and birds. These are obligatory parasites that are characterized by the presence of apical complex in the free stages of cycle (sporozoites and merozoites) which invade the epithelial cells. Eimeria have direct life cycle (only one host), they are very site specific with reference to the development (intestine) and to cell types (epithelial cells of the intestinal villi or cells of the crypts) Badran & Lukesova, (2006). The life cycle of coccidia involves sexual and asexual phases. Once they have been ingested by suitable host, isosporan oocyst form haploid sporozoites that enter the epithelium of the intestine and undergo asexual reproduction through a variable number of cycles. This asexual phase is the damaging portion of the life cycle to the host as the sporozoites feed on host tissue to grow and divide. Eventually gametes are formed that fuse to form zygote in the intestine. Zygotes produce a tough outer coating to become oocysts that can then pass out of the parent host, survive extreme environmental conditions and then repeat the cycle if they are ingested by another suitable host Hill, (2002). The symptoms of the disease include unthriftiness, loss of appetite, greenish or reddish diarrhea, huddling together, heads drawn in and ruffled feathers. In addition to weakness inability to stand and emaciation were also recorded at three out of twelve farms. The infected birds showed their comb and wattles pale and anaemic. Histological evidence revealed oedema, necrosis, leakage of blood, disruption and loss of villi. Severe unclotted blood may be observed in acute form Soomro et al., (2001). Coccidiosis is still the major disease problem of poultry in spite of advances that are made in control and prevention through chemotherapy, nutrition and management Gari et al., (2008). Seven species of Eimeria (E. mayurai from P. cristatus, E. mayurai from P. muticus, E. pavonina from P. cristatus, E. pavonina from P. muticus, E. Pavonis from P. cristatus, E. pavonis from P. muticus, I. pellerdyi from P. muticus) are identified as infecting peacocks AlYousif & Al-shawa, (1999). E. arabica from Pavo cristatus, E. mandali from Pavo cristatus, E. patnaiki from Pavo cristatus, E. riyadhae from Pavo cristatus, E. kharjensis n.sp. from Pavo muticus, E. mutica n.sp. from Pavo muticus are also reported AlYousif, et al., (1998). Although this disease is known for many years, it is still considered as the most economically important parasitic condition affecting poultry production throughout the world. These infections result in diarrhea, poor growth and eventually high mortality particularly in young birds El-Shahawy, (2010).
The prevalence of infection with the parasite is as follows: (E. pavonina 48.3%); (E. pavonis 16.7%); (I. mayurai 3.3%) Titilincu et al., (2009). The economic losses due to the disease are estimated to about US$ 450 million and
60 M. F. QAMAR ET AL BIOLOGIA (PAKISTAN)
due to medication are about US$100 milllion in the United States Allen and Fetterer, (2002); Lillehoj et al., (2001). The annual worldwide cost is anticipated to about $800 million and that for the American broiler industry about $450 million Badran & Lukesova, (2006). In countries like Pakistan where the farming is substandard, the disease becomes more serious and causes heavy economic losses; although the exact losses due to coccidiosis in Pakistan are not known due to the lack of statistical indices but these will be definitely in millions of rupees. Quantitative losses due to coccidiosis in Ethiopia are not well documented, but it has been reported that coccidiosis contributes to 8.4% loss in profit in large-scale farms and 11.86% loss in profit in small-scale farms Gari et al., (2008). The parasitic diseases in peacocks are less known in our country, but it is an accepted fact that the most diseases resemble the ones that are encountered in turkeys Titilincu et al., (2009). Eimeria are very effective parasites. One of the main reasons coccidiosis is still a major problem, is the difficult diagnosis. The classical parasitological methods of diagnosis are labor intensive and therefore costly. Oocyst per gram (OPG) counts in feces or litter have a poor relation to the impact of the parasite on the performance of a flock. Identification of different species is based on morphology of oocysts. There are basically two means of prevention of coccidiosis: chemoprophylaxis and vaccination. Chemoprophylaxis using so-called anticoccidial products (ACP) or anticoccidials in the ration is by far the most popular: It is estimated that 95% broilers produced receive anticoccidials Chapman, (2005). Generally two groups of anticoccidial drus are used namely 'ionophores' (ionophorous) and 'chemicals' (synthetically produced drugs). In 1948, sulphaquinoxaline was the first drug administered in the feed Chapman, (2003), McDougald, (2003). Other chemicals followed in the years after, allowing the poultry industry to expand and upscale production McDougald et al., (1987); Peek & Landman, (2003); Naciri et al., (2004).
The objective of the study was to investigate the prevalence of coccidiosis in relation to sex, month and different locations. The relationship was also investigated with different environmental and managemental conditions to the prevalence of disease.
MATERIALS AND METHODS
Study area and duration
Three hundred freshly egested fecal samples of peacocks were collected from January to June 2012. The samples were taken from the ground of their cages at Jallo Park, Safari Park, Bahria Town Park, Lahore Zoo, University of Veterinary and Animal Sciences and household peacocks.
Sample collection
Three hundred freshly egested fecal samples of both sexes of adult Pavo. cristatus (Common Peafowl) were collected from the ground of their cages at the Lahore Zoo, Jallo Park, University of Veterinary and Animal Sciences, Lahore, and household peafowl in clean polyethylene bags to prevent loss of moisture. The appearance of fecal samples for diarrhea or constipation was
VOL. 59 (1) COCCIDIOSIS IN PEACOCK 61
observed. The fecal samples were collected to prevent contamination by the feces of other animals, dust, stones and other material. The samples were preserved in cold icebox and stored at 4°C until the day of examination El-Shahawy, (2010). The samples collected were then taken to the coprological examination at University diagnostic laboratory, University of Veterinary and Animal Sciences, Lahore.
Coprological examination
The specimens were examined by both qualitative and quantitative fecal examination for the presence of oocysts of coccidia.
Qualitative fecal examination Qualitative fecal examination was done by both macroscopic and microscopic examination. Macroscopic examination
Macroscopic examination was done with naked eye. The fecal samples were observed for color, consistency, blood, mucous, odor and parasites Urquhart, (1996).
Microscopic examination
To identify the coccidial oocysts, direct smear method was used Urquhart, (1996).
Direct Smear method
A small amount of fresh fecal sample was placed on a clean microscopic glass slide and one or two drops of water were mixed with it thoroughly to form a homogenous mixture. The slide was tilted at an angle to allow the fluid to flow from the heavy debris. Placed a cover slip on the fluid making the smear and examined under low power of microscope. Fecal samples found negative for coccidia with direct smear method were examined either by direct floatation or centrifugal floatation method Soulsby, (1982).
Concentration methods
Direct Floatation Two grams of fresh feces were mixed well with 20 ml of saturated NaCl
solution. The homogenous suspension was strained with mesh and poured into the test tube upto the top. A cover glass was placed on the top of the test tube touching the meniscus of the mixture. It was allowed to stand for twenty minutes. The cover glass was then removed carefully from the test tube and placed on the glass slide and was examined under low power of microscope.
Centrifugal floatation Two grams of feces were mixed with 30-50 ml of water. The solution was
strained through a sieve (1mm mesh) to remove the coarse fecal material. The solution was sedimented for 10-15 minutes on the bench until the supernatant was clear. The sediment was then mixed with the saturated solution of sodium chloride in a centrifuge tube and centrifuged at 1500 revolutions per minute for
62 M. F. QAMAR ET AL BIOLOGIA (PAKISTAN)
one or two minutes. The floating oocysts were removed by touching with cover glass and transferred to clean glass slide and then examined microscopically.
Counting of oocysts The samples positive for coccidial infection were subjected to McMaster
Counting Technique for counting oocysts/grams of feces Kelly, (1974). McMaster Technique Two grams of feces were weighed and placed in a 120 ml wide mouthed
screw capped plastic bottle containing about four dozen small glass balls. 60 ml saturated sodium chloride solution was added in the bottle. After screwing the cap, the contents were shaken thoroughly for 2-3 minutes to break up the feces; the mixture was then sieved through a 100-mesh sieve into a small beaker and the debris discarded. The filtrate was agitated and with the help of Pasteur pipette a sufficient amount was withdrawn to fill one chamber of McMaster slide. The residues in the pipette were returned to the filtrate, re-agitated and again a sufficient amount of filtrate was withdrawn to fill the second chamber. After focusing a corner of the etched lines, the oocysts were counted by moving up and down the column of lines. The counting was revised for the second chamber. The total number of oocysts counted in two chambers was multiplied by 100 to get the number of oocysts per gram of feces (OPG):
O.P.G = N × 100 Where N = No. of oocysts counted in two chambers.
RESULTS AND DISCUSSION
Freshly egested fecal samples (n=300) were collected from peacocks
(Pavo cristatus) from January, 2012 to June, 2012, at Jallo Park, Safari park, Lahore Zoo, Bahria Town Park, University of Veterinary and Animal Sciences, Lahore and household peacocks. These fecal samples were examined concerning the presence of oocysts of Eimeria. Out of 300 fecal samples examined 66 were found positive for coccidia. The point prevalence of the disease can be found by the following formula:
22%
Freshly egested fecal samples (n=300) were examined from January to
June 2012. Out of which 66 samples were found positive for coccidiosis. The prevalence of the disease during this period was 22%. The average no. of oocysts in fecal samples is calculated to about 281.81/g.
Month-wise prevalence of the Coccidiosis Freshly egested fecal samples of peacocks (n=300) were examined from
January to June, 2012. During January 50 samples were collected, out of which
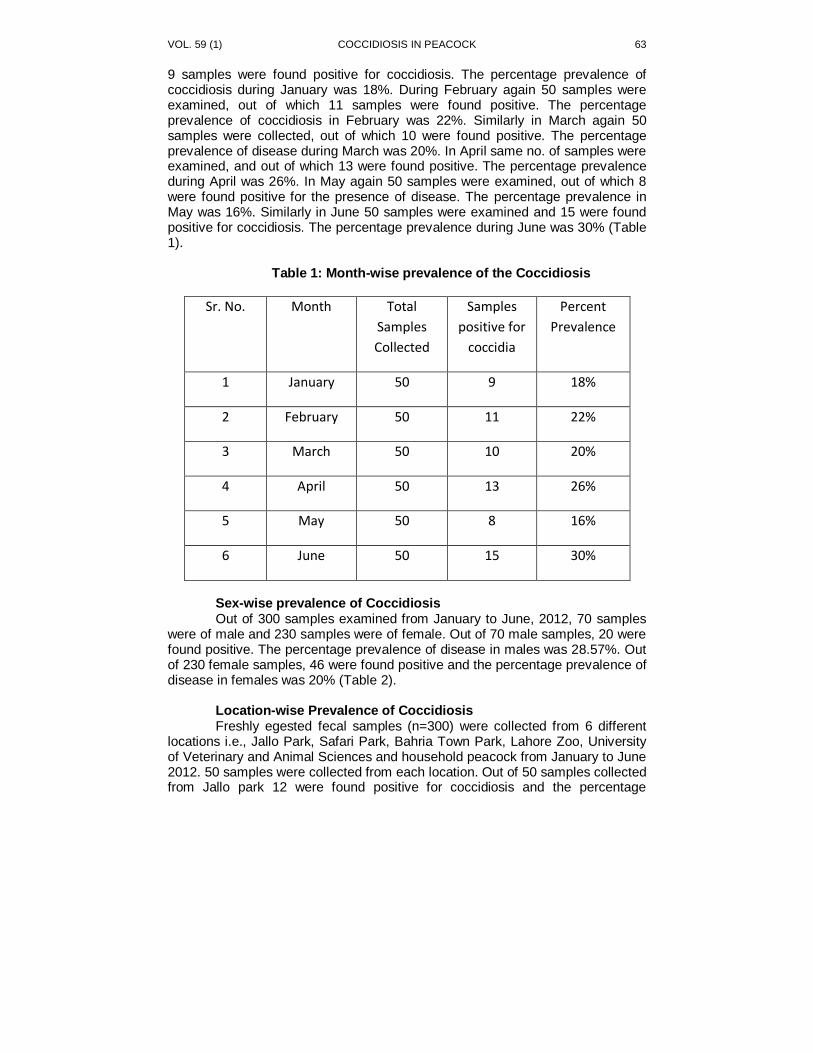
VOL. 59 (1) COCCIDIOSIS IN PEACOCK 63
9 samples were found positive for coccidiosis. The percentage prevalence of coccidiosis during January was 18%. During February again 50 samples were examined, out of which 11 samples were found positive. The percentage prevalence of coccidiosis in February was 22%. Similarly in March again 50 samples were collected, out of which 10 were found positive. The percentage prevalence of disease during March was 20%. In April same no. of samples were examined, and out of which 13 were found positive. The percentage prevalence during April was 26%. In May again 50 samples were examined, out of which 8 were found positive for the presence of disease. The percentage prevalence in May was 16%. Similarly in June 50 samples were examined and 15 were found positive for coccidiosis. The percentage prevalence during June was 30% (Table 1).
Table 1: Month-wise prevalence of the Coccidiosis
Sr. No. Month Total
Samples
Collected
Samples
positive for
coccidia
Percent
Prevalence
1 January 50 9 18%
2 February 50 11 22%
3 March 50 10 20%
4 April 50 13 26%
5 May 50 8 16%
6 June 50 15 30%
Sex-wise prevalence of Coccidiosis
Out of 300 samples examined from January to June, 2012, 70 samples were of male and 230 samples were of female. Out of 70 male samples, 20 were found positive. The percentage prevalence of disease in males was 28.57%. Out of 230 female samples, 46 were found positive and the percentage prevalence of disease in females was 20% (Table 2).
Location-wise Prevalence of Coccidiosis Freshly egested fecal samples (n=300) were collected from 6 different locations i.e., Jallo Park, Safari Park, Bahria Town Park, Lahore Zoo, University of Veterinary and Animal Sciences and household peacock from January to June 2012. 50 samples were collected from each location. Out of 50 samples collected from Jallo park 12 were found positive for coccidiosis and the percentage
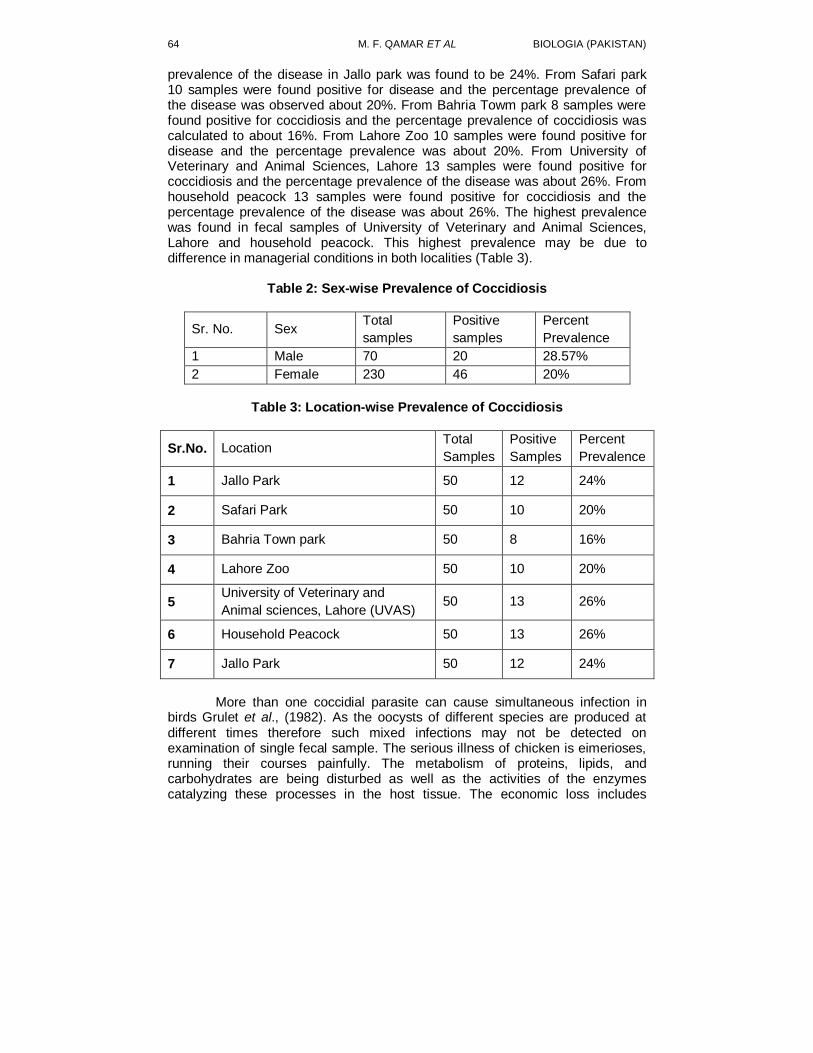
64 M. F. QAMAR ET AL BIOLOGIA (PAKISTAN)
prevalence of the disease in Jallo park was found to be 24%. From Safari park 10 samples were found positive for disease and the percentage prevalence of the disease was observed about 20%. From Bahria Towm park 8 samples were found positive for coccidiosis and the percentage prevalence of coccidiosis was calculated to about 16%. From Lahore Zoo 10 samples were found positive for disease and the percentage prevalence was about 20%. From University of Veterinary and Animal Sciences, Lahore 13 samples were found positive for coccidiosis and the percentage prevalence of the disease was about 26%. From household peacock 13 samples were found positive for coccidiosis and the percentage prevalence of the disease was about 26%. The highest prevalence was found in fecal samples of University of Veterinary and Animal Sciences, Lahore and household peacock. This highest prevalence may be due to difference in managerial conditions in both localities (Table 3).
Table 2: Sex-wise Prevalence of Coccidiosis
Sr. No. Sex Total
samples
Positive
samples
Percent
Prevalence
1 Male 70 20 28.57%
2 Female 230 46 20%
Table 3: Location-wise Prevalence of Coccidiosis
Sr.No. Location Total
Samples
Positive
Samples
Percent
Prevalence
1 Jallo Park 50 12 24%
2 Safari Park 50 10 20%
3 Bahria Town park 50 8 16%
4 Lahore Zoo 50 10 20%
5 University of Veterinary and
Animal sciences, Lahore (UVAS) 50 13 26%
6 Household Peacock 50 13 26%
7 Jallo Park 50 12 24%
More than one coccidial parasite can cause simultaneous infection in
birds Grulet et al., (1982). As the oocysts of different species are produced at different times therefore such mixed infections may not be detected on examination of single fecal sample. The serious illness of chicken is eimerioses, running their courses painfully. The metabolism of proteins, lipids, and carbohydrates are being disturbed as well as the activities of the enzymes catalyzing these processes in the host tissue. The economic loss includes
VOL. 59 (1) COCCIDIOSIS IN PEACOCK 65
mortality, the retardation of growth and development of the affected bird, the diminution of the body masses and rates of oviposition and deterioration of the meat quality Musaev et al., (1991). Eimeria continues to circulate between the environment and the host; however their specific composition remains particularly constant for a relatively long time Musaev et al., (1991). In peacocks, 5 Eimeria and 11 Isospora species have been reported Pellerdy, (1974).
It is well known that cryptosporidiosis in birds causes respiratory and digestive disorders mainly in immunocompromised birds and chicks Suteu et al., (2004). Clinical signs in peacocks were not noticed in our case, but the increase in prevalence was correlated with spring season when ambient temperature increases and also the number of chicks Titilincu et al., (2009). The information on eimerian parasite of the genus Pavo is limited to the reports of E. Arabica and E. riyadhae Amoudi, (1988); E. mandali, E. pavonina Banik & Ray, (1964); E. mayurai Bhatia & Pande, (1966); E. patnaiki Ray, (1996) and E. pavonis showing heavy infection.
The size variation of the oocysts may be due to the geographic distribution and host differences Duszynski, (1971). The peacocks showing heavy infection revealed low growth rate, loss of feathers, weakness, signs of diarrhea and upon dissecting the small intestine, it was found to have many inflammatory lesions Al-Yousif & Al-shawa, (1999). Eimerian species are considered to be highly host specific not under natural conditions Hiepe & Jumgmann, (1983) but also in farmed birds Rommel, (2000). Therefore, host’s geographic origin and systematic are commonly used criteria in their taxonomy El-Shahawy, (2010). The genus Eimeria represents the most specious genus within both protozoan and metazoan organisms. Up to present more than 1700 Eimeria species have been described based on both qualitative and quantitative traits of their sporulated oocyst and their host specificity Duszynski et al., (2001). Up to present, little data was available on eimeriid parasites of galliformes that infect game birds, such as peafowl, particularly regarding the biodiversity of Africa. The seasonality and biology of coccidian infection in galliform captive birds is almost not known. However it can cause severe disease and high mortality in galliform bird in captivity Rommel, (2000). The research on game bird population dynamics should not neglect protozoan infections, especially the ones caused by the coccidian parasites, which are of great importance for species conservation. Therefore more detailed parasitological studies are needed El-Shahawy, (2010).
During the current study it was noted that the prevalence of coccidiosis from January to June was 22%. The disease was found more prevalent during June. The possible reason might be the conditions prevailing during June that were favorable for the transmission of parasite. My study concludes that the disease was more prevalent in peacock of University of Veterinary and Animal Sciences, Lahore and household peacock. The possible reason might be environmental and managemental conditions. During the current study it was noted that the prevalence of coccidiosis in male peacock was 28.57% and in females 20%. The prevalence was higher in males than in females.
66 M. F. QAMAR ET AL BIOLOGIA (PAKISTAN)
REFERENCES
Ali, S. & Ripley, S. D., 1980. Handbook of the birds of India and Pakistan. 2nd
Ed. Oxford University Press. 2: 123–126.
Allen, P. C. & Fetterer, R. H., 2002. Interaction of Dietary Vitamin E with Eimeria maxima Infections in Chickens. Poultry Science 81: 41-48.
Alyousif, M. S., Yaser, R. & Al-Shawa., 1998. Two new coccidia (Apicomplexa: Eimeriidae) from the green peacock (Pavo muticus) from Saudi Arabia. Parasitology International. 47: 301-306.
AlYousif, S. M. & Al-shawa, R. Y., 1999. Coccidian Parasites of the green peacock (Pavo muticus L.) in Saudi Arabia, Saudi. J. Bio. Sci. 6 (2): 111-117.
Athar, M., Shakoor, A., Muhammad, G., Asi, N. M. & Saqib, M., 2001. Surgical rectification of thread-associated Glossoptosis in peafowls. Pakistan Vet. J. 21(2):92-94.
Badran, I. & Lukesova, D., 2006. Control of Coccidiosis and Different Coccidia of Chicken in Selected Technologies used in Tropics and Subtropics. Agricultura Tropica Et Subtropica. 39(1):39-42.
Banik, D. C. & Ray, H. N., 1964. On a new coccidium Eimeria mandali n.sp. from the Indian peacock. Bull Calcutta Sch Trop Med. 12: 27.
Berman, R. 1996. Peacock. Lerner Publication Company. 8-13. Bhatia, B.B. & Pande, B.P., 1966. A new coccidium, Eimeria mayurai (Sporozoa:
Eimeriidae) from the common peafowl Pavo cristatus L. Proc Natl Acad Sci India. 36: 39-42.
Chapman, H. D., 2003. Origins of coccidiosis research in the fowl –The first fifty years. Avian Diseases. 47: 1-20.
Chapman, H. D., 2005. Perspectives for the control of coccidiosis in poultry by chemotherapy and vaccination. Proceedings of the IXth International Coccidiosis Conference, Foz do Iguassu. 19-23.
Conway, P. D. & McKenzie., 2007. Poultry Coccidiosis: diagnostic and testing procedures. 3
rd Ed. Blackwell Publishing Ltd. Pp. 07.
Dhanwatey. & Amrut, S., 1986. A Crested Hawk-EagleSpizaetus cirrhatus (Gmelin) killing a Peafowl Pavo cristatusLinnaeus. J. Bombay Nat. Hist. Soc. 83 (4): 202.
Dodsworth, P. T. L., 1912. Occurrence of the Common PeafowlPavo cristatus, Linnaeus in the neighbourhood of Simla, N.W. Himalayas. J. Bombay Nat. Hist. Soc. 21 (3): 1082–1083.
Duszynski, D. W., 1971. Increase in size of Eimeria separata oocysts during patency. J. Parasitol. 75: 948-942.
Duszynski, D. W., 2001. The common coccidia of wild mammals: Cyclospora, Eimeria (Eimeriidae) and Cryptosporidium (cryptosporodiidae) spp. In Samuel, W.M., Pybus, J.M. & Kocan, A.A (eds.). parasitc diseases of wild mammals, Iowa State University Press, Ames. pp: 416-463.
El-Shahawy, S. I., 2010. Eimeria pavoaegyptica sp. nov. (Apicomplexa: Eimeriidae) in feces of Indian Peacocks, Pavo cristatus Linnaeus, 1758 (Galliformes: Phasianidae) from Egypt. Mem Inst Oswaldo Cruz, Rio de Janerio 105 (8): 965-969.
VOL. 59 (1) COCCIDIOSIS IN PEACOCK 67
Flower, M. S. S., 1938., The duration of life in animals - IV. Birds: special notes by orders and families. Proceedings of the Zoological Society of London. pp: 195–235.
Gari, G., Tilahun, G. & Dorchies, P., 2008. Study on Poultry Coccidiosis in Tiyo District, Arsi Zone, Ethiopia. Int. J. Poul. Sci. 7 (3): 251-256
Grulet, O., Landau, I. & Baccam, D., 1982. Les Isospora du moineau domestique: multiplicité des especies. Ann Parasitol Hum Comp. 57: 209-235.
Hiepe, T. & Jumgmann, R., 1983. Lehrbuch der parasitologie, Bd2, Veterinarmedizinische Protozoologie, Fisher Verlag, Jena. 101-110.
Hill, E. G., 2002. A Red Bird in a Brown Bag-The function and evolution of colorful plumage in the house finch. Oxford University Press, Inc. pp: 110.
Jackson, E.C., 2006. Peacock. Published by Reaktion Books Ltd. 33 great Sutton street, London, U.K. Pp. 07-16. Publication Date: November 30, 2006 | ISBN-10: 1861892934 | ISBN-13: 978-1861892935
Jadhav, N. B., Nikam, V. S., Bhamare, N. S. & Jaid, L. E., 2012. New species of genus Eimeria (Eimeria shivpuri) in Broiler chicken (Gallus gallus domesticus) from Aurangabad (M.S) India. Int. Multi. Res. J. 2 (3):06-08.
Johnsingh, A. J. T. & Murali, S., 1978. The ecology and behaviour of the Indian Peafowl (Pavo cristatus) Linn. of Injar. J. Bombay Nat. Hist. Soc. 75 (4): 1069–1079.
Johnsingh, A. J. T., 1976. Peacocks and cobra. J. Bombay Nat. Hist. Soc. 73 (1): 214.
Kelly, W.R. 1974. Veterinary Clinical Diagnosis. 2nd
Ed. Bailliere Taindall. pp: 200.
Lillehoj, H. S., Min, W., Choi, D. K., Bahu, S. U., Burnside, J., Miyamoto, T., Rosenthal, M. B. & Lillehoj, P. E., 2001. Molecular, Cellular and Functional characterization of chicken cytokines homologous to mammalian IL-15 and IL-2. Vet Immunol Immunopathol. 82: 229-244.
McDougald, L. R., 2003. Coccidiosis. Diseases of Poultry.11th Ed. Iowa State
University Press, Ames, IA, USA. McDougald, L.R., Lamas, D.A., Silva, J.M., Solis, J. & Braga, M. 1987. A survey
of sensitivity to anticoccidial drugs in 60 isolates of coccidia from Broiler chickens in Brazil and Argentina. Avian Diseases. 31 (2): 287-292.
Musaev, M. A., Gadjiev, A. T., Yolchiyev, Y. Y., Vahidova, S. M. & Mustafaeva, Z. A., 1991. Parasite of domestic fowl in Azerbaijan and method of control. Elm. Baku. pp: 160.
Naciri, G. M., Chausse, A. M., Fort, G., Bernardet, N., Nerat, F. & De Gussem, K., 2004. Value of anticoccidial sensitivity tests (ASTs) in the prevention of chicken coccidiosis. XXII World’s Poultry Congress, Istanbul. 8-13.
Parasharya, B.M., Mukherjee. & Aeshita. 1999. Roosting behaviour of Indian Peafowl Pavo cristatus. J. Bombay Nat. Hist. Soc. 96 (3): 471–472.
Peek, H. & Landman, W., 2003. Resistance to anticoccidial drugs of Ditch avian Eimeria spp. field isolates originating from 1996, 1999 and 2001. Avian Pathology. 32 (4): 391-401.
Pellerdy, L., 1974. Coccidia and Coccidiosis. Akad. kiado. Budapest. 193-330.
68 M. F. QAMAR ET AL BIOLOGIA (PAKISTAN)
Petrie, M., Krupa, A. & Burke, T., 1999. Peacocks lek with relatives even in the absence of social and environmental cues. Nature. 401 (6749): 155–157.
Ray, H. N., 1966. Remarks on Eimeria pavonis n.sp. from Indian peacock (Pavo cristatus). Indian J. Microbiol. 6: 51-52.
Rommel, M. 2000. parasitosen des nutzgeflugels (Huhn, Truthuhn, Gans, Ente, Taube). In Rommel, M., Eckert, J., Kutzer, E., Korting, W. & Schnieder, T (eds). Veterinarmedizinische parasitologie, Parey Buchveriag, Berlin. pp: 673-774.
Shivrajkumar, Y. S., 1957. An incubating Peacock (Pavo cristatus Linn.). J. Bombay Nat. Hist. Soc. 54 (2): 464.
Soomro, N. M., Rind, R., Arijo, G. A. & Soomro, A. S., 2001. Clinical, Gross and Histopathological Studies of Coccidial Infection in Chicken. International Journal of Agriculture & Biology. 3 (4): 426–427.
Soulsby, E.J.L. 1982. Helminths, Arthropods & Protozoa of domestic animals. Baillere Tindall, London. pp: 765-766.
Suteu, I. & Cozma, V., 2004. Parazitologie Clinica Parazitara, Edit. Risoprint, Cluj Napoca. pp: 124-127.
Tehsin, R. & Tehsin, F., 1990. Indian Great Horned Owl Bubo bubo (Linn.) and Peafowl Pavo cristatus Linn. J. Bombay Nat. Hist. Soc. 87 (2): 300.
Titilincu, A., Mircean, V., Bejan, A., Iovu, A., Ungureanu, R. & Cozma, V. 2009. Prevalence of Endoparasites in Peacocks (Pavo cristatus). Sc. Parasit. 1-2: 101-105.
Trivedi., P. & Johnsingh, A. J. T., 1995. Diet of Indian Peafowl Pavo cristatus Linn. in Gir Forest, Gujarat. J. Bombay Nat. Hist. Soc. 92 (2): 262–263.
Urquhart, G.M., 1996. In: Veterinary Parasitology. 2nd
Ed., ELBS, Longman House, Burnt Mill, Harlow, England. pp: 297-300.
Vyas, R., 1994. Unusual breeding site of Indian Peafowl. Newsletter for Birdwatchers. 34 (6): 139.
Whistler. & Hugh. 1949. Popular handbook of Indian birds (4 Ed.). Gurney and Jackson, London. pp: 401–410.
Yasmin., S. & Yahya, H. S. A., 2000. Group size and vigilance in Indian Peafowl Pavo cristatus (Linn.), Family: Phasianidae. J. Bombay Nat. Hist. Soc. 97 (3): 425–428.
BIOLOGIA (PAKISTAN) 2013, 59 (1), 69- 83 PK ISSN 0006 - 3096
*Corresponding author:[email protected]
Catfishes of the genus Glyptothorax Blyth (Pisces: Sisoridae)
from Pakistan
M. NAEEM JAVED1, SABIRA KALSOOM
2, KHALID PERVAIZ
3,
M. RAMZAN MIRZA4
& AZIZULLAH5
1,2,4,5,Department of Zoology, Govt. College University, Lahore.
3Department of Fisheries Punjab, Lahore
ABSTRACT
Sisorid catfish genus Glyptothorax Blyth is represented in Pakistan by six species, viz., Glyptothorax sufii Bashir & Mirza, Glyptothorax cavia (Hamilton), Glyptothorax pectinopterus (McClelland), Glyptothorax stocki Mirza & Nijssen, Glyptothorax kashmirensis Hora, Glyptothorax punjabensis Mirza & Kashmiri. These are recorded from different foot hill streams and adjoining plains. After detailed analysis G. naziri is found to be a synonym of G. kashmirensis Hora; G. telchitta sufii Bashir and Mirza has been validated as full species G. sufii. Presently recognized species are easily identifiable on the basis of general body shape, sucker shape, length of barbels, fin structure, number of serrations on dorsal and pectoral spines and number of gill rakers.
Keywords: Sisoridae, Glyptothorax, Catfishes, Pakistan
INTRODUCTION
The fishes of the genus Glyptothorax Blyth are of great importance from
the ecological and evolutionary point of view because they show great adaptations for rapidly flowing streams.
Day (1877 and 1889) recorded two species viz., Glyptothorax telchitta (Hamilton) and G. pectinopterus (McClelland) from Punjab and Sind. Hora (1923) and Menon (1954) excluded the areas of Pakistan from the range of G. pectinopterus. Hora & Menon (1948) and Menon (1954) considered the occurrence of G. telchitta in Punjab doubtful.
Sufi (1957) recorded two species G. cavia (Hamilton) and G. telchitta (Hamilton) from Peshawar and Hyderabad divisions respectively. In 1963 he reported three species from Pakistan (then West Pakistan) adding G. platypogonoides (Bleeker) from Peshawar in the list. Ahmad (1963) recorded same three species from Pakistan.
A new species G. naziri was described by Mirza & Naik (1969) from the river Zhob, Baluchistan. Later on it was collected from the river Kurram by Mirza et al. (1993). Mirza (1970) reported G. conirostris (Steindachner) from the Punjab. It was subsequently recognized as a new subspecies viz., G. conirostris punjabensis by Mirza & Kashmiri (1971) on the basis of mainly shorter head, longer nasal barbels, broader thoracic adhesive apparatus, shorter pectoral fins and fewer serrations on pectoral spine. Mirza & Hameed (1974) elevated it to the full species rank as G. punjabensis. They elaborated many inter populational variations in Glyptothorax naziri, like shape of thoracic sucker, body depth, shape
70 M. N. JAVED ET AL BIOLOGIA (PAKISTAN)
of pectoral fin, length of barbels and colour pattern. They described seven species of Glyptothorax Blyth from Pakistan namely, Glyptothorax cavia (Hamilton) Glyptothorax kashmirensis Hora Glyptothorax naziri Mirza & Naik Glyptothorax pectinopterus (McClelland) Glyptothorax platypogonoides (Bleeker) Glyptothorax punjabensis Mirza & Kashmiri Glyptothorax telchitta (Hamilton)
Mirza & Nijssen (1978) pointed out that the record of Glyptothorax platypogonoides (Bleeker) from Pakistan was based on wrong identification and described it as G. stocki.
Bashir & Mirza (1975) descried a new subspecies, G. telchitta sufii from Sutlej river, near Lahore and differentiated it from G. telchitta s. st. on the basis of mainly having longer snout, longer outer mandibular barbels and narrow caudal peduncle. It was treated as full species by some authors like Mirza (1990), Rafique (2000), Thomas & Page (2006) and Jayaram 2010, but maintained as subspecies by Mirza (2003). G. pectinopterus was recorded by Mirza and Waheed ud Din (1976) from Mandher nullah, a tributary of Punch river. Later, Butt (2006) recorded G. pectinopterus from the river Kunhar.
Rashida et al. (1996) discussed the sucker shape and serrations on dorsal and pectoral spines of G. naziri, G. kashmirensis and G. punjabensis. Kullander et al. (1999), suggested that it is the synonym of G. kashmirensis. Jayaram (2010) and Eschmeyer (2013) described seven valid species of this genus from Pakistan. The taxonomic status of various species of the genus Glyptothorax Blyth is reviewed in this report because of the fact that certain features like colour, size and certain other morphological characters vary with age, locality and even after preservation. Moreover there was much overlapping in morphological aspects of G. naziri and G. kashmirensis. So there was a need to confirm the taxonomic status of various species of the genus Glyptothorax found in Pakistan.
MATERIALS AND METHODS
The present report is based mainly upon the collections from the river Chenab, Zhob, Indus, Jhelum, Kurram, Haro, Punch and Kunhar etc. and material in Natural History Museum, Department of Zoology, Govt. College University Lahore, was also examined. Measurements were made with vernier calipers with accuracy of 0.05 mm (1/20
th mm). Minute features like fin rays and
pleats of suckers were observed under magnifying glass (2X and 4X) and Kyowa (Tokyo) binocular dissecting microscope (20 X). Pattern of collection, preservation and measurements mostly followed Ng (2005) and Jayaram (2010).
SYSTEMATIC ACCOUNT Genus Glyptothorax Blyth
Sisorid catfishes of the genus Glyptothorax Blyth mainly inhabit foot hill rivers and swift running mountain streams. They are benthic; a prominent thoracic sucker as an adaptive structure, is formed by longitudinal muscular skin folds or pleats sometimes with a depression in the centre Body laterally
VOL. 59 (1) GLYPTOTHORAX BLYTH (PISCES: SISORIDAE) 71
compressed; head depressed; eyes small, directed upwards, covered with a skin membrane. Mouth inferior, transverse and narrow; lips thick, fleshy and papillated. Barbels four pairs; maxillary barbels are the longest, with broad skin at the base. Last simple ray of dorsal fin forms a spine; posterior margin of the spine variably denticulated. Pectoral fin with a strong spine having sharp serrations along its internal margin. Caudal fin deeply forked.
Key to species: 1a: Nasal barbels not reaching the eye ………………….…………….………….…2 b: Nasal barbels reaching the eye …………………………………….…………....3 2a: Maxillary barbels reaching origin of pectoral fin, gill rakers 4..…..… G. cavia b: Maxillary barbels not reaching origin of pectoral fin, gill rakers 7 ……G. sufii 3a: Outer rays of paired fins ventrally plaited………………….. .G. pectinopterus b: Outer rays of paired fins not plaited ventrally . ………………….……………...4 4a: Thoracic adhesive apparatus V shaped, broader than long, extending on to throat anteriorly ……….…………………………………...…… G. punjabensis b: Thoracic adhesive apparatus longer than broad, not extending on to throat anteriorly, depression not V shaped………………….…………...…………… 5 5a: Sucker more or less oval in shape with almost slit like depression …G. stocki b: Sucker not oval, with rounded or U shaped depression in the centre ………………………………………………………………………G. kashmirensis
Glyptothorax cavia (Hamilton) Pimelodus cavia Hamilton, 1822. Euglyptosternum lineatum Day, 1877. Glyptothorax lineatus, Hora, 1923. Glyptothorax cavia Hora & Menon, 1948
Fin formula: D. I,6; P. I, 10; V. I,5; A.III, 10; C. 17; G.r. 4 A medium sized fish with dorsal profile rising from the tip of snout to the
origin of dorsal fin beyond which it tapers towards caudal base. Very small, rounded tubercles present on head region and in the vicinity of pectoral base up to sucker. Occipital process and basal bone of dorsal are widely separate. Body depth maximum at the origin of dorsal fin and is 18.4 – 19.8 (m: 19.1) % of SL; body is broadest just behind the operculum; its breadth 19.9 - 21.98 (m: 20.9) % 0f SL.
Head long and depressed, flat on ventral side, broader than high; its length 27.2 – 31.45 (m: 29.33) %, height 16.8 – 17.34 (m: 17.07) % and breadth 21.6 – 25.81 (m: 23.7) % of SL. Snout is rounded, broad and depressed; its length 12.8 – 14.32 (m: 13.56) % of SL, 45.51 - 47 (m: 46.26) % of HL and 76.2 – 82.56 (m: 79.38) % of head height. Nostrils of a side are close together and nearer to the tip of snout than to eye. Mouth inferior and wide, transverse and crescentic; cleft of mouth shallow and present close to the tip of snout; upper jaw slightly longer than lower jaw; lips are thick and papillated. Eyes small, rounded, subcutaneous, dorsally located, nearer to the posterior margin of operculum than to the tip of snout, smaller than the interorbital width; its diameter 1.6 – 1.7 (m: 1.65) % of SL, 5.8 – 6.1 (m: 5.95) % of HL, 26.7 – 27.0 (m: 26.85) % of interorbital width and 12.5 – 13.0 (m: 12.75) % of snout length; interorbital width smaller than snout length and is 6 – 7.66 (m: 6.83) % of SL.
72 M. N. JAVED ET AL BIOLOGIA (PAKISTAN)
Barbels four pairs, nasal not reaching the eye, smaller than outer mandibular and longer than inner mandibular; its length 5.65 - 7.2 (m: 6.42) % of SL. Maxillary longest of all, broader at the base due to the presence of a skin flap, reaching up to the origin of pectoral spine; its length 18.95 - 20.8 (m: 19.88) % of SL. Inner mandibular arising just behind the anterior edges of lower jaw; its length 4.03 - 6 (m: 5.02) % of SL. Outer mandibular longer than inner one and originating slightly behind it; its length 11.2 – 12.10 (m: 11.65) % of SL.
Origin of rayed dorsal before pelvic origin, nearer to the tip of snout than to caudal base. Predorsal distance 34.8 – 41.53 (m: 38.17) % of SL. Dorsal spine strong with 8 small blunt serrations. Adipose dorsal long and low; its origin nearer to the base of caudal than to the posterior end of rayed dorsal almost opposite to anal fin; its length greater than the base of dorsal and is 15.2 – 17.74 (m: 16.47) % of SL; inter dorsal space 24.0 – 24.4 (m: 24.2) % of SL. Pectoral spine longer and stronger than dorsal spine; 8 serrations along its posterior margin which are sharp, elongated and pointed. Pelvic originating slightly behind the origin of last ray of dorsal fin, reaching beyond the genital opening; prepelvic distance 49.6 - 56.0 (m: 52.8) % of SL. Anal nonconfluent with caudal; its base smaller than adipose dorsal but longer than pelvic and pectoral. Caudal deeply forked, lower lobe is slightly longer than the upper one; first complete caudal ray longer and curved inward.
Caudal peduncle strong and muscular; its length 15.32 - 18.4 (m: 16.86) % of SL; its least height 6.4 - 7.06 (m: 6.73)% of SL and 34.8 - 46.05 (m: 39.05) % of its length.
Sucker oval, forming 3/4th of a circle, slightly longer than broad. Small
rounded clear depression is present in the centre; ridges or pleats are not very thick and diffuse gently towards inner and outer margins; its length 11.11 - 11.16 (m: 11.14) % and breadth 8.73 – 8.77 (m: 8.75) % of SL.
Very small, sharp and pointed cardiform teeth are present on two differently shaped bands, upper is semicircular and broader extending up to the palate which is a distinguishing character of this fish. Lower band is crescent shaped and is divided into two pieces.
Colour of dorsal side is greyish black, lateral side is light grey and ventral side is pale white. Localities: Khatki &Abazai (KPK), Kalabagh, Chashma, Jhelum, Bajwat, Shadiwal, Qadirabad & D. G. Khan (Punjab). Distribution: Pakistan: Punjab, KPK, Azad Kashmir; India: Eastern Himalayas, Assam; Nepal; Bangladesh & Myanmer. Fishery Value: It grows to a relatively larger size and has a reasonable food value. A specimen from Chashma is 305 mm long (TL)
Glyptothorax kashmirensis Hora
Glyptothorax kashmirensis Hora, 1923. Glyptothorax naziri Mirza & Naik, 1969., Mirza & Hameed, 1974
Fin Formula: D. I,6; P. I, 8-9; V. I,5; A.III, 7-8; C. 17 Small to medium sized fish. We have 31.75 mm to 145.0 mm long
specimens from different localities of Pakistan including Kurram, Zhob, Haro and Indus rivers. Body elongate; dorsal profile rising from the tip of snout to the commencement of dorsal fin and then becoming gradually straight. Ventral profile
VOL. 59 (1) GLYPTOTHORAX BLYTH (PISCES: SISORIDAE) 73
almost straight; head depressed, slightly longer than broad. Occipital process very close but not fused to the basal bone of dorsal fin. Mouth inferior, lips papillated; barbels four pairs, maxillary being the longest, extends posteriorly beyond the pectoral fin base. Adhesive apparatus present in the thorax is well developed, longer than broad and with a rounded or oval central pit. Sucker horse shoe shaped in smaller specimens but gets more prominent and elongated in larger specimens. Caudal fin deeply forked. Skin rough due to large number of tubercles.
Body depth maximum at the origin of dorsal fin; its depth greater than breadth, body depth 20.5 – 25. 2 (m: 23.01) % of SL. Body breadth maximum just behind the operculum. Head long and depressed, flat on the ventral side, broader than high; its length 24 – 30 (m: 27.02) %, height 14.5 – 17.5 (m: 15.8) % and breadth 18 – 25 (m: 21.2) % of SL.
Snout rounded, broad and depressed, its length 12.9 – 15.6 (m: 13.8) % of SL, 46.6 – 53.8 (m: 50.1) % of HL and 80.2 – 95 (m: 91.4) % of head height. Nostrils of a side close to each other and nearer to the tip of snout than to eyes. Mouth inferior, wide and crescent shaped; upper jaw slightly longer than the lower jaw; lips papillated
Eyes very small, rounded in shape, subcutaneous; located on the dorsal side in the posterior half of the head, smaller than the interorbital width; its diameter 1.8 – 2.9 (m: 2.2 ) % of SL, 6.6 – 9.8 (m: 8.02) % of HL, 31.1 – 42.8 (m: 37.8) % of interorbital width and 14.2 – 20.3 (m: 16.8) % of snout length. Interorbital width smaller than snout length and is 6.3 – 8.1 (m: 7.06) % of SL.
Barbels four pair, nasal smaller than outer mandibular and longer than inner mandibular, reaching beyond the posterior margin of eye, its length 11.8 – 14 (m: 12.9) % of SL. Maxillary longest of all, reaching beyond the pectoral base, its length 32.2 – 42.5 (m: 37.0) % of SL. Inner mandibular originating just behind the edge of lower jaw, its length 11.1 15 (m: 13.2) % of SL. Outer mandibular longer than and originating slightly behind the inner one, its length 17.7 – 23.1 (m: 20.5) % of SL.
Origin of rayed dorsal before pelvic origin, nearer to the tip of snout than to the caudal base, predorsal distance 35.1 – 39.7 (m: 37.1) % of SL; its base 11.7 – 15.4 (m: 13.6) % of SL. Last simple ray forms a spine having 4 – 7 serrations along its posterior edge. Serrations are prominent, sharp and pointed in smaller specimens but smaller and blunt in larger specimens. Adipose dorsal long and low; its origin almost opposite to the anal origin; nearer to the base of caudal fin than to the posterior end of rayed dorsal; its length greater than the base of rayed dorsal and is 16.6 – 21.4 (m: 19.6) % of SL. Length of space between rayed and adipose dorsal 11.1 – 17.0 (m: 13.2) % of SL.
Pectoral spine longer and stronger than dorsal spine; 10 – 13 serrations along its posterior margin are sharp and pointed. Pelvic origin almost in the middle of SL, slightly behind the last ray of dorsal fin reaching beyond the genital opening; prepelvic distance 49 – 53.7 (m: 51.31) % of SL.
Anal fin nonconfluent with caudal; its base smaller than the base of adipose dorsal but longer than the base of pelvic and pectoral. Caudal deeply forked, its lower lobe slightly longer than upper one.
74 M. N. JAVED ET AL BIOLOGIA (PAKISTAN)
Caudal peduncle strong and muscular; its length 17.2 – 20.9 (m: 19.4) % of SL; its least height 48 – 58 (m: 50.8) % of its length and 8.5 – 11.2 (m: 9.8) % of SL.
Sucker longer than broad, its shape changes slightly with the age; in smaller specimens it is horse shoe shaped but as the fish grows it gradually changes shape and becomes elongated with a rounded, oval or U shaped clear area in the centre. Ridges grow from centre to periphery. Length of sucker 14 – 15.6 (m: 14.6) % of SL; its breadth 12.5 – 13.7 (m: 13.2) % of SL.
A large number of very small cardiform teeth are present on jaws in the form of crescent shaped bands, upper band is in one piece and lower is divided into two. Colour dark brown or greyish on the dorsal and lateral sides lighter beneath, light yellow on the base of fins. Localities: Neelam river (Azad Kashmir), Kurram river (KPK), Zhob river (Baluchistan), Haro and Chenab river (Punjab). Distribution: Pakistan: Indus river system; India: Kashmir, Himachal Pradesh. Fishery Value: It has minor fishery value because it does not grow to a large size. The longest specimen from Kashmir is 149 mm long and from Kurram is 141mm long.
Glyptothorax pectinopterus (McClelland)
Glyptosternon pectinopterus McClelland, 1942. Glyptothorax pectinopterus Hora, 1923.
Fin formula: D. I,6; P. I, 8; V. I,5; A.II, 6; C. 17. A small sized fish with greatly depressed head and compressed posterior
part especially behind the dorsal fin origin. Dorsal profile rises from the tip of snout to the origin of dorsal fin beyond which it slopes down towards caudal base. Very small, rounded tubercles present on head region and in the vicinity of pectoral base up to sucker. Occipital process and basal bone of dorsal are separate. Body depth maximum at the origin of dorsal fin and is 18.31 – 18.87 (m: 18.59) % of SL; body is broadest just behind the operculum; its breadth 16.9 - 20.76 (m: 18.83) % 0f SL.
Head long and depressed, flat on ventral side, broader than high; its length 22.64 - 23.94 (m: 23.29) %, height 12.33 – 14.15 (m: 13.24) % and breadth 20.76 - 21.13 (m: 20.94) % of SL. Snout is rounded and broad when viewed dorsally; greatly depressed when viewed laterally; its length 11.27 – 13.21 (m: 12.24) % of SL and 47.06 – 58.33 (m: 52.7) % of HL. Nostrils of a side are close together and nearer to the tip of snout than to eye. Mouth inferior and wide, transverse and crescent; cleft of mouth shallow and present close to the tip of snout; upper jaw slightly longer than lower jaw; lips are thick and papillated. Eyes small, rounded, subcutaneous, dorsally located, nearer to the posterior margin of operculum than to the tip of snout, smaller than the interorbital width; its diameter 2.81 – 3.77 (m: 3.29) % of SL and 11.77 – 16.67 (m: 14.22) % of HL. Interorbital width smaller than snout length and is 8.45 – 8.49 (m: 8.47) % of SL and 35.29 – 37.5 (36.40) % of HL.
Barbels four pairs, nasal reaching the eye, smaller than outer mandibular and longer than inner mandibular; its length 5.66 – 6.34 (m: 6.00) % of SL and 25.00 – 26.47 (m: 25.74) % of HL. Maxillary longest of all, broader at the base due to the presence of a skin flap, reaching up to the 1/3
rd of the pectoral spine,
VOL. 59 (1) GLYPTOTHORAX BLYTH (PISCES: SISORIDAE) 75
almost equal to head length; its length 22.54 - 26.42 (m: 24.48) % of SL. Inner mandibular arising just behind the anterior edges of lower jaw; its length 7.75 – 8.49 (m: 8.12) % of SL and 32.35 – 37.5 (m: 34.9) % of HL. Outer mandibular longer than inner one and originating slightly behind it, reaching to the origin of pectoral fin; its length 11.97 – 13.21 (m: 12.59) % of SL and 50.00 – 58.33 (m: 54.16) % of HL.
Origin of rayed dorsal before pelvic origin, nearer to the tip of snout than to caudal base. Predorsal distance 30.99 – 35.85 (m: 36.40) % of SL. Dorsal spine strong without serrations. Adipose dorsal long and low; its origin nearer to the base of caudal than to the posterior end of rayed dorsal, almost opposite to anal fin; its length greater than the base of dorsal and is 19.72 – 21.7 (m: 20.71) % of SL; inter dorsal space 24.37 – 26.42 (m: 25.39) % of SL. Paired fins have ventrally plaited first ray which extends on the first branched ray of pelvic. Pectoral spine longer and stronger than dorsal spine; 9 serrations along its posterior margin which are sharp, elongated and pointed. Pelvic originating slightly behind the origin of last ray of dorsal fin, reaching beyond the genital opening; prepelvic distance 46.48 - 49.06 (m: 47.77) % of SL. Anal nonconfluent with caudal; its base smaller than adipose dorsal but longer than pelvic and pectoral. Caudal deeply forked, both the lobes almost equal; its length almost equal to the pelvic.
Caudal peduncle strong and muscular; its length 19.51 - 19.25 (m: 19.38) % of SL; its least height 9.43 - 9.86 (m: 9.65) % of SL and 50.54 - 49.02 (m: 49.78) % of its length.
Sucker longer than broad, somewhat oval depression is present in the centre; its length 6.6 - 7.18 (m: 6.89) % and breadth 9.65 – 10.19 (m: 10.02) % of SL.
Very small, sharp and pointed cardiform teeth are present on two differently shaped bands, upper is semicircular and lower is crescent shaped is divided into two pieces.
Colour of dorsal side is greyish black, lateral side is light grey and ventral side is pale white. Localities: Azad Kashmir: Mandher Nullah, a tributary of Punch River, Jhelum River (Mirza et al.,1997) Pakistan: Kunhar River near Balakot (KPK). Distribution: Pakistan: KPK, Azad Kashmir; India: Kashmir, East Punjab & UP; Nepal Fishery Value: It seems to have no fishery value because it remains small sized. We have a maximum of 86 mm (TL) long specimen. Talwar & Jhingran (1991) has reported a maximum length of 178 mm (SL).
Glyptothorax punjabensis Mirza & Kashmiri
Glyptothorax conirostris (non Steindachner) Mirza 1970. Glyptothorax conirostris punjabensis Mirza & Kashmiri, 1971. Glyptothorax punjabensis Mirza & Hameed, 1974., Jayaram, 1979.
Fin formula: D. I,6; P. I, 8; V. I,5; A.I, 8; C. 17; G.r. 9 – 11 A medium sized fish with dorsal profile rising from tip of snout to the
origin of dorsal fin, beyond which it tapers towards caudal base, almost straight in males and slightly convex in females. Scattered tubercles on head region large and rounded on the snout, operculum has long and more elongated on adipose
76 M. N. JAVED ET AL BIOLOGIA (PAKISTAN)
fin. Occipital process and basal bone of dorsal are not opposed to each other. Body depth maximum at the origin of dorsal fin; 15.15 - 23.6 (m: 18.57) % of SL, body breadth maximum at the level of operculum.
Head long and depressed, flat on the ventral side; its length 27.5 – 30.5 (m: 28.4) % of SL; its height 12.3 – 18.5 (m: 14.18) % of SL; its width greater than height and is 18.18 – 22.2 (m: 19.2) % of SL. Snout rounded, broad and depressed; its length 13.8 – 15.7 (m: 14.5) % of SL, 50 – 53 (m: 51.14) % of HL and 113 – 120 (m: 115) % of head height. Nostrils of a side are close together and nearer to the tip of snout than to the eye.
Mouth wide and crescentic in shape; cleft of mouth shallow, present close to the tip of snout; upper jaw slightly longer than lower jaw; lips are thick and papillated. Eyes very small, rounded, subcutaneous, located dorsally, in the posterior half of head; its diameter smaller than the interorbital width; 1.4 – 2.2 (m: 1.86) % of SL, 5.1 – 8.1 (m: 6.3) % of HL, 22.2 – 37.5 (m: 31.6) % of interorbital width and 10.0 – 15.7 (m: 13.04) % of snout length. Interorbital width smaller than snout length; 6.0 – 6.4 (m: 6.24) % of SL.
Barbels four pairs, nasal reaching beyond the posterior margin of eye; its length 10.9 – 12.9 (m: 12.2) % of SL. Maxillary longest of all, broader at the base, reaching up to 3/4
th or the end of the pectoral spine; its length 26.8 – 32.4 (m:
30.0) % of SL. Inner mandibular originating just behind the anterior edge of lower jaw; its length 9.1 – 10.9 (m: 10.16) % of SL. Outer mandibular longer than inner one, originating slightly behind it; its length 18 – 22.2 (m: 19.3) % of SL.
Origin of rayed dorsal before the pelvic origin, nearer to the tip of snout than to the caudal base. Predorsal distance 36 – 40.9 (m: 37.6) % of SL; its base 10.6 – 12.9 (m: 12.2) % of SL. Spine of dorsal fin poorly serrated, having 1 to 2 serrations along its posterior margin. Adipose dorsal long and low; its origin nearer to the base of caudal than to the posterior end of dorsal fin and opposite to anal fin; its length greater than the base of rayed dorsal; 17.5 – 19.0 (m: 18.6) % of SL. Space between rayed and adipose dorsal 14.4 – 18.18 (m: 16.03) % of SL. Pectoral spine longer and stronger than dorsal spine; its posterior margin has 8 – 10 serrations which are more prominent in number and size than the dorsal spine. Pelvic originating slightly behind the origin of rayed dorsal; prepelvic distance 47.4 – 53 (m: 48.91) % of SL. Anal nonconfluent with caudal, longer than pelvic. Caudal deeply forked, lower lobe slightly longer than upper lobe.
Caudal peduncle strong and muscular; its length 20.4 – 23.3 (m: 21.9) % of SL; its least height 8.3 – 9.2 (m: 8.36) % of SL and 36 – 42 (m: 38.2) % of its own length.
Sucker extends up to the chin in the form of series of longitudinal pleats of skin. Its thoracic part is broader than long; ridges run anteroposteriorly giving it V – shape; its length 11.3 – 11.4 (m: 11.34) % and breadth 12.5 – 13.6 (m: 13.13) % of SL. A large number of very small cardiform teeth are present on jaws in the form of crescent shaped bands; upper band is in one piece and lower is divided into two.
Colour is variable. Dorsal and lateral sides are from grey through dark and light brown to yellowish brown; ventral side is light pale. Localities: Lahore - Bhed nullah; Rawalpindi - river Soan; Shadiwal - Upper Jhelum canal; Barotha - river Indus (Punjab); Khatki village - Kabul drainage; the river Siran near Ghazi (KPK); Kotli (Azad Kashmir).
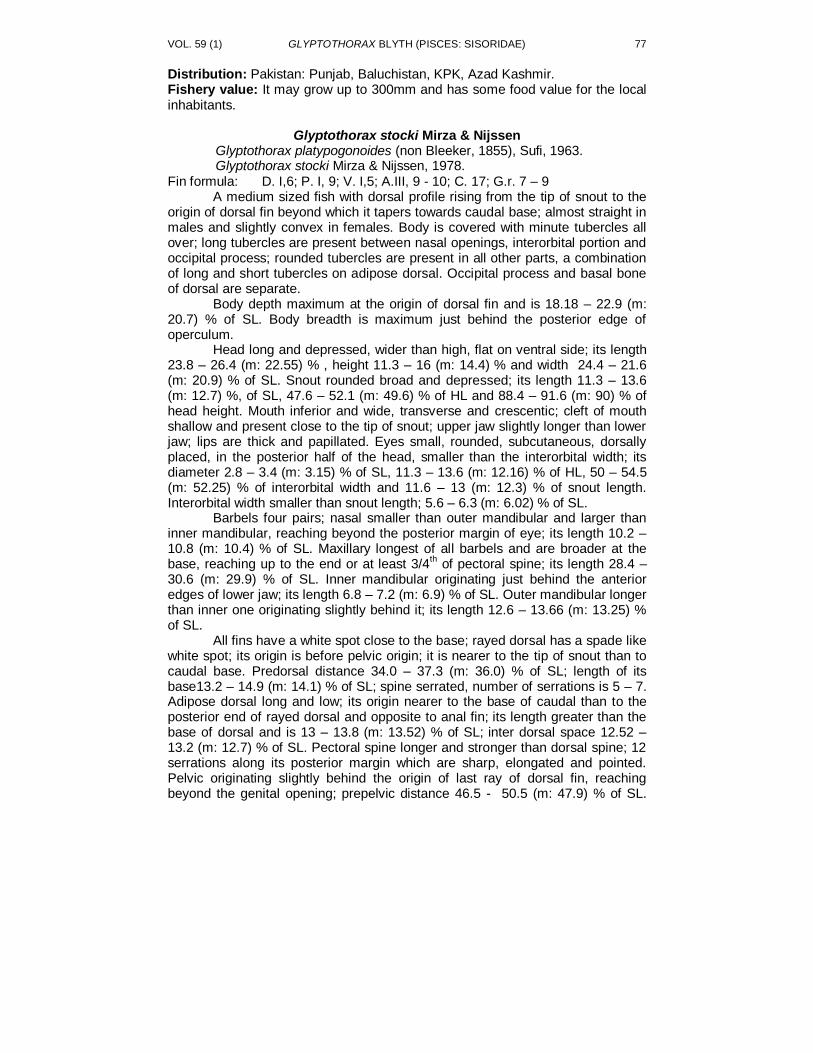
VOL. 59 (1) GLYPTOTHORAX BLYTH (PISCES: SISORIDAE) 77
Distribution: Pakistan: Punjab, Baluchistan, KPK, Azad Kashmir. Fishery value: It may grow up to 300mm and has some food value for the local inhabitants.
Glyptothorax stocki Mirza & Nijssen Glyptothorax platypogonoides (non Bleeker, 1855), Sufi, 1963. Glyptothorax stocki Mirza & Nijssen, 1978.
Fin formula: D. I,6; P. I, 9; V. I,5; A.III, 9 - 10; C. 17; G.r. 7 – 9 A medium sized fish with dorsal profile rising from the tip of snout to the
origin of dorsal fin beyond which it tapers towards caudal base; almost straight in males and slightly convex in females. Body is covered with minute tubercles all over; long tubercles are present between nasal openings, interorbital portion and occipital process; rounded tubercles are present in all other parts, a combination of long and short tubercles on adipose dorsal. Occipital process and basal bone of dorsal are separate.
Body depth maximum at the origin of dorsal fin and is 18.18 – 22.9 (m: 20.7) % of SL. Body breadth is maximum just behind the posterior edge of operculum.
Head long and depressed, wider than high, flat on ventral side; its length 23.8 – 26.4 (m: 22.55) % , height 11.3 – 16 (m: 14.4) % and width 24.4 – 21.6 (m: 20.9) % of SL. Snout rounded broad and depressed; its length 11.3 – 13.6 (m: 12.7) %, of SL, 47.6 – 52.1 (m: 49.6) % of HL and 88.4 – 91.6 (m: 90) % of head height. Mouth inferior and wide, transverse and crescentic; cleft of mouth shallow and present close to the tip of snout; upper jaw slightly longer than lower jaw; lips are thick and papillated. Eyes small, rounded, subcutaneous, dorsally placed, in the posterior half of the head, smaller than the interorbital width; its diameter 2.8 – 3.4 (m: 3.15) % of SL, 11.3 – 13.6 (m: 12.16) % of HL, 50 – 54.5 (m: 52.25) % of interorbital width and 11.6 – 13 (m: 12.3) % of snout length. Interorbital width smaller than snout length; 5.6 – 6.3 (m: 6.02) % of SL.
Barbels four pairs; nasal smaller than outer mandibular and larger than inner mandibular, reaching beyond the posterior margin of eye; its length 10.2 – 10.8 (m: 10.4) % of SL. Maxillary longest of all barbels and are broader at the base, reaching up to the end or at least 3/4
th of pectoral spine; its length 28.4 –
30.6 (m: 29.9) % of SL. Inner mandibular originating just behind the anterior edges of lower jaw; its length 6.8 – 7.2 (m: 6.9) % of SL. Outer mandibular longer than inner one originating slightly behind it; its length 12.6 – 13.66 (m: 13.25) % of SL.
All fins have a white spot close to the base; rayed dorsal has a spade like white spot; its origin is before pelvic origin; it is nearer to the tip of snout than to caudal base. Predorsal distance 34.0 – 37.3 (m: 36.0) % of SL; length of its base13.2 – 14.9 (m: 14.1) % of SL; spine serrated, number of serrations is 5 – 7. Adipose dorsal long and low; its origin nearer to the base of caudal than to the posterior end of rayed dorsal and opposite to anal fin; its length greater than the base of dorsal and is 13 – 13.8 (m: 13.52) % of SL; inter dorsal space 12.52 – 13.2 (m: 12.7) % of SL. Pectoral spine longer and stronger than dorsal spine; 12 serrations along its posterior margin which are sharp, elongated and pointed. Pelvic originating slightly behind the origin of last ray of dorsal fin, reaching beyond the genital opening; prepelvic distance 46.5 - 50.5 (m: 47.9) % of SL.
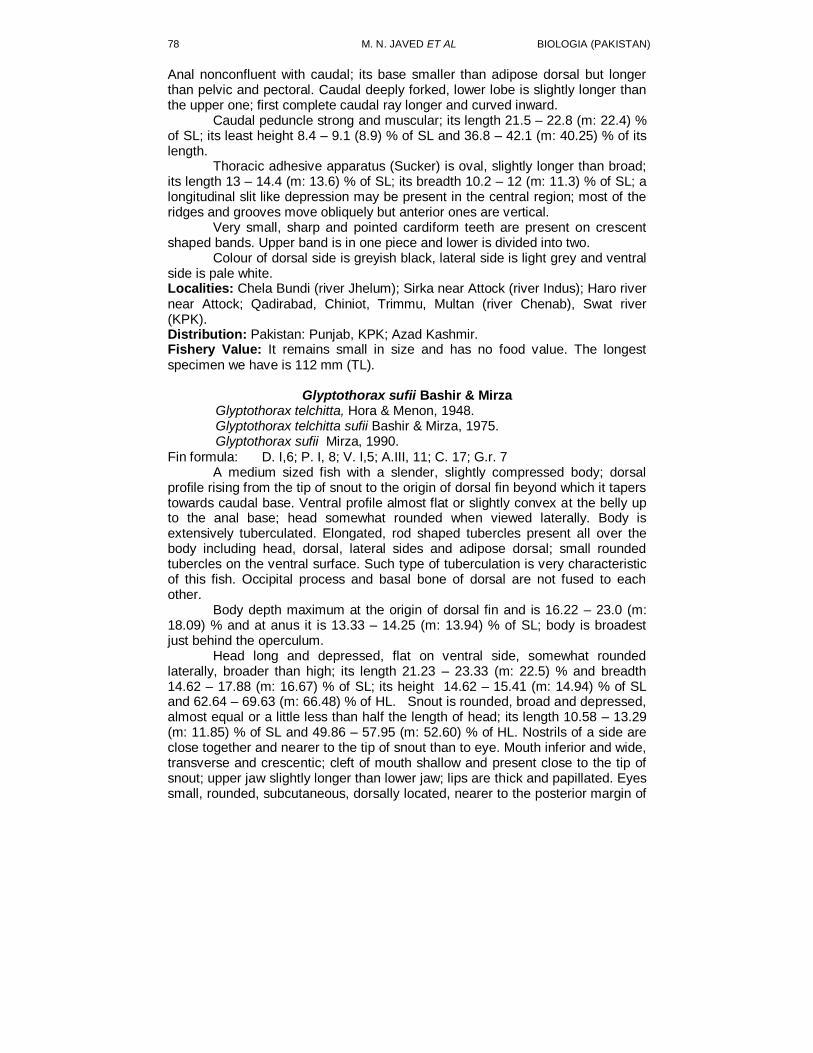
78 M. N. JAVED ET AL BIOLOGIA (PAKISTAN)
Anal nonconfluent with caudal; its base smaller than adipose dorsal but longer than pelvic and pectoral. Caudal deeply forked, lower lobe is slightly longer than the upper one; first complete caudal ray longer and curved inward.
Caudal peduncle strong and muscular; its length 21.5 – 22.8 (m: 22.4) % of SL; its least height 8.4 – 9.1 (8.9) % of SL and 36.8 – 42.1 (m: 40.25) % of its length.
Thoracic adhesive apparatus (Sucker) is oval, slightly longer than broad; its length 13 – 14.4 (m: 13.6) % of SL; its breadth 10.2 – 12 (m: 11.3) % of SL; a longitudinal slit like depression may be present in the central region; most of the ridges and grooves move obliquely but anterior ones are vertical.
Very small, sharp and pointed cardiform teeth are present on crescent shaped bands. Upper band is in one piece and lower is divided into two.
Colour of dorsal side is greyish black, lateral side is light grey and ventral side is pale white. Localities: Chela Bundi (river Jhelum); Sirka near Attock (river Indus); Haro river near Attock; Qadirabad, Chiniot, Trimmu, Multan (river Chenab), Swat river (KPK). Distribution: Pakistan: Punjab, KPK; Azad Kashmir. Fishery Value: It remains small in size and has no food value. The longest specimen we have is 112 mm (TL).
Glyptothorax sufii Bashir & Mirza Glyptothorax telchitta, Hora & Menon, 1948. Glyptothorax telchitta sufii Bashir & Mirza, 1975. Glyptothorax sufii Mirza, 1990.
Fin formula: D. I,6; P. I, 8; V. I,5; A.III, 11; C. 17; G.r. 7 A medium sized fish with a slender, slightly compressed body; dorsal
profile rising from the tip of snout to the origin of dorsal fin beyond which it tapers towards caudal base. Ventral profile almost flat or slightly convex at the belly up to the anal base; head somewhat rounded when viewed laterally. Body is extensively tuberculated. Elongated, rod shaped tubercles present all over the body including head, dorsal, lateral sides and adipose dorsal; small rounded tubercles on the ventral surface. Such type of tuberculation is very characteristic of this fish. Occipital process and basal bone of dorsal are not fused to each other.
Body depth maximum at the origin of dorsal fin and is 16.22 – 23.0 (m: 18.09) % and at anus it is 13.33 – 14.25 (m: 13.94) % of SL; body is broadest just behind the operculum.
Head long and depressed, flat on ventral side, somewhat rounded laterally, broader than high; its length 21.23 – 23.33 (m: 22.5) % and breadth 14.62 – 17.88 (m: 16.67) % of SL; its height 14.62 – 15.41 (m: 14.94) % of SL and 62.64 – 69.63 (m: 66.48) % of HL. Snout is rounded, broad and depressed, almost equal or a little less than half the length of head; its length 10.58 – 13.29 (m: 11.85) % of SL and 49.86 – 57.95 (m: 52.60) % of HL. Nostrils of a side are close together and nearer to the tip of snout than to eye. Mouth inferior and wide, transverse and crescentic; cleft of mouth shallow and present close to the tip of snout; upper jaw slightly longer than lower jaw; lips are thick and papillated. Eyes small, rounded, subcutaneous, dorsally located, nearer to the posterior margin of
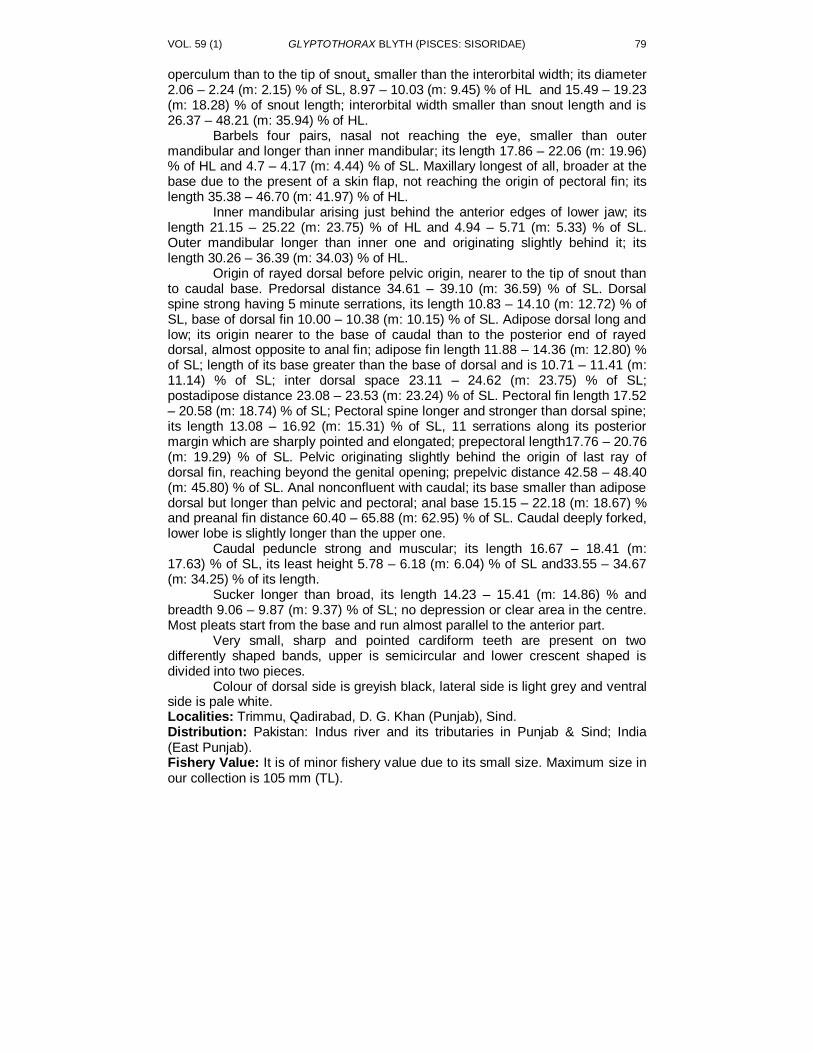
VOL. 59 (1) GLYPTOTHORAX BLYTH (PISCES: SISORIDAE) 79
operculum than to the tip of snout, smaller than the interorbital width; its diameter 2.06 – 2.24 (m: 2.15) % of SL, 8.97 – 10.03 (m: 9.45) % of HL and 15.49 – 19.23 (m: 18.28) % of snout length; interorbital width smaller than snout length and is 26.37 – 48.21 (m: 35.94) % of HL.
Barbels four pairs, nasal not reaching the eye, smaller than outer mandibular and longer than inner mandibular; its length 17.86 – 22.06 (m: 19.96) % of HL and 4.7 – 4.17 (m: 4.44) % of SL. Maxillary longest of all, broader at the base due to the present of a skin flap, not reaching the origin of pectoral fin; its length 35.38 – 46.70 (m: 41.97) % of HL.
Inner mandibular arising just behind the anterior edges of lower jaw; its length 21.15 – 25.22 (m: 23.75) % of HL and 4.94 – 5.71 (m: 5.33) % of SL. Outer mandibular longer than inner one and originating slightly behind it; its length 30.26 – 36.39 (m: 34.03) % of HL.
Origin of rayed dorsal before pelvic origin, nearer to the tip of snout than to caudal base. Predorsal distance 34.61 – 39.10 (m: 36.59) % of SL. Dorsal spine strong having 5 minute serrations, its length 10.83 – 14.10 (m: 12.72) % of SL, base of dorsal fin 10.00 – 10.38 (m: 10.15) % of SL. Adipose dorsal long and low; its origin nearer to the base of caudal than to the posterior end of rayed dorsal, almost opposite to anal fin; adipose fin length 11.88 – 14.36 (m: 12.80) % of SL; length of its base greater than the base of dorsal and is 10.71 – 11.41 (m: 11.14) % of SL; inter dorsal space 23.11 – 24.62 (m: 23.75) % of SL; postadipose distance 23.08 – 23.53 (m: 23.24) % of SL. Pectoral fin length 17.52 – 20.58 (m: 18.74) % of SL; Pectoral spine longer and stronger than dorsal spine; its length 13.08 – 16.92 (m: 15.31) % of SL, 11 serrations along its posterior margin which are sharply pointed and elongated; prepectoral length17.76 – 20.76 (m: 19.29) % of SL. Pelvic originating slightly behind the origin of last ray of dorsal fin, reaching beyond the genital opening; prepelvic distance 42.58 – 48.40 (m: 45.80) % of SL. Anal nonconfluent with caudal; its base smaller than adipose dorsal but longer than pelvic and pectoral; anal base 15.15 – 22.18 (m: 18.67) % and preanal fin distance 60.40 – 65.88 (m: 62.95) % of SL. Caudal deeply forked, lower lobe is slightly longer than the upper one.
Caudal peduncle strong and muscular; its length 16.67 – 18.41 (m: 17.63) % of SL, its least height 5.78 – 6.18 (m: 6.04) % of SL and33.55 – 34.67 (m: 34.25) % of its length.
Sucker longer than broad, its length 14.23 – 15.41 (m: 14.86) % and breadth 9.06 – 9.87 (m: 9.37) % of SL; no depression or clear area in the centre. Most pleats start from the base and run almost parallel to the anterior part.
Very small, sharp and pointed cardiform teeth are present on two differently shaped bands, upper is semicircular and lower crescent shaped is divided into two pieces.
Colour of dorsal side is greyish black, lateral side is light grey and ventral side is pale white. Localities: Trimmu, Qadirabad, D. G. Khan (Punjab), Sind. Distribution: Pakistan: Indus river and its tributaries in Punjab & Sind; India (East Punjab). Fishery Value: It is of minor fishery value due to its small size. Maximum size in our collection is 105 mm (TL).
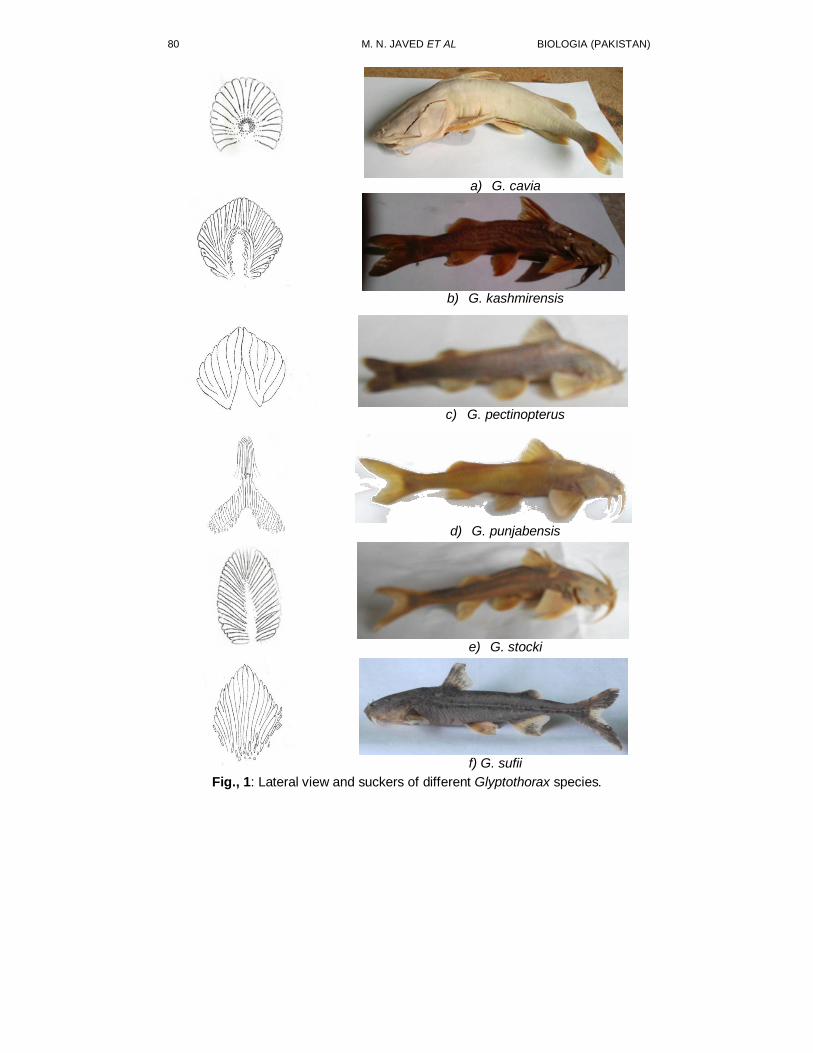
80 M. N. JAVED ET AL BIOLOGIA (PAKISTAN)
a) G. cavia
b) G. kashmirensis
c) G. pectinopterus
d) G. punjabensis
e) G. stocki
f) G. sufii
Fig., 1: Lateral view and suckers of different Glyptothorax species.
VOL. 59 (1) GLYPTOTHORAX BLYTH (PISCES: SISORIDAE) 81
DISCUSSION
Six species of sisorid genus Glyptothorax are found to occur in different regions of Pakistan. They are mainly recorded from rapids of foothills but their distribution is extended upto the plains.
G. pectinopterus was previously reported from Kashmir but later recorded also from the river Kunhar in Kaghan Valley by M. Z. Butt (2002). It is the only fish in Pakistan with ventrally plaited pectoral and pelvic fins. G. cavia is identifiable on the basis of shorter nasal barbel, not reaching the eye, maxillary reaching the pectoral, rounded sucker with a central pit, position of teeth on the upper jaw and palate and a wide gap between occipital process and basal bone of dorsal. G. stocki can be distinguished on the basis of sucker shape, and barbel length.
G. sufii was earlier described as a subspecies G. telchitta sufii by Basir and Mirza (1975), on the basis of mainly having longer snout, longer outer mandibular barbels and narrower caudal peduncle as compared to G. telchitta s. st. Moreover it varies from G. telchitta which is elaborately discussed by Ng (2005), in terms of having shorter and higher caudal peduncle, deeper body, greater head depth, wider interorbital width, 12 serrations of pectoral spine as compared to 8 – 10 in G. telchitta and shorter maxillary barbels. As Indus river system is geographically completely isolated from the Ganges River system, its full species rank seems valid to us.
Detailed analysis of reasonable number of specimens of G. naziri Mirza & Naik and G. kashmirensis Hora show much overlapping in various morphological features. It appears as the distinction between the two was due to the insufficient available material. Now when specimens of different sizes from different localities like the river Haro, Zhob, Kurram, Indus etc. are available, a gradual change in many variables is observed e.g., snout shape, number and form of serrations on dorsal spine and shape of sucker. Serrations on dorsal spine are more prominent and sharply pointed in younger specimens, while in larger specimens, serrations are reduced in size and number. Sucker in younger specimens 34 - 40 mm is regular horse shoe shaped, but in medium sized and larger specimens, it becomes longer than broad and attain U – shape; fin ray count is similar; number, distribution and intensity of tubercles on the body is similar in both the types. Occipital process although very close but not fused to the basal bone of the dorsal fin, although in smaller specimens there is a minute gap between the two which disappears in larger specimens. Thick papillae are present on ventral side of upper lip, on lower lip and on the throat. In younger specimens, these are few in number but they increase in number as the fish grows in size. Moreover there is clear overlapping in other commonly described morphometric parameters. All these observations necessitated the reconsideration of the taxonomic status of G. naziri and G. kashmirensis. After thoroughly examining specimens of various sizes from various localities, we are very much convinced that earlier description of G. naziri might have been based on some young ones of G. kashmirensis and we conclude that G. naziri is the synonym of previously described fish G. kashmirensis.
Kullander et al. (1999) suggested G. punjabensis as the synonym of G. kashmirensis. We disagree with them as the sucker in G. punjabensis clearly
82 M. N. JAVED ET AL BIOLOGIA (PAKISTAN)
extends on the chin up to the lower lip. Taking into account the anterior part of the sucker, its shape becomes like inverted – Y. And this shape is consistent in various size groups. We are of the view that G. punjabensis is the valid species as recognized by Talwar & Jhingran (1991), Jayaram (2010) and Eschmeyer (2013).
Acknowledgement
We are extremely thankful to Mr. M. Zakaria Rauf Butt, Assistant Professor of Zoology, Govt. College Township, Lahore, for providing specimens of G. pectinopterus from the river Kunhar.
REFERENCES
Ahmad, N., 1963. Fish fauna of West Pakistan. Lahore: Government Printing
Press, West Pakistan. Bashir, K. A. & Mirza, M. R., 1975. Fishes of the river Sutlej in Lahore District,
Pakistan, with the description of a new subspecies. Bull. Hydrobiol. Res. Gordon College. 1: 91 – 104.
Bleeker, P., 1855. Nalenzinger op de vischfauna von Sumatra. Visschen van Lahat en sibogha. Nat. Tijdschi. Nederl – India. 9: 275 – 280.
Butt, M. Z., 2002. Fishes of river Kunhar. M. Phil thesis, Department of Zoology, Govt. College University, Lahore.
Day, F., 1877. Fishes of India being a natural history of fishes known to inhabit the seas and freshwaters of of India, Burma and Ceylon. Text and Atlas in 4 parts, London. pp. 778, pls. 195.
Day, F. 1889. The fauna of British India, including Ceylon and Burma. Fishes, 1, 548 pp; 2, 509 pp. London, Tailor and Francis.
Eschmeyer, W., 2013. Catalog of Fishes, California Academy of Sciences, San Francisco, Online Version, Updated 10 June, 2013, accessed on June, 12 2013.
Hamilton, F., 1822. An Account of Fishes found in the river Ganges and its branches: Edinburgh and London. 405 pp, 39 pls. Hora, S. L., 1923. Notes on Fishes in the Indian Museum. V: On the composite
genus Glyptosternon McClelland. Rec. Indian. Mus., 25: 1 – 44. Hora, S. L. & Menon, M. A. S., 1948. Systematic position of three Glyptosternoid
fishes described by Hamilton. Rec. Indian. Mus., 46: 55 – 62. Jayaram, K. C., 1979. Aid to the identification of Siluroid fishes of India, Burma,
Sri Lanka, Pakistan and Bangladesh. Sisoridae, occ. Papers. Zool. Surv. India. 14: 1 – 62.
Jayaram, K. C., 2010. The freshwater fishes of the Indian region. Delhi: 2nd
Ed. Narendra Publishing House, India, pp. 616, plt. 39.
Kullander, S. O., Fang, F., Delling, B. & Ahlander, E., 1999. The fishes of the Kashmir Valley. 98 – 167. In River Jhelum, Kashmir Valley. Impacts on the aquatic environment. Swedmar, Goteborg, 198 pp.
McClelland, J., 1842. On the freshwater fishes collected by William Griffith during his travels from 1835 – 1842. J. Nat. Hist. Calcutta. 2: 560 – 589. Menon, M. A. S., 1954. Notes on the fishes of the genus Glyptothorax Blyth. Rec. Indian. Mus., 52: 27 – 54.
VOL. 59 (1) GLYPTOTHORAX BLYTH (PISCES: SISORIDAE) 83
Mirza, M. R., 1970. A contribution to the fishes of Lahore including revision of classification and addition of new records. Biologia (Pakistan), 16: 71 – 118.
Mirza, M. R., 1990. Freshwater fishes in Pakistan. Urdu Science Board, Lahore, Pakistan. pp.128.
Mirza, M. R., 2003. Checklist of freshwater fishes of Pakistan. Pak. J. Zool. Suppl. Ser. 3: 1 – 30.
Mirza, M. R., Ali, I. & Javed, M. N., 1993. A contribution to the fishes of the Kurram Agency Pakistan. Punj. Uni. J. Zool., 8: 37 – 40. Mirza, M. R. & Hameed, K., 1974. Sisorid Fishes (Osteichthyes, Sisoridae) of Pakistan and Azad Kashmir. Biologia (Pakistan), 20 (1): 83 – 97. Mirza, M. R. & Kashmiri, K. M., 1971. A note on the fishes of the genus
Glyptothorax Blyth (Osteichthyes, Sisoridae) from West Pakistan with the description of a new subspecies. Biologia (Pakistan), 17: 67 – 93.
Mirza, M. R. & Naik, I. U., 1969. Fishes of Zhob District with the description of a new species. Pak. J. Sci., 21: 121 – 125. Mirza, M. R. & Nijssen, H., 1978. Glyptothorax stocki, a new sisorid catfish from
Pakistan and Azad Kashmir (Siluriformes, Sisoridae). Bull. Zool. Mus. (Amsterdam), 6: 79 – 85.
Mirza, M. R., Saleem, M., Adil, S. F. and Waheed, B., 1997. Fish and fisheries of the rive Neelam in Azad Kashmir. Biologia (Pakistan), 43: 27 – 40. Mirza, M. R. & Waheed ud Din, 1976. A note on the fishes of the river Punch in
Azad Kashmir. Pak. J. Zool., 8 (1): 98 – 99. Ng, H. H., 2005. Glyptothorax botius (Hamilton, 1822), a valid species of catfish
(Teleostei: Sisoridae) from northeast India, with notes on the identity of G. telchitta (Hamilton, 1822). Zootaxa 930: 1 - 19.
Rafique, 2000. Fish diversity and distribution in Indus river and its drainage system. Pakistan J. Zool., 32 (4): 301 – 332.
Rashida, Mirza, M. R. & Saleem, M., 1996. A contribution to the systematic and biology of Glyptothorax kashmirensis Hora (Pisces: Sisoridae) from Pakistan Azad Kashmir. Biologia, 42: 59 – 60.
Sufi, S. M. K., 1957. Occurrence of the fishes of the genus Glyptothorax in Peshawar and Hyderabad Divisions of Pakistan. Pakistan j. Sci., 9: 170 – 172.
Sufi, S. M. K., 1963. Checklist of the fishes of the genus Glyptothorax of West Pakistan with records of Glyptothorax platypogonoides (Bleeker) from Peshawar Division (West Pakistan) Biologia, 9 (1): 25 – 27.
Talwar, P. K. & Jhingran, A. G., 1991. Inland Fishes of India and Adjacent Countries, Vol I & II, Oxford and IBH Publishing Company, Pvt. Ltd. New Dehli, Bombay and Calcutta. pp. 1158.
Thomson, A. W. & Page, L. M., 2006. Genera of the Asian catfish families Sisoridae and Erithistidae (Teleostei: Siluriformes) Zootaxa, 1345: 1 – 96
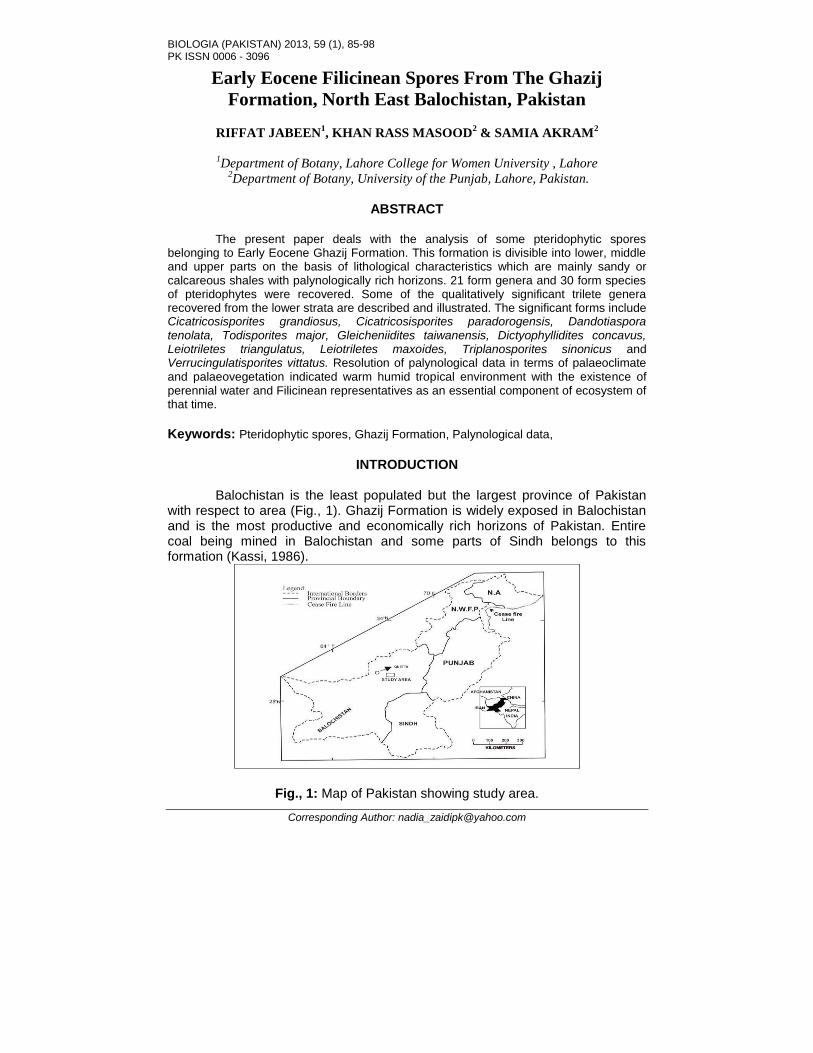
BIOLOGIA (PAKISTAN) 2013, 59 (1), 85-98 PK ISSN 0006 - 3096
Corresponding Author: [email protected]
Early Eocene Filicinean Spores From The Ghazij
Formation, North East Balochistan, Pakistan
RIFFAT JABEEN1, KHAN RASS MASOOD
2 & SAMIA AKRAM
2
1Department of Botany, Lahore College for Women University , Lahore
2Department of Botany, University of the Punjab, Lahore, Pakistan.
ABSTRACT
The present paper deals with the analysis of some pteridophytic spores belonging to Early Eocene Ghazij Formation. This formation is divisible into lower, middle and upper parts on the basis of lithological characteristics which are mainly sandy or calcareous shales with palynologically rich horizons. 21 form genera and 30 form species of pteridophytes were recovered. Some of the qualitatively significant trilete genera recovered from the lower strata are described and illustrated. The significant forms include Cicatricosisporites grandiosus, Cicatricosisporites paradorogensis, Dandotiaspora tenolata, Todisporites major, Gleicheniidites taiwanensis, Dictyophyllidites concavus, Leiotriletes triangulatus, Leiotriletes maxoides, Triplanosporites sinonicus and Verrucingulatisporites vittatus. Resolution of palynological data in terms of palaeoclimate and palaeovegetation indicated warm humid tropical environment with the existence of perennial water and Filicinean representatives as an essential component of ecosystem of that time.
Keywords: Pteridophytic spores, Ghazij Formation, Palynological data,
INTRODUCTION
Balochistan is the least populated but the largest province of Pakistan with respect to area (Fig., 1). Ghazij Formation is widely exposed in Balochistan and is the most productive and economically rich horizons of Pakistan. Entire coal being mined in Balochistan and some parts of Sindh belongs to this formation (Kassi, 1986).
Fig., 1: Map of Pakistan showing study area.
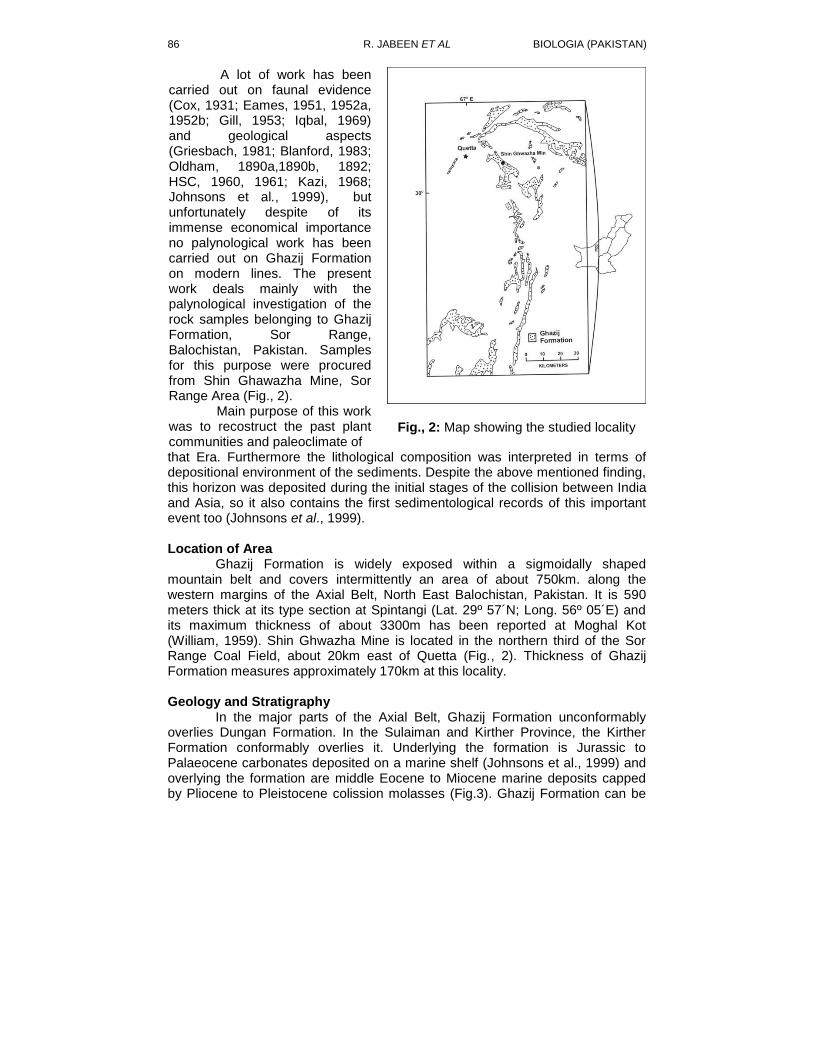
86 R. JABEEN ET AL BIOLOGIA (PAKISTAN)
A lot of work has been carried out on faunal evidence (Cox, 1931; Eames, 1951, 1952a, 1952b; Gill, 1953; Iqbal, 1969) and geological aspects (Griesbach, 1981; Blanford, 1983; Oldham, 1890a,1890b, 1892; HSC, 1960, 1961; Kazi, 1968; Johnsons et al., 1999), but unfortunately despite of its immense economical importance no palynological work has been carried out on Ghazij Formation on modern lines. The present work deals mainly with the palynological investigation of the rock samples belonging to Ghazij Formation, Sor Range, Balochistan, Pakistan. Samples for this purpose were procured from Shin Ghawazha Mine, Sor Range Area (Fig., 2). Main purpose of this work was to recostruct the past plant communities and paleoclimate of
Fig., 2: Map showing the studied locality
that Era. Furthermore the lithological composition was interpreted in terms of depositional environment of the sediments. Despite the above mentioned finding, this horizon was deposited during the initial stages of the collision between India and Asia, so it also contains the first sedimentological records of this important event too (Johnsons et al., 1999). Location of Area
Ghazij Formation is widely exposed within a sigmoidally shaped mountain belt and covers intermittently an area of about 750km. along the western margins of the Axial Belt, North East Balochistan, Pakistan. It is 590 meters thick at its type section at Spintangi (Lat. 29º 57´N; Long. 56º 05´E) and its maximum thickness of about 3300m has been reported at Moghal Kot (William, 1959). Shin Ghwazha Mine is located in the northern third of the Sor Range Coal Field, about 20km east of Quetta (Fig., 2). Thickness of Ghazij Formation measures approximately 170km at this locality.
Geology and Stratigraphy In the major parts of the Axial Belt, Ghazij Formation unconformably overlies Dungan Formation. In the Sulaiman and Kirther Province, the Kirther Formation conformably overlies it. Underlying the formation is Jurassic to Palaeocene carbonates deposited on a marine shelf (Johnsons et al., 1999) and overlying the formation are middle Eocene to Miocene marine deposits capped by Pliocene to Pleistocene colission molasses (Fig.3). Ghazij Formation can be
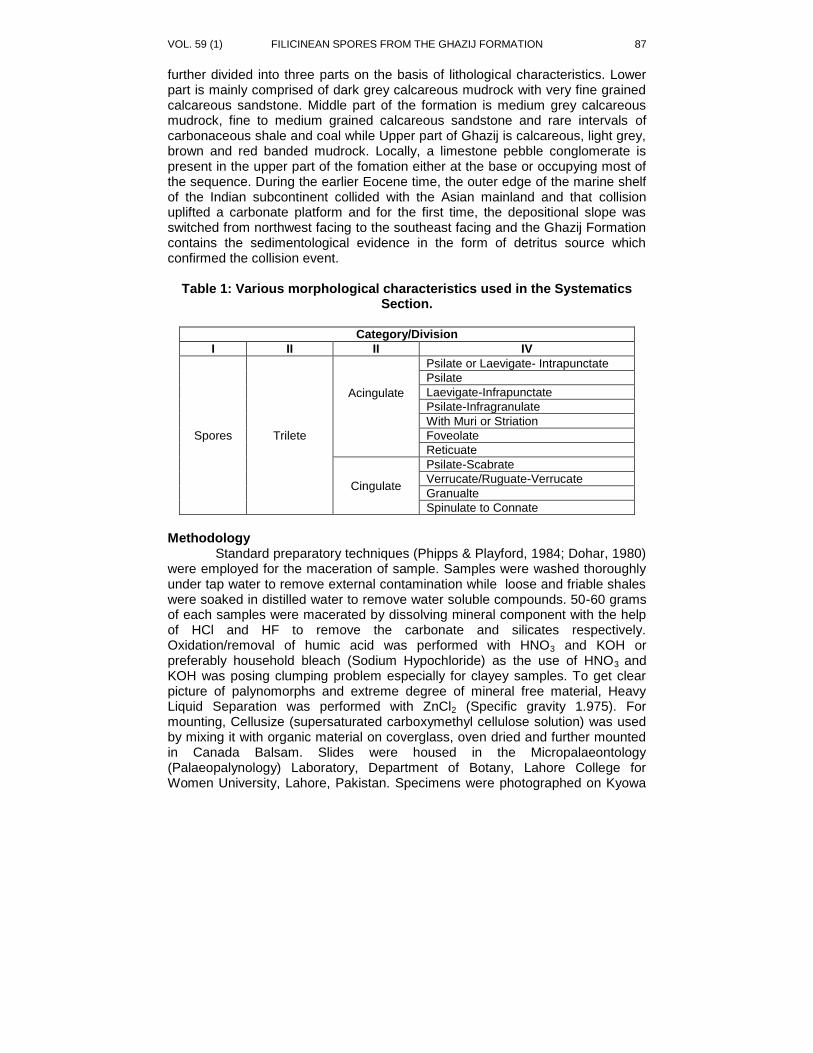
VOL. 59 (1) FILICINEAN SPORES FROM THE GHAZIJ FORMATION 87
further divided into three parts on the basis of lithological characteristics. Lower part is mainly comprised of dark grey calcareous mudrock with very fine grained calcareous sandstone. Middle part of the formation is medium grey calcareous mudrock, fine to medium grained calcareous sandstone and rare intervals of carbonaceous shale and coal while Upper part of Ghazij is calcareous, light grey, brown and red banded mudrock. Locally, a limestone pebble conglomerate is present in the upper part of the fomation either at the base or occupying most of the sequence. During the earlier Eocene time, the outer edge of the marine shelf of the Indian subcontinent collided with the Asian mainland and that collision uplifted a carbonate platform and for the first time, the depositional slope was switched from northwest facing to the southeast facing and the Ghazij Formation contains the sedimentological evidence in the form of detritus source which confirmed the collision event.
Table 1: Various morphological characteristics used in the Systematics Section.
Category/Division
I II II IV
Spores Trilete
Acingulate
Psilate or Laevigate- Intrapunctate
Psilate
Laevigate-Infrapunctate
Psilate-Infragranulate
With Muri or Striation
Foveolate
Reticuate
Cingulate
Psilate-Scabrate
Verrucate/Ruguate-Verrucate
Granualte
Spinulate to Connate
Methodology Standard preparatory techniques (Phipps & Playford, 1984; Dohar, 1980) were employed for the maceration of sample. Samples were washed thoroughly under tap water to remove external contamination while loose and friable shales were soaked in distilled water to remove water soluble compounds. 50-60 grams of each samples were macerated by dissolving mineral component with the help of HCl and HF to remove the carbonate and silicates respectively. Oxidation/removal of humic acid was performed with HNO3 and KOH or preferably household bleach (Sodium Hypochloride) as the use of HNO3 and KOH was posing clumping problem especially for clayey samples. To get clear picture of palynomorphs and extreme degree of mineral free material, Heavy Liquid Separation was performed with ZnCl2 (Specific gravity 1.975). For mounting, Cellusize (supersaturated carboxymethyl cellulose solution) was used by mixing it with organic material on coverglass, oven dried and further mounted in Canada Balsam. Slides were housed in the Micropalaeontology (Palaeopalynology) Laboratory, Department of Botany, Lahore College for Women University, Lahore, Pakistan. Specimens were photographed on Kyowa
88 R. JABEEN ET AL BIOLOGIA (PAKISTAN)
Medilux Trinocular Microscope under X10, X20, X40 and X60 and mostly under XOil objectives on Kodak Panchromatic TMX 100 ASA (21º Din) film. Positive prints were made on Kentmere double weight satin paper. Systematics Individual palynomorph species were identified with the help of major morphological features of the exine. Palynomorphs were divided into various morphological categories on the basis of their structural features like laesurae of spores and colpi of pollen, pores and sacci as defined by Dettmann, (1963). All the technical terms used in the current study are explained in Kremp (1965) and Punt et al., (1994). Lower ranks were constructed according to various taxonomic characteristics like elements and apertures constructions exhibited by them (Table 1). Botanical affinities are provided following the technical description of important trilete genera.
Category I: Spores Category II: Trilete
Category III: Acingulate Category IV Psilate or Laevigate-Intrapunctate
Genus: Leiotriletes (Naumova) Pötonie & Kremp 1954 Type Species: Leiotriletes sphaerotriangulus (Loose) Pötonie & Kremp 1954
Leiotriletes triangulatus (Mürr et pf ex W.Kr) W.Kr Pl. 1 Fig., 10
Dimension: (Equatorial Diameter) 16(25) 30µm Specimens studied: 13 Description: Miospore, trilete, amb triangular, angles rounded, sides straight, lete distinct, arms of lete extending almost to the angles, ray folds infrequent, exine masked by labra which is uniform and straight, exine laevigate 1µm thick. Other Records: This species is a characteristic component of the European sediments. It has also been recorded from the African sediments, Egypt (Shaw, 1999b). This is the first record of the species in the Eocene sediments of Pakistan. Film No. 16/01 Slide No. SG-152/02 Botanical Affinity: Lygodiaceae.
Leiotriletes maxoides, minoris Krutzsch
Pl. 1 Fig. 09 Dimension: (Equatorial Diameter) 40(44) 47µm Specimens studied: 04 Description: Miospore, trilete, amb broadly triangular, angles rounded, sides straight to slightly convex, lete distinct, straight extending 3/4 distance to the periphery, exine laevigate, upto 2µm thick. Other Records: Krutzsch, 1962; Nagy, 1969; Takahashi, 1982; Krutzsch, 1962; Nagy, 1985; Takahashi & Jux, 1986.
Film No: 23/01 Slide No: SG 156/06 Botanical Affinity: Schizaeaceae.
VOL. 59 (1) FILICINEAN SPORES FROM THE GHAZIJ FORMATION 89
Genus: Todisporites Couper 1958 Type Species: Todisporites major Couper 1958
Todisporites major Couper 1958 Pl. 1 Figs. 11, 12
Dimension: (Equatorial Diameter) 68(77) 90µm, 29(36) 45 µm Specimens studied: 11, 20 Description: Miospore, trilete, amb circular to sub-circular, lete distinct, trilete mark relatively long i.e., more than half radius, commissure smooth, labra indistinct, exine laevigate to finely scabrate, secondary foldings not well developed. Other Records: Palaeocene to Eocene: Mikir Formation, Assam (Mehrotra, 1983), Therria and Copili Formations, Assam (Tripathi & Singh, 1985), Palaeocene: Matanomadh, Kachchh (Saxena, 1978), Eocene to Oligocene: Bhuban Farmation, Assam (Rao & Singh, 1987), Eocene: Sabathu Formation, (Sarkar & Singh, 1988), Neogene: Girujan Clay, Assam (Singh & Saxena, 1984), Moran & Nahorkatiya Wells, Assam (Nandi, 1981). Film No: 23/05, 21/05 Slide No: SG 118/08 Botanical Affinity: Osmundaceae.
Genus: Dandotiaspora (Sah, Kar & Singh 1971) Singh et al. 1979 Type Species: Dandotiaspora dialata (Mather) Sah et al. 1971
Dandotiaspora tenolata (Sah et al.) Singh et al. Pl. 1 Fig. 3
Dimension: (Equatorial Diameter) 41(53) 68µm Specimens studied: 10 Description: Miospore, trilete, amb rounded triangular, apices broadly rounded, interapical margins generally straight to slightly convex, arms of the lete distinct, equal, extending more than half equator, narrow, not appreciably raised, uniformly broad or slightly tapering at angles, commissure well recognizable, exine laevigate or intrapunctate, up to 3µm thick, more thickened at apices, contact area distinct and more strongly intrapunctate than any other part, bacterial and fungal attack on exine commonly causing pseudo-ornamentational pattern, exine on distal side regularly thickened especially opposite to trilete mark, appearing as a well developed crescent or may be circular to sub-circular, raised or flat warts with or without continuation towards commissure. Other Records: Palaeocene to Eocene: Therria and Copili Formation, Meghalaya, (Tripathi & Singh, 1985), Palaeocene: Garo Hills, Maghalaya, (Singh et al., 1976), Tura Formation, Maghalaya, (Singh, 1975), Lakadong Sandstone; (Kar & Kumar, 1986), Matanomadh Formation, Kachchh, (Saxena, 1978). Film No. 28/06 Slide No. SG 181/09 Botanical Affinities: The sporomorph closely compares with the spores of Matoniaceae (Singh & Tripathi, 1987).
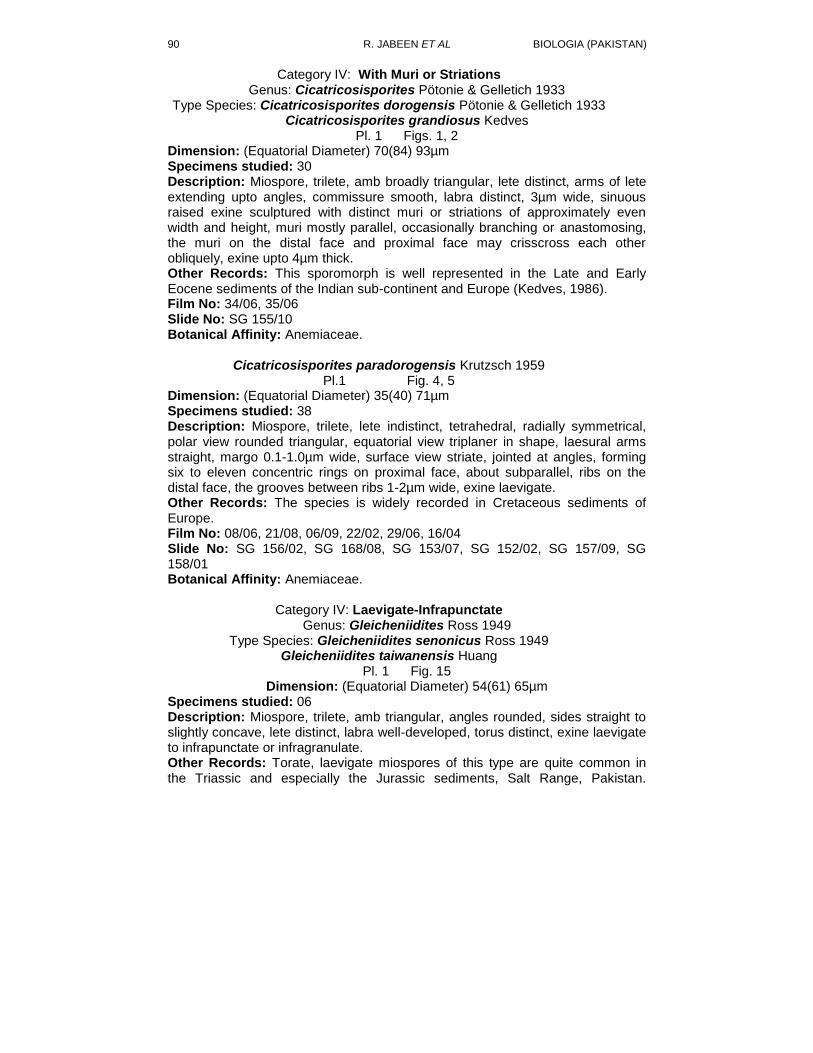
90 R. JABEEN ET AL BIOLOGIA (PAKISTAN)
Category IV: With Muri or Striations Genus: Cicatricosisporites Pötonie & Gelletich 1933
Type Species: Cicatricosisporites dorogensis Pötonie & Gelletich 1933 Cicatricosisporites grandiosus Kedves
Pl. 1 Figs. 1, 2 Dimension: (Equatorial Diameter) 70(84) 93µm Specimens studied: 30 Description: Miospore, trilete, amb broadly triangular, lete distinct, arms of lete extending upto angles, commissure smooth, labra distinct, 3µm wide, sinuous raised exine sculptured with distinct muri or striations of approximately even width and height, muri mostly parallel, occasionally branching or anastomosing, the muri on the distal face and proximal face may crisscross each other obliquely, exine upto 4µm thick. Other Records: This sporomorph is well represented in the Late and Early Eocene sediments of the Indian sub-continent and Europe (Kedves, 1986). Film No: 34/06, 35/06 Slide No: SG 155/10 Botanical Affinity: Anemiaceae.
Cicatricosisporites paradorogensis Krutzsch 1959
Pl.1 Fig. 4, 5 Dimension: (Equatorial Diameter) 35(40) 71µm Specimens studied: 38 Description: Miospore, trilete, lete indistinct, tetrahedral, radially symmetrical, polar view rounded triangular, equatorial view triplaner in shape, laesural arms straight, margo 0.1-1.0µm wide, surface view striate, jointed at angles, forming six to eleven concentric rings on proximal face, about subparallel, ribs on the distal face, the grooves between ribs 1-2µm wide, exine laevigate. Other Records: The species is widely recorded in Cretaceous sediments of Europe. Film No: 08/06, 21/08, 06/09, 22/02, 29/06, 16/04 Slide No: SG 156/02, SG 168/08, SG 153/07, SG 152/02, SG 157/09, SG 158/01 Botanical Affinity: Anemiaceae.
Category IV: Laevigate-Infrapunctate Genus: Gleicheniidites Ross 1949
Type Species: Gleicheniidites senonicus Ross 1949 Gleicheniidites taiwanensis Huang
Pl. 1 Fig. 15 Dimension: (Equatorial Diameter) 54(61) 65µm
Specimens studied: 06 Description: Miospore, trilete, amb triangular, angles rounded, sides straight to slightly concave, lete distinct, labra well-developed, torus distinct, exine laevigate to infrapunctate or infragranulate. Other Records: Torate, laevigate miospores of this type are quite common in the Triassic and especially the Jurassic sediments, Salt Range, Pakistan.
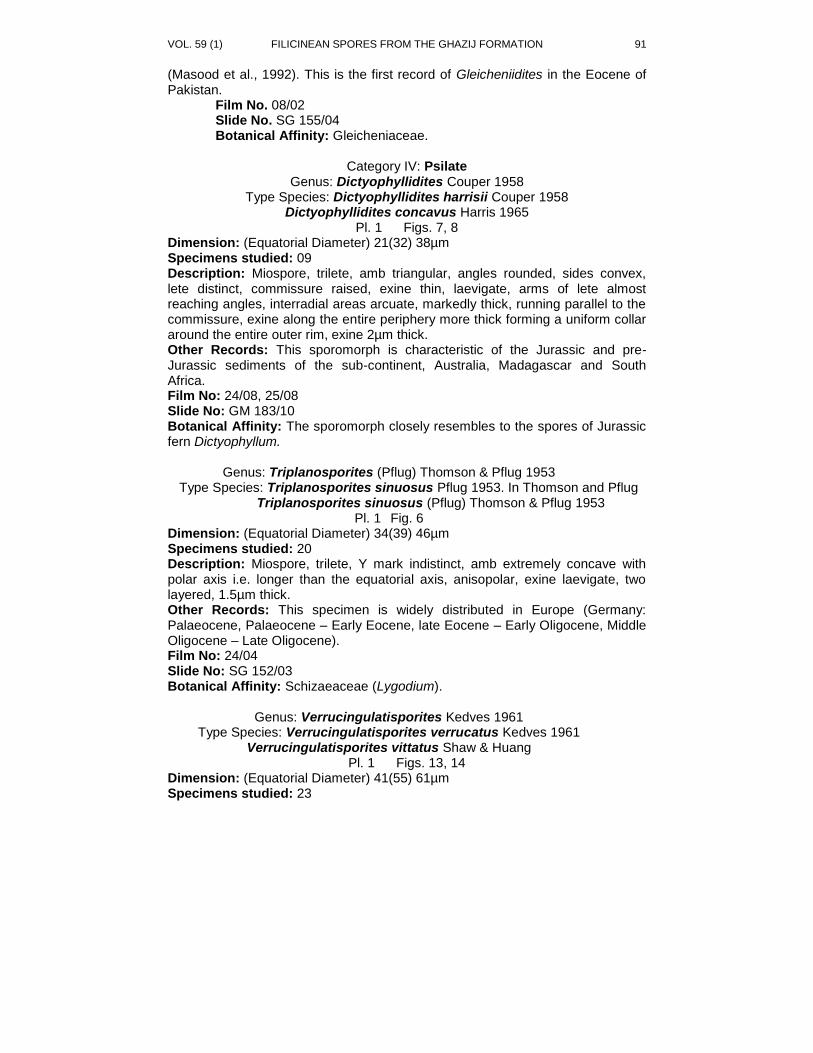
VOL. 59 (1) FILICINEAN SPORES FROM THE GHAZIJ FORMATION 91
(Masood et al., 1992). This is the first record of Gleicheniidites in the Eocene of Pakistan.
Film No. 08/02 Slide No. SG 155/04 Botanical Affinity: Gleicheniaceae.
Category IV: Psilate
Genus: Dictyophyllidites Couper 1958 Type Species: Dictyophyllidites harrisii Couper 1958
Dictyophyllidites concavus Harris 1965 Pl. 1 Figs. 7, 8
Dimension: (Equatorial Diameter) 21(32) 38µm Specimens studied: 09 Description: Miospore, trilete, amb triangular, angles rounded, sides convex, lete distinct, commissure raised, exine thin, laevigate, arms of lete almost reaching angles, interradial areas arcuate, markedly thick, running parallel to the commissure, exine along the entire periphery more thick forming a uniform collar around the entire outer rim, exine 2µm thick. Other Records: This sporomorph is characteristic of the Jurassic and pre-Jurassic sediments of the sub-continent, Australia, Madagascar and South Africa. Film No: 24/08, 25/08 Slide No: GM 183/10 Botanical Affinity: The sporomorph closely resembles to the spores of Jurassic fern Dictyophyllum.
Genus: Triplanosporites (Pflug) Thomson & Pflug 1953
Type Species: Triplanosporites sinuosus Pflug 1953. In Thomson and Pflug Triplanosporites sinuosus (Pflug) Thomson & Pflug 1953
Pl. 1 Fig. 6 Dimension: (Equatorial Diameter) 34(39) 46µm Specimens studied: 20 Description: Miospore, trilete, Y mark indistinct, amb extremely concave with polar axis i.e. longer than the equatorial axis, anisopolar, exine laevigate, two layered, 1.5µm thick. Other Records: This specimen is widely distributed in Europe (Germany: Palaeocene, Palaeocene – Early Eocene, late Eocene – Early Oligocene, Middle Oligocene – Late Oligocene). Film No: 24/04 Slide No: SG 152/03 Botanical Affinity: Schizaeaceae (Lygodium).
Genus: Verrucingulatisporites Kedves 1961
Type Species: Verrucingulatisporites verrucatus Kedves 1961 Verrucingulatisporites vittatus Shaw & Huang
Pl. 1 Figs. 13, 14 Dimension: (Equatorial Diameter) 41(55) 61µm Specimens studied: 23
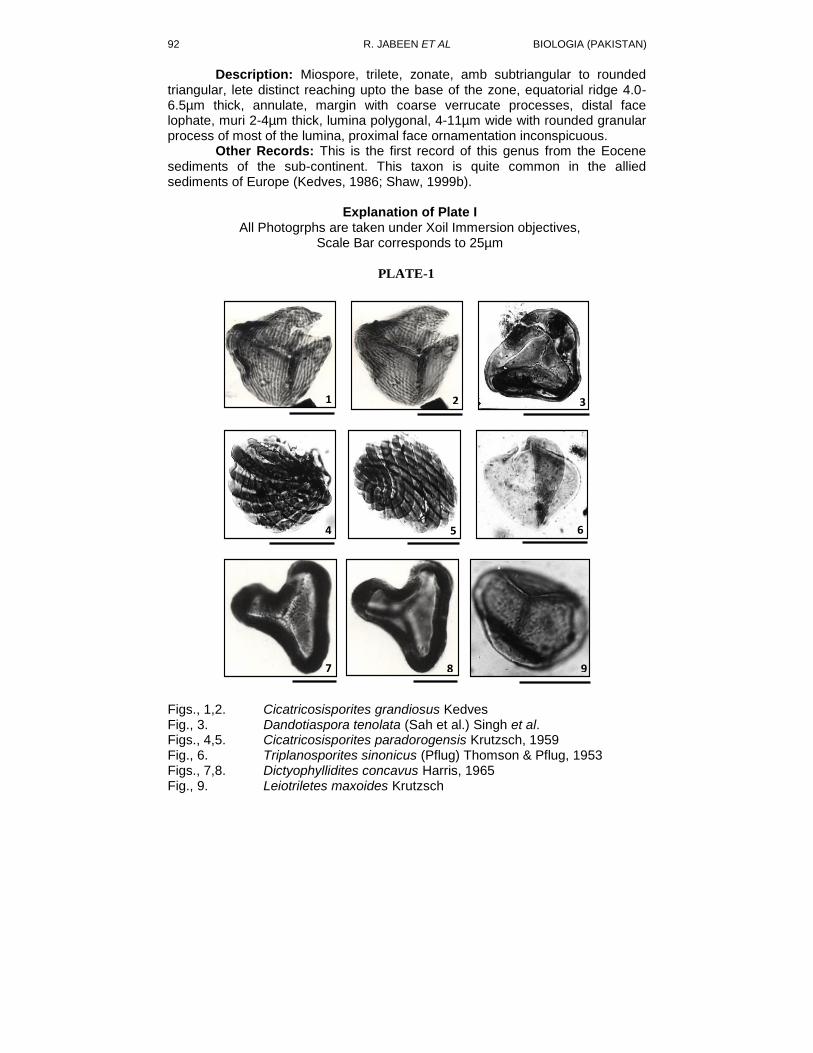
92 R. JABEEN ET AL BIOLOGIA (PAKISTAN)
Description: Miospore, trilete, zonate, amb subtriangular to rounded triangular, lete distinct reaching upto the base of the zone, equatorial ridge 4.0-6.5µm thick, annulate, margin with coarse verrucate processes, distal face lophate, muri 2-4µm thick, lumina polygonal, 4-11µm wide with rounded granular process of most of the lumina, proximal face ornamentation inconspicuous. Other Records: This is the first record of this genus from the Eocene sediments of the sub-continent. This taxon is quite common in the allied sediments of Europe (Kedves, 1986; Shaw, 1999b).
Explanation of Plate I
All Photogrphs are taken under Xoil Immersion objectives, Scale Bar corresponds to 25µm
PLATE-1
1 2 3
4 5 6
7 8 9
10 11 12
13 14 15
Figs., 1,2. Cicatricosisporites grandiosus Kedves Fig., 3. Dandotiaspora tenolata (Sah et al.) Singh et al. Figs., 4,5. Cicatricosisporites paradorogensis Krutzsch, 1959 Fig., 6. Triplanosporites sinonicus (Pflug) Thomson & Pflug, 1953 Figs., 7,8. Dictyophyllidites concavus Harris, 1965 Fig., 9. Leiotriletes maxoides Krutzsch
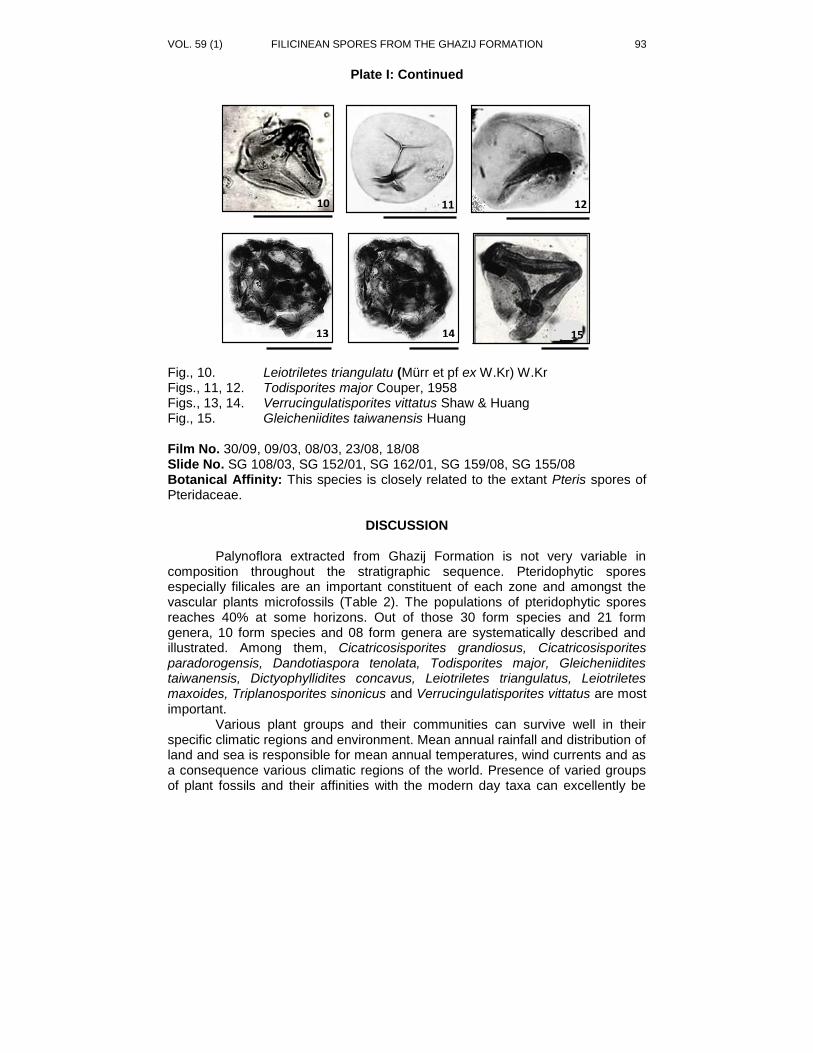
VOL. 59 (1) FILICINEAN SPORES FROM THE GHAZIJ FORMATION 93
Plate I: Continued
PLATE-1
1 2 3
4 5 6
7 8 9
10 11 12
13 14 15
Fig., 10. Leiotriletes triangulatu (Mürr et pf ex W.Kr) W.Kr Figs., 11, 12. Todisporites major Couper, 1958 Figs., 13, 14. Verrucingulatisporites vittatus Shaw & Huang Fig., 15. Gleicheniidites taiwanensis Huang Film No. 30/09, 09/03, 08/03, 23/08, 18/08 Slide No. SG 108/03, SG 152/01, SG 162/01, SG 159/08, SG 155/08 Botanical Affinity: This species is closely related to the extant Pteris spores of Pteridaceae.
DISCUSSION Palynoflora extracted from Ghazij Formation is not very variable in composition throughout the stratigraphic sequence. Pteridophytic spores especially filicales are an important constituent of each zone and amongst the vascular plants microfossils (Table 2). The populations of pteridophytic spores reaches 40% at some horizons. Out of those 30 form species and 21 form genera, 10 form species and 08 form genera are systematically described and illustrated. Among them, Cicatricosisporites grandiosus, Cicatricosisporites paradorogensis, Dandotiaspora tenolata, Todisporites major, Gleicheniidites taiwanensis, Dictyophyllidites concavus, Leiotriletes triangulatus, Leiotriletes maxoides, Triplanosporites sinonicus and Verrucingulatisporites vittatus are most important. Various plant groups and their communities can survive well in their specific climatic regions and environment. Mean annual rainfall and distribution of land and sea is responsible for mean annual temperatures, wind currents and as a consequence various climatic regions of the world. Presence of varied groups of plant fossils and their affinities with the modern day taxa can excellently be
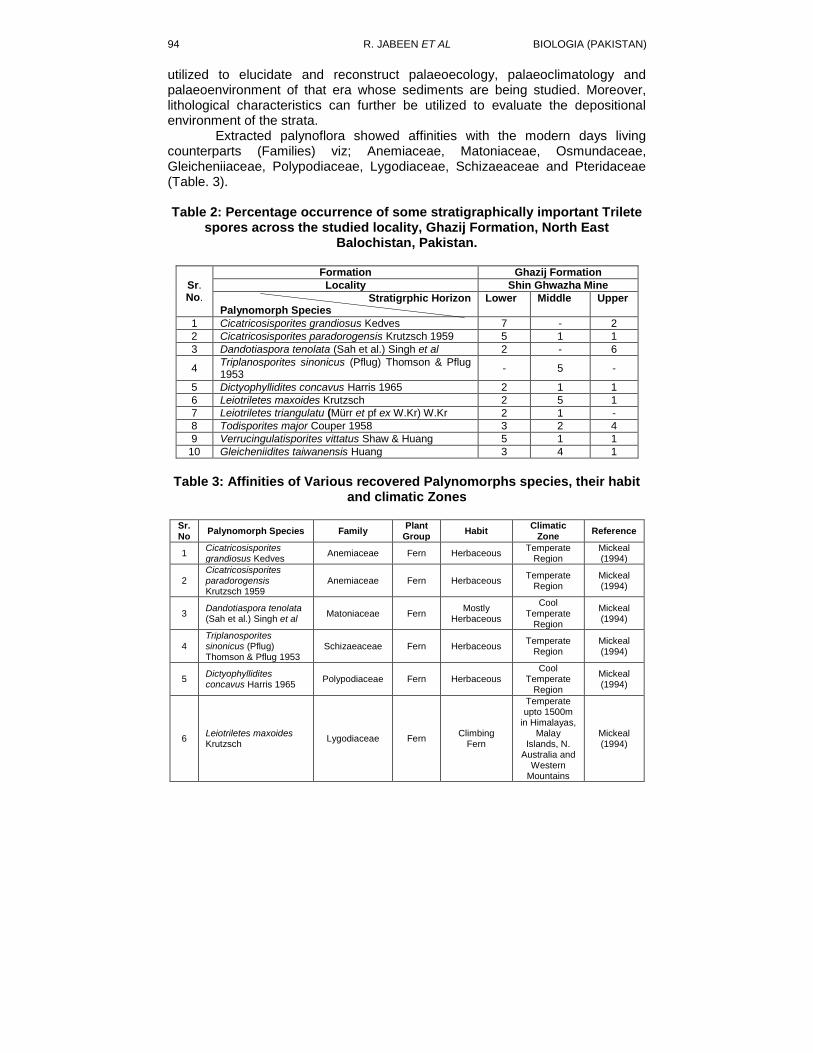
94 R. JABEEN ET AL BIOLOGIA (PAKISTAN)
utilized to elucidate and reconstruct palaeoecology, palaeoclimatology and palaeoenvironment of that era whose sediments are being studied. Moreover, lithological characteristics can further be utilized to evaluate the depositional environment of the strata. Extracted palynoflora showed affinities with the modern days living counterparts (Families) viz; Anemiaceae, Matoniaceae, Osmundaceae, Gleicheniiaceae, Polypodiaceae, Lygodiaceae, Schizaeaceae and Pteridaceae (Table. 3).
Table 2: Percentage occurrence of some stratigraphically important Trilete
spores across the studied locality, Ghazij Formation, North East Balochistan, Pakistan.
Sr. No.
Formation Ghazij Formation
Locality Shin Ghwazha Mine
Stratigrphic Horizon Palynomorph Species
Lower Middle Upper
1 Cicatricosisporites grandiosus Kedves 7 - 2
2 Cicatricosisporites paradorogensis Krutzsch 1959 5 1 1
3 Dandotiaspora tenolata (Sah et al.) Singh et al 2 - 6
4 Triplanosporites sinonicus (Pflug) Thomson & Pflug 1953
- 5 -
5 Dictyophyllidites concavus Harris 1965 2 1 1
6 Leiotriletes maxoides Krutzsch 2 5 1
7 Leiotriletes triangulatu (Mürr et pf ex W.Kr) W.Kr 2 1 -
8 Todisporites major Couper 1958 3 2 4
9 Verrucingulatisporites vittatus Shaw & Huang 5 1 1
10 Gleicheniidites taiwanensis Huang 3 4 1
Table 3: Affinities of Various recovered Palynomorphs species, their habit
and climatic Zones
Sr. No
Palynomorph Species Family Plant
Group Habit
Climatic Zone
Reference
1 Cicatricosisporites grandiosus Kedves
Anemiaceae Fern Herbaceous Temperate
Region Mickeal (1994)
2 Cicatricosisporites paradorogensis Krutzsch 1959
Anemiaceae Fern Herbaceous Temperate
Region Mickeal (1994)
3 Dandotiaspora tenolata (Sah et al.) Singh et al
Matoniaceae Fern Mostly
Herbaceous
Cool Temperate
Region
Mickeal (1994)
4 Triplanosporites sinonicus (Pflug) Thomson & Pflug 1953
Schizaeaceae Fern Herbaceous Temperate
Region Mickeal (1994)
5 Dictyophyllidites concavus Harris 1965
Polypodiaceae Fern Herbaceous Cool
Temperate Region
Mickeal (1994)
6 Leiotriletes maxoides Krutzsch
Lygodiaceae Fern Climbing
Fern
Temperate upto 1500m
in Himalayas, Malay
Islands, N. Australia and
Western Mountains
Mickeal (1994)
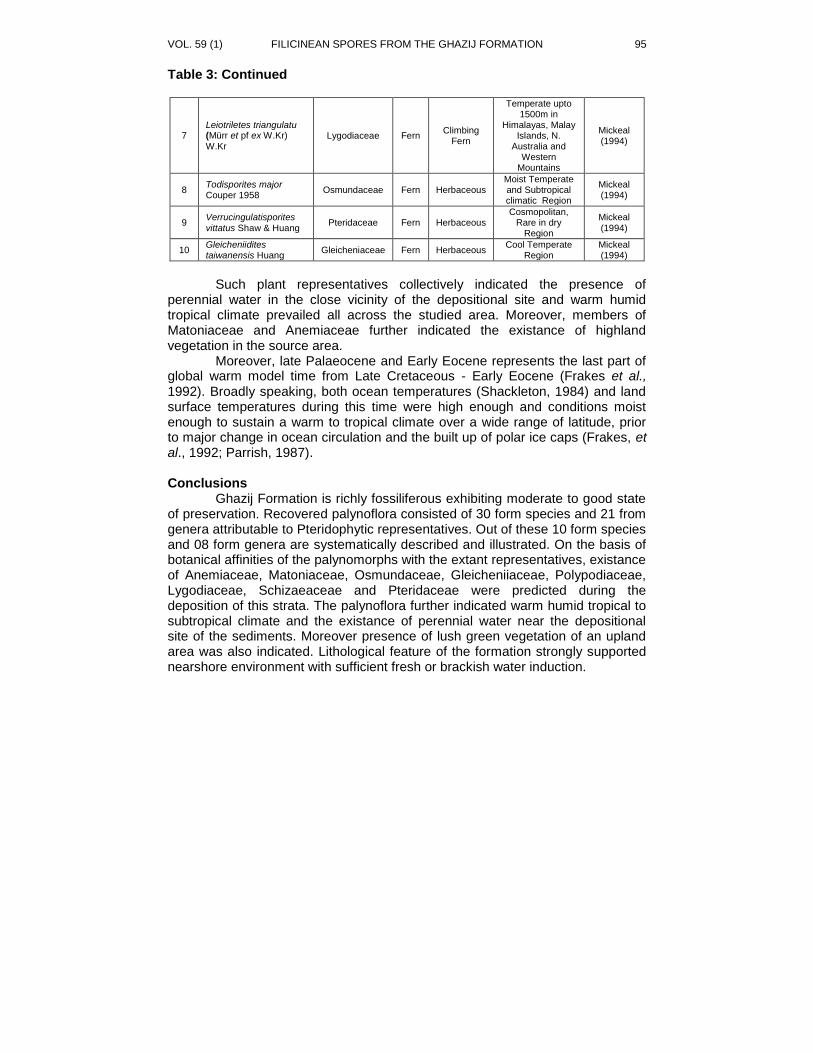
VOL. 59 (1) FILICINEAN SPORES FROM THE GHAZIJ FORMATION 95
Table 3: Continued
7 Leiotriletes triangulatu (Mürr et pf ex W.Kr) W.Kr
Lygodiaceae Fern Climbing
Fern
Temperate upto 1500m in
Himalayas, Malay Islands, N.
Australia and Western
Mountains
Mickeal (1994)
8 Todisporites major Couper 1958
Osmundaceae Fern Herbaceous Moist Temperate and Subtropical climatic Region
Mickeal (1994)
9 Verrucingulatisporites
vittatus Shaw & Huang Pteridaceae Fern Herbaceous
Cosmopolitan, Rare in dry
Region
Mickeal (1994)
10 Gleicheniidites taiwanensis Huang
Gleicheniaceae Fern Herbaceous Cool Temperate
Region Mickeal (1994)
Such plant representatives collectively indicated the presence of perennial water in the close vicinity of the depositional site and warm humid tropical climate prevailed all across the studied area. Moreover, members of Matoniaceae and Anemiaceae further indicated the existance of highland vegetation in the source area. Moreover, late Palaeocene and Early Eocene represents the last part of global warm model time from Late Cretaceous - Early Eocene (Frakes et al., 1992). Broadly speaking, both ocean temperatures (Shackleton, 1984) and land surface temperatures during this time were high enough and conditions moist enough to sustain a warm to tropical climate over a wide range of latitude, prior to major change in ocean circulation and the built up of polar ice caps (Frakes, et al., 1992; Parrish, 1987). Conclusions Ghazij Formation is richly fossiliferous exhibiting moderate to good state of preservation. Recovered palynoflora consisted of 30 form species and 21 from genera attributable to Pteridophytic representatives. Out of these 10 form species and 08 form genera are systematically described and illustrated. On the basis of botanical affinities of the palynomorphs with the extant representatives, existance of Anemiaceae, Matoniaceae, Osmundaceae, Gleicheniiaceae, Polypodiaceae, Lygodiaceae, Schizaeaceae and Pteridaceae were predicted during the deposition of this strata. The palynoflora further indicated warm humid tropical to subtropical climate and the existance of perennial water near the depositional site of the sediments. Moreover presence of lush green vegetation of an upland area was also indicated. Lithological feature of the formation strongly supported nearshore environment with sufficient fresh or brackish water induction.
96 R. JABEEN ET AL BIOLOGIA (PAKISTAN)
REFERENCES
Blanford, W.T., 1883. Geological note on the hills in the neighbourhood of the
Sindh and Punjab frontier between Quetta and Dera Ghazi Khan: Mem. Geol. Sur., India, 20:105-240.
Cox, L.R., 1931. A contribution to the molluscan fauna of the Laki and Basal Kirthar Group of the Indian Eocene: Trans. Roy. Soc., Edinburgh, 57(2): 25-92.
Dettmann, M.E., 1963. Upper Mesozoic microfloras from southeastern Australia. Proc. Roy. Soc., Victoria, 77: 1-148.
Doher, L.I., 1980. Palynomorph preparation procedures currently used in palaeontology and stratigraphy laboratories. U.S.G.S., Circular, 830: 1-27.
Eames, F.E., 1951. A contribution to the study of the Eocene in Western Pakistan and Western India-B, The description of the Lamellibranchia from standard sections in the Rakhi Nala and Zinda Pir areas of the western Punjab and in the Kohat District; Philosophical Transactions of the Royal Society of London, Series B, Biol. Sci., 235 (27): 311-482.
Eames, F.E., 1952a. A contribution to the study of the Eocene in Western Pakistan and Western India; Part A. The geology of standard sections in the Western Punjab and in the Kohat District: Quat. Jour. Geol. Soc., London, 107: 59-171.
Eames, F.E., 1952b. A contribution to the study of Eocene in Western Pakistan and Western India; Part B., Description of the faunas of certain standard sections and their bearing on the classification and correlation of the Eocene in the Western Pakistan and the Western India; Quat. Jour. Geol. Soc., London, 107: 173-200.
Frakes, L.A., Francies, J.E. & Syktus, J.I. 1992. Climate Modes of the Phanerozoic. Chapter 8, The Warm Mode: Late Cretaceous to Early Tertiary. pp. 83-98 (Cambridge University Press) Cambridge.
Gill, W.D., 1953. Facies and fauna of the Bhadrar beds of the Punjab Salt Range, Pakistan; Jour. Palaeont., 27(6): 824-44.
Griesbach, C.L., 1881. Report on the geology of the section between the Bolan Pass in Baluchistan and Girishk in southern Afghanistan: Mem. Geol. Sur. India, 18: 1-60.
Hunting Survey Corporation, Limited, 1960 [1961]. Reconnaissance geology of part of West Pakistan; a Colombo Plan Co-operative Project: Toronto, Canada, Government of Canada; Oshawa, Ontario, Maracle Press, 550 pp.
Iqbal, M.W.A., 1969. Mega-fauna from the Ghazij Formation (Lower Eocene) Quetta Shahrig narea, West Pakistan: Memoir of the Geological Survey of Pakistan, Palaeont. Pakis., 5:.40.
Johnson, E.A., Peter, D.W., Stephan, B.R. & Intizar, H. K., 1999. Lithofacies, Depositional Environments, and Regional Stratigraphy of the Lower Eocene Ghazij Formation, Baluchistan, Pakistan, U.S.G.S., Professional Paper, 1599-1575.
VOL. 59 (1) FILICINEAN SPORES FROM THE GHAZIJ FORMATION 97
Kar, R.K. & Kumar, M., 1986. Neocouperipollis – a new name for Couperipollis Venkatachala and Kar. Palaeobot., 35: 171-174. Lucknow.
Kassi, A.M., 1986. Sandstone petrology of Ghazij Formation of Deghari, Kach, Murree Brewery, and Bibi Nani areas, northeast Baluchistan: Geol. Bull., University of Peshawar, 19: 77-82.
Kazi, A., 1968. Sedimentology of the Ghazij Formation, Harnai, Baluchistan, in Bulman, O.M.B., Nockolds,S.R., and Harland, W.B., eds., Geol. Mag.,: Caxton Hill, England Mimram Books, 105(1): 35-45.
Kremp, G.O.W., 1965. Morphologic Encyclopaedia of Palynology, University Arizona Press, Tucson, Arizona. 263 pp.
Mehrotra, N.C., 1983. Palynology of Mikir Formation in the type area. Jour. Geosci., 4(1): 1-34. Chandigarh.
Mickeal, J., 1994. Ferns for American Gardens. Macmillan Publishing Company, New York. 320 pp.
Nandi, B., 1981. Microfloral investigation on the Neogene formations of Moran and Nahorkatiya wells, Upper Assam, India. Geophyt., 11(1): 27-40; Lucknow.
Oldham, R.D., 1890a. Special report on the most favorable sites for petroleum exploration in the Harnai District Baluchistan: Rec. Geol. Sur. India, 23: 59.
Oldham, R.D., 1890b. Report on the geology and economic resources of the country adjoining the Sindh-Pishin railway between Shahrig and Spintangi, and of the country between it and Khattan: Rec. Geol. Sur. India, 23: 3-110.
Oldham, R.D., 1892. Report on the geology of Thal Chotiali and part of the Mari country: Rec.Geol. Sur. India, 5: 8-29.
Phipps, D. & Playford, G., 1984. Techniques for the extraction of palynomorphs from sediments. Pap. Dep. Geol., University of Queensland, 11(1): 1-33.
Punt, W., Blackmore, S., Nilsson, S. & Le Thomas, A., 1994. Glossary of Pollen and Spore Terminology LPP Contribution Series No. 1, LPP Foundation, Utrecht.
Parrish, J.T., 1987. Global palaeogeography and palaeoclimate of the Late Cretaceous and Early Tertiary. In: Friis, E.M., Chaloner, W.G. and Crane, P.R. (eds.): The origins of angiosperms and their biological consequences. 51-73 (Cambridge University Press) Cambridge.
Sarkar, S. & Singh, H.P. 1988. Palynological investigation of Subathu Formation (Eocene) in the Banethi-Bagthin area of Himachal Pradesh. Palaeontograph. Abt. B, 209: 29-109; Stuttgart.
Saxena, R.K., 1978. Palynology of the Matanomadh Formation in type area, northwestern Kutch, India (Part-1) Systematic Description of Pteridophytic spores. Palaeobot., 25: 416-448.
Shaw, R.C.L., 1999b. Eocene Palynomorphs of Taiwan-Pteridophytic spores. Taiwania, 44(2): 230-258.
Singh, H.P. & Saxena, R.K., 1984. Palynology of the Neogene sediments of Jorajan well Upper Assam. Cur. Tre. Life Sci., 10: 613-631; New Delhi.
Tripathi, S.K.M. & Singh, H.P., 1985. Palynology of Jaintia group (Palaeocene-Eocene) exposed along Jowai-Ronapur Road, Meghalaya India (Part-I) Systematic Palynology. Geophytol., 5(2): 164-187; Lucknow.

98 R. JABEEN ET AL BIOLOGIA (PAKISTAN)
Williams, M.D., 1959. Stratigraphy of the Lower Indus Basin, West Pakistan: Proceedings of the fifth World Petroleum Congress, Geol. & Geophy., Section I, Paper 19: 377-394.
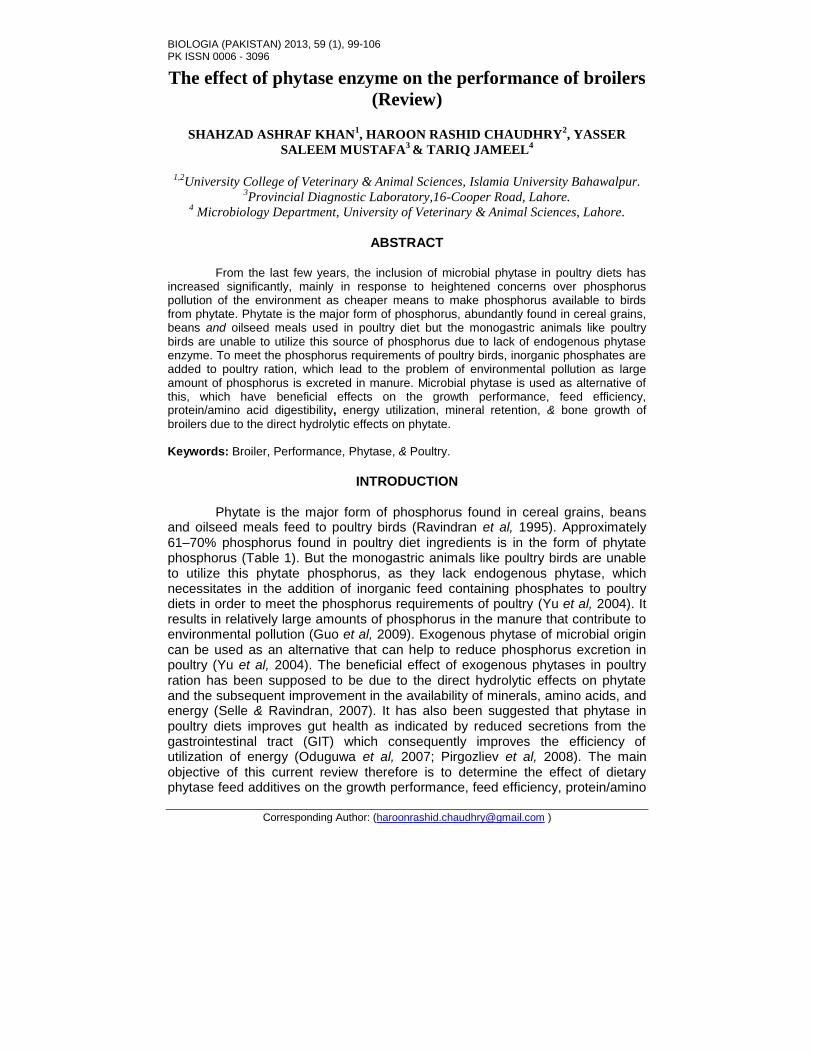
BIOLOGIA (PAKISTAN) 2013, 59 (1), 99-106 PK ISSN 0006 - 3096
Corresponding Author: ([email protected] )
The effect of phytase enzyme on the performance of broilers
(Review)
SHAHZAD ASHRAF KHAN1, HAROON RASHID CHAUDHRY
2, YASSER
SALEEM MUSTAFA3 & TARIQ JAMEEL
4
1,2
University College of Veterinary & Animal Sciences, Islamia University Bahawalpur. 3Provincial Diagnostic Laboratory,16-Cooper Road, Lahore.
4 Microbiology Department, University of Veterinary & Animal Sciences, Lahore.
ABSTRACT
From the last few years, the inclusion of microbial phytase in poultry diets has
increased significantly, mainly in response to heightened concerns over phosphorus pollution of the environment as cheaper means to make phosphorus available to birds from phytate. Phytate is the major form of phosphorus, abundantly found in cereal grains, beans and oilseed meals used in poultry diet but the monogastric animals like poultry birds are unable to utilize this source of phosphorus due to lack of endogenous phytase enzyme. To meet the phosphorus requirements of poultry birds, inorganic phosphates are added to poultry ration, which lead to the problem of environmental pollution as large amount of phosphorus is excreted in manure. Microbial phytase is used as alternative of this, which have beneficial effects on the growth performance, feed efficiency, protein/amino acid digestibility, energy utilization, mineral retention, & bone growth of
broilers due to the direct hydrolytic effects on phytate. Keywords: Broiler, Performance, Phytase, & Poultry.
INTRODUCTION
Phytate is the major form of phosphorus found in cereal grains, beans
and oilseed meals feed to poultry birds (Ravindran et al, 1995). Approximately 61–70% phosphorus found in poultry diet ingredients is in the form of phytate phosphorus (Table 1). But the monogastric animals like poultry birds are unable to utilize this phytate phosphorus, as they lack endogenous phytase, which necessitates in the addition of inorganic feed containing phosphates to poultry diets in order to meet the phosphorus requirements of poultry (Yu et al, 2004). It results in relatively large amounts of phosphorus in the manure that contribute to environmental pollution (Guo et al, 2009). Exogenous phytase of microbial origin can be used as an alternative that can help to reduce phosphorus excretion in poultry (Yu et al, 2004). The beneficial effect of exogenous phytases in poultry ration has been supposed to be due to the direct hydrolytic effects on phytate and the subsequent improvement in the availability of minerals, amino acids, and energy (Selle & Ravindran, 2007). It has also been suggested that phytase in poultry diets improves gut health as indicated by reduced secretions from the gastrointestinal tract (GIT) which consequently improves the efficiency of utilization of energy (Oduguwa et al, 2007; Pirgozliev et al, 2008). The main objective of this current review therefore is to determine the effect of dietary phytase feed additives on the growth performance, feed efficiency, protein/amino
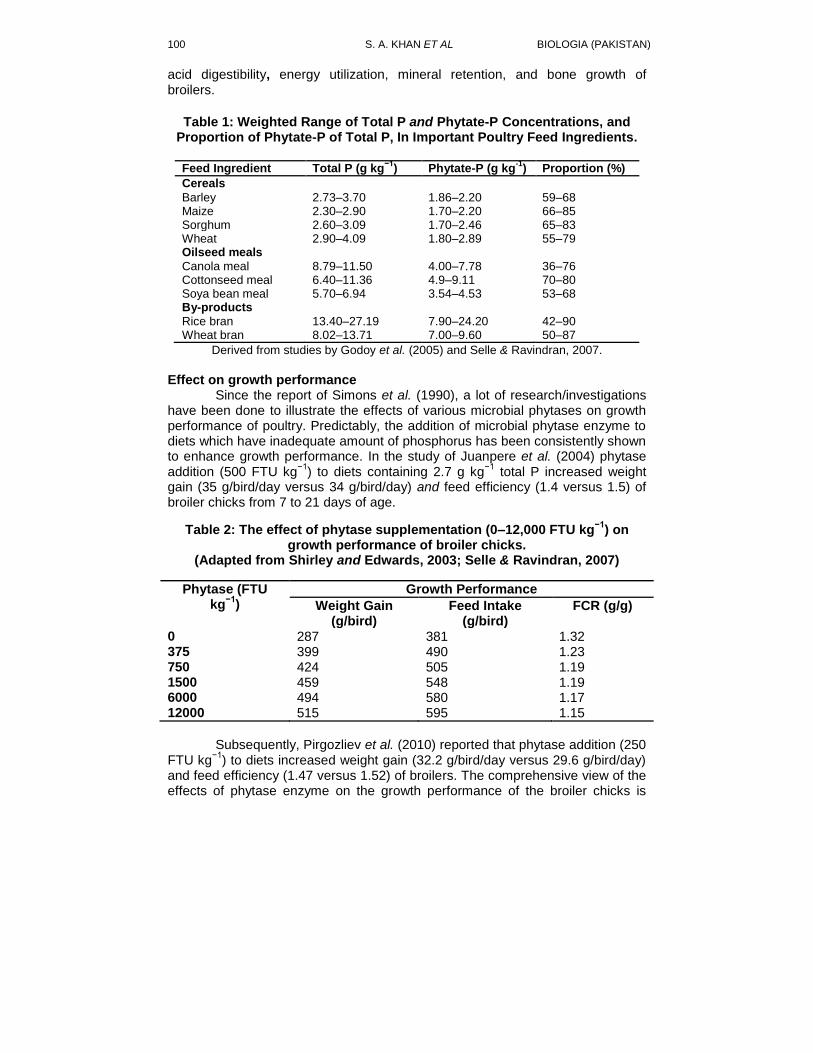
100 S. A. KHAN ET AL BIOLOGIA (PAKISTAN)
acid digestibility, energy utilization, mineral retention, and bone growth of broilers.
Table 1: Weighted Range of Total P and Phytate-P Concentrations, and
Proportion of Phytate-P of Total P, In Important Poultry Feed Ingredients.
Feed Ingredient Total P (g kg−1
) Phytate-P (g kg-1
) Proportion (%)
Cereals Barley 2.73–3.70 1.86–2.20 59–68 Maize 2.30–2.90 1.70–2.20 66–85 Sorghum 2.60–3.09 1.70–2.46 65–83 Wheat 2.90–4.09 1.80–2.89 55–79 Oilseed meals
Canola meal 8.79–11.50 4.00–7.78 36–76 Cottonseed meal 6.40–11.36 4.9–9.11 70–80 Soya bean meal 5.70–6.94 3.54–4.53 53–68 By-products
Rice bran 13.40–27.19 7.90–24.20 42–90 Wheat bran 8.02–13.71 7.00–9.60 50–87
Derived from studies by Godoy et al. (2005) and Selle & Ravindran, 2007.
Effect on growth performance
Since the report of Simons et al. (1990), a lot of research/investigations have been done to illustrate the effects of various microbial phytases on growth performance of poultry. Predictably, the addition of microbial phytase enzyme to diets which have inadequate amount of phosphorus has been consistently shown to enhance growth performance. In the study of Juanpere et al. (2004) phytase addition (500 FTU kg
−1) to diets containing 2.7 g kg
−1 total P increased weight
gain (35 g/bird/day versus 34 g/bird/day) and feed efficiency (1.4 versus 1.5) of broiler chicks from 7 to 21 days of age.
Table 2: The effect of phytase supplementation (0–12,000 FTU kg−1
) on growth performance of broiler chicks.
(Adapted from Shirley and Edwards, 2003; Selle & Ravindran, 2007)
Phytase (FTU kg
−1)
Growth Performance
Weight Gain (g/bird)
Feed Intake (g/bird)
FCR (g/g)
0 287 381 1.32 375 399 490 1.23 750 424 505 1.19 1500 459 548 1.19 6000 494 580 1.17 12000 515 595 1.15
Subsequently, Pirgozliev et al. (2010) reported that phytase addition (250
FTU kg−1
) to diets increased weight gain (32.2 g/bird/day versus 29.6 g/bird/day) and feed efficiency (1.47 versus 1.52) of broilers. The comprehensive view of the effects of phytase enzyme on the growth performance of the broiler chicks is
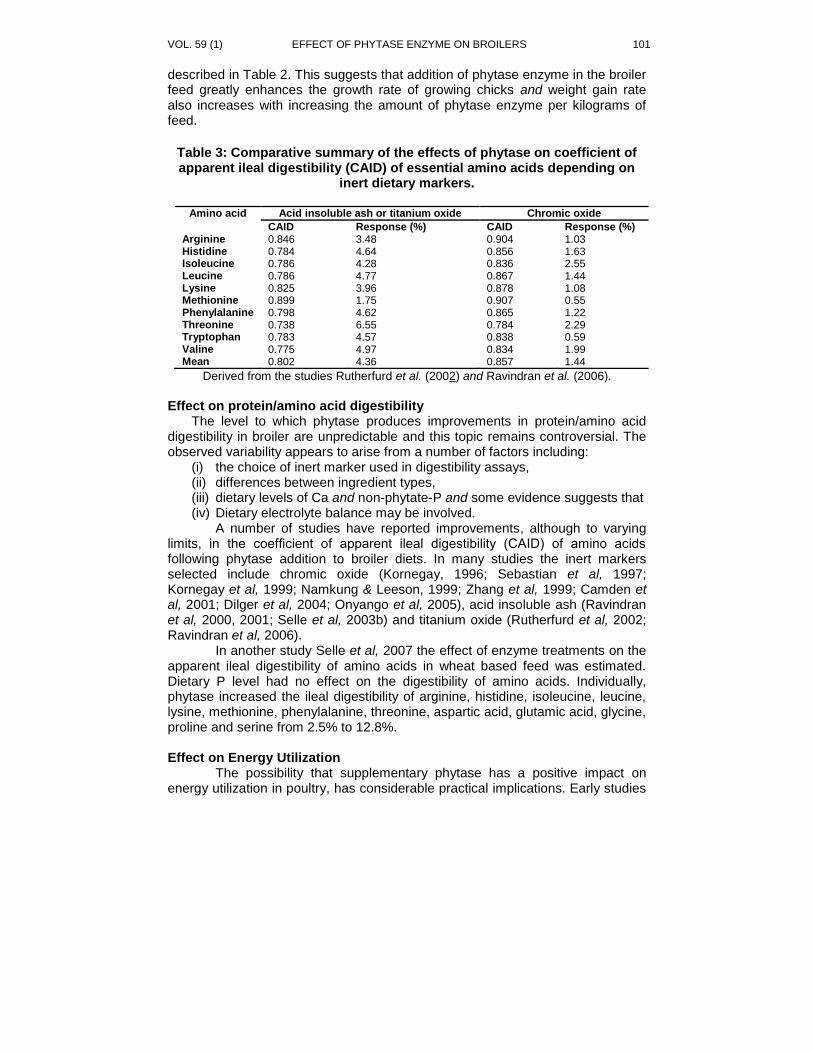
VOL. 59 (1) EFFECT OF PHYTASE ENZYME ON BROILERS 101
described in Table 2. This suggests that addition of phytase enzyme in the broiler feed greatly enhances the growth rate of growing chicks and weight gain rate also increases with increasing the amount of phytase enzyme per kilograms of feed.
Table 3: Comparative summary of the effects of phytase on coefficient of apparent ileal digestibility (CAID) of essential amino acids depending on
inert dietary markers.
Amino acid Acid insoluble ash or titanium oxide Chromic oxide
CAID Response (%) CAID Response (%) Arginine 0.846 3.48 0.904 1.03 Histidine 0.784 4.64 0.856 1.63 Isoleucine 0.786 4.28 0.836 2.55 Leucine 0.786 4.77 0.867 1.44 Lysine 0.825 3.96 0.878 1.08 Methionine 0.899 1.75 0.907 0.55 Phenylalanine 0.798 4.62 0.865 1.22 Threonine 0.738 6.55 0.784 2.29 Tryptophan 0.783 4.57 0.838 0.59 Valine 0.775 4.97 0.834 1.99 Mean 0.802 4.36 0.857 1.44
Derived from the studies Rutherfurd et al. (2002) and Ravindran et al. (2006).
Effect on protein/amino acid digestibility
The level to which phytase produces improvements in protein/amino acid digestibility in broiler are unpredictable and this topic remains controversial. The observed variability appears to arise from a number of factors including:
(i) the choice of inert marker used in digestibility assays, (ii) differences between ingredient types, (iii) dietary levels of Ca and non-phytate-P and some evidence suggests that (iv) Dietary electrolyte balance may be involved.
A number of studies have reported improvements, although to varying limits, in the coefficient of apparent ileal digestibility (CAID) of amino acids following phytase addition to broiler diets. In many studies the inert markers selected include chromic oxide (Kornegay, 1996; Sebastian et al, 1997; Kornegay et al, 1999; Namkung & Leeson, 1999; Zhang et al, 1999; Camden et al, 2001; Dilger et al, 2004; Onyango et al, 2005), acid insoluble ash (Ravindran et al, 2000, 2001; Selle et al, 2003b) and titanium oxide (Rutherfurd et al, 2002; Ravindran et al, 2006).
In another study Selle et al, 2007 the effect of enzyme treatments on the apparent ileal digestibility of amino acids in wheat based feed was estimated. Dietary P level had no effect on the digestibility of amino acids. Individually, phytase increased the ileal digestibility of arginine, histidine, isoleucine, leucine, lysine, methionine, phenylalanine, threonine, aspartic acid, glutamic acid, glycine, proline and serine from 2.5% to 12.8%.
Effect on Energy Utilization
The possibility that supplementary phytase has a positive impact on energy utilization in poultry, has considerable practical implications. Early studies
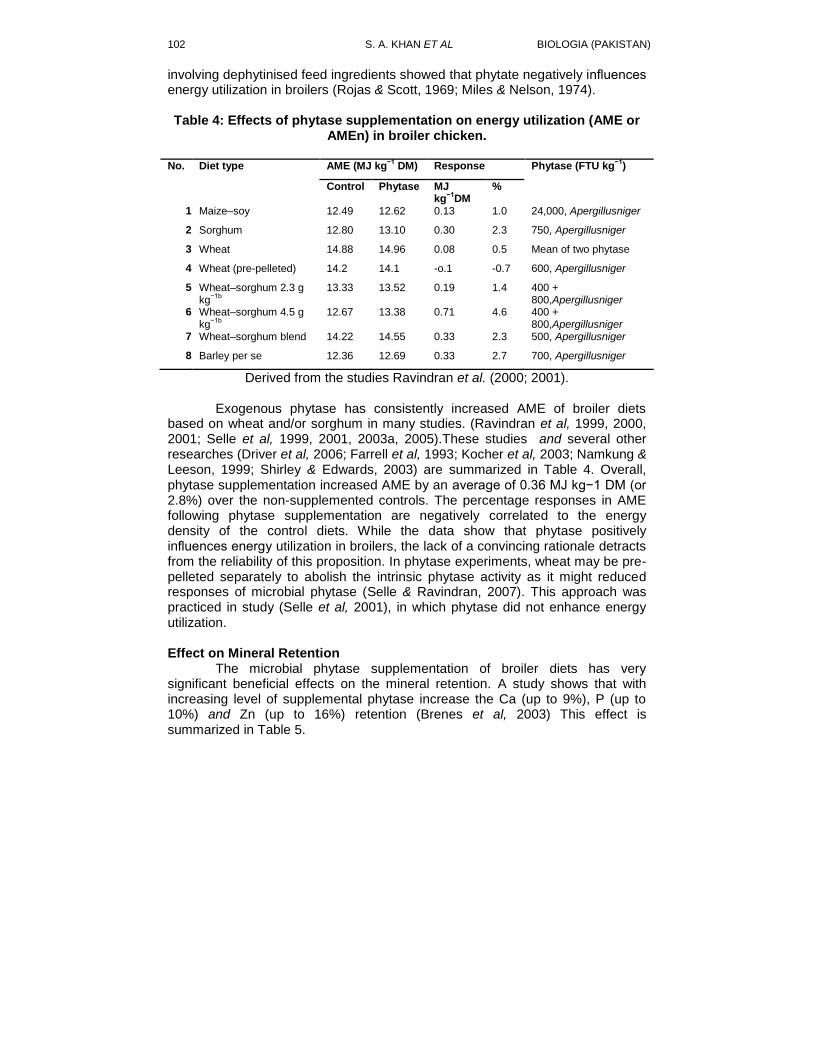
102 S. A. KHAN ET AL BIOLOGIA (PAKISTAN)
involving dephytinised feed ingredients showed that phytate negatively influences energy utilization in broilers (Rojas & Scott, 1969; Miles & Nelson, 1974).
Table 4: Effects of phytase supplementation on energy utilization (AME or
AMEn) in broiler chicken.
No. Diet type AME (MJ kg−1
DM) Response Phytase (FTU kg−1
)
Control Phytase MJ kg
−1DM
%
1. Maize–soy 12.49 12.62 0.13 1.0 24,000, Apergillusniger
2. Sorghum 12.80 13.10 0.30 2.3 750, Apergillusniger
3. Wheat 14.88 14.96 0.08 0.5 Mean of two phytase
4. Wheat (pre-pelleted) 14.2 14.1 -o.1 -0.7 600, Apergillusniger
5. Wheat–sorghum 2.3 g kg
−1b
13.33 13.52 0.19 1.4 400 + 800,Apergillusniger
6. Wheat–sorghum 4.5 g kg
−1b
12.67 13.38 0.71 4.6 400 + 800,Apergillusniger
7. Wheat–sorghum blend 14.22 14.55 0.33 2.3 500, Apergillusniger
8. Barley per se 12.36 12.69 0.33 2.7 700, Apergillusniger
Derived from the studies Ravindran et al. (2000; 2001).
Exogenous phytase has consistently increased AME of broiler diets based on wheat and/or sorghum in many studies. (Ravindran et al, 1999, 2000, 2001; Selle et al, 1999, 2001, 2003a, 2005).These studies and several other researches (Driver et al, 2006; Farrell et al, 1993; Kocher et al, 2003; Namkung & Leeson, 1999; Shirley & Edwards, 2003) are summarized in Table 4. Overall, phytase supplementation increased AME by an average of 0.36 MJ kg−1 DM (or 2.8%) over the non-supplemented controls. The percentage responses in AME following phytase supplementation are negatively correlated to the energy density of the control diets. While the data show that phytase positively influences energy utilization in broilers, the lack of a convincing rationale detracts from the reliability of this proposition. In phytase experiments, wheat may be pre-pelleted separately to abolish the intrinsic phytase activity as it might reduced responses of microbial phytase (Selle & Ravindran, 2007). This approach was practiced in study (Selle et al, 2001), in which phytase did not enhance energy utilization.
Effect on Mineral Retention
The microbial phytase supplementation of broiler diets has very significant beneficial effects on the mineral retention. A study shows that with increasing level of supplemental phytase increase the Ca (up to 9%), P (up to 10%) and Zn (up to 16%) retention (Brenes et al, 2003) This effect is summarized in Table 5.
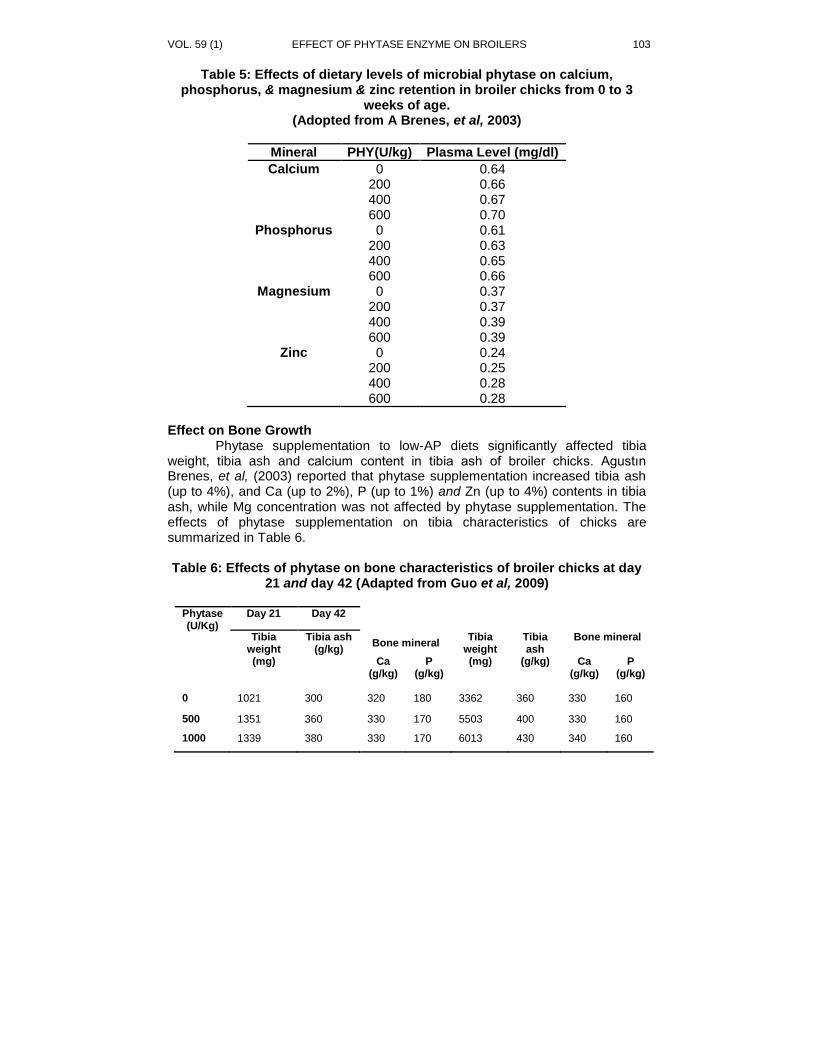
VOL. 59 (1) EFFECT OF PHYTASE ENZYME ON BROILERS 103
Table 5: Effects of dietary levels of microbial phytase on calcium, phosphorus, & magnesium & zinc retention in broiler chicks from 0 to 3
weeks of age. (Adopted from A Brenes, et al, 2003)
Mineral PHY(U/kg) Plasma Level (mg/dl)
Calcium 0 0.64 200 0.66 400 0.67 600 0.70
Phosphorus 0 0.61 200 0.63 400 0.65 600 0.66
Magnesium 0 0.37 200 0.37 400 0.39 600 0.39
Zinc 0 0.24 200 0.25 400 0.28 600 0.28
Effect on Bone Growth
Phytase supplementation to low-AP diets significantly affected tibia weight, tibia ash and calcium content in tibia ash of broiler chicks. Agustın Brenes, et al, (2003) reported that phytase supplementation increased tibia ash (up to 4%), and Ca (up to 2%), P (up to 1%) and Zn (up to 4%) contents in tibia ash, while Mg concentration was not affected by phytase supplementation. The effects of phytase supplementation on tibia characteristics of chicks are summarized in Table 6. Table 6: Effects of phytase on bone characteristics of broiler chicks at day
21 and day 42 (Adapted from Guo et al, 2009)
Phytase (U/Kg)
Day 21 Day 42
Tibia weight (mg)
Tibia ash (g/kg)
Bone mineral Tibia
weight (mg)
Tibia ash
(g/kg)
Bone mineral
Ca (g/kg)
P (g/kg)
Ca (g/kg)
P (g/kg)
0 1021 300 320 180 3362 360 330 160
500 1351 360 330 170 5503 400 330 160
1000 1339 380 330 170 6013 430 340 160
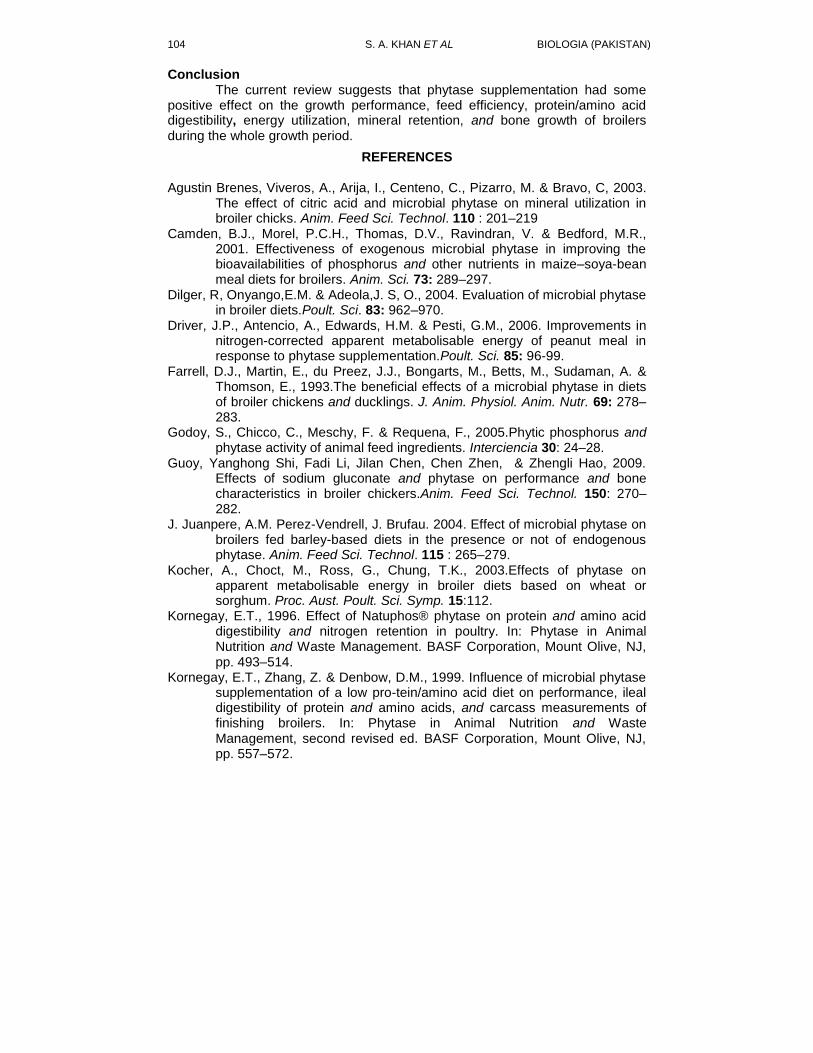
104 S. A. KHAN ET AL BIOLOGIA (PAKISTAN)
Conclusion The current review suggests that phytase supplementation had some
positive effect on the growth performance, feed efficiency, protein/amino acid digestibility, energy utilization, mineral retention, and bone growth of broilers during the whole growth period.
REFERENCES Agustin Brenes, Viveros, A., Arija, I., Centeno, C., Pizarro, M. & Bravo, C, 2003.
The effect of citric acid and microbial phytase on mineral utilization in broiler chicks. Anim. Feed Sci. Technol. 110 : 201–219
Camden, B.J., Morel, P.C.H., Thomas, D.V., Ravindran, V. & Bedford, M.R., 2001. Effectiveness of exogenous microbial phytase in improving the bioavailabilities of phosphorus and other nutrients in maize–soya-bean meal diets for broilers. Anim. Sci. 73: 289–297.
Dilger, R, Onyango,E.M. & Adeola,J. S, O., 2004. Evaluation of microbial phytase in broiler diets.Poult. Sci. 83: 962–970.
Driver, J.P., Antencio, A., Edwards, H.M. & Pesti, G.M., 2006. Improvements in nitrogen-corrected apparent metabolisable energy of peanut meal in response to phytase supplementation.Poult. Sci. 85: 96-99.
Farrell, D.J., Martin, E., du Preez, J.J., Bongarts, M., Betts, M., Sudaman, A. & Thomson, E., 1993.The beneficial effects of a microbial phytase in diets of broiler chickens and ducklings. J. Anim. Physiol. Anim. Nutr. 69: 278–283.
Godoy, S., Chicco, C., Meschy, F. & Requena, F., 2005.Phytic phosphorus and phytase activity of animal feed ingredients. Interciencia 30: 24–28.
Guoy, Yanghong Shi, Fadi Li, Jilan Chen, Chen Zhen, & Zhengli Hao, 2009. Effects of sodium gluconate and phytase on performance and bone characteristics in broiler chickers.Anim. Feed Sci. Technol. 150: 270–282.
J. Juanpere, A.M. Perez-Vendrell, J. Brufau. 2004. Effect of microbial phytase on broilers fed barley-based diets in the presence or not of endogenous phytase. Anim. Feed Sci. Technol. 115 : 265–279.
Kocher, A., Choct, M., Ross, G., Chung, T.K., 2003.Effects of phytase on apparent metabolisable energy in broiler diets based on wheat or sorghum. Proc. Aust. Poult. Sci. Symp. 15:112.
Kornegay, E.T., 1996. Effect of Natuphos® phytase on protein and amino acid digestibility and nitrogen retention in poultry. In: Phytase in Animal Nutrition and Waste Management. BASF Corporation, Mount Olive, NJ, pp. 493–514.
Kornegay, E.T., Zhang, Z. & Denbow, D.M., 1999. Influence of microbial phytase supplementation of a low pro-tein/amino acid diet on performance, ileal digestibility of protein and amino acids, and carcass measurements of finishing broilers. In: Phytase in Animal Nutrition and Waste Management, second revised ed. BASF Corporation, Mount Olive, NJ, pp. 557–572.
VOL. 59 (1) EFFECT OF PHYTASE ENZYME ON BROILERS 105
Miles, R.D. & Nelson, T.S., 1974. The effect of enzymatic hydrolysis of phytate on the available energy content of feed ingredients for chickens and rats. Poult. Sci. 53: 1714–1717.
Namkung, H. & Leeson, S., 1999. Effect of phytase enzyme on dietary nitrogen-corrected apparent metabolisable energy and the ileal digestibility of nitrogen and amino acids.Poult. Sci. 78: 1317–1319.
Oduguwa, O., Pirgozliev, V. & Acamovic, T., 2007. Energy metabolizability and digestibility of amino acids by broilers fed malted sorghum sprouts supplemented with polyethylene glycol, charcoal, phytase and xylanase. Brit. Poult. Sci. 48: 55–63.
Onyango, E.M., Bedford, M.R. & Adeola, O., 2005. Efficacy of an evolved Escherichia coliphytase in diets for broiler chicks.Poult. Sci. 84: 248–255.
Pirgozliev, V., Oduguwa, O., Acamovic, T., & Bedford, M.R., 2008. Effects of dietary phytase on performance and nutrient metabolism in chickens.Brit. Poult. Sci. 49: 144–154.
Pirgozliev V., F. Karadas, A. Pappas, Acamovic, T. & Bedford, M.R., 2010. The effect on performance, energy metabolism and hepatic carotenoid content when phytase supplemented diets were fed to broiler chickens. Vet. Sci. 89: 203–205.
Ravindran, V., Ravindran, G. & Sivalogan, S., 1994.Total and phytate phosphorus contents of various foods and feedstuffs of plant origin. Food Chem. 50: 133–136.
Ravindran, V., Bryden, L.W. & Kornegay, E.T., 1995.Phytates: occurrence, bioavailability and implications in poultry nutrition. Poult. Avian Biol. Rev. 6: 125–143.
Ravindran, V., Selle, P.H. & Bryden, W.L., 1999. Effects of phytase supplementation, individually and in combi-nation, on the nutritive value of wheat and barley.Poult. Sci. 78: 1588–1595.
Ravindran, V., Cabahug, S., Ravindran, G., Selle, P.H. & Bryden, W.L., 2000. Response of broiler chickens to microbial phytase supplementation as influenced by dietary phytic acid and non-phytate phosphorus levels. II. Effects on apparent metabolisable energy, nutrient digestibility and nutrient retention. Brit. Poult. Sci. 41:193–200.
Ravindran, V., Selle, P.H., Ravindran, G., Morel, P.C.H., Kies, A.K. & Bryden, W.L., 2001. Microbial phytase improves performance, apparent metabolisable energy and ileal amino acid digestibility of broilers fed a lysine-deficient diet. Poult. Sci. 80: 338–344.
Ravindran, V., Morel, P.C.H., Partridge, G.G., Hruby, M. & Sands, J.S., 2006. Influence of an E. coli derived phytase on nutrient utilization in broiler starter fed diets containing varying concentrations of phytic acid. Poult. Sci. 85: 82–89.
Rojas, S.W. & Scott, M.L., 1969. Factors affecting the nutritive value of cottonseed meal as a protein source in chick diets. Poult. Sci. 48: 819–835.
Rutherfurd, S.M., Chung, T.K. & Moughan, P.J., 2002. The effect of microbial phytase on ileal phosphorus and amino acid digestibility in broiler chickens. Brit. Poult. Sci. 44: 598–606.
106 S. A. KHAN ET AL BIOLOGIA (PAKISTAN)
Sebastian, S., Touchburn, S.P., Chavez, E.R. & Lague, P.C., 1997. Apparent digestibility of protein and amino acids in broiler chickens fed a corn–soybean diet supplemented with microbial phytase. Poult. Sci. 76: 1760–1769.
Selle, P.H., Ravindran, V., Pittolo, P.H. & Bryden, W.L., 1999. An evaluation of microbial phytase in sorghum-based broiler diets. Proc. Aust. Poult. Sci. Symp. 11: 97–100.
Selle, P.H., Pittolo, P.H. & Bryden, W.L., 2001. Individual and combined supplementation of wheat-based broiler diets with phytase and xylanase. Proc. Aust. Poult. Sci. Symp. 13: 246
Selle, P.H., Ravindran, V., Ravindran, G., Pittolo, P.H. & Bryden, W.L., 2003. Influence of phytase and xylanase sup-plementation on growth performance and nutrient utilisation of broilers offered wheat-based diets. Asian–Aust. J. Anim. Sci. 16: 394–402.
Selle, P.H., Walker, A.R. & Bryden, W.L., 2003b. Total and phytate-phosphorus contents and phytase activity of Australian sourced feed ingredients for pigs and poultry. Aust. J. Expt. Agric. 45: 475–479.
Selle, P.H., Ravindran, V., Ravindran, G. & Bryden, W.L., 2005. Amino acid digestibility and growth performance interactions to phytase and lysine supplementation of lysine-deficient broiler diets. Proc. Aust. Poult. Sci. Symp. 17: 234–237.
Selle, P.H. & Ravindran, V., 2007. Microbial phytase in poultry nutrition. Anim. Feed Sci. Technol. 135: 1–41.
Shirley, R.B. & Edwards, H.M., 2003. Graded levels of phytase past industry standards improve broiler performance. Poult. Sci. 82: 671–680.
Simons, P.C.M., Versteegh, H.A.J., Jongbloed, A.W., Kemme, P.A., Slump, P., Bos, K.D., Wolters, M.G.E., Beudeker, R.F. & Verschoor, G.J., 1990. Improvement of phosphorus availability by microbial phytase in broilers and pigs. Brit. J. Nutr. 64: 525–540.
Yu, B., Jana, Y.C., Chungb, T.K., Leea, T.T., Chioua, P.W.S., 2004. Exogenous phytase activity in the gastrointestinal tract of broiler chickens. Anim. Feed Sc.Tech., 117: 295–303.
Zhang, X., Roland, D.A., McDaniel, G.R. & Rao, S.K., 1999. Effect of Natuphos® phytase supplementation to feed on performance and ileal digestibility of protein and amino acids in broilers.Poult. Sci. 78: 1567–1572.
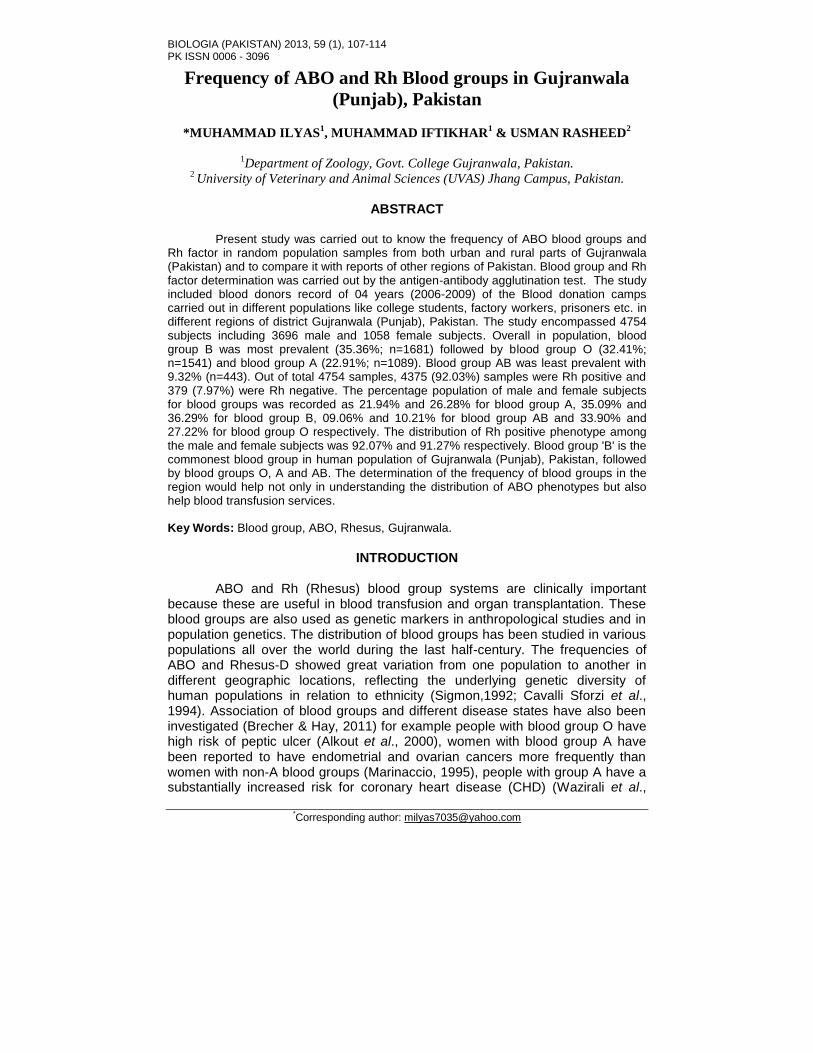
BIOLOGIA (PAKISTAN) 2013, 59 (1), 107-114 PK ISSN 0006 - 3096
*Corresponding author: [email protected]
Frequency of ABO and Rh Blood groups in Gujranwala
(Punjab), Pakistan
*MUHAMMAD ILYAS1, MUHAMMAD IFTIKHAR
1 & USMAN RASHEED
2
1Department of Zoology, Govt. College Gujranwala, Pakistan.
2 University of Veterinary and Animal Sciences (UVAS) Jhang Campus, Pakistan.
ABSTRACT
Present study was carried out to know the frequency of ABO blood groups and
Rh factor in random population samples from both urban and rural parts of Gujranwala (Pakistan) and to compare it with reports of other regions of Pakistan. Blood group and Rh factor determination was carried out by the antigen-antibody agglutination test. The study included blood donors record of 04 years (2006-2009) of the Blood donation camps carried out in different populations like college students, factory workers, prisoners etc. in different regions of district Gujranwala (Punjab), Pakistan. The study encompassed 4754 subjects including 3696 male and 1058 female subjects. Overall in population, blood group B was most prevalent (35.36%; n=1681) followed by blood group O (32.41%; n=1541) and blood group A (22.91%; n=1089). Blood group AB was least prevalent with 9.32% (n=443). Out of total 4754 samples, 4375 (92.03%) samples were Rh positive and 379 (7.97%) were Rh negative. The percentage population of male and female subjects for blood groups was recorded as 21.94% and 26.28% for blood group A, 35.09% and 36.29% for blood group B, 09.06% and 10.21% for blood group AB and 33.90% and 27.22% for blood group O respectively. The distribution of Rh positive phenotype among the male and female subjects was 92.07% and 91.27% respectively. Blood group 'B' is the commonest blood group in human population of Gujranwala (Punjab), Pakistan, followed by blood groups O, A and AB. The determination of the frequency of blood groups in the region would help not only in understanding the distribution of ABO phenotypes but also help blood transfusion services. Key Words: Blood group, ABO, Rhesus, Gujranwala.
INTRODUCTION
ABO and Rh (Rhesus) blood group systems are clinically important
because these are useful in blood transfusion and organ transplantation. These blood groups are also used as genetic markers in anthropological studies and in population genetics. The distribution of blood groups has been studied in various populations all over the world during the last half-century. The frequencies of ABO and Rhesus-D showed great variation from one population to another in different geographic locations, reflecting the underlying genetic diversity of human populations in relation to ethnicity (Sigmon,1992; Cavalli Sforzi et al., 1994). Association of blood groups and different disease states have also been investigated (Brecher & Hay, 2011) for example people with blood group O have high risk of peptic ulcer (Alkout et al., 2000), women with blood group A have been reported to have endometrial and ovarian cancers more frequently than women with non-A blood groups (Marinaccio, 1995), people with group A have a substantially increased risk for coronary heart disease (CHD) (Wazirali et al.,
108 M. ILYAS ET AL BIOLOGIA (PAKISTAN)
2005). Finally, the distribution of ABO blood groups have been shown to work as a strong predictor of national suicide and homicide rates (Lester et al., 2004, 2005) and a genetic marker for obesity (Molison, 1979). Various studies concerning the distribution of ABO and Rh blood groups among populations of different cities of Pakistan have been carried out, however there are no data/study available for Gujranwala (Pakistan); the fifth most populated and industrial district within Punjab province. The present study has been aimed to record the frequency of ABO blood groups and Rh factor in the population of Gujranwala. The data obtained may have multipurpose use in future health planning and variety of disease control programs in this region.
MATERIALS AND METHODS
The study included blood donor records of 04 years (2006-2009) of the
Blood donation camps carried out in different populations like college students, factory workers, prisoners in jail etc. in different regions of district Gujranwala (Punjab), Pakistan. The study encompassed 4754 subjects including 3696 male and 1058 female subjects. Blood groups ABO and Rh factor determination was performed by antigen-antibody agglutination tests. Blood group phenotypes were worked out by mixing anti-A, anti-B, and anti-D antisera (Biolaboratory, USA) with blood samples and looking for agglutination under microscope.
RESULTS
Present study was aimed at assessing the frequency of ABO blood
groups and Rh factor in random population samples from urban and rural areas of Gujranwala region of Pakistan and to compare it with reports of other regions of Pakistan. The study included 4754 subjects with 3696 male and 1058 female subjects. Figure 1 shows the relative occurrence of blood groups ABO in random population under study. Overall in population blood group B was most prevalent (35.36%; n=1681) followed by blood group O (32.41%; n=1541) and blood group A (22.91%; n=1089). Blood group AB was least prevalent with 9.32% (n=443) prevalence. Out of total 4754 samples, 4375 subjects (92.03%) were positive and 379 subjects (7.97%) were negative for Rh factor. Various phenotypes among Rh positive subjects showed that, 32.54% were B positive, 30.06% were O positive, 20.97% were A positive and 8.46% were AB positive. Among the Rh negative subjects, 2.82% were B negative, 2.36% were O negative, 1.94% were A negative and 0.86% were AB negative. Figure 2 and 3 shows gender wise distribution of blood groups. The percent ratios of various phenotypes gender-wise, respectively, have been given as in Table 1.
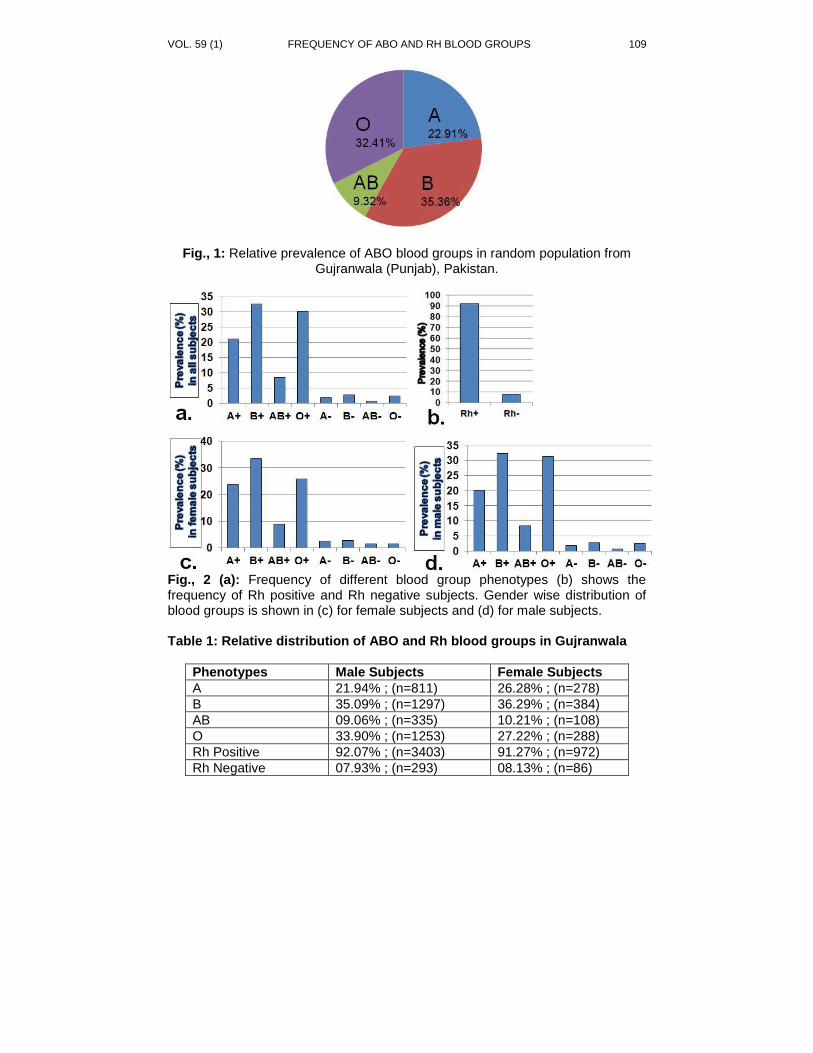
VOL. 59 (1) FREQUENCY OF ABO AND RH BLOOD GROUPS 109
Fig., 1: Relative prevalence of ABO blood groups in random population from Gujranwala (Punjab), Pakistan.
Fig., 2 (a): Frequency of different blood group phenotypes (b) shows the frequency of Rh positive and Rh negative subjects. Gender wise distribution of blood groups is shown in (c) for female subjects and (d) for male subjects. Table 1: Relative distribution of ABO and Rh blood groups in Gujranwala
Phenotypes Male Subjects Female Subjects
A 21.94% ; (n=811) 26.28% ; (n=278)
B 35.09% ; (n=1297) 36.29% ; (n=384)
AB 09.06% ; (n=335) 10.21% ; (n=108)
O 33.90% ; (n=1253) 27.22% ; (n=288)
Rh Positive 92.07% ; (n=3403) 91.27% ; (n=972)
Rh Negative 07.93% ; (n=293) 08.13% ; (n=86)
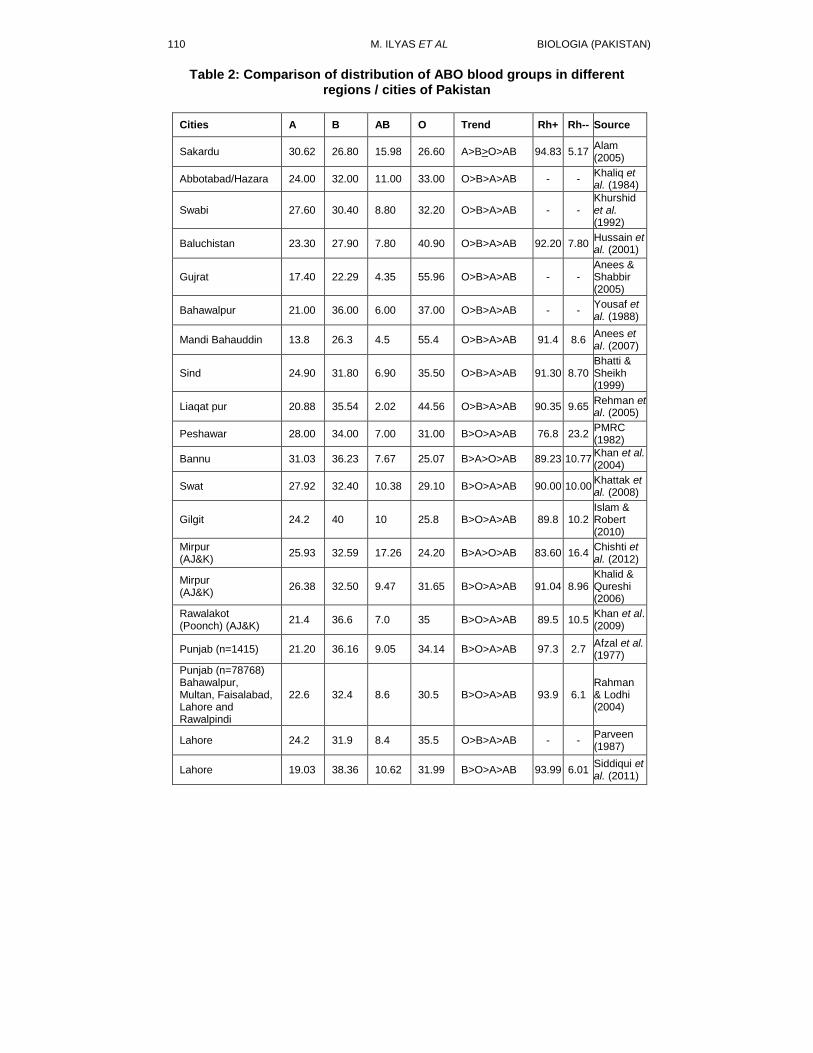
110 M. ILYAS ET AL BIOLOGIA (PAKISTAN)
Table 2: Comparison of distribution of ABO blood groups in different regions / cities of Pakistan
Cities A B AB O Trend Rh+ Rh-- Source
Sakardu 30.62 26.80 15.98 26.60 A>B>O>AB 94.83 5.17 Alam (2005)
Abbotabad/Hazara 24.00 32.00 11.00 33.00 O>B>A>AB - - Khaliq et al. (1984)
Swabi 27.60 30.40 8.80 32.20 O>B>A>AB - - Khurshid et al. (1992)
Baluchistan 23.30 27.90 7.80 40.90 O>B>A>AB 92.20 7.80 Hussain et al. (2001)
Gujrat 17.40 22.29 4.35 55.96 O>B>A>AB - - Anees & Shabbir (2005)
Bahawalpur 21.00 36.00 6.00 37.00 O>B>A>AB - - Yousaf et al. (1988)
Mandi Bahauddin 13.8 26.3 4.5 55.4 O>B>A>AB 91.4 8.6 Anees et al. (2007)
Sind 24.90 31.80 6.90 35.50 O>B>A>AB 91.30 8.70 Bhatti & Sheikh (1999)
Liaqat pur 20.88 35.54 2.02 44.56 O>B>A>AB 90.35 9.65 Rehman et al. (2005)
Peshawar 28.00 34.00 7.00 31.00 B>O>A>AB 76.8 23.2 PMRC (1982)
Bannu 31.03 36.23 7.67 25.07 B>A>O>AB 89.23 10.77 Khan et al. (2004)
Swat 27.92 32.40 10.38 29.10 B>O>A>AB 90.00 10.00 Khattak et al. (2008)
Gilgit 24.2 40 10 25.8 B>O>A>AB 89.8 10.2 Islam & Robert (2010)
Mirpur (AJ&K)
25.93 32.59 17.26 24.20 B>A>O>AB 83.60 16.4 Chishti et al. (2012)
Mirpur (AJ&K)
26.38 32.50 9.47 31.65 B>O>A>AB 91.04 8.96 Khalid & Qureshi (2006)
Rawalakot (Poonch) (AJ&K)
21.4 36.6 7.0 35 B>O>A>AB 89.5 10.5 Khan et al. (2009)
Punjab (n=1415) 21.20 36.16 9.05 34.14 B>O>A>AB 97.3 2.7 Afzal et al. (1977)
Punjab (n=78768) Bahawalpur, Multan, Faisalabad, Lahore and Rawalpindi
22.6 32.4 8.6 30.5 B>O>A>AB 93.9 6.1 Rahman & Lodhi (2004)
Lahore 24.2 31.9 8.4 35.5 O>B>A>AB - - Parveen (1987)
Lahore 19.03 38.36 10.62 31.99 B>O>A>AB 93.99 6.01 Siddiqui et al. (2011)
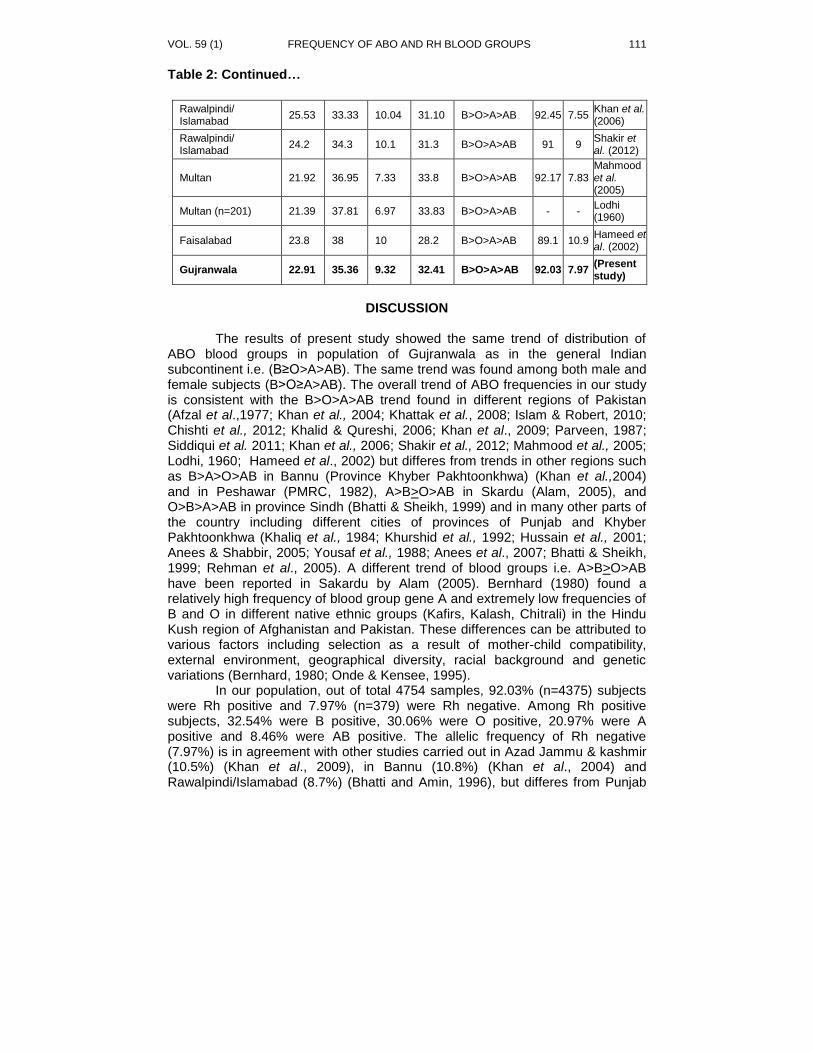
VOL. 59 (1) FREQUENCY OF ABO AND RH BLOOD GROUPS 111
Table 2: Continued…
Rawalpindi/ Islamabad
25.53 33.33 10.04 31.10 B>O>A>AB 92.45 7.55 Khan et al. (2006)
Rawalpindi/ Islamabad
24.2 34.3 10.1 31.3 B>O>A>AB 91 9 Shakir et al. (2012)
Multan 21.92 36.95 7.33 33.8 B>O>A>AB 92.17 7.83 Mahmood et al. (2005)
Multan (n=201) 21.39 37.81 6.97 33.83 B>O>A>AB - - Lodhi (1960)
Faisalabad 23.8 38 10 28.2 B>O>A>AB 89.1 10.9 Hameed et al. (2002)
Gujranwala 22.91 35.36 9.32 32.41 B>O>A>AB 92.03 7.97 (Present study)
DISCUSSION
The results of present study showed the same trend of distribution of
ABO blood groups in population of Gujranwala as in the general Indian subcontinent i.e. (B≥O>A>AB). The same trend was found among both male and female subjects (B>O≥A>AB). The overall trend of ABO frequencies in our study is consistent with the B>O>A>AB trend found in different regions of Pakistan (Afzal et al.,1977; Khan et al., 2004; Khattak et al., 2008; Islam & Robert, 2010; Chishti et al., 2012; Khalid & Qureshi, 2006; Khan et al., 2009; Parveen, 1987; Siddiqui et al. 2011; Khan et al., 2006; Shakir et al., 2012; Mahmood et al., 2005; Lodhi, 1960; Hameed et al., 2002) but differes from trends in other regions such as B>A>O>AB in Bannu (Province Khyber Pakhtoonkhwa) (Khan et al.,2004) and in Peshawar (PMRC, 1982), A>B>O>AB in Skardu (Alam, 2005), and O>B>A>AB in province Sindh (Bhatti & Sheikh, 1999) and in many other parts of the country including different cities of provinces of Punjab and Khyber Pakhtoonkhwa (Khaliq et al., 1984; Khurshid et al., 1992; Hussain et al., 2001; Anees & Shabbir, 2005; Yousaf et al., 1988; Anees et al., 2007; Bhatti & Sheikh, 1999; Rehman et al., 2005). A different trend of blood groups i.e. A>B>O>AB have been reported in Sakardu by Alam (2005). Bernhard (1980) found a relatively high frequency of blood group gene A and extremely low frequencies of B and O in different native ethnic groups (Kafirs, Kalash, Chitrali) in the Hindu Kush region of Afghanistan and Pakistan. These differences can be attributed to various factors including selection as a result of mother-child compatibility, external environment, geographical diversity, racial background and genetic variations (Bernhard, 1980; Onde & Kensee, 1995).
In our population, out of total 4754 samples, 92.03% (n=4375) subjects were Rh positive and 7.97% (n=379) were Rh negative. Among Rh positive subjects, 32.54% were B positive, 30.06% were O positive, 20.97% were A positive and 8.46% were AB positive. The allelic frequency of Rh negative (7.97%) is in agreement with other studies carried out in Azad Jammu & kashmir (10.5%) (Khan et al., 2009), in Bannu (10.8%) (Khan et al., 2004) and Rawalpindi/Islamabad (8.7%) (Bhatti and Amin, 1996), but differes from Punjab
112 M. ILYAS ET AL BIOLOGIA (PAKISTAN)
(2.8%) (Afzal et al., 1977) and even the Azad Jammu & Kashmir population as whole (2.3%) (Rashid, 1983). These differences can be attributed to the selection of sample and sample size, genetic diversity and other factors. These differences also indicate broad genetic and ethnic diversity in Pakistan. The relative frequency of the various blood groups which have been recorded in studies on various segments of the Pakistani populations is given in table 2. It is expected that present study will enhance our ability in future planning of blood demand and supply.
REFERENCES
Afzal, M., Rehman, Z., Hussain, F. & Siddiqi, R., 1977. A survey of blood groups.
J. Pak. Med. Assoc. 27(11):426–428. Alam, M., 2005. ABO and Rhesus blood groups in potential blood donors at
Skardu (Northern Areas). Pak. J. Pathol. 16:94–7. Alkout, A.M., Blackwell, C.C. & Weir, D.M., 2000. Increased inflammatory
responses of persons of blood group O to Helicobacter pylori. J. Infect. Dis.,181:1364-1369.
Anees, M. & Shabir, M., 2005. Distribution of ABO and Rh blood group alleles in Gujrat region of Punjab, Pakistan. Proc Pakistan Acad Sci; 42(4):233–8.
Anees, M., Jawad, A. & Hashmi, I., 2007. Distribution of ABO and Rh blood group alleles in Mandi Bahauddin district of Punjab, Pakistan. Proc. Pakistan. Acad. Sci.; 44(4):289–94.Profess
Bernhard, W., 1980. Distribution of ABO blood groups and incidence of Rh factor (D) in various ethnic groups in the Hindu Kush region (Kafirs, Kalash Chitrali). Anthropol. Anz., 37(4):251-65.
Bhatti, F.A. & Amin, M., 1996. Spectrum of ABO and D blood groups of donors at Rawalpindi / Islamabad. Pak J Pathol., 7(2):26–28.
Bhatti, R. & Shiekh, D.M., 1999. Variations of ABO blood groups. Gene frequencies in the population of Sindh (Pakistan). Ann. King Edward Med. Uni. 5(3/4):328–331.
Brecher, M.E. & Hay, S.N., 2011. ABO Blood Type and Longevity. Am. J. Clin. Pathol.135:96-98
Cavalli-Sforza, L.L., Menozzi, P. & Piazza, A., 1994. The history and geography of human genes. Princeton, New Jersey, Princeton University Press.
Chishti, H.M.,Waheed, U., Ansari, M.A., Wazir, I. & Hussain, Z., 2012. ABO and Rhesus (D) blood group phenotypes in Mirpur, Azad Jammu Kashmir, Pakistan, 2008-12. J. Pub. Health. Bio. Sci. 1(2): 43-46.
Hameed, A., Hussain, W., Ahmad, J., Rabbi, F. & Qureshi, J.A., 2002. Prevalence of phenotype and genes of ABO and Rhesus (D) blood groups in Faisalabad, Pakistan. Pak. J. Biol. Sci., 5(6):722-724.
Hussain, A., Sheikh, S.A., Haider, M., Rashid, T. & Malik, M.R., 2001. Frequency Distribution of ABO and Rhesus Blood Groups in Population of Balochistan. Pak. Armed Forces Med. J., 51(1):22-6.
Islam, F. & Robert, H., 2010. Frequency of ABO and Rhesus blood groups in the population of Gilgit area of Pakistan. Pak. J. Pathol.; 21(3):87-91.
VOL. 59 (1) FREQUENCY OF ABO AND RH BLOOD GROUPS 113
Khalid, M. & Qureshi M.A., 2006 Frequencies of blood group antigens and corresponding alleles in the population of Mirpur, Azad Jammu Kashmir. .J Anim. Plant Sci., 16(3-4):
Khaliq, M.A., Khan, J.A., Shah, H. & Khan, S.P., 1984. Frequency of ABO and Rh (D) blood groups in Hazara division (Abbottabad). Pak. J. Med. Res., 23(4): 102-3.
Khan, M.S., Farooq, N., Qamar, N., Tahir, F., Subhan, F., Kazi, B.M., Fiyaz, M. & Karamat, K.A., 2006. Trend of blood groups and Rh Factor in the twin cities of Rawalpindi and Islamabad. J. Pak. Med. Assoc., 56(7):299-302.
Khan, M.N., Khaliq, I., Bakhsh, A., Akhtar, M.S. & Amin-ud-Din, M., 2009. Distribution of ABO and Rh D blood groups in the population of Poonch district, Azad Jammu and Kashmir. EMHJ., 15(3):717-721.
Khan, M.S., Sibtain, F., Tahir, F., Kazi, B.M., Dil, A.S., Sultan, S., Deepa, F. & Khan, F., 2004. Prevalence of Blood Groups & Rh factor in Bannu region NWFP (Pakistan). Pak. J. Med. Res.; 43(1):8-10.
Khattak, I.D., Khan, T.M., Khan, P., Shah, S.M., Khattak, S.T. & Ali A., 2008. Frequency of ABO and Rhesus blood group in district Swat, Pakistan. J. Ayub. Med. Coll., 20(4):127-9.
Khurshid, B., Naz, M., Hassan, M. & Mabood, S.F. 1992. Frequency of ABO and Rh (D) blood groups in district Swabi N.W.F.P (Pakistan). J. Sci. Tech. Univ. Peshawar, 16:5-6.
Lodhi, M.A.K., 1960. A study of blood groups in Multan (West Pakistan). Medicus, Karachi; 20(2): 53 - 61.
Lester, D., 2004. Blood types and national suicide rates. Crisis.,25:140. Lester, D., 2005. Predicting suicide in nations. Arch. Suicide Res., 9: 219-223. Mahmood, M.A., Anjum, A.H., Train, S.M.A., Shahid R., Usman, M. & Khawar S.,
2005 Pattern of ABO and Rh blood groups in Multan region. Biomedica. 2: 1-4.
Marinaccio, M., Traversa, A., Carioggia, E., Valentino, L., Coviello, M., Salamanna, S., Dragone, D.C. & Marinaccio, L., 1995. Blood groups of the ABO system and survival rate in gynecologic tumors [in Italian]. Minerva Ginecol. 47:69-76.
Molison, P.L., 1979. Blood Transfusion in Clinical Medicine. 6th edition, Blackwell scientific Publications, Oxford, U.K. pp.239-666.
Onde, S. & Kensee, A., 1995. Geographic variations analysis of the ABO and Rh system in Turkey. Gene Geograp; 9: 211-220.
Perveen, N., 1987. ABO and sub-groups of A in the Lahore population; J. Pak. Med. Assoc. 37: 200-201.
PMRC., 1982. Some normal parameters of Pakistani's in the Peshawar area 1976-82. Pakistan Medical Research Council (PMRC), KMC., Peshawar. 21p.
Rahman M. & Lodhi Y., 2004. Frequency of ABO & Rhesus blood groups in blood donors in Punjab. Pak. J. Med. Sci. 20(4): 315-318.
Rashid, M., 1983. Gene frequency of ABO blood groups in Azad Kashmir (M.Sc. thesis), Department of Botany, University of Peshawar, Peshawar, Pakistan.

114 M. ILYAS ET AL BIOLOGIA (PAKISTAN)
Rehman, A., Khan, M.A., Ashraf, M., Malik, S.A., Saeed, M.A., Rafique, A. & Ali, A.,2005. ABO & Rhesus Blood Groups. Professional Med. J., 12(4):368-371.
Siddiqui, Z.H., Chaudhry, M.A., Nigar, M. & Butt, H., 2011. A study of association between ABO and Rh blood groups, sex, age and angina pectoris. Sci. Int.(Lahore), 23(2):113-116.
Sigmon, J.M., 1992. Basic principles of the ABO and Rh blood group systems for hemapheresis practitioners. J. Clinl. Apheresis. 7(3):158–162.
Shakir, M., Khan, S.A. & Ghani, E., 2012 Frequency of ABO and Rh (D) blood groups among blood donors in Rawalpindi/Islamabad area. Pak. Armed Forces Med. J., 2: June 2012.
Yousaf, M., Yousaf, N. & Zahid, A., 1988. Pattern of ABO and Rh (D) Blood groups distribution in Bahawalpur Division. Pak. J. Med. Res. 27(1):40-1.
Wazirali, H., Ashfaque, R.A. & Herzig, J.W., 2005. Association of blood group A with increased risk of coronary heart disease in the Pakistani population. Pak. J. Physiol., 1(1-2).
BIOLOGIA (PAKISTAN) 2013, 59 (1), 115-123 PK ISSN 0006 - 3096
*Corresponding Author: [email protected]
Use of Earthworms for Composting of Sugar Industry
Waste
*ZAHIDA UMAR & FAIZA SHARIF
Sustainable Development Study Centre, Government College University, Lahore
ABSTRACT
Transformation of industrial sludges into vermicomposts can convert these
wastes into valuable products. This study explores the potential of converting the sugar industrial waste into value added fertilizer and vermicompost. A total of six treatments of sugar sludge with different percentages of sludge and cow dung (CD) were prepared with three replicates. The experiment was conducted in plastic pots at 27 ± 3°C and moisture contents were maintained at 70-80%. The treatments were monitored for the nutrient increments, heavy metals reduction (Fe, Mn, Cu, Ni) and growth of earthworms for 90 days. Earthworms survived only in S3 (300 g sugar mill waste + 200 g CD) and S4 (400 g sugar mill waste + 100 g CD). Earthworms caused a significant change in the chemical composition of these treatments. Increase in number and bodyweights of earthworms, pH, EC1:1, N, P, K and heavy metals reduction were significantly (p < 0.05) better in S3 vermicompost as compared to S4. There was a significant (p < 0.05) reduction in heavy metal and total organic carbon and increase in pH, EC, N, P and K contents of final vermicomposts of S3 ans S4 than their initial mixtures. Results revealed that chemical properties (pH, EC1:1, N, P & K) and heavy metals contents of sugar vermicomposts were in compliance with the standard end use compost limits and were suitable to be used as effective organic fertilizers and soil conditioners for agriculture purposes. Key words: Agro- industrial sludge, sugar waste, vermiproduct, earthworms, cowdung
INTRODUCTION
Vermicomposting is an eco-biotechnological process that converts complex and energy rich organic wastes into more stabilized vermiproduct by exploiting earthworms (Benitez et al., 2000). Through this process, the essential nutrients of plants such as nitrogen, phosphorus, potassium and calcium present in the mixture are transformed into plant soluble and available forms through microbial action (Ndegwa and Thompson 2001). In vermicomposting, several earthworm species are employed to accelerate waste conversion process to generate useful final product. Earthworms are capable of transforming garbage into ‘gold’ through a type of biological alchemy (Vermi Co 2001).
Industrial sludges should be mixed with nitrogen-rich organic waste to provide nutrients as micro-organisms inoculum and to obtain stabilized vermicomposts adequate for agricultural use (Hartenstein 1978). Studies indicated that certain epigeic species demonstrate outstanding result in bedding mixed with cow and sheep manures (Nogales et al. 1999). Some agro-industrial sludge such as sugar industrial sludge has significant quantity of plant nutrients, which may be reutilized for restoration of land and food production. Sugar sludges are either stored in premises of sugar
116 Z. UMAR & F. SHARIF BIOLOGIA (PAKISTAN)
mill or discarded along roadsides due to high sludge disposal cost where it causes harmful impacts on the ambient environment (Parthasarthi & Ranganathan 2008). These sludges can be valuable raw materials for vermicomposting at commercial level.
Current study is designed to see the potential of sugar industrial sludge to be converted into vermicompost by employing spring species (Darwida nepalensis and Remiella bishambari) of earthworms collected from GCU Botanical Garden, Lahore.
Use of sugar industrial sludge in vermicomposting are expected to provide sound management practices for this sludge in order to solve the widespread environmental and economic problems related with the disposal of this wastes and can also help farmers in income generation.
The objectives of the current study were to 1. Determine the appropriate ratio of sugar industrial sludge and cow dung
required for suitable growth of earthworms. 2. Effectiveness of selected earthworm species in increasing concentration
of nutrients and reducing heavy metals.
MATERIALS AND METHODS
Sample Collection Sugar mill sludge was collected from Shakarganj sugar mill, Jhang.
Spring species of Earthworms (Darwida nepalensis and Remiella bishambari) were collected from the Botanical Garden, GC University Lahore. The complete identification of species of earthworms was carried out with the help of monographic work of Gates (1972) and Julka (1988). Experimental setup
Sugar sludge and fresh cow dung (CD) were air dried for 48 hours and were oven dried at 60 ̊C for 24 hours. The experiment was conducted in plastic pots of 18 cm height and 17 cm diameter, each of 2 kg capacity. Total duration of experiment was 90 days. The composting mixture consisted of sugar sludge mixed individually with cow dung (CD) in different ratios (on dry weight basis). Total 500 g of composting mixture was taken in each experimental pot. Sugar sludge treatments were designated as S1 (100g sludge +400g CD), S2 (200g ss +300g CD), S3 (300g ss +200g CD), S4 (400g ss +100g CD) and S5 (500g ss). Three replicates for each treatment were run. Each mixture was turned over manually every 24 h for 15 days in order to eliminate volatile toxic substances. In each replicate pot, 10 healthy earthworms were inoculated after 15 days of predecomposition of organic wastes. This was done to avoid exposure of worms to high temperature during the initial thermophilic stage of composting. The moisture content of each replicate was maintained at 70-80% by periodic sprinkling of an adequate quantity of water. The experimental pots were kept under shade and covered with the muslin cloth to avoid direct sunlight and excessive evaporation. Earthworm survival and body weight in each treatment were noted after 15 days of inoculation of earthworms, 45 and 90 days of composting.
VOL. 59 (1) EARTHWORMS FOR COMPOSTING 117
Analysis of vermicompost samples Chemical parameters pH, EC1:1, organic matter (OM), Total organic
carbon (TOC), Na, K, P, Ca and Mg were analysed as described by Ryan et al. (2001). Copper (Cu), Manganese (Mn), Nickel (Ni) and Iron (Fe) were estimated by FAAS, shimadzuAA-7000F Atomic Absorption Spectroscopy (Kamitani & Kaneko 2007). Statistical Analyses The data were analyzed statistically and all values were presented as Mean ± SE (Standard Error). t-test was performed to determine the significant differences among different treatments for the studied parameters using SPSS version 16. The probability levels used for statistical significance were p < 0.05 for the tests.
RESULTS Earthworms could not survive in pure sugar sludge treatment (S5) and increased cowdung concentrations more than 200g/ 500g of initial sugar-cowdung mixture (S1 & S2). At the end of one week, no earthworm survived in S1, S2 and S5, so these treatments were terminated. Earthworms only survived in S3 (300g sugar mill sludge + 200g Cow dung) and S4 treatments (400g sugar mill sludge + 100g CD). Earthworm survival and body weight Earthworm survival rate slightly declined during composting from 0 to 90 days in both S3 and S4 treatments (Table 1). In initial mixture, 10 earthworms were inoculated in both sugar mill sludge treatments that decreased to 9 in both S3 and S4 treatments. After 90 days the body weight of earthworms was increased to 7.58 g and 7.42 g in S3 and S4 treatments, respectively (Table 1). Difference of both treatments for earthworms survival and increase in body weight was statistically non-significant (Fig.,1). Chemical Properties
After 90 days pH, EC1:1, nitrogen (%), phosphorous (mg/kg), sodium (mg/kg) and potassium (mg/kg) significantly increased in both S3 and S4 treatments in final products as compared to 0 day(Table 1). While total organic carbon (%), organic matter (%), calcium (mg/kg), magnesium (mg/kg) and heavy metals i.e. Cu, Ni, Mn, Fe (mg/kg) significantly decreased in final product of both S3 and S4 treatments (Table 1).
In the final product, values of EC 1:1 (mS/cm), sodium and magnesium were significantly lower in S4 than S3. While total organic carbon (%), Phosphorous and heavy metals (mg/kg) were significantly less and Nitrogen, calcium and potassium were significantly higher in S3. Reduction in pH and organic matter (%) were non-significant in both S3 & S4 treatments (Fig., 1- 5).
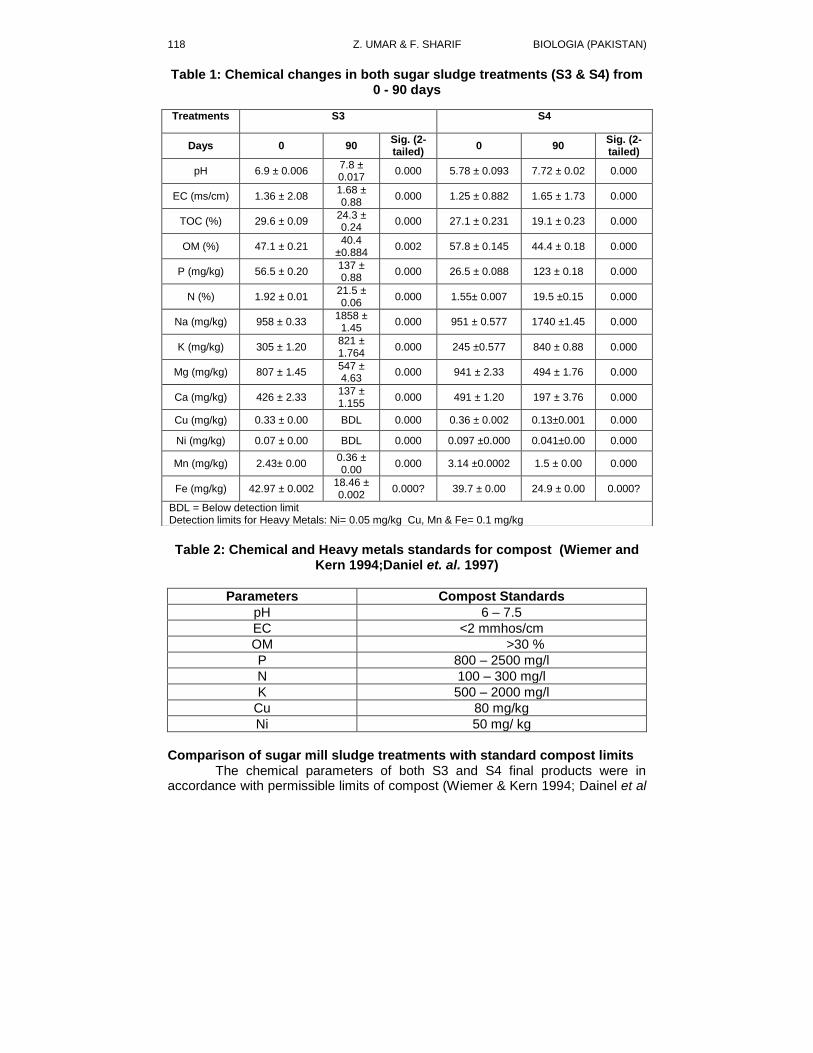
118 Z. UMAR & F. SHARIF BIOLOGIA (PAKISTAN)
Table 1: Chemical changes in both sugar sludge treatments (S3 & S4) from 0 - 90 days
Table 2: Chemical and Heavy metals standards for compost (Wiemer and
Kern 1994;Daniel et. al. 1997)
Parameters Compost Standards
pH 6 – 7.5
EC <2 mmhos/cm
OM >30 %
P 800 – 2500 mg/l
N 100 – 300 mg/l
K 500 – 2000 mg/l
Cu 80 mg/kg
Ni 50 mg/ kg
Comparison of sugar mill sludge treatments with standard compost limits
The chemical parameters of both S3 and S4 final products were in accordance with permissible limits of compost (Wiemer & Kern 1994; Dainel et al
Treatments S3 S4
Days 0 90 Sig. (2-tailed)
0 90 Sig. (2-tailed)
pH 6.9 ± 0.006 7.8 ± 0.017
0.000 5.78 ± 0.093 7.72 ± 0.02 0.000
EC (ms/cm) 1.36 ± 2.08 1.68 ± 0.88
0.000 1.25 ± 0.882 1.65 ± 1.73 0.000
TOC (%) 29.6 ± 0.09 24.3 ± 0.24
0.000 27.1 ± 0.231 19.1 ± 0.23 0.000
OM (%) 47.1 ± 0.21 40.4
±0.884 0.002 57.8 ± 0.145 44.4 ± 0.18 0.000
P (mg/kg) 56.5 ± 0.20 137 ± 0.88
0.000 26.5 ± 0.088 123 ± 0.18 0.000
N (%) 1.92 ± 0.01 21.5 ± 0.06
0.000 1.55± 0.007 19.5 ±0.15 0.000
Na (mg/kg) 958 ± 0.33 1858 ± 1.45
0.000 951 ± 0.577 1740 ±1.45 0.000
K (mg/kg) 305 ± 1.20 821 ± 1.764
0.000 245 ±0.577 840 ± 0.88 0.000
Mg (mg/kg) 807 ± 1.45 547 ± 4.63
0.000 941 ± 2.33 494 ± 1.76 0.000
Ca (mg/kg) 426 ± 2.33 137 ± 1.155
0.000 491 ± 1.20 197 ± 3.76 0.000
Cu (mg/kg) 0.33 ± 0.00 BDL 0.000 0.36 ± 0.002 0.13±0.001 0.000
Ni (mg/kg) 0.07 ± 0.00 BDL 0.000 0.097 ±0.000 0.041±0.00 0.000
Mn (mg/kg) 2.43± 0.00 0.36 ± 0.00
0.000 3.14 ±0.0002 1.5 ± 0.00 0.000
Fe (mg/kg) 42.97 ± 0.002 18.46 ± 0.002
0.000? 39.7 ± 0.00 24.9 ± 0.00 0.000?
BDL = Below detection limit Detection limits for Heavy Metals: Ni= 0.05 mg/kg Cu, Mn & Fe= 0.1 mg/kg
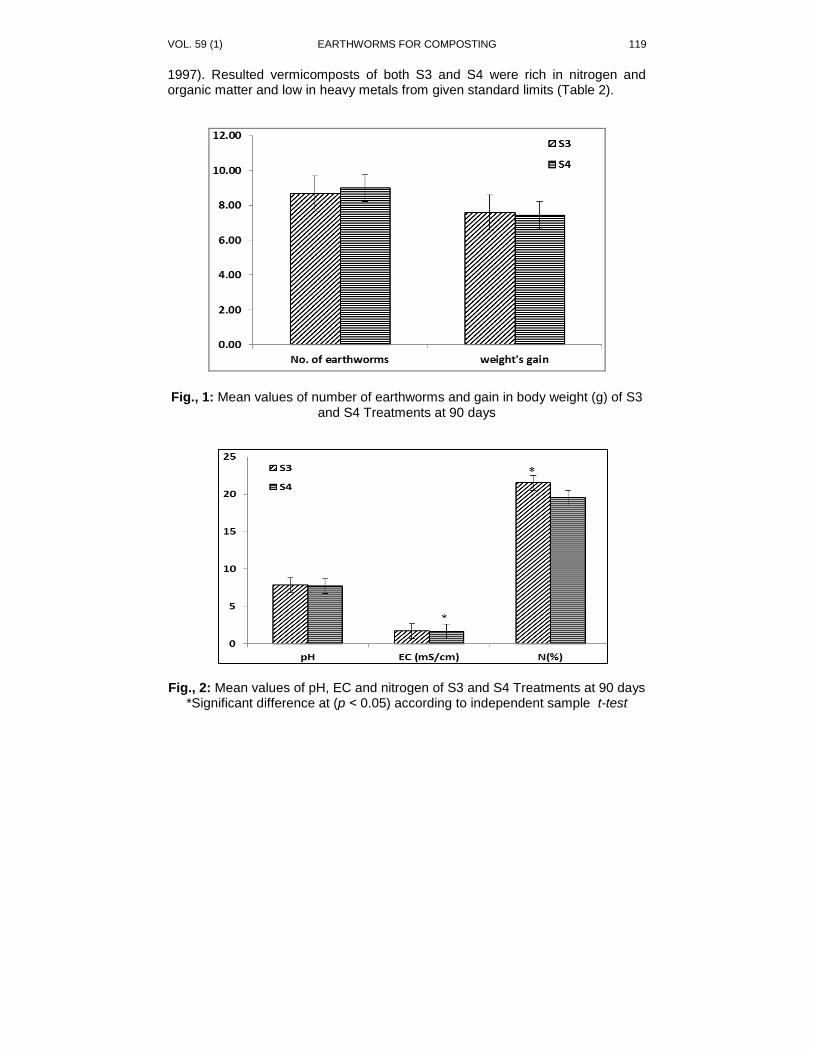
VOL. 59 (1) EARTHWORMS FOR COMPOSTING 119
1997). Resulted vermicomposts of both S3 and S4 were rich in nitrogen and organic matter and low in heavy metals from given standard limits (Table 2).
Fig., 1: Mean values of number of earthworms and gain in body weight (g) of S3
and S4 Treatments at 90 days
Fig., 2: Mean values of pH, EC and nitrogen of S3 and S4 Treatments at 90 days
*Significant difference at (p ˂ 0.05) according to independent sample t-test
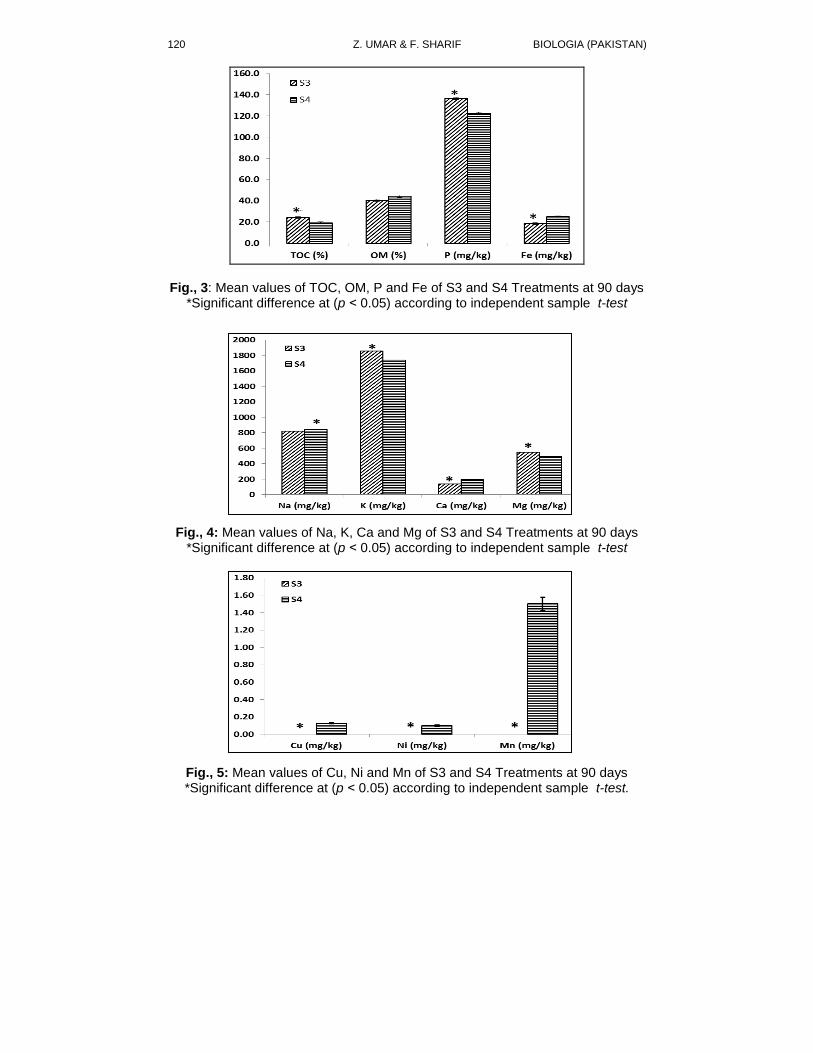
120 Z. UMAR & F. SHARIF BIOLOGIA (PAKISTAN)
Fig., 3: Mean values of TOC, OM, P and Fe of S3 and S4 Treatments at 90 days
*Significant difference at (p ˂ 0.05) according to independent sample t-test
Fig., 4: Mean values of Na, K, Ca and Mg of S3 and S4 Treatments at 90 days
*Significant difference at (p ˂ 0.05) according to independent sample t-test
Fig., 5: Mean values of Cu, Ni and Mn of S3 and S4 Treatments at 90 days *Significant difference at (p ˂ 0.05) according to independent sample t-test.
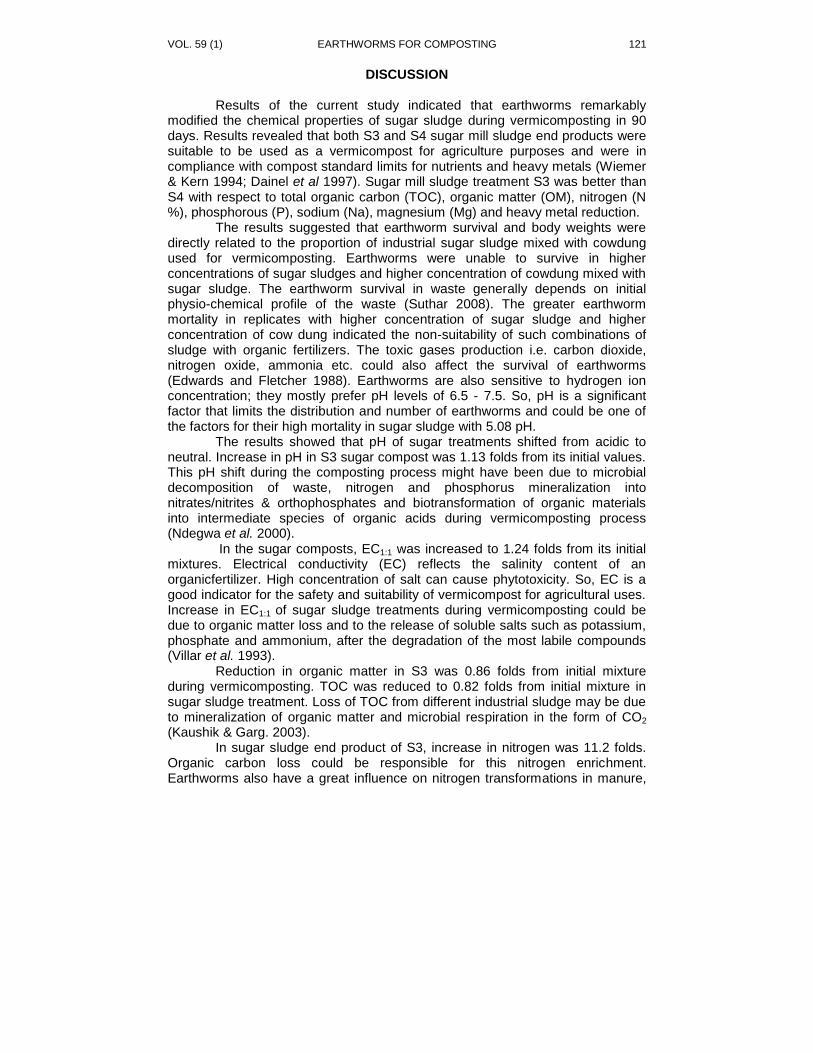
VOL. 59 (1) EARTHWORMS FOR COMPOSTING 121
DISCUSSION Results of the current study indicated that earthworms remarkably modified the chemical properties of sugar sludge during vermicomposting in 90 days. Results revealed that both S3 and S4 sugar mill sludge end products were suitable to be used as a vermicompost for agriculture purposes and were in compliance with compost standard limits for nutrients and heavy metals (Wiemer & Kern 1994; Dainel et al 1997). Sugar mill sludge treatment S3 was better than S4 with respect to total organic carbon (TOC), organic matter (OM), nitrogen (N %), phosphorous (P), sodium (Na), magnesium (Mg) and heavy metal reduction. The results suggested that earthworm survival and body weights were directly related to the proportion of industrial sugar sludge mixed with cowdung used for vermicomposting. Earthworms were unable to survive in higher concentrations of sugar sludges and higher concentration of cowdung mixed with sugar sludge. The earthworm survival in waste generally depends on initial physio-chemical profile of the waste (Suthar 2008). The greater earthworm mortality in replicates with higher concentration of sugar sludge and higher concentration of cow dung indicated the non-suitability of such combinations of sludge with organic fertilizers. The toxic gases production i.e. carbon dioxide, nitrogen oxide, ammonia etc. could also affect the survival of earthworms (Edwards and Fletcher 1988). Earthworms are also sensitive to hydrogen ion concentration; they mostly prefer pH levels of 6.5 - 7.5. So, pH is a significant factor that limits the distribution and number of earthworms and could be one of the factors for their high mortality in sugar sludge with 5.08 pH.
The results showed that pH of sugar treatments shifted from acidic to neutral. Increase in pH in S3 sugar compost was 1.13 folds from its initial values. This pH shift during the composting process might have been due to microbial decomposition of waste, nitrogen and phosphorus mineralization into nitrates/nitrites & orthophosphates and biotransformation of organic materials into intermediate species of organic acids during vermicomposting process (Ndegwa et al. 2000). In the sugar composts, EC1:1 was increased to 1.24 folds from its initial mixtures. Electrical conductivity (EC) reflects the salinity content of an organicfertilizer. High concentration of salt can cause phytotoxicity. So, EC is a good indicator for the safety and suitability of vermicompost for agricultural uses. Increase in EC1:1 of sugar sludge treatments during vermicomposting could be due to organic matter loss and to the release of soluble salts such as potassium, phosphate and ammonium, after the degradation of the most labile compounds (Villar et al. 1993). Reduction in organic matter in S3 was 0.86 folds from initial mixture during vermicomposting. TOC was reduced to 0.82 folds from initial mixture in sugar sludge treatment. Loss of TOC from different industrial sludge may be due to mineralization of organic matter and microbial respiration in the form of CO2 (Kaushik & Garg. 2003). In sugar sludge end product of S3, increase in nitrogen was 11.2 folds. Organic carbon loss could be responsible for this nitrogen enrichment. Earthworms also have a great influence on nitrogen transformations in manure,
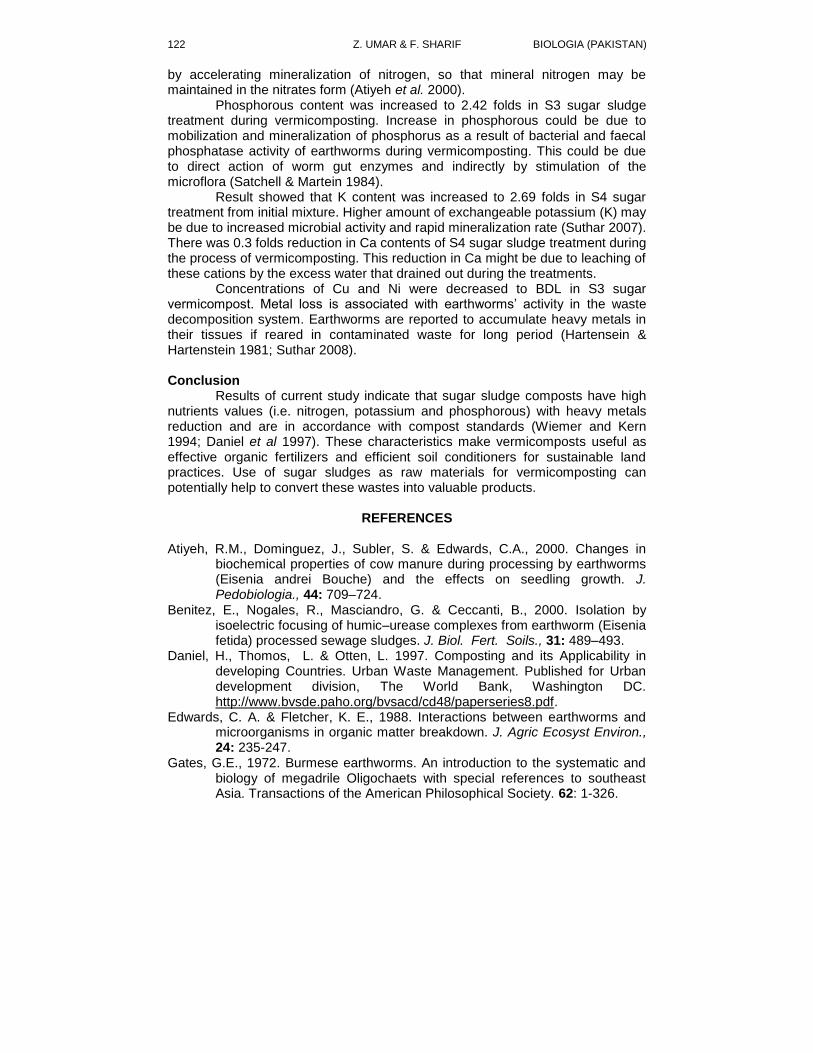
122 Z. UMAR & F. SHARIF BIOLOGIA (PAKISTAN)
by accelerating mineralization of nitrogen, so that mineral nitrogen may be maintained in the nitrates form (Atiyeh et al. 2000). Phosphorous content was increased to 2.42 folds in S3 sugar sludge treatment during vermicomposting. Increase in phosphorous could be due to mobilization and mineralization of phosphorus as a result of bacterial and faecal phosphatase activity of earthworms during vermicomposting. This could be due to direct action of worm gut enzymes and indirectly by stimulation of the microflora (Satchell & Martein 1984).
Result showed that K content was increased to 2.69 folds in S4 sugar treatment from initial mixture. Higher amount of exchangeable potassium (K) may be due to increased microbial activity and rapid mineralization rate (Suthar 2007). There was 0.3 folds reduction in Ca contents of S4 sugar sludge treatment during the process of vermicomposting. This reduction in Ca might be due to leaching of these cations by the excess water that drained out during the treatments. Concentrations of Cu and Ni were decreased to BDL in S3 sugar vermicompost. Metal loss is associated with earthworms’ activity in the waste decomposition system. Earthworms are reported to accumulate heavy metals in their tissues if reared in contaminated waste for long period (Hartensein & Hartenstein 1981; Suthar 2008). Conclusion Results of current study indicate that sugar sludge composts have high nutrients values (i.e. nitrogen, potassium and phosphorous) with heavy metals reduction and are in accordance with compost standards (Wiemer and Kern 1994; Daniel et al 1997). These characteristics make vermicomposts useful as effective organic fertilizers and efficient soil conditioners for sustainable land practices. Use of sugar sludges as raw materials for vermicomposting can potentially help to convert these wastes into valuable products.
REFERENCES
Atiyeh, R.M., Dominguez, J., Subler, S. & Edwards, C.A., 2000. Changes in
biochemical properties of cow manure during processing by earthworms (Eisenia andrei Bouche) and the effects on seedling growth. J. Pedobiologia., 44: 709–724.
Benitez, E., Nogales, R., Masciandro, G. & Ceccanti, B., 2000. Isolation by isoelectric focusing of humic–urease complexes from earthworm (Eisenia fetida) processed sewage sludges. J. Biol. Fert. Soils., 31: 489–493.
Daniel, H., Thomos, L. & Otten, L. 1997. Composting and its Applicability in developing Countries. Urban Waste Management. Published for Urban development division, The World Bank, Washington DC. http://www.bvsde.paho.org/bvsacd/cd48/paperseries8.pdf.
Edwards, C. A. & Fletcher, K. E., 1988. Interactions between earthworms and microorganisms in organic matter breakdown. J. Agric Ecosyst Environ., 24: 235-247.
Gates, G.E., 1972. Burmese earthworms. An introduction to the systematic and biology of megadrile Oligochaets with special references to southeast Asia. Transactions of the American Philosophical Society. 62: 1-326.
VOL. 59 (1) EARTHWORMS FOR COMPOSTING 123
Hartenstein, R. & Hartenstein, F., 1981. Physicochemical changes in activated sludge by the earthworm Eisenia foetida. J. Environ. Qual., 10: 377–382.
Hartenstein, R., 1978. Use of Eisenia foetida in organic recycling based on laboratory experiments. EPA Doc., 600, 12(X 078): 155-165.
Julka, J.M., 1988. The fauna of India and the adjacent countries. Megascolecidae: Octochaetidae (Earthworms) Haplotaxida, Lumbricina: Megascolecidae: Octochaetidae xiv, ZSI, Calcutta. PP-40
Kamitani, T. & Kaneko, N., 2007. Species-specific heavy metal accumulation patterns of earthworms on floodplain in Japan. J. Ecotox Environ Safe., 66(1):82–91.
Kaushik, P. & Garg, V.K., 2003. Vermicomposting of mixed solid textile mill sludge and cow dung with epigenic earthworm Eisenia fetida. J. Bioresource technol., 90: 311- 316.
Ndegwa, P.M. & Thompson, S.A., 2001. Integrating composting and vermicomposting the treatment and bioconversion of biosolids. J. Bioresource Technol., 76: 107–112.
Ndegwa, P.M., Thompson, S. A. & Das, K.C., 2000. Effects of stocking density and feeding rate on vermicomposting of biosolids. J. Bioresource Technol., 71: 5–12.
Nogales, R., Elvira, C., Benitez, E., Thompson, R. & Gomez, M., 1999. Feasibility of vermicomposting dairy biosolids using a modified system to avoid earthworm mortality. J. Environ. Sci. Health., 34 (1): 151–169.
Parthasarathi, K. & Ranganathan, L.S., 2008. Enhanced phosphatase activity in earthworm casts is more of microbial origin. J. Curr. Sci., 79: 1158–115.
Ryan, J., Estefan, G. & Rashid, A., 2001. Soil and plant analysis, laboratory manual. 2
nd edition. Internat center for agricultural reseacrch in the dry
areas (ICARDA) and the National agricultural research center (NARC). Satchell, J.E. & Martein, K., 1984. Phosphate activity in earthworm faeces. J. Soil
Biol. Biochem., 16: 191–194. Suthar, S., 2007. Vermicomposting potential of Perionyx sansibaricus (Perrier) in
different waste materials. J. Bioresource Technol., 98: 1231-1237. Suthar, S., 2008. Earthworm communities a bioindicator of arable land
management practices: A case study in semi arid region of India. J. Ecol. Indicators. dio:10.1016/j.ecolind.2008.08.002.
Vermi Co., 2001. Vermicomposting technology for waste management and agriculture: an executive summary. Grants Pass, OR 97528, USA. http://www.vermico.com/summary.html.
Villar, M.C., Beloso, M.C., Acea, M.J., Cabaneiro, A., González-Prieto, S.J., Díaz-Raviña, M. & Carballas, T., 1993. Physical and chemical characterization of four composted urban refuses. J. Bioresource Technol., 45: 105–113.
Wiemer, K. & Kern, M., 1994. Gütesicherung and Vermarktung von Bioabfallkompost. (Quality Cerification and Marketing of Compost) Technical Series 9. 710pp. University of Kassel MIC Baeza Verlag.
BIOLOGIA (PAKISTAN) 2013, 59 (1),125-130 PK ISSN 0006 - 3096
*Corresponding Author [email protected]:
Haematological Studies during the Use of Herbal
Polysaccharides in Commercial Poultry
MUHAMMAD ZAFAR1, AFTAB AHMAD ANJUM
2, MUHAMMAD FIAZ
QAMAR3, MUHAMMAD IMRAN NAJEEB
4 AND AZHAR MAQBOOL
5
1,2,4,5 Faculty of Veterinary Science, UVAS, Lahore
3Department of Zoology, Govt. College University, Lahore
ABSTRACT
Haematological studies help the poultry consultants to understand the
pathological conditions associated with different infections in different age groups. In the current study Comparison of different haematological values i.e.; Hemoglobin Concentration (Hb), Packed Cell Volume (PCV), Total Leukocyte Count (TLC), Differential Leukocytes Counts (DLC) was made between the birds treated with Livol (a Herbal Polysaccarides) and untreated birds. Treatment related changes in feed intake, general body condition and anaemia were also observed amongst the various groups. The addition of Livol (Herbal Polysaccarides) to feed diminished the adverse effects of different vaccines and antibody titres against Newcastle disease. There was comparatively higher weight gain in Livol treated birds. These findings suggested that Livol can effectively correct the circulatory and immune system in broiler chicks. KEY WORDS: Haematological studies, Herbal Polysaccharides, Commercial Poultry.
INTRODUCTION
The modulation of immune responses of animals may be either immuno-stimulatory or immunosuppressive. Immunostimulation of a bird may lead to increase antibody production, enhance graft rejection versus host reaction, increase phagacytosis by macrophages and/or inhibit tumor growth (Spallolhz et al., 1973). Intermediate vaccines were used successfully with hot vaccines being used on heavily contaminated sites. The rationale behind this successful approach was that the hotter vaccines would be able to produce higher levels of maternal antibodies. Moreover, vaccination protocols have to be strictly adhered to so that vaccination is effective without causing adverse effects on growth or immune system function (Skinner, 2000). The half-life of maternal antibodies to IBDV is between 3 and 5 days (Skeeles et al., 1979). Such maternal antibodies protect the chick from early immunosuppressive infections, protecting them for 1 to 3 weeks, but by boosting the immunity in breeder flocks with oil-adjuvant vaccines, passive immunity may be extended to 4 or 5 weeks (Lutticken, 1981). Hence, the present study was carried out to evaluate the effect of panchagavya and andrographis paniculata on haematological, serum biochemical parameters and immune status of broilers.
Stress is responsible for suboptimal growth and production performances in commercial poultry. When a flock is exposed to any atmospheric upset, certain body changes are brought about that result in a situation where the body of the birds is unable to perform their normal functions, Qamar et al., (2010). The
BIOLOGIA (PAKISTAN) M. ZAFAR ET AL 126
objectives of the present study were to evaluate the effect of Herbal Polysaccharides (Livol) on the haematological parameters which determine the health status and degree of tissue damage caused by the disease and their correction by the use of Livol.
MATERIALS AND METHODS
Experimental Broiler Chicks A total of 150 one day-old-chicks were reared in the experimental poultry
shed for 42 days, Department of Microbiology University of Veterinary Sciences Lahore, under optimal managemental conditions. The experimental birds were randomly divided into three equal groups; 50 birds each (A, B & C) and were vaccinated against Newcastle Disease Vaccine (NDV) Lasota on days 6 by eye droppings and day 21 (through drinking water).
Group (A): They were kept as untreated control and were further subdivided into two groups having 25 birds each i.e. Group A1:- Not challenged. Group A2:- Challenged with virulent ND virus10
4 EID50, 0.1 ml/chick.
Group (B): Birds in this group were fed with herbal Polysaccharides with the dose rate of 1ml/litter in drinking water throughout the experiment till day 42
nd. This group was further subdivided into two groups having 25 birds each i.e.
Group B1:-. Not challenged. Group B2:- Challenged against Virulent ND virus 10 4 EID50, 0.1 ml/chick.
Group (C): Birds in this group were fed with 2ml/litter concentrations of herbal Polysaccharides in drinking water throughout the experiment. This group was further subdivided into two groups having 25 birds each i.e. Group C1:-. Not challenged. Group C2:- Challenged against Virulent ND virus10
4 EID50, 0.1
ml/chick. Blood/Serum Collection
Ten birds were randomly selected for blood collection from each group. Blood sample were collected from each group on day 1, 7, 14, 21, 28, 35 and 42 of age. The blood was collected from each bird separately and was allowed to clot at room temperature in order to separate the serum. The serum was then pipped out and stored at -20c until further processing. All the blood samples were collected from brachial vein and were processed for haematology, (Benjamin, 1981).
Haematology
Blood samples were analyzed for Hemoglobin concentration (Hb), Packed Cell Volume (PCV), Total Leukocyte Count (TLC), Differential Leukocyte Count (DLC) using the methods followed by Benjamin, (1981) & Burg (1998). Statistical Analysis
Data was analyzed by using one way analysis of variance (ANOVA) as described by Zar (1974) to show significant difference (p<0.05).
127 USE OF HERBAL POLYSACCHARIDES VOL. 59 (1)
RESULTS AND DISCUSSION
Hematology Blood samples with anticoagulant (EDTA) from all birds were collected
from the brachial vein at the end of experiment. Blood samples were analyzed for the following hematological parameters, using the method followed by Benjamin, (1981). Hemoglobin Concentration, Packed Cell Volume (PCV), Total Leukocyte Count (TLC), Differential Leukocytes Counts (DLC). Hemoglobin (Hb)
Means Hb level is presented in (figure 4). Significant (P<0.05) differences were observed in the mean Hb levels between groups treated with Livol and not treated with Livol.
The findings of the present research study are in agreement with the findings of Esonu et al., (2006), who observed significant increase in Hb level while, feeding herbal plant (Neem) to the laying hens. Our results are also in agreement with the results of Sham & Patwardhan (2003), who reported significant effect on hemoglobin and red cell count, while feeding Withania somnifera to animals. PCV
Means PCV level is presented in (figure 4). Significant (P<0.05) differences were observed in the mean PCV levels among the treatments and non-significant (P>0.05) between the vaccinated and non-vaccinated and also among the interaction of vaccinated and non-vaccinated with groups. The findings of the present research study are parallel to the findings of Esonu et al., (2006), who observed that significant increase in PCV level while feeding herbal plant (Neem) to laying hens. TLC
Means TLC level is presented in (figure 4). Significant (P<0.05) difference was observed in the mean TLC level among the treatments and non-significant (P>0.05) difference between the vaccinated and non-vaccinated and also among the interaction of vaccinated and non-vaccinated with groups. The findings of the present research study are parallel to the findings of Esonu et al., (2006), who observed significant increase in TLC level while feeding herbal plant (Neem) to the laying Hen. Our findings justified the result of Singh et al., (2001), who reported that Withania somnifera works through macrophage chemotaxis. PCV, WBCs & Hemoglobin (Hb)
The groups which was offered Livol (Herbal Polysaccharide) in the feed showed higher PCV, WBC & Hemoglobin percentage compared with the rest of the groups (p<0.05). Significant (P<0.05) difference was observed on the mean PCV, WBCs & HB levels among the treatments and non-significant between the vaccinated and non-vaccinated and also among the interaction of vaccinated and non-vaccinated with groups. Additionally, this percentage was consistently present throughout the monitoring period in this group. Interestingly, PCV, WBC & Hemoglobin percentage of all other groups were almost the same .The two
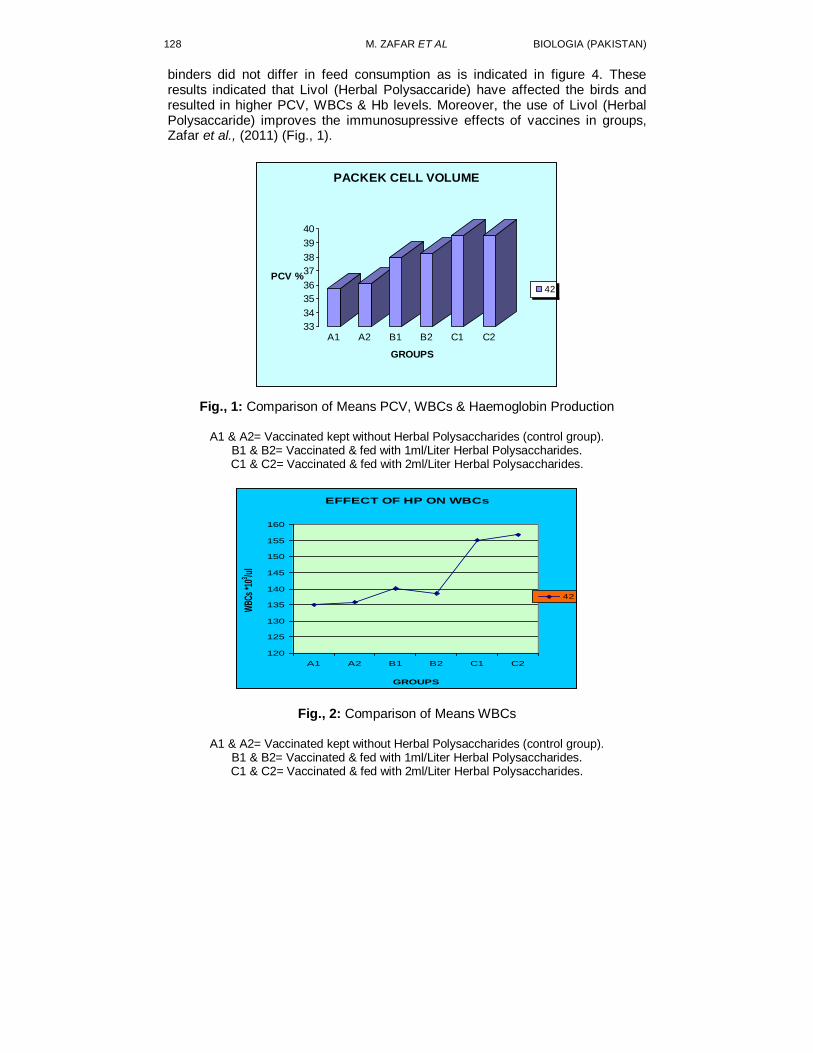
BIOLOGIA (PAKISTAN) M. ZAFAR ET AL 128
binders did not differ in feed consumption as is indicated in figure 4. These results indicated that Livol (Herbal Polysaccaride) have affected the birds and resulted in higher PCV, WBCs & Hb levels. Moreover, the use of Livol (Herbal Polysaccaride) improves the immunosupressive effects of vaccines in groups, Zafar et al., (2011) (Fig., 1).
33
34
35
36
37
38
39
40
PCV %
A1 A2 B1 B2 C1 C2
GROUPS
PACKEK CELL VOLUME
42
Fig., 1: Comparison of Means PCV, WBCs & Haemoglobin Production
A1 & A2= Vaccinated kept without Herbal Polysaccharides (control group). B1 & B2= Vaccinated & fed with 1ml/Liter Herbal Polysaccharides. C1 & C2= Vaccinated & fed with 2ml/Liter Herbal Polysaccharides.
EFFECT OF HP ON WBCs
120
125
130
135
140
145
150
155
160
A1 A2 B1 B2 C1 C2
GROUPS
WBC
s *1
03 /ul
42
Fig., 2: Comparison of Means WBCs
A1 & A2= Vaccinated kept without Herbal Polysaccharides (control group). B1 & B2= Vaccinated & fed with 1ml/Liter Herbal Polysaccharides. C1 & C2= Vaccinated & fed with 2ml/Liter Herbal Polysaccharides.

129 USE OF HERBAL POLYSACCHARIDES VOL. 59 (1)
EFFECT OF HP ON HB
0
2
4
6
8
10
12
14
A1 A2 B1 B2 C1 C2
GROUPS
HB
gm
/dl
42
Fig., 3: Comparison of Means Haemoglobin Production
A1= Vaccinated kept without Herbal Polysaccharides (control group). A2= Vaccinated kept without Herbal Polysaccharides (control group).
B1= Vaccinated & fed with 1ml/Liter Herbal Polysaccharides. B2= Vaccinated & fed with 1ml/Liter Herbal Polysaccharides. C1= Vaccinated & fed with 2ml/Liter Herbal Polysaccharides. C2= Vaccinated & fed with 2ml/Liter Herbal Polysaccharides
REFERENCES
Benjamin, M. M., 1981. Outline of veterinary clinical pathology. 2
nd Ed. Iowa
State University Press Ames Iowa, USA Burg, M. A., 1998. Simple method for recording and analyzing serological data.
Avian Dis., 2:362-365. Esonu, B. O., Opara, M. N., Okoli, I. C., Obikaonu, H. O., Udedibie, C., &
Iheshiulor, O.O., 2006. Physiological Response of Laying Birds to Neem (Azadirachta Indica) Leaf Meal-Based Diets: body weight organ characteristics and haematology. J. Ojhas. 5 (2): 972-997
Lutticken, W. D., 1981. The results of field trials with in inactivated Gumboro vaccine. Developments in Biological Standardization, 52:211-219
Qamar M. F., M. Zafar, A. A. Anjum, M. I. Najeeb & Maqbool, A., 2010. Effect of livol (herbal polysaccharide) as an immunomodulator in commercial broilers. BIOLOGIA (PAKISTAN) 56 (1&2), 23-30
Sham, D., D. C., & Patwardhan, B., 2003. Immunoprotection by botanical drugs in cancer chemotherapy. J. Ethnopharma. 90 (1): 49-55.
Singh, D.D., Dey, C.S., & Bhutani, K.K., 2001. Down regulation of p34cdc2 expression with aqueous fraction from Withania somnifera for a possible
BIOLOGIA (PAKISTAN) M. ZAFAR ET AL 130
molecular mechanism of anti-tumor and other pharmacological effects. Phytomedi, 8(6): 492–494
Skeeles, J. K., Lukert, P. D., Fletcher, O. J., Leonard, J. D., 1979. Immunization studies with a cell-culture-adapted infectious bursal disease virus. Avian Diseases, (23):107-117
Skinner, M. A. 2000. Very virulent strains of IBDV. In: World Poultry Congress, 21,Montreal, Canada. Anais. Montreal: 432-440
Spallolhz, H. E, Martin, J. L., & Gerlach, M.C., 1973. Enhanced immunoglobulin M and immunoglobulin G antibody titers in mice fed selenium. Infect. Immune.,8:841
Zafar, M., Anjum, A. A., Qamar, M. F., Najeeb, M. I., & Maqbool, A., 2011 Role of herbal polysaccharides as growth promoters in broilers. Sci. Int. (Lahore), 23(2), 157-159.
Zar, J. H., 1974. Biostatistical analysis, 6th edn. Prentice-Hall, New Jersey.
BIOLOGIA (PAKISTAN) 2013, 59 (1), 131-137 PK ISSN 0006 - 3096
*Corresponding author e-mail: [email protected]
Diversity, distribution and ecology of birds in summer
season at head Khanki, Punjab, Pakistan
*MUHAMMAD ALTAF1, ARSHAD JAVID
2, IRFAN
3, MUHAMMAD ASIF
MUNIR4, SANA ASHRAF
5, KHALID JAVED IQBAL
6, MUHAMMAD UMAIR
7,
ZULFIQAR ALI8 & ABDUL MAJID KHAN
9
1,2,3,4,5
Department of Wildlife and Ecology, UVAS, Lahore. 6Department of Fisheries and Aquaculture, UVAS, Lahore.
7Department of Botany, University of the Gujarat.
8,9Department of Zoology, University of the Punjab.
ABSTACT
Head Khanki is situated at the river Chenab (32
o24'07 N, 73
o58'39 E and
Elevation is 219 M) district Gujranwala, Punjab, Pakistan. The ecosystem is a complex of aquatic, terrestrial, forest and agricultural land. The present study was carried from April 2009 to August 2009 and data on diversity, distribution and ecology of birds was collected during dawn (5:00 am to 8:00 am) and dusk (4:00 pm to 7:00 pm) hours for a period of six months. A total of 64 bird species were recorded from the study area Shannon-wiener diversity index recorded was 3.973, Simpson diversity index 0.9793, Evenness 0.8306, Dominance 0.02067, Margalef index 0.8306 and Density was 2.20. Key Words: Birds, Diversity, Distribution, Ecology, Density, Head Khanki
INTRODUCTION
Pakistan possesses many climatic and vegetation zones within a
relatively small area (IUCN, 1989). Head Khanki is an important agri-forest wetland and despite of its ecological importance, very little work has been done about the avifauna diversity of the area. Ali & Ripley (1974) and Roberts (1991, 1992) described avifauna distribution in whole country. Waite (1948) described the avifauna of Salt Range, Pakistan. Ali (2005) recorded the diversity of water birds of Taunsa barrage. (Mahboob & Nisa, 2009) observed the water bird and it ecology and threats at Head Trimu, district Jhang. Munir (2010) and Altaf (2010) recorded the avifauna of Ravi siphon and Head Qadirabad respectively. Irfan (2010) noted the biodiversity of Changa Manga. Present study is unique in the sense that it is the first endeavor to explore the avifauna diversity of Head Khanki as bird fauna of the area has never been described separately.
A large number of birds migrate from central Asian countries and Europe towards wetlands of Pakistan to avoid severe winter. There is seven fly zones all over the world and one zone (Indus fly zone) present in Pakistan. The birds reach Pakistan flying over Karakorum, Suleiman Ranges and Hindu Kush along the Indus river. Falcons, cranes, swans, ducks, flamingos, waders and geese are important migratory birds in host country (Ali, 2005).
132 M. ALTAF ET AL BIOLOGIA (PAKISTAN)
MATERIALS AND METHODS
The present study was carried out from April 2009 to August 2009 to study the aquatic bird’s fauna at Head Khanki. Data on ecology and population of water-bird diversity was recorded from the study area. A wide range of field methods was applied during different stages of the survey. These methods were broadly classified into two categories, 1st direct field observations and 2nd information from the local community i.e. indirect observations (meetings with the locals). Roberts, 1991; 1992; Mirza & Wasiq, 2007; Grimmett et al., 1998 were consulted for identification and previous distribution of birds of the study area.
Study area: Head Khanki (32о24'07 N, 073
о58'39 E, 219 M) is situated
at river Chenab and is placed adjacent to Gujranwala and Gujarat districts. It is an agri-forest land and has a highly variable diversity. pH of water varies from 7.1 to 8.1 (Irrigation and Power Department Punjab, 2007). Climate of the area is temperate with four seasons. Summers are relatively longer with temperatures reaching upto 45
oC.
Ecology: Head Khanki is a tropical forest (Siddiqui, 1997), wetland area (IUCN, 1989; Scott, 1989) and rich in biodiversity. Most common aquatic vegetation of the study area includes hydrilla (Hydrilla verticillata), Indian lotus (Nelumbo nucifera), water lily (Nymphaea lotus), lesser Indian reed mace (Typha angustata), eel grass (Vallisneria spiralis), horned pondweed (Zannichellia palustris) and muskgrass (Chara sp.). Important natural vegetation of the surrounding plains includes jand (Prosopis cineraria), athel (Tamarix aphylla), Indian plum (Zizyphus mauritiana), goose grass (Eleusine compressa), kans grass (Saccharum spontaneurn), shisham (Dalbergia sissoo) and Kikar or thorn-tree (Acacia nilotica) (Savage, 1968; Roberts, l984; IUCN, 1987). Most common weed species of the study area include gajar boti (Parthenium hysterophorous) burra gokharu (Tribulus terrestris L.), common cockle-bur (Xanthium strumarium), slender amaranth (Amaranthus viridis), Indian doab (Cynodon dactylon), devil's horsewhip (Achyranthes aspera), prostrate spurge (Euphorbia prostrata L.) and marijuana (Cannabis sativa). Rice (Oryza sativa), wheat (Triticum aestivum) and pea plants (Pisum sativum) are amongst the prominent crop species of the area (Savage, 1968). Most abundant fish species of the river Chenab include Tilapia (Oreochromis niloticus), Rohu (Labeo rohita), Mori (Cirrhinus mrigala), Foji Khaga (Bagarius bagarius), Sangari (Sperata sarwari), Dola (Channa punctate), Masheer (Tor microlopsis) and Khaga (Rita rita) (Mirza, 1994, 2004; Qadir, 2009). Most dominant wild mammalian fauna is wild boar (Sus scrofa), small Indian mongoose (Herpestes javanicus), palm squirrel (Funnambulus pennantii), Indian crested porcupine (Hystrix cristatus), House rat (Rattus rattus) Small Indian mongoose (Herpestes javanicus) and Indian Wild boar (Sus scrofa) (Roberts, 1997, 2005a, b).
Statistical Analysis: Shannon-wiener Diversity Index was calculated in order to know the species diversity in different habitats. It was calculated based on the abundance of the species by the following formula given by Shannon and Weaver, 1963.
H' = - [ΣPІ In PІ] Where, H' = Diversity Index
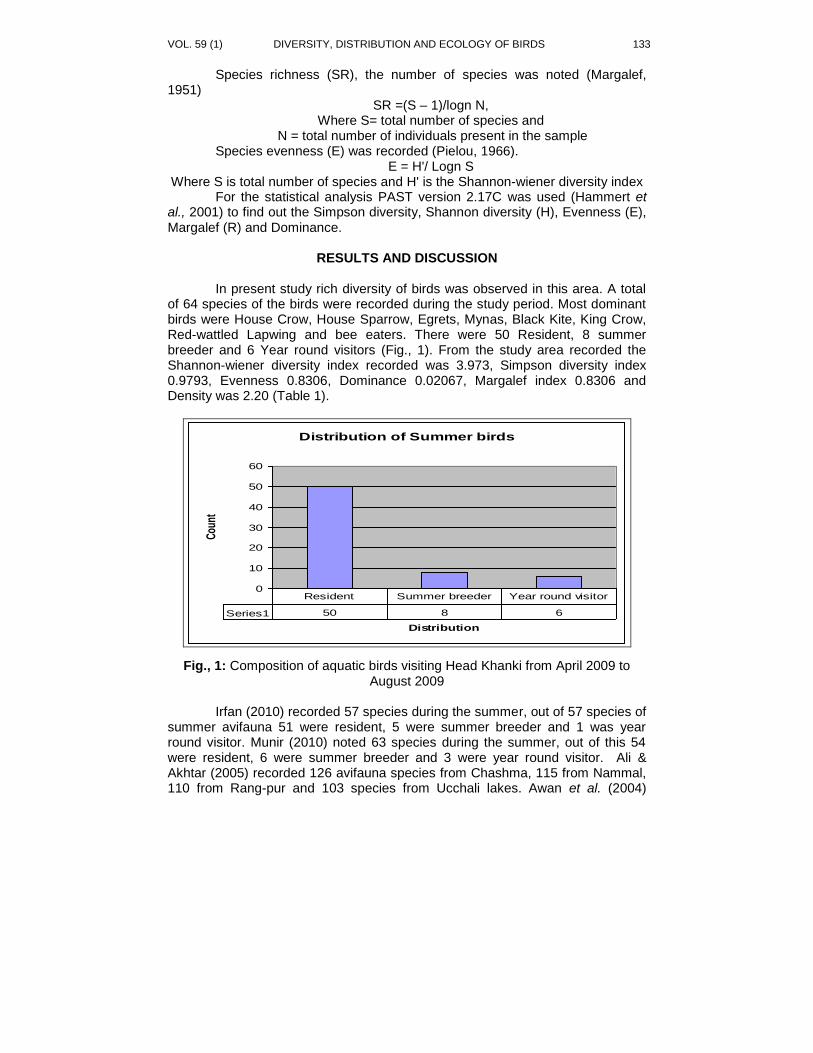
VOL. 59 (1) DIVERSITY, DISTRIBUTION AND ECOLOGY OF BIRDS 133
Species richness (SR), the number of species was noted (Margalef, 1951)
SR =(S – 1)/logn N, Where S= total number of species and
N = total number of individuals present in the sample Species evenness (E) was recorded (Pielou, 1966).
E = H'/ Logn S Where S is total number of species and H' is the Shannon-wiener diversity index
For the statistical analysis PAST version 2.17C was used (Hammert et al., 2001) to find out the Simpson diversity, Shannon diversity (H), Evenness (E), Margalef (R) and Dominance.
RESULTS AND DISCUSSION
In present study rich diversity of birds was observed in this area. A total
of 64 species of the birds were recorded during the study period. Most dominant birds were House Crow, House Sparrow, Egrets, Mynas, Black Kite, King Crow, Red-wattled Lapwing and bee eaters. There were 50 Resident, 8 summer breeder and 6 Year round visitors (Fig., 1). From the study area recorded the Shannon-wiener diversity index recorded was 3.973, Simpson diversity index 0.9793, Evenness 0.8306, Dominance 0.02067, Margalef index 0.8306 and Density was 2.20 (Table 1).
Distribution of Summer birds
0
10
20
30
40
50
60
Distribution
Cou
nt
Series1 50 8 6
Resident Summer breeder Year round visitor
Fig., 1: Composition of aquatic birds visiting Head Khanki from April 2009 to August 2009
Irfan (2010) recorded 57 species during the summer, out of 57 species of
summer avifauna 51 were resident, 5 were summer breeder and 1 was year round visitor. Munir (2010) noted 63 species during the summer, out of this 54 were resident, 6 were summer breeder and 3 were year round visitor. Ali & Akhtar (2005) recorded 126 avifauna species from Chashma, 115 from Nammal, 110 from Rang-pur and 103 species from Ucchali lakes. Awan et al. (2004)
134 M. ALTAF ET AL BIOLOGIA (PAKISTAN)
during the survey of Muzaffar-abad, Azad Kashmir, Pakistan, a total of 59 species were noted, out of which 24 were resident, 14 were winter visitor, 11 were summer visitor.
Table 1: Summary of the data of Head Khanki.
Common name Scientific name Distribution max
Density (Ha)
Little Grebe or Dabchick Tachybaptus ruficollis Resident 17 0.01
Little/Javanese Cormorant Phalacrocorax niger Year round visitor 36 0.03
Darter/Snake Bird Anhinga melanogaster Year round visitor 3 0.00
Chinies/Yellow Bittern Exobrychus sinensis Year round visitor 3 0.00
Night Heron Nycticorax nycticorax Summer breeder 18 0.02
Indian Pond Heron Ardeola grayii Resident 36 0.03
Cattle Egret Bubulcus ibis Resident 66 0.06
Little Egret Egretta garzetta Year round visitor 210 0.18
Large Egret Egretta alba Resident 250 0.21
Intermediate Egret Egretta intermedia Year round visitor 45 0.04
Indian/Black Kite Milvus migrans migrans Resident 150 0.13
Black Winged Kite Elanus caeruleus Resident 2 0.00
Common Buzzard Buteo buteo Year round visitor 4 0.00
Tawny Eagle Aquila rapax nipalensis Resident 2 0.00
Black partridge Francolinus francolinus Resident 9 0.01
Indian Grey Partridge Francolinus pondicerianus Resident 10 0.01
Common Quail Coturnix coturnix Summer breeder 12 0.01
White-breasted Waterhen Amaurornis phoenicurus Resident 21 0.02
Common Moorhen Gallinula chloropus Resident 12 0.01
Black-winged Stilt Himantopus himantopus Summer breeder 50 0.04
Red-wattled Lapwing Hoplopterus indicus Resident 45 0.04
Little Tern Sterna albifrons Summer breeder 11 0.01
Blue Rock Pigeon Columba livia Resident 6 0.01
Indian Ring Dove Streptopelia decaocta Resident 55 0.05
Red Turtle Dove Streptopelia tranquebarica
Summer breeder 34 0.03
Little Brown Dove Streptopelia senegalensis Resident 34 0.03
Large Indian Parakeet Psittacula eupatria Resident 8 0.01
Rose-ringed Parakeet Psitta krameri Resident 11 0.01
Pied Crested Cuckoo Clamator jacobinus Summer breeder 7 0.01
Common Hawk Cuckoo Hirrococcyx varius Resident 33 0.03
Little Swift Apus affinis Resident 24 0.02
VOL. 59 (1) DIVERSITY, DISTRIBUTION AND ECOLOGY OF BIRDS 135
Table 1: Continued….
White-throated Kingfisher Halcyon smyrnensis Resident 30 0.03
Common Kingfisher Alcedo atthis Resident 35 0.03
Small Pied kingfisher Ceryle rudis Resident 34 0.03
Little Green Bea-eater Merops orientalis Resident 50 0.04
Blue-cheeked Bee-eater Merops supercilliosus Summer breeder 45 0.04
Common Hoopoe Upupa epops Resident 8 0.01
Indian Roller/Blue Jay Coracias benghalensis Resident 7 0.01
Indian Sindh Martin Riparia paludicola Resident 14 0.01
Richard Pipit/Paddy Pipit Anthus novaeseelandiae Resident 7 0.01
Large Pied Wagtail Motacilla maderaspatensis Resident 3 0.00
Lesser Wood Shrike Tephrodornis pondicerian Resident 4 0.00
White-cheeked Bulbul Pycnonotus leucogenys Resident 4 0.00
Red-vented Bulbul Pycnonotus cafer Resident 9 0.01
White-tailed Bush Chat Saxicola leucura Resident 11 0.01
Indian Robin Saxicoloides fulicata Resident 4 0.00
Fan-tailed Warbler Cisticola juncidis Resident 2 0.00
Plain Coloured Prinia Prinia inornata Resident 3 0.00
Long-tailed Grass Warbler Prinia burnesii Resident 3 0.00
Tailor Bird Orthotomus sutorius Resident 2 0.00
Ashy long-tailed Warbler Prinia socialis Resident 2 0.00
White-browned Fantail Flycatcher
Rhipidura aureola Resident 2 0.00
Sind Babbler Chrysomma altirostre Resident 2 0.00
Common Babler Turdoides caudatus Resident 9 0.01
Striated Babbler Turdoides earlei Resident 17 0.01
Jungle Babbler Turdoides striatus Resident 5 0.00
Purple Sunbird Nectarinia asiatica Summer breeder 29 0.02
Black Drongo/King Crow Dicrurus macrocercus Resident 410 0.34
Common Myna Acridothere tristis Resident 100 0.08
Bank Myna Acridothere ginginianus Resident 35 0.03
Indian Tree Pie Dendocitta vagabunda Resident 10 0.01
House Crow Corvus splendens Resident 120 0.10
House Sparrow Passer domesticus Resident 400 0.33
Indian Silverbill Lonchura malabarica Resident 4 0.00
Total 2644 2.20
136 M. ALTAF ET AL BIOLOGIA (PAKISTAN)
During present survey maximum population of 2644 birds was noted. Irfan (2010) during survey of Changa Manga noted 524 bird’s maximum number. Munir (2010) observed maximum of 363 number of avifauna from Ravi Siphon. Threats: The main threats to birds were the following: habitat loss and degradation, chemical toxins, chemical pollution, avian diseases, human disturbance of nesting, feeding and roosting areas, shortage of water, degraded quality of foraging habitat by the invasion of introduced species and public dislike for some species.
REFERENCES
Ali, S. & Ripley, S. D., 1974. Handbook of the Birds of India and Pakistan. Vol. 10. Oxford University Press, Bombay.
Ali, Z. & Akhtar, M. 2005. Bird surveys at wetlands in Punjab, Pakistan, with special reference to the present status of White-headed Duck Oxyura leucocephala. Forktail. 21: 43–50.
Ali, Z., 2005. Ecology, distribution and conservation of migratory birds at Uchalli Wetlands Complex, Punjab, Pakistan. Ph.D. Thesis. University of the Punjab. Pakistan. 265 pp.
Altaf, M., 2010. Ecology and Diversity of Birds of Head Qadirabad, Gujranwala, Pakistan. M.Phil. Thesis. University of Veterinary and Animal Sciences, Pakistan. 85 pp.
Awan, M.N., M. S. Awan, K. B. Ahmed, A. A. Khan & N. I. Dar, (2004). A Preliminary Study on Distribution of Avian Fauna of Muzaffarabad–Azad Jammu and Kashmir, Pakistan. IJAB. 06 (2): 300–302.
Grimmet, R., Inskipp, C. & Inskip, T., 1998. Birds of the Indian subcontinent, Christopher Helm an imprint of A and C Black (Publisher) Ltd, 35 Bedford Row, London WCIR 4JH. Pp:888.
Hammert, Q., D. A. T. Harper & P. D., Ryan, 2001. Past paleontological statistical software package for education and data analysis. PE. 4 (1):9.
Irfan (2010). Ecology and population of Birds of Changa Manga Forest, Pakistan. M.Phil. Thesis. University of Veterinary and Animal Sciences, Pakistan. 61 pp.
Irrigation and Power Department Punjab, 2007. Surface water quality monitoring in Punjab, Directorate of Land Reclamation Punjab Canal Bank Moghalpura, Lahore.
IUCN, 1987. Directory of Wetlands of International Importance: Sites designated under the Convention on Wetlands of International Importance especially as Waterfowl Habitat. Gland and Cambridge: IUCN.
IUCN, 1989. Pakistan Fact Sheet Water. Journalist Resource Centre for the Environment, IUCN Pakistan.
Mahboob, S. & Nisa, Z., 2009. Diversity of Avifauna of Trimmu barrage District Jhang, Punjab, Pakistan. Pakistan J. Zool., 41(1): 43-49.
Margalef, R.,1951. Diversidad de especies en lascomunidalesnaturales.Publ. Inst. Biol. Apl. 9: 5-27.
Mirza, M. R., (1994). Geographical distribution of freshwater fishes in Pakistan: A review. Punjab Uni. J. Zool. 9: 93-108.
VOL. 59 (1) DIVERSITY, DISTRIBUTION AND ECOLOGY OF BIRDS 137
Mirza, M. R., (2004). Freshwater fishes of Pakistan, (Urdu) Urdu Science board.2. pp:244.
Mirza, Z. B. & Wasiq, H., 2007. A field guide to birds of Pakistan. in press. Pp: 366.
Munir, M. A., 2010. Status of wild life close to Indian border area at Ravi siphon, Pakistan. M.Phil. Thesis. University of Veterinary and Animal Sciences, Pakistan. 69 pp.
Pielou, E.C., 1966. The measurement of diversity in different types of biological collections.J. Theoret. Biol.,13:131-144.
Qadir, A. 2009. Effect of anthropogenic activities on water quality and fish fauna of Nullah Aik and Nullah Palkhu tributaries of River Chenab, Pakistan. Ph.D. Thesis. Quad-I-Azam University, Islamabad. 262 pp.
Roberts, T. J., 1984. Brief Review of the Status of Wetlands in Pakistan. Paper presented at the 10th Asian Continental Section Conference of ICBP, Kandy, Sri Lanka, ICBP.
Roberts, T. J., 1991. The Birds of Pakistan, Oxford University Press, Karachi: I. pp: 598.
Roberts, T. J., 1992. The Birds of Pakistan, Oxford University Press, Karachi: II. pp: 617.
Roberts, T. J., 1997. The mammals of Pakistan, Oxford University Press, New Yark. pp:525.
Roberts, T. J., 2005a. Small mammals of Pakistan, Oxford University Press, Karachi.pp:280.
Roberts, T. J., 2005b. Large and medium-sized mammals of Pakistan, Oxford University Press, pp: 258
Savage, C. D. W., 1968. The Wildfowl and Wetland Situation in West Pakistan. In: Proc. Technical Meeting on Wetland Conservation, Ankara- Bursa-Istanbul, 9-16 October 1967. IUCN Publications new series, 12:122-128.
Scott, D. A., 1989. A Directory of Asian Wetlands. IUCN Switzerland, and Cambridge, U.K. xiv + 1181 pp., 33 maps.
Shannon, C. E. and W. Weaver. 1963. The Mathematical Theory of Communication. Urbana, I.L: University of Illinois Press. pp: 31–35.
Siddiqui K. M., 1997. Asia-pacific forestry sector outlook study. Forestry Policy and Planning Division, Rome, regional Office for Asia and the Pacific, Bangkok.
Waite, H. W., 1948. The birds of Punjab Salt Range, Pakistan. Jour. Bombay Nat. Hist. Soc. 48: 93-117.
BIOLOGIA (PAKISTAN) 2013, 59 (1), 139-146 PK ISSN 0006 - 3096
*Corresponding author: [email protected]
Ethnobotanical evaluation of the shrubs of Central Punjab,
Pakistan
ARIFA ZEREEN, ZAHEER-UD-DIN KHAN AND MUHAMMAD AJAIB
Department of Botany, GC University, Lahore, Pakistan.
ABSTRACT
The ethnobotanical data on the various medicinal uses of the shrubs of central Punjab, Pakistan, was documented during 2008-10. Using semi- structured questionnaire about 125 informants of different age groups (30-80 years old) were interviewed to obtain ethnobotanical information. A total of 35 plant species belonging to 22 families were identified by the indigenous people of the study area in their daily life use as medicines, fuel wood, shelter, forage/fodder, etc. Most of the shrubs were recorded to have single use. Family Capparidaceae was found unique among all the families in having comparatively the larger number of species, i.e., 4.
Keywords: Ethnobotany, Wild Shrubs, Ethnomedicinal shrubs, Central Punjab.
INTRODUCTION
Man utilizes plants for several purposes such as medicine, fruit, vegetables, fodder, and fuel, etc. The plant based medicines are essential for healthier life as they are effective, inexpensive and without any side effects. Plants play more role in our life than animals because they possess many biochemicals that are effective against different ailments (Cotton, 1996; Buckingham, 1999). Ethnobotanical knowledge on plants and their uses by indigenous people can be utilized not only for conservation of traditional cultures and plant diversity but also in the promotion of herbal medicines. This information is exploited as a guide for new drug development under the assumption that a plant which has been utilized by indigenous people over a long period of time may have an allopathic application as well (Fransworth, 1993).
Central Punjab is rich in plant diversity because of its diversified climate and soil types. The present Ethnobotanical survey was conducted to record the ethnobotanical data on the economically important shrubs of eight districts of central Punjab, that lies in between longitude 74.21″ east and latitude 31.33″ north. The population of the central Punjab is about 16,687,160 according to 1998 census. Its area is 26230 sq.km. The climate of the central Punjab is characterized by large seasonal fluctuations in temperature and rainfall. It is continental, ranging from sub- humid in the north- east to arid in the south- west. Day time temperature remains within 16 and 21
◦C and night time temperature
below 4.5◦C during winter (December- February). Maximum temperature of more
than 40◦C is common from May to August, although the warmest months are
May and June, prior to the monsoon- rain. The Central Punjab is on the fringe of the monsoon belt and about 70% of the average rainfall occurs during monsoon season from July to September, the remainder in winter season.
Ahmad et al., (2011) carried out ethnobotanical studies of Tehsil Kabal, Swat District, KPK and recorded 140 plant species in use for medicinal, food,
140 A. ZEREEN ET AL BIOLOGIA (PAKISTAN)
timber, wood and fodder purposes. In a similar study conducted by Murad et al. (2012) in Hazar Nao Forest, District Malakand, Pakistan about 90 vascular plant species, belonging to 56 families were found in use by indigenous people for various purposes. The ethnobotanical studies of Tehsil Birmal in South Waziristan Agency, Pakistan was carried out by Farooq et al. (2012) and 72 plant species were found useful mostly as medicinal, forage, fuel, wood, vegetables, timber, etc. Bahadur (2012) recorded 19 plant species belonging to different families, which were used by Merbazghaz communities, Murdan for treating different ailments. In an ethnomedicinal study of the flora of District Sialkot, Punjab, Pakistan, medicinal uses of about 48 plant species were recorded. In another study conducted by Safa et al. (2012) in order to record the ethnobotanical and ethnomedicinal knowledge of the inhabitants of Hormozgan Province, Iran, about 150 plant species were documented having medicinal abilities in treating or curing different diseases as well as having other conventional uses.Likewise, in the present ethnobotanical study, it was noticed that the local people were mostly depending on the local flora for medicine, food, fuel, forage/fodder, etc.
MATERIALS AND METHODS
The ethnobotanical knowledge of the eight districts viz.; Faisalabad, Pakpattan, Lahore, Nankana Sahib, Narowal, Sahiwal, Sialkot and Vehari of central Punjab was documented by interviewing local people, herbal drug dealers, hakims and growers, using semi-structured questionnaire. Mostly elderly people and herbal practitioners were consulted for obtaining the Ethnobotanical information as they were found to possess a lot of knowledge about the local plants and their traditional uses. The plant species collected from the area were pressed, dried and mounted properly on herbarium sheets. They were identified with the help of Flora of Pakistan by Nasir & Ali (1970-1989), Ali & Nasir (1990-1992) & Ali & Qaisar (1992-2009). Voucher numbers were pasted on the mounted plant specimens that were deposited in Dr. Sultan Ahmad Herbarium, GC University, Lahore.
RESULTS AND DISCUSSION
Ethnobotanical uses of 35 species of shrubs belonging to 22 angiospermic families documented from indigenous people, showed that the shrubs were in use from generations to generations for medicinal, fruit, forage/fodder, fuel, fence, ornamental purposes, etc. It was observed that most of the shrubs were medicinally important for the treatment of human ailments of digestive tract, skin, rheumatic pains, cardiac and pulmonary problems, etc. On the whole it was found that 23 species (65%) were having single uses, 10 (29 %) two uses and the remaining 2 (6 %) having multiuse (Fig., 1). The list of shrubs with an arrangement of plant species in alphabetical order of their botanical names followed by local name, family, part used and traditional uses along with the flowering period is given in (Table 1).
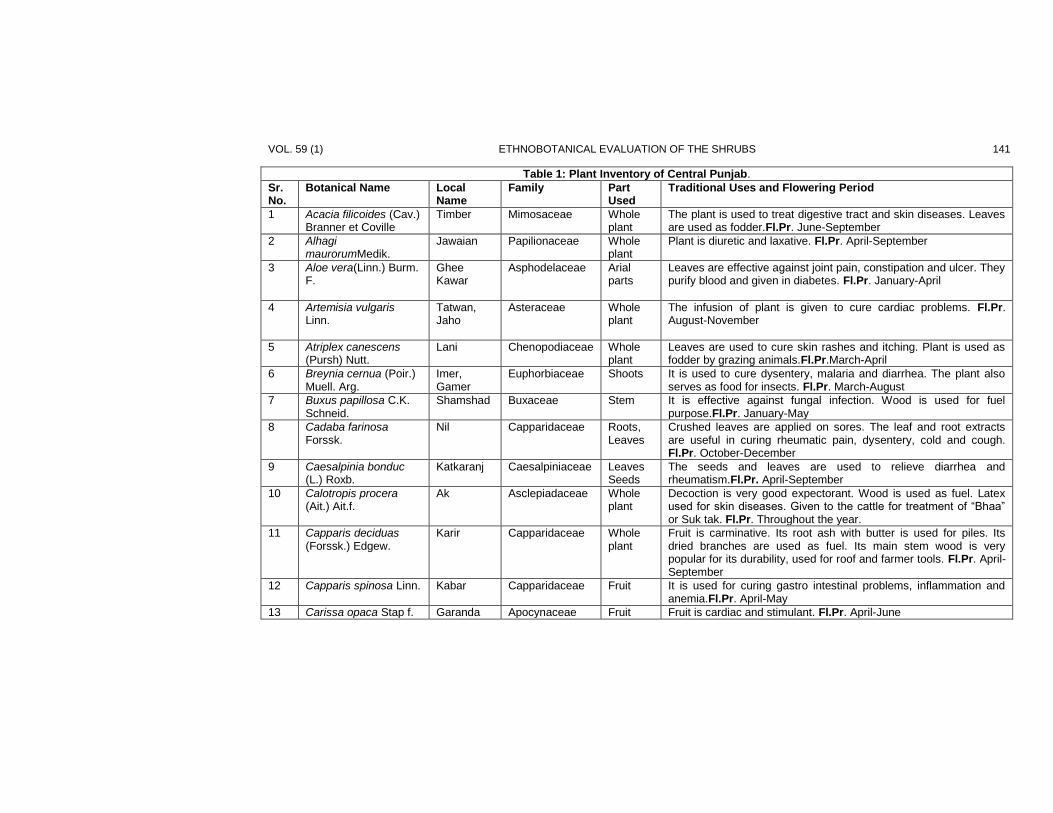
VOL. 59 (1) ETHNOBOTANICAL EVALUATION OF THE SHRUBS 141
Table 1: Plant Inventory of Central Punjab.
Sr. No.
Botanical Name Local Name
Family Part Used
Traditional Uses and Flowering Period
1 Acacia filicoides (Cav.) Branner et Coville
Timber Mimosaceae
Whole plant
The plant is used to treat digestive tract and skin diseases. Leaves are used as fodder.Fl.Pr. June-September
2 Alhagi maurorumMedik.
Jawaian Papilionaceae
Whole plant
Plant is diuretic and laxative. Fl.Pr. April-September
3 Aloe vera(Linn.) Burm. F.
Ghee Kawar
Asphodelaceae
Arial parts
Leaves are effective against joint pain, constipation and ulcer. They purify blood and given in diabetes. Fl.Pr. January-April
4 Artemisia vulgaris Linn.
Tatwan, Jaho
Asteraceae Whole plant
The infusion of plant is given to cure cardiac problems. Fl.Pr. August-November
5 Atriplex canescens (Pursh) Nutt.
Lani Chenopodiaceae Whole plant
Leaves are used to cure skin rashes and itching. Plant is used as fodder by grazing animals.Fl.Pr.March-April
6 Breynia cernua (Poir.) Muell. Arg.
Imer, Gamer
Euphorbiaceae Shoots
It is used to cure dysentery, malaria and diarrhea. The plant also serves as food for insects. Fl.Pr. March-August
7 Buxus papillosa C.K. Schneid.
Shamshad Buxaceae
Stem
It is effective against fungal infection. Wood is used for fuel purpose.Fl.Pr. January-May
8 Cadaba farinosa Forssk.
Nil
Capparidaceae Roots, Leaves
Crushed leaves are applied on sores. The leaf and root extracts are useful in curing rheumatic pain, dysentery, cold and cough. Fl.Pr. October-December
9 Caesalpinia bonduc (L.) Roxb.
Katkaranj Caesalpiniaceae Leaves Seeds
The seeds and leaves are used to relieve diarrhea and rheumatism.Fl.Pr. April-September
10 Calotropis procera (Ait.) Ait.f.
Ak Asclepiadaceae Whole plant
Decoction is very good expectorant. Wood is used as fuel. Latex used for skin diseases. Given to the cattle for treatment of “Bhaa” or Suk tak. Fl.Pr. Throughout the year.
11 Capparis deciduas (Forssk.) Edgew.
Karir Capparidaceae Whole plant
Fruit is carminative. Its root ash with butter is used for piles. Its dried branches are used as fuel. Its main stem wood is very popular for its durability, used for roof and farmer tools. Fl.Pr. April-September
12 Capparis spinosa Linn. Kabar Capparidaceae Fruit It is used for curing gastro intestinal problems, inflammation and anemia.Fl.Pr. April-May
13 Carissa opaca Stap f. Garanda Apocynaceae Fruit Fruit is cardiac and stimulant. Fl.Pr. April-June
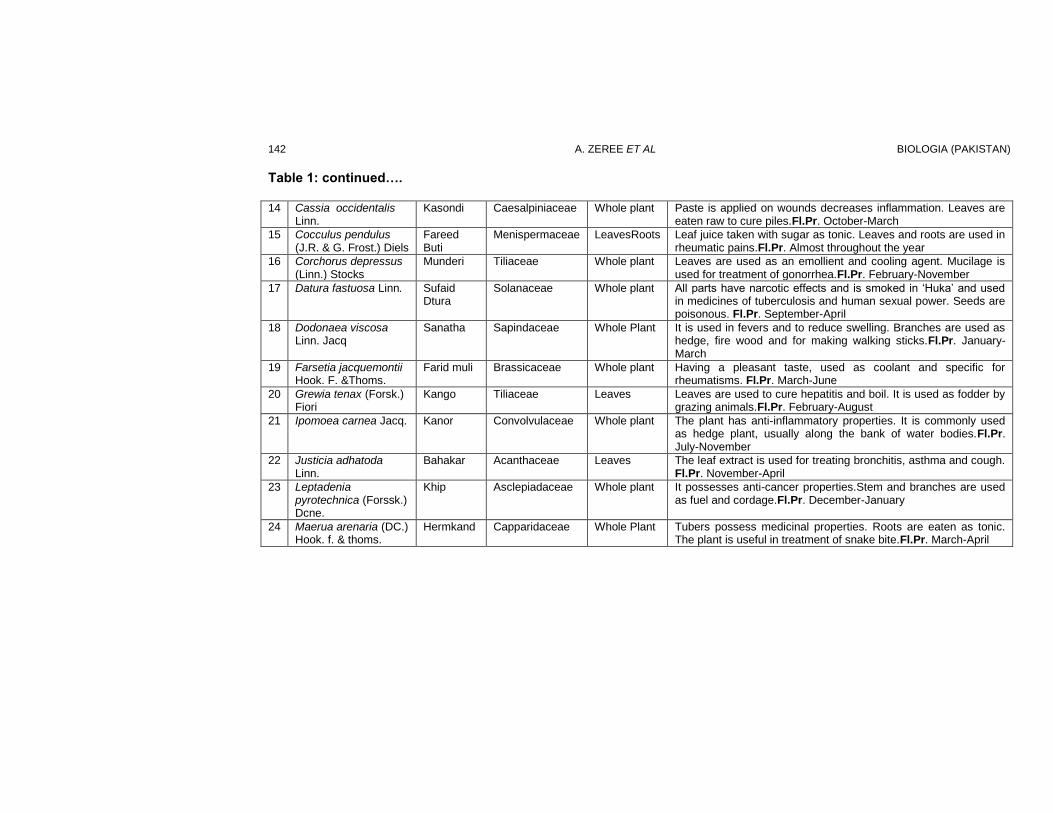
142 A. ZEREE ET AL BIOLOGIA (PAKISTAN)
Table 1: continued…. 14 Cassia occidentalis
Linn. Kasondi Caesalpiniaceae Whole plant Paste is applied on wounds decreases inflammation. Leaves are
eaten raw to cure piles.Fl.Pr. October-March
15 Cocculus pendulus (J.R. & G. Frost.) Diels
Fareed Buti
Menispermaceae LeavesRoots Leaf juice taken with sugar as tonic. Leaves and roots are used in rheumatic pains.Fl.Pr. Almost throughout the year
16 Corchorus depressus (Linn.) Stocks
Munderi Tiliaceae Whole plant Leaves are used as an emollient and cooling agent. Mucilage is used for treatment of gonorrhea.Fl.Pr. February-November
17 Datura fastuosa Linn.
Sufaid Dtura
Solanaceae
Whole plant
All parts have narcotic effects and is smoked in „Huka‟ and used in medicines of tuberculosis and human sexual power. Seeds are poisonous. Fl.Pr. September-April
18 Dodonaea viscosa Linn. Jacq
Sanatha Sapindaceae Whole Plant It is used in fevers and to reduce swelling. Branches are used as hedge, fire wood and for making walking sticks.Fl.Pr. January-March
19 Farsetia jacquemontii Hook. F. &Thoms.
Farid muli Brassicaceae Whole plant Having a pleasant taste, used as coolant and specific for rheumatisms. Fl.Pr. March-June
20 Grewia tenax (Forsk.) Fiori
Kango Tiliaceae Leaves Leaves are used to cure hepatitis and boil. It is used as fodder by grazing animals.Fl.Pr. February-August
21 Ipomoea carnea Jacq. Kanor Convolvulaceae Whole plant The plant has anti-inflammatory properties. It is commonly used as hedge plant, usually along the bank of water bodies.Fl.Pr. July-November
22 Justicia adhatoda Linn.
Bahakar Acanthaceae Leaves The leaf extract is used for treating bronchitis, asthma and cough. Fl.Pr. November-April
23 Leptadenia pyrotechnica (Forssk.) Dcne.
Khip Asclepiadaceae Whole plant It possesses anti-cancer properties.Stem and branches are used as fuel and cordage.Fl.Pr. December-January
24 Maerua arenaria (DC.) Hook. f. & thoms.
Hermkand Capparidaceae Whole Plant Tubers possess medicinal properties. Roots are eaten as tonic. The plant is useful in treatment of snake bite.Fl.Pr. March-April
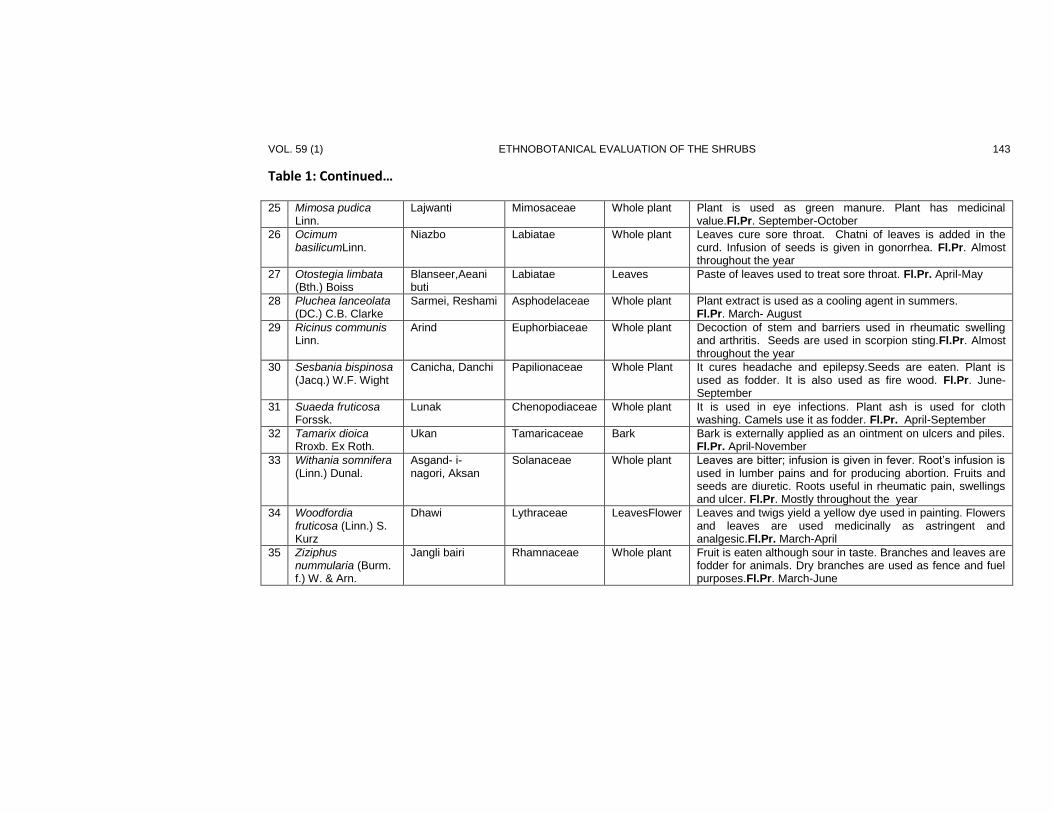
VOL. 59 (1) ETHNOBOTANICAL EVALUATION OF THE SHRUBS 143
Table 1: Continued…
25 Mimosa pudica Linn.
Lajwanti Mimosaceae Whole plant Plant is used as green manure. Plant has medicinal value.Fl.Pr. September-October
26 Ocimum basilicumLinn.
Niazbo Labiatae Whole plant Leaves cure sore throat. Chatni of leaves is added in the curd. Infusion of seeds is given in gonorrhea. Fl.Pr. Almost throughout the year
27 Otostegia limbata (Bth.) Boiss
Blanseer,Aeani buti
Labiatae Leaves Paste of leaves used to treat sore throat. Fl.Pr. April-May
28 Pluchea lanceolata (DC.) C.B. Clarke
Sarmei, Reshami Asphodelaceae Whole plant Plant extract is used as a cooling agent in summers. Fl.Pr. March- August
29 Ricinus communis Linn.
Arind Euphorbiaceae
Whole plant
Decoction of stem and barriers used in rheumatic swelling and arthritis. Seeds are used in scorpion sting.Fl.Pr. Almost throughout the year
30 Sesbania bispinosa (Jacq.) W.F. Wight
Canicha, Danchi Papilionaceae Whole Plant It cures headache and epilepsy.Seeds are eaten. Plant is used as fodder. It is also used as fire wood. Fl.Pr. June-September
31 Suaeda fruticosa Forssk.
Lunak Chenopodiaceae Whole plant It is used in eye infections. Plant ash is used for cloth washing. Camels use it as fodder. Fl.Pr. April-September
32 Tamarix dioica Rroxb. Ex Roth.
Ukan Tamaricaceae
Bark
Bark is externally applied as an ointment on ulcers and piles. Fl.Pr. April-November
33 Withania somnifera (Linn.) Dunal.
Asgand- i- nagori, Aksan
Solanaceae Whole plant Leaves are bitter; infusion is given in fever. Root‟s infusion is used in lumber pains and for producing abortion. Fruits and seeds are diuretic. Roots useful in rheumatic pain, swellings and ulcer. Fl.Pr. Mostly throughout the year
34 Woodfordia fruticosa (Linn.) S. Kurz
Dhawi Lythraceae LeavesFlower Leaves and twigs yield a yellow dye used in painting. Flowers and leaves are used medicinally as astringent and analgesic.Fl.Pr. March-April
35 Ziziphus nummularia (Burm. f.) W. & Arn.
Jangli bairi
Rhamnaceae
Whole plant
Fruit is eaten although sour in taste. Branches and leaves are fodder for animals. Dry branches are used as fence and fuel purposes.Fl.Pr. March-June
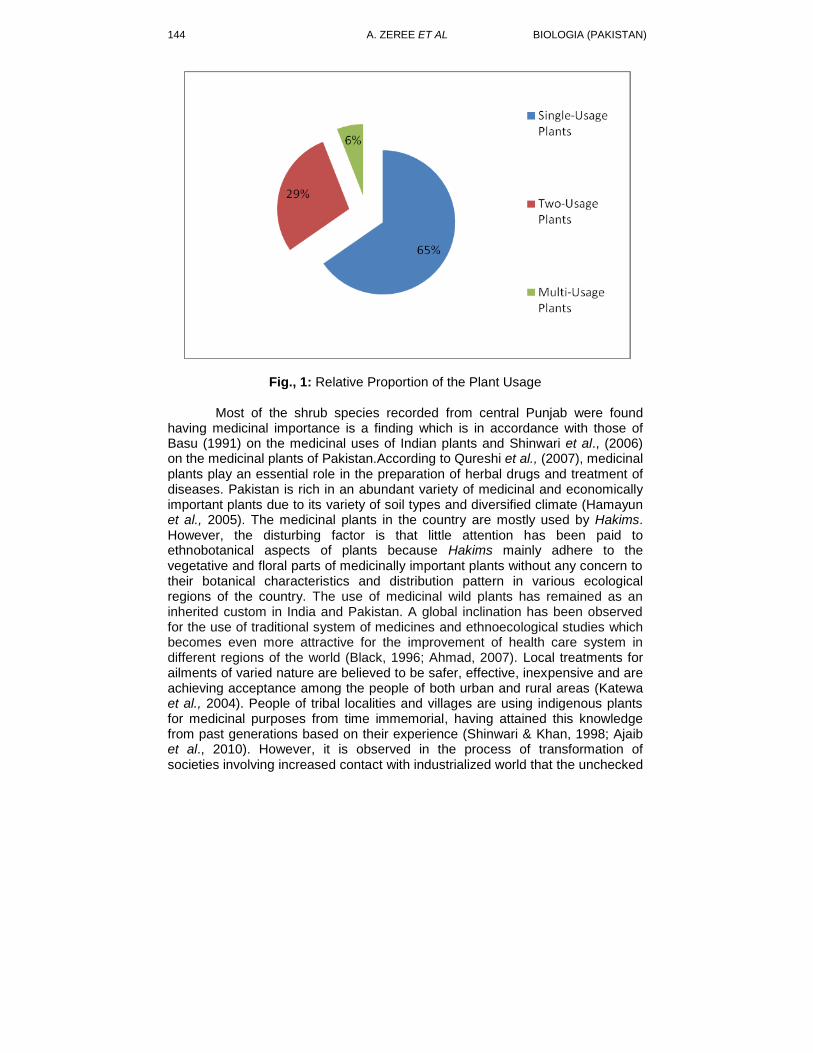
144 A. ZEREE ET AL BIOLOGIA (PAKISTAN)
Fig., 1: Relative Proportion of the Plant Usage
Most of the shrub species recorded from central Punjab were found having medicinal importance is a finding which is in accordance with those of Basu (1991) on the medicinal uses of Indian plants and Shinwari et al., (2006) on the medicinal plants of Pakistan.According to Qureshi et al., (2007), medicinal plants play an essential role in the preparation of herbal drugs and treatment of diseases. Pakistan is rich in an abundant variety of medicinal and economically important plants due to its variety of soil types and diversified climate (Hamayun et al., 2005). The medicinal plants in the country are mostly used by Hakims. However, the disturbing factor is that little attention has been paid to ethnobotanical aspects of plants because Hakims mainly adhere to the vegetative and floral parts of medicinally important plants without any concern to their botanical characteristics and distribution pattern in various ecological regions of the country. The use of medicinal wild plants has remained as an inherited custom in India and Pakistan. A global inclination has been observed for the use of traditional system of medicines and ethnoecological studies which becomes even more attractive for the improvement of health care system in different regions of the world (Black, 1996; Ahmad, 2007). Local treatments for ailments of varied nature are believed to be safer, effective, inexpensive and are achieving acceptance among the people of both urban and rural areas (Katewa et al., 2004). People of tribal localities and villages are using indigenous plants for medicinal purposes from time immemorial, having attained this knowledge from past generations based on their experience (Shinwari & Khan, 1998; Ajaib et al., 2010). However, it is observed in the process of transformation of societies involving increased contact with industrialized world that the unchecked
VOL. 59 (1) ETHNOBOTANICAL EVALUATION OF THE SHRUBS 145
erosion of natural resource based indigenous knowledge with no measures for its protection, is gradually decreasing. Most of the shrubs in central Punjab were found having single usage (65 %). It was observed that random and unauthorized cutting of plants by the local inhabitants for their fuel demand and the damage caused by animal grazing was causing significant loss to the local vegetation. It was noticed that the number of endangered species was increasing due to environmental deterioration and overexploitation of useful plants, overgrazing etc. People are ignorant of the importance of sustainable use and conservation of biological resources. Ruthless and unmanaged storage of medicinally important plants and over grazing may result in extinction of many valuable plants. Thus it is imperative that for the conservation of natural flora local community should be involved (Khalid, 1995).
REFERENCES
Ahmad, I., Ibrar, M., Barkatullah, & Ali, N., 2011. Ethnobotanical study of tehsil
Kabal, Swat District, KPK, Pakistan. Hindawi Publishing Corporation. J. Bot., 2011(2011): 1-9.
Ahmad, S.S., 2007. Medicinal wild plants from Lahore- IslamabadMotorway, (M-2). Pak. J. Bot., 39(2): 355- 377.
Ajaib, M., Khan, Z., Khan, N. & Wahab, M., 2010. Ethnobotanical studies on useful shrubs of District Kotli, Pakistan. Pak. J. Bot., 42(3): 1407-1415.
Ali, S.I. & Qaisar, M., (Edit.) 1992-2009. Flora of Pakistan. Nos. 194-208. Department of Botany,University of Karachi and National Herbarium, PARC, Islamabad.
Ali, S.I. & Nasir, Y.J.,(Edit.) 1990-92. Flora of Pakistan. No. 191-193. Department of Botany,University of Karachi and National Herbarium, PARC, Islamabad.
Bahadur, A., 2012. Ethnomedicinal study of Merbazghaz Jahangir Abad, Mardan, Khyber Pukhtoon Khwa, Pakistan Int. J. Phar. Res. Dev., 4(1): 129-131.
Basu, B.D., 1991. Indian Medicinal Plants Vol.1-4. Periodical Experts Book Agency Delhi, India.
Black, M.J., 1996. Transforming ethnobotany for the new millennium. Annals of the Missouri Botanical Garden, 83: 58-66.
Buckingham, J., 1999. Dictionary of Natural Compounds. Chapman and Hall, U.K: 14-20.
Cotton,C.M., 1996. Ethnobotany: Principals and Applications. John Wiley and Sons Ltd.,Chichister, England.
Farnsworth, N.R., 1993. Ethnopharmacology and future drug development: The North AmericanExperience. J. Ethnopharmacol., 38: 145-152.
Farooq, S., Barki, A. Khan, M.Y. & Fazal. H., 2012. Ethnobotanical Studies of the Flora of Tehsil Birmal in South Waziristan Agency, Pakistan. Pak. J. Weed Sci. Res.,18(3): 277-291.
Hamayun, M., Khan, M. A. & Hayat, T., 2005. Ethnobotanical profile of Utror and Gabral Valleys, District Swat, Pakistan. www.ethnoleaflets.com/leaflets/swat.htm
146 A. ZEREE ET AL BIOLOGIA (PAKISTAN)
Katewa, S.S., Chaudhary, B.L. & Jain, A., 2004. Folk herbal medicines from tribal areas of Rajasthan, India. J. Ethnopharmacol., 92: 41- 46.
Khalid, S., 1995. Plants in Danger. Fifth National Conference of Plants Scientists. NARC, Islamabad: 25-30.
Murad, W., Ahmad, A., Ishaq, G.,Khan, M.S.,Khan. A.M., Ullah, I., Azizullah & Khan, I., 2012. Ethnobotanical Studies on Plant Resources of Hazar Nao Forest, District Malakand, Pakistan. Pak. J. Weed Sci. Res., 18(4): 509-527.
Nasir, E. & Ali, S.I., (Edit.) 1970-89. Flora of Pakistan. No. 1-190. National Herbarium, PARC,Islamabad and Department of Botany, University of Karachi, Pakistan.
Qureshi, R.A., Gilani, S.A. & Ghufran, M.A., 2007. Ethnobotanical Studies of Plants of MianwaliDistrict Punjab, Pakistan. Pak. J. Bot., 39(7): 2285-2290.
Safa, O., Soltanipoor, M.A., Rastegar, S., Kazami, M., Dehkord, K.N. & Ghannadi, A., 2012. An Ethnobotanical Survey on Harmozgan Province, Iran. Avicenna J. Phytomedicine.,3(1): 64-81.
Shinwari, M. I. & Khan, M. A., 1998. Ethnobotany of the Margalla Hills, Islamabad, Pakistan: Department of Biological Sciences, Quaid-i-Azam University.
Shinwari, Z.K., Watanabe, T., Rehman, M.U. & Yoshikawa, T., 2006. A Pictorial Guide to Medicinal Plants of Pakistan. Kohat University of Science and Technology, Kohat, Pakistan.
BIOLOGIA (PAKISTAN) 2013, 59 (1), 147-156 PK ISSN 0006 - 3096
*Corresponding author:[email protected]
Palynomorphological studies of some Ornamental Plants of
Mall Road, Lahore
*UZMA HANIF, MADEHA MAZHAR & ANDLEEB ANWER SARDAR
Department of Botany, Govt. College University, Lahore
ABSTRACT
The Research work was conducted to analyze the palynomorphological data of
ornamental plants collected from Lahore city. The results compiled indicated that total 14 pollen taxa were identified belonging to 12 families and 14 different genera. The pollen identified belonging to woody, herbaceous and shrubby vegetation. Among them nine were exotic taxa and five were native species. Woody pollen was abundant in samples while the percentage of the herbaceous pollen consisted of only 21.42%. Colpate and prolate type of apertures were characterized in all the pollen taxa. It was observed that circular apertures were only present in Hibiscus rosa-sinensis Linn. and Cassia fistula Linn. The maximum pollen size was recorded in Hibiscus rosa-sinensis Linn. and Lagerstroemia indica Linn.
Keywords: Ornamental plants, palynomorphological studies, pollen
INTRODUCTION
Palynology is the science that studies fossil and contemporary
palynomorphs that include spores, pollen, acritarchs, chitinozoans, scolecodonts, orbicules and dinoflagellate cysts particulate organic matter (POM) and together with kerogen found in sediments and sedimentary rocks.The knowledge of palynology is used in geography, geology and immunology. Palynology, as a forensic tool, has been considered as a discipline of plant ecology (Horrocks et al., 1998; Mildenhall, 2006; Mildenhall et al., 2006). The scope, aspects and prospects of the science have been discussed in India (Sahni, 1948; Nair, 1960; Mittre, 1961; Srivastava, 1962), and also abroad (Erdtman, 1955). The functional importance of pollen grains have been realized by the ancient Assyrians as early as 717 B.C. the potentialities of pollen and spores as a morphological entity in plants have become increasingly understood, since the time Hooke developed a prototype microscope in 1665 (cit. Wodehouse, 1935). The great advances in the technology of the microscope have been paralleled in the science of palynology. The increase in knowledge, the science has widened its scope of interest. Various aspects of palynological studies have been delimited under two main divisions, basic palynology and applied palynology (Erdtman, 1963).
Hyde & Williams (1945) coined the term palynology, for the science concerning the study of spores and pollen. Hyde & Williams chose the term palynology on the basis of two Greek words paluno meaning „to sprinkle‟ and pale meaning „dust‟ (Bhattacharya et al., 2006)
The publication of Pollen Morphology and Plant Taxonomy by Erdtman, (1952) marked the beginning of a new phase. He made available pollen
148 U. HANIF ET AL BIOLOGIA (PAKISTAN)
characters of all angiosperm families to taxonomists. Since then they are increasingly used in systematic work.
Pollen characters such as number and position of the furrows, number and position of the apertures and details of sculpturing of the exine are of taxonomic value. The exine possesses the unique morphological characters that are always specific to a particular taxon (Moore, 1978; Milne, 2005).
MATERIALS AND METHODS
Government College University Campus and its Botanical Garden were
selected for the collection of samples. About 10-15 flowers were collected from selected trees and herbs. The samples were collected in the month of February and March 2010 because maximum ornamental flowers bloom in this season. The pollen grains were prepared for light microscopy by the standard methods described by Erdtman (1952) (Perveen et al., 2004; Perveen & Qaiser, 2002 and observation were made with a Meiji CO., LTD, Japan,ModelNO. 35440, light microscope, using digital camera 4.1 mega pixel using 10X eye piece. The terminology used is in accordance with Erdtman (1952, 1960, 1969), Faegri & Iversen (1964) and Walker & Doyle (1975).
RESULTS AND DISCUSSION
A total of 15 mature flowers were collected from Lahore city-namely Rosa damascena Mill., Cassia fistula Linn., Hibiscus rosa-sinensis Linn., Lagerstroemia indica Linn., Delonix regia Rafin., Justicia brandegeana Wassh & Smith, Punica granatum Linn., Papaver somniferum Linn., Jacarandra mimosifolia D.Don., Bougainvillea glabra Choisy, Erythrina suberosa Roxb., Petunia hybrida Vilm., Amaryllis vittata L’Herit., Euphorbia milii Ch. des Moulins. The plants collected belonged to 12 families and 14 different genera. The families identified included Rosaceae, Caesalpiniaceae, Malvaceae, Lythraceae, Punicaceae, Papaveraceae, Bignoniaceae, Nyctanginaceae, Fabaceae, Solanaceae, Amaryllidaceae and Euphorbiaceae (Appendix I). Among them nine are exotic taxa and five are native. The palynomorphological studies of 14 pollen were identical. The percentage of the herbaceous pollen was 21.42 %, the woody pollen was 42.85 % and the shrubby pollen was 35.73 %. The size, symmetry, shape, aperture, spine and exine of the pollen were determined and the results were compiled as: 1.Family:Rosaceae
Botanical name:Rosa damascena Mill. Flowering Season:Summer months PalynomorphTricolpate, Perforate, striate, composed of muri and wide
striae, striae run parallel and are deep. The apocolpium and mesocolpium is striate. The length of pollen 6μm, breadth 4μm, pollen size 24μm. Shape of pollen: Elliptical.
2.Family:Caesalpiniaceae Botanical name:Cassia fistula Linn. Flowering Season:April-June
VOL. 59 (1) PALYNOMORPHOLOGICAL STUDIES OF ORNAMENTAL PLANTS 149
PalynomorphTricolpate, sub-porate, non-angular, length of colpi 21μm and breadth 12.6μm. Size of pollen is 263.6 μm. Grains 3-colporate prolatte, small to medium, sub-triangular, testate, granulate, colpi and pores distant, colpi 2-7 μm wide and more than the length of polar axis, spherical, diameter 3.6-4.6μm.
3.Family: Malvaceae Botanical name: Hibiscus rosa-sinensis Linn. Flowering Season:Throughout the year Palynomorph: Pentoporate, isopolar, globose to spherical, bilateral
symmetry in equatorial view and radial in polar view, circular to oval. Size of pollen is 143μm. Number of pores 16 μm. Number of spines 24 μm. Echinate. Echini regularly arranged. Central spines which form a ring are somewhat different. Dimorphic with blunt apex, rounded and bifurcated. Apex is as much wide as base in some spines. Tectums reticulate. Tectum densely granulated between spines and perforated. Aperture clear and large.
4.Family:Lythraceae Botanical name:Lagerstroemia indica Linn. Flowering Season:Spring and summer months PalynomorphProlate, Tricolporate, elliptical long aperture, ends. The
length of pollen 15μm, breadth 10μm, pollen size is 150 μm, sexine thicker than nexine. Colpi 12μm long.
5.Family:Caesalpiniaceae Botanical name:Delonix regia Rafin. Flowering Season:April-June Palynomorph:Tricolporate, sub-prolate, triangular colpi breadth 2.1μm,
length 6.3μm, Mesocolpium 12.6. Apocolpium 14.7. Sexine thicker than nexine. Tectum regulate-reticulate.
6.Family:Acanthaceae Botanical name:Justicia brandegeana Wassh. & Smith Flowering Season:Summer season PalynomorphPollen grains 3-8 colpate, isopolar, prolate-perprolate,
colporate. 7.Family: Punicaceae
Botanical name:Punica granatum Linn. Flowering Season: April-July, September-December Palynomorph: Grains prolate, 3-colporate. Sexine slightly thicker than
nexine, probably tegillate, the outer margins more lobed or undulated. Meridonial ridges with a very faint pseudocolpus. Size of pollen 24 μm.
150 U. HANIF ET AL BIOLOGIA (PAKISTAN)
8.Family: Papaveraceae Botanical name: Papaver somniferum Linn. Flowering Season: April-June Palynomorph: Pollen grains colpate, rupate, rugate, forate or provided
with irregular apertures, sub-oblate, prolate. Sexine usually as thick as nexine or thicker. Aperture membrane granulate, reticulate, sub-prolate.
9 Family: Bignoniaceae Botanical name: Jacaranda mimosifolia D.Don. Flowering Season: Mid April-May Palynomorph: Grains 50 μm, spheroidal, prolate, exine 4 μm thick,
surfacereticulate. 10Family: Nyctaginaceae
Botanical name: Bougainvillea glabra Choisy Flowering Season: Throughout the year Palynomorph: Grains 3-colpate, oblate, reticulate (muri provided with
scattered spinuloid excrescences), lumina baculate; at low power of the microscope.
11.Family: Papilionaceae Botanical name: Erythrina suberosa Roxb. Flowering Season: March-April Palynomorph: Grains 3-colporate, sub-triangular, small to medium,
tectate, granulate to finely reticulate, anguloaperturate, colpi and pores distinct, pore diameter 5.2μm, exine 1.2 μm thick.
12.Family: Solanaceae Botanical name: Petunia hybrida Vilm. Flowering Season: March-April Palynomorph: Grain 35 μm, Spheroidal, 3-4 zonocolporate, margins of
colpi, thickened, endocolpium, and surface feveolate.
13.Family: Amaryllidaceae Botanical name: Amaryllis vittata L’Herit.
Flowering Season: Twice every year Palynomorph: Length about 60 μm, sexine with small spinules.
14.Family: Euphorbiaceae
Botanical name: Euphorbia milii Ch. des Moulins Flowering Season: February-November Palynomorph: 3-colporate, 3-zonoclpate, prolate-spheroidal to prolate
or sub-prolate, ectoaperturate colpi not sunken along long margin, irregular, end acute. Circular endoaperture.
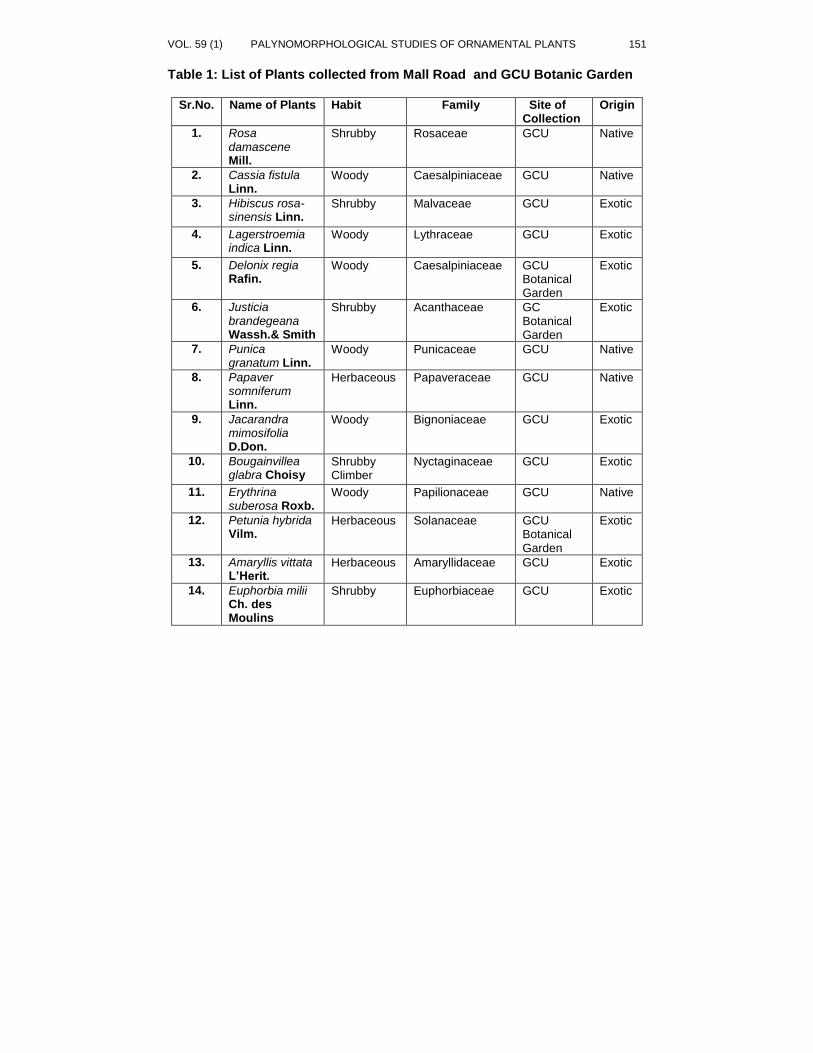
VOL. 59 (1) PALYNOMORPHOLOGICAL STUDIES OF ORNAMENTAL PLANTS 151
Table 1: List of Plants collected from Mall Road and GCU Botanic Garden
Sr.No. Name of Plants Habit Family Site of Collection
Origin
1. Rosa damascene Mill.
Shrubby Rosaceae GCU Native
2. Cassia fistula Linn.
Woody Caesalpiniaceae GCU Native
3. Hibiscus rosa-sinensis Linn.
Shrubby Malvaceae GCU Exotic
4. Lagerstroemia indica Linn.
Woody Lythraceae GCU Exotic
5. Delonix regia Rafin.
Woody Caesalpiniaceae GCU Botanical Garden
Exotic
6. Justicia brandegeana Wassh.& Smith
Shrubby Acanthaceae GC Botanical Garden
Exotic
7. Punica granatum Linn.
Woody Punicaceae GCU Native
8. Papaver somniferum Linn.
Herbaceous Papaveraceae GCU Native
9. Jacarandra mimosifolia D.Don.
Woody Bignoniaceae GCU Exotic
10. Bougainvillea glabra Choisy
Shrubby Climber
Nyctaginaceae GCU Exotic
11. Erythrina suberosa Roxb.
Woody Papilionaceae GCU Native
12. Petunia hybrida Vilm.
Herbaceous Solanaceae GCU Botanical Garden
Exotic
13. Amaryllis vittata L’Herit.
Herbaceous Amaryllidaceae GCU Exotic
14. Euphorbia milii Ch. des Moulins
Shrubby Euphorbiaceae GCU Exotic
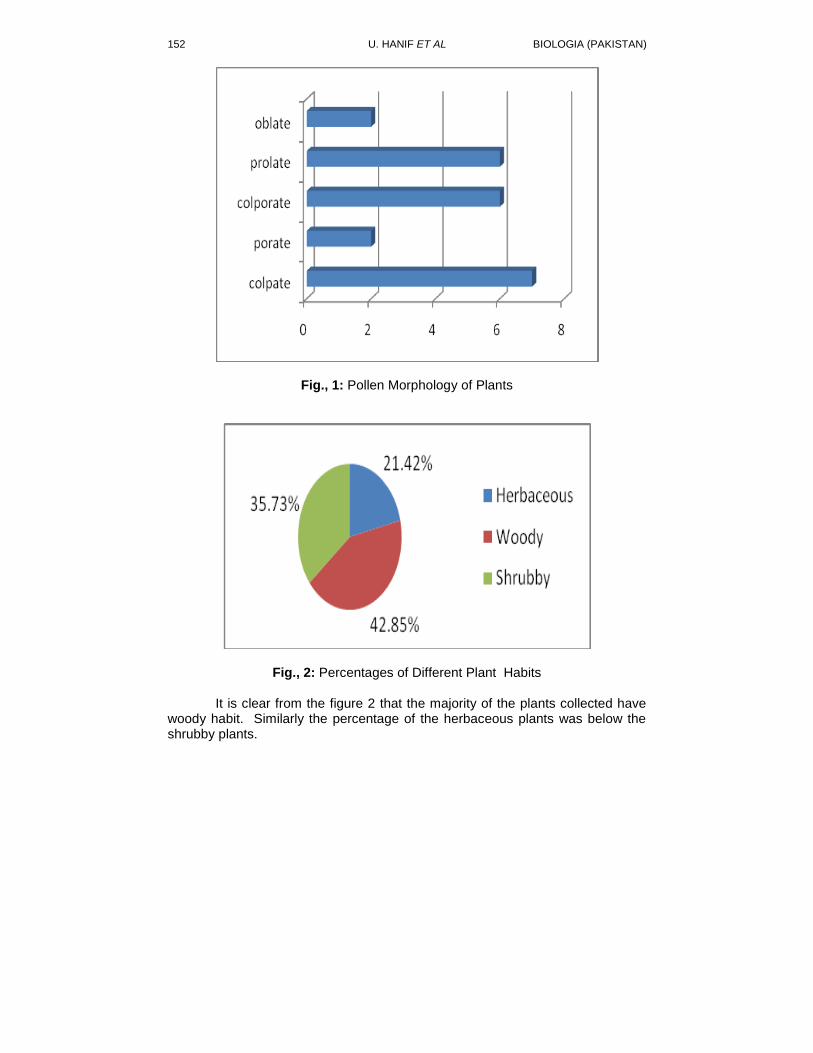
152 U. HANIF ET AL BIOLOGIA (PAKISTAN)
Fig., 1: Pollen Morphology of Plants
Fig., 2: Percentages of Different Plant Habits
It is clear from the figure 2 that the majority of the plants collected have woody habit. Similarly the percentage of the herbaceous plants was below the shrubby plants.
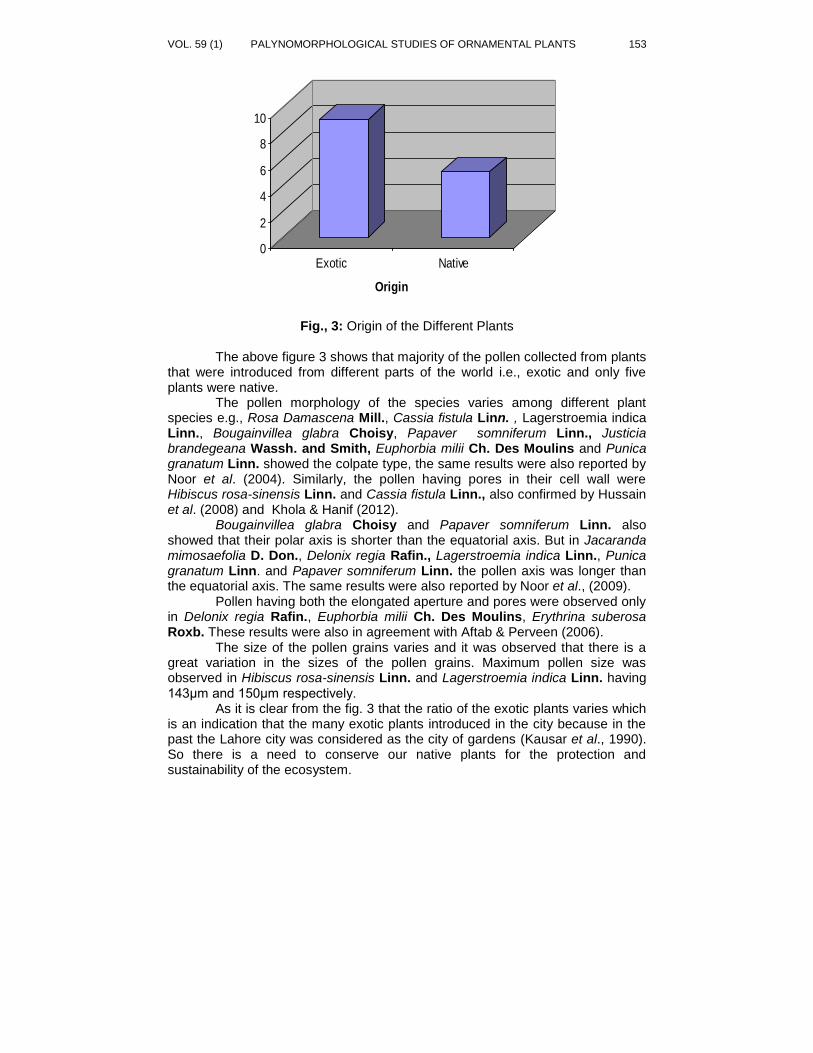
VOL. 59 (1) PALYNOMORPHOLOGICAL STUDIES OF ORNAMENTAL PLANTS 153
0
2
4
6
8
10
Exotic Native
Origin
No. of Plants
No. of Plants
Fig., 3: Origin of the Different Plants
The above figure 3 shows that majority of the pollen collected from plants that were introduced from different parts of the world i.e., exotic and only five plants were native.
The pollen morphology of the species varies among different plant species e.g., Rosa Damascena Mill., Cassia fistula Linn. , Lagerstroemia indica Linn., Bougainvillea glabra Choisy, Papaver somniferum Linn., Justicia brandegeana Wassh. and Smith, Euphorbia milii Ch. Des Moulins and Punica granatum Linn. showed the colpate type, the same results were also reported by Noor et al. (2004). Similarly, the pollen having pores in their cell wall were Hibiscus rosa-sinensis Linn. and Cassia fistula Linn., also confirmed by Hussain et al. (2008) and Khola & Hanif (2012). Bougainvillea glabra Choisy and Papaver somniferum Linn. also showed that their polar axis is shorter than the equatorial axis. But in Jacaranda mimosaefolia D. Don., Delonix regia Rafin., Lagerstroemia indica Linn., Punica granatum Linn. and Papaver somniferum Linn. the pollen axis was longer than the equatorial axis. The same results were also reported by Noor et al., (2009). Pollen having both the elongated aperture and pores were observed only in Delonix regia Rafin., Euphorbia milii Ch. Des Moulins, Erythrina suberosa Roxb. These results were also in agreement with Aftab & Perveen (2006).
The size of the pollen grains varies and it was observed that there is a great variation in the sizes of the pollen grains. Maximum pollen size was observed in Hibiscus rosa-sinensis Linn. and Lagerstroemia indica Linn. having 143μm and 150μm respectively.
As it is clear from the fig. 3 that the ratio of the exotic plants varies which is an indication that the many exotic plants introduced in the city because in the past the Lahore city was considered as the city of gardens (Kausar et al., 1990). So there is a need to conserve our native plants for the protection and sustainability of the ecosystem.
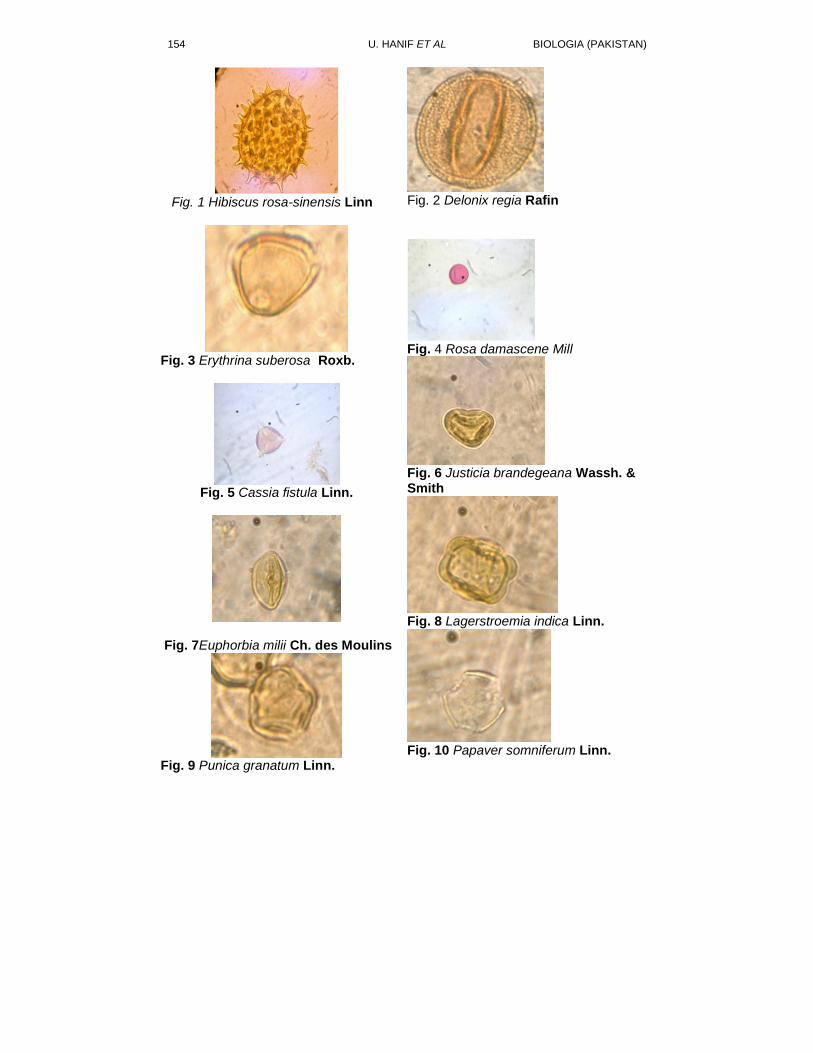
154 U. HANIF ET AL BIOLOGIA (PAKISTAN)
Fig. 1 Hibiscus rosa-sinensis Linn
Fig. 3 Erythrina suberosa Roxb.
Fig. 5 Cassia fistula Linn.
Fig. 7Euphorbia milii Ch. des Moulins
Fig. 9 Punica granatum Linn.
Fig. 2 Delonix regia Rafin
Fig. 4 Rosa damascene Mill
Fig. 6 Justicia brandegeana Wassh. & Smith
Fig. 8 Lagerstroemia indica Linn.
Fig. 10 Papaver somniferum Linn.
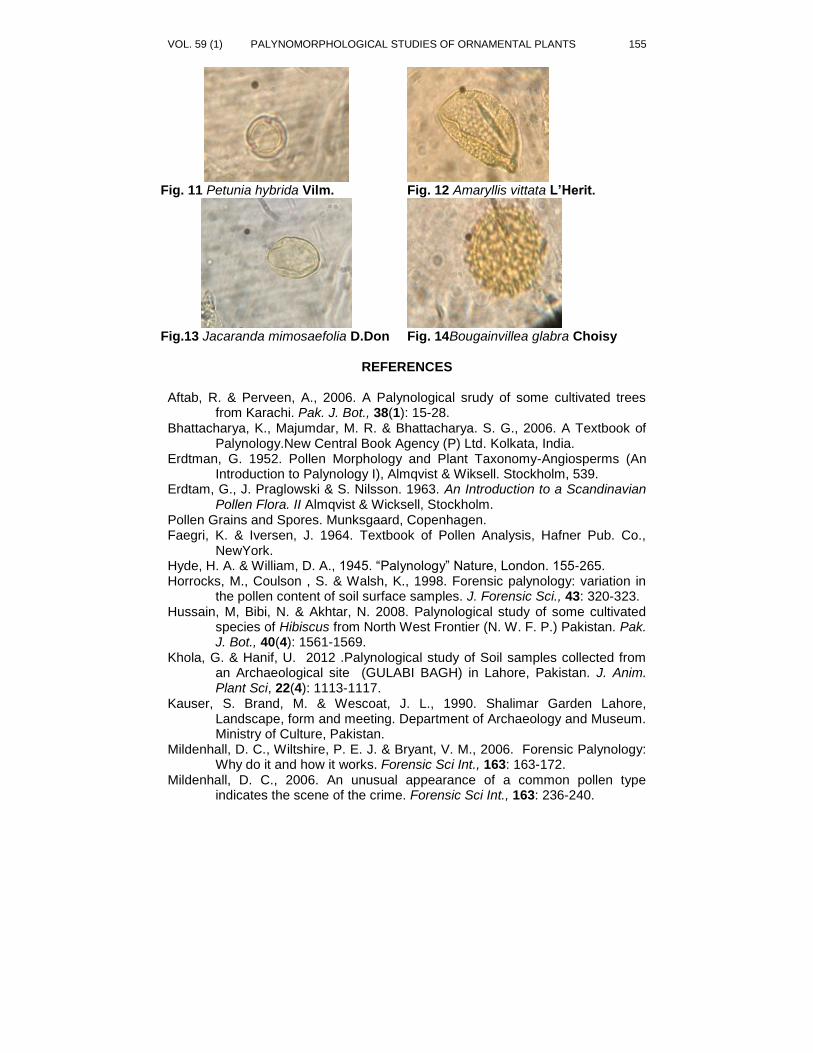
VOL. 59 (1) PALYNOMORPHOLOGICAL STUDIES OF ORNAMENTAL PLANTS 155
Fig. 11 Petunia hybrida Vilm.
Fig.13 Jacaranda mimosaefolia D.Don
Fig. 12 Amaryllis vittata L’Herit.
Fig. 14Bougainvillea glabra Choisy
REFERENCES
Aftab, R. & Perveen, A., 2006. A Palynological srudy of some cultivated trees from Karachi. Pak. J. Bot., 38(1): 15-28.
Bhattacharya, K., Majumdar, M. R. & Bhattacharya. S. G., 2006. A Textbook of Palynology.New Central Book Agency (P) Ltd. Kolkata, India.
Erdtman, G. 1952. Pollen Morphology and Plant Taxonomy-Angiosperms (An Introduction to Palynology I), Almqvist & Wiksell. Stockholm, 539.
Erdtam, G., J. Praglowski & S. Nilsson. 1963. An Introduction to a Scandinavian Pollen Flora. II Almqvist & Wicksell, Stockholm.
Pollen Grains and Spores. Munksgaard, Copenhagen. Faegri, K. & Iversen, J. 1964. Textbook of Pollen Analysis, Hafner Pub. Co.,
NewYork. Hyde, H. A. & William, D. A., 1945. “Palynology” Nature, London. 155-265. Horrocks, M., Coulson , S. & Walsh, K., 1998. Forensic palynology: variation in
the pollen content of soil surface samples. J. Forensic Sci., 43: 320-323. Hussain, M, Bibi, N. & Akhtar, N. 2008. Palynological study of some cultivated
species of Hibiscus from North West Frontier (N. W. F. P.) Pakistan. Pak. J. Bot., 40(4): 1561-1569.
Khola, G. & Hanif, U. 2012 .Palynological study of Soil samples collected from an Archaeological site (GULABI BAGH) in Lahore, Pakistan. J. Anim. Plant Sci, 22(4): 1113-1117.
Kauser, S. Brand, M. & Wescoat, J. L., 1990. Shalimar Garden Lahore, Landscape, form and meeting. Department of Archaeology and Museum. Ministry of Culture, Pakistan.
Mildenhall, D. C., Wiltshire, P. E. J. & Bryant, V. M., 2006. Forensic Palynology: Why do it and how it works. Forensic Sci Int., 163: 163-172.
Mildenhall, D. C., 2006. An unusual appearance of a common pollen type indicates the scene of the crime. Forensic Sci Int., 163: 236-240.
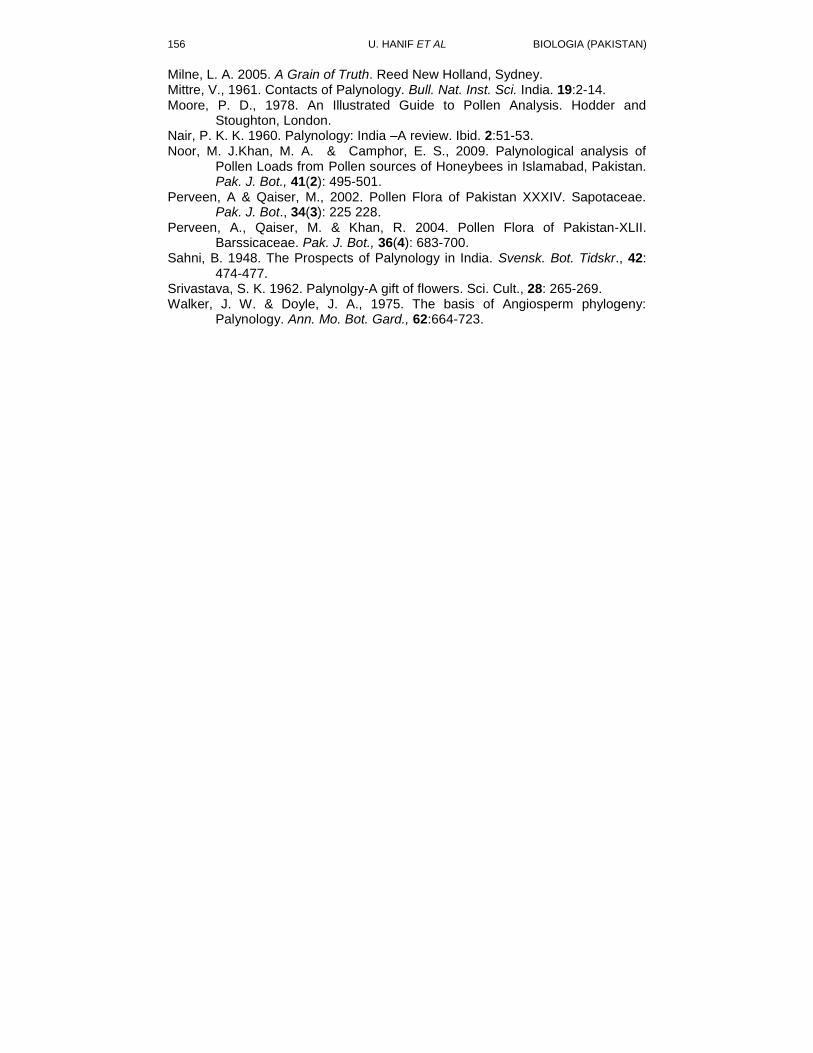
156 U. HANIF ET AL BIOLOGIA (PAKISTAN)
Milne, L. A. 2005. A Grain of Truth. Reed New Holland, Sydney. Mittre, V., 1961. Contacts of Palynology. Bull. Nat. Inst. Sci. India. 19:2-14. Moore, P. D., 1978. An Illustrated Guide to Pollen Analysis. Hodder and
Stoughton, London. Nair, P. K. K. 1960. Palynology: India –A review. Ibid. 2:51-53. Noor, M. J.Khan, M. A. & Camphor, E. S., 2009. Palynological analysis of
Pollen Loads from Pollen sources of Honeybees in Islamabad, Pakistan. Pak. J. Bot., 41(2): 495-501.
Perveen, A & Qaiser, M., 2002. Pollen Flora of Pakistan XXXIV. Sapotaceae. Pak. J. Bot., 34(3): 225 228.
Perveen, A., Qaiser, M. & Khan, R. 2004. Pollen Flora of Pakistan-XLII. Barssicaceae. Pak. J. Bot., 36(4): 683-700.
Sahni, B. 1948. The Prospects of Palynology in India. Svensk. Bot. Tidskr., 42: 474-477.
Srivastava, S. K. 1962. Palynolgy-A gift of flowers. Sci. Cult., 28: 265-269. Walker, J. W. & Doyle, J. A., 1975. The basis of Angiosperm phylogeny:
Palynology. Ann. Mo. Bot. Gard., 62:664-723.
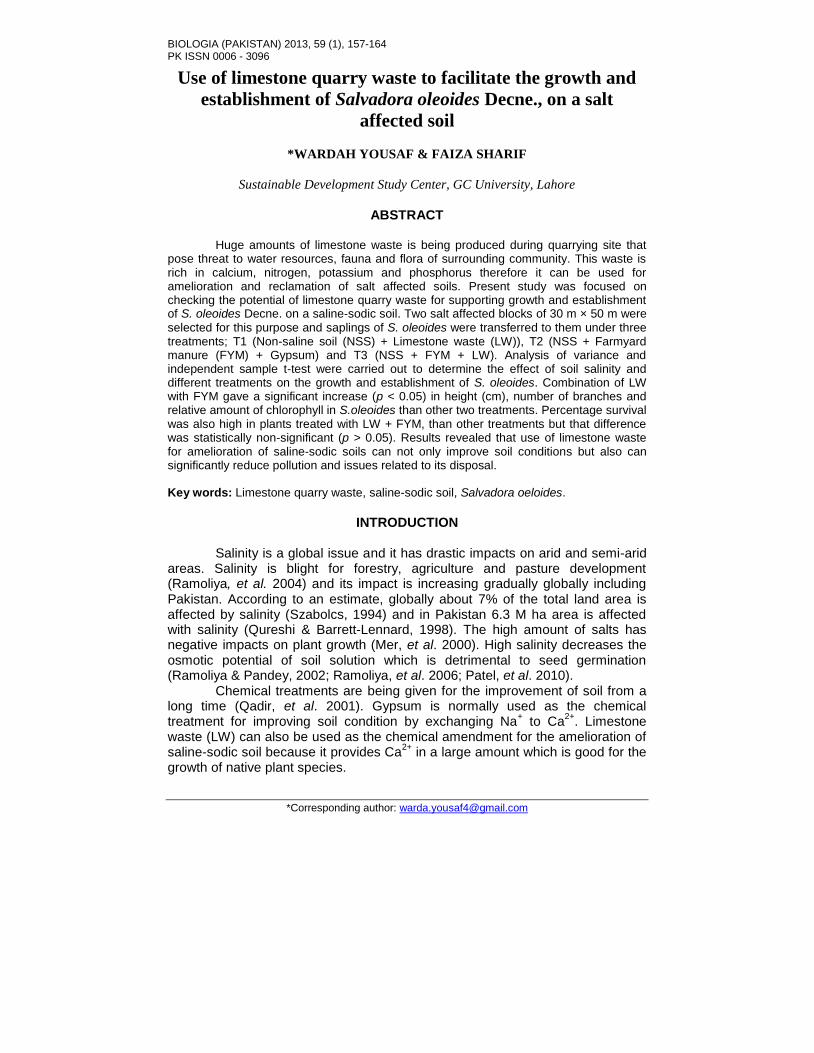
BIOLOGIA (PAKISTAN) 2013, 59 (1), 157-164 PK ISSN 0006 - 3096
*Corresponding author: [email protected]
Use of limestone quarry waste to facilitate the growth and
establishment of Salvadora oleoides Decne., on a salt
affected soil
*WARDAH YOUSAF & FAIZA SHARIF
Sustainable Development Study Center, GC University, Lahore
ABSTRACT
Huge amounts of limestone waste is being produced during quarrying site that
pose threat to water resources, fauna and flora of surrounding community. This waste is rich in calcium, nitrogen, potassium and phosphorus therefore it can be used for amelioration and reclamation of salt affected soils. Present study was focused on checking the potential of limestone quarry waste for supporting growth and establishment of S. oleoides Decne. on a saline-sodic soil. Two salt affected blocks of 30 m × 50 m were selected for this purpose and saplings of S. oleoides were transferred to them under three treatments; T1 (Non-saline soil (NSS) + Limestone waste (LW)), T2 (NSS + Farmyard manure (FYM) + Gypsum) and T3 (NSS + FYM + LW). Analysis of variance and independent sample t-test were carried out to determine the effect of soil salinity and different treatments on the growth and establishment of S. oleoides. Combination of LW with FYM gave a significant increase (p < 0.05) in height (cm), number of branches and relative amount of chlorophyll in S.oleoides than other two treatments. Percentage survival was also high in plants treated with LW + FYM, than other treatments but that difference was statistically non-significant (p > 0.05). Results revealed that use of limestone waste for amelioration of saline-sodic soils can not only improve soil conditions but also can significantly reduce pollution and issues related to its disposal. Key words: Limestone quarry waste, saline-sodic soil, Salvadora oeloides.
INTRODUCTION
Salinity is a global issue and it has drastic impacts on arid and semi-arid
areas. Salinity is blight for forestry, agriculture and pasture development (Ramoliya, et al. 2004) and its impact is increasing gradually globally including Pakistan. According to an estimate, globally about 7% of the total land area is affected by salinity (Szabolcs, 1994) and in Pakistan 6.3 M ha area is affected with salinity (Qureshi & Barrett-Lennard, 1998). The high amount of salts has negative impacts on plant growth (Mer, et al. 2000). High salinity decreases the osmotic potential of soil solution which is detrimental to seed germination (Ramoliya & Pandey, 2002; Ramoliya, et al. 2006; Patel, et al. 2010).
Chemical treatments are being given for the improvement of soil from a long time (Qadir, et al. 2001). Gypsum is normally used as the chemical treatment for improving soil condition by exchanging Na
+ to Ca
2+. Limestone
waste (LW) can also be used as the chemical amendment for the amelioration of saline-sodic soil because it provides Ca
2+ in a large amount which is good for the
growth of native plant species.
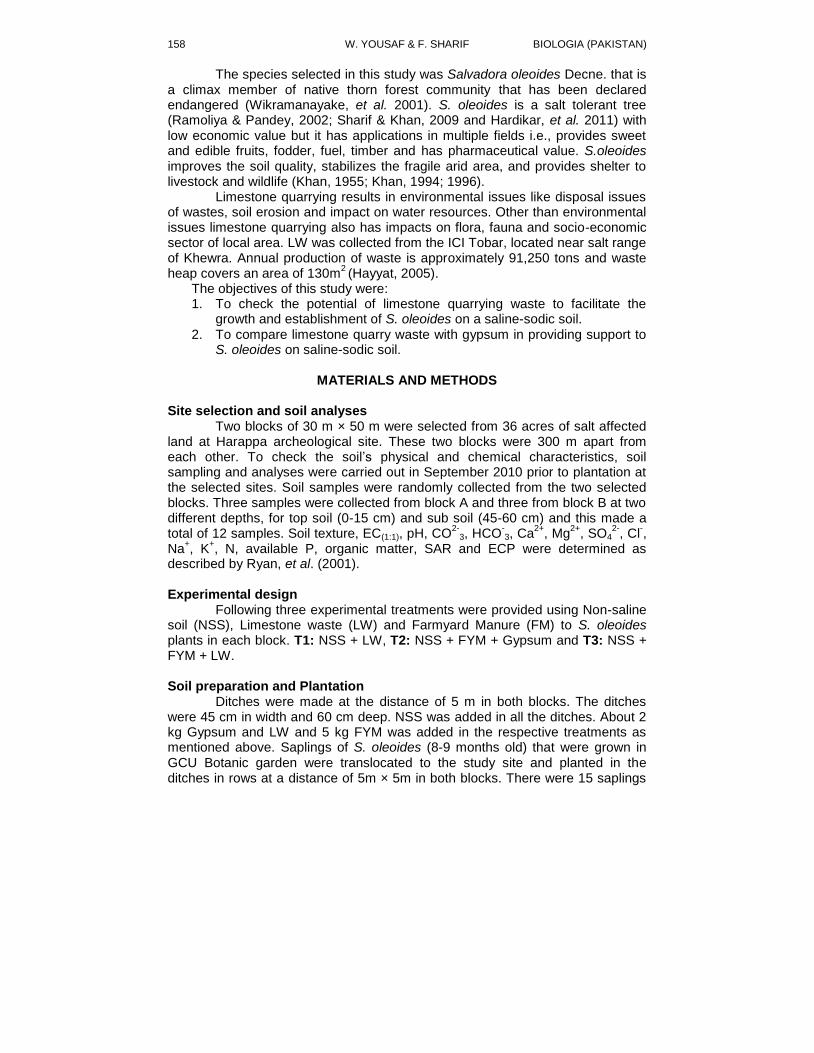
158 W. YOUSAF & F. SHARIF BIOLOGIA (PAKISTAN)
The species selected in this study was Salvadora oleoides Decne. that is a climax member of native thorn forest community that has been declared endangered (Wikramanayake, et al. 2001). S. oleoides is a salt tolerant tree (Ramoliya & Pandey, 2002; Sharif & Khan, 2009 and Hardikar, et al. 2011) with low economic value but it has applications in multiple fields i.e., provides sweet and edible fruits, fodder, fuel, timber and has pharmaceutical value. S.oleoides improves the soil quality, stabilizes the fragile arid area, and provides shelter to livestock and wildlife (Khan, 1955; Khan, 1994; 1996).
Limestone quarrying results in environmental issues like disposal issues of wastes, soil erosion and impact on water resources. Other than environmental issues limestone quarrying also has impacts on flora, fauna and socio-economic sector of local area. LW was collected from the ICI Tobar, located near salt range of Khewra. Annual production of waste is approximately 91,250 tons and waste heap covers an area of 130m
2 (Hayyat, 2005).
The objectives of this study were: 1. To check the potential of limestone quarrying waste to facilitate the
growth and establishment of S. oleoides on a saline-sodic soil. 2. To compare limestone quarry waste with gypsum in providing support to
S. oleoides on saline-sodic soil.
MATERIALS AND METHODS
Site selection and soil analyses Two blocks of 30 m × 50 m were selected from 36 acres of salt affected land at Harappa archeological site. These two blocks were 300 m apart from each other. To check the soil’s physical and chemical characteristics, soil sampling and analyses were carried out in September 2010 prior to plantation at the selected sites. Soil samples were randomly collected from the two selected blocks. Three samples were collected from block A and three from block B at two different depths, for top soil (0-15 cm) and sub soil (45-60 cm) and this made a total of 12 samples. Soil texture, EC(1:1), pH, CO
2-3, HCO
-3, Ca
2+, Mg
2+, SO4
2-, Cl
-,
Na+, K
+, N, available P, organic matter, SAR and ECP were determined as
described by Ryan, et al. (2001). Experimental design
Following three experimental treatments were provided using Non-saline soil (NSS), Limestone waste (LW) and Farmyard Manure (FM) to S. oleoides plants in each block. T1: NSS + LW, T2: NSS + FYM + Gypsum and T3: NSS + FYM + LW.
Soil preparation and Plantation
Ditches were made at the distance of 5 m in both blocks. The ditches were 45 cm in width and 60 cm deep. NSS was added in all the ditches. About 2 kg Gypsum and LW and 5 kg FYM was added in the respective treatments as mentioned above. Saplings of S. oleoides (8-9 months old) that were grown in GCU Botanic garden were translocated to the study site and planted in the ditches in rows at a distance of 5m × 5m in both blocks. There were 15 saplings
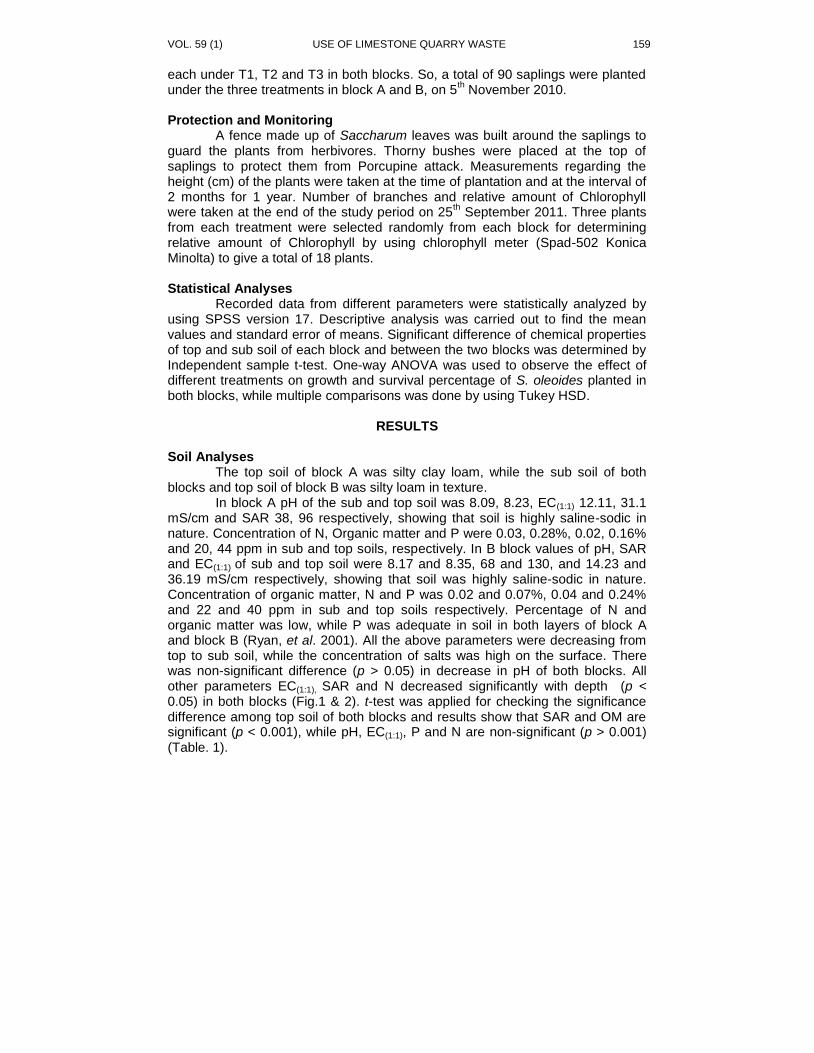
VOL. 59 (1) USE OF LIMESTONE QUARRY WASTE 159
each under T1, T2 and T3 in both blocks. So, a total of 90 saplings were planted under the three treatments in block A and B, on 5
th November 2010.
Protection and Monitoring
A fence made up of Saccharum leaves was built around the saplings to guard the plants from herbivores. Thorny bushes were placed at the top of saplings to protect them from Porcupine attack. Measurements regarding the height (cm) of the plants were taken at the time of plantation and at the interval of 2 months for 1 year. Number of branches and relative amount of Chlorophyll were taken at the end of the study period on 25
th September 2011. Three plants
from each treatment were selected randomly from each block for determining relative amount of Chlorophyll by using chlorophyll meter (Spad-502 Konica Minolta) to give a total of 18 plants. Statistical Analyses
Recorded data from different parameters were statistically analyzed by using SPSS version 17. Descriptive analysis was carried out to find the mean values and standard error of means. Significant difference of chemical properties of top and sub soil of each block and between the two blocks was determined by Independent sample t-test. One-way ANOVA was used to observe the effect of different treatments on growth and survival percentage of S. oleoides planted in both blocks, while multiple comparisons was done by using Tukey HSD.
RESULTS
Soil Analyses
The top soil of block A was silty clay loam, while the sub soil of both blocks and top soil of block B was silty loam in texture.
In block A pH of the sub and top soil was 8.09, 8.23, EC(1:1) 12.11, 31.1 mS/cm and SAR 38, 96 respectively, showing that soil is highly saline-sodic in nature. Concentration of N, Organic matter and P were 0.03, 0.28%, 0.02, 0.16% and 20, 44 ppm in sub and top soils, respectively. In B block values of pH, SAR and EC(1:1) of sub and top soil were 8.17 and 8.35, 68 and 130, and 14.23 and 36.19 mS/cm respectively, showing that soil was highly saline-sodic in nature. Concentration of organic matter, N and P was 0.02 and 0.07%, 0.04 and 0.24% and 22 and 40 ppm in sub and top soils respectively. Percentage of N and organic matter was low, while P was adequate in soil in both layers of block A and block B (Ryan, et al. 2001). All the above parameters were decreasing from top to sub soil, while the concentration of salts was high on the surface. There was non-significant difference (p > 0.05) in decrease in pH of both blocks. All other parameters EC(1:1), SAR and N decreased significantly with depth (p < 0.05) in both blocks (Fig.1 & 2). t-test was applied for checking the significance difference among top soil of both blocks and results show that SAR and OM are significant (p < 0.001), while pH, EC(1:1), P and N are non-significant (p > 0.001) (Table. 1).
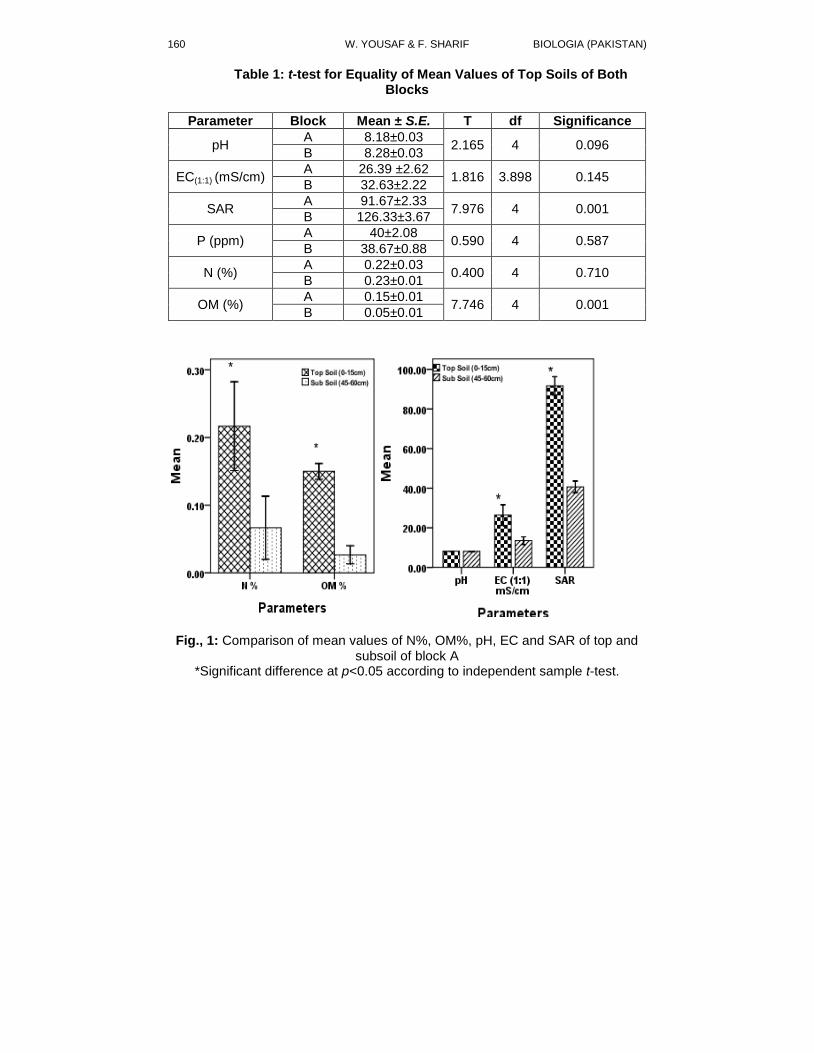
160 W. YOUSAF & F. SHARIF BIOLOGIA (PAKISTAN)
Table 1: t-test for Equality of Mean Values of Top Soils of Both Blocks
Parameter Block Mean ± S.E. T df Significance
pH A 8.18±0.03
2.165 4 0.096 B 8.28±0.03
EC(1:1) (mS/cm) A 26.39 ±2.62
1.816 3.898 0.145 B 32.63±2.22
SAR A 91.67±2.33
7.976 4 0.001 B 126.33±3.67
P (ppm) A 40±2.08
0.590 4 0.587 B 38.67±0.88
N (%) A 0.22±0.03
0.400 4 0.710 B 0.23±0.01
OM (%) A 0.15±0.01
7.746 4 0.001 B 0.05±0.01
Fig., 1: Comparison of mean values of N%, OM%, pH, EC and SAR of top and subsoil of block A
*Significant difference at p<0.05 according to independent sample t-test.
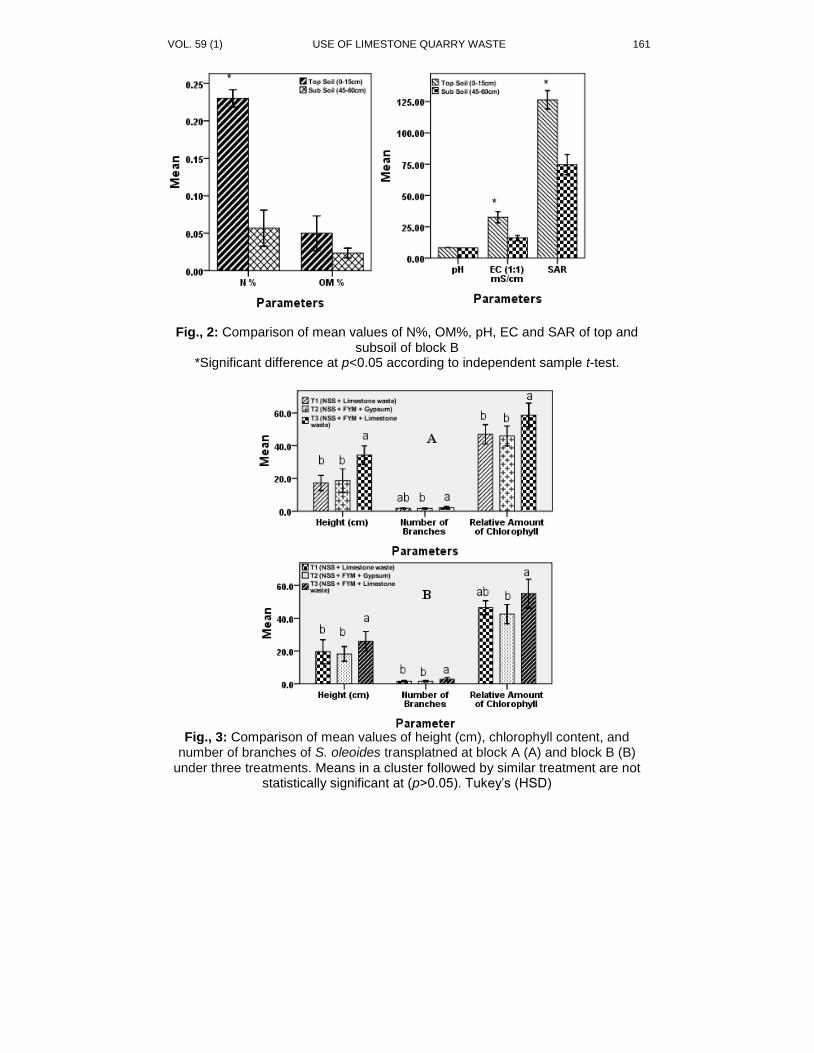
VOL. 59 (1) USE OF LIMESTONE QUARRY WASTE 161
Fig., 2: Comparison of mean values of N%, OM%, pH, EC and SAR of top and subsoil of block B
*Significant difference at p<0.05 according to independent sample t-test.
Fig., 3: Comparison of mean values of height (cm), chlorophyll content, and
number of branches of S. oleoides transplatned at block A (A) and block B (B) under three treatments. Means in a cluster followed by similar treatment are not
statistically significant at (p>0.05). Tukey’s (HSD)
162 W. YOUSAF & F. SHARIF BIOLOGIA (PAKISTAN)
Effect of different treatments on growth and survival of S. oleoides Effect of different treatments on height (cm), number of branches and
relative amount of chlorophyll was significant (p < 0.05), while percentage survival was non-significant (p > 0.05) in both blocks. Plants amended with both FYM + LW showed higher survival (93.75% and 78.57%) than other two treatments in block A and block B respectively. Similar trend was followed by all growth parameters i.e., height, number of branches and relative amount of chlorophyll in both blocks (Fig., 3. A & B).
DISCUSSION
The results of current study showed that selected blocks were highly
saline-sodic. Three different treatments were provided to the plants to minimize the negative impacts on growth and establishment on saline-sodic soil. S. oleoides plants amended with combination of LW and FYM showed higher survival and growth rate is than those of other treatments. S. oleoides plants under T3 (NSS + FYM + LW) gained 41% and 35% more height than T1 (NSS + LW) and T2 (NSS + FYM + Gypsum) in both blocks, respectively. The trend was same for number of branches and relative amount of chlorophyll, T3 had 1.2 times more amount of chlorophyll than T1 and T2 in both blocks and this indicates better growth and salt tolerance in plants amended with T3. Hardikar (2011) had reported similar results that photosynthesis rate and leaf area were affected by high salinity which indirectly causes reduction in yield and crop growth.
Gypsum provides essential macronutrient Ca to soil which plays a diverse messenger and structural role in plant growth (Marschner, 1995) and it precipitates with carbonates, bicarbonates and sulfates replacing sodium ions and thus decreases the level of sodicity in soil (Sadiq, et al. 2007). FYM provides nutrients and increases the absorption rate of nutrients (Dutta, et al. 2003). LW is non-toxic and it contains high amount of Ca, along with N, P, Mg and K. So, it provides sufficient nutrients for plant growth. LW along with FYM collectively acted as a fertilizer and provided an additional amount of essential nutrients which were helpful in establishment and growth of S. oleoides on saline-sodic soil. Results of current study are in agreement with the results of Sharif & Khan (2009) who found that salt tolerance limit of S.oleoides was increased when additional fertilizer was provided.
Although there was a significant difference in soil salinity of both blocks but during one year study period, non-significant difference was observed in the survival and growth of S. oleoides at two blocks. The effect of soil salinity is expected to be more pronounced in future when the roots will penetrate in the non-amended original soil.
VOL. 59 (1) USE OF LIMESTONE QUARRY WASTE 163
REFERENCES
Dutta, S., Pal, R., Chakeraborty, A. & Chakrabarti, K., 2003. Influence of integrated plant nutrients phosphorus and sugarcane and sugar yields. Field. Crop. Res., 77: 43-49.
Hardikar, S.A., Panchal, N.S. & Pandey, A.N., 2011. Growth, water status and nutrient accumulation of seedlings of Slavadoraoleoides (Decne.) in response to soil salinity. J. Trop. Ecol., 52(3): 253-264.
Hayyat, M.U., 2005. A study of environmental and social impacts of limestone quarrying near village Tobar, District Jehlum. M. Phil. Thesis. Government College University, Lahore. 105 pp.
Khan, A.U., 1994. History of decline and present status of natural tropical thorn forest in Punjab. J. Bio. Conser., 67(3): 205-210.
Khan, A.U., 1996. Appraisal of ethno-ecological incentives to promote conservation of SalvadoraoleoidesDecne: The case for creating a resource area. J. Bio. Conser., 75: 187-190.
Khan, M., 1955. Tropical thorn forest of Pakistan. Pak. J. Forest., 5(3): 161-171. Marschner, H., 1995. Mineral nutrition of higher plants. 2
nd ed. London: Academic
press, pp. 38-41. Mer, R.K., Prajith, P.K., Pandya, D.H. & Pandey, A.N., 2000. Effect of salts on
germination of seeds and growth of young plants of Hordeumvulgare, Triticumaestivum, Cicerarietinum and Brassica juncea. J. Agron. Crop. Sci., 184(4): 209-217.
Patel, A.D., Jadeja, H.R. & Pandey, A.N., 2010. Effect of soil salinity on growth, water status and nutrient accumulation in seedlings of Acacia auriculiformis (Fabaceae). J. Plant. Nutr., 33: 914-932.
Qadir, M., Schubert, S., Ghafoor, A. & Murtaza, G., 2001. Amelioration strategies for sodic soils: A review. J. Land. Degrade. Develop., 12: 357-386.
Qureshi, R.H. & Barrett-Lennard, E.G., 1998. Saline Agriculture for Irrigated Land in Pakistan:A Handbook. Australian centre for International Agricultural Research, Canberra, Australia, 142 pp.
Ramoliya, P.J. & Pandey, A.N., 2002. Effect of increasing salt concentration on emergence, growth and survival of seedlings of Salvadoraoleoides (Salvadoraceae). J. Arid. Environ., 51: 121-132.
Ramoliya, P.J., Patel, H.M. & Pandey, A.N., 2004. Effect of salinization of soil on growth and macro- and micro-nutrient accumulation in seedlings of Salvadorapersica (Salvadoraceae). J. Forest. Eco. Manage., 202: 181-193.
Ramoliya, P.J., Patel, H.M., Joshi, J.B. & Pandey, A.N., 2006. Effect of salinization of soil on growth and nutrient accumulation in seedlings of Prosopis cineraria. J. Plant. Nutr., 29: 283-303.
Ryan, J., Estefan, G. & Rashid, A., 2001. Soil and Plant Laboratory Manual. 2
nded. Interaction Center for Agricultural Research in the Dry Areas
(ICARDA).Aleppo, Syria. 269 pp. Sadiq, M., Hassan, G., Mehdi, M., Hussain, N. & Jamil, M., 2007. Amelioration of
saline-sodic soils with thillage implements and sulfuric acid application. Pedosphere, 17(2): 182-190.

164 W. YOUSAF & F. SHARIF BIOLOGIA (PAKISTAN)
Sharif, F. & Khan, A.U., 2009. Alleviation of salinity tolerance by fertilization in four thorn forest species for the reclamation of salt-affected sites. Pak. J. Bot., 41(6): 2901-2915.
Wikramanayake, E., E. Dinerstein, C.J. Loucks et al. 2001. Terrestrial Ecoregions of the Indo-Pacific: A Conservation Assessment. Island Press, pp. 28.
Szabolcs, I., 1994. Soils and salinisation. In: M. Pessarakali & M. Dekker. (Ed.), Handbook of Plant and Crop Stress. New York, pp. 3-11.
BIOLOGIA (PAKISTAN) 2013, 59 (1), 165-171 PK ISSN 0006 - 3096
*Corresponding author: [email protected]
Partial purification of alkaline protease by mutant strain of
Bacillus subtilisEMS-6
*NADEEMULLAH1& HAMID MUKHTAR
2
1Dendrochronology Laboratory, Department of Botany, GCU, Lahore-54000. Pakistan.
2Institute of Industrial Biotechnology, GCU, Lahore-54000. Pakistan.
ABSTRACT
The present study utilized different methods for purification of alkaline protease
by using ammonium sulphate and acetone. Ammonium sulphate was found the best purifying agent and gave 109.09 fold purification of protease with 49.7% yield at 60% saturation. Dialysis was performed by using phosphate and Tris-HCl buffer and phosphate buffer was optimized to good dialyzing agent at pH 8.0. Key words: Alkaline protease, Bacillus subtilis
EMS-6, Partial purification
INTRODUCTION
More than 1700 enzymes have been reported in a living cell, each with
efficiency unique in nature. Among different industrially important enzymes, proteolytic enzymes are the most important ones representing worldwide sales of about 60% of the total enzymes market. These enzymes are widely used in brewing industry, detergent industry, food industry, laundry industry, leather industry, paper industry, pharmaceutical industry, photography and waste processing industry (Raju, et al., 1994; Horikoshi, 1999; Woods, et al., 2001; Barredo, 2004; Ahmad, et al., 2011).
Proteases are hydrolytic enzymes, because these act upon native proteins and catalyze the breakdown of peptide bonds. These are found in plant tissues, animal tissues and micro-organisms. Microbial source is preferred than the plant and animal source, since they possess almost all the characteristics desirable for their biotechnological applications and can be extracted profitably and economically. Among different microorganisms, especially bacteria of Bacillus species are commercially very important producers of proteases (Adinarayana et al., 2003; Joo, 2005; Ahmad, et al., 2011).
Many procedures have been used for alkaline protease downstream processing especially those which do not cause denaturation of enzyme. A protein may be purified by single step e.g. affinity chromatography or by combination of several steps e.g. fractionation with salts or solvents, ion exchange and gel filtration. It can be carried out by inorganic salts and organic solvents. The most commonly used salt is ammonium sulphate. Various organic solvents such as methanol, ethanol, acetone and diethyl ether can also be used for the precipitation of proteins (Towatana, et al., 1999; Reed, 2004; Iftikhar, et al., 2011).
Fractionation is one of the easiest and least expensive procedures for the purification of industrial enzymes. This is the oldest and most commonly used
166 NADEEMULLAH & H. MUKHTAR BIOLOGIA (PAKISTAN)
method of fractioning enzymes in which neutral salts such as ammonium sulphate are used at high concentrations. Ammonium sulphate is the most commonly used salt because it is inexpensive, highly soluble, having minimum harmful effects and stability effect on many enzymes and fractionate the enzyme at room temperature. Enzymes having high molecular weight usually precipitate at lower ammonium sulphate saturation (25-35%) and vice versa (Secades & Guijarro, 1999; Lee, et al., 2002).
Purpose of study:
The major purpose of the present study was to partially purify alkaline protease with the help of acetone and ammonium sulphate and to assess the efficiency of these used chemicals.
MATERIALS AND METHODS
Bacterial culture collection and maintenance
The bacterial culture of Bacillus subtilis was taken from culture bank of Institute of Industrial Biotechnology, GC University, Lahore. The culture was originally isolated from the soil of a tannery area. The culture was revived by transferring to the slants of peptone-yeast extract agar medium. After taking growth the culture was maintained weekly by transferring to fresh slants and was stored at 4°C in a cool place.
Fermentation experiment Bacterial inoculum was prepared in 250ml Erlenmeyer flask containing 50ml of nutrient broth medium. After sterilization a loop full of bacteria from a fresh slant was transferred to the flask under aseptic conditions. The flasks were then placed in the shaking incubator at 37°C rotating at a speed of 200 rpm for 24 hours. One milliliter of that broth containing rich growth of the bacterium was used as an inoculum. About 50ml of fermentation medium (g/l: soybean meal, 20; Glucose, 10; polypeptone, 10; KH2PO4, 1.0; (NH4)2SO4, 1.0 and Na2CO3, 5.0) was taken in 250ml Erlenmeyer flasks. The flasks were sterilized and inoculated with 1ml of inoculum under aseptic conditions. Then the flasks were placed in shaking incubator at 37ºC at 200 rpm for 48 hrs. After fermentation the broth was centrifuged at 6,000 rpm for 10 minutes and the supernatant was used for enzyme purification and other analytical procedures (Mukhtar & Haq, 2008). Assay of proteolytic enzyme The method of McDonald & Chen (1965) was used for the assay of proteolytic enzyme. Casein was used as substrate, blue colour was developed by the addition of Folin & Ciocalteau reagent and O.D was obtained at 700 nm. Protein estimation The method of Bradford 1976 was used for the estimation of protein content in the fermentation broth.
VOL. 59 (1) ALKALINE PROTEASE BY BACILLUS SUBTILIS 167
Mutagenesis Ethyl methane sulphonate (EMS) was used as a chemical mutagen for
inducing mutation in B. subtilis. Wild bacteria were grown in peptone-yeast extract medium for 24 hrs in 250ml flasks. After taking growth, the broth was centrifuged at 5000 rpm for 10 min. Supernatant was discarded and the pellet was washed with sterilized saline water and resuspended in 5ml of 0.2 M Tris. 150 µl of EMS was added in the tube and shaken well. The medium was incubated at 37ºC for 2 hrs. After prescribed period, the medium was centrifuged and pellet was washed. The suspension was poured on peptone-yeast extract casein-agar plates and placed in incubator at 37ºC for 24-48 hrs. Purification of alkaline protease
1. Ammonium sulphate precipitation Solid ammonium sulphate was added to 100 ml of crude cell free broth of
protease at the concentration of 30% (w/v). The suspension was stirred for half an hour at 4⁰C in cold room. After sufficient shaking the precipitates were
collected by centrifugation at 15,000 rpm for 15 minutes at 4⁰C. Similarly,
enzyme solution was then treated with 40, 50 and 60% (w/v) ammonium sulphate
to achieve the desired saturation from 30% to 80 % at 4⁰C. Proteolytic activity
was determined in the supernatant after each treatment and precipitates were collected for further purification.
2. Acetone Precipitation
Crude enzyme extract was mixed at 4⁰C with cold acetone and kept at
0⁰C for 12 hrs. The resultant precipitates were pelleted by centrifugation at
15,000 rpm for 15 minutes at 4⁰C.The pelleted precipitates after removing
supernatant were re-suspended in potassium phosphate / Tris-HCl buffer to one fifth of the starting volume. Then the proteolytic activity was measured. Dialysis
The precipitates obtained by ammonium sulphate and acetone were dialyzed in small volume of the dialysis buffer using 12,000 molecular weight cut off dialyzed bag, which was placed in one litre of the buffer (pH 7.0) for 24 hrs at
4⁰C. The proteolytic activity of the dialyzed material was determined.
RESULTS AND DISCUSSIONS
Ammonium sulphate and acetone fractionation
The protease was purified by using ammonium sulphate and acetone fractionation. The fractionation was carried out from 30 to 80 % saturation of acetone and ammonium sulphate. In case of acetone precipitation, the fractionation was started from 40% saturation and at 70% saturation it reached at maximum after which it started to decline sharply. There was 54.97 purification fold with 40.5% yield and the specific activity was 2.419µg/ml/mg (Table 1). While on the other hand, in ammonium suphate precipitation, maximum enzyme purification was achieved at 60% saturation corresponding to 109.09 fold purification with 49.7% yield and specific activity was 4.8µg/ml/mg (Table 2).
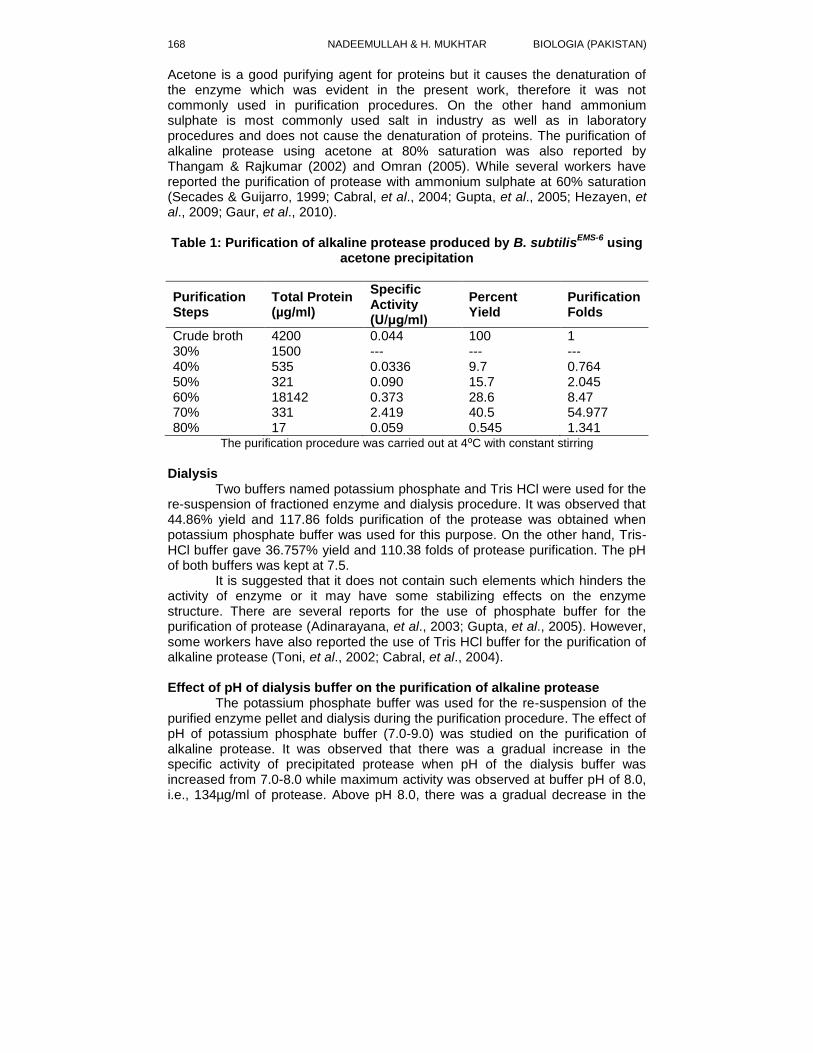
168 NADEEMULLAH & H. MUKHTAR BIOLOGIA (PAKISTAN)
Acetone is a good purifying agent for proteins but it causes the denaturation of the enzyme which was evident in the present work, therefore it was not commonly used in purification procedures. On the other hand ammonium sulphate is most commonly used salt in industry as well as in laboratory procedures and does not cause the denaturation of proteins. The purification of alkaline protease using acetone at 80% saturation was also reported by Thangam & Rajkumar (2002) and Omran (2005). While several workers have reported the purification of protease with ammonium sulphate at 60% saturation (Secades & Guijarro, 1999; Cabral, et al., 2004; Gupta, et al., 2005; Hezayen, et al., 2009; Gaur, et al., 2010). Table 1: Purification of alkaline protease produced by B. subtilis
EMS-6 using
acetone precipitation
Purification Steps
Total Protein (µg/ml)
Specific Activity (U/μg/ml)
Percent Yield
Purification Folds
Crude broth 4200 0.044 100 1 30% 1500 --- --- --- 40% 535 0.0336 9.7 0.764 50% 321 0.090 15.7 2.045 60% 18142 0.373 28.6 8.47 70% 331 2.419 40.5 54.977 80% 17 0.059 0.545 1.341
The purification procedure was carried out at 4⁰C with constant stirring
Dialysis
Two buffers named potassium phosphate and Tris HCl were used for the re-suspension of fractioned enzyme and dialysis procedure. It was observed that 44.86% yield and 117.86 folds purification of the protease was obtained when potassium phosphate buffer was used for this purpose. On the other hand, Tris-HCl buffer gave 36.757% yield and 110.38 folds of protease purification. The pH of both buffers was kept at 7.5.
It is suggested that it does not contain such elements which hinders the activity of enzyme or it may have some stabilizing effects on the enzyme structure. There are several reports for the use of phosphate buffer for the purification of protease (Adinarayana, et al., 2003; Gupta, et al., 2005). However, some workers have also reported the use of Tris HCl buffer for the purification of alkaline protease (Toni, et al., 2002; Cabral, et al., 2004). Effect of pH of dialysis buffer on the purification of alkaline protease
The potassium phosphate buffer was used for the re-suspension of the purified enzyme pellet and dialysis during the purification procedure. The effect of pH of potassium phosphate buffer (7.0-9.0) was studied on the purification of alkaline protease. It was observed that there was a gradual increase in the specific activity of precipitated protease when pH of the dialysis buffer was increased from 7.0-8.0 while maximum activity was observed at buffer pH of 8.0, i.e., 134µg/ml of protease. Above pH 8.0, there was a gradual decrease in the
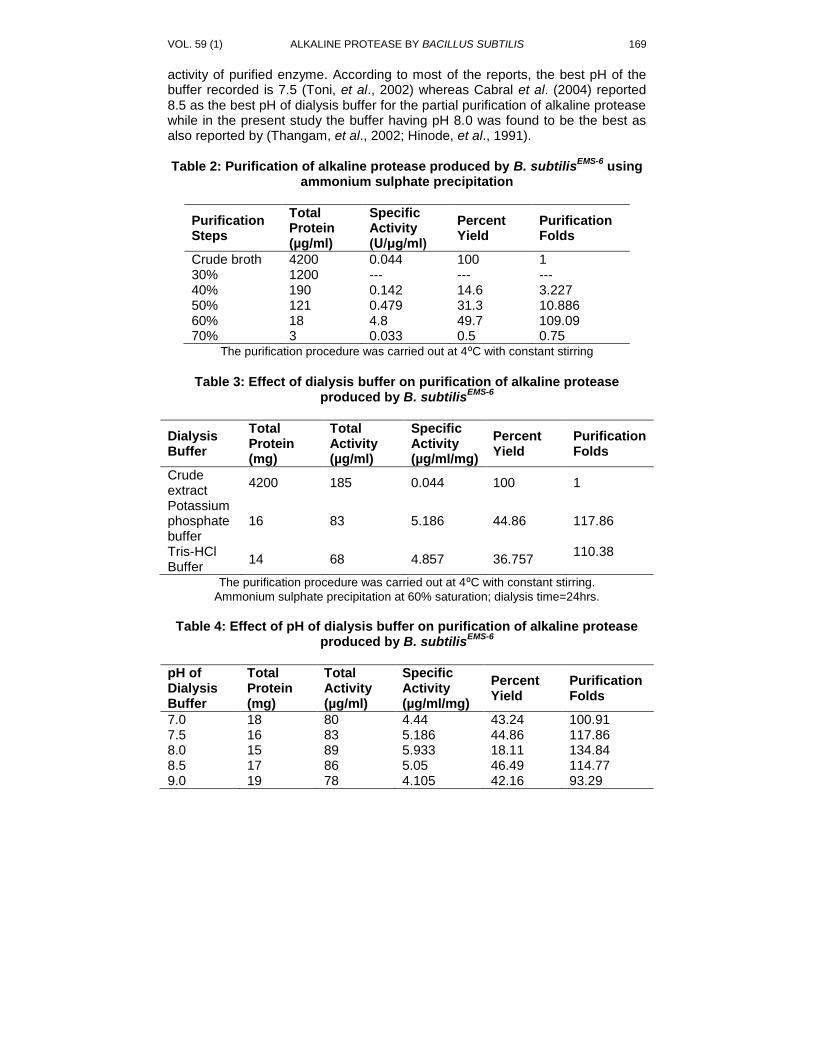
VOL. 59 (1) ALKALINE PROTEASE BY BACILLUS SUBTILIS 169
activity of purified enzyme. According to most of the reports, the best pH of the buffer recorded is 7.5 (Toni, et al., 2002) whereas Cabral et al. (2004) reported 8.5 as the best pH of dialysis buffer for the partial purification of alkaline protease while in the present study the buffer having pH 8.0 was found to be the best as also reported by (Thangam, et al., 2002; Hinode, et al., 1991). Table 2: Purification of alkaline protease produced by B. subtilis
EMS-6 using
ammonium sulphate precipitation
Purification Steps
Total Protein (µg/ml)
Specific Activity (U/μg/ml)
Percent Yield
Purification Folds
Crude broth 4200 0.044 100 1 30% 1200 --- --- --- 40% 190 0.142 14.6 3.227 50% 121 0.479 31.3 10.886 60% 18 4.8 49.7 109.09 70% 3 0.033 0.5 0.75
The purification procedure was carried out at 4⁰C with constant stirring
Table 3: Effect of dialysis buffer on purification of alkaline protease
produced by B. subtilisEMS-6
Dialysis Buffer
Total Protein (mg)
Total Activity (µg/ml)
Specific Activity (µg/ml/mg)
Percent Yield
Purification Folds
Crude extract
4200 185 0.044 100 1
Potassium phosphate buffer
16 83 5.186 44.86 117.86
Tris-HCl Buffer
14 68 4.857 36.757 110.38
The purification procedure was carried out at 4⁰C with constant stirring.
Ammonium sulphate precipitation at 60% saturation; dialysis time=24hrs.
Table 4: Effect of pH of dialysis buffer on purification of alkaline protease
produced by B. subtilisEMS-6
pH of Dialysis Buffer
Total Protein (mg)
Total Activity (µg/ml)
Specific Activity (µg/ml/mg)
Percent Yield
Purification Folds
7.0 18 80 4.44 43.24 100.91 7.5 16 83 5.186 44.86 117.86 8.0 15 89 5.933 18.11 134.84 8.5 17 86 5.05 46.49 114.77 9.0 19 78 4.105 42.16 93.29
170 NADEEMULLAH & H. MUKHTAR BIOLOGIA (PAKISTAN)
REFERENCES
Adinarayana, K., Ellaiah, P. & Prasad, D.S., 2003. Production and partial characterization of thermostable serine alkaline protease from newly isolated Bacillus subtilis PE-11. AAPS. Pharm. Sci. Tech., 4(4): 440-448.
Ahmad, I., Zia, M.A., Iftikhar, T. & Iqbal, H.M.N., 2011. Characterization and detergent compatibility of purified proteases produced from Aspergillus niger by utilizing agrowastes. BioResources., 6(4): 4505-4522.
Barredo, J.L., 2004. Microbial enzymes and biotransformations. Methods in Biotechnol., 17: 78-152.
Bradford, M.M., 1976. A rapid and sensitive method for the quantitation of microgram quantities of protein utilizing the principle of protein-dye binding. Anal Biochem., 72: 248-254.
Cabral, C.M., Cherquii, A., Pereira, A. & Simoes, N., 2004. Purification and characterization of two distinct metalloproteases secreted by endopathogenic bacterium Photorhabdus sp. Strain Az29. Appl. Env. Microbiol., 70(7): 3831-3838.
Gaur, S., Agrahari, S. & Wadhwa, N., 2010. Purification of protease from Pseudomonas thermaerum GW1 isolated from poultry waste site. The Open Microbiology Journal, 4: 67-74.
Gupta, A., Roy, I., Patel, R.K., Singh, S.P., Khare, S.K. & Gupta, M.N., 2005. One step purification of alkaline protease from haloalkaliphilic Bacillus sp. J. Chromatography., 10(75): 103-108.
Hezayen, F.F., Gutierrez, C.M., Steinbuchel, A., Tindal, B.J. & Rehm, B.H., 2009. Halopiger aswanensis sp. Nov., a polymer producing extremely halophilic archaeon isolated from hypersaline soil. Int. J. Syst. Evol. Microbiol., 60(3): 633-637
Hinode, D., Hayashi, H. & Nakamura, R., 1991. Purification & characterization of three types of proteases from culture supernatants of Porphyromonas gingivalis. Infac. Immun., 59: 3060-3068
Horikoshi, K., 1999. Alkaliphiles: some applications of their products for biotechnology.Microbiol. Mol. Biol., 63: 735–750.
Iftikhar, T., Niaz, M., Haq, I.U. & Jabeen, R., 2011. Purification and characterization of extracellular lipases. Pak. J. Bot., 43(3): 1541-1545.
Joo, S.H., 2005. Cultural conditions for protease production by a featherdegrading bacterium, Bacillus megaterium F7-1. INISTCNRS., 33(4): 315-318.
Lee, H., Suh, D.B., Hwang, J.H. & Suh, H.J., 2002. Characterization of a keratinolytic metalloprotease from Bacillus spp. SCB-3.Appl. Biochem. Biotechnol., 97: 123-133.
McDonald, C.E. & Chen. L.L., 1965. Lowry modification of the Folin reagent for determination of proteinase activity. Annals Biochem., 10: 175-177.
Mukhtar, H. & Haq. I., 2008. Production of alkaline protease from Bacillus subtilis and its application as a depilating agent in leather processing. Pak. J. Bot., 40(4): 1673-1679.
Omran, R., 2005. Charracterization of alkaline protease from Thermoactinomyces sp. National J. of Chem., 19: 446-456
VOL. 59 (1) ALKALINE PROTEASE BY BACILLUS SUBTILIS 171
Raju, K., Jaya, R. & Ayyanna, C., 1994. Hydrolysis of casein by bajara protease importance. Biotechnol. Coming Decades., 181: 55-70.
Reed, G., 2004. Presscott and Dunn’s Industrial Microbiology, 4th Ed., CBS
Publishers and Distributors, New Delhi, India, pp. 684-691. Secades, P. & Guijarro, J.A., 1999. Purification and characterization of an
extracellular protease from the fish pathogen Yersinia ruckeri and effect of culture conditions on production. Appl. Env. Microbiol., 65(9): 39969-3975.
Thangam, E.B. & Rajkumar, G.S., 2002. Purification and characterization of alkaline protease from Alcaligenes faecalis. Biotechnol. Appl. Biochem., 35: 149-154.
Toni, C.H., DeRichter, M.F., Chages, J.R., Henriques, J.A.P. & Termignoni, C., 2002. Purification and characterization of an alkaline serine endopeptidase from a feather-degrading Xanthomonas maltophilia strain. Can. J. Micro., 48(4): 342-348.
Towatana, N.H., Painupong, A. & Suntinanaler, P., 1999. Purification and characterization of an extracellular protease from alkaliphilic and thermophilic Bacillus sp. PS 719. J. Bio. Sci. Bioeng., 87: 581-587.
Woods, R., Burger, M., Bevan, C. & Beacham, I., 2001. Extracellular enzyme production in Pseudomonas fluorescence. J. Microbiol., 143: 345-354.
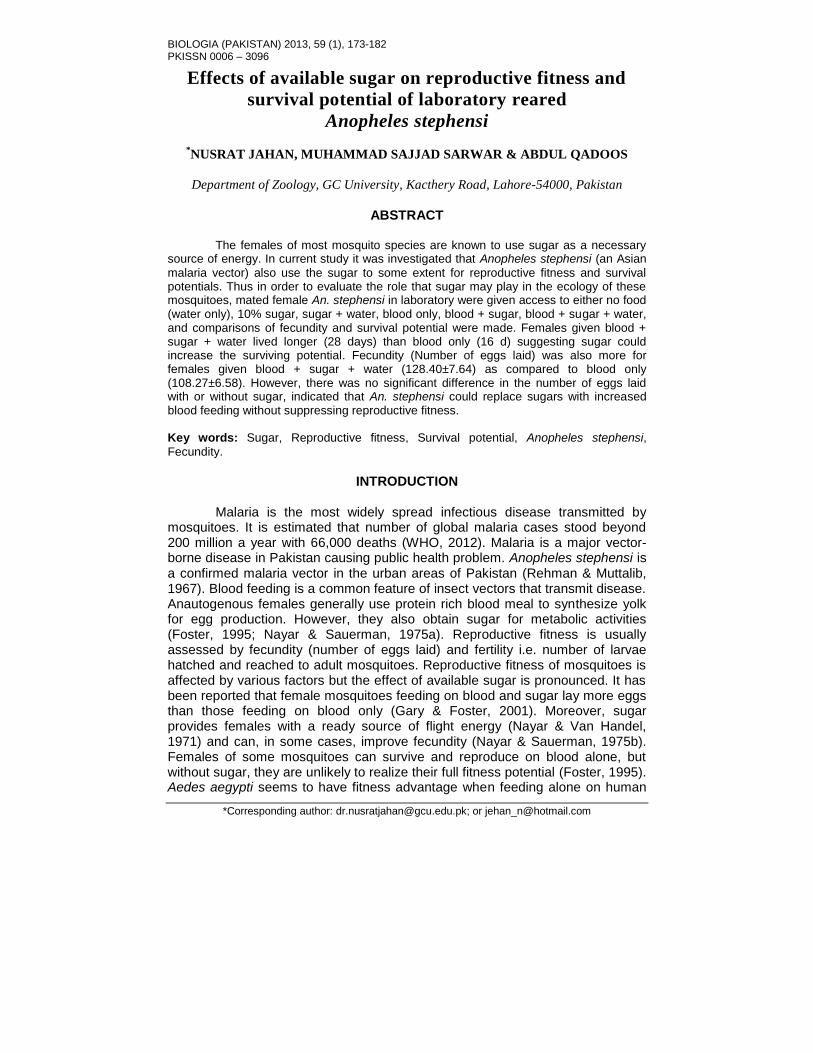
BIOLOGIA (PAKISTAN) 2013, 59 (1), 173-182 PKISSN 0006 – 3096
*Corresponding author: [email protected]; or [email protected]
Effects of available sugar on reproductive fitness and
survival potential of laboratory reared
Anopheles stephensi
*NUSRAT JAHAN, MUHAMMAD SAJJAD SARWAR & ABDUL QADOOS
Department of Zoology, GC University, Kacthery Road, Lahore-54000, Pakistan
ABSTRACT
The females of most mosquito species are known to use sugar as a necessary source of energy. In current study it was investigated that Anopheles stephensi (an Asian
malaria vector) also use the sugar to some extent for reproductive fitness and survival potentials. Thus in order to evaluate the role that sugar may play in the ecology of these mosquitoes, mated female An. stephensi in laboratory were given access to either no food (water only), 10% sugar, sugar + water, blood only, blood + sugar, blood + sugar + water, and comparisons of fecundity and survival potential were made. Females given blood + sugar + water lived longer (28 days) than blood only (16 d) suggesting sugar could increase the surviving potential. Fecundity (Number of eggs laid) was also more for females given blood + sugar + water (128.40±7.64) as compared to blood only (108.27±6.58). However, there was no significant difference in the number of eggs laid with or without sugar, indicated that An. stephensi could replace sugars with increased blood feeding without suppressing reproductive fitness. Key words: Sugar, Reproductive fitness, Survival potential, Anopheles stephensi,
Fecundity.
INTRODUCTION
Malaria is the most widely spread infectious disease transmitted by
mosquitoes. It is estimated that number of global malaria cases stood beyond 200 million a year with 66,000 deaths (WHO, 2012). Malaria is a major vector-borne disease in Pakistan causing public health problem. Anopheles stephensi is a confirmed malaria vector in the urban areas of Pakistan (Rehman & Muttalib, 1967). Blood feeding is a common feature of insect vectors that transmit disease. Anautogenous females generally use protein rich blood meal to synthesize yolk for egg production. However, they also obtain sugar for metabolic activities (Foster, 1995; Nayar & Sauerman, 1975a). Reproductive fitness is usually assessed by fecundity (number of eggs laid) and fertility i.e. number of larvae hatched and reached to adult mosquitoes. Reproductive fitness of mosquitoes is affected by various factors but the effect of available sugar is pronounced. It has been reported that female mosquitoes feeding on blood and sugar lay more eggs than those feeding on blood only (Gary & Foster, 2001). Moreover, sugar provides females with a ready source of flight energy (Nayar & Van Handel, 1971) and can, in some cases, improve fecundity (Nayar & Sauerman, 1975b). Females of some mosquitoes can survive and reproduce on blood alone, but without sugar, they are unlikely to realize their full fitness potential (Foster, 1995). Aedes aegypti seems to have fitness advantage when feeding alone on human
N. JAHAN ET AL BIOLOGIA (PAKISTAN) 174
blood (Foster, 1995; Morrison et al., 1999; Scott et al., 1997). However, sugar feeding is more common with abundant supply of nectar sources (Martinez-Ibarra et al., 1997), despite the presence of blood hosts and the apparent cost of fecundity (Morrison et al., 1999), indicating that excessive blood feeding may be a function of sugar scarcity.
The extensive study on blood feeding suggested that feeding on flower nectars greatly affects the longevity (hence vectorial capacity) and dispersal potential of mosquitoes and therefore ability to transmit diseases. It is well documented that mosquitoes (males as well as females) visit the flowering plants and utilize nectar sugars as energy for survival, reproduction and flight (Clements, 1963; Nayar & Van Handel, 1971). Therefore, it appears that females will obtain nectar whenever possible, utilize some of the carbohydrates for immediate energy in flight and for survival, incorporated some carbohydrates into yolk, and store the remainder as glycogen and triglycerides for later use (Van Handel, 1972).
The female mosquitoes of different age groups acquired fructose in all phases of the gonotrophic cycles and some individuals obtained nectar before completing their first ovarian cycle. It is further reported that nectar feeding in females was widespread (Magnarelli, 1979). Wild caught Ae. communis females were fed with human blood once repletion, and were provided with water only (not sugar) failed to mature their ovaries. When fed with sugar solution after blood meal, about 15% of females mature their ovaries (Andersson, 1992).
Okech et al. (2003) studied influence of sugar availability and indoor microclimate on survival of An. gambiae. Mosquitoes fed with human blood alone (once every two d), 6% glucose only, and blood + glucose were survived 14, 29 and 33 d respectively. The feeding on blood not only increase fecundity, but blood is also responsible for higher biting frequency in Ae. aegypti (Foster & Eischen, 1987). In An. gambiae close association between sugar feeding and blood feeding was found in 20 d old mosquitoes provided with and without sugar. Generally in sugar deprived, female's blood feeding capability increased (Straif & Beier, 1996). It has also been observed that survival of Ae. aegypti and Ae. albopictus sugar-fed females was significantly greater than that of sugar-deprived females (Braks et al., 2006).
Effect of adult diet on host biting and survival of Ae. aegypti has been studied by Canyon et al. (1999). The authors reported that biting frequency was not significantly different between blood only versus blood + water and survival on blood alone was also not significantly lower than survival on sugar + water supplemented diet. Age specific survivorship was found higher in Ae. aegypti when fed on blood + sugar as compared to blood only (Costero et al., 1998). In addition, Ae. aegypti feeding only on human blood had greater fecundity but these mosquitoes also had greater biting frequency (Foster & Eischen, 1987). The supplemented meals are used to meet their metabolic needs and this can be supported by the fact that multiple blood meals are carried out in the fields during a gonotrophic cycle (Scott et al., 1993). In most mosquitoes, survivorship is increased through sugar feeding (Foster, 1995).
The effect of available sugar on the reproductive fitness and vectorial capacity of the malaria vector An. gambiae was studied by Gary & Foster (2001). Females given blood and sugar lived significantly longer than did those fed on
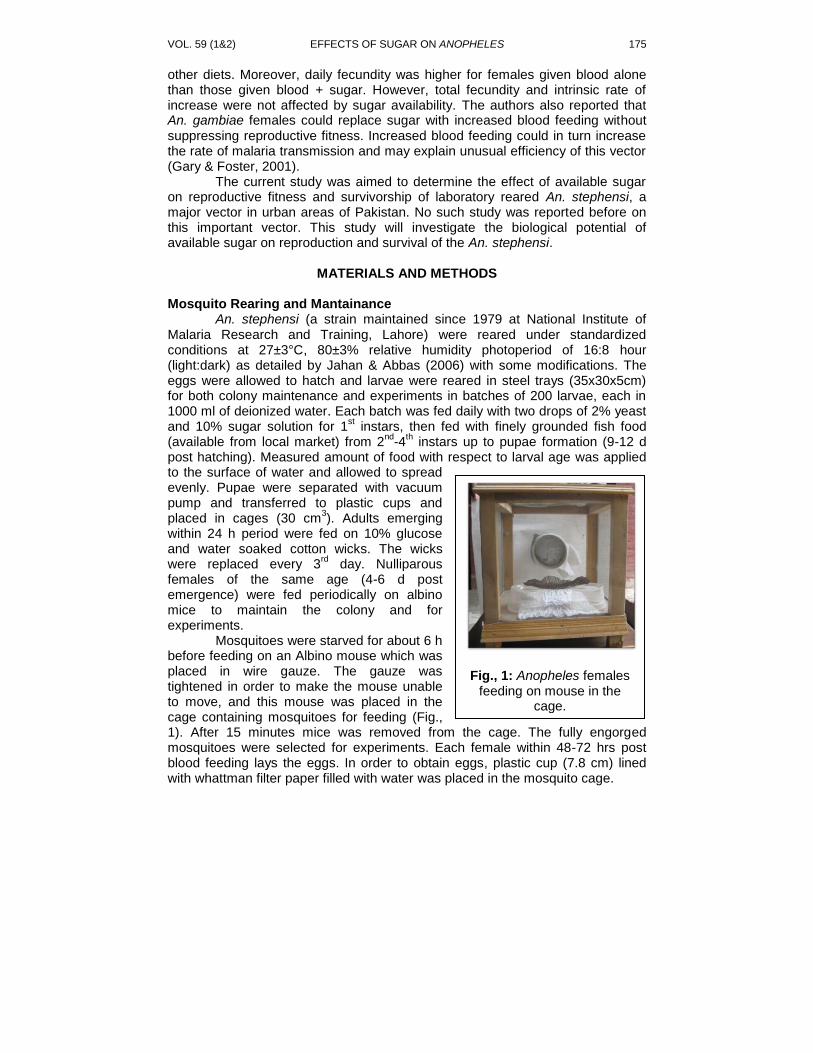
VOL. 59 (1&2) EFFECTS OF SUGAR ON ANOPHELES 175
other diets. Moreover, daily fecundity was higher for females given blood alone than those given blood + sugar. However, total fecundity and intrinsic rate of increase were not affected by sugar availability. The authors also reported that An. gambiae females could replace sugar with increased blood feeding without suppressing reproductive fitness. Increased blood feeding could in turn increase the rate of malaria transmission and may explain unusual efficiency of this vector (Gary & Foster, 2001).
The current study was aimed to determine the effect of available sugar on reproductive fitness and survivorship of laboratory reared An. stephensi, a major vector in urban areas of Pakistan. No such study was reported before on this important vector. This study will investigate the biological potential of available sugar on reproduction and survival of the An. stephensi.
MATERIALS AND METHODS
Mosquito Rearing and Mantainance
An. stephensi (a strain maintained since 1979 at National Institute of Malaria Research and Training, Lahore) were reared under standardized conditions at 27±3°C, 80±3% relative humidity photoperiod of 16:8 hour (light:dark) as detailed by Jahan & Abbas (2006) with some modifications. The eggs were allowed to hatch and larvae were reared in steel trays (35x30x5cm) for both colony maintenance and experiments in batches of 200 larvae, each in 1000 ml of deionized water. Each batch was fed daily with two drops of 2% yeast and 10% sugar solution for 1
st instars, then fed with finely grounded fish food
(available from local market) from 2nd
-4th instars up to pupae formation (9-12 d
post hatching). Measured amount of food with respect to larval age was applied to the surface of water and allowed to spread evenly. Pupae were separated with vacuum pump and transferred to plastic cups and placed in cages (30 cm
3). Adults emerging
within 24 h period were fed on 10% glucose and water soaked cotton wicks. The wicks were replaced every 3
rd day. Nulliparous
females of the same age (4-6 d post emergence) were fed periodically on albino mice to maintain the colony and for experiments.
Mosquitoes were starved for about 6 h before feeding on an Albino mouse which was placed in wire gauze. The gauze was tightened in order to make the mouse unable to move, and this mouse was placed in the cage containing mosquitoes for feeding (Fig., 1). After 15 minutes mice was removed from the cage. The fully engorged mosquitoes were selected for experiments. Each female within 48-72 hrs post blood feeding lays the eggs. In order to obtain eggs, plastic cup (7.8 cm) lined with whattman filter paper filled with water was placed in the mosquito cage.
Fig., 1: Anopheles females feeding on mouse in the
cage.
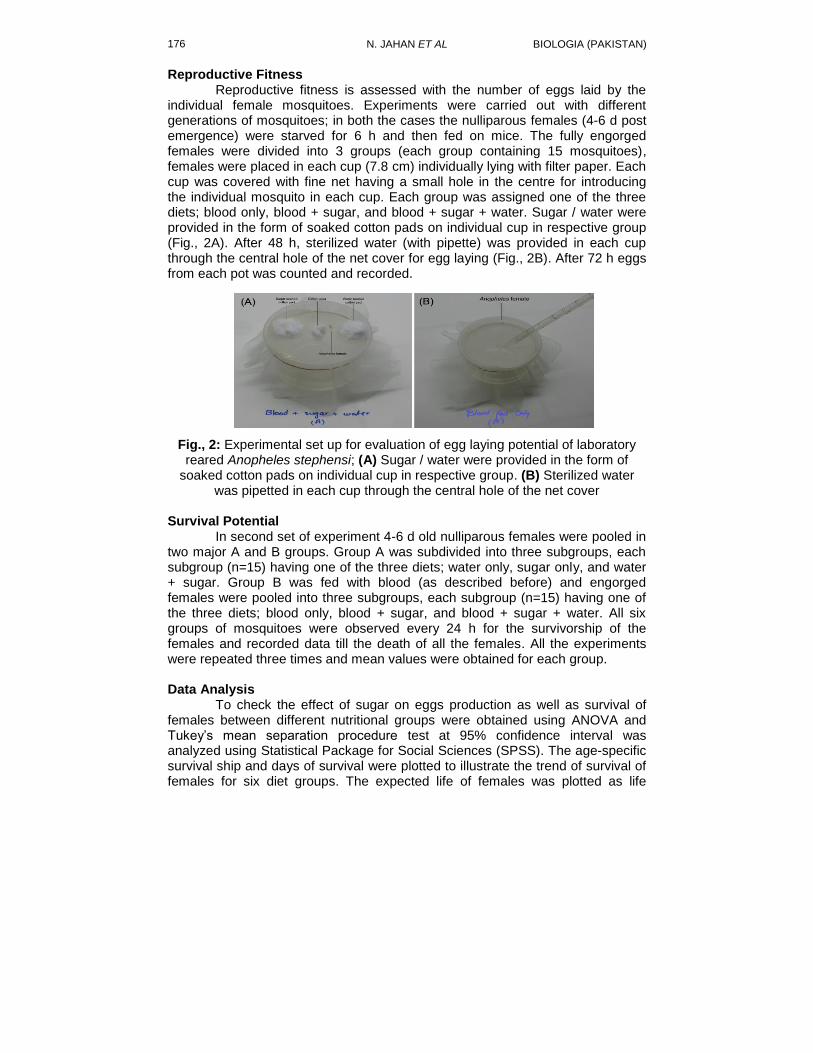
N. JAHAN ET AL BIOLOGIA (PAKISTAN) 176
Reproductive Fitness Reproductive fitness is assessed with the number of eggs laid by the
individual female mosquitoes. Experiments were carried out with different generations of mosquitoes; in both the cases the nulliparous females (4-6 d post emergence) were starved for 6 h and then fed on mice. The fully engorged females were divided into 3 groups (each group containing 15 mosquitoes), females were placed in each cup (7.8 cm) individually lying with filter paper. Each cup was covered with fine net having a small hole in the centre for introducing the individual mosquito in each cup. Each group was assigned one of the three diets; blood only, blood + sugar, and blood + sugar + water. Sugar / water were provided in the form of soaked cotton pads on individual cup in respective group (Fig., 2A). After 48 h, sterilized water (with pipette) was provided in each cup through the central hole of the net cover for egg laying (Fig., 2B). After 72 h eggs from each pot was counted and recorded.
Fig., 2: Experimental set up for evaluation of egg laying potential of laboratory reared Anopheles stephensi; (A) Sugar / water were provided in the form of
soaked cotton pads on individual cup in respective group. (B) Sterilized water was pipetted in each cup through the central hole of the net cover
Survival Potential
In second set of experiment 4-6 d old nulliparous females were pooled in two major A and B groups. Group A was subdivided into three subgroups, each subgroup (n=15) having one of the three diets; water only, sugar only, and water + sugar. Group B was fed with blood (as described before) and engorged females were pooled into three subgroups, each subgroup (n=15) having one of the three diets; blood only, blood + sugar, and blood + sugar + water. All six groups of mosquitoes were observed every 24 h for the survivorship of the females and recorded data till the death of all the females. All the experiments were repeated three times and mean values were obtained for each group.
Data Analysis
To check the effect of sugar on eggs production as well as survival of females between different nutritional groups were obtained using ANOVA and Tukey’s mean separation procedure test at 95% confidence interval was analyzed using Statistical Package for Social Sciences (SPSS). The age-specific survival ship and days of survival were plotted to illustrate the trend of survival of females for six diet groups. The expected life of females was plotted as life
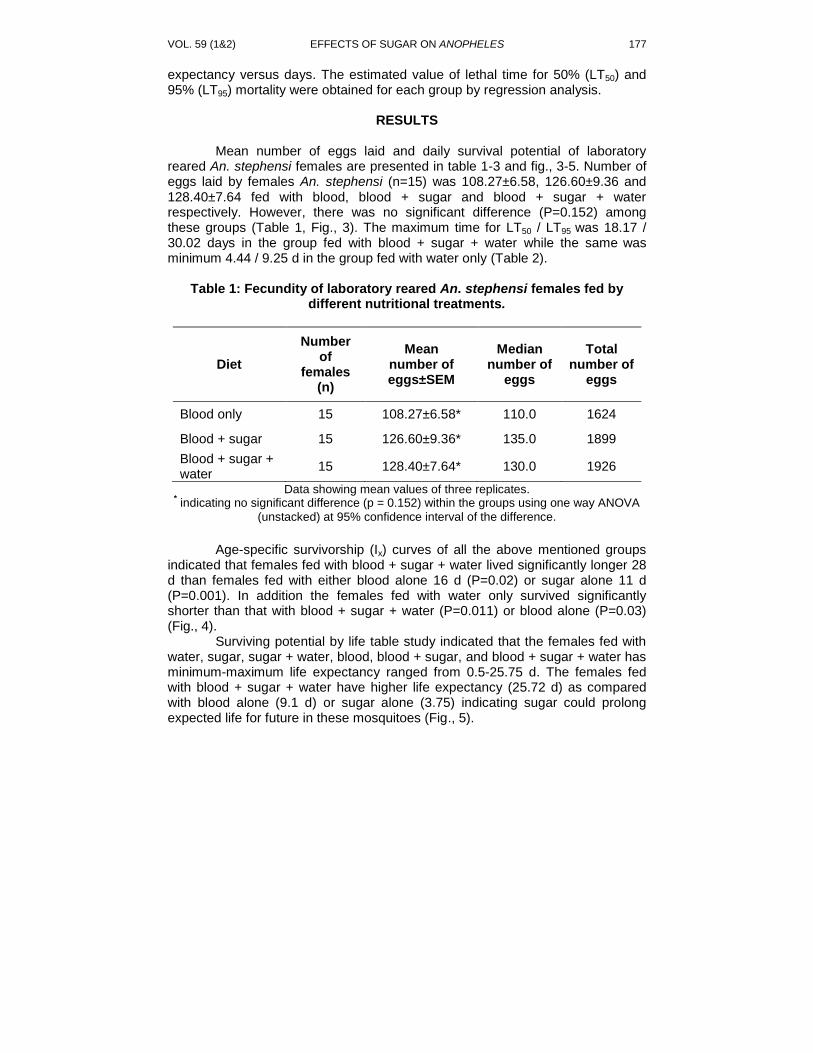
VOL. 59 (1&2) EFFECTS OF SUGAR ON ANOPHELES 177
expectancy versus days. The estimated value of lethal time for 50% (LT50) and 95% (LT95) mortality were obtained for each group by regression analysis.
RESULTS
Mean number of eggs laid and daily survival potential of laboratory
reared An. stephensi females are presented in table 1-3 and fig., 3-5. Number of eggs laid by females An. stephensi (n=15) was 108.27±6.58, 126.60±9.36 and 128.40±7.64 fed with blood, blood + sugar and blood + sugar + water respectively. However, there was no significant difference (P=0.152) among these groups (Table 1, Fig., 3). The maximum time for LT50 / LT95 was 18.17 / 30.02 days in the group fed with blood + sugar + water while the same was minimum 4.44 / 9.25 d in the group fed with water only (Table 2).
Table 1: Fecundity of laboratory reared An. stephensi females fed by
different nutritional treatments.
Diet
Number of
females (n)
Mean number of eggs±SEM
Median number of
eggs
Total number of
eggs
Blood only 15 108.27±6.58* 110.0 1624
Blood + sugar 15 126.60±9.36* 135.0 1899
Blood + sugar + water
15 128.40±7.64* 130.0 1926
Data showing mean values of three replicates. * indicating no significant difference (p = 0.152) within the groups using one way ANOVA
(unstacked) at 95% confidence interval of the difference.
Age-specific survivorship (Ix) curves of all the above mentioned groups
indicated that females fed with blood + sugar + water lived significantly longer 28 d than females fed with either blood alone 16 d (P=0.02) or sugar alone 11 d (P=0.001). In addition the females fed with water only survived significantly shorter than that with blood + sugar + water (P=0.011) or blood alone (P=0.03) (Fig., 4).
Surviving potential by life table study indicated that the females fed with water, sugar, sugar + water, blood, blood + sugar, and blood + sugar + water has minimum-maximum life expectancy ranged from 0.5-25.75 d. The females fed with blood + sugar + water have higher life expectancy (25.72 d) as compared with blood alone (9.1 d) or sugar alone (3.75) indicating sugar could prolong expected life for future in these mosquitoes (Fig., 5).
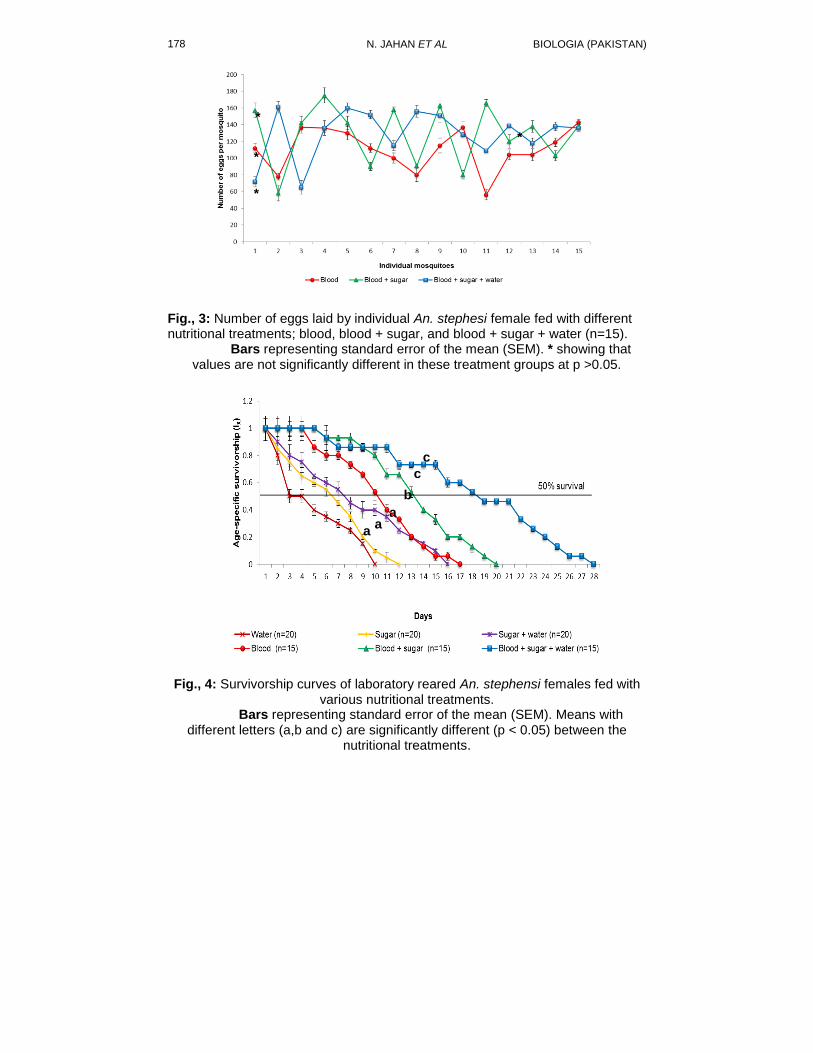
N. JAHAN ET AL BIOLOGIA (PAKISTAN) 178
Fig., 3: Number of eggs laid by individual An. stephesi female fed with different nutritional treatments; blood, blood + sugar, and blood + sugar + water (n=15).
Bars representing standard error of the mean (SEM). * showing that values are not significantly different in these treatment groups at p >0.05.
Fig., 4: Survivorship curves of laboratory reared An. stephensi females fed with various nutritional treatments.
Bars representing standard error of the mean (SEM). Means with different letters (a,b and c) are significantly different (p < 0.05) between the
nutritional treatments.
*
*
*
*
a
c
c
a
b
a
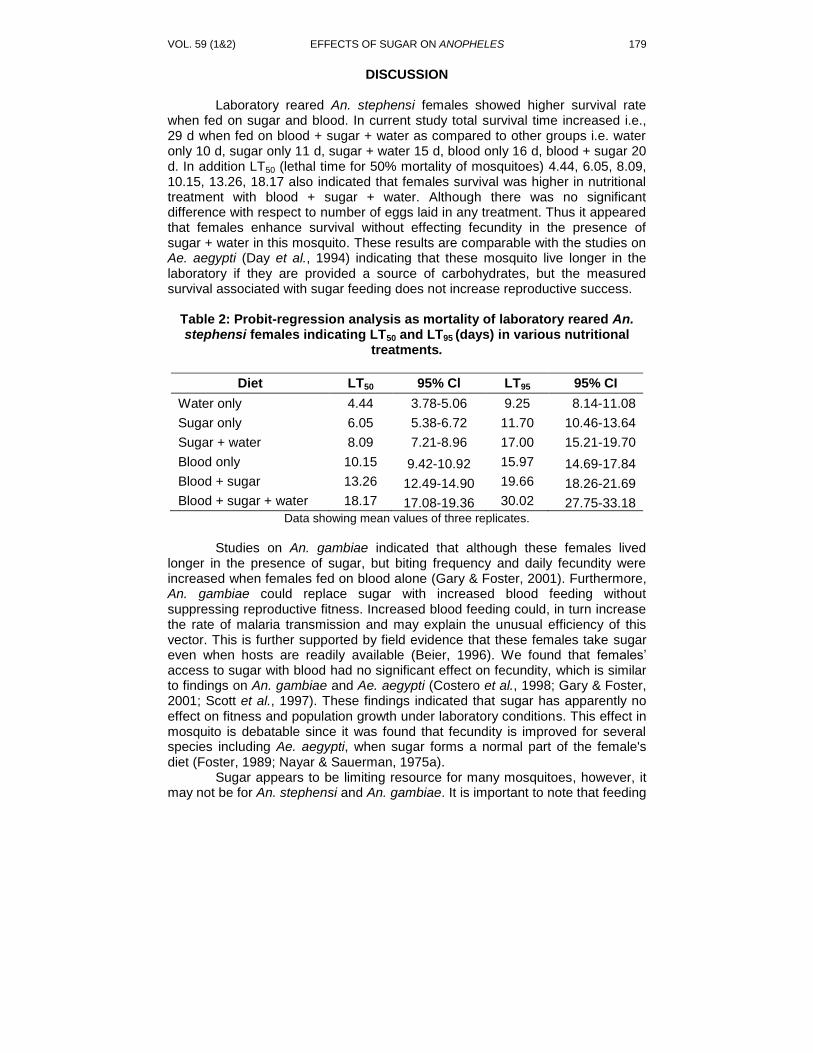
VOL. 59 (1&2) EFFECTS OF SUGAR ON ANOPHELES 179
DISCUSSION
Laboratory reared An. stephensi females showed higher survival rate when fed on sugar and blood. In current study total survival time increased i.e., 29 d when fed on blood + sugar + water as compared to other groups i.e. water only 10 d, sugar only 11 d, sugar + water 15 d, blood only 16 d, blood + sugar 20 d. In addition LT50 (lethal time for 50% mortality of mosquitoes) 4.44, 6.05, 8.09, 10.15, 13.26, 18.17 also indicated that females survival was higher in nutritional treatment with blood + sugar + water. Although there was no significant difference with respect to number of eggs laid in any treatment. Thus it appeared that females enhance survival without effecting fecundity in the presence of sugar + water in this mosquito. These results are comparable with the studies on Ae. aegypti (Day et al., 1994) indicating that these mosquito live longer in the laboratory if they are provided a source of carbohydrates, but the measured survival associated with sugar feeding does not increase reproductive success.
Table 2: Probit-regression analysis as mortality of laboratory reared An. stephensi females indicating LT50 and LT95 (days) in various nutritional
treatments.
Diet LT50 95% Cl LT95 95% CI
Water only 4.44 3.78-5.06 9.25 8.14-11.08
Sugar only 6.05 5.38-6.72 11.70 10.46-13.64
Sugar + water 8.09 7.21-8.96 17.00 15.21-19.70
Blood only 10.15 9.42-10.92 15.97 14.69-17.84
Blood + sugar 13.26 12.49-14.90 19.66 18.26-21.69
Blood + sugar + water 18.17 17.08-19.36 30.02 27.75-33.18 Data showing mean values of three replicates.
Studies on An. gambiae indicated that although these females lived
longer in the presence of sugar, but biting frequency and daily fecundity were increased when females fed on blood alone (Gary & Foster, 2001). Furthermore, An. gambiae could replace sugar with increased blood feeding without suppressing reproductive fitness. Increased blood feeding could, in turn increase the rate of malaria transmission and may explain the unusual efficiency of this vector. This is further supported by field evidence that these females take sugar even when hosts are readily available (Beier, 1996). We found that females’ access to sugar with blood had no significant effect on fecundity, which is similar to findings on An. gambiae and Ae. aegypti (Costero et al., 1998; Gary & Foster, 2001; Scott et al., 1997). These findings indicated that sugar has apparently no effect on fitness and population growth under laboratory conditions. This effect in mosquito is debatable since it was found that fecundity is improved for several species including Ae. aegypti, when sugar forms a normal part of the female's diet (Foster, 1989; Nayar & Sauerman, 1975a).
Sugar appears to be limiting resource for many mosquitoes, however, it may not be for An. stephensi and An. gambiae. It is important to note that feeding
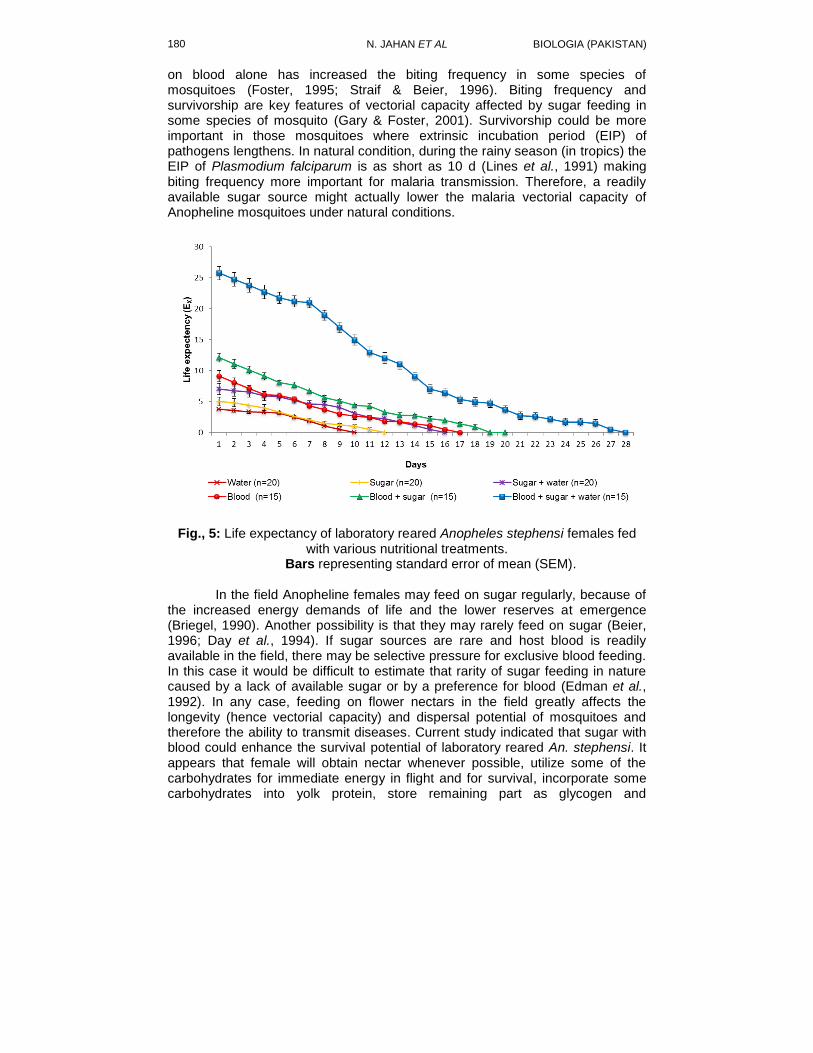
N. JAHAN ET AL BIOLOGIA (PAKISTAN) 180
on blood alone has increased the biting frequency in some species of mosquitoes (Foster, 1995; Straif & Beier, 1996). Biting frequency and survivorship are key features of vectorial capacity affected by sugar feeding in some species of mosquito (Gary & Foster, 2001). Survivorship could be more important in those mosquitoes where extrinsic incubation period (EIP) of pathogens lengthens. In natural condition, during the rainy season (in tropics) the EIP of Plasmodium falciparum is as short as 10 d (Lines et al., 1991) making biting frequency more important for malaria transmission. Therefore, a readily available sugar source might actually lower the malaria vectorial capacity of Anopheline mosquitoes under natural conditions.
Fig., 5: Life expectancy of laboratory reared Anopheles stephensi females fed with various nutritional treatments.
Bars representing standard error of mean (SEM).
In the field Anopheline females may feed on sugar regularly, because of the increased energy demands of life and the lower reserves at emergence (Briegel, 1990). Another possibility is that they may rarely feed on sugar (Beier, 1996; Day et al., 1994). If sugar sources are rare and host blood is readily available in the field, there may be selective pressure for exclusive blood feeding. In this case it would be difficult to estimate that rarity of sugar feeding in nature caused by a lack of available sugar or by a preference for blood (Edman et al., 1992). In any case, feeding on flower nectars in the field greatly affects the longevity (hence vectorial capacity) and dispersal potential of mosquitoes and therefore the ability to transmit diseases. Current study indicated that sugar with blood could enhance the survival potential of laboratory reared An. stephensi. It appears that female will obtain nectar whenever possible, utilize some of the carbohydrates for immediate energy in flight and for survival, incorporate some carbohydrates into yolk protein, store remaining part as glycogen and
VOL. 59 (1&2) EFFECTS OF SUGAR ON ANOPHELES 181
triglycerides for later use. Further study of sugar effect on vectorial capacity, male performance and other feeding regimes of laboratory reared and wild caught An. stephensi is needed.
REFERENCES
Andersson, I. H., 1992. The effect of sugar meals and body size on fecundity and
longevity of female Aedes communis (Diptera: Culicidae). Physiol. Entomol., 17(3): 203-207.
Beier, J. C., 1996. Frequent blood-feeding and restrictive sugar-feeding behavior enhance the malaria vector potential of Anopheles gambiae s.l. and An. funestus (Diptera: Culicidae) in western Kenya. J. Med. Entomol., 33(4): 613-618.
Braks, M. A., Juliano, S. A. & Lounibos, L. P., 2006. Superior reproductive success on human blood without sugar is not limited to highly anthropophilic mosquito species. Med. Vet. Entomol., 20(1): 53-59.
Briegel, H., 1990. Fecundity, metabolism, and body size in Anopheles (Diptera: Culicidae), vectors of malaria. J. Med. Entomol., 27(5): 839-850.
Canyon, D. V., Hii, J. L. & Muller, R., 1999. Effect of diet on biting, oviposition, and survival of Aedes aegypti (Diptera: Culicidae). J. Med. Entomol., 36(3): 301-308.
Clements, A. N., 1963. The physiology of mosquitoes. New York: Pergamon Press, 393 pp.
Costero, A., Edman, J. D., Clark, G. G. & Scott, T. W., 1998. Life table study of Aedes aegypti (Diptera: Culicidae) in Puerto Rico fed only human blood versus blood plus sugar. J. Med. Entomol., 35(5): 809-813.
Day, J. F., Edman, J. D. & Scott, T. W., 1994. Reproductive fitness and survivorship of Aedes aegypti (Diptera: Culicidae) maintained on blood, with field observations from Thailand. J. Med. Entomol., 31(4): 611-617.
Edman, J. D., Strickman, D., Kittayapong, P. & Scott, T. W., 1992. Female Aedes aegypti (Diptera: Culicidae) in Thailand rarely feed on sugar. J. Med. Entomol., 29(6): 1035-1038.
Foster, B. E., 1989. Aedes albopictus larvae collected from tree holes in southern Indiana. J. Am. Mosq. Control Assoc., 5(1): 95.
Foster, W. A., 1995. Mosquito sugar feeding and reproductive energetics. Annu. Rev. Entomol., 40: 443-474.
Foster, W. A. & Eischen, F. A., 1987. Frequency of blood feeding in relation to sugar availability in Aedes aegypti and Anopheles quadrimaculatus (Diptera: Culicidae). Ann. Entomol. Soc. Am., 80: 103-108.
Gary, R. E., Jr. & Foster, W. A., 2001. Effects of available sugar on the reproductive fitness and vectorial capacity of the malaria vector Anopheles gambiae (Diptera: Culicidae). J. Med. Entomol., 38(1): 22-28.
Jahan, N. & Abbas, Z., 2006. Larvicidal efficacy of Bacillus thuringiensis var. israelensis against laboratory-reared Anopheles stephensi and field-collected Culex quinquefasciatus mosquitoes from Lahore, Pakistan. Biologia (Pakistan), 52(1): 15-21.
N. JAHAN ET AL BIOLOGIA (PAKISTAN) 182
Lines, J. D., Wilkes, T. J. & Lyimo, E. O., 1991. Human malaria infectiousness measured by age-specific sporozoite rates in Anopheles gambiae in Tanzania. Parasitology, 102: 167-177.
Magnarelli, L. A., 1979. Diurnal nectar-feeding of Aedes cantator and A. sollicitans (Diptera: Culicidae). Env. Entomol., 8(5): 949-955.
Martinez-Ibarra, J. A., Rodriguez, M. H., Arredondo-Jimenez, J. I. & Yuval, B., 1997. Influence of plant abundance on nectar feeding by Aedes aegypti (Diptera: Culicidae) in southern Mexico. J Med Entomol, 34(6): 589-593.
Morrison, A. C., Costero, A., Edman, J. D., Clark, G. G. & Scott, T. W., 1999. Increased fecundity of Aedes aegypti fed human blood before release in a mark-recapture study in Puerto Rico. J. Am. Mosq. Control Assoc., 15(2): 98-104.
Nayar, J. K. & Sauerman, D. M., Jr., 1975a. The effects of nutrition on survival and fecundity in Florida mosquitoes. Part 1. Utilization of sugar for survival. J. Med. Entomol., 12(1): 92-98.
Nayar, J. K. & Sauerman, D. M., Jr., 1975b. The effects of nutrition on survival and fecundity in Florida mosquitoes. Part 3. Utilization of blood and sugar for fecundity. J. Med. Entomol., 12(2): 220-225.
Nayar, J. K. & Van Handel, E., 1971. The fuel for sustained mosquito flight. J. Insect Physiol., 17(3): 471-481.
Okech, B. A., Gouagna, L. C., Killeen, G. F., Knols, B. G., Kabiru, E. W., Beier, J. C., Yan, G. & Githure, J. I., 2003. Influence of sugar availability and indoor microclimate on survival of Anopheles gambiae (Diptera: Culicidae) under semifield conditions in western Kenya. J. Med. Entomol., 40(5): 657-663.
Rehman, M. & Muttalib, A., 1967. Determination of malaria transmission in the central part of Karachi city; incrimination of Anopheles stephensi as the vector. Pak. J. Hlth., 17: 73-84.
Scott, T. W., Clark, G. G., Lorenz, L. H., Amerasinghe, P. H., Reiter, P. & Edman, J. D., 1993. Detection of multiple blood feeding in Aedes aegypti (Diptera: Culicidae) during a single gonotrophic cycle using a histologic technique. J. Med. Entomol., 30(1): 94-99.
Scott, T. W., Naksathit, A., Day, J. F., Kittayapong, P. & Edman, J. D., 1997. A fitness advantage for Aedes aegypti and the viruses it transmits when females feed only on human blood. Am. J. Trop. Med. Hyg., 57(2): 235-239.
Straif, S. C. & Beier, J. C., 1996. Effects of sugar availability on the blood-feeding behavior of Anopheles gambiae (Diptera: Culicidae). J. Med. Entomol., 33(4): 608-612.
Van Handel, E., 1972. The detection of nectar in mosquitoes. Mosquito News, 32: 458-459.
WHO, 2012. World malaria report 2012. Global Malaria Programme, World Health Organization, Geneva 27, Switzerland. Retrived on June 30, 2013 from:http://www.who.int/malaria/publications/world_malaria_report_2012/report/en/index.html.
BIOLOGIA (PAKISTAN) 2013, 59 (1), 183-189 PK ISSN 0006 - 3096
*Corresponding author: [email protected]
Uptake of some toxic metals in spinach crop irrigated by
Saggian drain water, Lahore
*Syed Tariq Rizwan1, Sana Chaudhary
2 & Muhammad Ikram
3
1,2Department of Botany, GC University, Lahore
3Ex. Director, Soil Survey of Pakistan, Lahore
ABSTRACT
A comparative study to detect the uptake of toxic metals (Zn, Cr, Fe, Mn, Co, Ni, Cu, Pb and Cd) in spinach (Spinaceae oleraceae) irrigated by drain and tube well water was carried out along Saggian Drain, Lahore. The metal contents of drain water were fairly higher than those of the tube well water. Similar results are evident from the analytical data of root, shoot and leaves of spinach. It was observed that in root, irrigated with drain water, concentration of Zn was 223.00µg/g and that of Pb was 12.00µg/g. while Zn was 25.66µg/g and Pb was 3.00µg/g in roots irrigated with tube well water. In shoot the concentration of Cr was 26.33µg/g and Cu was 34.50µg/g being irrigated with drain water. While the concentration of these metals were lower in shoot irrigated with tube well water. In leaves irrigated with drain water the concentration of Pb was 11.00µg/g while it was 3.33µg/g when irrigated with tube well water. However, the contamination level of edible parts is toxic to human health; its constant consumption may lead to various health disorders.
Keywords: toxic metals, Spinach, Saggian drain
INTRODUCTION
Environment in its wider sense includes everything which is external to the human beings. Environmental pollution is attributed to the waste that cannot be dispersed off by natural recycling processes due to their excessive quantity and injurious quality or unique chemical composition. Environmental pollution, a worldwide problem resulted from industrial revolution and urbanization, is causing undesirable changes in the physical, chemical and biological characteristics of air, water, and soil ultimately affecting human, animal, and plant lives (Mishra & Dinesh, 1991).
Agricultural fields throughout the world are receiving waste water, directly being dumped into the river channels, drains and water bodies from the industrial and municipal human settlements. This waste water enriches the soil as well as ground water with heavy metals which enter the food chain and pose a lethal threat to the life (WWF, 2001). The important segment of the pollution which effect the health via crops and soil is the indiscriminate use of sewage for the agricultural productions around the urban centers in arid and semi arid countries on account of increasing demand for the limited water supplies (Mishra & Dinesh, 1991)
Heavy metals contamination of land is an increasingly important environmental, health and economic issue in Pakistan (Hussain, 1996). Pakistan is an agricultural country, and however in recent past the economy has started to
184 S. T. RIZWAN ET AL BIOLOGIA (PAKISTAN)
shift towards the industry. These industries are disposing off their effluents into open surface drains or nearby ponds which essentially end up to rivers and canals used for the irrigation. The rapid increase in the population together with the excessive use of fertilizers and chemicals in the agriculture and rapid industrialization combined with the unplanned disposal of industrial and domestic effluents have increased the threat of soil pollution (Khan & Scullion, 2000).
In the city of Lahore it has been pointed out that most of the wastewater is collected by 12 pumping stations, located along the protection embankment. This water is discharged into sludge carriers which are open drains leading to the River Ravi. Along the sludge carriers seasonal food crops and vegetables are grown. These vegetables and food items are being utilized by the people and the animals. All the chemical contents thus come in the food chain of the human beings and animals (Qamar, 2004).
Spinach is Spinacia oleracea. In Latin “spina” means spiny fruit and “oleracea” stands for herbaceous garden herb. It is a member of Chenopodiaceae (goosefoot) family. It is a low – growing fleshy leafed annual that forms a heavy rosette of broad, crinkly tender leaves. The glabrous (non–hairy) leaves which are edible vegetable portion, are ovate (oval but broader toward the base) to orbicular (round) in shape with the lower leaves being wider and the highest leaves being narrower. Leaf stems are also edible, but less preferred because of toughness. The Savoy leaved are usually preferred for fresh marketing; the smooth for processing (Sackett, 1975).
Objectives Chemical analysis of Saggian Drain and Tube well water. Evaluation of the uptake of the toxic elements in Spinacia oleracea Comparison of uptake of toxic elements in Spinacia oleracea like Zn, Mn,
Cr, Cu, Pb, Fe, Co, Cd and Ni irrigated with Saggian Drain and Tube well water.
MATERIALS AND METHODS
The site for experiment, collection of plants and water was SHAHDARA
Soil series irrigated by the sewage along the drain area (Fig., 1). The collection of the waste water was done by dipping the sample bottles into the flowing water of „Nullah‟ with the help of thread and was taken out on filling, transferred to the polyethylene bottle. Similarly tube well water samples were taken directly from the outlet at least after half an hour tube well was running. pH and EC were measured with pH and EC meters.
Heavy metal analysis of plant samples were made after digestion of plant samples in double acid (1:2) of perchloric and nitric acid. Heavy metals were analyzed using polarized Zeeman Atomic Absorption Spectrophotometer (Z- 5300). Data collected for various plants from both control and drain site were analyzed with Duncan‟s Multiple Range test (Steel & Torrie, 1980).
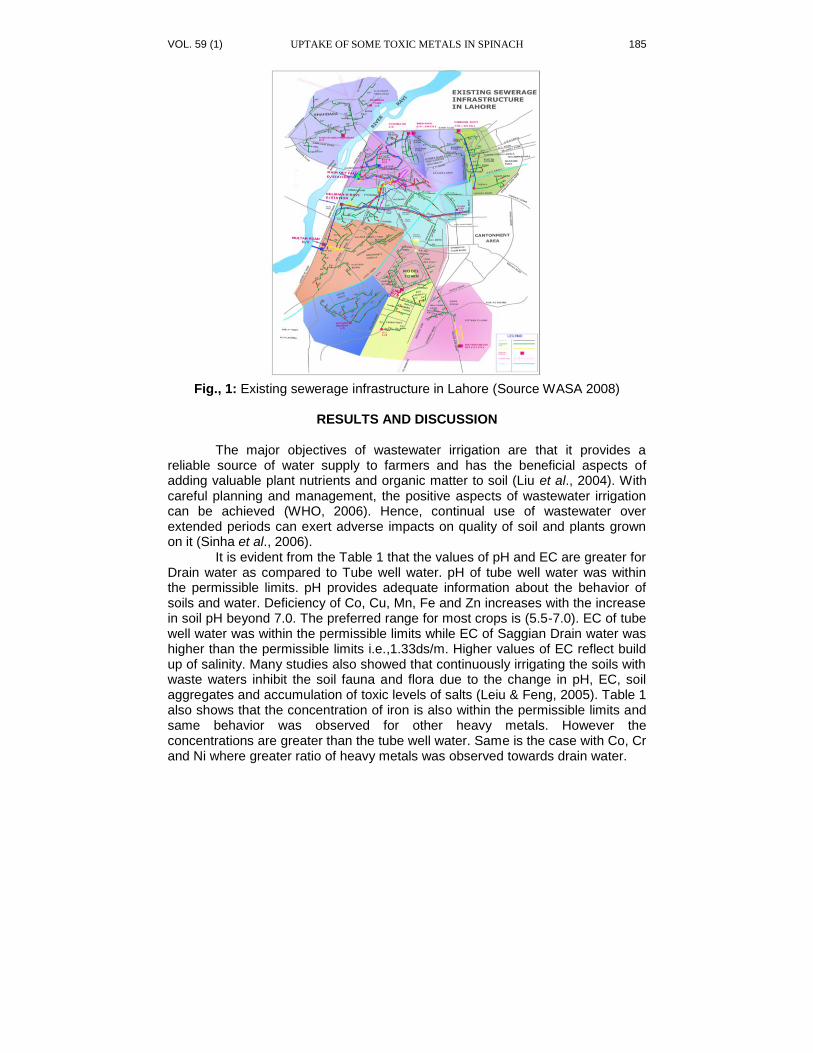
VOL. 59 (1) UPTAKE OF SOME TOXIC METALS IN SPINACH 185
Fig., 1: Existing sewerage infrastructure in Lahore (Source WASA 2008)
RESULTS AND DISCUSSION
The major objectives of wastewater irrigation are that it provides a
reliable source of water supply to farmers and has the beneficial aspects of adding valuable plant nutrients and organic matter to soil (Liu et al., 2004). With careful planning and management, the positive aspects of wastewater irrigation can be achieved (WHO, 2006). Hence, continual use of wastewater over extended periods can exert adverse impacts on quality of soil and plants grown on it (Sinha et al., 2006).
It is evident from the Table 1 that the values of pH and EC are greater for Drain water as compared to Tube well water. pH of tube well water was within the permissible limits. pH provides adequate information about the behavior of soils and water. Deficiency of Co, Cu, Mn, Fe and Zn increases with the increase in soil pH beyond 7.0. The preferred range for most crops is (5.5-7.0). EC of tube well water was within the permissible limits while EC of Saggian Drain water was higher than the permissible limits i.e.,1.33ds/m. Higher values of EC reflect build up of salinity. Many studies also showed that continuously irrigating the soils with waste waters inhibit the soil fauna and flora due to the change in pH, EC, soil aggregates and accumulation of toxic levels of salts (Leiu & Feng, 2005). Table 1 also shows that the concentration of iron is also within the permissible limits and same behavior was observed for other heavy metals. However the concentrations are greater than the tube well water. Same is the case with Co, Cr and Ni where greater ratio of heavy metals was observed towards drain water.
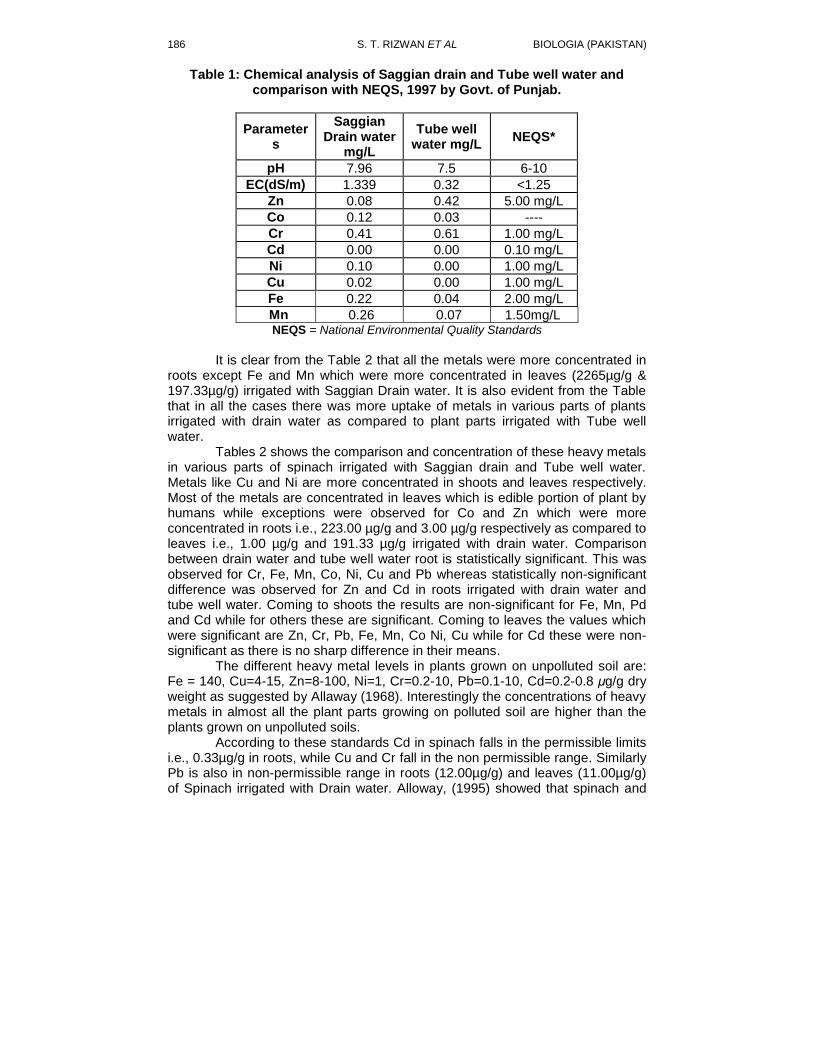
186 S. T. RIZWAN ET AL BIOLOGIA (PAKISTAN)
Table 1: Chemical analysis of Saggian drain and Tube well water and comparison with NEQS, 1997 by Govt. of Punjab.
Parameters
Saggian Drain water
mg/L
Tube well water mg/L
NEQS*
pH 7.96 7.5 6-10
EC(dS/m) 1.339 0.32 <1.25
Zn 0.08 0.42 5.00 mg/L
Co 0.12 0.03 ----
Cr 0.41 0.61 1.00 mg/L
Cd 0.00 0.00 0.10 mg/L
Ni 0.10 0.00 1.00 mg/L
Cu 0.02 0.00 1.00 mg/L
Fe 0.22 0.04 2.00 mg/L
Mn 0.26 0.07 1.50mg/L NEQS = National Environmental Quality Standards
It is clear from the Table 2 that all the metals were more concentrated in
roots except Fe and Mn which were more concentrated in leaves (2265µg/g & 197.33µg/g) irrigated with Saggian Drain water. It is also evident from the Table that in all the cases there was more uptake of metals in various parts of plants irrigated with drain water as compared to plant parts irrigated with Tube well water.
Tables 2 shows the comparison and concentration of these heavy metals in various parts of spinach irrigated with Saggian drain and Tube well water. Metals like Cu and Ni are more concentrated in shoots and leaves respectively. Most of the metals are concentrated in leaves which is edible portion of plant by humans while exceptions were observed for Co and Zn which were more concentrated in roots i.e., 223.00 µg/g and 3.00 µg/g respectively as compared to leaves i.e., 1.00 µg/g and 191.33 µg/g irrigated with drain water. Comparison between drain water and tube well water root is statistically significant. This was observed for Cr, Fe, Mn, Co, Ni, Cu and Pb whereas statistically non-significant difference was observed for Zn and Cd in roots irrigated with drain water and tube well water. Coming to shoots the results are non-significant for Fe, Mn, Pd and Cd while for others these are significant. Coming to leaves the values which were significant are Zn, Cr, Pb, Fe, Mn, Co Ni, Cu while for Cd these were non-significant as there is no sharp difference in their means.
The different heavy metal levels in plants grown on unpolluted soil are: Fe = 140, Cu=4-15, Zn=8-100, Ni=1, Cr=0.2-10, Pb=0.1-10, Cd=0.2-0.8 μg/g dry weight as suggested by Allaway (1968). Interestingly the concentrations of heavy metals in almost all the plant parts growing on polluted soil are higher than the plants grown on unpolluted soils.
According to these standards Cd in spinach falls in the permissible limits i.e., 0.33µg/g in roots, while Cu and Cr fall in the non permissible range. Similarly Pb is also in non-permissible range in roots (12.00µg/g) and leaves (11.00µg/g) of Spinach irrigated with Drain water. Alloway, (1995) showed that spinach and
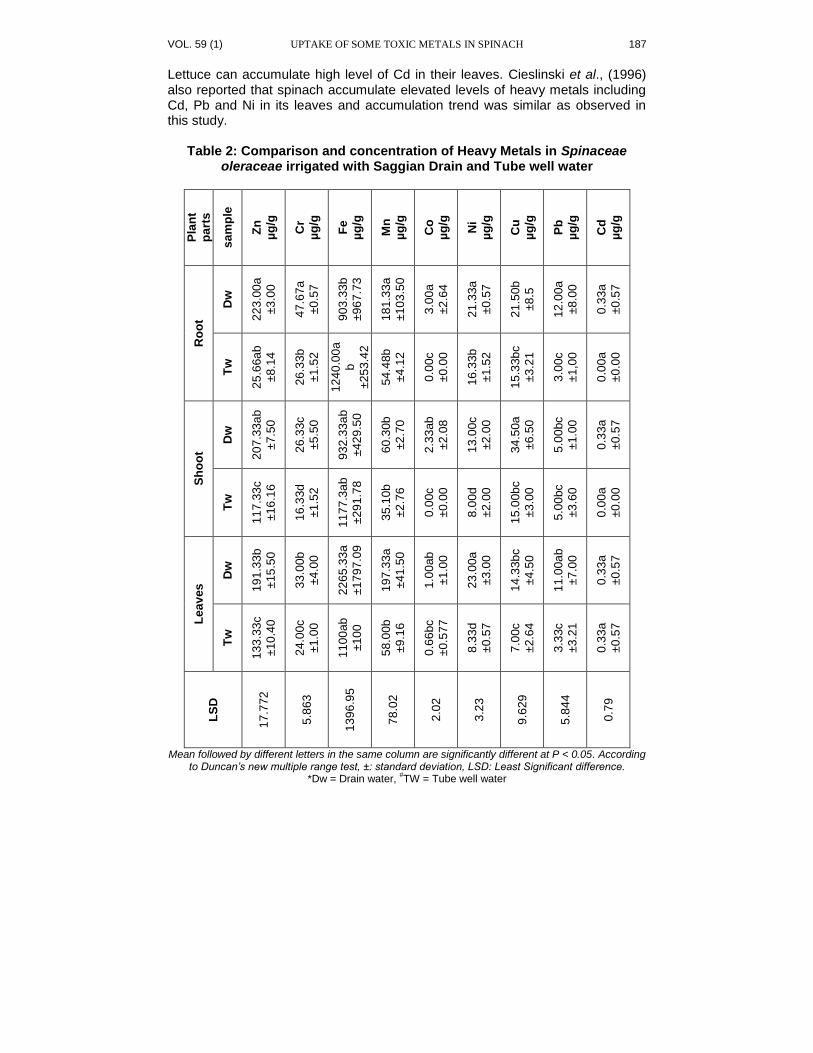
VOL. 59 (1) UPTAKE OF SOME TOXIC METALS IN SPINACH 187
Lettuce can accumulate high level of Cd in their leaves. Cieslinski et al., (1996) also reported that spinach accumulate elevated levels of heavy metals including Cd, Pb and Ni in its leaves and accumulation trend was similar as observed in this study.
Table 2: Comparison and concentration of Heavy Metals in Spinaceae
oleraceae irrigated with Saggian Drain and Tube well water
Pla
nt
pa
rts
sa
mp
le
Zn
µg
/g
Cr
µg
/g
Fe
µg
/g
Mn
µg
/g
Co
µg
/g
Ni
µg
/g
Cu
µg
/g
Pb
µg
/g
Cd
µg
/g
Ro
ot
Dw
22
3.0
0a
±3
.00
47
.67a
±0
.57
90
3.3
3b
±9
67
.73
18
1.3
3a
±1
03
.50
3.0
0a
±2
.64
21
.33a
±0
.57
21
.50b
±8
.5
12
.00a
±8
.00
0.3
3a
±0
.57
Tw
25
.66a
b
±8.1
4
26
.33b
±1.5
2
12
40
.00
a
b
±25
3.4
2
54
.48b
±4.1
2
0.0
0c
±0.0
0
16
.33b
±1.5
2
15
.33b
c
±3.2
1
3.0
0c
±1,0
0
0.0
0a
±0.0
0
Sh
oo
t
Dw
20
7.3
3a
b
±7.5
0
26
.33c
±5.5
0
93
2.3
3a
b
±42
9.5
0
60
.30b
±2.7
0
2.3
3ab
±2.0
8
13
.00c
±2.0
0
34
.50a
±6.5
0
5.0
0bc
±1.0
0
0.3
3a
±0.5
7
Tw
11
7.3
3c
±16
.16
16
.33d
±1.5
2
11
77
.3a
b
±29
1.7
8
35
.10b
±2.7
6
0.0
0c
±0.0
0
8.0
0d
±2.0
0
15
.00b
c
±3.0
0
5.0
0bc
±3.6
0
0.0
0a
±0.0
0
Le
av
es D
w
19
1.3
3b
±15
.50
33
.00b
±4.0
0
22
65
.33
a
±17
97
.09
19
7.3
3a
±41
.50
1.0
0ab
±1.0
0
23
.00a
±3.0
0
14
.33b
c
±4.5
0
11
.00a
b
±7.0
0
0.3
3a
±0.5
7
Tw
13
3.3
3c
±10
.40
24
.00c
±1.0
0
11
00
ab
±10
0
58
.00b
±9.1
6
0.6
6bc
±0.5
77
8.3
3d
±0.5
7
7.0
0c
±2.6
4
3.3
3c
±3.2
1
0.3
3a
±0.5
7
LS
D
17
.772
5.8
63
13
96
.95
78
.02
2.0
2
3.2
3
9.6
29
5.8
44
0.7
9
Mean followed by different letters in the same column are significantly different at P < 0.05. According to Duncan’s new multiple range test, ±: standard deviation, LSD: Least Significant difference.
*Dw = Drain water, #TW = Tube well water
188 S. T. RIZWAN ET AL BIOLOGIA (PAKISTAN)
Conclusion It is evident from the study that sewage of Main Outfall Drain to irrigate
crops is saline and sodic. Irrigation with this water results in high concentration of Zn (223µg/g), Cr (47.67 µg/g), Fe (2265.33 µg/g) and Cu (21.5 µg/g) in plants. The concentrations of other metals (Cd, Co, Mn, Ni and Pb) though in permissible limits, yet are higher than those of Tube well water used for irrigation. These metals with the continuous irrigations accumulate and reach harmful limits deteriorating the soil. Plants may uptake these metallic ions and cause serious problems among human beings and animals. The economic impacts of the use of waste water on crop production depend on the degree of treatment and composition of waste water, type and nature of crops grown and the overall farm level water management practices. Given the agronomic and water management practices, it can be used as supplementary water for irrigation ,reduce fertilizers cost and can increase/decrease the yield depending on the plant nutrient content of waste water, which has the implication for profitability of crop production.
REFERENCES
Allaway, W. H., 1968. Agronomic controls over environmental cycling of trace elements. Adv. Agron., 20: 235-274.
Alloway, B.J., 1995. Heavy metals in soils.London: Blackie Academic & Professional.UK.
Cieslinski, G., K. VanRees, C.J., Huang, P. M. Kozak, L. M. Rostad, H. P.W.& Knott, D.R., 1996. Cadmium uptake and bioaccumulation in selected cultivars of durum wheat and flax as affected by soil type. Plant soil.182:115-124
Hussain, 1996. Contaminants and the soil environment in the Australia Pacific Region (R. Naidu, R.S. Kookana).
Khan, M. & Scullion, J., 2000. Effect of soil on microbial responces to metal contamination. Environmental pollution, 110: 115.
Leiu, M. H. & Feng, J. C., 2005. Wastewaters of soap industry and growth of cereal crops in China. Env. Sci., 15: 36-44.
Liu,D.,W.Jiang and X.Gao.2004.Effects of Cadmium on root growth,cell division and nucleoli in root tips of garlic, Physiologia Plantarum.,47:79-83
Mishra, S. G. & Dinesh, D., 1991. Soil Pollution, Ashing Publishing House, New Delhi, pp. 31–56.
Qamar, M. K., 2004. Impact of sewage irrigation on ground water quality of Lahore, Proceedings of the WSSD Workshop on Human Settlement and Environment Islamabad, pp: 5-8.
Sackett, C., 1975. United Fresh Fruit and Vegetable Assn. 727 N. Washington, Alexandria, VA 22314.
Sinha, S., Gupta, A,. Bhatt, K., Pandey, K., Rai, U. N. & Singh. K. P., 2006. Distribution of metals in the edible plants grown at Jammu,Khanpur(India) receiving treated tannery wastewater: Relation with physic-chemical properties of the soil. Env. Mon. Assessment.115: 1-22.
Steel, R. G. D. & Torrie, J.H., 1980. Principles and procedures of statistics. A Biometrical Approach, 2
nd Edition. McGraw- Hill, New York. 144pp.

VOL. 59 (1) UPTAKE OF SOME TOXIC METALS IN SPINACH 189
WASA, 2008. Water and sanitization agency. WASA master plan for bulk water supply and sewerages system. Presentation on Faisalabad city.
WHO, 2006. Guidelines for safe use of wastewater,excreta and grey water: Waste water use in agriculture (volume II).
WWF, 2001. Water quality monitering of Hudiara Drain. Environmental Pollution unit. Worldwide Fund for Nature, Lahore- Pakistan.