brazil - world bank group
TRANSCRIPT

1
Brazil Brazil Interest Rates andInterest Rates andIntermediation SpreadsIntermediation Spreads
Why so high?
Augusto de la Torre
with Federico Filippini
Office of the Chief Economist
Latin America & the Caribbean
The World Bank

2
Based on:
Brazil Interest Rates and Intermediation Spreads. July 2006. World Bank Report No. 36628-BR
By a team led by Augusto de la Torre and Stijn Claessens
Team members: Roberto Rigobón, Marcio Garcia, MarcioNakane, Miguel Kiguel, Alvaro Vivanco, Yaye Seynabou Sakho
3
Structure of Presentation
What are the stylized facts and why worry?
Links between the Selic and intermediation spreads
Why has the Selic been so high?
Microeconomic aspects of intermediation spreads
Final thoughts
4
Stylized facts and why worry
Brazil’s intermediation spreads are international outlierNo matter how measured
But abnormally high spreads coexist with some “normal” (relevant) characteristics
High spreads mean high and volatile lending rates, leading to a high cost of capital, reduced investment and a bias toward short-term high-risk investment
Shortage of affordable finance is binding constraint to growth (Hausmann, Rodrik and Velasco, 2005)

5
Brazil is a major outlier in width of interest spreads
Average Banking Spreads Across Countriesaverage periods: 1990-1999 & 2000-2006
AGO
BRAZILBGR
GEO
MNG
RUS
SRB
UKR
URY
0
10
20
30
40
50
60
70
80
0 10 20 30 40 50 60 70 80
Spreads 2000-2006
Spre
ads
1990
-199
9
Source: WDI 2006 - World Develoment Indicators - World Bank
6
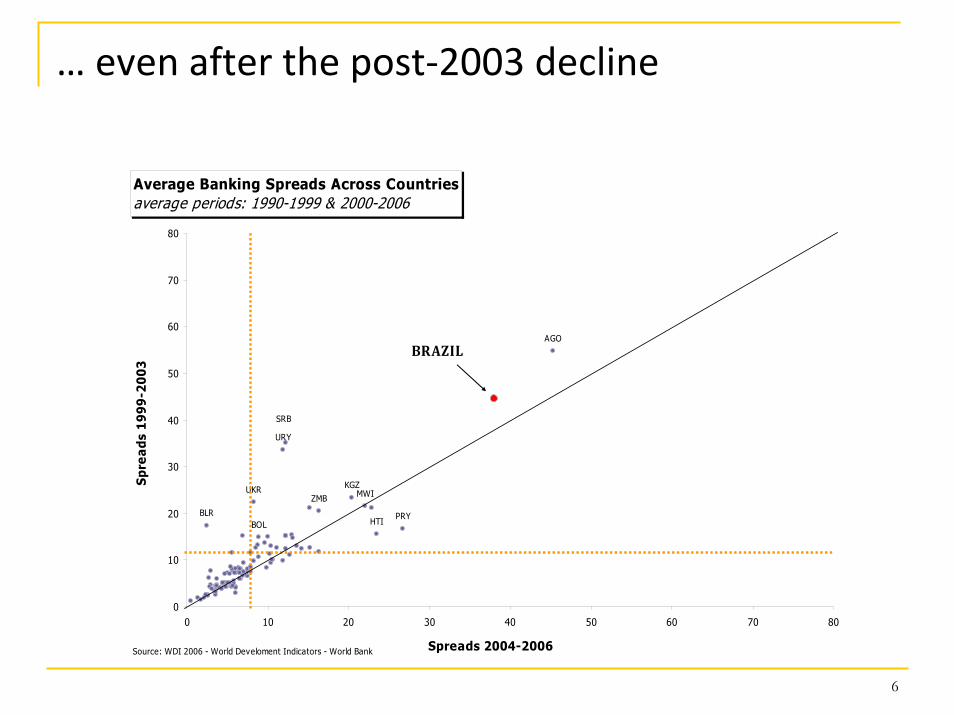
… even after the post-2003 decline
Average Banking Spreads Across Countriesaverage periods: 1990-1999 & 2000-2006
AGO
BLRBOL
BRAZIL
HTI
KGZMWI
PRY
SRB
UKR
URY
ZMB
0
10
20
30
40
50
60
70
80
0 10 20 30 40 50 60 70 80
Spreads 2004-2006
Spre
ads
1999
-200
3
Source: WDI 2006 - World Develoment Indicators - World Bank

7
Spreads fell with disinflation buy then hit a plateau
Bank Interest Rates & Intermediation Spreadsin %
0
30
60
90
120
150
180
210
240
Jul9
4
Jan9
5
Jul9
5
Jan9
6
Jul9
6
Jan9
7
Jul9
7
Jan9
8
Jul9
8
Jan9
9
Jul9
9
Jan0
0
Jul0
0
Jan0
1
Jul0
1
Jan0
2
Jul0
2
Jan0
3
Jul0
3
Jan0
4
Jul0
4
Jan0
5
Jul0
5
Jan0
6
Jul0
6
Jan0
7
Jul0
7
Lending Rate Spread Selic
Source: Central Bank of Brazil

8
Brazil is not an outlier in credit depth measures…
Domestic credit to Private Sectorfor 2006
0
50
100
150
200
4 5 6 7 8 9 10 11Ln of GDP per capita
Dom
esti
c cr
edit
to
priv
ate
sect
or (
% o
f G
DP
)
BRAZIL
Source: WDI 2007, Wolrd Bank
9
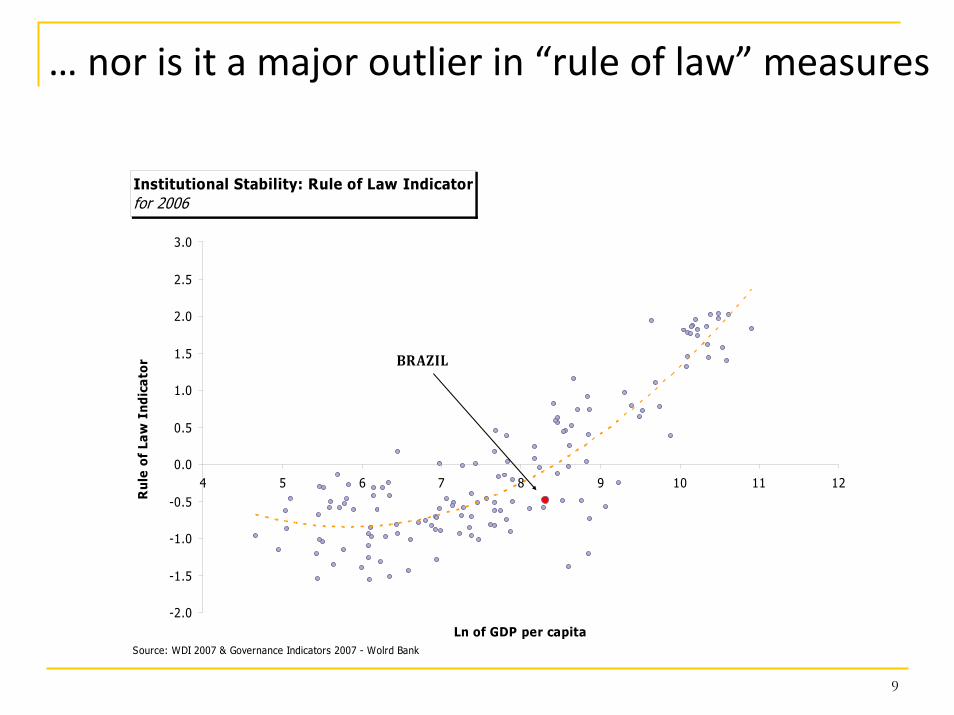
… nor is it a major outlier in “rule of law” measures
Institutional Stability: Rule of Law Indicatorfor 2006
-2.0
-1.5
-1.0
-0.5
0.0
0.5
1.0
1.5
2.0
2.5
3.0
4 5 6 7 8 9 10 11 12
Ln of GDP per capita
Rul
e of
Law
Ind
icat
or
Source: WDI 2007 & Governance Indicators 2007 - Wolrd Bank
BRAZIL
10
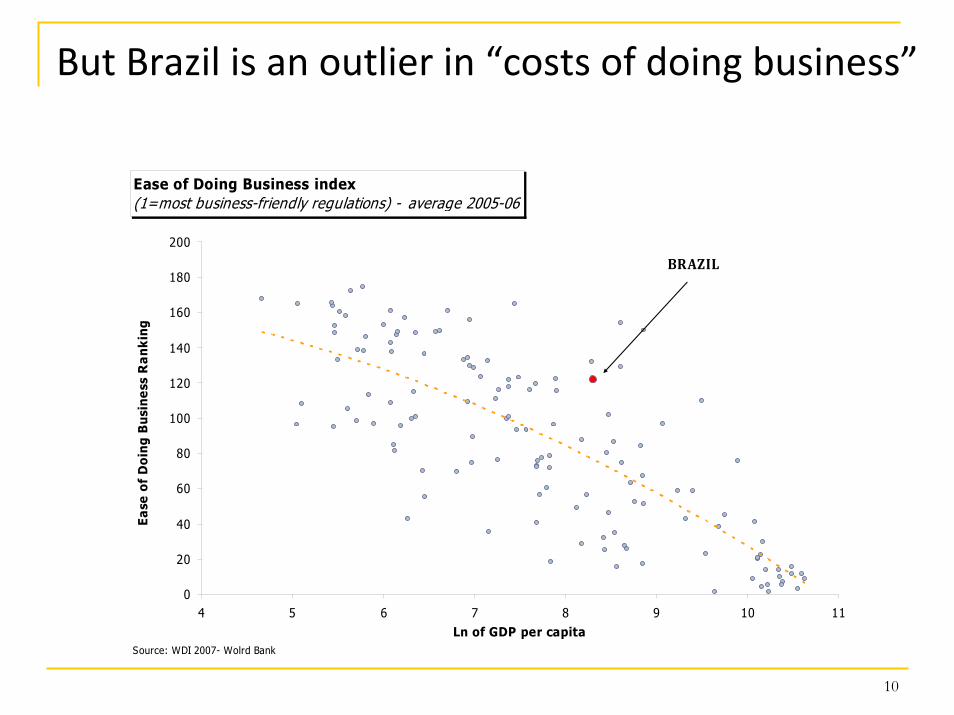
But Brazil is an outlier in “costs of doing business”
Ease of Doing Business index (1=most business-friendly regulations) - average 2005-06
0
20
40
60
80
100
120
140
160
180
200
4 5 6 7 8 9 10 11Ln of GDP per capita
Ease
of
Doi
ng B
usin
ess
Ran
king
Source: WDI 2007- Wolrd Bank
BRAZIL

11
… and is also an outlier in marginal cost of funds
Funding RatesGDP for 2006 - average interest rate for 2007
ARG
AUS
AUTBEL
BRAZIL
CAN
CHLCHN
COL
DNKGRC
IND
IDN
IRL
ISR
ITA
NOR
PER
PHL
POLPRT
RUS
SVK
ZAF
ESP
TUR
GBRUSA
2
4
6
8
10
12
14
16
18
20
6 7 7 8 8 9 9 10 10 11 11Ln of GDP per capita
Rep
os R
ates
(%
)
Source: WDI 2007 & Global Economic Monitor - Wolrd Bank

Links between the Selicand intermediation spreads
13
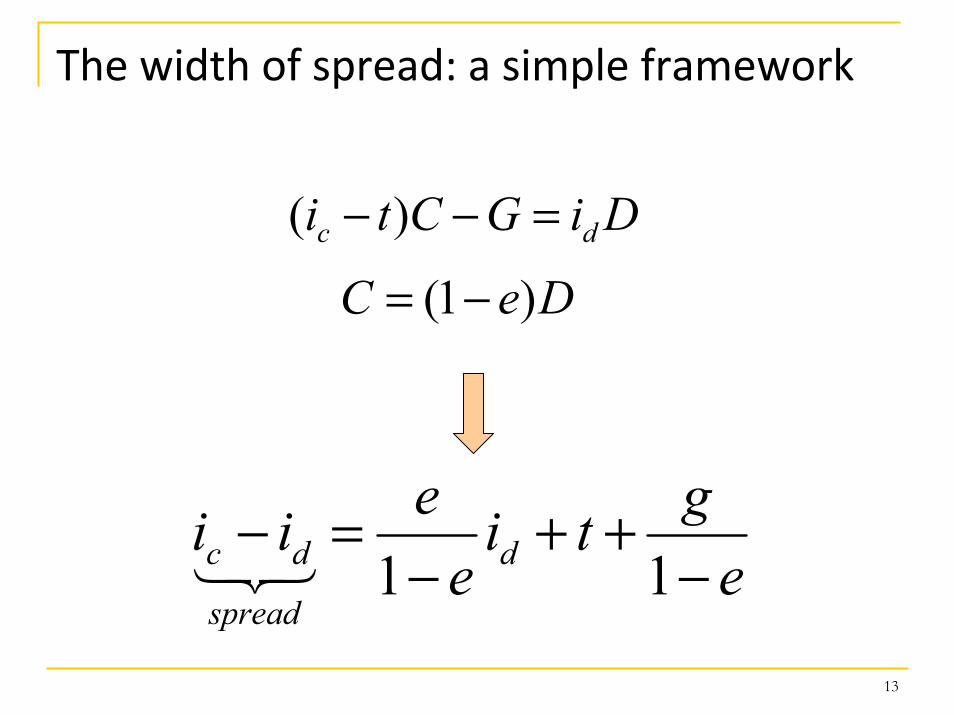
The width of spread: a simple framework
)( DiGCti dc =−−
DeC )1( −=
egti
eeii d
spread
dc −++
−=−
11321

14
Key implications
Spreads are proportional to marginal cost of funds, with factor of proportionality rising with “taxes”
A high marginal cost of funds dominates the width of spread as long as “taxes” (LRR, directed credit, etc.) are high
A high cost of funds reflects systemic risk and can further widen spread through a high idiosyncratic risk premium
As marginal cost of funds and/or “taxes” fall, costs & idiosyncratic risks bind, putting a floor on width of absolute spread

15
Bank Intermediation Spreads and the Level of the Interest RateAug.1994 - Sep.2007
0
20
40
60
80
100
120
140
160
180
200
0 10 20 30 40 50 60 70 80 90
SELIC
Tota
l Spr
ead
Source: Central Bank of Brazil
Selic level and width of spreads have co-moved

16
Absolute vs. proportional spreads: empirical test
ufactorsotherrrri ++⋅+=− βαAbsolute Model
Null hypothesis: β = 0 (complete pass-through)Note that β > 0 is also consistent with a proportional version

17
Absolute vs. proportional spreads: empirical test
Proportional Model
vfactorsotherrri ++= γ
Null hypothesis: γ = 1 (complete pass-through)β > 0 from eq. (1) can imply more-than-complete pass-through under the additive model, or complete pass-through under the proportional model

18
Absolute vs. proportional spread: empirical test
Proportional Model
vfactorsotherrr
ri ++⋅+= 1δγ
In order to discriminate the cases9 possible cases

19
Absolute vs. proportional spread: empirical test
β<0 β=0 β>0
δ<0 Inconsistent Inconsistent More than Complete Pass-Through
δ=0 Inconsistent Complete Pass-Through Proportional Model
δ>0 Incomplete Pass- Through Absolute Model Inconsistent

20
Proportional relationship at work in credit markets characterized by high price competition
Results inconsistent in credit markets with less price competition
No regression supported the absolute spread model (β = 0; δ > 0)
Results of empirical test
Monthly data for 13 interest rates over Aug1994 – Sep2005 period.

21
Brazil not a major outlier when intermediation spreads are defined as a proportion of cost of funds
Domestic credit to Private Sector & Proportional Spreadcredit for 2006 - proportional spread: lending rate over deposit rate
0
2
4
6
8
10
12
0 50 100 150 200 250
Domestic credit to private sector (% of GDP)
Pro
po
rtio
nal
Sp
read BRAZIL
Source: WDI 2007 - World Bank

22
Relative stability of proportional spreads implies that spreads have been high because Selic has been high
Spreads: Proportional Perspectiveratio between lending and funding (SELIC) rates - Monthly average - General total
0
0.5
1
1.5
2
2.5
3
3.5
4
4.5
5
Aug94 Aug95 Aug96 Aug97 Aug98 Aug99 Aug00 Aug01 Aug02 Aug03 Aug04 Aug05 Aug06 Aug07
Source: Central Bank of Brazil
Why has the Selic been so high?

24
Why the Selic so high?
Three hypotheses
Macro fundamentals – fiscal and debt vulnerability
Multiple equilibria
Jurisdictional uncertainty (Arida, Bacha and Lara-Resende, 2004)

25
Why the Selic so high? Empirical test
• “Multiple equilibria” and “jurisdictional uncertainty” imply the fixing macro fundamentals is not sufficient
• Econometrically, this implies a disconnection between fundamentals and LEVEL of the Selic
Captured in the constant of the regression

26
Why the Selic so high? Empirical test
The “usual”approach
SELIC = 0.09*Constant + 0.01*Unemp. - 1.61*GDP + (2.05) (0.97) (3.41)
+ 2.01*Fiscal Deficit - 0.07*CA Deficit - 0.003*Inflation(0.50) (-3.51) (-0.28)
- 0.80*Share of foreign cur. debt_t-1 - 0.32*Debt to GDP (net)_t-1 (-0.58) (-0.32)
+ 0.11*RER + 2.04*US interest rate+ 0.38*SELIC rate_t-1(1.19) (1.38) (2.18)
t-statistics in parenthesesR-squared = 0.80. Adjusted R-squared = 0.71Sample (adjusted): 2002M01 to 2004M10Newey-West HAC Standard Errors & Covariance (lag truncation = 3)

27
Why the Selic so high? Empirical test
Value-At-Risk (V@R) Approach
If default probability is a non-linear function of the macro
fundamentals, the traditional linear specification fails to
adequately identify default risk and hides it in the constant
Challenge: find an appropriate measure of default

28
Procedure to estimate the prob. of default
1. Choose variables representing macro fundamentals
2. Estimate VAR model on all variables to capture their endogenous relations and stochastic properties
3. Compute future paths for the macro variables via Monte Carlo simulations, with coefficients & covariance matrix estimated using rolling (60 month window) VAR regressions
4. Calculate debt paths using debt accumulation equation, given forecasted values of macro variables
5. Compute the frequency debt reaches a threshold
6. Compute the optimal threshold (51.1%)
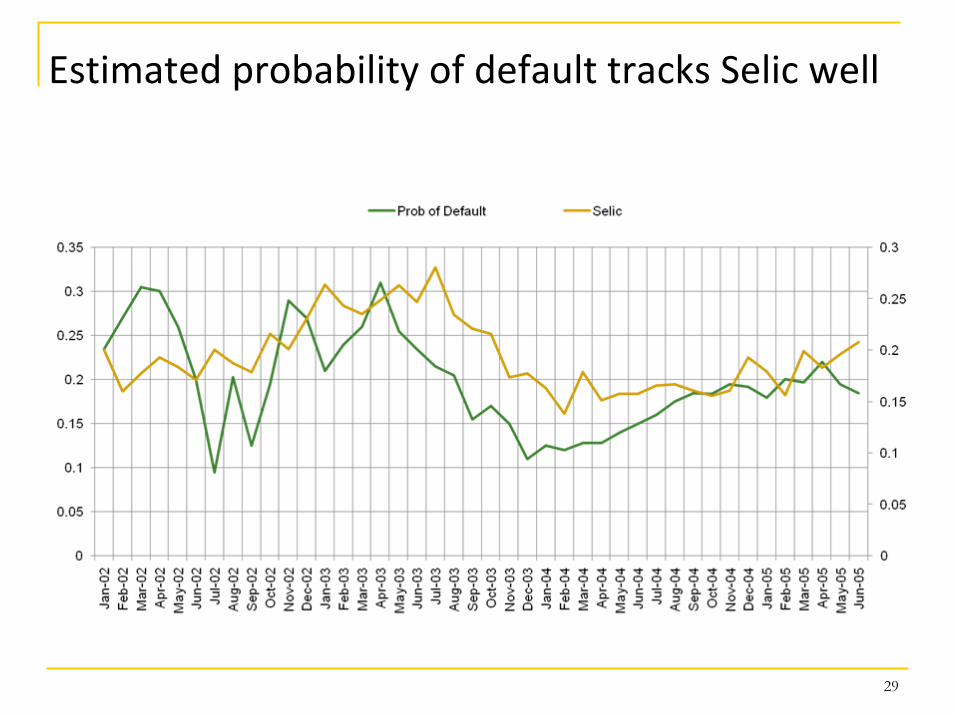
29
Estimated probability of default tracks Selic well
30
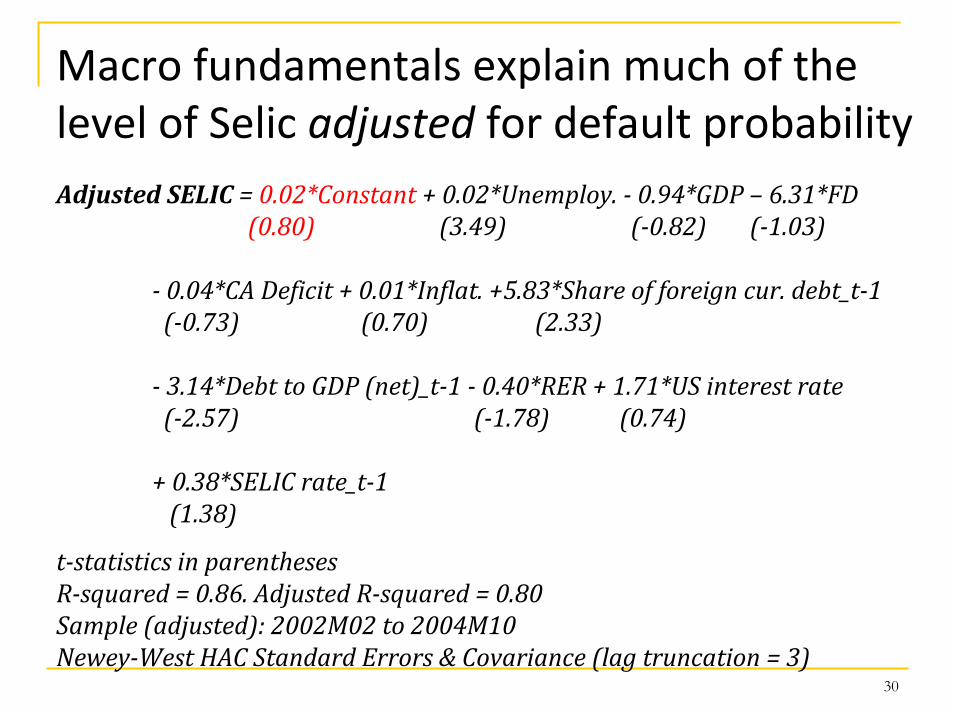
Macro fundamentals explain much of the level of Selic adjusted for default probability Adjusted SELIC = 0.02*Constant + 0.02*Unemploy. - 0.94*GDP – 6.31*FD
(0.80) (3.49) (-0.82) (-1.03)
- 0.04*CA Deficit + 0.01*Inflat. +5.83*Share of foreign cur. debt_t-1(-0.73) (0.70) (2.33)
- 3.14*Debt to GDP (net)_t-1 - 0.40*RER + 1.71*US interest rate(-2.57) (-1.78) (0.74)
+ 0.38*SELIC rate_t-1(1.38)
t-statistics in parenthesesR-squared = 0.86. Adjusted R-squared = 0.80Sample (adjusted): 2002M02 to 2004M10Newey-West HAC Standard Errors & Covariance (lag truncation = 3)

31
Updating the results to 2007 suggests a regime change

Microeconomic aspects of intermediation spreads

33
Some stylized micro facts
While variance of lending spreads is wider than commonly believed…
… over 60% of actual loans are at rates in the lower segment of the range…
… with actual interest spreads much lower than quoted interest spreads
Average lending spreads fall steadily with loan size Average rates on loans above R$1,000,000 are nearly twice those on loans below R$10,000
Interest rates on loans to large firms are about 2/3 those for small firms and 1/2 those for micro firms
34
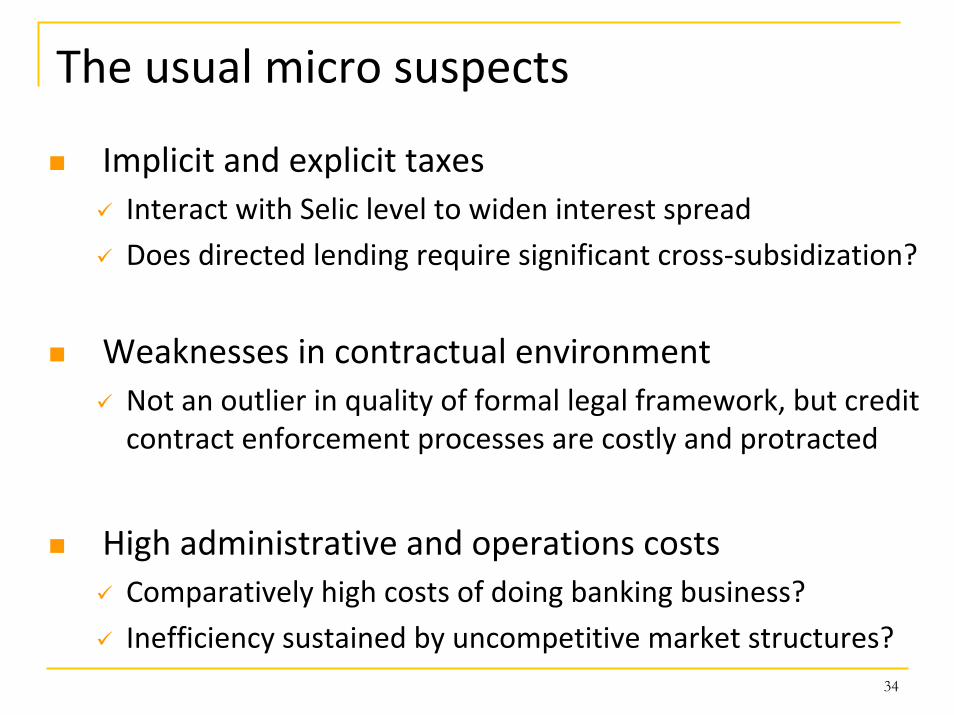
The usual micro suspects
Implicit and explicit taxesInteract with Selic level to widen interest spread
Does directed lending require significant cross-subsidization?
Weaknesses in contractual environmentNot an outlier in quality of formal legal framework, but credit contract enforcement processes are costly and protracted
High administrative and operations costsComparatively high costs of doing banking business?
Inefficiency sustained by uncompetitive market structures?

35
The usual micro suspects (cont.)
CompetitionAggregate evidence is inconclusive on whether contestability is sufficiently lacking to foster inefficiencies that would significantly contribute to the width of the spreads
o Banking system does not behave as cartel nor is it perfectly competitive (Nakane, 2001; Belaish, 2003)
But competition conditions and issues vary across different banking markets (Urdapilleta et al., 2007)

36
Final thoughts
High interest spreads have been dominated by a high marginal cost of funds interacting with high “taxes”
Until recently, default risk was the main explanation behind the high level of the Selic
Usual micro suspects are of 2nd-order importance at high levels of the SELIC but “bite” as the Selic declines
Further work:Interactions between institutions and macro fundamentals
Impact of directed lending on interest spreads
Generate time-series panel data from Central de Risco