bruto domaći proizvod u eu
TRANSCRIPT

8/6/2019 Bruto domaći proizvod u EU
http://slidepdf.com/reader/full/bruto-domaci-proizvod-u-eu 1/15
8/6/2019 Bruto domaći proizvod u EU
http://slidepdf.com/reader/full/bruto-domaci-proizvod-u-eu 2/15
4 Gross domestic product
74 Eurostat regional yearbook 2010 eurostat
What is regional gross domesticproduct?
Te economic development o a region is, as a rule,expressed in terms o its gross domestic product(GDP). Tis indicator is also requently used as abasis or comparisons between regions. But whatexactly does it mean? And how can comparability be established between regions o di erent sizesand with di erent currencies?
Regions o di erent sizes achieve di erent levelso regional GDP. However, a real comparison canbe made only by comparing the regional GDPwith the population o the region in question.
Tis is where the distinction between place o work and place o residence becomes signi cant:GDP measures the economic output achievedwithin national or regional boundaries, regardlesso whether this was attributable to resident ornon-resident employed persons. Te use o perinhabitant GDP is there ore only straight orwardi all employed persons involved in generatingGDP are also residents o the region in question.
In areas with a high proportion o commuters,regional per inhabitant GDP can be extremely high, particularly in business centres such asLondon or Luxembourg but also in Hamburg,Praha or Wien, and relatively low in thesurrounding regions, even i households’ primary income in these regions is very high. Regional perinhabitant GDP should there ore not be equatedwith regional primary income.
Regional GDP is calculated in the currency o thecountry in question. In order to make GDP com-parable between countries, it is converted into eu-ros, using the o cial average exchange rate or thegiven calendar year. However, not all di erences in
price levels between countries are re ected by ex-change rates. o compensate or this, GDP is con- verted using conversion actors, known as purchas-ing power parities (PPPs), to an arti cial commoncurrency called the purchasing power standard(PPS). Tis makes it possible to compare the pur-chasing power o di erent national currencies (seemethodological notes at the end o the chapter).
Regional GDP in 2007
Maps 4.1 and 4.2 provide an overview o the
regional distribution o per inhabitant GDP (as apercentage o the EU-27 average o 24 900 PPS) or
the European Union, Croatia, the ormer YugoslavRepublic o Macedonia and urkey which has, afera lengthy interruption, once again provided data( or re erence years 2004–06) or the rst time inline with the ESA transmission programme. Teregions with the highest per inhabitant GDP arein southern Germany, in the south o the UK, innorthern Italy and in Belgium, Luxembourg, theNetherlands, Austria, Ireland and Scandinavia.Te capital regions Madrid, Paris and Prahaalso all into this category. Te weaker regionsare concentrated at the southern, western andsouth-eastern periphery o the Union, in easternGermany and the new Member States, Croatia,the ormer Yugoslav Republic o Macedonia and
urkey.
Within the EU-27, per inhabitant GDP rangesrom 26 % o the EU-27 average (6 400 PPS) in
Severozapaden in Bulgaria to 334 % (83 200 PPS)in the capital region o Inner London in the UK.Te actor between the two ends o the distributionis there ore 13.1:1. Luxembourg at 275 % (68 500PPS) and Brussels at 221 % (55 000 PPS) are inpositions 2 and 3, ollowed by Hamburg at 192 %(47 800 PPS) and Praha at 172 % (42 800 PPS) inpositions 4 and 5.
Praha (Czech Republic) thus remains by anincreasing margin the region with the highestper inhabitant GDP in the new Member States;Bratislavský kraj (Slovakia) ollows with 160 %(39 900 PPS) in position 12 o the 271 NU S level2 regions in the EU-27. However, these two regionsmust be regarded as exceptions among the regionsin the new Member States which joined in 2004,since the next most prosperous regions in the newMember States are a long way behind: ZahodnaSlovenija (Slovenia) at 107 % (26 600 PPS) in position94, Közép-Magyarország (Hungary) at 103 %(25 600 PPS) in position 111 and Cyprus at 94 %(23 300 PPS) in position 146. With the exceptiono our other regions (Bucureşti–Il ov in Romania,Mazowieckie in Poland, Malta and Střední Čechy in the Czech Republic), all the other regions o thenew Member States have a per inhabitant GDP inPPS o less than 75 % o the EU-27 average.
Map 4.2 classi es the 271 EU regions accordingto their level o per inhabitant GDP (in PPS) inrelation to the EU-27 average o 24 900 PPS perinhabitant. As a result, in 2007, GDP in 67 regionswas less than 75 % o the EU-27 average. Some24.4 % o the EU population live in these 67
regions, three quarters o them in new MemberStates and one quarter in EU-15 countries.
8/6/2019 Bruto domaći proizvod u EU
http://slidepdf.com/reader/full/bruto-domaci-proizvod-u-eu 3/15
4
75Eurostat regional yearbook 2010eurostat
Gross domestic product
Map 4.1: Gross domestic product (GDP) per inhabitant, by NUTS 2 regions, 2007 ( 1) (PPS per inhabitant)
0 600 km
Gross domestic product (GDP)per inhabitant,by NUTS 2 regions, 2007
Cartography: Eurostat — GISCO, 03/2010 © EuroGeographics Association, for the administrative boundaries
<= 15 00015 000 – <= 20 00020 000 – <= 25 00025 000 – <= 30 000> 30 000Data not available
(PPS per inhabitant)
Guadeloupe (FR)
0 25
Martinique (FR)
0 20
Guyane (FR)
0 100
Réunion (FR)
0 20
Açores (PT)
0 100
Madeira (PT)
0 20
Canarias (ES)
0 100
Malta
0 10
0 100
Ísland
(1) Turkey, 2006.
Source: Eurostat (tgs00005 ).
8/6/2019 Bruto domaći proizvod u EU
http://slidepdf.com/reader/full/bruto-domaci-proizvod-u-eu 4/15
4 Gross domestic product
76 Eurostat regional yearbook 2010 eurostat
Map 4.2: GDP per inhabitant, in PPS, by NUTS 2 regions, 2007 ( 1)(in percentage o EU-27 = 100)
0 600 km
GDP per inhabit ant,in PPS,by NUTS 2 regions, 2007 ( 1)
Cartography: Eurostat — GISCO, 03/2010 © EuroGeographics Association, for t he administrative boundaries
EU-27 = 100<= 5050 – <= 7575 – <= 100100 – <= 125> 125Data not available
(in percentage of EU-27 =100)
Guadeloupe (FR)
0 25
Martinique (FR)
0 20
Guyane (FR)
0 100
Réunion (FR)
0 20
Açores (PT)
0 100
Madeira (PT)
0 20
Canarias (ES)
0 100
Malta
0 10
0 100
Ísland
(1) Turkey, 2006.
Source: Eurostat (reg_e2gdp ).
8/6/2019 Bruto domaći proizvod u EU
http://slidepdf.com/reader/full/bruto-domaci-proizvod-u-eu 5/15
4
77Eurostat regional yearbook 2010eurostat
Gross domestic product
At the upper end o the spectrum, 41 regionshave a per inhabitant GDP o more than 125 %o the EU-27 average; these regions are home to20.6 % o the population. Te regions with a perinhabitant GDP o between 75 % and 125 % o the EU-27 average are home to 55 %, and thus aclear majority o the EU population. Some 9.9 %o the EU population live in the 28 regions whoseper inhabitant GDP is less than 50 % o the EU-27 average; with the exception o the Frenchdépartement d’outre-mer o Guyane, all theseregions are located in the new Member States.
O the 30 level 2 regions in the candidatecountries Croatia, the ormer Yugoslav Republico Macedonia and urkey, only two (the capital
region o Sjeverozapadna Hrvatska in Croatia andİstanbul in urkey) are at a level close to threequarters o the EU-27 average; in a total o nineregions covering 41 % o the population o thesethree countries, the levels are over 50 % o the EUaverage. Te lowest per inhabitant GDP o the 30countries examined here is ound in the regions Van(15 % o the EU-27 average) and Ağri (18.2 %) onthe eastern edge o urkey. Tese levels are aroundone third below the level o the least prosperous EUregion o Severozapaden in Bulgaria.
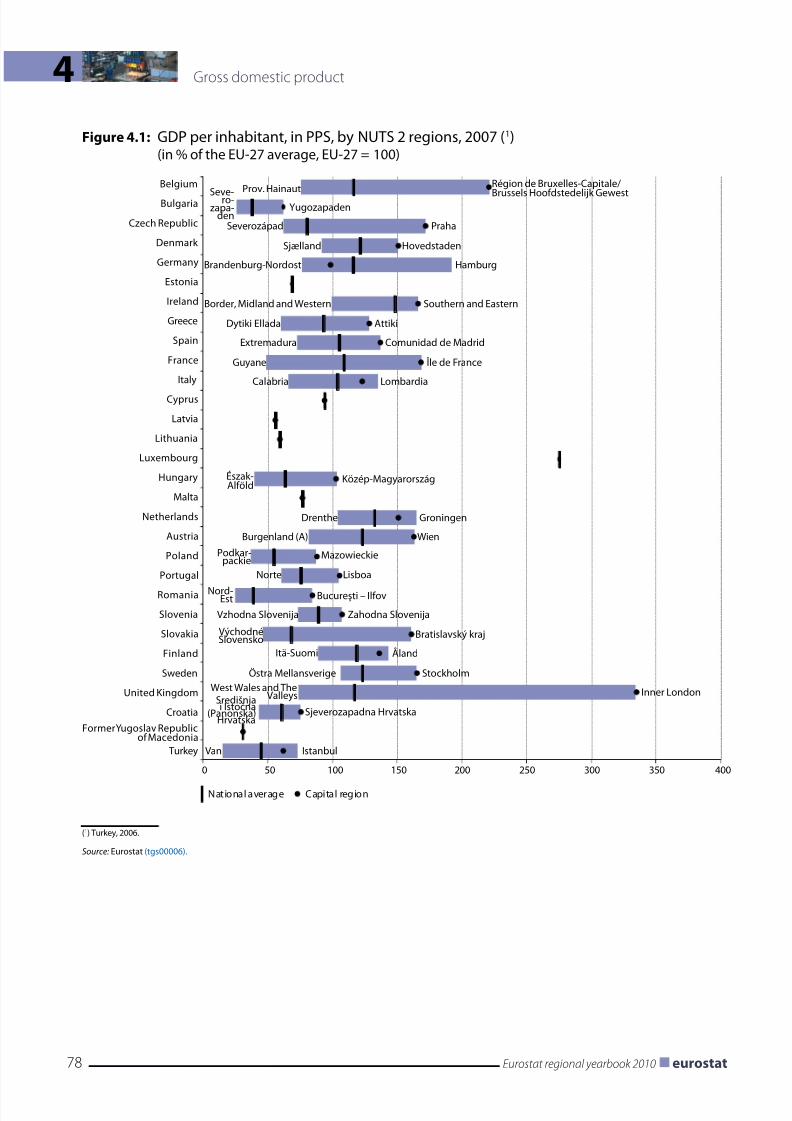
Major regional diferences evenwithin the countries themselves
Tere are also substantial regional di erenceseven within the countries themselves, as Figure4.1 shows. In 2007, the highest per inhabitantGDP was more than twice the lowest in 14 o the23 countries examined here with several NU S2 regions. Tis group includes seven o the ninenew Member States/candidate countries but only seven o the 14 EU-15 Member States.
Te largest regional di erences are in urkey,where there is a actor o 4.9 between the highestand lowest values, and in the United Kingdom andSlovakia with actors o 4.6 and 3.5 respectively.Te lowest values are in Slovenia and in Swedenwith a actor o 1.5, and in the Netherlands with a
actor o 1.6. Moderate regional disparities in perinhabitant GDP (i.e. actors o less than 2 betweenthe highest and lowest values) are ound, with theexception o Slovenia and Croatia, only in EU-15Member States.
In all the new Member States, Croatia and a
number o EU-15 Member States, a substantialproportion o economic activity is concentrated
in the capital regions. Consequently, in 18 o the23 countries included here in which there areseveral NU S 2 regions, the capital regions arealso the regions with the highest per inhabitantGDP. For example, Maps 4.1 and 4.2 clearly showthe prominent position o the regions o Brussels,So a, Praha, Athina, Madrid, Paris and Lisboa aswell as Budapest, Bratislava, London, Warszawaand Bucureşti.
A comparison o the extreme values between2000 and 2007, however, shows that trends inthe EU-15 have been very di erent rom those inthe new Member States. Whilst the gap betweenthe regional extreme values in the new MemberStates and Croatia is clearly increasing in several
cases, it is alling in one out o every two EU-15countries.
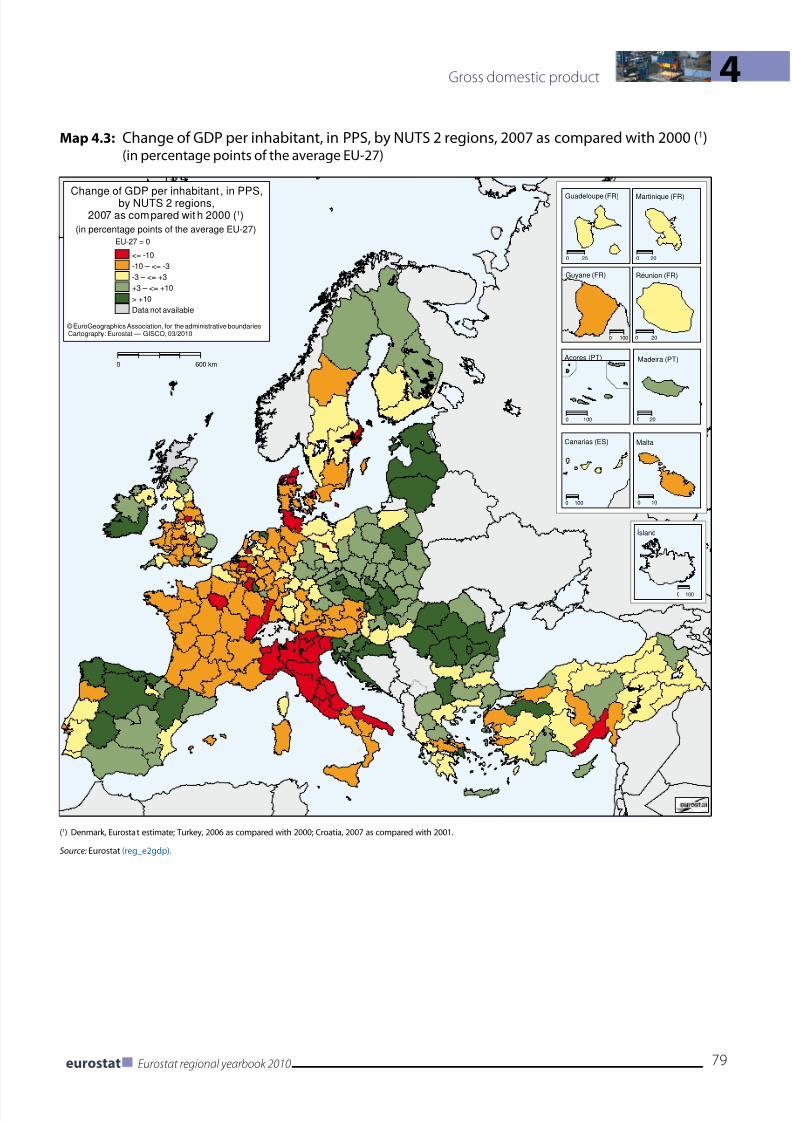
Dynamic catch-up processon the periphery
Map 4.3 shows the extent to which per inhabitantGDP changed between 2000 and 2007 comparedwith the EU-27 average (expressed in percentagepoints o the EU-27 average). Economically dynamic regions, whose per inhabitant GDPincreased by more than 3 percentage pointscompared with the EU average, are shown ingreen. By contrast, less dynamic regions (thosewith a all o more than 3 percentage points inper inhabitant GDP compared with the EU-27average) are shown in orange and red. Te rangeis rom +52 percentage points or Bratislavský kraj(Slovakia) to –35 percentage points or Brussels inBelgium.
Te map shows that economic dynamism iswell above average in the western, eastern andnorthern peripheral areas o the EU, not only inEU-15 countries but also in new Member States,Croatia and some regions o urkey.
Among the EU-15 Member States, stronggrowth can be seen in Spain, Ireland and partso Greece, the United Kingdom, Finland andSweden in particular. On the other hand, atrend which started a number o years ago iscontinuing: sustained weak growth in certainEU-15 countries. Particularly badly hit havebeen Italy, Belgium and Austria, where noregion achieved the average growth o theEU-27 during the seven-year period 2000–07;
in France, all regions except Guadeloupe andMartinique, and almost two thirds o those
8/6/2019 Bruto domaći proizvod u EU
http://slidepdf.com/reader/full/bruto-domaci-proizvod-u-eu 6/15
4 Gross domestic product
78 Eurostat regional yearbook 2010 eurostat
Figure 4.1: GDP per inhabitant, in PPS, by NUTS 2 regions, 2007 ( 1) (in % o the EU-27 average, EU-27 = 100)
0 50 100 150 200 250 300 350 400
Belgium
Bulgaria
Czech Republic
Denmark
Germany
Estonia
Ireland
Greece
Spain
France
Italy
Cyprus
Latvia
Lithuania
Luxembourg
Hungary
Malta
Netherlands
Austria
Poland
Portugal
Romania
Slovenia
Slovakia
Finland
Sweden
United Kingdom
CroatiaFormer Yugoslav Republic
of MacedoniaTurkey
National average Capital region
Prov. Hainaut Région de Bruxelles-Capitale/Brussels Hoofdstedelijk GewestYugozapaden
Severozápad Praha
Sjælland Hovedstaden
Brandenburg-Nordost Hamburg
Border, Midland and Western
Dytiki Ellada Attiki
Southern and Eastern
Extremadura Comunidad de Madrid
Guyane Île de France
Calabria Lombardia
Észak-Alföld Közép-Magyarország
Drenthe
Burgenland (A)
Groningen
WienMazowieckie
Norte Lisboa
Bucureşti – Ilfov
Vzhodna Slovenija Zahodna Slovenija
Bratislavský krajItä-Suomi Åland
Van Istanbul
Središnjai Istočna(Panonska)Hrvatska
Östra Mellansverige Stockholm
Inner London
Sjeverozapadna Hrvatska
West Wales and TheValleys
VýchodnéSlovensko
Nord-Est
Podkar-packie
Seve-ro-zapa-den
(1) Turkey, 2006.
Source: Eurostat (tgs00006 ).
8/6/2019 Bruto domaći proizvod u EU
http://slidepdf.com/reader/full/bruto-domaci-proizvod-u-eu 7/15
4
79Eurostat regional yearbook 2010eurostat
Gross domestic product
Map 4.3: Change o GDP per inhabitant, in PPS, by NUTS 2 regions, 2007 as compared with 2000 ( 1) (in percentage points o the average EU-27)
0 600 km
Change of GDP per inhabitant , in PPS,by NUTS 2 regions,2007 as compared wit h 2000 ( 1)
Cartography: Eurostat — GISCO, 03/2010 © EuroGeographics Association, for the administrative boundaries
EU-27 = 0<= -10-10 – <= -3-3 – <= +3+3 – <= +10> +10Data not available
(in percentage points of the average EU-27)
Guadeloupe (FR)
0 25
Martinique (FR)
0 20
Guyane (FR)
0 100
Réunion (FR)
0 20
Açores (PT)
0 100
Madeira (PT)
0 20
Canarias (ES)
0 100
Malta
0 10
0 100
Ísland
(1) Denmark, Eurosta t estimate; Turkey, 2006 as compared with 2000; Croatia, 2007 as compared with 2001.
Source: Eurostat (reg_e2gdp ).
8/6/2019 Bruto domaći proizvod u EU
http://slidepdf.com/reader/full/bruto-domaci-proizvod-u-eu 8/15
4 Gross domestic product
80 Eurostat regional yearbook 2010 eurostat
in Germany, ell against the EU average. InPortugal, only Alentejo and the islands achievedgrowth above the EU average.
O the new Member States, apart rom the very dynamic capital regions, the Baltic countries,Romania, the Czech Republic, Slovakia andmost regions o Poland in particular have seenmarkedly above-average growth. Croatia, the
ormer Yugoslav Republic o Macedonia andmost o the urkish regions also reveal above-average economic growth or the seven-yearperiod 2000–07.
Closer analysis o the most dynamic regionsshows that 36 EU regions have outper ormed the
EU average by more than 10 percentage points; o these, 20 are in the new Member States.
Te 10 astest-growing regions are spread overnine EU Member States. It is striking, however,that the capital regions continue to have anabove-average rate o growth not only in the EU-15 countries but also in the new Member States.Te non-capital region with the strongest growthin the new Member States was Vest (Romania),where per inhabitant GDP (in PPS) increasedby 21.4 percentage points o the EU-27 averagebetween 2000 and 2007.
A clear concentration in certain Member Statesis, on the other hand, apparent at the lower end o the distribution curve: o the 31 regions which ellby more than 10 percentage points below the EU-27 average, 15 are in Italy, our in Belgium andthree in France.
Closer examination o the new Member Statesyields the pleasing result that, between 2000and 2007, only three regions ell back comparedwith the EU-27 average: these are Malta (–7.2percentage points), Nyugat-Dunántúl in Hungary (–1.3 percentage points) and Zachodniopomorskiein Poland (–0.2).
Te trend in urkey (2006 compared with 2000)was, on the other hand, airly heterogeneous:by comparison with the EU, the catching-upprocess in certain western regions o urkey was,as expected, particularly dynamic (speci cally in İstanbul and Bursa); however, progress inindividual regions in inland areas and in theeast, such as in Kayseri and Ağri, has been aboveaverage. By contrast, other regions, particularly
Adana on the eastern coast o the Mediterranean,have in some cases allen substantially.
Te catch-up process in the new Member Stateswas o the order o 1.5 percentage points per yearbetween 2000 and 2007 compared to the EUaverage, and there ore considerably aster than inthe 1990s. Per inhabitant GDP (in PPS) in these 12countries thus rose rom 45 % o the EU-27 averagein 2000 to 56 % in 2007. It is eared, however, thatowing to the severe economic crisis o 2008 and2009 this rate o growth will slow towards the endo the decade. However, the initial data availableon certain Member States or 2008 and 2009would suggest that the recession in rural regionsand areas lagging behind in terms o economicdevelopment was less severe than in regions witha high per inhabitant GDP or with a high level o dependence on exports.
Diferent trends even within thecountries themselves
A more detailed analysis o trends within thecountries between 2000 and 2007 shows that theeconomic development o regions even within acountry can be extremely divergent.
Te greatest di erences were seen in Slovakia,Greece, the Czech Republic and Belgium, wherethere was a di erence o some 30 percentagepoints relative to the EU-27 average or perinhabitant GDP between the astest- and slowest-growing regions. Slovenia and Denmark are atthe lower end o the scale with 6 and 8 percentagepoints respectively. Te highest and lowest valuesin the 26 regions o urkey show a di erence o 27percentage points and thus all within the upper
fh or the EU Member States.
In both new Member States and EU-15 countries,this signi cant divergence was the result mainly
o dynamic growth in capital regions. However,as the relatively low values or Poland andCroatia in particular show, the data available donot con rm the assumption that such regionalgrowth disparities are a typical eature o newMember States or accession countries.
Te available data also show that even the leasteconomically dynamic regions in 12 MemberStates attained levels o growth above the EU-27average. It is pleasing to note that this was thecase in all seven new Member States with at least
two NU S 2 regions. Te same positive trend canbe observed in Croatia and urkey.
8/6/2019 Bruto domaći proizvod u EU
http://slidepdf.com/reader/full/bruto-domaci-proizvod-u-eu 9/15
4
81Eurostat regional yearbook 2010eurostat
Gross domestic product
Convergence makes progress
Tis section addresses the question o whether
convergence among the regions o the EU-27 hasmade progress over the seven-year period 2000–07. Regional convergence o per inhabitant GDP(in PPS) can be assessed in various ways on thebasis o data supplied to Eurostat by the nationalstatistical institutes.
Te simplest approach is to measure the gapbetween the highest and lowest values. By thismethod, the gap closed rom a actor o 17.7 in2000 to 13.1 in 2007. Te main reason or thisclear convergence was the aster economicgrowth in Bulgaria and Romania. However, asthis approach looks only at the extreme values, itis clear that the majority o shifs between regionsare not taken into account.
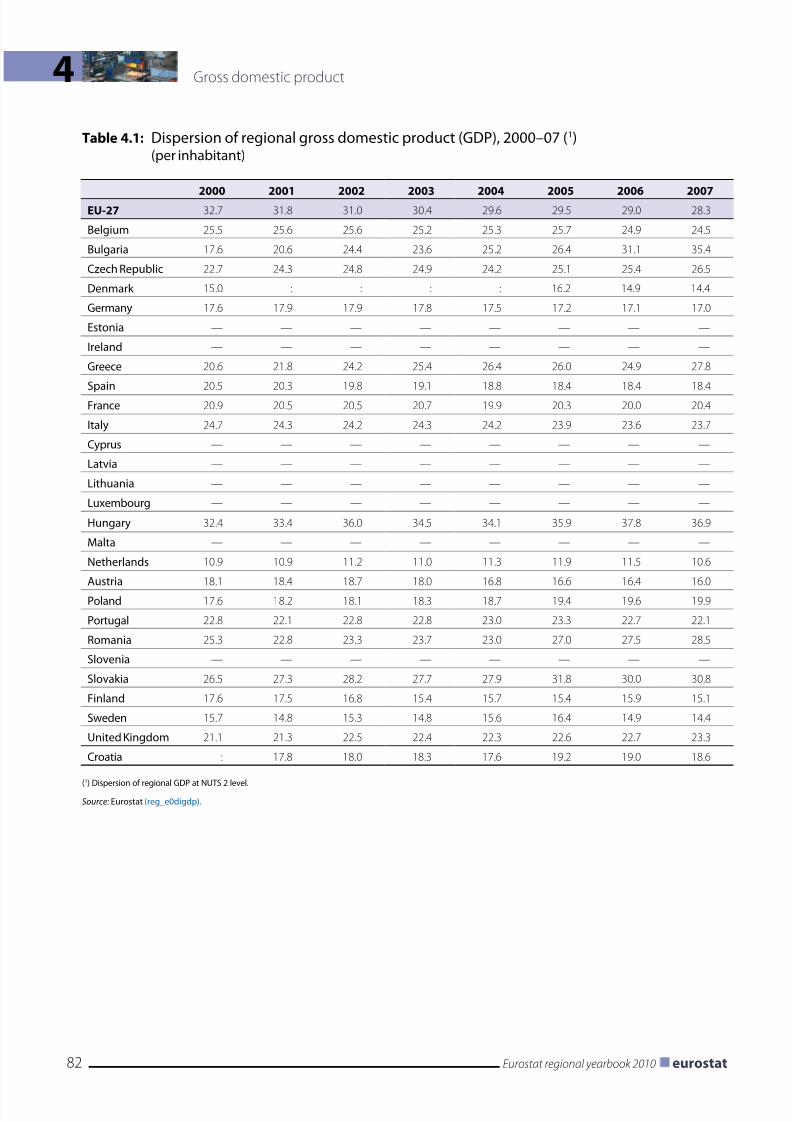
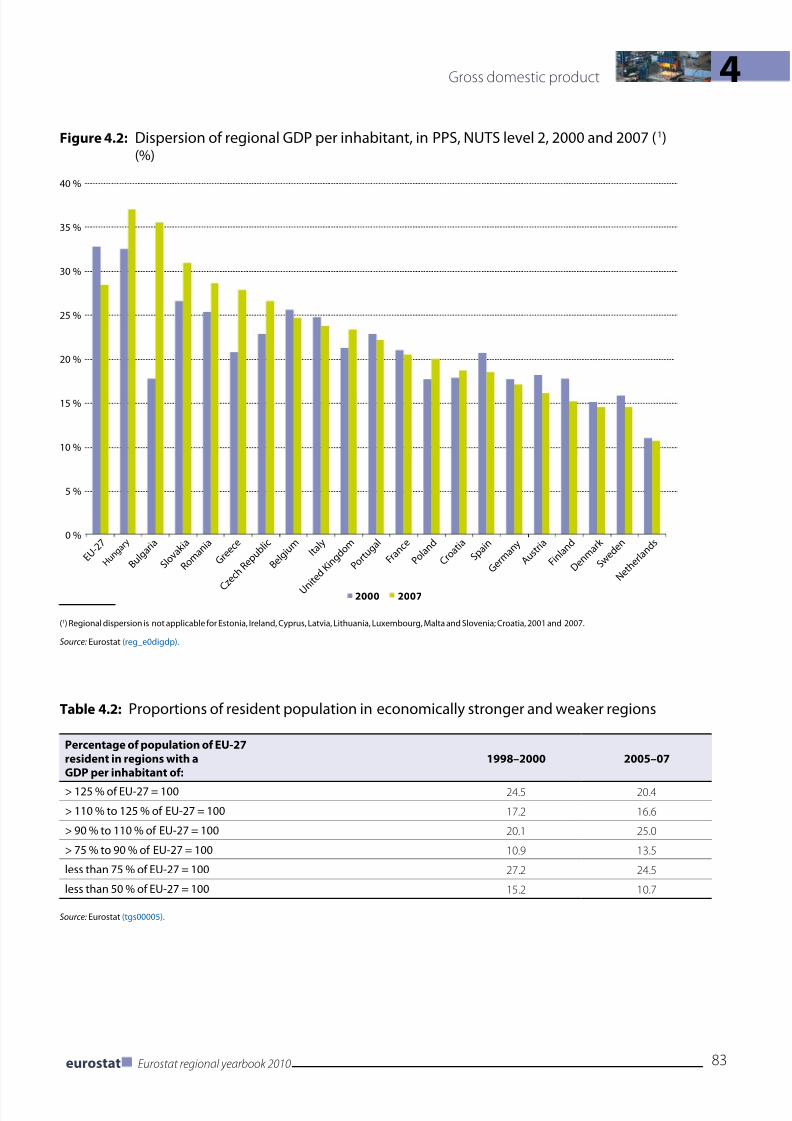
A much more accurate evaluation o regionalconvergence is a orded by the dispersion o regionalGDP calculated by Eurostat or the EU-27 andCroatia since 2007 ( or details o the method see themethodological notes at the end o the chapter). Tistakes account o the divergences rom the nationalaverage in all NU S 2 regions or each country inturn, weighted by the regional population. able
4.1 shows the trends in dispersion or 2000 to 2007and Figure 4.2 compares the values or these twoyears. In the rst instance a downward trend isapparent, i.e. a decrease in regional dispersion orthe EU-27 as a whole. An examination o the trendin individual countries reveals clear di erencesbetween certain groups o Member States. Firstly,most o the EU-15 countries have lower dispersionthan the new Member States. In addition, valuesin the EU-15 countries are generally decreasing,whereas they are increasing considerably in someo the new Member States. It is thus evident thatthe economic catching-up process in the newMember States has so ar gone hand-in-hand withincreasing regional disparities.
Te approach most ofen used at present involvesclassi ying the regions according to their perinhabitant GDP (in PPS). In this way, theproportion o the EU-27 population living inmore or less prosperous regions, and how thisproportion has changed, can be ascertained. Asa rule, average values over a period o three yearsare used. Tree-year averages or per inhabitantGDP are particularly important because they are
used or deciding which regions receive supportrom the Structural Funds o the EU.
able 4.2 shows clear progress in economicconvergence between the regions over thethree-year periods 1998–2000 and 2005–07: theproportion o the population living in regionswhere per inhabitant GDP is less than 75 % o the EU-27 average ell rom 27.2 % to 24.5 %. Atthe same time, the proportion o the populationliving in regions where this value is greater than125 % ell rom 24.5 % to 20.4 %. Tese shifs atthe top and bottom ends o the distribution meantthat the proportion o the population in the mid-range (per inhabitant GDP o 75–125 %) increasedsharply rom 48.2 % to 55.1 %. Tis correspondsto an increase o around 34 million inhabitants.
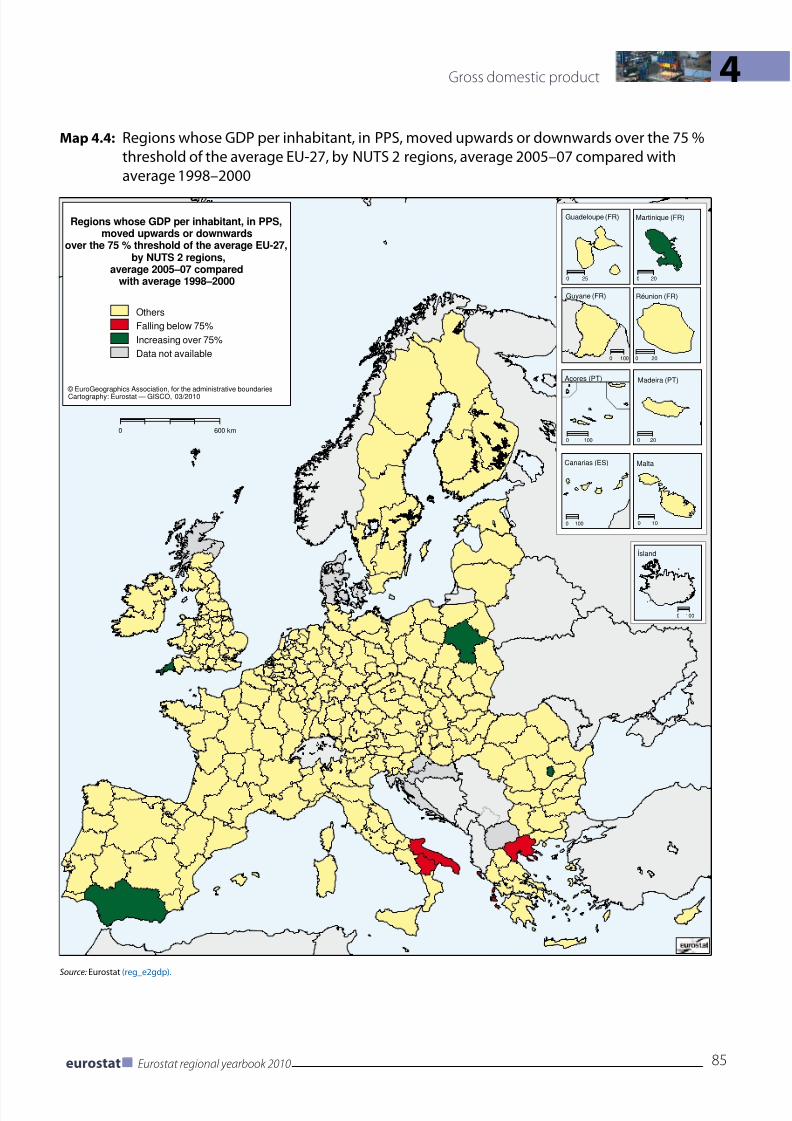
Map 4.4 shows, however, that despite the clear
progress made towards convergence overall, acomparison between the three-year periods 1998–2000 and 2005–07 reveals that just fve regionsmanaged to pass the 75 % threshold. Tese were oneregion each in Spain, France, Poland, Romania andthe UK. Tese regions are home to almost 16 millionpeople, or around 3.2 % o the EU population. Atthe same time, however, GDP in two Greek andtwo Italian regions covering a total o 6.8 millioninhabitants, i.e. approx. 1.4 % o the EU population,has again allen below the 75 % threshold. I bothdevelopments are juxtaposed it is ound that, as aresult o economic development between the three-year periods 1998–2000 and 2005–07, the populationliving in regions with a GDP o more than 75 % o the average grew by just over 9 million people.
Tese results close to the 75 % threshold suggestthat economically weaker regions bene ted only marginally during the rst hal o the decade
rom increased convergence in the EU.
However, a more detailed analysis shows thatmany regions with a GDP o less than 75 % o theEU-27 average have made considerable progress,even where they were not able to exceed the 75 %threshold. Te population living in regions witha GDP o less than 50 % o the average thus ellbetween the three-year periods 1998–2000 and2005–07 by more than a quarter rom 15.2 % to10.7 %, i.e. by over 20 million people.
Moreover, an examination o the 20 weakestregions as at 1998–2000, where at that time 8.4 %o the EU population lived, shows that this grouphas progressed as well: per inhabitant GDP inthese regions rose between 1998–2000 and 2005–07 rom 28.0 % to 36.1 % o the EU-27 average and
this testi es, in particular, to the strong catch-upprocess under way in Bulgaria and Romania.
8/6/2019 Bruto domaći proizvod u EU
http://slidepdf.com/reader/full/bruto-domaci-proizvod-u-eu 10/15
4 Gross domestic product
82 Eurostat regional yearbook 2010 eurostat
Table 4.1: Dispersion o regional gross domestic product (GDP), 2000–07 ( 1) (per inhabitant)
2000 2001 2002 2003 2004 2005 2006 2007EU-27 32.7 31.8 31.0 30.4 29.6 29.5 29.0 28.3
Belgium 25.5 25.6 25.6 25.2 25.3 25.7 24.9 24.5
Bulgaria 17.6 20.6 24.4 23.6 25.2 26.4 31.1 35.4
Czech Republic 22.7 24.3 24.8 24.9 24.2 25.1 25.4 26.5
Denmark 15.0 : : : : 16.2 14.9 14.4
Germany 17.6 17.9 17.9 17.8 17.5 17.2 17.1 17.0
Estonia — — — — — — — —
Ireland — — — — — — — —
Greece 20.6 21.8 24.2 25.4 26.4 26.0 24.9 27.8
Spain 20.5 20.3 19.8 19.1 18.8 18.4 18.4 18.4
France 20.9 20.5 20.5 20.7 19.9 20.3 20.0 20.4
Italy 24.7 24.3 24.2 24.3 24.2 23.9 23.6 23.7
Cyprus — — — — — — — —
Latvia — — — — — — — —
Lithuania — — — — — — — —
Luxembourg — — — — — — — —
Hungary 32.4 33.4 36.0 34.5 34.1 35.9 37.8 36.9
Malta — — — — — — — —
Netherlands 10.9 10.9 11.2 11.0 11.3 11.9 11.5 10.6
Austria 18.1 18.4 18.7 18.0 16.8 16.6 16.4 16.0
Poland 17.6 18.2 18.1 18.3 18.7 19.4 19.6 19.9
Portugal 22.8 22.1 22.8 22.8 23.0 23.3 22.7 22.1
Romania 25.3 22.8 23.3 23.7 23.0 27.0 27.5 28.5
Slovenia — — — — — — — —
Slovakia 26.5 27.3 28.2 27.7 27.9 31.8 30.0 30.8
Finland 17.6 17.5 16.8 15.4 15.7 15.4 15.9 15.1
Sweden 15.7 14.8 15.3 14.8 15.6 16.4 14.9 14.4
United Kingdom 21.1 21.3 22.5 22.4 22.3 22.6 22.7 23.3
Croatia : 17.8 18.0 18.3 17.6 19.2 19.0 18.6
(1
) Dispersion o regional GDP at NUTS 2 level.Source: Eurostat (reg_e0digdp ).
8/6/2019 Bruto domaći proizvod u EU
http://slidepdf.com/reader/full/bruto-domaci-proizvod-u-eu 11/15
4
83Eurostat regional yearbook 2010eurostat
Gross domestic product
Figure 4.2: Dispersion o regional GDP per inhabitant, in PPS, NUTS level 2, 2000 and 2007 ( 1) (%)
0 %
5 %
10 %
15 %
20 %
25 %
30 %
35 %
40 %
2000 2007
E U - 2 7
H u n g a r y
B u l g a r i a
S l o v a k i a
R o m a
n i a
G r e e
c e
C z e
c h R e p
u b l i c
B e l g i u m I t a l y
U n i t e d
K i n g d o m
P o r t u g a l
F r a n c
e
P o l a n
d
C r o a t i a
S p a i n
G e r m
a n y
A u s t r
i a
F i n l a n d
D e n m
a r k
S w e d e
n
N e t h e
r l a n d s
(1) Regional dispersion is not applicable or Estonia, Ireland, Cyprus, Latvia, Lithuania, Luxembourg, Malta and Slovenia; Croatia, 2001 and 2007.
Source: Eurostat (reg_e0digdp ).
Table 4.2: Proportions o resident population in economically stronger and weaker regions
Percentage of population of EU-27resident in regions with aGDP per inhabitant of:
1998–2000 2005–07
> 125 % o EU-27 = 100 24.5 20.4
> 110 % to 125 % o EU-27 = 100 17.2 16.6
> 90 % to 110 % o EU-27 = 100 20.1 25.0
> 75 % to 90 % o EU-27 = 100 10.9 13.5
less than 75 % o EU-27 = 100 27.2 24.5
less than 50 % o EU-27 = 100 15.2 10.7
Source: Eurostat (tgs00005 ).
8/6/2019 Bruto domaći proizvod u EU
http://slidepdf.com/reader/full/bruto-domaci-proizvod-u-eu 12/15
4 Gross domestic product
84 Eurostat regional yearbook 2010 eurostat
Conclusion
In 2007, the highest and lowest values o per
inhabitant GDP (in PPS) or the 271 NU S level2 regions o the EU-27 examined here di ered by a actor o 13.1; a gure which is still very highbut decreasing over the medium term. O the 30level 2 regions in the candidate countries Croatia,the ormer Yugoslav Republic o Macedonia and
urkey, only two have attained a level o almostthree quarters o the EU-27 average. Te lowestper inhabitant GDP o the 30 countries examinedhere is ound in the regions Van (15 % o theEU-27 average) and Ağri (18.2 %) on the easternedge o urkey. Tese levels are around one thirdbelow the level o the least prosperous EU regiono Severozapaden in Bulgaria.
Within individual countries, there are di erenceso up to a actor o 4.9 in urkey. Within the EU-27 the levels are between 4.6 and 1.5; regionaldi erences in new Member States tend to begreater than in the EU-15.
In 2007, GDP in 67 regions was less than 75 % o theEU-27 average. Some 24.4 % o the population livein these 67 regions, three quarters o them in newMember States and one quarter in EU-15 countries.I the view is broadened to include the three-yearaverage or 2005–07, an important indicator or EUstructural policy, very similar values are ound: 68regions with 24.5 % o the population show valueso less than 75 % o the EU-27 average.
I the trends over the seven-year period 2000–07are considered, dynamic growth can be seenin the EU-15, particularly in Greece, Spain,Ireland and certain regions o the UK, Finlandand Sweden. However, this must be set againstrather disappointing growth in most regions o Belgium, Germany, France, Italy, Austria andPortugal.
In the new Member States, signi cantly above-average growth can be seen primarily in theBaltic countries, Romania, the Czech Republic,Slovakia and most regions o Poland. Te sameapplies to Croatia, the ormer Yugoslav Republico Macedonia and the majority o the urkishregions.
Te catch-up process in the new Member Stateswas o the order o 1.5 percentage points per yearcompared to the EU average between 2000 and2007, and there ore considerably aster than inthe 1990s. Per inhabitant GDP (in PPS) in these12 countries thus rose rom 45 % o the EU-27 average in 2000 to 56 % in 2007. It is eared,however, that owing to the severe economic crisiso 2008 and 2009 this rhythm will slow towardsthe end o the decade. However, the initial dataavailable on certain Member States or 2008 and2009 would suggest that the recession in ruralregions and areas lagging behind in developmentterms was less severe than in regions with ahigh per inhabitant GDP or with a high level o dependence on exports.
8/6/2019 Bruto domaći proizvod u EU
http://slidepdf.com/reader/full/bruto-domaci-proizvod-u-eu 13/15
4
85Eurostat regional yearbook 2010eurostat
Gross domestic product
Map 4.4: Regions whose GDP per inhabitant, in PPS, moved upwards or downwards over the 75 %threshold o the average EU-27, by NUTS 2 regions, average 2005–07 compared withaverage 1998–2000
0 600 km
Regions whose GDP per inhabitant, in PPS,moved upwards or downwards
over the 75 % threshold of the average EU-27,by NUTS 2 regions,
average 2005–07 comparedwith average 1998–2000
Cartography: Eurostat — GISCO, 03/2010 © EuroGeographics Association, for the administrative boundaries
OthersFalling below 75%Increasing over 75%Data not available
Guadeloupe (FR)
0 25
Martinique (FR)
0 20
Guyane (FR)
0 100
Réunion (FR)
0 20
Açores (PT)
0 100
Madeira (PT)
0 20
Canarias (ES)
0 100
Malta
0 10
0 100
Ísland
Source: Eurostat (reg_e2gdp ).
8/6/2019 Bruto domaći proizvod u EU
http://slidepdf.com/reader/full/bruto-domaci-proizvod-u-eu 14/15
4 Gross domestic product
86 Eurostat regional yearbook 2010 eurostat
Methodological notes
Purchasing power parities and international volume comparisons
Te di erences in GDP values between countries, even afer conversion by means o exchange rates to acommon currency, cannot be attributed solely to di ering volumes o goods and services. Te ‘level o prices’ component is also a major contributory actor. Exchange rates are determined by many actorsrelated to demand and supply in the currency markets, such as international trade, in ation orecastsand interest rate di erentials. Conversions using exchange rates are there ore o only limited relevance
or international comparisons. o obtain a more precise comparison, it is essential to use specialconversion rates which eliminate the e ect o price-level di erences between countries. Purchasingpower parities (PPPs) are conversion actors o this kind which convert economic indicators romnational currencies into an arti cial common currency, called the purchasing power standard (PPS).PPPs are there ore used to convert GDP and other economic aggregates (e.g. consumption expenditureon certain product groups) o various countries into comparable volumes o expenditure, expressed in
purchasing power standards.With the introduction o the euro, prices can now, or the rst time, be compared directly betweencountries in the euro area. However, the euro has di erent purchasing power in the di erent countrieso the euro area, depending on the national price level. PPPs must there ore also continue to be used tocalculate pure volume aggregates in PPS or the Member States within the euro area.
In their simplest orm, PPPs are a set o price ratios between the prices in national currency o the samgood or service in di erent countries (e.g. a loa o bread costs EUR 2.30 in France, EUR 1.90 in GermanGBP 2.40 in the UK, etc.). A basket o comparable goods and services is used or price surveys. Tese arselected so as to represent the whole range o goods and services, taking account o the consumptionstructures in the various countries. Te simple price ratios at product level are then aggregated to PPPs
or product groups, then or overall consumption and nally or GDP. In order to have a re erence valuor the calculation o PPPs, one country is usually chosen and used as the re erence country, and set to
1. For the European Union, the selection o a single country as a base is inappropriate. Tere ore, PPSis the arti cial common re erence currency unit used in the European Union to express the volume oeconomic aggregates or the purpose o spatial comparisons in real terms.
Un ortunately, or reasons o cost, it will not be possible in the oreseeable uture to calculate regionconversion actors. I such regional PPPs were available, the GDP in PPS or numerous peripheral orural regions o the EU would probably be higher than that calculated using national PPPs.
Te regions may be ranked di erently when calculating in PPS instead o euros. For example, in 2007the Swedish region o Östra Mellansverige had a per inhabitant GDP o EUR 31 300, putting it welahead o Madrid at EUR 30 600. However, in PPS, Madrid at 34 100 PPS per inhabitant is ahead o
Östra Mellansverige at 26 500 PPS per inhabitant.In terms o distribution, the use o PPS rather than the euro has a levelling e ect, as countries with a very high per inhabitant GDP also generally have relatively high price levels. Te range o per inhabitantGDP in NU S level 2 regions in the EU-27 thus alls rom 93 400 in euros to 76 900 in PPS.
Per inhabitant GDP in PPS is the key variable or determining the eligibility o NU S level 2 regionunder the European Union’s structural policy.
Dispersion of per inhabitant GDP
Since 2007, Eurostat has been calculating a derived indicator which records the di erences between
regional per inhabitant GDP and the national average and makes them comparable betweencountries.
8/6/2019 Bruto domaći proizvod u EU
http://slidepdf.com/reader/full/bruto-domaci-proizvod-u-eu 15/15
4
87Eurostat regional yearbook 2010eurostat
Gross domestic product
For a given country the dispersion D o regional GDP o the level 2 or 3 regions is de ned as the sum o the absolute di erences between regional and national GDP per inhabitant, weighted with the regionalshare o population and expressed as a percentage o national per inhabitant GDP:
D = 100 ¦ (y i - Y) ¦ (pi / P)
where:
y •i is the regional per inhabitant GDP o regioni;
Y is the national average per inhabitant GDP;•
p•i is the population o regioni;
P is the population o the country;•
n• is the number o regions o the country.
Te value o the dispersion o per inhabitant GDP is equal to zero, i regional GDP values are identicalin all regions o the country or economic area (such as the EU-27 or the euro area), and it will show,ceteris paribus, an increase i the di erences between the regional per inhabitant GDP values amongregions are rising. For example, a value o 20 % means that the per inhabitant GDP o all regions o agiven country, weighted on the basis o the regional population, di ers rom the national value by anaverage o 20 %.
Te EU-27 value is calculated by treating the EU-27 as a single country, i.e. only the level 2 or 3 regionsare taken into account in each case. Te corresponding NU S level 2, level 1 or national values are thusnot used in the calculation in order to avoid them being taken into account twice.
GDP dispersion gures published on the Eurostat website are based on per inhabitant GDP inpurchasing power standards (PPS).