caltrain grade crossing study appendicesmodernization+program/...interconnection1 – the electrical...
TRANSCRIPT

DRAFT
APPENDIX
DRAFT
Appendix A Key Study Terms
Advance Preemption1 – It is the notification of an approaching train when it is forwarded to the highway traffic signal controller by the railroad equipment in advance of the activation of railroad warning devices. This is provided to improve traffic safety and circulation at the crossings. Advance pre‐emption does not affect gate down time at a crossing, rather it helps to clear off vehicles across the crossing and to reduce/eliminate traffic movements allowing vehicles to proceed towards an activated grade crossing.
AtGrade Crossing – An intersection of railroad tracks, roadways, walkways or a combination of these at the same level.
Automatic territory – Track located outside of interlockings.
Clockface schedule – A timetable schedule where trains arrive at an even interval that repeats hourly.
CBOSS (Also referred to as an Advanced Signal System2) – CBOSS is an acronym that stands for Communications Based Overlay Signal Systems. Caltrain’s CBOSS system is a new generation train control systems planned for Caltrain that provides for the possibility of advanced grade crossing interfaces that may benefit grade crossing down times and is intended to meet the 2008 federal mandates, called positive train control, by 2015 and also to increase system capacity to allow for future increases in ridership demand.
Control Point (CP) – A location on the Caltrain Corridor with wayside signals that can be controlled by a Train Dispatcher, allowing trains to be held at that point as required. Almost all Control Points on the Caltrain Corridor are associated with interlockings, a collection of signals and track switches where trains can be routed from track to track as needed to maintain fluid railroad operations.
EMU (Electrical Multiple Unit) –Electrified train type where all cars provide tractive effort, a force that a train’s motors generate for forward movement.
Gate Down Time – It is the time from the start of gate flashers on, to the gates come down, to the time that the gates are rising and are in a mostly vertical position after the train has passed through the crossing, when pedestrian, bicycle and vehicular traffic can safely cross the railroad crossing.
Gate Down Event – A gate down event represents an incidence of gate closure at the railroad crossing, due to a train either passing a crossing or stopping at a nearby upstream station. It can also be due to simultaneous passing of two trains in opposite directions at a crossing.
GradeSeparated Crossing – A railroad crossing where roadways and railroads cross at different elevations.
1 Definition obtained from the California Manual on Uniform Traffic Control Devices, 2012. 2 Advanced signal system is a descriptor, not an official name.

DRAFT
Appendix A KEY STUDY TERMS
Headway – Time (either scheduled or actual) between successive trains on the corridor.
Holdout rule – An operating rule on the Caltrain Corridor that requires trains to wait for other trains to pass or finish unloading passengers at stations where pedestrians must cross the track. This only applies when a train is making a station stop, otherwise two trains can travel through the station without stopping.
Inhibit Feature – The planned CBOSS feature that allows grade crossings to remain open for automobile traffic while trains are profiled to a stop at a passenger station located at the near (upstream) side of a grade crossing.
Interconnection1 – The electrical connection between the railroad active warning system and the highway traffic signal controller assembly for the purpose of pre‐emption.
Interlocking – Control point protected by signals where movable bridges, rail crossings or turnouts exist.
Level of Service (LOS) – The Federal Highway Administration (FHWA), Caltrans, City/County Association of Governments of San Mateo County and most local jurisdictions have adopted definitions of traffic service quality, which are referred to as Levels of Service. There are six categories of LOS that in alphabetical sequence describe very good traffic conditions (LOS A) to very poor traffic conditions (LOS F). Average vehicle delay is the primary indicator that is used to classify traffic conditions into the six categories.
NonPreempted Intersection – An intersection that operates independent of any activated railroad grade crossing.
Preempted Intersection – Interconnected vehicular traffic signal controller that uses communication from the railroad grade crossing circuitry to reduce/eliminate concurrent signals from allowing vehicles to proceed to an activated grade crossing.
Preemption – The transfer of normal operation of roadway traffic signals to a special control mode that prioritizes railroad crossing operations and prohibits all traffic movements allowing vehicles to proceed towards an activated grade crossing. Pre‐emption has no effect on the gate down times, but it has an impact on the traffic operations at the signalized intersections located in the neighborhood of an at‐grade railroad crossing.
Rolling stock – Vehicle of a trainset.
Skipstop – Scheduling technique of alternating station stops to increase average travel speeds and to reduce trip times.
Wayside signaling – Signals alongside the track that convey to the train engineer occupancy and/or routing status ahead.
DRAFT
Appendix B
Train Horn Sounding, Bell Ringing, and Quiet Zone
Rules
This appendix provides information on train horn and quiet zones. While this topic is not the focus of
this study, it was added to address questions and misunderstandings from stakeholders that surfaced
through the study process.
The appendix provides the key facts associated with train horn, bell and whistle sounding rules and
information about quiet zones.
Train Sounding Rules
The uses of locomotive horns at at-grade crossings for railroads in the United States are defined in the
Code of Federal Regulations. Further definition is also provided in the General Code of Operating
Rules (GCOR).
The train horn sounding rules state that a locomotive engineer would sound the train horn as a
warning whenever necessary to ensure the safe operation of a train and safety to persons on or near
the track. Specifically, the locomotive engineer must sound train horns in the following
circumstances:
When persons or livestock are on the track at other than road crossings at-grade;
To warn railroad employees when an emergency exists;
When approaching public at-grade crossings (the locomotive engineer is to prolong the train
horn until locomotive completely occupies the crossing); and
When approaching persons or equipment on or near the track; and
Prior to initiating movement if the engine bell is defective.
The locomotive engineer also must sound train horns in the following circumstances, but may use
other forms of communication (i.e. bell, whistle or flashing headlights) in place of a train horn:
When air brakes are applied and pressure is equalized;
When releasing brakes and proceeding from a stopped position;
When acknowledging any signal not otherwise provided for (i.e. a hand held signal in a work
zone?);
When backing up from a stopped position; and
When requesting a signal to be given or repeated if not understood.
DRAFT
Appendix B TRAIN HORN SOUNDING, BELL RINGING, AND QUIET ZONE RULES
Locomotive horn sound level requirements state that each lead locomotive shall be equipped with a
horn that produces a minimum sound level of 96 dB(A) and a maximum sound level of 110 dB(A) at
100 feet forward of the locomotive in its direction of travel. The locomotive horn shall be arranged so
that it can be conveniently operated from the engineer's usual position during operation of the
locomotive.
The use of train bells at at-grade crossings for railroads in the United States is also defined in the
GCOR. The following circumstances direct the locomotive engineer to sound the train bell:
Before moving, except when making momentary stop and start switching movements;
As a warning signal anytime it is necessary;
When approaching men or equipment on or near the track; and
Approaching public crossings at grade.
In addition to the use of horns and bells, the locomotive engineer would sound the train whistle when
passing through passenger stations if the engine bell is inoperative.
Quiet Zones
Quiet zones must be a minimum of one-half mile in length and comprise one or more public at-grade
crossings and may be multi-jurisdictional. A quiet zone is a location where locomotive engineers are
not supposed to blow their horns except when:
Necessary to provide warning in an emergency;
Notified automatic warning devices are malfunctioning;
Notified automatic warning devices are out of service;
The quiet zone is not in effect during specified hours; (i.e. an “Intermediate Partial Quiet Zone” –
where the quiet zone has specified periods of time)
At locomotive operator’s discretion to ensure safety.
In addition to the circumstances described above, in the Caltrain corridor, currently the train horn is
required to activate gate arms for at-grade crossings that are adjacent to stations in order to descend
the gates when the train is ready to depart the station.
It must be clearly understood that quiet zones do not eliminate horn sounding.
In addition to understanding what a quiet zone means in terms of reducing horn noise, it is just as
important to understand the process of establishing a quiet zone which would be initiated by the
public authority of the crossing. The public authority means the public entity responsible for traffic
control or law enforcement at the public highway-rail vehicular or pedestrian crossing.
The FRA regulations for establishing a quiet zone addresses minimum requirements/eligibility, the
evaluation process and crossing qualifications that must be met in order to request a quiet zone. The
FRA provides a quiet zone calculator to assess the risk of eliminating the train horn at each crossing
within a proposed quiet zone. This tool takes into account factors such as past traffic accidents at the
DRAFT
Appendix B TRAIN HORN SOUNDING, BELL RINGING, AND QUIET ZONE RULES
crossing, train frequency and other factors. The result of this assessment is a risk index which
indicates if the quiet zone criteria have been met and if Supplemental Safety Measures (SSMs) are
needed to meet the criteria.
SSMs include:
Temporary closure of a grade crossing;
Four-quadrant gate system;
Two-quadrant gates with medians or channelization of specific lengths on the approaches;
Gates blocking a one-way street; and
Permanent closure of a grade crossing.
Other important considerations that all involved stakeholders should deliberate before requesting
quiet zones include capital costs, on-going operating & maintenance costs, monitoring and reporting
to the FRA, and liability responsibilities.
DRAFT
Appendix C
Stakeholder Outreach
This study was initiated in early 2012. The scope of this study was informed by stakeholders
including city and county staff and elected officials and local regional transportation agencies and the
California High Speed Rail Authority (CHSRA).
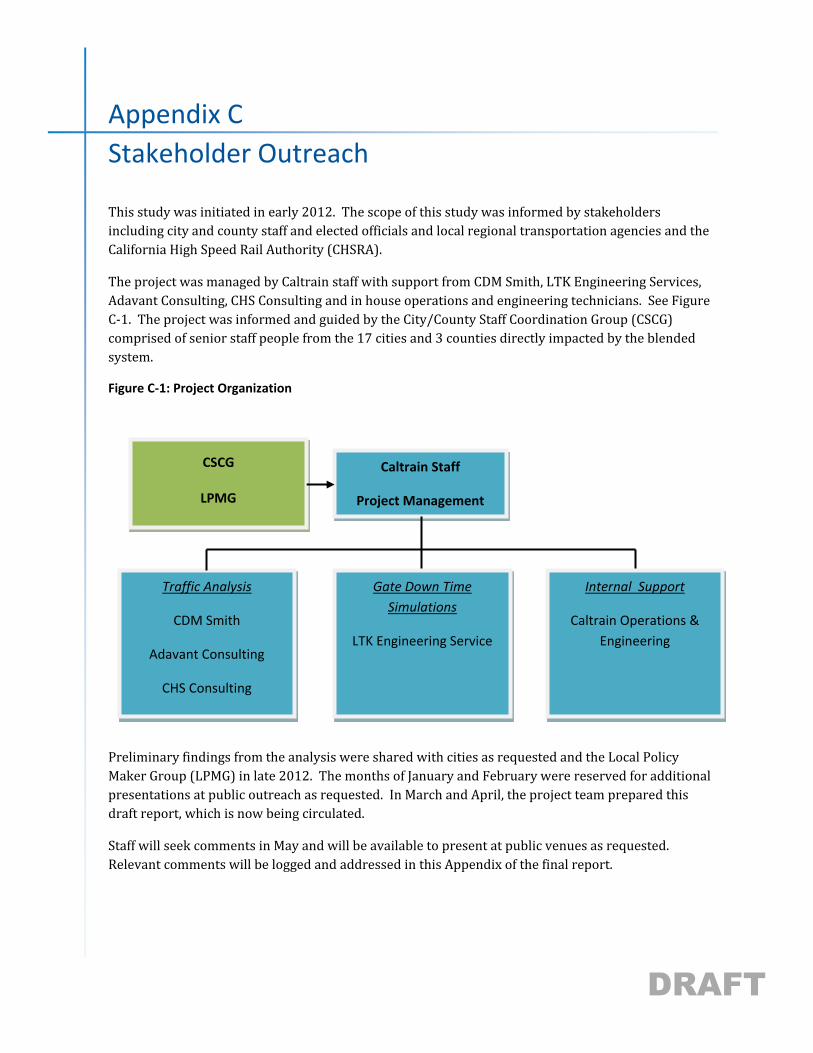
The project was managed by Caltrain staff with support from CDM Smith, LTK Engineering Services,
Adavant Consulting, CHS Consulting and in house operations and engineering technicians. See Figure
C-1. The project was informed and guided by the City/County Staff Coordination Group (CSCG)
comprised of senior staff people from the 17 cities and 3 counties directly impacted by the blended
system.
Figure C-1: Project Organization
Preliminary findings from the analysis were shared with cities as requested and the Local Policy
Maker Group (LPMG) in late 2012. The months of January and February were reserved for additional
presentations at public outreach as requested. In March and April, the project team prepared this
draft report, which is now being circulated.
Staff will seek comments in May and will be available to present at public venues as requested.
Relevant comments will be logged and addressed in this Appendix of the final report.
Caltrain Staff
Project Management
Traffic Analysis
CDM Smith
Adavant Consulting
CHS Consulting
CSCG
LPMG
Gate Down Time
Simulations
LTK Engineering Service
Internal Support
Caltrain Operations &
Engineering
DRAFT
Appendix D
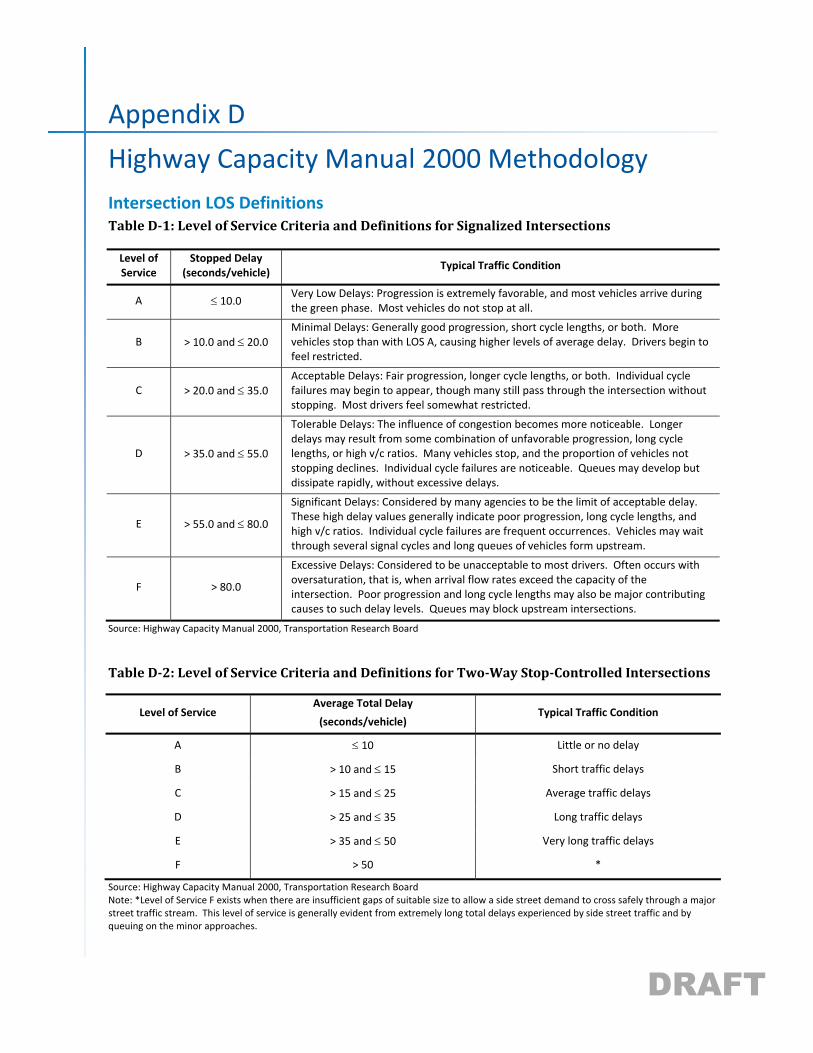
Highway Capacity Manual 2000 Methodology Intersection LOS Definitions Table D1: Level of Service Criteria and Definitions for Signalized Intersections
Level of Service
Stopped Delay (seconds/vehicle)
Typical Traffic Condition
A 10.0 Very Low Delays: Progression is extremely favorable, and most vehicles arrive during the green phase. Most vehicles do not stop at all.
B > 10.0 and 20.0 Minimal Delays: Generally good progression, short cycle lengths, or both. More vehicles stop than with LOS A, causing higher levels of average delay. Drivers begin to feel restricted.
C > 20.0 and 35.0 Acceptable Delays: Fair progression, longer cycle lengths, or both. Individual cycle failures may begin to appear, though many still pass through the intersection without stopping. Most drivers feel somewhat restricted.
D > 35.0 and 55.0
Tolerable Delays: The influence of congestion becomes more noticeable. Longer delays may result from some combination of unfavorable progression, long cycle lengths, or high v/c ratios. Many vehicles stop, and the proportion of vehicles not stopping declines. Individual cycle failures are noticeable. Queues may develop but dissipate rapidly, without excessive delays.
E > 55.0 and 80.0
Significant Delays: Considered by many agencies to be the limit of acceptable delay. These high delay values generally indicate poor progression, long cycle lengths, and high v/c ratios. Individual cycle failures are frequent occurrences. Vehicles may wait through several signal cycles and long queues of vehicles form upstream.
F > 80.0
Excessive Delays: Considered to be unacceptable to most drivers. Often occurs with oversaturation, that is, when arrival flow rates exceed the capacity of the intersection. Poor progression and long cycle lengths may also be major contributing causes to such delay levels. Queues may block upstream intersections.
Source: Highway Capacity Manual 2000, Transportation Research Board
Table D2: Level of Service Criteria and Definitions for TwoWay StopControlled Intersections
Level of Service Average Total Delay
(seconds/vehicle) Typical Traffic Condition
A 10 Little or no delay
B > 10 and 15 Short traffic delays
C > 15 and 25 Average traffic delays
D > 25 and 35 Long traffic delays
E > 35 and 50 Very long traffic delays
F > 50 *
Source: Highway Capacity Manual 2000, Transportation Research Board Note: *Level of Service F exists when there are insufficient gaps of suitable size to allow a side street demand to cross safely through a major street traffic stream. This level of service is generally evident from extremely long total delays experienced by side street traffic and by queuing on the minor approaches.
DRAFT
Appendix D HIGHWAY CAPACITY MANUAL 2000 METHODOLOGY
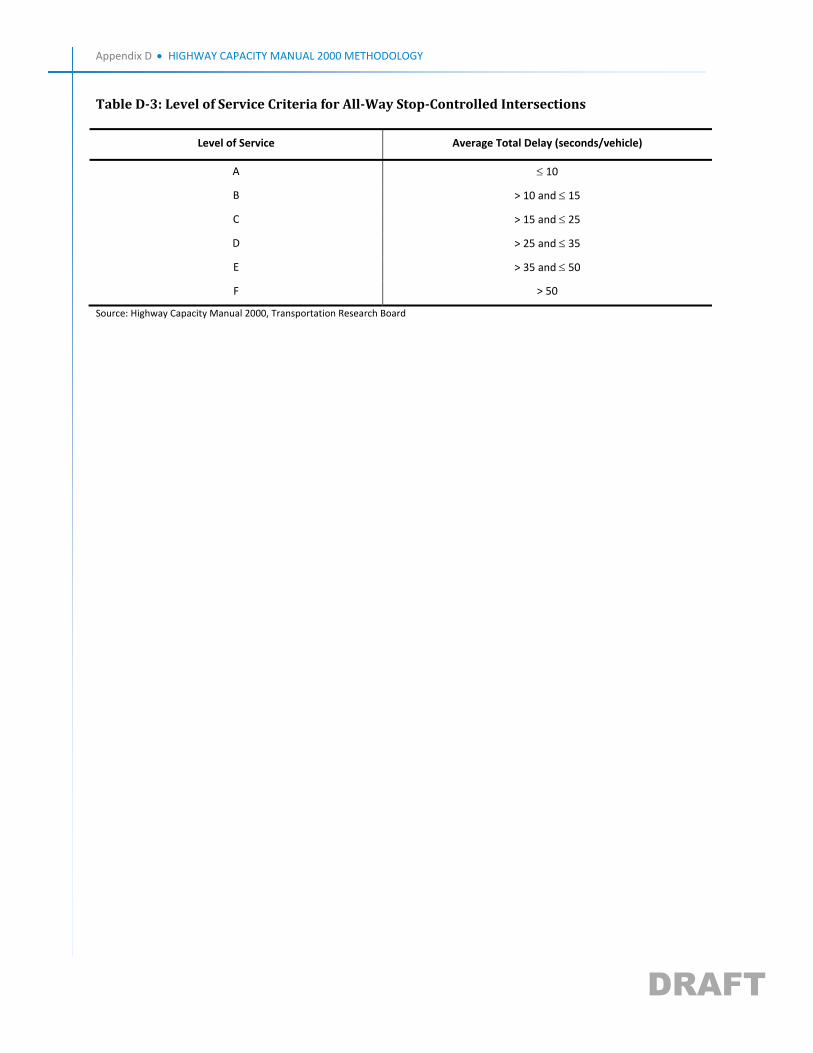
Table D3: Level of Service Criteria for AllWay StopControlled Intersections
Level of Service Average Total Delay (seconds/vehicle)
A 10
B > 10 and 15
C > 15 and 25
D > 25 and 35
E > 35 and 50
F > 50
Source: Highway Capacity Manual 2000, Transportation Research Board
DRAFT
Appendix E-1
Simulated Traffic Methodology
DRAFT
CALTRAIN GRADE CROSSING STUDY Simulated Traffic Methodology _____________________________________________________________________________________
_____________________________________________________________________________________ Page | 1
1. Terminology
An event represents an incidence of gate closure at the railroad crossing. It can be due to one or more trains traveling across the railroad crossing at the same time.
2. Methodology
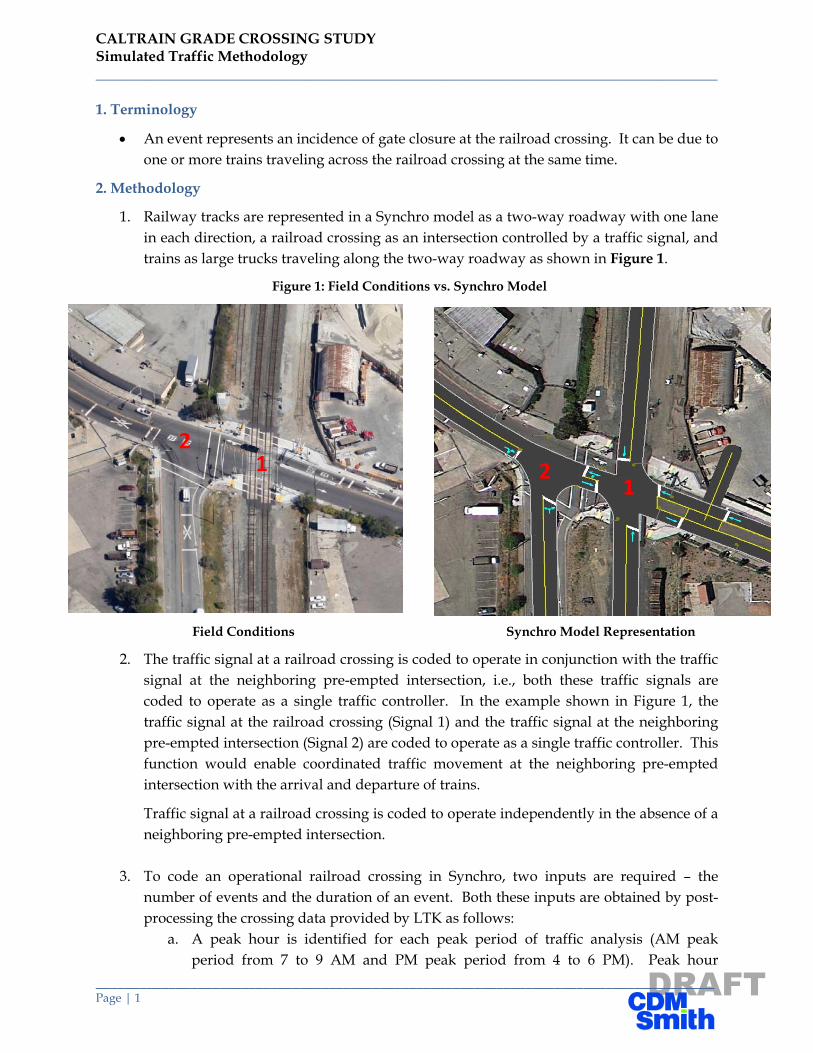
1. Railway tracks are represented in a Synchro model as a two-way roadway with one lane in each direction, a railroad crossing as an intersection controlled by a traffic signal, and trains as large trucks traveling along the two-way roadway as shown in Figure 1.
Figure 1: Field Conditions vs. Synchro Model
Field Conditions Synchro Model Representation
2. The traffic signal at a railroad crossing is coded to operate in conjunction with the traffic signal at the neighboring pre-empted intersection, i.e., both these traffic signals are coded to operate as a single traffic controller. In the example shown in Figure 1, the traffic signal at the railroad crossing (Signal 1) and the traffic signal at the neighboring pre-empted intersection (Signal 2) are coded to operate as a single traffic controller. This function would enable coordinated traffic movement at the neighboring pre-empted intersection with the arrival and departure of trains.
Traffic signal at a railroad crossing is coded to operate independently in the absence of a neighboring pre-empted intersection.
3. To code an operational railroad crossing in Synchro, two inputs are required – the number of events and the duration of an event. Both these inputs are obtained by post-processing the crossing data provided by LTK as follows:
a. A peak hour is identified for each peak period of traffic analysis (AM peak period from 7 to 9 AM and PM peak period from 4 to 6 PM). Peak hour
1 2
21

DRAFT
Simulated Traffic Methodology _____________________________________________________________________________________
_____________________________________________________________________________________ Page | 2
represents the hour within the peak period that has the highest cumulative gate downtime. In the example shown in Figure 2, the peak hour would be from 8 to 9 AM, since it has the highest cumulative gate downtime (429 seconds). The peak hour is identified for each crossing and peak period separately. The number of events and average gate downtime corresponding to the identified peak hour are used as Synchro inputs. Iin the following example, the railroad crossing gate closes nine times in an hour for about 48 seconds each time.
Figure 2: Example for Post-Processing of Crossing Data
AM Peak Period Gates Downtime (s) From To Event Count Cumulative Average
7:00:00 AM 8:00:00 AM 10 388 38.8 7:15:00 AM 8:15:00 AM 10 393 39.3 7:30:00 AM 8:30:00 AM 9 398 44.2 7:45:00 AM 8:45:00 AM 8 386 48.3 8:00:00 AM 9:00:00 AM 9 429 47.7
4. At crossings where advance pre-emption is provided, another dummy signalized intersection is created on the railway tracks upstream of the railroad crossing as shown in Figure 3.
Figure 3: Advance Pre-emption Representation in Synchro Model
2 1
3
4

DRAFT
Simulated Traffic Methodology _____________________________________________________________________________________
_____________________________________________________________________________________ Page | 3
In the example shown in Figure 3, Signal 3 was coded such that when a train starts leaving this signal, the advance pre-emption is activated. The regular pre-emption will be activated when the train starts leaving Signal 1. The advance and regular preemptions will be activated only when a train arrives at Signals 3 and 1. In all other scenarios, Signal 2 would operate normally.
5. To ensure that the number of events and gate downtimes identified from the crossing data are represented properly in the Synchro model, the following additional coding was performed:
a. All trains are coded to travel in one direction. This will avoid two events occurring at the same time in the Synchro model due to two trains crossing the gate, one in either direction at the same time.
b. Another dummy signalized intersection (Signal 4) is created on the railway tracks just upstream of Signal 3. This intersection and its traffic signal are designed in such a way that only one vehicle at a time reaches Signal 3 and in turn Signal 1. Since the number of events can be controlled in Synchro, but not the schedule of events, there may be situations when two or more vehicles travel together along the railway track, which would reduce the number of events occurring in the Synchro model. The device discussed above would avoid those situations.
6. As mentioned in Step 5, the schedule of events cannot be controlled in a Synchro model; vehicles are generated randomly. This is because microsimulation tools utilize algorithms that consider and reflect the interaction of individual vehicles throughout the given roadway network. Microsimulation tools assign probabilities to many of the decisions drivers make on a sub-second level (for example; whether or not to make a lane change) for the purpose of better reflecting the randomness inherent in the field. Random numbers are generated within the microsimulation tool to account for the fact that drivers do not always make the same decisions under the same conditions. As a result, a fixed set of assumptions and known conditions could generate different output results in separate runs.
To account for this, multiple runs using the same assumptions and conditions are performed. Single runs that are not representative of the random nature of these tools will reduce the credibility of the analysis and reduce the acceptance of the results. Therefore, for this project five different runs will be performed for each Synchro model and an average of the five runs will be used to obtain queuing lengths.
DRAFT
Appendix E‐2 Model Validation Results
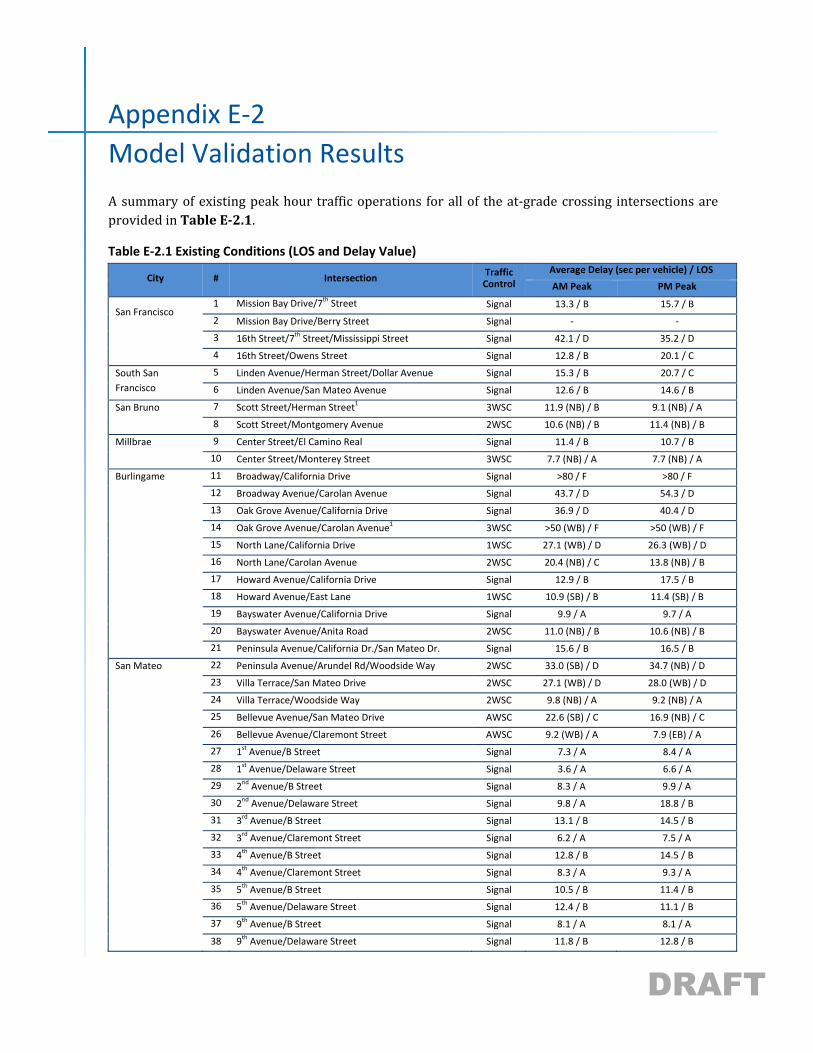
A summary of existing peak hour traffic operations for all of the at‐grade crossing intersections are provided in Table E2.1.
Table E‐2.1 Existing Conditions (LOS and Delay Value)
City # Intersection Traffic Control
Average Delay (sec per vehicle) / LOS
AM Peak PM Peak
San Francisco 1 Mission Bay Drive/7th Street Signal 13.3 / B 15.7 / B
2 Mission Bay Drive/Berry Street Signal ‐ ‐
3 16th Street/7th Street/Mississippi Street Signal 42.1 / D 35.2 / D
4 16th Street/Owens Street Signal 12.8 / B 20.1 / C
South San Francisco
5 Linden Avenue/Herman Street/Dollar Avenue Signal 15.3 / B 20.7 / C
6 Linden Avenue/San Mateo Avenue Signal 12.6 / B 14.6 / B
San Bruno 7 Scott Street/Herman Street1 3WSC 11.9 (NB) / B 9.1 (NB) / A
8 Scott Street/Montgomery Avenue 2WSC 10.6 (NB) / B 11.4 (NB) / B
Millbrae 9 Center Street/El Camino Real Signal 11.4 / B 10.7 / B
10 Center Street/Monterey Street 3WSC 7.7 (NB) / A 7.7 (NB) / A
Burlingame 11 Broadway/California Drive Signal >80 / F >80 / F
12 Broadway Avenue/Carolan Avenue Signal 43.7 / D 54.3 / D
13 Oak Grove Avenue/California Drive Signal 36.9 / D 40.4 / D
14 Oak Grove Avenue/Carolan Avenue1 3WSC >50 (WB) / F >50 (WB) / F
15 North Lane/California Drive 1WSC 27.1 (WB) / D 26.3 (WB) / D
16 North Lane/Carolan Avenue 2WSC 20.4 (NB) / C 13.8 (NB) / B
17 Howard Avenue/California Drive Signal 12.9 / B 17.5 / B
18 Howard Avenue/East Lane 1WSC 10.9 (SB) / B 11.4 (SB) / B
19 Bayswater Avenue/California Drive Signal 9.9 / A 9.7 / A
20 Bayswater Avenue/Anita Road 2WSC 11.0 (NB) / B 10.6 (NB) / B
21 Peninsula Avenue/California Dr./San Mateo Dr. Signal 15.6 / B 16.5 / B
San Mateo 22 Peninsula Avenue/Arundel Rd/Woodside Way 2WSC 33.0 (SB) / D 34.7 (NB) / D
23 Villa Terrace/San Mateo Drive 2WSC 27.1 (WB) / D 28.0 (WB) / D
24 Villa Terrace/Woodside Way 2WSC 9.8 (NB) / A 9.2 (NB) / A
25 Bellevue Avenue/San Mateo Drive AWSC 22.6 (SB) / C 16.9 (NB) / C
26 Bellevue Avenue/Claremont Street AWSC 9.2 (WB) / A 7.9 (EB) / A
27 1st Avenue/B Street Signal 7.3 / A 8.4 / A
28 1st Avenue/Delaware Street Signal 3.6 / A 6.6 / A
29 2nd Avenue/B Street Signal 8.3 / A 9.9 / A
30 2nd Avenue/Delaware Street Signal 9.8 / A 18.8 / B
31 3rd Avenue/B Street Signal 13.1 / B 14.5 / B
32 3rd Avenue/Claremont Street Signal 6.2 / A 7.5 / A
33 4th Avenue/B Street Signal 12.8 / B 14.5 / B
34 4th Avenue/Claremont Street Signal 8.3 / A 9.3 / A
35 5th Avenue/B Street Signal 10.5 / B 11.4 / B
36 5th Avenue/Delaware Street Signal 12.4 / B 11.1 / B
37 9th Avenue/B Street Signal 8.1 / A 8.1 / A
38 9th Avenue/Delaware Street Signal 11.8 / B 12.8 / B
DRAFT
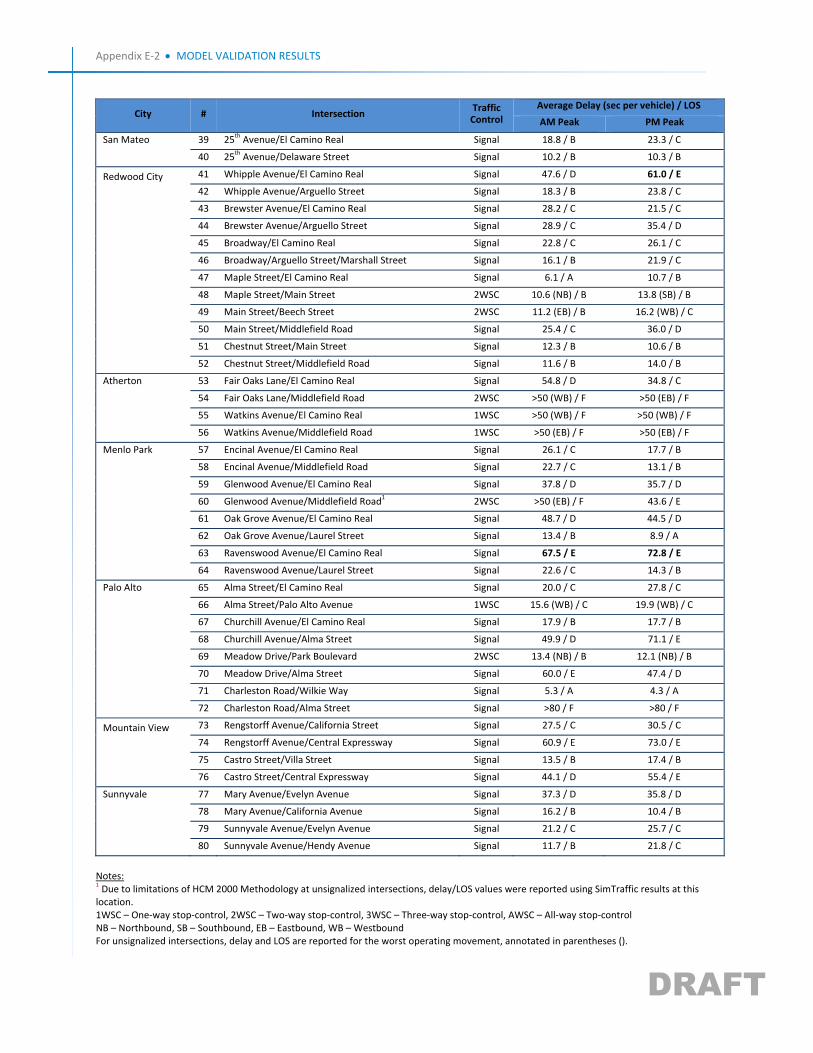
Appendix E‐2 MODEL VALIDATION RESULTS
City # Intersection Traffic Control
Average Delay (sec per vehicle) / LOS
AM Peak PM Peak
San Mateo 39 25th Avenue/El Camino Real Signal 18.8 / B 23.3 / C
40 25th Avenue/Delaware Street Signal 10.2 / B 10.3 / B
Redwood City 41 Whipple Avenue/El Camino Real Signal 47.6 / D 61.0 / E
42 Whipple Avenue/Arguello Street Signal 18.3 / B 23.8 / C
43 Brewster Avenue/El Camino Real Signal 28.2 / C 21.5 / C
44 Brewster Avenue/Arguello Street Signal 28.9 / C 35.4 / D
45 Broadway/El Camino Real Signal 22.8 / C 26.1 / C
46 Broadway/Arguello Street/Marshall Street Signal 16.1 / B 21.9 / C
47 Maple Street/El Camino Real Signal 6.1 / A 10.7 / B
48 Maple Street/Main Street 2WSC 10.6 (NB) / B 13.8 (SB) / B
49 Main Street/Beech Street 2WSC 11.2 (EB) / B 16.2 (WB) / C
50 Main Street/Middlefield Road Signal 25.4 / C 36.0 / D
51 Chestnut Street/Main Street Signal 12.3 / B 10.6 / B
52 Chestnut Street/Middlefield Road Signal 11.6 / B 14.0 / B
Atherton 53 Fair Oaks Lane/El Camino Real Signal 54.8 / D 34.8 / C
54 Fair Oaks Lane/Middlefield Road 2WSC >50 (WB) / F >50 (EB) / F
55 Watkins Avenue/El Camino Real 1WSC >50 (WB) / F >50 (WB) / F
56 Watkins Avenue/Middlefield Road 1WSC >50 (EB) / F >50 (EB) / F
Menlo Park 57 Encinal Avenue/El Camino Real Signal 26.1 / C 17.7 / B
58 Encinal Avenue/Middlefield Road Signal 22.7 / C 13.1 / B
59 Glenwood Avenue/El Camino Real Signal 37.8 / D 35.7 / D
60 Glenwood Avenue/Middlefield Road12WSC >50 (EB) / F 43.6 / E
61 Oak Grove Avenue/El Camino Real Signal 48.7 / D 44.5 / D
62 Oak Grove Avenue/Laurel Street Signal 13.4 / B 8.9 / A
63 Ravenswood Avenue/El Camino Real Signal 67.5 / E 72.8 / E
64 Ravenswood Avenue/Laurel Street Signal 22.6 / C 14.3 / B
Palo Alto 65 Alma Street/El Camino Real Signal 20.0 / C 27.8 / C
66 Alma Street/Palo Alto Avenue 1WSC 15.6 (WB) / C 19.9 (WB) / C
67 Churchill Avenue/El Camino Real Signal 17.9 / B 17.7 / B
68 Churchill Avenue/Alma Street Signal 49.9 / D 71.1 / E
69 Meadow Drive/Park Boulevard 2WSC 13.4 (NB) / B 12.1 (NB) / B
70 Meadow Drive/Alma Street Signal 60.0 / E 47.4 / D
71 Charleston Road/Wilkie Way Signal 5.3 / A 4.3 / A
72 Charleston Road/Alma Street Signal >80 / F >80 / F
Mountain View 73 Rengstorff Avenue/California Street Signal 27.5 / C 30.5 / C
74 Rengstorff Avenue/Central Expressway Signal 60.9 / E 73.0 / E
75 Castro Street/Villa Street Signal 13.5 / B 17.4 / B
76 Castro Street/Central Expressway Signal 44.1 / D 55.4 / E
Sunnyvale 77 Mary Avenue/Evelyn Avenue Signal 37.3 / D 35.8 / D
78 Mary Avenue/California Avenue Signal 16.2 / B 10.4 / B
79 Sunnyvale Avenue/Evelyn Avenue Signal 21.2 / C 25.7 / C
80 Sunnyvale Avenue/Hendy Avenue Signal 11.7 / B 21.8 / C
Notes: 1 Due to limitations of HCM 2000 Methodology at unsignalized intersections, delay/LOS values were reported using SimTraffic results at this location. 1WSC – One‐way stop‐control, 2WSC – Two‐way stop‐control, 3WSC – Three‐way stop‐control, AWSC – All‐way stop‐control NB – Northbound, SB – Southbound, EB – Eastbound, WB – Westbound For unsignalized intersections, delay and LOS are reported for the worst operating movement, annotated in parentheses ().
DRAFT
Appendix E‐2 MODEL VALIDATION RESULTS
To validate the model simulation of existing conditions, the LOS and delay values reported in Table E‐2.1 were compared to those provided by the cities, wherever available. The LOS and delay values provided by the cities were obtained from recently completed transportation studies and environmental impact reports. Of the 80 study intersections, city‐provided data was available for 25 intersections.
In general, the LOS and delay values presented in this report were similar to those provided by the cities. There were differences in the AM or PM delay values by 20 percent or more at five intersections:
Whipple Avenue/El Camino Real
Broadway/Arguello Street/Marshall Street
Churchill Avenue/Alma Street
Meadow Drive/Alma Street
Charleston Road/Alma Street
Possible reasons for the discrepancy range from differences in traffic volumes to differences in analysis tools.
DRAFT
Appendix E-3
HCM Results

DRAFT
CALTRAIN GRADE CROSSING & TRAFFIC STUDYHCM LOS and Delay Values
AUGUST 24, 2012Intersection Operations - 2035 Conditions
City # Intersection Delay LOS Delay LOS Delay LOS Delay LOS Delay LOS Delay LOS Delay LOS Delay LOS Delay LOS Delay LOS
San Francisco1 3 16th Street/7th Street/Mississippi Street Signal 41.7 D 35.2 D 224.4 F 283.6 F 227.1 F 256.4 F 231.3 F 238.0 F 231.3 F 240.9 F
39 25th Avenue/El Camino Real Signal 18.8 B 23.3 C 171.1 F 74.7 E 171.1 F 74.7 E 171.1 F 74.7 E 171.1 F 74.7 E
40 25th Avenue/Delaware Street Signal 10.2 B 10.3 B 12.4 B 13.1 B 12.5 B 15.0 B 13.1 B 15.6 B 13.1 B 15.6 B
Redwood City2 45 Broadway/El Camino Real Signal 22.8 C 26.1 C 47.9 D 61.5 E 47.9 D 61.5 E 47.9 D 61.5 E 47.9 D 61.5 E
Palo Alto 68 Churchill Avenue/Alma Street Signal 49.9 D 71.1 E 103.2 F 132.5 F 107.4 F 132.5 F 108.6 F 134.1 F 117.0 F 138.6 F
Notes:Synchro (HCM) outputs represent static results, which do not consider the effect of neighboring traffic operations on the operations of the study intersection.Bold represents LOS E or LOS F.1. 2035 No Build values are higher than those obtained from the UCSF Facility Office Building Traffic Analysis (LOS D during the PM peak hour), since the UCSF analysis was performed using TRAFFIX analysis tool and did not consider the effect of the railroad crossing on the intersection operations.2. 2035 No Build values are higher than those obtained from the Redwood City Downtown Precise Plan EIR (LOS C during both the AM and PM peak hours), since the cumulative year for both the studies are different. Also, the Downtown analysis was performed using TRAFFIX analysis tool.
AM PM
San Mateo
2035 6/4AM PM AM PM AM PM AM PMTraffic
Control
2035 No Build 2035 6/0 2035 6/2Existing
Page 1 of 1
DRAFT
CALTRAIN GRADE CROSSING & TRAFFIC STUDY NOVEMBER 02, 2012Grade Separation Analysis - HCM LOS and Delay Values
Intersection Operations - 2035 Conditions (Grade-Separated Rail Crossings)
City # Intersection Delay LOS Delay LOS Delay LOS Delay LOS Delay LOS Delay LOS
39 25th Avenue/El Camino Real Signal 18.8 B 23.3 C 171.1 F 74.7 E 171.1 F 74.7 E
40 25th Avenue/Delaware Street Signal 10.2 B 10.3 B 12.4 B 13.1 B 7.3 A 8.1 A
Redwood City 45 Broadway/El Camino Real Signal 22.8 C 26.1 C 47.9 D 61.5 E 46.5 D 61.4 E
Notes:Synchro (HCM) outputs represent static results, which do not consider the effect of neighboring traffic operations on the operations of the study intersection.Bold represents LOS E or LOS F.
AM2035 Build (Grade-Separated Crossing)
AM PM2035 No Build (At-Grade Crossing)
AM PMPMExisting
San Mateo
Traffic Control
Page 1 of 1

DRAFT
Appendix F
Gate Down Time Sensitivity
Detailed review of the gate down time simulation results for the simulated operating plans revealed
insights into the factors that contribute to increases and decreases in gate down time at individual
crossings. One of the more sensitive factors is the train schedule.
To analyze the level of gate down time sensitivity to a particular schedule, an alternative schedule was
tested for the “6/0” scenario. The baseline “6/0” scenario schedule is a “skip stop” zone express trains
per peak hour per direction. The alternative plan utilized a Baby Bullet type operation, with 2 “super
express” trains per hour per direction and 4 “skip stop” trains per hour. While the overall train
volume was the same, the number of trains stopping at some individual stations on the Caltrain
Corridor differed between the two operating plans.
Tables F-1 and F-2 show a sample hour of the the northbound AM Caltrain schedules simulated for the
sensitivity test. Table F-1 shows the baseline “6/0” scenario and Table F-2 shows the alternative
(Baby Bullet) plan.
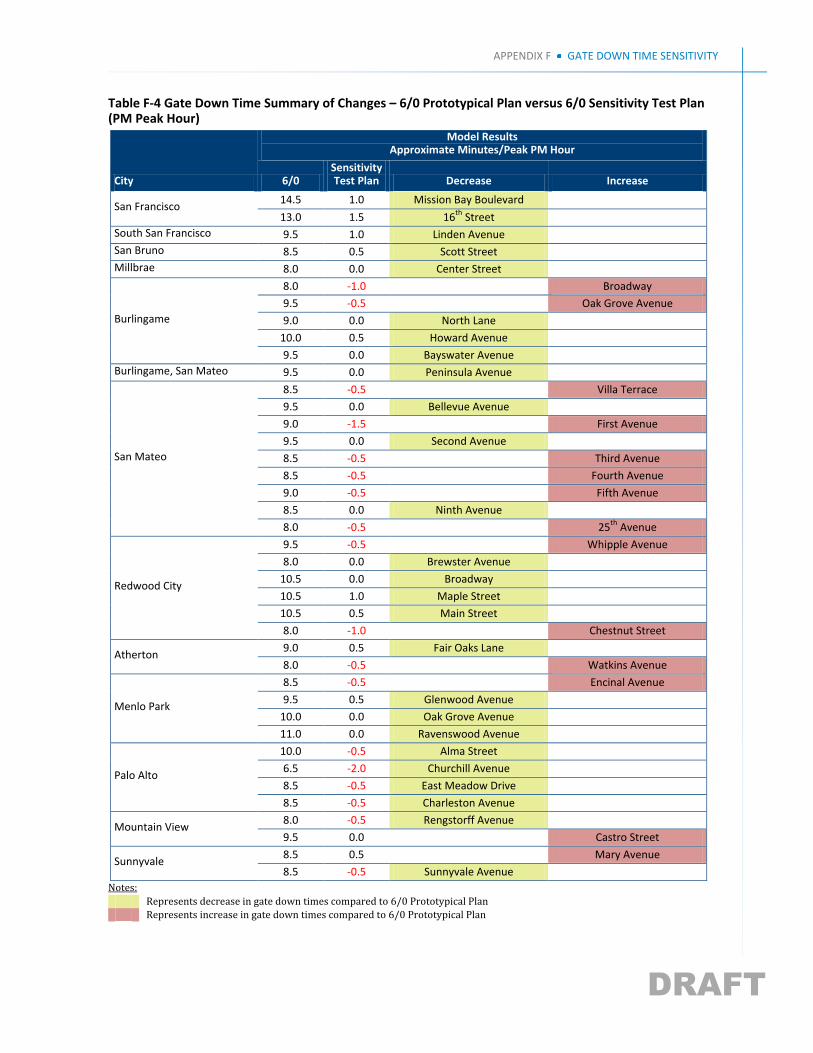
Comparing the simulated gate down times of the two prototypical future Caltrain operating plans, the
total duration of gate down time within the Caltrain corridor during the morning peak hour was
similar (6 hours and 18 minutes for the baseline versus 6 hours and 24 minutes for the alternative
schedule).
This system wide gate down time difference of six minutes reflects a difference of about 2%.
However, individual crossing gate down times showed more significant variability between the two
operating plans. For example, the 16th Street crossing in San Francisco dropped by one minute from
approximately 14.5 minutes under the baseline to 13.5 minutes under the alternative schedule, a
decrease of 13 percent. At the Churchill Avenue crossing in Palo Alto, there was an increase of 13
percent under the alternative compared to the baseline schedule.
Tables F-3 and F-4 show a comparison between the baseline and alternative schedule gate down times
for the morning and evening peak hours.
DRAFT
Appendix F GATE DOWN TIME SENSITIVITY
Table F-1 Northbound Caltrain 6/0 Baseline Plan (AM Peak Hour)
Station Train Number
416 418 420 422 424 426
Tamien Station 7:02a 7:32a
San Jose Diridon Station 7:00a 7:10a 7:20a 7:30a 7:40a 7:50a
College Park Station1
Santa Clara Station 7:05a 7:35a
Lawrence Station 7:18a 7:48a
Sunnyvale Station 7:11a 7:21a 7:30a 7:41a 7:51a 8:00a
Mountain View Station 7:16a 7:26a 7:35a 7:46a 7:56a 8:05a
San Antonio Station 7:38a 8:08a
California Ave. Station 7:21a 7:51a
Palo Alto Station 7:25a 7:34a 7:44a 7:55a 8:04a 8:14a
Menlo Park Station 7:36a 7:46a 8:06a 8:16a
Atherton Station 7:28a
Redwood City Station 7:32a 7:43a 7:51a 8:01a 8:13a 8:21a
San Carlos Station 7:54a 8:24a
Belmont Station 7:47a 8:17a
Hillsdale Station 7:39a 7:50a 7:58a 8:08a 8:20a 8:28a
Hayward Park Station 8:00a
San Mateo Station 7:42a 7:53a 8:11a 8:23a
Burlingame Station 7:56a 8:26a
Broadway Station 8:15a
Millbrae Station 7:50a 8:01a 8:08a 8:19a 8:31a 8:37a
San Bruno Station 8:12a 8:41a
South SF Station 7:57a 8:26a
Bayshore Station 8:45a
22nd Street Station 8:19a
4th & King Station 8:04a 8:14a 8:23a 8:33a 8:44a 8:52a
Notes: 1Schedule to be determined
DRAFT
APPENDIX F GATE DOWN TIME SENSITIVITY
Table F-2 Northbound Caltrain 6/0 Alternative (Baby Bullet) Plan (AM Peak Hour)
Station
Train Number
416 418 420 Baby
Bullet 424
Baby
Bullet
Tamien Station 12:00 AM 7:03 AM 12:00 AM 7:24 AM 7:32 AM 12:00 AM
San Jose Diridon Station 7:00 AM 7:11 AM 7:18 AM 7:32 AM 7:40 AM 7:55 AM
College Park Station1
Santa Clara Station 7:04 AM
Lawrence Station 7:11 AM 7:40 AM
Sunnyvale Station 7:09 AM 7:15 AM 7:27 AM 7:41 AM 7:44 AM 8:04 AM
Mountain View Station 7:12 AM 7:18 AM 7:30 AM 7:47 AM
San Antonio Station 7:33 AM
California Ave. Station 7:19 AM
Palo Alto Station 7:20 AM 7:28 AM 7:38 AM 7:50 AM 7:57 AM 8:13 AM
Menlo Park Station 7:30 AM 7:41 AM 7:59 AM
Atherton Station 7:25 AM
Redwood City Station 7:27 AM 7:36 AM 7:46 AM 7:56 AM 8:05 AM
San Carlos Station 7:49 AM
Belmont Station 7:41 AM 8:10 AM
Hillsdale Station 7:33 AM 7:44 AM 7:52 AM 8:13 AM 8:23 AM
Hayward Park Station 7:55 AM
San Mateo Station 7:37 AM 7:49 AM 8:04 AM 8:18 AM
Burlingame Station 7:51 AM 8:20 AM
Broadway Station
Millbrae Station 7:42 AM 7:55 AM 8:00 AM 8:09 AM 8:24 AM 8:30 AM
San Bruno Station 8:04 AM
South SF Station 7:47 AM
Bayshore Station
22nd Street Station 8:13 AM
4th & King Station 8:02 AM 8:12 AM 8:20 AM 8:26 AM 8:41 AM 8:47 AM
Notes: 1Schedule to be determined

DRAFT
Appendix F GATE DOWN TIME SENSITIVITY
Table F-3 Gate Down Time Summary of Changes – 6/0 Prototypical Plan versus 6/0 Sensitivity Test Plan (AM Peak Hour)
City
Model Results Approximate Minutes/Peak AM Hour
6/0 Sensitivity Test Plan Decrease Increase
San Francisco 14.5 -1.0 Mission Bay Boulevard
12.5 -1.0 16th Street
South San Francisco 10.0 -0.5 Linden Avenue
San Bruno 9.0 -1.0 Scott Street
Millbrae 8.5 1.0 Center Street
Burlingame
9.0 -0.5 Broadway
10.0 0.5 Oak Grove Avenue
9.5 0.0 North Lane
10.5 0.0 Howard Avenue
10.0 0.0 Bayswater Avenue
Burlingame, San Mateo 10.0 0.0 Peninsula Avenue
San Mateo
8.5 0.5 Villa Terrace
9.5 0.5 Bellevue Avenue
9.0 1.0 First Avenue
9.5 -0.5 Second Avenue
8.5 0.0 Third Avenue
8.5 0.0 Fourth Avenue
8.5 0.5 Fifth Avenue
8.0 1.0 Ninth Avenue
9.0 -1.0 25th Avenue
Redwood City
9.0 1.0 Whipple Avenue
8.5 0.0 Brewster Avenue
11.0 0.5 Broadway
10.0 0.5 Maple Street
10.5 0.0 Main Street
9.0 0.0 Chestnut Street
Atherton 9.0 1.0 Fair Oaks Lane (restored
service) 8.5 1.0 Watkins Avenue
Menlo Park
8.5 1.0 Encinal Avenue
9.5 0.5 Glenwood Avenue
9.5 1.0 Oak Grove Avenue
11.0 -1.0 Ravenswood Avenue
Palo Alto
10.0 0.5 Alma Street
8.0 1.0 Churchill Avenue
8.5 -0.5 East Meadow Drive
9.0 -0.5 Charleston Avenue
Mountain View 8.5 0.5 Rengstorff Avenue
10.0 0.0 Castro Street
Sunnyvale 8.5 0.5 Mary Avenue
9.0 0.5 Sunnyvale Avenue
Notes:
Represents decrease in gate down times compared to 6/0 Prototypical Plan
Represents increase in gate down times compared to 6/0 Prototypical Plan
DRAFT
APPENDIX F GATE DOWN TIME SENSITIVITY
Table F-4 Gate Down Time Summary of Changes – 6/0 Prototypical Plan versus 6/0 Sensitivity Test Plan (PM Peak Hour)
City
Model Results Approximate Minutes/Peak PM Hour
6/0 Sensitivity Test Plan Decrease Increase
San Francisco 14.5 1.0 Mission Bay Boulevard
13.0 1.5 16th Street
South San Francisco 9.5 1.0 Linden Avenue
San Bruno 8.5 0.5 Scott Street
Millbrae 8.0 0.0 Center Street
Burlingame
8.0 -1.0
Broadway
9.5 -0.5
Oak Grove Avenue
9.0 0.0 North Lane
10.0 0.5 Howard Avenue
9.5 0.0 Bayswater Avenue
Burlingame, San Mateo 9.5 0.0 Peninsula Avenue
San Mateo
8.5 -0.5
Villa Terrace
9.5 0.0 Bellevue Avenue
9.0 -1.5
First Avenue
9.5 0.0 Second Avenue
8.5 -0.5
Third Avenue
8.5 -0.5
Fourth Avenue
9.0 -0.5
Fifth Avenue
8.5 0.0 Ninth Avenue
8.0 -0.5
25th Avenue
Redwood City
9.5 -0.5
Whipple Avenue
8.0 0.0 Brewster Avenue
10.5 0.0 Broadway
10.5 1.0 Maple Street
10.5 0.5 Main Street
8.0 -1.0
Chestnut Street
Atherton 9.0 0.5 Fair Oaks Lane
8.0 -0.5
Watkins Avenue
Menlo Park
8.5 -0.5
Encinal Avenue
9.5 0.5 Glenwood Avenue
10.0 0.0 Oak Grove Avenue
11.0 0.0 Ravenswood Avenue
Palo Alto
10.0 -0.5 Alma Street
6.5 -2.0 Churchill Avenue
8.5 -0.5 East Meadow Drive
8.5 -0.5 Charleston Avenue
Mountain View 8.0 -0.5 Rengstorff Avenue
9.5 0.0
Castro Street
Sunnyvale 8.5 0.5
Mary Avenue
8.5 -0.5 Sunnyvale Avenue
Notes:
Represents decrease in gate down times compared to 6/0 Prototypical Plan
Represents increase in gate down times compared to 6/0 Prototypical Plan