cincinnati parkscore
TRANSCRIPT

8/15/2019 Cincinnati ParkScore
http://slidepdf.com/reader/full/cincinnati-parkscore 1/2
8
9
264
25
52
42
127
27
22
50
75
471
71
275
74
Density Individuals in
Density of Youth Age
Population Density -
Level of Park Need
Very highHighModerate
Parks with public access
Other parks and open space
Half-mile park service areas
Cemetery
University
Industrial
Vacant zero population areas
Waterbodies
County boundary
Level of Park
Need
Very highHighModerate
Level of Park
Need
Very highHighModerate
0 1 2 3Miles
The Trust for Public Land 2016 ParkScore index®
8/15/2019 Cincinnati ParkScore
http://slidepdf.com/reader/full/cincinnati-parkscore 2/2
The Trust for Public Land 2016 ParkScore index®
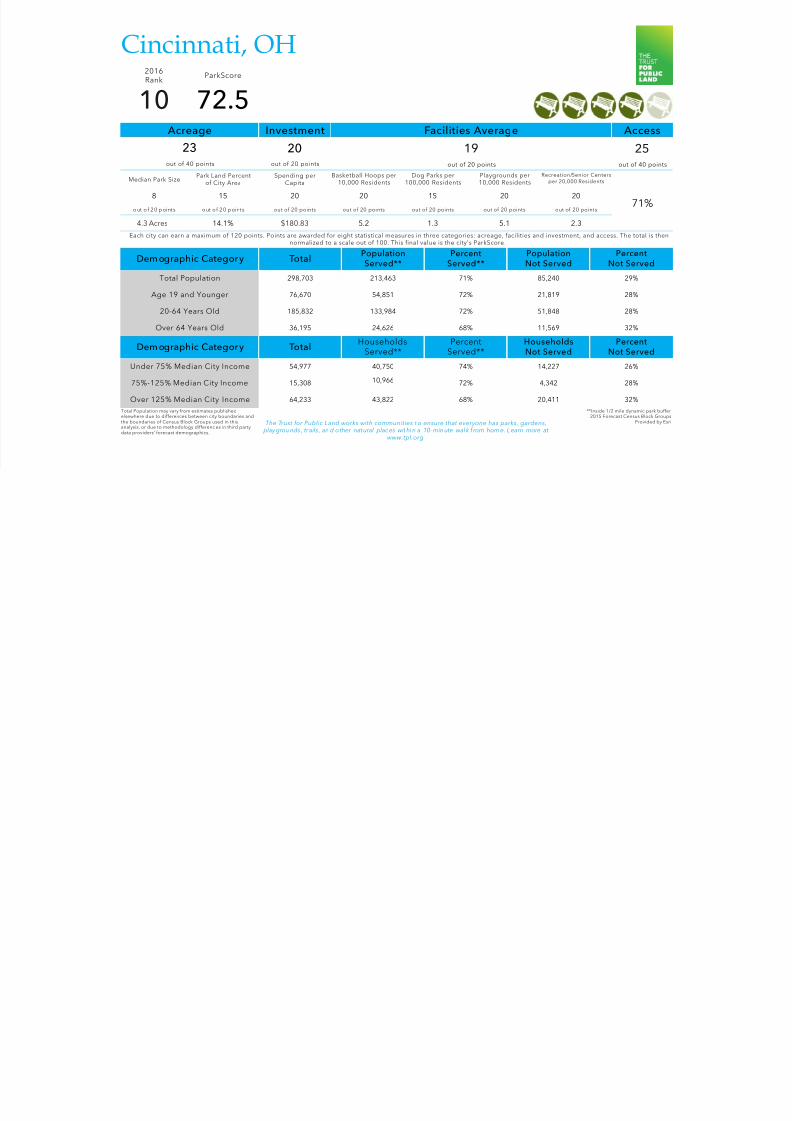
Acreage
23
10 72.5Facilities Average Access
25
Investment
20 19
Demographic Categor y Total Population
Served**Percent
Served**PopulationNot Served
PercentNot Served
Demographic Categor y Total
HouseholdsNot Served
PercentNot Served
Cincinnati, OH
The Trust for Public Land works with communities t o ensure that everyone has parks, gardens, play grou nds , tr ails , an d o ther nat ural plac es wit hin a 10- minute wal k f rom hom e. L earn more at www.tpl.org