clleea ar rwwatteer rriivveerr diissssool lvveedd ... river... · clleea ar rwwatteer rriivveerr...
TRANSCRIPT
CClleeaarrwwaatteerr RRiivveerr
DDiissssoollvveedd OOxxyyggeenn aanndd FFeeccaall CCoolliiffoorrmm
TTMMDDLL PPrroojjeecctt
QQuuaalliittyy AAssssuurraannccee PPrroojjeecctt PPllaann
RReevviissiioonn 00
OOccttoobbeerr 22000077
PPrreeppaarreedd ffoorr::
RReedd LLaakkee WWaatteerrsshheedd DDiissttrriicctt
110011 NNoorrtthh TThhiirrdd SSttrreeeett
TThhiieeff RRiivveerr FFaallllss,, MMNN 5566770011
PPrreeppaarreedd bbyy::
RRooggeerr FFiisshheerr
WWQQ QQAA//QQCC CCoooorrddiinnaattoorr
PPeerrffoorrmmaannccee MMaannaaggeemmeenntt && QQuuaalliittyy UUnniitt
EEnnvviirroonnmmeennttaall AAnnaallyyssiiss && OOuuttccoommeess DDiivviissiioonn
MMiinnnneessoottaa PPoolllluuttiioonn CCoonnttrrooll AAggeennccyy
552200 LLaaffaayyeettttee RRooaadd NNoorrtthh
SStt.. PPaauull,, MMiinnnneessoottaa 5555115555--44119944

Clearwater River Dissolved Oxygen and Fecal Coliform TMDL Project QAPP
Revision 0
October 4, 2007
Page 2 of 50

Clearwater River Dissolved Oxygen and Fecal Coliform TMDL Project QAPP
Revision 0
October 4, 2007
Page 3 of 50
A1. APPROVAL SIGNATURE PAGE
By their signatures below the undersigned attest that they are familiar with the requirements of
this document and agree to fulfill their responsibilities as specified herein.
_____________________________________________ __________________
Corey Hanson, Water Quality Coordinator, Red Lake WD Date
_____________________________________________ __________________
Lisa Scheirer, Project Manager, MPCA Date
_____________________________________________ __________________
Roger Fisher, WQ QA/QC Coordinator, MPCA Date

Clearwater River Dissolved Oxygen and Fecal Coliform TMDL Project QAPP
Revision 0
October 4, 2007
Page 4 of 50
A2. TABLE OF CONTENTS GROUP A – PROJECT MANAGEMENT
A1 APPROVAL SIGNATURE PAGE..................................................................................................... 3 A2 TABLE OF CONTENTS .................................................................................................................... 4
A3 DISTRIBUTION LIST ....................................................................................................................... 7 A4 PROJECT ORGANIZATION ............................................................................................................ 7 A5 PROBLEM DEFINITION/BACKGROUND .................................................................................... 7 A6 PROJECT DESCRIPTION ................................................................................................................ 8 A7 QUALITY OBJECTIVES AND CRITERIA ................................................................................... 10 A8 SPECIAL TRAINING/CERTIFICATIONS .................................................................................... 12 A9 DOCUMENTATION AND RECORDS .......................................................................................... 13
GROUP B – MEASUREMENT/DATA ACQUISITION
B1 SAMPLING PROCESS DESIGN .................................................................................................... 13 B2 SAMPLING METHODS ................................................................................................................. 13 B3 SAMPLE-HANDLING AND CUSTODY ...................................................................................... 15 B4 ANALYTICAL METHODS ........................................................................................................... .16 B5 QUALITY CONTROL .................................................................................................................... 17 B6 INSTRUMENT/EQUIPMENT TESTING, INSPECTION, AND MAINTENANCE .................... 17 B7 INSTRUMENT/EQUIPMENT CALIBRATION AND FREQUENCY .......................................... 18 B8 INSPECTION/ACCEPTANCE FOR SUPPLIES AND CONSUMABLES ................................... 18 B9 NON-DIRECT MEASUREMENTS ................................................................................................ 18 B10 DATA MANAGEMENT ................................................................................................................. 18
GROUP C – ASSESSMENT/OVERSIGHT
C1 ASSESSMENT AND RESPONSE ACTIONS ................................................................................ 18 C2 REPORTS TO MANAGEMENT .................................................................................................... 19
GROUP D – DATA VALIDATION AND USABILITY19
D1 DATA REVIEW, VERIFICATION AND VALIDATION ............................................................. 19 D2 VERIFICATION AND VALIDATION METHODS ...................................................................... 20 D3 RECONCILIATION WITH USER REQUIREMENTS .................................................................. 20

Clearwater River Dissolved Oxygen and Fecal Coliform TMDL Project QAPP
Revision 0
October 4, 2007
Page 5 of 50
Tables Table 1 Acronyms and Abbreviations 6
Table 2 Clearwater River DO and Fecal Coliform TMDL Project QAPP Distribution List 7
Table 3 Clearwater River DO and Fecal Coliform TMDL Project Personnel 7
Table 4 Clearwater River DO and Fecal Coliform TMDL Project Impaired Reaches 8
Table 5a Clearwater River DO and Fecal Coliform TMDL Project Milestone Schedule - 2007 9
Table 5b Clearwater River DO and Fecal Coliform TMDL Project Milestone Schedule – 2008 9
Table 6 Laboratory and Field Measurement Parameter Objectives 10
Table 7 RMB Environmental Laboratories, Inc., Analytical Parameter 12
Table 8 RMB Environmental Laboratories, Inc., Sample Analysis Method 16
Table 9 Oxygen Solubility Table 29
Table 10 Specific Conductance Calibration Table 34
Table 11 Stabilization Criteria for Recording Field Measurements 37
Table 12 RLWD Field Data Sheet 2007 – 2008 40
Table 13 Continuous Monitoring Data Grades 45
Standard Operating Procedures (SOPs)
Appendix A Hand Collected (Grab) Sampling 21
Appendix B QA Field Sampling Procedures 22
Appendix C pH Measurement 25
Appendix D Bacteria Sampling 27
Appendix E Temperature Measurement 30
Appendix F Specific Conductance Field Measurement 33
Appendix G The Field Notebook 35
Appendix H Portable Multiprobe Calibration Log 42
Appendix I Deployed Sonde Maintenance and Calibration Log 44
Appendix J Long-Term Sonde Storage 46
Appendix K Sampling from a Bridge 48
Clearwater River Dissolved Oxygen and Fecal Coliform TMDL Project QAPP
Revision 0
October 4, 2007
Page 6 of 50
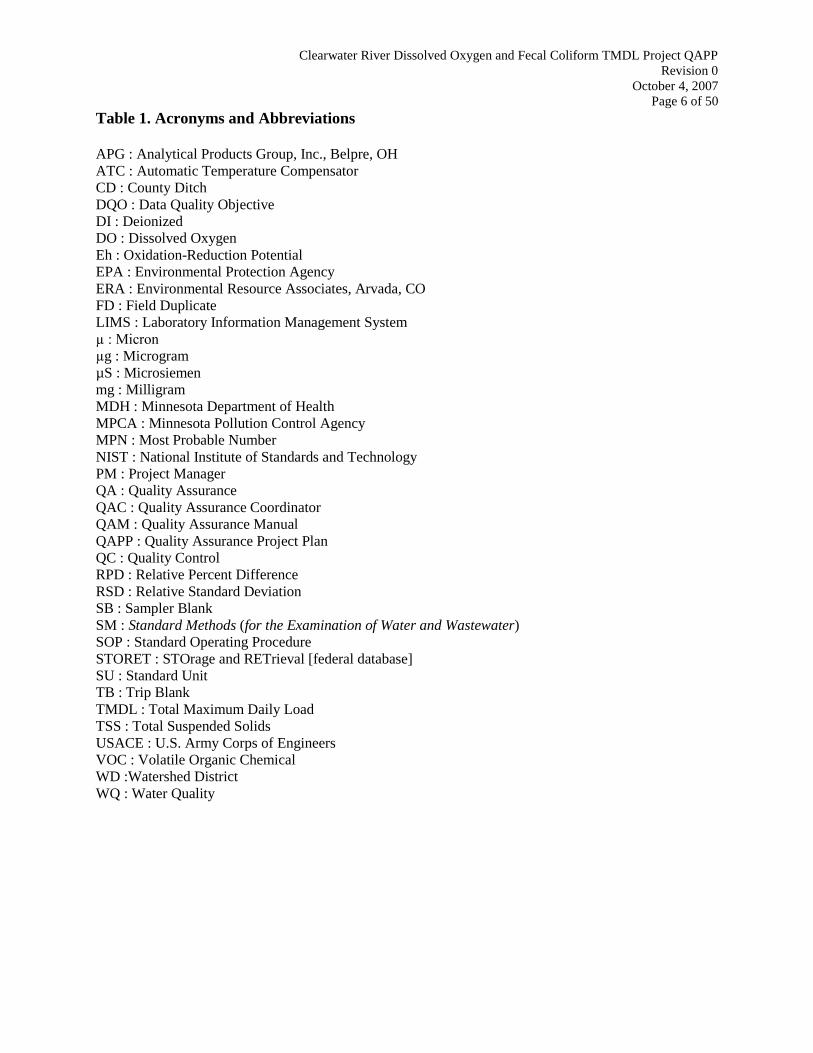
Table 1. Acronyms and Abbreviations
APG : Analytical Products Group, Inc., Belpre, OH
ATC : Automatic Temperature Compensator
CD : County Ditch
DQO : Data Quality Objective
DI : Deionized
DO : Dissolved Oxygen
Eh : Oxidation-Reduction Potential
EPA : Environmental Protection Agency
ERA : Environmental Resource Associates, Arvada, CO
FD : Field Duplicate
LIMS : Laboratory Information Management System
µ : Micron
µg : Microgram
µS : Microsiemen
mg : Milligram
MDH : Minnesota Department of Health
MPCA : Minnesota Pollution Control Agency
MPN : Most Probable Number
NIST : National Institute of Standards and Technology
PM : Project Manager
QA : Quality Assurance
QAC : Quality Assurance Coordinator
QAM : Quality Assurance Manual
QAPP : Quality Assurance Project Plan
QC : Quality Control
RPD : Relative Percent Difference
RSD : Relative Standard Deviation
SB : Sampler Blank
SM : Standard Methods (for the Examination of Water and Wastewater)
SOP : Standard Operating Procedure
STORET : STOrage and RETrieval [federal database]
SU : Standard Unit
TB : Trip Blank
TMDL : Total Maximum Daily Load
TSS : Total Suspended Solids
USACE : U.S. Army Corps of Engineers
VOC : Volatile Organic Chemical
WD :Watershed District
WQ : Water Quality

Clearwater River Dissolved Oxygen and Fecal Coliform TMDL Project QAPP
Revision 0
October 4, 2007
Page 7 of 50
DOCUMENT CONTROL
This document has been prepared according to the United States Environmental Protection
Agency publication, EPA Requirements for Quality Assurance Project Plans, dated March 2001
(QA/R5). This QAPP will be reviewed annually and updated as needed. Updated versions of this
QAPP will bear a new (x + 1) revision number. Corey Hanson will assume responsibility for
archiving outdated versions of this QAPP which will be kept at project headquarters. Archived
versions of this QAPP will be retained for a minimum of ten years from the date of archival.
GROUP A. PROJECT MANAGEMENT
A3. DISTRIBUTION LIST
Each person listed on the Approval Signature Page and each person listed in Table 2 will receive
a copy of the final approved version of this Quality Assurance Project Plan. A copy will also be
made available to other persons taking part in the project and to other interested parties.
Table 2. Clearwater River DO and Fecal Coliform TMDL Project QAPP Distribution List
Name Title/Affiliation Address Phone/e-mail
Corey
Hanson
Water Quality Coordinat-
or, Red Lake WD
1000 Pennington Ave. S., Thief
River Falls, MN 56701
218.681.5800 ;
Lisa
Scheirer
Project Manager, MPCA 714 Lake Ave., Detroit Lakes,
MN 56501
218.846.0498; lisa.
Roger
Fisher
WQ QA/QC Coordinator,
MPCA
520 Lafayette Road North, St.
Paul, MN 55155-4194
651.296.7387; roger.
A4. PROJECT ORGANIZATION
Table 3. Clearwater River DO and Fecal Coliform TMDL Project Personnel
Name/Title Project Responsibility
Corey Hanson, Water Quality Coordinator Project Decisions; QA/QC; Data Validation; MPCA
Liaison; Field and Sampling Activities; Field QC
Lisa Scheirer, MPCA Project Manager Technical Assistance, Data Review
Roger Fisher, WQ QA/QC Coordinator QA/QC Support
The MPCA QA/QC Coordinator (QAC) is independent from project staff including those that
generate data. The extent of the QAC role is to assist in the writing of this QAPP and to be
available to address project QA/QC problems and concerns. The QAC is not accountable to
anyone directly or indirectly associated with this project.
Corey Hanson is responsible for maintaining the latest official approved version of this QAPP.
A5. PROBLEM DEFINITION/BACKGROUND
A5.1 Clearwater River DO and Fecal Coliform TMDL Project Background

Clearwater River Dissolved Oxygen and Fecal Coliform TMDL Project QAPP
Revision 0
October 4, 2007
Page 8 of 50
Some of the impaired reaches addressed by this project were the subject of U.S. Army Corps of
Engineers (USACE) channelization efforts to improve their hydraulic efficiency. For details,
consult the project work plan.
The Ruffy Brook Aquatic Ecosystem Restoration Project, developed by USACE to remedy some
problems created by channelization awaits funding. Also, the Red Lake WD recently completed
a Clearwater River stream bank stabilization and revitalization project immediately upstream
from the USACE channel project.
A5.2 Clearwater River DO and Fecal Coliform TMDL Project Problem Definition
The Red Lake WD has been monitored for water quality for over 20 years. Most of the DO and
fecal coliform impairments are based on the 1994 Clearwater River CWP diagnostic study which
entailed both diagnostic and implementation phases. The Silver Creek fecal coliform impairment
is based upon data from the RLWD long-term monitoring program. The six impaired reaches
addressed in this project are listed below.
Wild rice operations located along the Clearwater River between Clearwater Lake dam and the
city of Plummer flood rice fields and reduce stream flows.
Table 4. Clearwater River DO and Fecal Coliform TMDL Project Impaired Reaches
Reach HUC Code Impairment Listed Dates
Clearwater River; Ruffy Brk to Lost River 09020305-510 Low DO 2002 2004-07
Clearwater River; Ruffy Brk to Lost River 09020305-510 Fecals 2002 2006-09
Lost River, Anderson Lake to Hill River 09020305-507 Fecals 2002 2006-09
CD #57, Unnamed Ditch to Clearwater 09020305-508 Low DO 2002 2004-07
Poplar River, Spring Lake to Hwy. 59 09020305-518 Low DO 2002 2004-07
Silver Creek, Headwaters to Anderson Lake 09020305-527 Fecals 2002 2004-07
Walker Brook, Walker Brook Lake to
Clearwater River
09020305-509 Low DO 2002 2002-05
A6. PROJECT DESCRIPTION
A6.1 Clearwater River DO and Fecal Coliform TMDL Project Summary
This project is a watershed-based water quality impairment study in the Red River Basin in
Minnesota. The first six reaches listed in Table 4 are located in the same area while the last
segment is located at the upstream headwaters of the Clearwater River system.
Project work is coordinated through the Red Lake Watershed District for the purpose of
completing impaired waters studies of the reaches listed in Table 4. The Walker Brook
impairment, the last reach listed, may be submitted for consideration as a reclassification.
A6.2 Clearwater River DO and Fecal Coliform TMDL Project Goal
Clearwater River Dissolved Oxygen and Fecal Coliform TMDL Project QAPP
Revision 0
October 4, 2007
Page 9 of 50
This project will verify the impairments, their locations, and define their sources. It will also
define current pollutant loads, estimate pollutant total daily maximum loads (TMDL), and
propose strategies to reduce them.
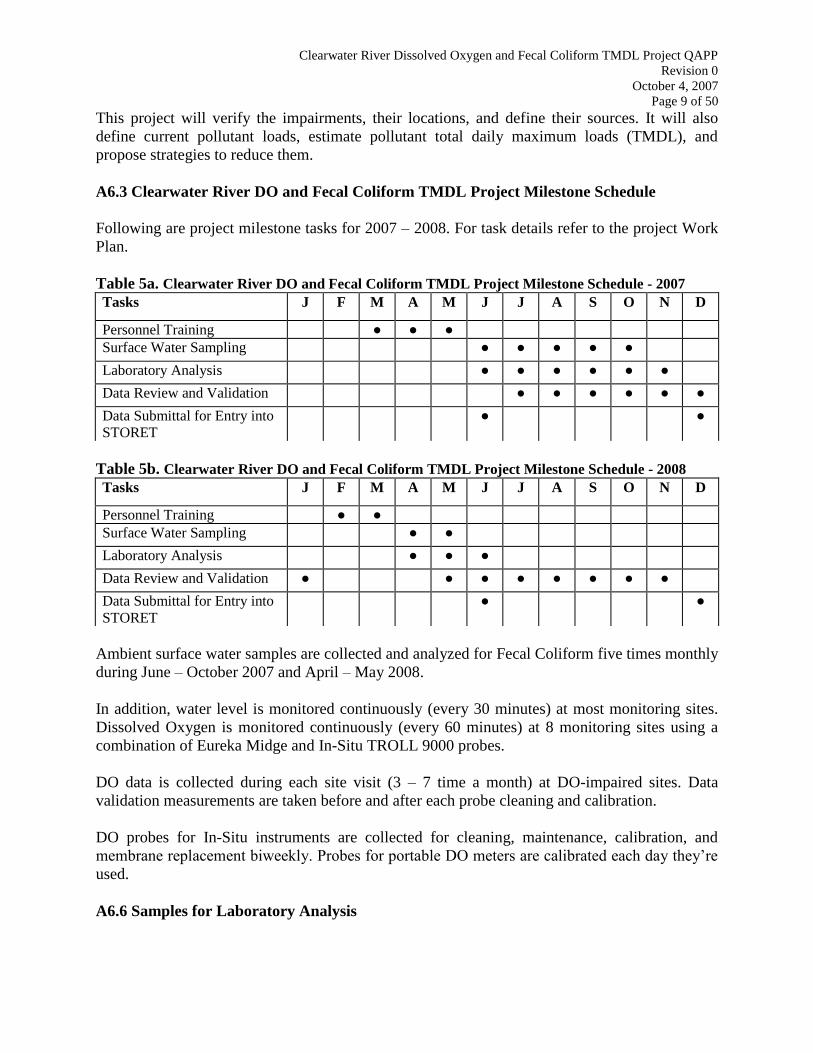
A6.3 Clearwater River DO and Fecal Coliform TMDL Project Milestone Schedule
Following are project milestone tasks for 2007 – 2008. For task details refer to the project Work
Plan.
Table 5a. Clearwater River DO and Fecal Coliform TMDL Project Milestone Schedule - 2007
Tasks J F M A M J J A S O N D
Personnel Training ● ● ●
Surface Water Sampling ● ● ● ● ●
Laboratory Analysis ● ● ● ● ● ●
Data Review and Validation ● ● ● ● ● ●
Data Submittal for Entry into
STORET
● ●
Table 5b. Clearwater River DO and Fecal Coliform TMDL Project Milestone Schedule - 2008
Tasks J F M A M J J A S O N D
Personnel Training ● ●
Surface Water Sampling ● ●
Laboratory Analysis ● ● ●
Data Review and Validation ● ● ● ● ● ● ● ●
Data Submittal for Entry into
STORET
● ●
Ambient surface water samples are collected and analyzed for Fecal Coliform five times monthly
during June – October 2007 and April – May 2008.
In addition, water level is monitored continuously (every 30 minutes) at most monitoring sites.
Dissolved Oxygen is monitored continuously (every 60 minutes) at 8 monitoring sites using a
combination of Eureka Midge and In-Situ TROLL 9000 probes.
DO data is collected during each site visit (3 – 7 time a month) at DO-impaired sites. Data
validation measurements are taken before and after each probe cleaning and calibration.
DO probes for In-Situ instruments are collected for cleaning, maintenance, calibration, and
membrane replacement biweekly. Probes for portable DO meters are calibrated each day they‘re
used.
A6.6 Samples for Laboratory Analysis
Clearwater River Dissolved Oxygen and Fecal Coliform TMDL Project QAPP
Revision 0
October 4, 2007
Page 10 of 50
Water quality samples are submitted to RMB Environmental Laboratories, Inc., Detroit Lakes,
and analyzed for the following parameters:
Fecal Coliform
A6.7 Samples for Field Analysis
The following parameters will be measured in the field through use of a sonde:
Dissolved Oxygen
Turbidity
Specific Conductance
pH
Temperature
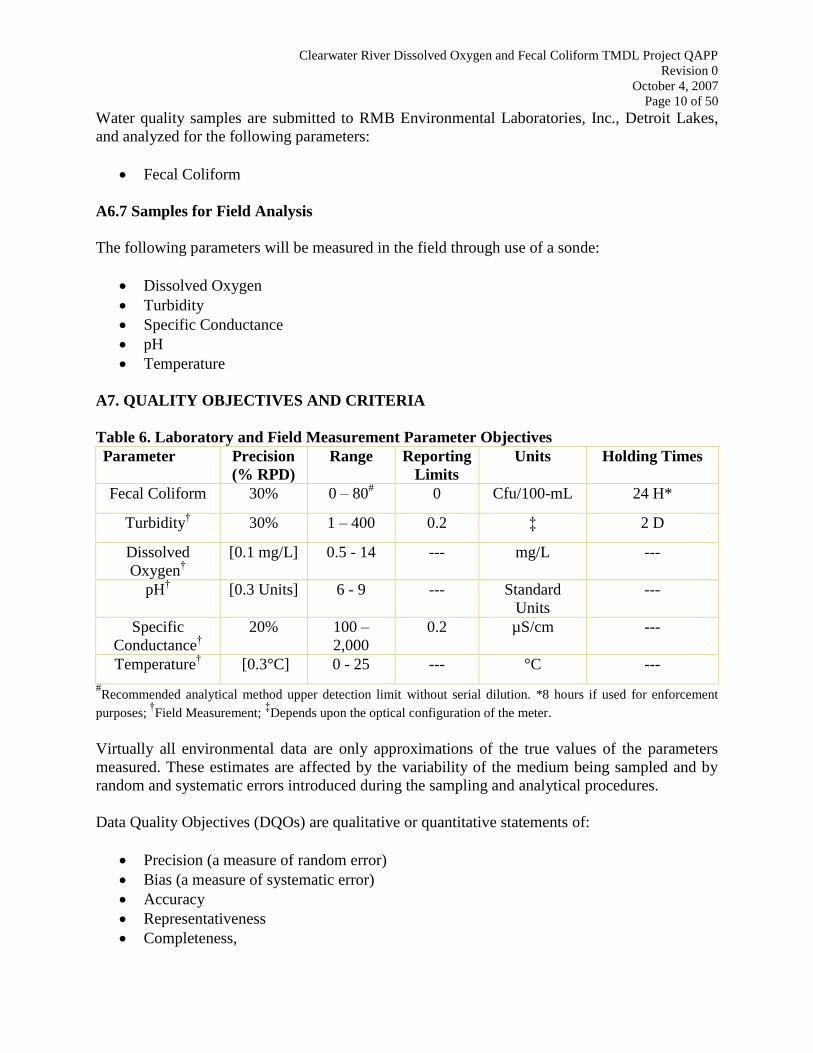
A7. QUALITY OBJECTIVES AND CRITERIA
Table 6. Laboratory and Field Measurement Parameter Objectives
Parameter Precision
(% RPD)
Range Reporting
Limits
Units Holding Times
Fecal Coliform 30% 0 – 80# 0 Cfu/100-mL 24 H*
Turbidity† 30% 1 – 400 0.2 ‡ 2 D
Dissolved
Oxygen†
[0.1 mg/L] 0.5 - 14 --- mg/L ---
pH† [0.3 Units] 6 - 9 --- Standard
Units
---
Specific
Conductance†
20% 100 –
2,000
0.2 µS/cm ---
Temperature† [0.3°C] 0 - 25 --- °C ---
#Recommended analytical method upper detection limit without serial dilution. *8 hours if used for enforcement
purposes; †
Field Measurement; ‡Depends upon the optical configuration of the meter.
Virtually all environmental data are only approximations of the true values of the parameters
measured. These estimates are affected by the variability of the medium being sampled and by
random and systematic errors introduced during the sampling and analytical procedures.
Data Quality Objectives (DQOs) are qualitative or quantitative statements of:
Precision (a measure of random error)
Bias (a measure of systematic error)
Accuracy
Representativeness
Completeness,

Clearwater River Dissolved Oxygen and Fecal Coliform TMDL Project QAPP
Revision 0
October 4, 2007
Page 11 of 50
Comparability, and
Sensitivity
The DQOs must be defined in the context of project requirements and objectives not the test
method capabilities.
Precision – This quality element measures how much two or more data values are in agreement
with each other. Precision is discussed in the introductory chapter of Standard Methods for the
Examination of Water and Wastewater, 20th
Edition, 1998. Field sampling precision is
determined by using field split samples or field duplicate samples. Laboratory analytical
precision is determined by comparing the results of split samples, duplicate samples, and
duplicate spike samples.
Sampling and/or analytical precision may be determined from split or duplicate samples by
calculating the Relative Percent Difference (RPD) as follows:
RPD = (A – B) ÷ ((A + B) / 2) x 100
where A is the larger of the two duplicate sample values and B is the smaller value.
Where three or more replicate samples or measurements have been taken, calculate the Relative
Standard Deviation (RSD) instead of the RPD as follows:
RSD = (s/χ) x 100
Where s is the standard deviation of the replicate values and χ is the mean of the replicate values.
Bias – This expresses the degree to which a measured value agrees with or differs from an
accepted reference (standard) value due to systematic errors. Field bias should be assessed by use
of field blanks and sampler blanks. Adherence to proper sample handling, preservation, and
holding time protocols will help minimize field bias. Field and sampler blanks are collected in
the same manner as the respective samples that are collected from the river. Field blanks consist
of sample bottles filled directly with distilled water in the field (to simulate a hand-dipped
sample). Sampler blanks determine the amount of contamination/bias that comes from the use of
a sampling device such as a Van Dorn sampler. The RLWD Van Dorn sampling device is
cleaned with distilled water before and after each sample. It is rinsed 3 times with sample water.
Therefore, to simulate a sample collected with a Van Dorn for a sampler blank, the device is
rinsed 3 times with distilled water, filled with distilled water, and then water is drawn from the
device and into sample bottles.
Trip blanks are taken only for VOC sampling which is not a parameter to be measured by this
project. Thus bias due to field activities will not be determined. However, laboratory bias will be
determined as part of its internal quality control. Bias effects that fall outside the laboratory‘s
acceptance limits will be flagged.

Clearwater River Dissolved Oxygen and Fecal Coliform TMDL Project QAPP
Revision 0
October 4, 2007
Page 12 of 50
Accuracy – This expresses the degree to which an observed (measured) value agrees with an
accepted reference standard (certified sample value) or differs from it due to systematic errors.
Completeness – Expressed as the number of valid (usable) data points made to the total number
of measurements expected according to the original sampling plan. Percent completeness is
determined separately for each parameter and is calculated as follows:
% Completeness = (no. of usable data points ÷ no. of planned data points) x 100
High or low water levels may reduce the number of samples that can be taken. This may be
compensated for by scheduling additional sampling events or sampling as near to the original
sampling site as possible. Any such variances to the established sampling protocol will be
thoroughly documented. Resulting data will also be qualified to reflect this.
Representativeness – This expresses the degree to which data accurately and precisely
represents parameter variations at a sampling point, or of a process or environmental condition.
Representativeness of field data are dependent upon proper sampling program design and is
maximized by following the sampling plan, using proper sampling protocols, and observing
sample holding times.
Data will also be compared to historical project data and to current and historical data generated
by other organizations
Comparability – This represents the level of confidence with which the project data set can be
compared to other data. Indicate the steps to be taken to ensure the comparability of field
measurements and laboratory analyses. Comparability is dependent upon establishing similar QA
objectives for the sets being compared and is achieved by using similar sampling and analytical
methods.
Sensitivity – For laboratory analyses this represents the lowest level of analyte that can be
reliably detected by the laboratory analytical method. For field measurements this represents the
lowest level of analyte the field analytical method or meter can reliably detect.
Table 7. RMB Environmental Laboratories Inc., Analytical Parameter
Parameter Sample
Quantity
Sample
Container
Preservative Holding
Time
Analytical Method
Fecal Coliform 100 mL Plastic Ascorbic acid,
Cool to 4°C 24 H* SM 9222 B
* 8 hrs if used for enforcement purposes.
A8. SPECIAL TRAINING/CERTIFICATION
Training of Red Lake WD Project staff is done through assistance from knowledgeable Red Lake
WD staff and the MPCA Project Manager. Corey Hanson is responsible for field sampling
training and monitoring oversight.

Clearwater River Dissolved Oxygen and Fecal Coliform TMDL Project QAPP
Revision 0
October 4, 2007
Page 13 of 50
Corey Hanson is responsible for ensuring key project staff have or receive adequate training to
effectively and correctly perform their project duties. Key staff include the Water Quality
Coordinator, Project Manager, samplers, sample handlers, data reviewers, and data assessors.
They are also responsible for documenting such training and maintaining the training records.
A9. DOCUMENTATION AND RECORDS
All versions of the QAPP are retained in the Red Lake WD office. Clearwater River DO and
Fecal Coliform TMDL Project staff retain sampling sheets for five years. Data are entered into
STORET by MPCA staff.
Sampling sheets are completed on-site at the time of sampling.
Sampling collection records, field notebooks, and all records of field activity are retained by the
Clearwater River DO and Fecal Coliform TMDL Project staff for five years following
completion of the project.
GROUP B. DATA GENERATION AND ACQUISITION
B1. SAMPLING PROCESS DESIGN
Red Lake WD staff and MPCA staff in consultation with project partners developed the
sampling plan.
Water chemistry and physical data are collected and used to monitor project effectiveness.
Samples taken during the project are considered a snapshot of current water quality conditions.
Long-term monitoring programs need to be established to truly measure water quality
improvements.
Samples are being collected and analyzed for E. coli instead of fecal coliform. This is because
the MPCA is in the process of replacing the fecal coliform standard with an E. coli standard. E.
coli is a better indicator of health risk from water contact.
B2. SAMPLING METHODS
All field work for this project, including collection of water samples and delivery of water
samples within the required time frame to RMB Environmental Laboratories, Inc. (RMB), are
conducted by Red Lake WD staff. A certified laboratory conducts all water sample analyses.
This QAPP supports the laboratory‘s QAM and SOPs and is specific for the Clearwater River
DO and Fecal Coliform TMDL Project.
Water chemistry field duplicates are collected 10% of the time for lake and stream samples. All
samples are collected using approved methods and sampling devices. Samples are transferred
from sample collection devices to pre-cleaned polyethylene or glass bottles. Bacteriological
samples are collected in sterile glass, polypropylene, or polycarbonate vessels. Red Lake WD
staff are responsible for collection and transport of the samples to RMB. RMB provides the pre-

Clearwater River Dissolved Oxygen and Fecal Coliform TMDL Project QAPP
Revision 0
October 4, 2007
Page 14 of 50
cleaned bottles and the sterile bacteriological bottles. Since there was not enough money
budgeted for this analysis, all QA/QC sample analysis bills are being paid by the RLWD.
Stream Sampling
Physical parameters are assesses on-site by used of a sonde. Chemical samples are collected by Red
Lake WD staff and are analyzed by RMB.
Grab Samples
Water quality samples are collected using clean polyethylene bottles of appropriate size to
provide the laboratory with sufficient sample to perform the requested analyses and reanalysis, if
necessary. All samples are preserved as required, labeled with a unique identifier, and placed in a
cooler on ice. Sample information is logged on field data sheets.
Grab sampling is conducted using the container type and size appropriate for each particular
analysis. In-stream samples are collected at mid-depth near or at the thalweg to obtain a well
mixed sample. The method used for any particular sampling event depended on several factors
including flow rate, stream depth and width, and accessibility. For information on the grab
sampling method see Appendix A.
Regardless of collection method, the grab sample is stored and transported in a clean, labeled
container. The clean container supplied by the analyzing laboratory is not rinsed before the
sample is collected.
Variations of the grab sampling method which may be use as needed are described below.
Wading and Hand Collection
If the stream is safe to wade, the sample collector wades to the center of the stream with a sample
bottle. The sample collector faces upstream taking care not to disturb any stream bottom debris
or sediment which may contaminate the sample. The sample bottle is inverted and dipped below
the surface, then turned upright to collect the sample while holding the bottle about one foot
below the water surface. When considering wading, the general rule is that if stream depth (in
feet) multiplied by its velocity (feet/second) is greater than the sampler‘s height (in feet), then the
sampler MUST NOT WADE.
Bridge and Rope Collection
For larger rivers where the sampling station is adjacent to a bridge, a grab sample may be
collected using a Wildco Beta Plus Van Dorn style (or equivalent) sampler lowered from the
bridge deck near the river thalweg. Before collection of samples, the sampler is rinsed with
distilled water to remove contaminants from the storage and the previous sampling site. The
sampler is then lowered to the river surface and plunged into the water to an approximate depth
of one meter below the water surface. The sampler is then raised to the bridge deck, and the grab
sample is poured into the sample container. In this variation, both the sampler and the sample
Clearwater River Dissolved Oxygen and Fecal Coliform TMDL Project QAPP
Revision 0
October 4, 2007
Page 15 of 50
bottle are triple rinsed with site water before collection of the final sample, as described above.
After the sample is collected, the sampler is rinsed with distilled water to prevent contaminants
from carrying over from one site to the next.
B3. SAMPLE HANDLING AND CUSTODY
Corey Hanson is the field sample custodian and keeps records of all samples taken by field
personnel. Sample bottles are labeled with bottle number, site identification, and date. They are
sealed tightly and packed in a cooler on ice at the sampling location. The field record includes
project name, sampler‘s signature, unique station identification number, sample number,
parameters for laboratory analysis, matrix, number and size of containers, and date and time. All
laboratory samples are typically delivered to RMB within 24 hours of collection. Coolers
containing samples that require ice preservation are checked periodically to ensure samples
remained adequately iced so sample temperatures do not exceed 6°C.
Information on field conditions, such as the weather, deviations from written procedures,
operating condition of the equipment, and other unusual occurrences are also recorded for each
sampling event.
Laboratory Sample Handling
Sample containers are provided by the laboratory. Container cleanliness is verified by QA/QC
procedures as specified in the laboratory‘s QAM and SOPs. The laboratory verified sample
bottle cleanliness is by running a specified number of bottle blanks on each shipment received
and on each batch of sample bottles following laboratory cleaning and sterilization. A
preservative is added to specific bottles, as required, or accompanies the bottles in a separate
container. Preservatives used and their volumes and concentrations are specified in the
laboratory QAM.
Temperature blanks are included in the coolers provided by the laboratory to verify whether the
appropriate sample temperature of ≤ 6°C has been maintained.
Upon arrival at the laboratory, the condition of the samples is determined. The samples are
checked for leaks and appropriate preservation and the temperature taken. The information is
recorded on the sample identification sheet. The sample identification sheet information is then
compared to the information on the sample bottles and any discrepancies are noted. The samples
are then logged into the Laboratory Information Management System (LIMS). They are assigned
two identification numbers, a work order number and a unique laboratory number. The samples
were then stored in the appropriate area as determined by required storage temperature, matrix,
and analyses required. The laboratory sample storage areas are monitored daily.
Samples are tracked using LIMS. Any problems encountered are reported to the client. An
analytical report is printed out. The samples are held until their holding time has expired or until
30 days after completion of the analysis. Samples are then disposed of in an environmentally
acceptable manner. Samples are returned to the client if requested. Water samples that are

Clearwater River Dissolved Oxygen and Fecal Coliform TMDL Project QAPP
Revision 0
October 4, 2007
Page 16 of 50
environmentally safe are disposed into the local sanitation system. Samples that contain
hazardous waste may be returned to the client for proper disposal.
Analytical Standard Operating Procedures (SOPs) are part of the laboratory QAM.
Field Information Sheets
Field data sheets are the primary method for documenting most stream monitoring field
activities. These sheets served as an initial record of any field measurements and weather
conditions at the time of sampling.
Field Notes
Field notes are used to document important information during sampling events. They are
entered into a bound notebook with waterproof pages. Entries are made using pens with indelible
ink. The field notebook becomes part of the project data and is retained with the analytical data
hard copies and other project documents.
Sample Labeling
Each sample container has a label attached which is filled out in its entirety. Sample containers
without labels or labels that are missing information are not, as per laboratory policy, accepted
by the laboratory. The sample label includes the water body code or name, the site number, the
date, and time of sample collection.
Sample Shipping
All samples are packed in an ice-filled cooler for transport to the laboratory. Samples are
typically transported within 24 hours of collection.
B4. ANALYTICAL METHODS
TABLE 8. RMB Environmental Laboratories, Inc. Analytical Method
Parameter Method
Fecal Coliform SM 9222 B
Analytical protocols are found in the RMB QA/QC Manual and SOPs. Analytical accuracy is
routinely checked by the laboratory‘s analysis of standard certified reference analytes.
All raw data generated in the laboratory are recorded in bound notebooks, on project specific raw
data sheets, RMB custom logbooks, or as an instrument printout. This data includes sample
numbers, calibration data, calculations, results, analyst notes and observations, quality control
data, date of analysis, and initials of the analyst. Completed notebooks are returned to the Quality
Assurance Unit where they are archived. Chromatograms, graphs, and strip charts, if part of the
data package, are kept with the laboratory raw data. All items are labeled, dated and signed by
the analyst. When completed, the data are integrated into a final report.

Clearwater River Dissolved Oxygen and Fecal Coliform TMDL Project QAPP
Revision 0
October 4, 2007
Page 17 of 50
For out-of-control situations, a corrective action plan is in place. The initial action is to repeat the
analyses of the samples bracketed by the unacceptable quality control sample. Replication of
unacceptable results is investigated as a matrix effect by reviewing blank spikes or laboratory
knowns. If the quality control samples are still unacceptable, the entire process is repeated. This
includes sample preparation or extraction. If re-analysis is not possible due to the sample being
past holding times or sample quantity is insufficient, documentation of the situation will be
added to the raw data. In these cases, the client is notified and the report flagged.
B5. QUALITY CONTROL
Where applicable, internal reference standards will be analyzed and recorded with each sample
run. External reference standards and standard reference material obtained from ERA, APG, or
another approved provider will also be used. All stock standard solutions will be properly
labeled, stored, and expiration dates visibly recorded on the label. The measured data for the
certified standards must fall within the specified range as given by the provider or corrective
action will be taken.
The Minnesota Department of Health (MDH) certifies RMB Environmental Laboratories, Inc.
As such the laboratory is subject to audit by MDH and MPCA.
One field QC grab sample duplicate for laboratory analysis is collected at the sampling site for
every ten like samples taken. The field duplicate for laboratory analysis is collected to determine
sampling and laboratory analytical precision.
If QC samples revealed a sampling or analytical problem, field and laboratory personnel attempt
to identify the cause.
Upon working out a plausible solution, personnel take necessary steps to ensure that similar
problems do not arise during future sampling events. If possible the sampling event is repeated.
As per laboratory protocol, suspect data are flagged or qualified depending upon the nature and
extent of the problem.
RMB implements specific QA/QC methods and procedures for dealing with out-of-control
situations. These are documented in RMB‘s QAM and SOPs, copies of which are maintained on
file at MPCA and available for consultation and review upon request.
B6. INSTRUMENT/EQUIPMENT TESTING, INSPECTION, AND MAINTENANCE
All hand-held instruments, when used, are inspected and tested each sampling day prior to their
use in the field. Steps are taken to fix any instrument problems noted during testing. If any
problems cannot be resolved the instrument is taken out of service and a substitute instrument is
used. pH buffer solutions are replaced with fresh solutions before the buffer solution expiration
date. Batteries for all meters are routinely checked and replaced when meters showed power-
related problems. Spare batteries for all instruments are taken on all sampling trips. All
maintenance procedures are documented in the meter maintenance logs or the field notebook.

Clearwater River Dissolved Oxygen and Fecal Coliform TMDL Project QAPP
Revision 0
October 4, 2007
Page 18 of 50
B7. INSTRUMENT/EQUIPMENT CALIBRATION AND FREQUENCY
Thermometers used during this project are checked for accuracy with a NIST-certified
thermometer. The field thermometer must read within ± 0.1°C of the NIST-certified thermometer
to be used. Thermometer accuracy is confirmed at the beginning of each sampling season. All
field instruments are calibrated each sampling day before being taken into the field. Instrument
calibration is checked periodically throughout the sampling day and recalibrated if necessary. All
instrument calibration checks and procedures are documented on the instrument maintenance log
or in the field notebook.
B8. INSPECTION/ACCEPTANCE OF SUPPLIES AND CONSUMABLES
Supplies and consumables included paper supplies, gloves, deionized water, and batteries.
Supplies and consumables are purchased only from reputable and reliable suppliers and
inspected for usability upon receipt.
B9. DATA ACQUISITION REQUIREMENTS (NON-DIRECT MEASUREMENTS)
Project staff review historical water quality data collected by previous assessment projects and
used the data for comparative purposes with the data from this project. Modeling is also used in
this project. For modeling details, consult the Work Plan.
B10. DATA MANAGEMENT
The Water Quality Coordinator is responsible for completing the field data sheets. This
information is entered into a spreadsheet or database and archived. Laboratory results are entered
into a computer database and/or spreadsheet which is maintained by the Project Manager who
also assists with data maintenance, reduction, and transmittal. The MPCA Project Manager also
reviews all data prior to its approved entry into STORET.
Quality assurance data sheet checks include scanning for apparent entry errors, measurement
errors, and omissions. Suspect data are flagged and/or excluded from use. Data may be presented
in table, graph, and chart format. Unusual data are rechecked to verify its accuracy. The data are
then entered into STORET by MPCA data entry personnel.
Data collected is analyzed on an annual basis with in-depth analysis and modeling being
conducted at least once during the project. Flow/discharge curves are created for the Red Lake
Watershed. Flow and nutrient loading are determined in the Red Lake Watershed through use of
a modeling program. Modeling based on water chemistry data is completed by the Red Lake WD
with assistance from the MPCA. All data are collected and analyzed in accordance with this
QAPP. The Red Lake WD provides the data and modeling results to project partners and makes
it available to the public.
GROUP C: ASSESSMENT AND OVERSIGHT
C1. ASSESSMENT AND RESPONSE ACTIONS
Clearwater River Dissolved Oxygen and Fecal Coliform TMDL Project QAPP
Revision 0
October 4, 2007
Page 19 of 50
Corey Hanson as Water Quality Coordinator is responsible for all field activities, reviewing the
data, reporting to the group on findings, and forwarding all data to the appropriate state
regulatory agency for inspection and input into STORET. He oversees and assesses all field
sampling and data collection. The MPCA Project Manager and QA staff are also authorized to
oversee field activities during this project. The MPCA Project Manager and WQ QA/QC
Coordinator are also authorized to follow up on sampling activities during the project.
C2. REPORTS TO MANAGEMENT
A draft report of the Clearwater River DO and Fecal Coliform TMDL Project findings will be
prepared for the MPCA and shared with all involved watershed districts, local resource
managers, and other involved parties.
The Water Quality Coordinator submits a semi-annual report on August 1st and February 1
st to
the MPCA Project Manager. Problems that arise during the project are corrected and reported to
all parties involved in the project.
Red Lake WD staff are responsible for the reporting, tracking, and overall management of the
Clearwater River DO and Fecal Coliform TMDL Project.
All data are recorded and tracked through use of the Microsoft Excel database management
system. The data compiled during this project is incorporated into spreadsheets and sent to the
MPCA for perpetual storage in STORET, the EPA environmental database.
GROUP D: DATA VALIDATION AND USABILITY
D1. DATA REVIEW, VERIFICATION, AND VALIDATION
All raw data are transcribed to the data transmittal form and stored in a binder-type notebook.
Where applicable, the data is organized electronically and filed in the MPCA STORET database.
Statistical analyses on replicate samples are recorded so that the degree of certainty can be
estimated.
All data are reviewed by the project monitoring coordinator and signed by the analyst. Copies of
the data transmittal form and all pertinent records of calibration, standardization, and
maintenance will be archived.
All laboratory analytical results are cross-checked against the field notebook and sample tags to
ensure that the raw, computer-generated summary of the laboratory analyses are assigned to the
correct sampling stations. All analytical results are compared to the field sheets to ensure that the
data are complete.
Field data and field QC sample sets are reviewed by Corey Hanson to determine if the data meets
the DQO and QAPP objectives. In addition, Lisa Scheirer, MPCA Project Manager, assists in the
data review. Data is examined and outliers identified through statistical analysis. Decisions to
reject or qualify data are made by Corey Hanson and Lisa Scheirer.

Clearwater River Dissolved Oxygen and Fecal Coliform TMDL Project QAPP
Revision 0
October 4, 2007
Page 20 of 50
D2. VERIFICATION AND VALIDATION METHODS
Project staff follows the EPA Guidance on Environmental Verification and Validation (EPA
QA/G-8) whereby the data is reviewed and accepted or qualified by project and/or MPCA staff.
D3. RECONCILIATION WITH USER REQUIREMENTS
Within 48 hours of receipt of results of each sampling event, calculations and determinations of
precision, completeness, and accuracy are made and corrective action implemented, if needed. If
data quality does not meet project specifications, the deficient data is flagged or discarded and
the cause of failure evaluated. Any limitations on data use are detailed in the project reports and
other documentation.
Project data is compared to historic data and is also used as complimentary data for other
monitoring efforts within the basin.
For the data to be considered valid, data collection procedures, the handling of samples, and data
analysis must be monitored for compliance with all the requirements described in this QAPP.
Data is flagged and qualified if there is evidence of habitual violations of the procedures
described in this QAPP. Any limitations placed on the data are reported to the data end user in
narrative form.

Clearwater River Dissolved Oxygen and Fecal Coliform TMDL Project QAPP
Revision 0
October 4, 2007
Page 21 of 50
Appendix A
Hand-Collected (Grab) Sampling
Standard Methods for Collection
Water is collected at the sampling point using one of the following methods depending upon
physical accessibility:
Sample bottle dip while wading
Sample bottle dip through hole cut in ice
Follow bottle rinse and preservation methods as directed by the analyzing laboratory. Bottles
shall not be rinsed before sample collection. Sample bottles are pre-cleaned and disposable. Do
not use bottles that may have been contaminated (caps have fallen off).
Samples are collected at a point that best represents the water quality of the total flow at the cross
section. Grab samples collected using the Standard Operating Procedures for Water Quality
Monitoring in the Red River Watershed are collected in the thalweg of the stream (representative
of the most flow) at a depth down from the surface that is approximately 6/10 of the total depth
of the stream (mid depth, target depth has the average flow velocity at that point in the cross-
section). Avoid sampling points that are poorly mixed or affected by local temporary conditions
such as ponding across part of the stream width, obviously disproportionate sediment load, or
backwater conditions. If a site is poorly mixed across the stream, integrated sample across the
stream width should be used, or, more practically, another site should be chosen that is well
mixed across the stream width.
Collect the sample at a middle (approximately 6/10 of the total depth down from the surface)
depth in the water column without disturbing stream bed sediments or collecting floating
materials from the surface. When grab sampling, the bottle should be lowered mouth down to
the middle depth below the water surface then turned upward to collect the sample. Opening the
bottle, upside down, under the surface of the water can help avoid contamination/bias from
debris floating on the water surface. Always stand downstream of the sampling point to avoid
contaminating the sample. During ice conditions, keep ice and snow out of the sampling hole cut
in the ice. Be mindful that, during low flow conditions, disturbed sediment can actually float in
an upstream direction. Avoid contaminating samples with this disturbed sediment.
SAFETY FIRST!
If wading, as a general rule, if stream depth (in feet) multiplied by its velocity (feet/second) is
greater than your height (in feet), and then DO NOT WADE!
(Stream Depth) [ft.] x Stream Velocity [ft./sec.] > your height [ft.] = Do Not Wade!

Clearwater River Dissolved Oxygen and Fecal Coliform TMDL Project QAPP
Revision 0
October 4, 2007
Page 22 of 50
Appendix B
QA Field Sampling Procedures
Sampler Blanks
A sampler blank (also commonly referred to as a rinsate blank or an equipment blank) is a
sample of distilled water that is rinsed through the sampling device and collected for analysis.
The RLWD collects one set of sampler blanks for every set of samples collected with a Van
Dorn sampling device (also done for other devices, but the Van Dorn is the only type being used
for this study). It is basically a simulated sample collected with the sampling device using a fresh
bottle of distilled water instead of river water. These samples can be used to determine whether
or not the sampler is being properly cleaned in between samples. The first step in collecting a
sampler blank is to decontaminate the sampling device in the same manner that is used to collect
your regular samples. For example, if you clean the sampling device with detergent and rinse
with DI water, then conduct this same procedure before you collect the blank. Because the
sampling device is rinsed 3 times with sample water before collecting your sample, then
conduct this rinse with DI water instead of sample water before collecting the sampler
blank – this will prevent any residual sample water from being detected in your results. Try to
eliminate as much of the rinse water from the sampling device as possible before you collect the
blank.
To collect the blank, fill the sampling device with distilled water and transfer the water to the
appropriate collection bottles. Handle the device as close to your normal sampling procedure as
possible: agitate the sampling device in the same manner, try to leave the water in the sampling
device for the same amount of time, and collect the same volume of water.
Trip Blanks
Trip Blanks are sample bottles of deionized water that are filled before going out into the field
and are carried along the entire sampling trip in the cooler. They are typically obtained ahead of
time from the laboratory and are preserved in the same manner as the regular sample. Trip blanks
are generally only used when collecting samples for volatile organic compounds.
Field Blanks
Field Blanks are similar to sampler and trip blanks. They are collected for 10% of all sets of
samples that are collected using the hand-dipping grab sample method. They are collected by
filling sample bottles with fresh distilled water at the sampling site. Contamination sources for
this sampling method may include the atmosphere (rain, blowing dirt), the sampling personnel
themselves, and the sample bottles.
Field Duplicates
A field duplicate is a second sample taken right after an initial sample in the exact same location.
Field duplicates assess the sampler‘s precision, laboratory precision, and possible temporal

Clearwater River Dissolved Oxygen and Fecal Coliform TMDL Project QAPP
Revision 0
October 4, 2007
Page 23 of 50
variability. The duplicate sample should be collected in the exact same manner as the first
sample, including the normal sampling equipment cleaning procedures.
Lab Sheets
A column labeled ―QA Type‖ has been added to the lab sheets. If you are collecting a QA
sample, fill in the type of QA sample in this column. Leave the column blank if it is a normal
sample. The abbreviations for the QA samples are as follows:
SB = sampler blank FD = field duplicate TB = trip blank FB = Field Blank
The sampler blanks and field duplicate samples will have the exact same station, date, time,
depth, and substation as the samples with which they are associated. The only thing
distinguishing the samples apart will be the specified sample type in the ―QA Type‖ column. So
please remember to fill in this column with the QA sample type (SB or FD). Since the trip
blanks are associated with an entire sampling trip, these samples will not have a station or time
associated with them. Fill in the date of the trip and the QA sample type (TB).
Data is examined to determine if the results are acceptable.

Clearwater River Dissolved Oxygen and Fecal Coliform TMDL Project QAPP
Revision 0
October 4, 2007
Page 24 of 50
Appendix C
pH Measurement
Note: The methods written below are not instrument or monitoring program specific. Please
consult the Standard Operating Procedures for Water Quality Monitoring in the Red River
Watershed and your instrument‘s manual for more information. Project specific notes are
inserted below, where necessary.
pH Meter Calibration
Calibrate and check the operation of a pH instrument system at the field site. Two pH buffers are
needed to properly calibrate the pH instrument system (pH 7 buffer and either the pH 4 or 10
buffer, depending on the anticipated sample pH). A third buffer can be used to check instrument
system performance over a larger range. The pH of the buffer solution is temperature dependent:
pH 10 buffers change more per unit change in temperature than do pH 4 buffers. The
temperature of buffer solutions must be known, and temperature-correction factors must be
applied before calibration adjustments are made. Calibration and operating procedures differ
with instrument systems--check the manufacturer's instructions.
Meters with microprocessors have reliable autocalibration functions and will automatically
compensate for buffer temperatures and indicate Nernst slope. For such meters, follow the
manufacturer's calibration instructions precisely--do not take shortcuts.
Check the records of electrode performance before each calibration and field trip. Electrode
response is optimum between approximately 98 percent and 99.5 percent. A slope of 94 percent
indicates possible electrode deterioration. At 90 percent slope, the electrode cannot be used.
Calibrate or check the temperature sensor at least three times per year, and tag the sensor with
the date of last calibration. Do not use the automatic temperature compensating function of a pH
meter if it has not been calibrated within the past 4 months.
Record calibration in the instrument log book and on field forms at the time of instrument
calibration.
1. Refer to the meter users‘ manual for instructions about preparing the probe for use and
clean it as you would to measure a sample‘s pH.
2. Using the probe as if measuring sample water, submerse probe in fresh pH 7 buffer water
to depth recommended by the manufacturer. When the reading has stabilized, note it on
the log. DON‘T ADJUST THE METER TO THE PROPER READING YET. Also note
the temperature reading on the meter, and write down the expected buffer pH at that
temperature range, which is usually found on the side of the buffer container.
3. Submerse the probe in fresh pH 10 buffer, following the same procedure and notations.
(If sampling in acidic waters, use pH 4 buffer instead).

Clearwater River Dissolved Oxygen and Fecal Coliform TMDL Project QAPP
Revision 0
October 4, 2007
Page 25 of 50
4. Now rinse and re-place the probe in the 7 and 10 buffers and allow or reset the meter to
re-calibrate, if needed. If the reset is manual, be sure to set the meter to the expected
buffer pH at the temperature measured, usually found on the side of the buffer container.
5. IMPORTANT: If the calibration was off more than your project‘s data quality objectives
allow (generally about 0.5 pH unit), be sure the project data manager, who reviews and
accepts the water quality measurement results, is aware of the possible discrepancy in the
data generated by the meter since the last calibration.
pH Measurement
The pH of a water sample can change significantly within hours or even minutes after sample
collection as a result of degassing (such as loss of carbon dioxide, hydrogen sulfide, and
ammonia); mineral precipitation (such as formation of calcium carbonate); temperature change;
and other chemical, physical, and biological reactions. The electrometric method of pH
measurement described below applies to filtered or unfiltered surface water and ground water,
from fresh to saline.
The pH of a water sample must be measured immediately in the field. Do not rely on laboratory-
measured pH in lieu of field-measured pH. Measurement of pH for the Clearwater River
Dissolved Oxygen and Fecal Coliform TMDL Study will be made in-situ with the pH probe on a
portable multiparameter sonde.
Field conditions, including rain, wind, cold, dust, and direct sunlight can cause measurement
problems. To the extent possible, shield the instrument and measurement process from the
effects of harsh weather.
In dry, windy climates, a static charge can build up on the face of a pH meter and cause erratic
readings on the display.
Polish the face of the display with a soft, absorbent tissue treated with several drops of antistatic
solution (such as plastic polish) to minimize this interference.
Technical Note: Temperature has two effects on pH measurement of a sample: it can affect
electrode potential (Nernstian slope effect), and it can change hydrogen-ion activity (chemical
effect). The electrode-potential problem can be solved by using an automatic or manual
temperature compensator. The change in hydrogen-ion activity resulting from temperature
changes in the sample can be minimized if the electrodes, buffers, and container are allowed to
equilibrate to the same temperature.
Surface Water
It is generally preferable to measure pH in situ rather than on a sample taken from a splitter or
compositing device. If stream conditions are such that water would pass the in situ pH sensor at a
very high rate of flow, however, streaming-potential effects could affect the accuracy of the
measurement. For such conditions, it is preferable to withdraw a discrete sample directly from

Clearwater River Dissolved Oxygen and Fecal Coliform TMDL Project QAPP
Revision 0
October 4, 2007
Page 26 of 50
the stream or compositing device and use the subsample measurement procedures described
below. When sampling from a boat, the pH instrument system should be set up on board the boat
so that pH is measured at the time of sample collection.
In Situ Measurement
Follow the steps listed below for in situ pH measurement:
Calibrate a pH system on site after equilibrating the buffers with the stream temperature, if
necessary. Check the electrode performance and the calibration date of the thermometer
being used.
Flowing, shallow stream - Wade to the location(s) where pH is to be measured.
Stream too deep to wade - Lower a weighted pH sensor with a calibrated temperature
sensor from a bridge, cableway, or boat. Do not attach the weight to sensor or sensor
cables.
Immerse the pH electrode and temperature sensor in the water to the correct depth and hold
them there for at least 60 seconds to equilibrate them to water temperature.
Measure the temperature.
If the pH instrument system contains an automatic temperature compensator (ATC), use
the ATC to measure water temperature.
If the instrument system does not contain an ATC, use a separate calibrated thermometer,
adjust the meter to the sample temperature (if necessary), and remove the thermometer.
Record the pH and temperature values without removing the sensor from the water.
Values generally stabilize quickly within ±0.05 to 0.1 standard pH unit, depending on the
instrument system.

Clearwater River Dissolved Oxygen and Fecal Coliform TMDL Project QAPP
Revision 0
October 4, 2007
Page 27 of 50
Appendix D
Bacteria Sampling
Sample Collection, Preservation, and Storage
Because sterile conditions must be maintained during collection, preservation, storage, and
analysis of indicator bacteria samples, specific procedures have been developed that must be
strictly followed. These procedures vary with types of sampling equipment and source of sample
(surface water, ground water, treated water, or waste water).
Surface-Water Sample Collection
The areal and temporal distribution of indicator bacteria in surface water can be as variable as the
distribution of suspended sediment because bacteria commonly are associated with solid
particles. To obtain representative data, use the same methods for collecting surface-water
samples for bacteria analysis as for suspended sediment.
Quality Control
Depending on the data-quality requirements, quality-control (QC) samples (blanks and
replicates) can comprise from 5 to 30 percent or more of the total number of samples collected
over a given period of time. E. coli QC samples will be collected at a rate of 10% for this study,
the same rate as all the other samples.
Collect and analyze field blanks to document that sampling equipment has not been
contaminated.
Blank bacteria samples are collected in the same manner as other blank samples. If there is
contamination from equipment, bottles, or sampling methods, it will show up in the laboratory
results. A laboratory result higher than the minimum reporting limit should trigger a review of
sampling protocols and field notes to determine the cause of the sample contamination and
prevent future reoccurrences.
Hand-Dip Method
Open a sterile, narrow-mouth borosilicate glass or plastic bottle; grasp the bottle near the base,
with hand and arm on downstream side of bottle.
Without rinsing, plunge the bottle opening downward, below the water surface. Allow the bottle
to fill with the opening pointed slightly upward into the current.
Remove the bottle with the opening pointed upward from the water and tightly cap it, allowing
about 2.5 - 5 cm. of headspace. This procedure minimizes collection of surface film and avoids
contact with the streambed.
Sample Preservation and Storage
Clearwater River Dissolved Oxygen and Fecal Coliform TMDL Project QAPP
Revision 0
October 4, 2007
Page 28 of 50
After collection, immediately chill samples in an ice chest or refrigerator at 4°C ± 2°C. Do not
freeze samples. Begin analysis as quickly as possible preferably within 1 hour but not more than
8 hours† after sample collection to minimize changes in the concentration of indicator bacteria.
Preserving Sample Cleanliness
Keep the rope, used to lower the sampler, coiled inside of a bucket or case. While pulling the
sampler up, constantly recoil the rope into the bucket/case. This keeps the rope from being
contaminated by substances from the bridge deck.
When lowering and raising the sampler do not let the rope rub against the side of the bridge.
Such rubbing knocks material from the bridge into the sampler, and can contaminate the sample.
Safety When Sampling From a Bridge
If you are in traffic wear a traffic safety vest. Carry a white bucket to increase your visibility. If
visibility is low, set a blinking warning light next to you while you are collecting the sample. It is
advisable to have a warning beacon on the top of the vehicle. Orange traffic cones can add
another level of safety when working on highway bridges or other busy roads.
If you are on a Warner truss or similar bridge and it is a sunny day, also use a warning light.
Place the light in one of the shadows. The shadows of the truss work on the bridge deck will
cause optical confusion for approaching drivers and will hide your presence.
†MPCA Environmental Analysis & Outcomes Division policy is as follows:
The maximum 8-hour holding time must be strictly observed if the sampling is being done in conjunction
with a possible enforcement action. A chain-of-custody form must also be used. If the sampling is not for
possible enforcement purposes, the maximum holding time is 24-hours and a chain-of-custody form need
not be used.

Clearwater River Dissolved Oxygen and Fecal Coliform TMDL Project QAPP
Revision 0
October 4, 2007
Page 29 of 50
Table 9. Oxygen Solubility Table

Clearwater River Dissolved Oxygen and Fecal Coliform TMDL Project QAPP
Revision 0
October 4, 2007
Page 30 of 50
Appendix E
Temperature Measurement
General Considerations
Equipment Selection and Data Sources
Water temperature is usually measured in situ rather than from water collected with sampling
devices; but, if the water sample is at least 500-mL and the temperature is measured
immediately, loss of heat will be minimal. Pocket and electronic thermometers are appropriate
for measuring temperature in water samples and water surface temperatures.
Site Selection
Several characteristics of a stream must be identified and measured so that the sampling
locations best meet the study objectives. The greatest temperature variability is most likely to
occur during low flows because of localized heating or during snowmelt where tributary water
enters the mainstream. Stream zones that receive spring water or water that has flowed through
slow-velocity areas will exhibit different temperature gradients. In addition, temperatures of a
regulated stream may not have the same seasonal trends that a free-flowing stream follows.
In selecting a stream sampling site, consider the shapes of the stream surface and bottom, the
inflow and outflow patterns, the prevailing winds, the accuracy requirements for the data, and the
specific study objectives. Wind-protected streams with large littoral areas and embayments
usually have large horizontal and vertical temperature variations.
Pocket Thermometer (Armored Glass)
Field Use
A glass thermometer can be used to calibrate other instruments. It is the simplest device for
measuring surface water temperature by boat or wading. Only glass thermometers calibrated for
full immersion should be used. Standard procedure is to take the surface temperature in the
shadow of a person or boat. Immerse the thermometer in the water for at least 60 seconds until
the temperature is constant. Read the temperature without removing it from the water. Record the
temperature, the site, and the time of day for each location.
Equipment
Armored glass thermometer
Water sampling apparatus, if necessary
Waders (optional)
Watercraft, if necessary
Training
Clearwater River Dissolved Oxygen and Fecal Coliform TMDL Project QAPP
Revision 0
October 4, 2007
Page 31 of 50
Five minutes to become familiar with the scale.
Electronic Thermometers (Thermistor Type)
Field Operation
See calibration procedures.
Thermistors are accurate, convenient, and simple to use because the sensor can be placed
remotely from the readout instrumentation. There is a thermistor installed on most multiprobes
produced today, including the Eureka Manta multiprobe that is being used for the Clearwater
River Dissolved Oxygen and Fecal Coliform TMDL Study.
Allow the instrument to warm up as directed by the manufacturer. Lower the probe to the desired
depth as indicated on the cable, and read the meter when it has stabilized.
For stream temperature profiles, readings are usually made every 1 – 2 meters, with shorter
intervals in the thermocline. Accurate data can be obtained if the readings are repeated as the
probe is brought to the surface. The two readings at each depth are averaged.
Equipment
Temperature readout unit (potentiometer)
Thermistor probe suitable for use with a readout unit with a range of -10°C to +50°C.
Sufficient cable for the sampling site
Training
One-half hour or one field trip to become familiar with the calibration and particular operating
procedures of the instrument.
Calibration
Calibration certificates are available for the better mercury glass thermometers. Two water baths
are required, one at 5oC, the other at 20
oC, to calibrate other instruments. The temperature of
these water baths should be monitored to the nearest 0.1oC with a certified thermometer.
Most temperature-measuring systems have two calibration adjustments. These are the zero
setting, which moves the temperature scale (or pen position) up or down, and the span setting,
which expands or contracts the length of the temperature scale (or pen movement). For
mechanical instruments, the zero setting is made by raising or lowering the pen arm, and the span
setting is made by moving the position of the pen-arm pivot. For electrical instruments, the zero
setting is made by changing the direct current voltage-bias potentiometer, and the span setting is
made by changing the voltage-gain potentiometer (volts per o C).
Water Bath Calibration

Clearwater River Dissolved Oxygen and Fecal Coliform TMDL Project QAPP
Revision 0
October 4, 2007
Page 32 of 50
Place sensor in the 5oC water bath and adjust the zero setting until the instrument indicates
the temperature of the water bath.
Place sensor in the 20oC water bath and overcorrect the instrument by an amount equal to
the difference between the temperature of this water bath and the temperature indicated by
the instrument (error) with the span setting.
Repeat steps 1 and 2 until the error is at or near zero. The instrument should now indicate
the temperature of both water baths within 0.5°C.
When using calibrated portable systems in the field, batteries and electrical connections should
be periodically checked. Water temperatures indicated by these systems should be periodically
compared with calibrated liquid-in-glass thermometer readings. These checks are important
when unusual conditions occur and ensure that the system is indicating accurate water
temperatures.

Clearwater River Dissolved Oxygen and Fecal Coliform TMDL Project QAPP
Revision 0
October 4, 2007
Page 33 of 50
Appendix F
Specific Conductance Field Measurement
Calibration
Conductivity systems must be calibrated at least once every month and before sampling begins in
the spring. The specific conductivity calibration on a Eureka Manta probe is very stable and
remains consistently stable and accurate within 3% of a freshly calibrated probe, even while
deployed in-situ for months. Calibration readings are recorded in the instrument log book and on
field forms at the time the instrument is calibrated. Calibrate your instrument according to
manufacturer‘s instructions.
Surface Water Measurement
In situ measurement generally is preferred for determining the conductivity of surface water.
Precision should be determined about every tenth sample or more frequently, depending on study
objectives. Successive measurements should be repeated until they agree within 5% at
conductivity ≤ 100 µmhos/cm or within 3% at conductivity > 100 µmhos/cm. The conductivity
measurement reported must account for sample temperature. If using an instrument that does not
automatically temperature compensate to 25°C, record the uncompensated measurement in your
field notes, along with the corrected conductivity value. Use correction factors supplied by the
instrument manufacturer.
Flowing, shallow stream – wade to the location(s) where conductivity is to be measured.
Stream too deep or swift to wade – lower a weighted conductivity sensor from a bridge,
cableway, or boat. Do not attach a weight to the sensor or the sensor cable.
Still-water conditions – measure conductivity at multiple depths and at several points.
Record the conductivity and corresponding temperature readings without removing the sensors
from water. When the measurement is complete, remove the sensor from the water, rinse it with
deionized water, and store it. Record the stream conductivity on the field forms. Rinse the
sensor, the thermometer, and the container with deionized water. If another measurement is to be
made within the next day or two, store the sensor in deionized water. Otherwise, store the sensor
dry.

Clearwater River Dissolved Oxygen and Fecal Coliform TMDL Project QAPP
Revision 0
October 4, 2007
Page 34 of 50
Table 10. Specific Conductance Calibration Table

Clearwater River Dissolved Oxygen and Fecal Coliform TMDL Project QAPP
Revision 0
October 4, 2007
Page 35 of 50
Appendix G
The Field Notebook
This section summarizes information, guidelines, and minimum requirements that apply
generally to field measurements for all studies of water quality and the collection of basic data.
Other terms commonly used for field measurements are field parameters and field analyses.
Before proceeding with field work, check each field-measurement section for recommended
methods and equipment, detailed descriptions of measurement and quality-control procedures,
and guidelines for troubleshooting and data reporting.
Field Measurements—determinations of physical or chemical properties that are measured on-
site as close as possible in time and space to the media being sampled.
Records, Field Instruments, and Quality Assurance
Field-measurement data and other field information must be recorded, either on paper or
electronically, while in the field. Reported field measurements are defined as those data that are
entered into STORET. The conventions used for reporting field measurement data are described
at the end of each field measurement section.
Record field-measurement data, methods and equipment selected, and calibration information on
field forms and in instrument log books.
Field forms include national or study-customized field forms and analytical services request
forms; other forms and records (for example, chain-of-custody records) may be required for the
study.
Instrument log books for each field instrument are required to document calibrations and
maintenance.
Electronic records are maintained for each uniquely identified sampling location.
Field personnel must be familiar with the instructions provided by equipment manufacturers.
This manual provides only generic guidelines for equipment use and maintenance or focuses on a
particular instrument or instruments that currently are in common use. There is a large variety of
available field instruments and field instruments are being continuously updated or replaced
using newer technology. Field personnel are encouraged to contact equipment manufacturers for
answers to technical questions.
Data Quality Objective (DQO) – Representativeness
Field measurements should represent, as closely as possible, the natural condition of the surface
water or ground water system at the time of sampling.
Field teams must determine if the instruments and method to be used will produce data of the
type and quality required to fulfill study needs. Experience and knowledge of field conditions

Clearwater River Dissolved Oxygen and Fecal Coliform TMDL Project QAPP
Revision 0
October 4, 2007
Page 36 of 50
often are indispensable for determining the most accurate field-measurement value. To ensure
the quality of the data collected:
Calibration is required at the field site for most instruments. Make field measurements
only with calibrated instruments.
Each field instrument must have a permanent log book for recording calibrations and
repairs. Review the log book before leaving for the field.
Test each instrument (meters and sensors) before leaving for the field. Practice your
measurement technique if the instrument or measurement is new to you.
Have back-up instruments readily available and in good working condition.
Data Quality Objective (DQO) – Precision
Determined by taking duplicate samples. The closer the two values the better the precision.
Usually expressed as Relative Percent Difference (RPD). Duplicate samples can measure:
Laboratory analytical proficiency
Sampling proficiency
Analyte variability occurring at the sampling point
Data Quality Objective (DQO) – Accuracy
The closer the sample value is to the true sample value, the better the accuracy. What is the true
value of the sample?
Quality-assurance protocols are mandatory for every data-collection effort and include practicing
good field procedures and implementing quality-control checks. Make field measurements in a
manner that minimizes artifacts that can bias the result. Check field-measurement variability
(precision) and bias (accuracy plus variability).
Requirement: Use reference samples to document your ability to make an accurate field
measurement. Field teams also are encouraged to verify accuracy of their measurements at least
quarterly against reference samples.
For measurements such as alkalinity made on sub-samples, check precision in the field every
tenth sample by repeating the measurement three times using separate sample aliquots from the
same sample volume.
Standard procedure: Before making field measurements, allow sensor to equilibrate to the
temperature of the water being monitored. Before recording field measurements, allow the
measurement readings to stabilize. The natural variability inherent in surface water or ground
water at the time of sampling generally falls within these stability criteria and reflects the
accuracy that should be attainable with a calibrated instrument.

Clearwater River Dissolved Oxygen and Fecal Coliform TMDL Project QAPP
Revision 0
October 4, 2007
Page 37 of 50
For surface water: Allow at least 60 seconds (or follow the manufacturer‘s guidelines) for
sensors to equilibrate with sample water. Take instrument readings until the stabilization criteria
are met. Record the median of the final three or more readings as the value to be reported for that
measurement point.
For sites at which variability exceeds the criteria: Allow the instrument a longer equilibration
time and record more measurements. To determine the value to be reported for that measurement
point or well, either use the median of the final five or more measurements recorded, or apply
knowledge of the site and professional judgment to select the most representative of the final
readings.
Table 11. Stabilization Criteria for Recording Field Measurements
Standard Direct Field Measurement Stabilization Criteria for Measurements
Temperature ± 0.2°C
Conductivity
≤ 100 μS/cm† →
> 100 μS/cm →
± 5 %
± 3 %
pH (meter displays to 0.01) ± 0.1 SU‡
Dissolved Oxygen (Amperometric method) ± 0.3 mg/L
Turbidity (Turbidimetric method) ± 10 % †Microsiemens per centimeter,
‡Standard Unit
Surface Water
Field measurements must accurately represent the body of surface water or that part of the water
body being studied. Field teams need to select a method to locate the point(s) of measurement
and the method(s) to be used to make the field measurements.
Normally, the point(s) at which field measurements are made correspond to the location(s) at
which samples are collected. Standard procedures for locating points of sample collection for
surface-water sampling are detailed in Chapter A4 of the USGS National Field Manual.
Properties such as temperature, dissolved-oxygen concentration, and Eh must be measured
directly in the water body (in situ). Properties such as pH, conductivity, and turbidity are best
measured in situ, but also may be measured in a sub-sample of a composited sample. Because
determinations of alkalinity or acid-neutralizing capacity (alkalinity/ANC) cannot be made in
situ, a discrete sample must be collected or sub-sampled from a composite.
The method selected to locate the point(s) of measurement usually differs for still water and
flowing water. If the water system is well-mixed and its chemistry is relatively uniform, a single
sample could be sufficient to represent the water body. Often, however, multiple points of
measurement are needed to determine a representative set of field-measurement values.
Still Water
Clearwater River Dissolved Oxygen and Fecal Coliform TMDL Project QAPP
Revision 0
October 4, 2007
Page 38 of 50
Still-water conditions are found in storage pools, lakes, and reservoirs. Field measurements
usually are made in situ at multiple locations and depths. Alternatively, pH, conductivity, and
turbidity can be measured in a discrete sample or sub-sample. Measurement of alkalinity/ ANC
must be in a discrete sample. The location, number, and distribution of measurement points are
selected according to study objectives.
Locating Point(s) of Measurement
Flowing Water
Flowing water conditions are found in perennial (water always present) and ephemeral (water
intermittently present) streams. The location and the number of field measurements depend on
study objectives. Different study objectives could dictate different methods for locating the
measurement point(s). For example, field measurements designed to correlate water chemistry
with benthic invertebrates may require measurements on one or more grab samples that represent
populated sections of the stream channel. Generally, a single set of field measurement data is
used to represent an entire stream cross section at a sampling site and can be useful when
calculating chemical loads.
To locate measurement points:
USGS EWI (Equal Width Increment) and EDI (Equal Depth Increment) methods are
beyond the scope of our surface water sampling programs.
Most sampling is single-point grab sampling. In the Red River Basin, water monitoring
professionals have collectively decided upon the 6/10 depth point as a target for single-
point grab samples. Because it is very difficult to get a sampler to this exact point,
especially during high flows, this point is treated as an approximate sampling point.
Samples, therefore, are collected as close to this point as possible, at a point just greater
than mid-depth.
Knowledge and experience must often be applied to sampling site selection in that a
single sample will represent the entire stream width.
The sampling site must be well-mixed.
Backwaters, pools, and eddies must be avoided.
For safety purposes, the sample may have to be taken within arm‘s length or remote-
sampling-pole length of the bank.
As a rule, if stream flow feet per second • stream depth (in feet) > sampler‘s height (in
feet), Do Not Wade!
In Situ and Sub-Sample Measurement Procedures
In situ Measurement
In-situ measurement, made by immersing a field measurement sensor directly into the water may
be used to determine parameter variability at a single stream point. In situ measurement can be
Clearwater River Dissolved Oxygen and Fecal Coliform TMDL Project QAPP
Revision 0
October 4, 2007
Page 39 of 50
repeated at a variety of points if stream discharge is highly variable and a single measurement
point may not be as representative as the average of multiple measurement point values.
Measurements made directly in the surface water body (in situ) are preferable to avoid changes
that result from removing a water sample from its source. In situ measurement is necessary to
avoid changes in chemical properties of anoxic (devoid of oxygen) water.
In situ measurement is mandatory for determination of:
Temperature,
Dissolved Oxygen
Eh (Oxidation-Reduction Potential)
In situ measurement also can be used for pH, Conductivity, and Turbidity, but not for Alkalinity.
Sub-Sample Measurement
Depth- and width-integrated sampling methods can be used to collect and composite samples
that can be sub-sampled for some field measurements. Again, these sampling methods are
generally beyond the scope of our ambient surface water quality sampling programs. However,
the same field measurements can be performed on discrete samples collected with a thief, a
bailer, or a grab sampler. Sub-samples or discrete samples that have been withdrawn from a
sample-compositing device or point sampler can yield good data for conductivity, pH, turbidity,
and alkalinity as long as correct procedures are followed and the water is not anoxic (devoid of
oxygen).
Sub-samples are necessary for Alkalinity determinations.
Before using a sample-compositing/splitting device, pre-clean and field-rinse the device in
accordance with approved procedures.
When compositing and splitting a sample, follow manufacturer‘s instructions for the device
being used.
Again, do not measure Temperature, Dissolved Oxygen, or Eh on sub-samples.
Table 12. RLWD Field Data Sheet 2007 – 2008

Clearwater River Dissolved Oxygen and Fecal Coliform TMDL Project QAPP
Revision 0
October 4, 2007
Page 40 of 50

Clearwater River Dissolved Oxygen and Fecal Coliform TMDL Project QAPP
Revision 0
October 4, 2007
Page 41 of 50
Appendix H

Clearwater River Dissolved Oxygen and Fecal Coliform TMDL Project QAPP
Revision 0
October 4, 2007
Page 42 of 50
Portable Multiprobe Calibration Log
47
101
23
Exa
mpl
eY
740
NY
4.00
7.02
10.0
5Y
1412
Y0
200
Tu
rbid
ity
Cal
ibra
tio
n P
oin
ts
pH?
SpCond?
Turibidity?
uS/cm of SpCond
Std.
Pre-Cal DO %Sat
Post-Cal DO %
Sat
Pre-Cal SpCond
uS/cm
Post-Cal SpCond
uS/cm
Dat
e
DO Membrane
Change?
Act
ual
pH
Sta
nd
ard
Val
ue
Ad
just
ed f
or
Tem
p
Bar
o.
Pre
ssu
re
(mm
Hg
)DO?

Clearwater River Dissolved Oxygen and Fecal Coliform TMDL Project QAPP
Revision 0
October 4, 2007
Page 43 of 50

Clearwater River Dissolved Oxygen and Fecal Coliform TMDL Project QAPP
Revision 0
October 4, 2007
Page 44 of 50
Appendix I
Deployed Sonde Maintenance and Calibration Log

Clearwater River Dissolved Oxygen and Fecal Coliform TMDL Project QAPP
Revision 0
October 4, 2007
Page 45 of 50
Table 13. Continuous Monitoring Data Grades*
*From the British Columbia Ministry of Environment's Continuous Water-Quality Sampling Programs:
Operating Procedures

Clearwater River Dissolved Oxygen and Fecal Coliform TMDL Project QAPP
Revision 0
October 4, 2007
Page 46 of 50
Appendix J
Long-Term Sonde Storage
The following document was drafted as a checklist to guide MPCA staff in the proper storage of
water quality monitoring sondes for end of season (long-term) storage. The guidance provided is
intended to assist in protecting the instrument from conditions that could lead to problems with
future sonde use and to maintain sonde longevity. The information in this document is not
intended to replace the manufacturer‘s recommendations for storage and as such you are
encouraged to review the owner‘s manual for the specific instrumentation you have.
When preparing the instrument for storage you are advised to review each instrument for
performance. If you find that it is not fully functional or if you have had problems with any
probes during the sampling season it is recommended that you resolve the problem before storing
the instrument. If it needs manufacturer maintenance or repair, fall is the best time to do it.
Getting service on sondes can take several months and waiting until spring could result in missed
sample opportunities during the period it takes to get your instrument repaired and shipped back
to you.
YSI 6600, 6820, 6920
1) Temperature and Conductivity – Do not remove. Clean the thermistor with hot soapy
water. If it‘s especially dirty, let it soak in a solution of warm, soapy water for an hour
before cleaning it with small brush. Note: foaming tub and tile cleaner also works well.
Also clean the portals with the small brush provided in the maintenance kit.
2) Dissolved Oxygen – Do not remove. Clean the metal strips on the sensor with emery
paper. Follow the cleaning directions in the manual. Change the electrolyte in the probe.
Make sure the probe is completely immersed in water in the cup when storing long-term.
Use distilled water for storage, if possible.
3) pH – Remove the probe and insert the port plug into the bulkhead. Make sure there is no
water inside the port before inserting the plug. Clean the pH probe with warm soapy
water. If still not clean, soak the bulb in bleach for an hour. The bulb is very fragile – use
Q-tips for cleaning. Store the pH probe in the storage bottle provided with the new pH
probe. Fill the bottle about 2/3 full with one of the following: 1) a purchased premixed
pH probe storage solution, 2) a 2 M KCl solution or 3) a pH 7 standard solution with 2
drops of DO electrolyte added. To retard evaporation make sure the storage bottle has an
O ring seal under cap.
4) ORP – storage is the same as for the pH probe.
5) Ammonium, Nitrate, and Chloride - Remove the probe and insert the port plug into the
bulkhead. Make sure there is no water inside the port before inserting the plug. Place the
sensors in a storage bottle or a plastic bag, leaving it open to the atmosphere. For long-

Clearwater River Dissolved Oxygen and Fecal Coliform TMDL Project QAPP
Revision 0
October 4, 2007
Page 47 of 50
term storage these sensors are stored dry. The chloride sensor must be protected from
damage by storing it in a bottle or wrapping it in tissue paper.
6) Turbidity - Remove the probe and insert the port plug into the bulkhead. Make sure there
is no water inside the port before inserting plug. Store the probe dry in plastic bags.
Before reinstalling the probe for use change the wiper.
7) Remove the batteries from all hand pads (key pads), sondes with stand-alone deployment
capabilities, and other instruments being stored during the winter.
The HydroLab Quanta:
1) Dissolved Oxygen – Do not remove. Change the electrolyte in the probe. Make sure the
probe is completely immersed in water in the cup when storing long-term. Use distilled
water for storage, if possible.
2) pH – Do not remove. Remove the pH reference tube and clean it in warm, soapy water
with a small brush. Refill the reference tube with new reference solution and reinstall.
3) Temperature – Do not remove. No winter storage maintenance is required.
4) Conductivity – Do not remove. No winter storage maintenance is required.
5) Stirrer – Remove the paddle on the end of the stirrer. Clean the stirrer stem with emery
paper. Oil the stem and hole in the paddle with very lightweight oil and place it back on
the stem.

Clearwater River Dissolved Oxygen and Fecal Coliform TMDL Project QAPP
Revision 0
October 4, 2007
Page 48 of 50
Appendix K
Sampling from a Bridge
Sample Bottles
Follow sample bottle rinse and preservation methods as directed by the analyzing laboratory.
Typically, laboratories (including the Minnesota Department of Health) recommend that their
bottles not be rinsed before sample collection in that they are typically pre-cleaned and each lot
of sample bottles is quality-tested for cleanliness in accordance with each laboratory‘s Quality
Assurance Manual (QAM) and Standard Operating Procedures (SOPs).
Repeat-Use Sampling Equipment
Repeat-use sampling equipment such as a bucket and rope that contact sample water should be
rinsed thoroughly with sample water three times before water is collected for transfer to sample
containers. Thoroughly rinse equipment with distilled water before and after sampling at each
site.
Selecting a Stream Sampling Point
It is important to select a stream sampling point beneath the bridge that is representative of the
entire stream. Select a point beneath the bridge where the water is well mixed. Typically, this
point will be at or near the stream center where the rate of flow is at or near its maximum. Avoid
points where the stream is swirling (eddies) or has pooled. Also avoid points near the stream
banks in that this water may be atypically high in sediment.
Sampling
After you‘ve selected your sampling point, carefully lower the bucket to the stream surface. Due
to stream flow velocity and the plastic bucket‘s buoyancy it may not be possible to obtain a sub-
surface sample. Tip the bucket until it has filled with stream water, raise it to the bridge, and
empty the contents back into the stream. Repeat this procedure twice more, i.e., triple rinse the
bucket. Lower the bucket again and draw a bucket of stream water for transfer to sample
containers for analysis.
Maintaining Sample Cleanliness
When lowering and raising the sample bucket do not let it or the rope rub against the side of the
bridge, the railing, or the abutments at the ends of the bride. Such rubbing may loosen material
from the bridge, railing, or abutment that may contaminate the sample.
Ensure that the rope is affixed securely to the plastic bucket handle. When not in use, keep the
rope coiled inside of a bucket.
Quality Assurance Samples and Procedures

Clearwater River Dissolved Oxygen and Fecal Coliform TMDL Project QAPP
Revision 0
October 4, 2007
Page 49 of 50
Each type of quality assurance sample should comprise at least 10% of all samples taken. This is
to say that if you are taking both Sampler Blanks and Field Duplicates, one of each should be
taken for every nine analytical samples taken. If you typically take fewer than nine analytical
samples during one field trip, it is recommended that you develop in advance of your first field
trip a sampling schedule for the entire season and designate every tenth sample on the schedule
to be a Field Duplicate and/or a Sampler Blank. This is particularly helpful if multiple field
personnel will be doing this work throughout the course of the season.
The Sampler Blank
A sampler blank (also commonly referred to as a rinsate blank or an equipment blank) is a
sample of distilled or de-ionized water that is use to rinse the sampling device and collected for
analysis to determine if the sampling device is adequately cleaned before taking a sample for
analysis.
When collecting a Sampler Blank, decontaminate the sampling device in exactly the same way
you do before you collect a routine sample for analysis. For example, if you triple-rinse a bucket
with stream water before taking a sample for analysis, do the same before collecting a Sampler
Blank. Empty as much of the triple-rinse water from the bucket as possible before collecting the
Sampler Blank.
To collect the Sampler Blank, pour sufficient de-ionized water into the bucket to make contact
with its entire inner surface when swirling. Pour a portion of the de-ionized water into a sample
bottle and enter the station number, date, time, and ‗SB‘ on the bottle label. Place the sample in
the cooler with ice.
The Field Duplicate
A field duplicate is a second sample taken immediately after an analytical sample and from
exactly the same sampling spot in the stream. A field duplicate assesses the sampler‘s sampling
precision, the laboratory‘s analytical precision, and can provide information about the stream‘s
temporal variability. The duplicate sample should be collected in exactly the same manner as its
corresponding analytical sample including use of the normal sampling equipment cleaning
procedures. Pour a portion of the Field Duplicate water into a sample bottle and enter the same
station number, date, and time on the bottle label as its corresponding analytical sample. Also
label the bottle ‗FD.‘ Place the sample in the cooler with ice.
The Trip Blank
The Trip Blank is a sample bottle of de-ionized water that is carried in the cooler with ice
unopened during the entire sampling trip. It is typically obtained in advance from the analytical
laboratory and contains the same preservative(s), if any, as the regular sample. A Trip Blank is
typically only used when collecting samples for Volatile Organic Compound (VOC) analysis.
The Lab Sheet

Clearwater River Dissolved Oxygen and Fecal Coliform TMDL Project QAPP
Revision 0
October 4, 2007
Page 50 of 50
The Lab Sheet has a column labeled QA Type. When collecting a QA sample, enter the QA
sample type in this column. Leave the column blank if it is a routine analytical sample. The
abbreviations to use for the QA sample types are as follows:
SB : Sampler Blank FD : Field Duplicate TB : Trip Blank
The Sampler Blank and the Field Duplicate will have the same station, date, time, depth, and
substation as the analytical sample with which each is associated. The only difference between
the analytical sample and its associated QA Sample is that the QA Sample will be designated as
SB, FD, or TB in the QA Type column. The Trip Blank, if used, represents the entire sampling
trip thus will not have a station or time associated with it. For a Trip Blank enter only the date
and the QA sample type (TB) in the QA Type column.
Safety When Sampling from a Bridge
If possible park your vehicle on the up-traffic side of the bridge from which you will be
sampling. This way your vehicle will be seen by approaching drivers who are traveling in the
lane next to you and will be alerted to your presence well before they reach the bridge.
After parking, turn on you vehicle‘s flashing lights to alert approaching traffic to drive
cautiously.
If available, wear a traffic safety vest for greater visibility. If a traffic safety vest isn‘t available,
dress in bright clothing to enhance your visibility. Also use a brightly colored bucket if possible
for greater visibility. If available, set a blinking warning light or orange traffic cones next to you
while you are collecting the sample.
If you are on a Warner truss or similar bridge and it is a sunny day, also use a warning light, if
available. Place the light in one of the bridge shadows. The shadows cast by the truss work on
the bridge deck may cause optical confusion for approaching drivers and may hide your
presence.