college of management, mahidol university¸šทความ adv/nareerat...charlie charoenwong...
TRANSCRIPT
Charlie CharoenwongNanyang Technological University
Chiraphol ChiyachantanaSingapore Management University
Nareerat Taechapiroontong*College of Management, Mahidol University
The Effectiveness of Trading Halts and Investor Trading Performance: An Intraday Analysis on
the Stock Exchange of Thailand
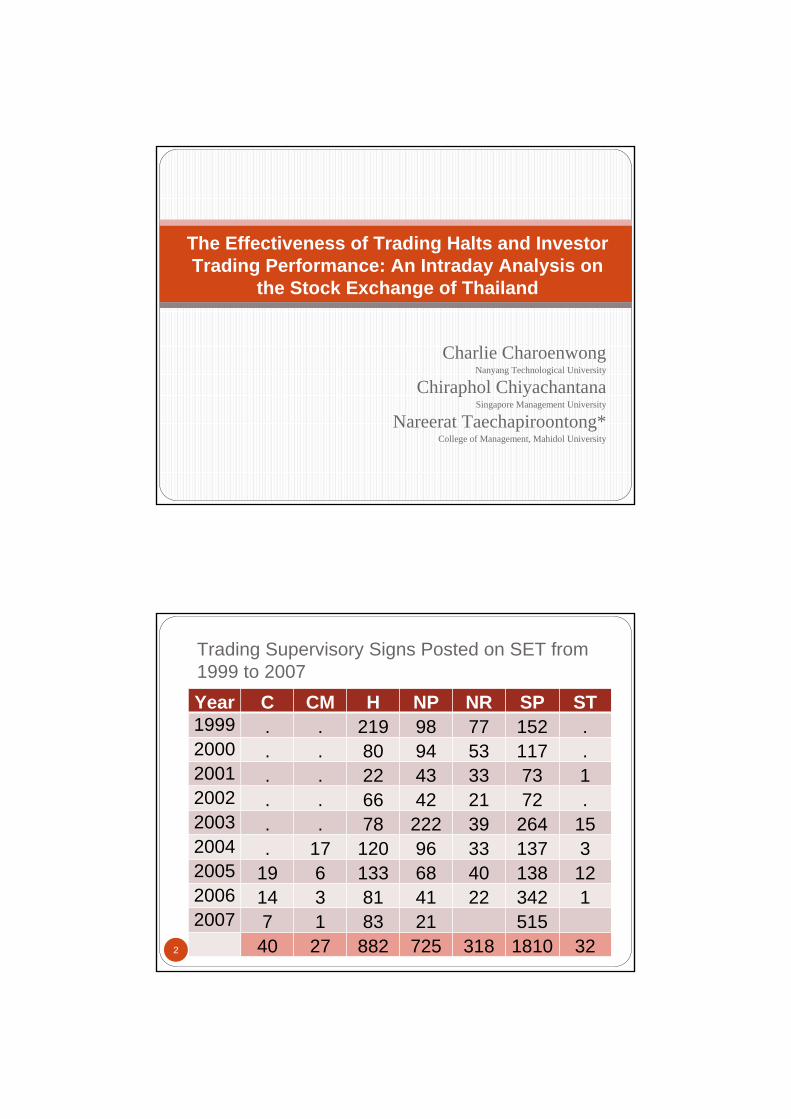
Trading Supervisory Signs Posted on SET from 1999 to 2007
2
Year C CM H NP NR SP ST1999 . . 219 98 77 152 .2000 . . 80 94 53 117 .2001 . . 22 43 33 73 12002 . . 66 42 21 72 .2003 . . 78 222 39 264 152004 . 17 120 96 33 137 32005 19 6 133 68 40 138 122006 14 3 81 41 22 342 12007 7 1 83 21 515
40 27 882 725 318 1810 32

Trading in the security is halted for a maximum period of one trading session.* This may be because of :
3
1. Critical changes or major events concerning a listed company which have occurred during trading hours. The firm involved must then clarify the situation with the SET immediately.
2. Trading conditions (e.g., price fluctuations) which indicate that some investors may have received important news or information about a listed company before it was formally disseminated to the public.
4
3. Trading which may have been halted at the request of the issuer in order to allow for clarification of a major development or for a news announcement to be made during trading hours.
4. Major events which may critically influence the ASSET trading system.
*Remarks: The Halt Sign may be removed at any time during the trading session, if deemed appropriate by the SET, and/or following clarification or resolution of the situation.

Outline
5
MotivationEmpirical QuestionsContributionsHypothesesDataMethodologyEmpirical ResultsConclusion
Motivations
6
On going debate on the benefits and costs of trading haltsSupporters
Halts allow investors an opportunity to reevaluate market informationHalts remove the possible advantage possessed by insiders Halts promote an orderly marketHalts reduce trader’s overreaction and price volatility

Motivations
7
OpponentsDelayed Price DiscoveryVolatility SpilloverTrading Interference
Empirical Questions
8
Do trading halts reduce possible speculation?Do trading halts contribute to higher price volatility?Do trading halts enhance efficiency of the market?Are halt mechanisms and durations effect the effectiveness of halts?Do trading halts affect the trading behavior of retail, institutional and foreign investors?

Contributions
9
1. Evaluate the efficacy of trading halts on a computerized order-driven market without any influence of market-makers.
2. Analyzes both types of halts that occur during the trading day (intra-day) and before the trading session starts (delayed opening).
3. Study halts with halt duration and firm size4. Investigate the investors reaction and
performance around trading halts.
Hypotheses
10
1. Delayed Price Discovery HypothesisIn a semi-strong form efficient market, if halts are tools that enable dissemination of material information, it is expected that halts should be installed unpredictably and withdrawn when full information disclosed within a short period of times. Otherwise, there is a delay in price discovery.
H1: Abnormal returns in the post-halt periods are not significantly different from zero.

Hypotheses (cont.)
11
2. Volatility Spillover HypothesisThe purpose of trading halts is to prevent the excessive volatility caused by unexpected information released during trading. If the halt is effective tool, volatility in the post-halt period should return to its normal level in a short period of time.
H2: Volatility in the post-halt periods are not significantly different from that in nonhaltperiod.
Trading halt may interrupt information flow and cause volatility to spread over a longer period by prevent trading. How long does it last?
Hypotheses (cont.)
12
3. Trading Interference HypothesisStrategic trading behavior of liquidity traders and informed traders
The need of investors to trade for liquidity and portfolio rebalancing purposes after receiving new information.
H3: Trading activities in the post-halt periods are not significantly different from those in nonhalt period.

Data Sources
13
SETSMARTHalts posted from 1999 to 2007Posted time and dateLifted time and date
Transaction dataTrade execution time, price, volume Buyer and seller sides information, such as order times, investors types (R, I, F)
Data Screening
14
Common Stocks 1999 to 2007Exclude 1. Halts surrounded by other signs such as NP, NR and
SP 20 days prior to and after halts 2. Multiple halts incurring within 20 days 3. Halted stocks having no trades within 1 days prior to
and after halts4. Halts that are posted and lifted before the opening of
the day 5. Halted stocks with price below 1 baht6. Halts having trade execution for at least 54 intervals
before and after events. The final sample comprises 228 halts.

Trading Halts Characteristics
15
Price ChangeFavorable event (Good news)Unfavorable event (Bad news)Neutral event (No news)
By comparing first trade price following resume of trade with last trade price before the halt starts. The first price is greater (less) than last trade price, a halts is defined as good (bad) news.
Time of HaltsHalts that occurred
before the opening of the trading session is classified as “delayed opening halts”during the trading session is classified as “intraday halts”
Trading Halts CharacteristicsDuration of Halts
<=60 minutes61-120 minutes and > 120 minutes
Firm Size (Market Capitalization)SmallMediumLarge
16

Summary Statistics
17
Empirical Results
18
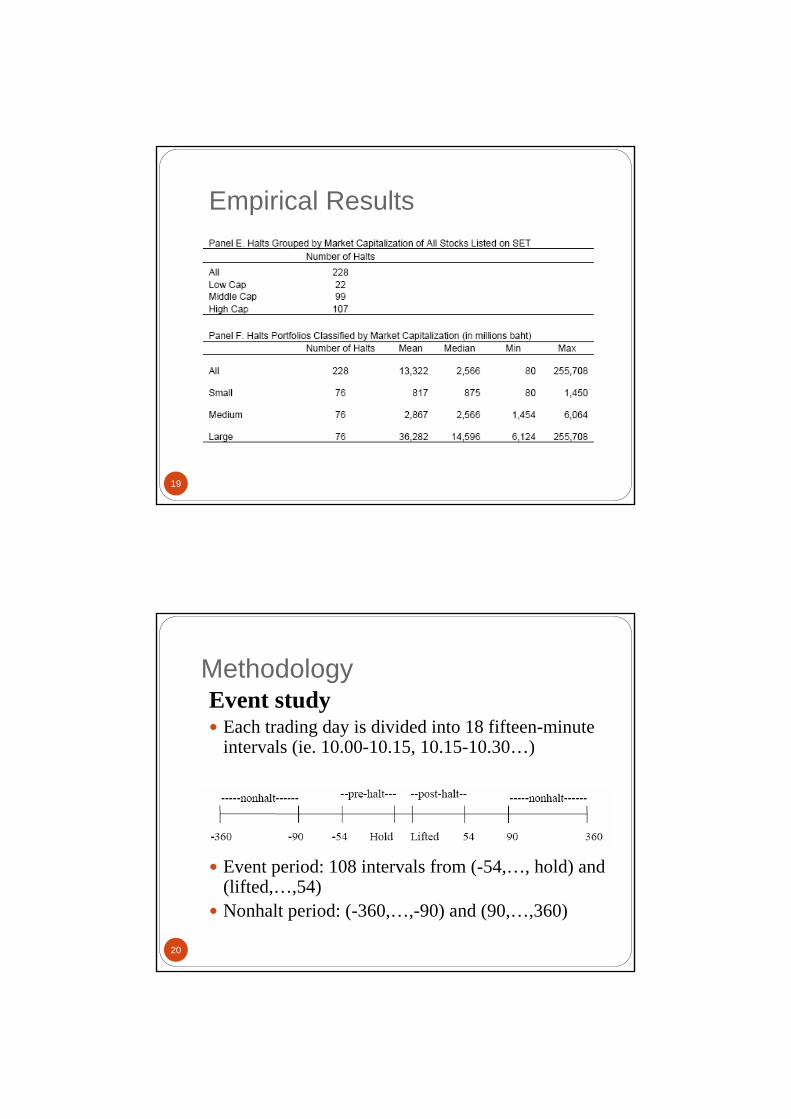
Empirical Results
19
Methodology
20
Event studyEach trading day is divided into 18 fifteen-minute intervals (ie. 10.00-10.15, 10.15-10.30…)
Event period: 108 intervals from (-54,…, hold) and (lifted,…,54)Nonhalt period: (-360,…,-90) and (90,…,360)

Methodology (cont.)
21
Abnormal Return Measure
where ( )it
ititit P
PPR −= −1
∑=
=N
titt AR
NAAR
1
1 ∑=
=T
ttT AARCAAR
1
Rit = percentage change of the last trade price of stock i on interval trelative to the last trade price on interval t -1 during halt period
Ritnon = percentage change of the last trade price of stock i on interval trelative to the last trade price on interval t -1 during nonhalt period
itnonitit RRAR −=
Methodology (cont.)
22
Volatility Measures:1. Hi-low2. Absolute return
Trading Activity Measures:1.Share volume traded2.Number of trades

Methodology (cont.)
23
Abnormal Measurement (Volatility and Trading Activity) (%) =
100*⎟⎟⎠
⎞⎜⎜⎝
⎛ −PeriodsNonhaltAcrossValueMean
PeriodsNonhaltAcrossValueMeanValuePeriodHalt
Methodology (cont.)Volatility Regression Analysis
The regression is estimated for interval 1 (15minutes after a trading halt interval) to give an indication of the relationship immediately after a trading halt.
Abnormal absolute return as abnormal volatility measures. Abnormal volume is measured from share volume. HaltTimeDum is dummy variable defined as 1 for Delayed Opening Halts and 0 for Intraday Halts.
24
iii
iii
MarketCapDurationmHaltTimeDuVolumeAbnormalVolatilityAbnormal
εααααα
+++++=
****
43
210

25
Empirical Results
26
AAR is positively significant for full sample for the first 15 minutes after halts and decreases to normal level after 30 minutes

Figure 1. CAAR around Trading Halts Classified by News Types
27
Empirical Results
28
‘No news’ trading halts exhibit a positive abnormal returns just before the halts, but not during or after a trading halt.
‘no news’ trading halts are initiated for the release of less informative announcements that have no significant impact on the returns generated.
The ‘good news’ exhibit a strong upward trend in the pre-halt and post-halt period as expected.

Empirical Results
29
The ‘bad news’ halts provide some unanticipated results.1. A positive price run up in the pre-halt
period for ‘bad news’ trading halts.Investors that anticipate trading halts and trade in the incorrect direction to the information released during the trading halt.
2. The ‘price discovery’ occurs faster on ‘bad news’ halts rather than ‘good news’halts.
Empirical Results
30
Market immediately reacts to halts. Price discovery process occurs during the first post halt interval for positive news as price reach its new equilibrium level and does not seem to reverse to the non-halt period.The increase in prices in pre-halt period indicates the existence of information leakage or insider trading prior to halts imposed. Thus halts are effective in controlling pre-halt information asymmetry.Consistent with hypothesis 1

31
32
Figure 2. CAAR around Trading Halts Classified by Halt Time
•Delayed opening: high return at the opening•Intraday halts: insignificant negative return

33
34
Figure 3. CAAR around Trading Halts Classified by Halt Durations
•Shorter time duration is followed by favorable event•Longer halt duration is associated with unfavorable information.

35
36
Figure 4. CAAR around Trading Halts Classified by Halt Stocks Portfolios

37
38
Figure 5. Abnormal Volatility around Trading Halts Classified by News Types

Empirical Results
39
Volatility increases significant after trade resume and decline significantly to normal level within one hour.
This implies that halts are successful in controlling volatility. Halts do not cause volatility to spread over long period.Halts help prevent overreaction to announcements by facilitating the distribution of valuable information during the halt periods.
Empirical Results
40
Good news contribute the highest volatility than other types of news.

41
42
Figure 6. Abnormal Volatility around Trading Halts Classified by Halt Time
•Delayed openings halts shows higher volatility and last longer than intraday halts.

43
44
Figure7. Abnormal Volatility around Trading Halts Classified by Halt Durations
•Long duration >120 mins shows highest volatility in terms of absolute return and last longer than the shorter halt duration.

45
46
Figure8. Abnormal Volatility around Trading Halts Classified by Halt Stock Portfolios
• Medium size stocks shows highest volatility after halts but declines significantly within one hour.

47
48
Figure 9. Abnormal Share Volume around Trading Halts Classified by News Types

Empirical Results
49
Both trading volume and number of trades greatly increase one day before halts.Then significantly increase after resuming of trades during the first fifteen minutes.Trading activities decline immediately after first fifteen minutes hour and stay higher than nonhaltperiod but gradually decrease and almost fully reverse at the beginning of third days. Trading activity is more pronounced for positive news, delayed opening, large firm and long duration halts.Investors tends to slowly adjust their liquidity and portfolio rebalancing.
50

51
Figure10. Abnormal Share Volume around Trading Halts Classified by Halt Time
52

53
Figure11. Abnormal Share Volume around Trading Halts Classified by Halt Durations
54

55
Figure12. Abnormal Share Volume around Trading Halts Classified by Halt Portfolios
56
•Abnormal share trading volume significantly positively related to abnormal volatility. •Long duration of halt significantly results in high abnormal volatility.
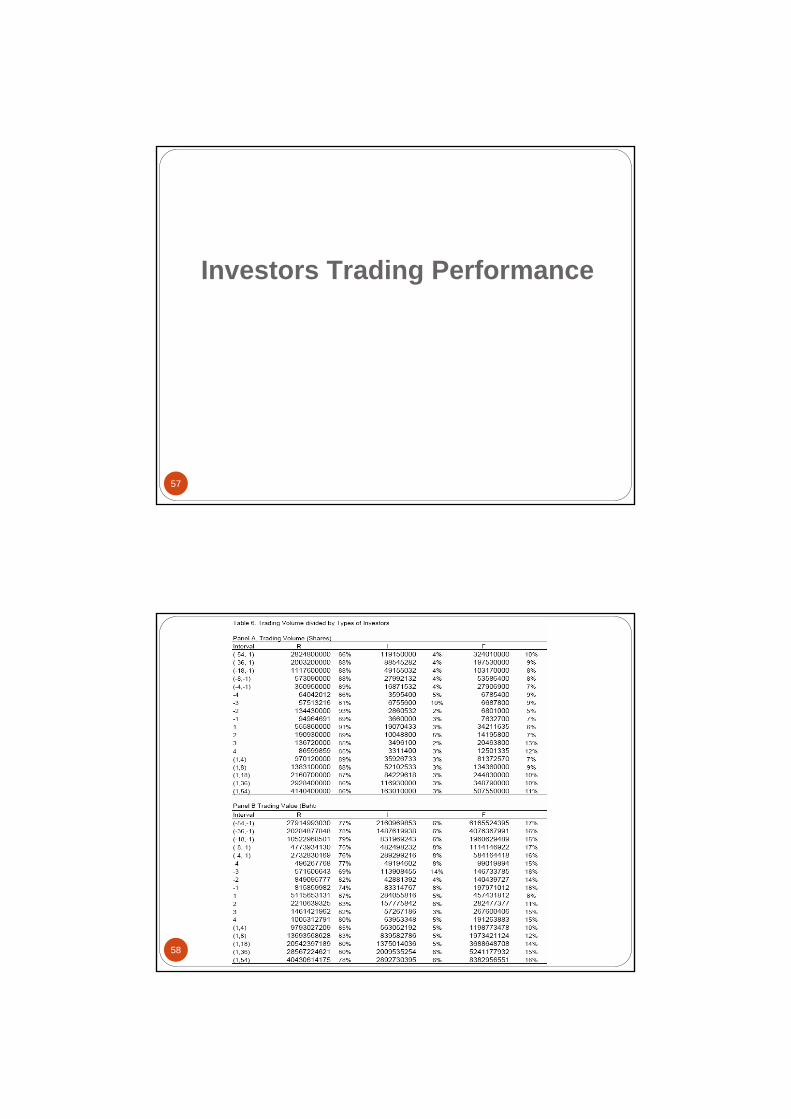
Investors Trading Performance
57
58

Empirical Results
59
Retails are major players for halted stocks in terms of volume and value (account for more than 70%)Foreigners tend to trade at high price stocks.Domestic investors (R, I) increase their trading (30,45 minutes) before halts.
Domestic investors know better than foreign investors.
60

Retails concentrate on small size stocks and medium stocks. Foreigners focus on large size stocksInstitutions focus on larger size stocks but less volume than those of foreigner.
61
Investors Trading Performance
62
Trade Price PerformancePrice ratio:where

63
The ratio indicates which investor type trades at better price than the others in each interval.
a measure of how much more or less an investor pays than the average price on that interval when he buys and how much more or less he receives when he sells.
64

65
66

Empirical Results
67
Retails trade at better price than foreign investors. Retails do not trade better than institutionsRetails aggressively buy even at higher price than institutions just before the halt for goods news.Retails continuously buy at lower price than foreign three days prior to trading halts, especially for good news.
Empirical Results
68
Institutions start buying at lower price than foreign just one day prior to trading halts.
This implies that there is leakage of information before halts. In other words, domestic investors know more than foreign investors and take advantage of this information by purchasing earlier at a lower price. They buy on good news.
Retails sell at higher price than institutions after halts during good news.Retails follow contrarian trading strategy by buying low and selling high. Their performance is more manifest for good news.

Conclusions
69
In general, trading halts are effective in maintaining stability and an orderly trading in the market. Trading halts serve as tool to facilitate price discovery process by allowing investors opportunity to adjust their trading interests and react to the material information. The return and volatility tend to reverse to their normal trading period in a short period of time. However, high trading activity appears before and after halts but slowly decays within 3 days after resumption of trades. Policy makers realize that long duration of halts may cause higher volatility than short duration.
Conclusions
70
The evidence shows that domestic investors trade at better prices than foreign investors during trading halts. Retail domestic investors trade at the most favorable price than institutional domestic and foreign investors.Retails follow contrarian trading strategy by buying low and selling high.