dama実験における中性子 バックグラウンドの季節...
TRANSCRIPT

DAMA実験における中性子バックグラウンドの季節変動2
名古屋大学
久野光慧 / 森下美沙希
2015/5/17
1

内容
• muonとneutrinoはDAMAの示すシグナルとなるような十分なneutronをつくるか
• DAMAに注目した点
• neutronとdark ma0erの区別
2

neutron 破砕
• detecterの周りのシールドとしてPbがよく使われる
• muon、neutrinoがPbに衝突することでneutronをつくる
• neutrinoのエネルギー Eν > 7 MeVで208Pbからneutronがでる
• 8B太陽neutrinoのエネルギーは7 MeVより大きい値をもつ
85B ! 242He + e+ + ⌫e
3
ν
n Pb
> 7 MeV
ν
14. Neutrino mixing 25
14.4. Measurements of ∆m2⊙
and θ⊙
14.4.1. Solar neutrino observations :
Observation of solar neutrinos directly addresses the theory of stellar structure andevolution, which is the basis of the standard solar model (SSM). The Sun as a well-definedneutrino source also provides extremely important opportunities to investigate nontrivialneutrino properties such as nonzero mass and mixing, because of the wide range of matterdensity and the great distance from the Sun to the Earth.
The solar neutrinos are produced by some of the fusion reactions in the pp chain orCNO cycle. The combined effect of these reactions is written as
4p → 4He + 2e+ + 2νe. (14.63)
Figure 14.2: The solar neutrino spectrum predicted by the BS05(OP) standardsolar model [103]. The neutrino fluxes are given in units of cm−2s−1MeV−1 forcontinuous spectra and cm−2s−1 for line spectra. The numbers associated with theneutrino sources show theoretical errors of the fluxes. This figure is taken from thelate John Bahcall’s web site, http://www.sns.ias.edu/~jnb/.
Positrons annihilate with electrons. Therefore, when considering the solar thermal energygeneration, a relevant expression is
4p + 2e− → 4He + 2νe + 26.73 MeV − Eν , (14.64)
August 29, 2014 14:37

neutron event rate
Rµ ⇠ 10
�34nV neutrons/sec
R⌫ ⇠ 10
�35nV neutrons/sec
R ⇠ ��nV
R⌫
Rµ⇠ 0.1
neutronの比率をR
8B太陽neutrinoのfluxと208Pbをターゲットとしたcross secBonより
muonについて
これより、neutron比の関係は
Φ:flux σ:cross secBon n:ターゲットの数密度 V:体積 4
Φν 〜 106 cm-‐2 s-‐1 σν 〜 10−41 cm2
Φμ 〜 10-‐8 cm-‐2 s-‐1 σμ 〜 10−26 cm2

DAMAとの対応
• Pbについて、数密度n 〜 1029 m-‐3、ターゲットの体積V 〜 1000 m3 とする – Rν 〜 100 neutrons/days – Rν + Rμ 〜 1000 neutrons/days – 〜 1 m3 of lead is present in the DAMA/LIBRA shield ?????
• これはDAMAの検出比と似ている – 250 kg NaI(Tl), recoil energy 2-‐6 keV – 3.5 × 10⁶ events/keV, Exposure 1.33 ton × yr – 〜2.6 x 10³ event/keV/kg/yr 〜1700 event/keV/day 〜7000 event/day ????? – (0.0112 ± 0.0012) cpd/kg/keV 〜 2.5 cpd/keV 〜 10 cpd ?????
• muonによるneutronの(n,p)反応のみを考えたときのmean free pathはλ = 2.6 m – このときの有効体積はVeff 〜 450 m3 程度と見積もられる
• これはDAMAのシグナルを説明するために必要な体積Vに近い
• neutron生成の全ての過程を考えている訳ではない – V 〜 1000 m3 をより小さく補正できるかもしれない
⇒muon+neutrino modelでDAMAのシグナルを説明できるかも 5

DAMAに注目した点
• シールドの構造
• しきい値
7
tron multiplicity as a function of muon energy betweenthe proposed parameterization based on the measure-ments [31, 41] and the FLUKA simulation.
Md − Mmc
Md= 0.64E0.02
µ − 0.74E−0.12µ , (10)
where Md is the measured neutron multiplicity, Mmc isthe simulated neutron multiplicity in FLUKA and Eµ isthe muon energy in GeV. After correcting the neutronmultiplicity in the FLUKA simulation, good agreementis found between the data and the simulation as can beseen in Fig. 11.
Mean Muon Energy (GeV)0 50 100 150 200 250 300 350 400
)-2
g c
mµ
Neut
ron
Yiel
d (n
/
-410
HertenbergerBoehm
Bezrukov
Bezrukov
Enikeev
LVD
AgliettaLVD-corrected
The fitted function with the corrected LVD data
FLUKA after correcting the neutron multiplicity
FIG. 11: The muon-induced neutron production rate versusthe mean muon energy after correcting the neutron multiplic-ity in the FLUKA simulation.
Further improvement might be gained with minormodifications in the inclusion of deep inelastic scatter-ing of muons on nucleons. More generally, it is desir-able to have more data for high energy muon interac-tions in the appropriate materials in order to more ac-curately tune the simulations relevant to neutron pro-duction deep underground. Nonetheless, whether we useour global fit function to the measured data or rely uponthe multiplicity-corrected FLUKA simulation, the muon-induced neutron yield reproduces the data within an ac-curacy of about 15%.
B. Media Dependence of Neutron Production Rate
The muon-induced production rate for neutrons de-pends critically on knowledge of the chemical compo-sition and density of the medium through which themuons interact. We have studied this dependence us-ing the FLUKA simulation specific to Gran Sasso in or-der to compare directly with Ref. [38]. The dependenceon atomic weight is shown in Fig. 12, where the generaltrend is well described by a power law, consistent withRef. [38] using slightly different fitting parameters.
< n >= 4.54 × 10⁻⁵A0.81n/(µ g cm−2). (11)
Atomic Weight of a Medium10 210
)-2
g c
mµ
Neut
ron
Yiel
d (n
/
-310
C
2n+2HnC
NaNaCl
Fe Cd
Au
Pb
FIG. 12: Simulation of the muon-induced neutron productionrate versus the atomic weight of the medium.
The contribution to the neutron production rate fromelectromagnetic showers becomes more important for aheavy target, since the cross-section of an electromag-netic muon interaction is proportional to Z2/A. Fig. 13shows this dependence where, again, the general trendcan be described using a power law:
< n >= 1.27 × 10⁻⁴(Z2
A)0.92n/(µ g cm−2). (12)
/A2Z0 5 10 15 20 25 30 35
)-2
g c
mµ
Neut
ron
Yiel
d (n
/
-310
C2n+2HnC
NaNaCl
Fe Cd
Au
Pb
FIG. 13: Simulation of the muon-induced neutron productionrate versus Z2/A of the medium.
C. Neutron Fluxes and Differential Spectra atUnderground Sites
1. Neutron Flux at Rock/Cavern Boundary
The muon-induced neutron flux emerging from therock into the cavern has been estimated for the variousunderground sites considered in this work. We derivethe neutron flux utilizing the FLUKA simulation with
6

Page 2 of 11 Eur. Phys. J. C (2013) 73:2648
Fig. 1 Schematic view of the DAMA/LIBRA apparatus. The 25highly radiopure NaI(Tl) crystal scintillators (5-rows by 5-columnsmatrix), housed in the sealed copper box continuously maintainedin High Purity Nitrogen atmosphere, within low-radioactive passiveshield are visible. Mostly outside the installation, the DAMA/LIBRAapparatus is also almost fully surrounded by about 1 m concrete madeof the Gran Sasso rock. The copper guides of the calibration systemare also shown. For details see Ref. [1]
dent, very effective and, in addition, it allows to test a largeinterval of cross sections and of halo densities.
This DM signature might be mimiced only by systematiceffects or side reactions able to account for the whole ob-served modulation amplitude and to simultaneously satisfyall the requirements given above. No one is available [1–3,6, 7, 21–23].
The full description of the DAMA/LIBRA set-up duringthe phase1 and other related arguments have been discussedin details in Refs. [1–3, 7] and references therein. Here wejust remind—as can be seen in Fig. 1—that the sensitivepart of this set-up is made of 25 highly radiopure NaI(Tl)crystal scintillators (5-rows by 5-columns matrix) having9.70 kg mass each one. In each detector two 10 cm longUV light guides (made of Suprasil B quartz) act also as op-tical windows on the two end faces of the crystal, and arecoupled to two low background photomultipliers (PMTs)working in coincidence at single photoelectron level. Thelow background 9265-B53/FL and 9302-A/FL PMTs, de-veloped by EMI-Electron Tubes with dedicated R&Ds,were used in the phase1; for details see Refs. [1, 20, 22]and references therein. The detectors are housed in asealed low-radioactive copper box installed in the centerof a low-radioactive Cu/Pb/Cd-foils/polyethylene/paraffinshield; moreover, about 1 m concrete (made from the GranSasso rock material) almost fully surrounds (mostly out-side the barrack) this passive shield, acting as a furtherneutron moderator. A threefold-levels sealing system pre-vents the detectors to be in contact with the environmentalair of the underground laboratory [1]. The light responseof the detectors during phase1 typically ranges from 5.5to 7.5 photoelectrons/keV, depending on the detector. The
hardware threshold of each PMT is at single photoelectron,while a software energy threshold of 2 keV electron equiva-lent (hereafter keV) is used [1, 20]. Energy calibration withX-rays/γ sources are regularly carried out in the same run-ning condition down to few keV [1]; in particular, doublecoincidences due to internal X-rays from 40K (which is atppt levels in the crystals) provide (when summing the dataover long periods) a calibration point at 3.2 keV close tothe software energy threshold (for details see Ref. [1]). TheDAQ system records both single-hit events (where just oneof the detectors fires) and multiple-hit events (where morethan one detector fires) up to the MeV region despite the op-timization is performed for the lowest one. The radiopurity,the procedures and details are discussed in Refs. [1–3, 7]and references therein.
The data of the former DAMA/NaI setup (0.29 ton× yr) and, later, those of the first 6 annual cycles ofDAMA/LIBRA (0.87 ton × yr) have already given posi-tive model independent evidence for the presence of DMparticles in the galactic halo with high confidence level onthe basis of the exploited DM annual modulation signature[2, 3, 7, 22].
In this paper the final model independent result ofDAMA/LIBRA–phase1, obtained by including in the anal-ysis also the data collected during the last seventh an-nual cycle of operation, is presented. The total exposure ofDAMA/LIBRA–phase1 is: 1.04 ton × yr; when includingalso that of the first generation DAMA/NaI experiment it is1.33 ton × yr, corresponding to 14 annual cycles.
2 The results
Table 1 summarizes the information about the seven annualcycles of DAMA/LIBRA–phase1; the cumulative exposure,considering also the former DAMA/NaI, is also given.
The total number of events collected for the energy cali-brations during the entire DAMA/LIBRA–phase1 is about9.6 × 107, while about 3.5 × 10⁶ events/keV have beencollected for the evaluation of the acceptance window ef-ficiency for noise rejection near energy threshold [1].
As it can be inferred from Table 1, the duty cycle of theexperiment is high; the routine calibrations and, in partic-ular, those related with the acceptance windows efficiencymainly affect it. The further improvement of the duty cyclein the last two annual cycles is mainly due to the improvedperformances of the new transient digitizers and DAQ sys-tem installed at fall 2008 before the start of the sixth annualcycle [3].
The same procedures previously adopted [1–3, 7] havebeen exploited also in the analysis of the data of the seventhannual cycle and several analyses on the model-independentinvestigation of the DM annual modulation signature havebeen performed.
• neutronを遮断するためにPolyethyleneがよくきく
• DAMAのシールドの構造をみると、neutronを多くつくるPbの外側にPolyethyleneのシールドがある
• DAMAの構造ではPbからでるneutronを遮断できない可能性がある
WPAS2014, Hyun Su Lee, Ewha Womans University
Shielding for External background reduction
Mineral Oil (30cm) & Muon det.
Lead (15cm)
Polyethylene (5cm)
Copper (10cm)
CsI(Tl) crystal
4
Cu/Pb/Cd-‐foils/polyethylene/paraffin/…
DAMA KIMS
7
しきい値
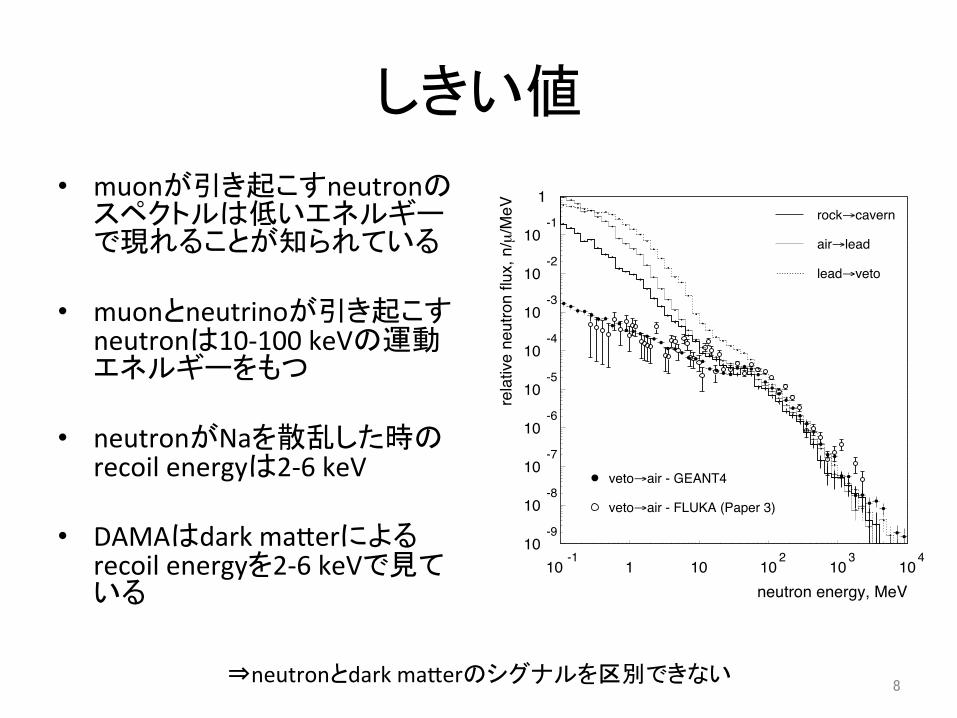
• muonが引き起こすneutronのスペクトルは低いエネルギーで現れることが知られている
• muonとneutrinoが引き起こすneutronは10-‐100 keVの運動エネルギーをもつ
• neutronがNaを散乱した時のrecoil energyは2-‐6 keV
• DAMAはdark ma0erによるrecoil energyを2-‐6 keVで見ている
⇒neutronとdark ma0erのシグナルを区別できない
rock
veto
µ
cavern
1n
C1
C2n2
detector
lead
Fig. 9. Monte Carlo geometry model for a 250 kg liquid xenon module shielded by50 cm of hydrocarbon scintillator (40 g/cm2) and 30 cm of lead (340 g/cm2). Thefigure also shows a GEANT4 event in which a 280 GeV muon produces two neutrons(n1, n2) in the lead shielding which are captured in the hydrocarbon veto (C1, C2).
10-9
10-8
10-7
10-6
10-5
10-4
10-3
10-2
10-1
1
10-1
1 10 102
103
104
neutron energy, MeV
rela
tive
neut
ron
flux,
n/µ
/MeV rock→cavern
air→lead
lead→veto
veto→air - GEANT4
veto→air - FLUKA (Paper 3)
Fig. 10. Energy spectra of muon-induced neutron fluxes across several boundaries.The thick line represents the flux at the rock face for an empty cavern (curve labelled‘GEANT4 - F+R’ in Fig. 8). The spectrum of neutrons exiting the hydrocarbonveto obtained with FLUKA (Paper 3) is also shown.
15
8

区別の方法
• 2-‐4 keVのphaseのずれ
• 場所依存
9

phaseのずれで区別 Eur. Phys. J. C (2013) 73:2648 Page 5 of 11
Table 4 Modulation amplitude(A), period (T = 2π
ω ) and phase(t0), obtained by fitting, with theformula: A cosω(t − t0), thesingle-hit residual rate of theentire DAMA/LIBRA–phase1,and including also the formerDAMA/NaI data. The results arewell compatible withexpectations for a signal in theDM annual modulationsignature
A (cpd/kg/keV) T = 2πω (yr) t0 (days) C.L.
DAMA/LIBRA–phase1
2–4 keV (0.0178 ± 0.0022) (0.996 ± 0.002) 134 ± 7 8.1σ
2–5 keV (0.0127 ± 0.0016) (0.996 ± 0.002) 137 ± 8 7.9σ
2–6 keV (0.0097 ± 0.0013) (0.998 ± 0.002) 144 ± 8 7.5σ
DAMA/NaI & DAMA/LIBRA–phase1
2–4 keV (0.0190 ± 0.0020) (0.996 ± 0.002) 134 ± 6 9.5σ
2–5 keV (0.0140 ± 0.0015) (0.996 ± 0.002) 140 ± 6 9.3σ
2–6 keV (0.0112 ± 0.0012) (0.998 ± 0.002) 144 ± 7 9.3σ
Fig. 3 The data points are the modulation amplitudes of each singleannual cycle of DAMA/NaI and DAMA/LIBRA–phase1 experiments.The error bars are the 1σ errors. The same time scale and the sameenergy intervals as in Fig. 2 are adopted. The solid horizontal linesshows the central values obtained by best fit over the whole data set.The χ2 test and the run test accept the hypothesis at 90 % C.L. thatthe modulation amplitudes are normally fluctuating around the best fitvalues. See text
energy interval; the same analysis in the (6–14) keV en-ergy region shows instead only aliasing peaks. Neither otherstructure at different frequencies has been observed (see alsoRef. [7]).
Absence of any significant background modulation in theenergy spectrum has been verified in energy regions not ofinterest for DM.2 As an example, the measured rate inte-grated above 90 keV, R90, as a function of the time has beenanalysed. Figure 5 shows the distribution of the percentagevariations of R90 with respect to the mean values for allthe detectors in the entire DAMA/LIBRA–phase1 data. Itshows a cumulative Gaussian behaviour with σ ≃ 1 %, well
2In fact, the background in the lowest energy region is essentially dueto “Compton” electrons, X-rays and/or Auger electrons, muon inducedevents, etc., which are strictly correlated with the events in the higherenergy region of the spectrum. Thus, if a modulation detected in thelowest energy region were due to a modulation of the background(rather than to a signal), an equal or larger modulation in the higherenergy regions should be present.
accounted by the statistical spread expected from the usedsampling time. Moreover, fitting the time behaviour of R90including a term with phase and period as for DM particles,a modulation amplitude compatible with zero has also beenfound for all the annual cycles (see Table 5). This also ex-cludes the presence of any background modulation in thewhole energy spectrum at a level much lower than the effectfound in the lowest energy region for the single-hit events. Infact, otherwise—considering the R90 mean values—a mod-ulation amplitude of order of tens cpd/kg would be presentfor each annual cycle, that is ≃100σ far away from the mea-sured values. Similar result is obtained when comparing thesingle-hit residuals in the (2–6) keV with those in other en-ergy intervals; for example Fig. 6 shows the single-hit resid-uals in the (2–6) keV and in the (6–14) keV energy regionsfor the entire DAMA/LIBRA–phase1 data as if they werecollected in a single annual cycle (i.e. binning in the vari-able time from the Jan 1st of each annual cycle). It is worthnoting that the obtained results account of whatever kind ofbackground and, in addition, no background process able tomimic the DM annual modulation signature (that is able tosimultaneously satisfy all the peculiarities of the signatureand to account for the measured modulation amplitude) isavailable (see also discussions e.g. in Refs. [1–3, 6, 7, 54–60]).
Also in the entire DAMA/LIBRA–phase1 a further rele-vant investigation has been performed by applying the samehardware and software procedures, used to acquire and toanalyse the single-hit residual rate, to the multiple-hit one.In fact, since the probability that a DM particle interacts inmore than one detector is negligible, a DM signal can bepresent just in the single-hit residual rate. Thus, the com-parison of the results of the single-hit events with those ofthe multiple-hit ones corresponds practically to compare be-tween them the cases of DM particles beam-on and beam-off. This procedure also allows an additional test of the back-ground behaviour in the same energy interval where the pos-itive effect is observed. In particular, in Fig. 7 the resid-ual rates of the single-hit events measured over the wholeDAMA/LIBRA–phase1 annual cycles are reported, as col-lected in a single cycle, together with the residual rates of
• ここまではrecoil energyが2-‐6 keVの場合を考えてきた
• 2-‐4 keVのエネルギーを使ったDAMAの見せたbest-‐fit phaseは〜10daysだけ前にずれる
• このずれをmuon+neutrino modelで説明できるれば信憑性があがる
⇒neutronとdark ma0erの区別できるかも 10

場所で区別
3
4. Definition of Depth and Total Muon Flux forUnderground Sites
The data on the total muon intensity at the variousunderground sites is summarized in Table I and Fig. 3.We use equation (4) to calculate the total muon fluxfor Homestake (flat-overburden) at the depth 4.3 ± 0.2km.w.e. [18]. The relative difference between the dataand our model (equation (4)) is shown in Fig. 4, wherethe uncertainties reflect the experimental uncertaintiesin Table I. In order to circumvent the misuse of verticalmuon intensity in comparing sites with flat overburdento those under mountains, we define the equivalent depthrelative to a flat overburden by the experimental mea-surements of the total muon intensity. This definitionand these intensities are used hereafter.
Equivalent Vertical Depth (km.w.e.)2 3 4 5 6
)-1 s
-2To
tal M
uon
Flux
(cm
-910
-810
-710
Flat-overburdan sitesKamiokaGran SassoFrejusHomestake
WIPP
Soudan
Boulby
Sudbury
FIG. 3: The total muon flux measured for the various un-derground sites summarized in Table I as a function of theequivalent vertical depth relative to a flat overburden. Thesmooth curve is our global fit function to those data takenfrom sites with flat overburden (equation (4)).
TABLE I: Summary of the total muon flux measured at theunderground sites and the equivalent vertical depth relativeto a flat overburden.
Site Total flux Depthcm−2sec−1 km.w.e.
WIPP (4.77±0.09) × 10−7 [6] 1.585±0.011Soudan (2.0±0.2) × 10−7 [15] 1.95±0.15Kamioka (1.58±0.21) × 10−7 [8] 2.05±0.15†
Boulby (4.09±0.15) × 10−8 [9] 2.805±0.015Gran Sasso (2.58±0.3) × 10−8[this work] 3.1±0.2†
(2.78±0.2) × 10−8 [16] 3.05±0.2†
(3.22±0.2) × 10−8 [17] 2.96±0.2†
Frejus (5.47±0.1) × 10−9 [14] 4.15±0.2†
(4.83 ±0.5) × 10−9 [this work] 4.2±0.2†
Homestake (4.4±0.1 × 10⁻⁹)[this work] 4.3±0.2Sudbury (3.77±0.41) × 10−10 [12] 6.011±0.1
† Equivalent vertical depth with a flat overburdendetermined by the measured total muon flux.
Equivalent Vertical Depth (km.w.e.)2 3 4 5 6
Dat
aD
ata-
Fit
≡to
tI
∆
-0.15
-0.1
-0.05
0
0.05
0.1
WIPP
Soudan
Kamioka
Boulby
Gran Sasso
Frejus
Sudbury
FIG. 4: The relative deviation between data on the totalmuon flux and our global fit function. The horizontal linesindicate the root-mean-square deviation amongst the resid-uals based upon the experimental uncertainties in the mea-surements.
B. Stopping Muon Intensity
Stopping-muons are also a source of background. Forexample, µ− capture on a nucleus produces neutronsand radioactive isotopes. The total stopping-muon ratehas contributions from cosmic-ray muons coming tothe end of their range, secondary muons generated lo-cally through interactions of the primary muons (due tovirtual-photo interactions with nuclei), and local muonproduction by real photons (π0-decay in electromagneticshowers). It is customary to quote results in terms of theratio, R, of stopping muons to through-going muons. Adetailed calculation is provided by Cassiday et al. [13].The total ratio, R(h), of stopping-muons to through-going muons (vertical direction) at different depths canbe parameterized as [19]
R(h) ≈ γµ∆Eeh/ξ
(eh/ξ − 1)ϵµ, (7)
where γµ = 3.77 for Eµ ≥ 1000 GeV [20], ξ = 2.5 km.w.e.,∆E ≈ αh, α = 0.268 GeV/km.w.e. [21] for Eµ ≥ 1000GeV [20], h is the depth of an underground laboratory,and ϵµ = 618 GeV [20]. For large depths, as can be seenin Fig. 5, this ratio is less than 0.5% and is hereafterneglected for the underground sites considered in thisstudy.
C. Muon Energy Spectrum and AngularDistribution
In addition to the total muon intensity arriving at agiven underground site, we require knowledge of the dif-ferential energy and angular distributions in order to gen-erate the muon-induced activity within a particular ex-perimental cavern. The energy spectrum is discussed in
8
the corrected neutron multiplicity (equation (10)) andthe muon fluxes and distributions outlined in Section II.The neutron flux (φn) as a function of depth is shownin Fig. 14 where we have included a fit function of thefollowing form:
φn = P0(P1
h0)e−h0/P1 , (13)
where h0 is the equivalent vertical depth (in km.w.e.)relative to a flat overburden. The fit parameters are P0 =(4.0 ± 1.1)×10−7 cm−2s−1 and P1 = 0.86 ± 0.05 km.w.e..
Depth (km.w.e.)2 3 4 5 6
)-1 s
-2N
eutr
on F
lux
(cm
-1110
-1010
-910
-810
WIPPSoudan
Kamioka
BoulbyGran Sasso
Sudbury
FIG. 14: The total muon-induced neutron flux deduced forthe various underground sites displayed. Uncertainties oneach point reflect those added in quadrature from uncertain-ties in knowledge of the absolute muon fluxes and neutronproduction rates based upon our simulations constrained bythe available experimental data.
In Table V we summarize the neutron flux at therock/cavern boundary for the various sites consideredand note that we have not included the effect of neutronsthat emerge from one surface and back-scatter back intothe cavity. The results are in good agreement with theexisting simulation results for Gran Sasso [42]. If thesimulation results for Boulby [65] are modified using ourneutron multiplicity correction, good agreement is alsofound between the two results. It is relevant to note thatthere is a significant fraction of the neutrons with energyabove 10 MeV.
TABLE V: The muon-induced neutron flux for six sites (inunits of 10−9 cm−2s−1). The total flux is included along withthose predicted for neutron energies above 1, 10, and 100MeV.
Site total > 1.0 MeV > 10MeV > 100MeVWIPP 34.1 10.78 7.51 1.557Soudan 16.9 5.84 4.73 1.073Kamioka 12.3 3.82 3.24 0.813Boulby 4.86 1.34 1.11 0.277Gran Sasso 2.72 0.81 0.73 0.201Sudbury 0.054 0.020 0.018 0.005
2. Neutron Production in Common Shielding Materials
Fast neutrons can also be created by muons passingthrough the materials commonly used to shield a detectortarget from natural radioactivity local to the surroundingcavern rock. Fig. 15 shows the neutron yield in somecommon shielding materials. We have also included asimulation for germanium which will prove useful laterin this paper when we consider the DSR for experimentsbased on this target material.
Depth (km.w.e.)2 3 4 5 6
)-1
s-3
Neu
tron
Pro
duct
ion
Rat
e (n
cm
-1310
-1210
-1110
-1010
-910
-810 WIPPSoudan
KamiokaBoulby
Gran Sasso
Sudbury
LeadPolyethyleneCopperGermanium
FIG. 15: The muon-induced neutron production rate pre-dicted for some common detector shielding materials. Notethat minor variations due to neutron back-scattering havebeen neglected in these calculations.
The fitted functions have the same form as equa-tion (13) but with different values for parameters whichare provided in Table VI. To convert the neutron produc-tion rate to the total neutron flux, one multiplies equa-tion (13) by the average muon path length which dependsupon the detector geometry.
TABLE VI: Summary of the fitting parameters describing themuon-induced neutron production rate in common detectorshielding materials.
Material P0 P1
Lead (7.84±2.21) × 10−8 0.86±0.05Polyethylene (6.89±1.95) × 10−9 0.86±0.05Copper (2.97±0.838) × 10−8 0.87±0.05Germanium (3.35±0.95) × 10−8 0.87±0.05
Generally speaking, muon-induced neutrons producedin a detector target or surrounding shield can be activelyvetoed in coincidence with the primary, depending on theveto efficiency and specific detector geometry. Specificexamples are provided later in this paper.
3
4. Definition of Depth and Total Muon Flux forUnderground Sites
The data on the total muon intensity at the variousunderground sites is summarized in Table I and Fig. 3.We use equation (4) to calculate the total muon fluxfor Homestake (flat-overburden) at the depth 4.3 ± 0.2km.w.e. [18]. The relative difference between the dataand our model (equation (4)) is shown in Fig. 4, wherethe uncertainties reflect the experimental uncertaintiesin Table I. In order to circumvent the misuse of verticalmuon intensity in comparing sites with flat overburdento those under mountains, we define the equivalent depthrelative to a flat overburden by the experimental mea-surements of the total muon intensity. This definitionand these intensities are used hereafter.
Equivalent Vertical Depth (km.w.e.)2 3 4 5 6
)-1 s
-2To
tal M
uon
Flux
(cm
-910
-810
-710
Flat-overburdan sitesKamiokaGran SassoFrejusHomestake
WIPP
Soudan
Boulby
Sudbury
FIG. 3: The total muon flux measured for the various un-derground sites summarized in Table I as a function of theequivalent vertical depth relative to a flat overburden. Thesmooth curve is our global fit function to those data takenfrom sites with flat overburden (equation (4)).
TABLE I: Summary of the total muon flux measured at theunderground sites and the equivalent vertical depth relativeto a flat overburden.
Site Total flux Depthcm−2sec−1 km.w.e.
WIPP (4.77±0.09) × 10−7 [6] 1.585±0.011Soudan (2.0±0.2) × 10−7 [15] 1.95±0.15Kamioka (1.58±0.21) × 10−7 [8] 2.05±0.15†
Boulby (4.09±0.15) × 10−8 [9] 2.805±0.015Gran Sasso (2.58±0.3) × 10−8[this work] 3.1±0.2†
(2.78±0.2) × 10−8 [16] 3.05±0.2†
(3.22±0.2) × 10−8 [17] 2.96±0.2†
Frejus (5.47±0.1) × 10−9 [14] 4.15±0.2†
(4.83 ±0.5) × 10−9 [this work] 4.2±0.2†
Homestake (4.4±0.1 × 10⁻⁹)[this work] 4.3±0.2Sudbury (3.77±0.41) × 10−10 [12] 6.011±0.1
† Equivalent vertical depth with a flat overburdendetermined by the measured total muon flux.
Equivalent Vertical Depth (km.w.e.)2 3 4 5 6
Dat
aD
ata-
Fit
≡to
tI
∆
-0.15
-0.1
-0.05
0
0.05
0.1
WIPP
Soudan
Kamioka
Boulby
Gran Sasso
Frejus
Sudbury
FIG. 4: The relative deviation between data on the totalmuon flux and our global fit function. The horizontal linesindicate the root-mean-square deviation amongst the resid-uals based upon the experimental uncertainties in the mea-surements.
B. Stopping Muon Intensity
Stopping-muons are also a source of background. Forexample, µ− capture on a nucleus produces neutronsand radioactive isotopes. The total stopping-muon ratehas contributions from cosmic-ray muons coming tothe end of their range, secondary muons generated lo-cally through interactions of the primary muons (due tovirtual-photo interactions with nuclei), and local muonproduction by real photons (π0-decay in electromagneticshowers). It is customary to quote results in terms of theratio, R, of stopping muons to through-going muons. Adetailed calculation is provided by Cassiday et al. [13].The total ratio, R(h), of stopping-muons to through-going muons (vertical direction) at different depths canbe parameterized as [19]
R(h) ≈ γµ∆Eeh/ξ
(eh/ξ − 1)ϵµ, (7)
where γµ = 3.77 for Eµ ≥ 1000 GeV [20], ξ = 2.5 km.w.e.,∆E ≈ αh, α = 0.268 GeV/km.w.e. [21] for Eµ ≥ 1000GeV [20], h is the depth of an underground laboratory,and ϵµ = 618 GeV [20]. For large depths, as can be seenin Fig. 5, this ratio is less than 0.5% and is hereafterneglected for the underground sites considered in thisstudy.
C. Muon Energy Spectrum and AngularDistribution
In addition to the total muon intensity arriving at agiven underground site, we require knowledge of the dif-ferential energy and angular distributions in order to gen-erate the muon-induced activity within a particular ex-perimental cavern. The energy spectrum is discussed in
• muonのfluxは実験場所の深さで異なる
• 深いほど、neutronのfluxが少ない 11

場所で区別 4
FIG. 4: Approximate peak day of the neutrino+muon signalat four di↵erent labs. Deeper labs have a lower muon flux [38]and so a phase closer to that of the solar neutrinos.
our estimates imply R⌫/Rµ ⇠ 0.1 which is encourag-ing given that we required for the modulation residualsA⌫/Aµ ⇡ 0.5 to provide a good fit to DAMA data.
Taking the number density to be n = 1029 m�3 a vol-ume of V ⇠ 1000 m3 is enough to generate ⇠ 100 neu-trons per day, which is similar to the rate observedin DAMA. For the muon-induced neutrons the meanfree path (MFP) is � ⇡ 2.6 m [31]. Hence we es-timate the e↵ective volume over which these neutronsare produced and still reach the detector to be Ve↵ =4⇡
Rdr r2 exp[�r/�] ⇡ 450 m3, which is close to volume
V needed to explain the DAMA signal. The neutrino-induced neutrons will be of lower energies resulting in ashorter MFP and a smaller Ve↵ . However we have ne-glected the production of multiple neutrons per neutrinoand resonances in the cross section for neutron produc-tion, which may compensate for the smaller volume.
We have yet to comment on why only DAMA (and per-haps CoGeNT [32, 33]) sees a modulation signal [7]. Thiscould be due to a combination of several factors, mostnotably shielding and thresholds. For the former otherexperiments employ di↵erent, and possibly stronger, neu-tron shields [34, 35]. The geometry of the shielding mayalso be important: for example at KIMS the polyethyleneshield is between the lead shield and the detector [36].
For the latter it is known that muons produce neutronswith a spectrum which rises at low energies, and so themajority of the muon-induced neutrons have kinetic en-ergy of the order 10�100 keV [26]. The neutrino-inducedspectrum will be similar, but also includes a populationof low-energy neutrons from neutrino scatters near thedetector. Hence if the neutrons are scattering o↵ Na inDAMA then the recoil energies fall into the 2�6 keV bin.However for heavier targets such as xenon or germaniumthe recoil energies would likely be below threshold.
IV. HIGHER-ORDER MODES AND FUTURETESTS
Based on annual modulation alone the muon+neutrinoand Dark Matter models provide equally valid fits to theDAMA data. In this section we discuss methods for dis-criminating between these two models.
The Sun goes through cycles of activity with a pe-
riod of approximately 11 years. Indeed atmosphericmuons possess a signifiant additional modulated compo-nent with a period of 10.7±0.3 years [16, 17]. However nocorrelation between solar activity and 8B solar neutrinoshas been observed by Super-Kamiokande [20] or for 7Beneutrinos in Borexino [19] (though there may be evidenceof a quasi-biennial mode [37]). Hence it is not possiblefor the two signals to interfere at the 11 year mode asthey do for the annual mode (i.e. A⌫/Aµ|T=11 year <A⌫/Aµ|T=1 year) and so a lack of power for this harmonicin the data would exclude our model.We do not have the full DAMA data-set, however it
is possible to partially reconstruct this information usingthe annual averages [2, 17]. Indeed the annually-averagedrates appear consistent with the ⇠ 1% modulation ex-pected from the 11 year mode. However a statisticalanalysis of this data is di�cult, since the earliest datacomes from DAMA/NaI (with larger error bars) whilethe later part comes from DAMA/LIBRA [2].There are further tests which may be able to distin-
guish our model from Dark Matter. For example, insection II we used only the 2 keV to 6 keV energy-bin.However the DAMA collaboration have shown that thebest-fit phase shifts forwards by ⇠ 10 days when fitting toevents with energies between 2 keV and 4 keV [1]. SinceA⌫/Aµ could increase with lower energy, such a shift maybe expected from our combined model.Additionally, our model predicts a modulation in
double-scatter neutrons. However this will likely bewashed out by other more numerous unmodulateddouble-scatter events, such as gammas.Finally future experiments such as DM-Ice [39],
KIMS [40], SABRE [41] or ANAIS [42] will be able toexploit a location-dependent phase change e.g. due tothe depreciation of muon flux with depth. We show infigure 4 the expected peak day of the neutrino+muonmodel at four labs. For example if A⌫/Aµ = 0.7 at GranSasso it will be 0.44 at Boulby since the muon flux is 1.6times larger [38], leading to a peak day ⇠ 20 days later.
V. CONCLUSION
In this letter we have proposed a new model for theDAMA annual modulation, which is a sum of two annu-ally modulating components with di↵erent phases. Morespecifically the events are composed of neutrons, whichare liberated in the material surrounding the detectorby a combination of 8B solar neutrinos and atmosphericmuons. The model is shown in figure 1.The muons alone can not explain the DAMA annual
modulation, as has been remarked upon before [13, 16,17], since they peak approximately ⇠ 30 days too late.Inclusion of the solar neutrinos solves this issue as theyalso modulate and peak around January 4th, e↵ectivelyshifting the phase of the combined model forward. Thisis shown in figure 3. Due to this phase shift we found thatour model fits as well to the DAMA annual modulation
• 実験場所の違いでneutrino+muon modelのphaseがずれる
⇒neutronとdark ma0erを区別できるかも
12

Summary
• muonとneutrinoはdetectorの周りのPbでneutronをつくる
• muon+neutrino modelはDAMAのシグナルとよくあう
• このmodelのDAMAのシグナルの区別の方法として、phaseのずれと場所依存を考える
13