department of water resources groundwater … of water resources groundwater elevation monitoring...
TRANSCRIPT

Department of Water Resources
Groundwater Elevation Monitoring
Guidelines
December 2010
DWR Groundwater Elevation Monitoring Guidelines

DWR Groundwater Elevation Monitoring Guidelines ii
TABLE OF CONTENTS
Introduction to the CASGEM Program .......................................................................................................... 1
Purpose of Guidelines for DWR Monitoring ................................................................................................. 1
Network Design Concepts ............................................................................................................................. 2
Selection of Monitoring Wells for Monitoring Plans ................................................................................ 2
Frequency of Water‐Level Measurements ............................................................................................... 5
Field Guidelines for CASGEM Water‐Level Measurements .......................................................................... 8
Introduction .............................................................................................................................................. 8
Establishing the Reference Point .............................................................................................................. 9
Guidelines for Measuring Water Levels .................................................................................................. 14
Glossary of Terms .................................................................................................................................... 29
References .............................................................................................................................................. 33

INTRODUCTION TO THE CASGEM PROGRAM On November 4, 2009 the state legislature amended the Water Code with SB 6, which mandates a statewide, locally-managed groundwater elevation monitoring program to track seasonal and long-term trends in groundwater elevations in California’s groundwater basins. To achieve that goal the amendment requires collaboration between local Monitoring Entities and the Department of Water Resources (DWR) to collect groundwater elevation data. In accordance with the amendment, DWR developed the California Statewide Groundwater Elevation Monitoring (CASGEM) program. If no local entities volunteer to monitor groundwater elevations in a basin or part of a basin, DWR may be required to develop a monitoring program for that part. If DWR takes over monitoring of a basin, certain entities in the basin may not be eligible for water grants or loans administered by the state. DWR will report findings of the CASGEM program to the Governor and the Legislature by January 1, 2012 and thereafter in years ending in 5 or 0.
PURPOSE OF GUIDELINES FOR DWR MONITORING The following Guidelines were developed to assist DWR by establishing criteria for the selection and measurement of monitoring wells in the event that DWR is required to perform the groundwater monitoring functions in lieu of a local monitoring agency pursuant to Water Code Section 10933.5(a). The primary objective of the CASGEM monitoring program is to define the seasonal and long-term trends in groundwater elevations in California’s groundwater basins. The scale for this evaluation should be the static, regional groundwater table or potentiometric surface. A secondary objective is to provide sufficient data to draw representative contour maps of the elevations. These maps could be used to estimate changes in groundwater storage and to evaluate potential areas of overdraft and subsidence. Although it is not an objective of the CASGEM program, it would be valuable to include monitoring wells near localized features that impact more dynamic groundwater elevations. These features would include wells near aquifer storage and recovery projects, near high volume pumping wells, and near rivers.
DWR Groundwater Elevation Monitoring Guidelines 1

NETWORK DESIGN CONCEPTS
SELECTION OF MONITORING WELLS FOR MONITORING PLANS The number of groundwater wells that need to be monitored in a basin to adequately represent static water levels (and corresponding elevations) depends on several factors, some of which include: the known hydrogeology of the basin, the slope of the groundwater table or potentiometric surface, the existence of high volume production wells and the frequency of their use, and the availability of easily-accessible monitoring wells. Dedicated groundwater monitoring wells with known construction information are preferred over production wells to determine static water levels, and monitoring wells near rivers or aquifer storage and recovery projects should be avoided due to the potential for rapidly fluctuating water levels and engineered groundwater systems. The selection of wells should be aquifer-specific and wells which are screened across more than one aquifer should not be candidates for selection. Heath (1976) suggested a density of groundwater monitoring wells ranging from 2 wells per 1,000 square miles (mi2) for a large area in which only major features are to be mapped, to 100 wells per 1,000 mi2 for a complex area to be mapped in considerable detail. The objective of the Heath (1976) design was to evaluate the status of groundwater storage and the areal extent of aquifers. Sophocleous (1983) proposed a redesign of a water-level monitoring program for the state of Kansas based on efficiency, economics, statistical analysis, comparison of water-level hydrographs, and consistency across the state. The Sophocleous study recommended a “square well network” with a density of 1 observation well per 16 mi2. The Texas Water Development Board proposed varying well network densities for counties according to the amount of groundwater pumpage. These densities range from 0.7 wells per 100 mi2 for counties with 1,000-2,500 acre-feet per year (AF/yr) of pumpage to 4 wells per 100 mi2 for counties with over 100,000 AF/yr of pumpage (Hopkins, 1994). These densities were converted to pumpage per 100 mi2 area by dividing by the size of an average county in Texas of about 1,000 mi2 (Table 2) Most designs of water-level monitoring programs rely on a probabilistic approach. Alley (1993) discussed four probabilistic designs: (1) simple random sampling throughout an aquifer; (2) stratified random sampling within different strata of an aquifer; (3) systematic grid sampling (e.g., at the midpoint of each section within an aquifer); and (4) random sampling within blocks (e.g., randomly selected wells within each section of an aquifer). The Sophocleous (1983) program used the third approach, systematic grid sampling. The guidelines on well density from the programs mentioned above are summarized in Table 2. Based on the few referenced studies with specific recommendations, the consensus appears to fall between 2 and 10 groundwater monitoring wells per 100 mi2. The
DWR Groundwater Elevation Monitoring Guidelines 2

exceptions to this density range include the lower end of the Heath (1976) range and the low-use counties in Texas. There will always be a tradeoff between the improved spatial (and temporal) representation of water levels in an aquifer and the expense of monitoring. A higher-resolution contour map would be warranted in an area with a greater reliance upon groundwater in order to anticipate potential problems, such as supply and groundwater contamination concerns, while a lower-resolution contour map might be sufficient in an area with few people or a low reliance upon groundwater. Ideally, areas with relatively steep groundwater gradients or areas of high recharge or discharge would have a greater density of monitoring wells. The illustrations in Figure 1 show a local groundwater elevation contour map developed with different numbers of wells. The examples cover the same area and use the same dataset, with wells randomly deleted by grid area from the full dataset to create a less dense network of wells. The resulting range of plotting density is 2 to 20 groundwater monitoring wells per 100 mi2. The contours in Figure 1 show how the accuracy and resolution of the contour map increases with the density of wells used for plotting. To avoid presenting misleading contour maps, only wells with the best possible elevation accuracies should be used. These accuracies are a combination of the accuracies in the water-level measurement and the reference point (RP) measurement. Unless the RP elevation has been surveyed, it will be the limiting factor on elevation accuracy.
Program and(or) Reference Density of monitoring wells
(wells per 100 mi2) Heath (1976) 0.2 – 10 Sophocleous (1983) 6.3 Hopkins (1994) (a) Basins with >10,000 AF/yr groundwater pumping per 100 mi2 area
4.0
(b) Basins with 1,000‐10,000 AF/yr groundwater pumping per 100 mi2 area
2.0
(c) Basins with 250‐1,000 AF/yr groundwater pumping per 100 mi2 area
1.0
(d) Basins with 100‐‐250 AF/yr groundwater pumping per 100 mi2 area
0.7
Table 1. Recommended density of monitoring wells for groundwater-level monitoring programs.
DWR Groundwater Elevation Monitoring Guidelines 3

Figure 1per 100
undwater Ele
1. Contour mi2) compa
evation Monit
maps – Coared to a lo
toring Guideli
ontours of aow-density w
a very high-well networ
-density werk (about 2
ell network (wells per 1
(about 20 w00 mi2).
wells
DWR Gro ines 4

FREQUENCY OF WATER‐LEVEL MEASUREMENTS To determine and define seasonal and long-term trends in groundwater levels a consistent measurement frequency must be established. At minimum, semi-annual monitoring of the designated wells in each basin or subbasin should be conducted to coincide with the high and low water-level times of year for each basin. However, quarterly- or monthly-monitoring of wells provides a better understanding of groundwater fluctuations. The DWR office responsible for monitoring a particular basin should use independent judgment to determine when the high and low water-level times occur in a groundwater basin, and to provide a justification for measurement rationale. The semi-annual frequency is a compromise between more frequent measurements (continuous, daily, monthly, or quarterly) and less frequent measurements (annual). A good discussion of water level measurement frequency and other issues related to the design of water-level monitoring programs can be found in the USGS Circular 1217 (Taylor and Alley, 2001). An example of the effect of different measurement frequencies on the water-level hydrographs in a Northern California well is shown in Figure 2. The data shows that higher-frequency monitoring (e.g., daily or monthly) best captures the seasonal fluctuations in the groundwater levels, quarterly monitoring identifies some of the elevation change, but semi-annual measurements often miss the true seasonal highs and lows.
Figure 2. Groundwater Hydrographs – Groundwater elevation changes in a monitoring well over time comparing various measurement frequencies.
DWR Groundwater Elevation Monitoring Guidelines 5

The Subcommittee on Ground Water of the Advisory Committee on Water Information generally recommends more frequent measurements than are being required by the CASGEM program; quarterly to annually for aquifers with very few groundwater withdrawals, monthly to quarterly for aquifers with moderate groundwater withdrawals, and daily to monthly for aquifers with many groundwater withdrawals (Table 2). The general effect of environmental factors on the recommended measurement frequency is illustrated in Figure 3.
Measurement Type
Aquifer Type Nearby Long‐Term Aquifer Withdrawals
Very Few Withdrawals
Moderate Withdrawals
Many Withdrawals
Baseline Measurements
All aquifer types Once per month
Once per day Once per hour
Surveillance Measurements
All aquifer types: “low” hydraulic conductivity (<200 ft/d), “low” recharge (<5 in/yr)
Once per year Once per quarter
Once per month
All aquifer types: “high” hydraulic conductivity (>200 ft/d), “high” recharge (>5 in/yr)
Once per quarter
Once per month
Once per day
Data made available to NGWMN
All aquifer types, throughout range of hydraulic conductivity
As stored in local
database, but at least annually
As stored in local
database, but at least annually
As stored in local
database, but at least annually
Table 2. Information on recommended minimum water-level measurement frequency from the Subcommittee on Ground Water of the Advisory Committee on Water Information (2009) (abbreviations: ft/d, feet per day; in/yr, inches per year; NGWMN, National Ground Water Monitoring Network). NOTE: These are not recommendations of the CASGEM program.
DWR Groundwater Elevation Monitoring Guidelines 6

Figure 3. Common environmental factors that influence the choice of frequency of water-level measurements (from Taylor and Alley, 2001).
DWR Groundwater Elevation Monitoring Guidelines 7

FIELD GUIDE
INTRODUCTION
LINES FOR CASGEM WATER-LEVEL MEASUREMENTS
This document presents guidelines for measuring groundwater levels in wells for the CASGEM program to ensure consistency between DWR offices. Following these guidelines will help ensure that groundwater level measurements are accurate and consistent in both unconfined and confined aquifers. Although a well network comprised entirely of dedicated monitoring wells (hereafter referred to as monitoring wells) is preferred, by necessity active production wells used for irrigation or domestic purposes and abandoned production wells that were used for domestic, irrigation, and public supply purposes will also need to be included. The portions of these guidelines that apply to only production wells will be shown in bold throughout. DWR does not currently plan to include public supply wells in the CASGEM well networks due to security concerns of the California Department of Public Health. The main reference used for these guidelines is the United States Geological Survey (USGS) National Field Manual (NFM) (U.S. Geological Survey, 2006). The final report of the Subcommittee on Groundwater (SOGW) of the Advisory Committee on Water Information was also used as a main reference, although in general it relied on the USGS guidelines (Subcommittee on Ground Water of the Advisory Committee on Water Information, 2009). The water-level measurement portion of the USGS guidelines were written for monitoring wells and not for production wells (Taylor and Alley, 2001; U.S. Geological Survey, 2006). Thus, although the USGS guidelines have been adopted with only minor modifications for the monitoring well guidelines of the CASGEM program, additional modifications have been incorporated in the guidelines for production wells. The most significant changes made to the USGS guidelines for production wells are: (1) reducing the required precision for consecutive depth to water measurements, (2) checking for obstructions in the well, and (3) not attaching weights to the steel tape so as not to hang up on obstructions. The guidelines presented in this document are for the use of steel tape, electric sounding tape, sonic water-level meters, or pressure transducers. Although the semi-annual measurements required by the CASGEM program can be satisfied with the use of a steel or electric sounding tape or sonic meter, a pressure transducer with a data logger provides a much better picture of what is happening with water levels over time. The use of the air-line or flowing-well methods should not be needed in most basins. However, if they are, guidelines for these methods are available in sections A4-B-4 (pages B17-B20) and A4-B-5 (pages B21-B24), respectively of the NFM (U.S. Geological Survey, 2006).
DWR Groundwater Elevation Monitoring Guidelines 8

ESTABLISHING THE REFERENCE POINT Water-level measurements from a given well must be referenced to the same datum (the reference point, or RP) to ensure data comparability (see Figure 4). For monitoring wells, the RP should be marked on the top of the well casing. For production wells, the RP will most likely be the top of the access tube or hole to the well casing. The RP must be as permanent as possible and be clearly visible and easily located. It can be marked with a permanent marker, paint, imprinting a mark with a chisel or punch, or by cutting a slot in the top of the casing. In any case, the location of the RP should be clearly described on DWR Form 429 (see Table 3). A photograph of the RP, with clear labeling, should be included in the well folder. In some cases, it may be valuable to establish multiple RPs for a well, depending on the consistent accessibility of the primary RP. In this case, each RP should be clearly described on DWR Form 429 and labeled in the field. The RP should be established with the following coordinate system: horizontal location (decimal latitude and longitude referenced to the North American Datum of 1983; NAD83) and vertical elevation (referenced to the North American Vertical Datum of 1988; NAVD88, in feet). The land-surface datum (LSD) is established by the person making the initial water-level measurement at the well. The LSD is chosen to represent the average elevation of the ground around the well. Because LSD around a well may change over time, the distance between the RP and LSD should be checked every 3 to 5 years. If appropriate, a concrete well pad or well vault may be chosen as the LSD, since they will be more permanent than the surrounding ground surface. The elevation of the RP can be determined in several ways: (1) surveying to a benchmark, (2) using a USGS 7.5’ quadrangle map, (3) using a digital elevation model (DEM), or (4) using a global positioning system (GPS). While surveying is the most accurate (± 0.1 ft), it is also the most expensive. Depending on the distance to the nearest benchmark, the cost can be prohibitive. The latitude and longitude of the well can be established accurately using a handheld GPS. From this information, the LSD can be located on a USGS quadrangle and the elevation estimated. However, the accuracy is only about ± one half of the contour interval. Thus, for a contour interval of 5 feet, the accuracy of the elevation estimate would be about ± 2.5 feet. The contour interval of high quality DEMs is currently about 30 feet. Therefore, the accuracy of using
DWR Groundwater Elevation Monitoring Guidelines 9

Figure 4. Groundwater-level measurements using a graduated steel tape (modified fro
m U.S. Geological Survey, 2006).
Reference Point(RP)
Well Casing
1'
2'
3'
4'
5'
6'
7'
8'
9'
10'
11'
12'
1'
14'
13'
15'
16'
Land Surface Datum (LSD)
15.0
0' (T
ape
at R
P)
Water Surface (WS)Tape atWater Surface
12.1
0' (R
P t
o W
S)
1.0
7'
11.0
3' (L
SD
to W
S)
Calculation of Depth to Water
Tape at RP 15.00'- Tape at WS -2.90'= RP to WS 12.10'- LSD to RP -1.07'= LSD to WS 11.03'
2.9
' (T
ape
at W
S)
DWR Groundwater Elevation Monitoring Guidelines 10

able 3. General well data form (DWR Form 429).
T
DWR Groundwater Elevation Monitoring Guidelines 11

DEMs to determine the elevation of the LSD is about ± 15 feet. While a handheld GPS unit is not very accurate for determining elevation, more expensive units with the Wide Area Augmentation System can be more accurate. However, GPS readings are subject to environmental conditions, such as weather conditions, overhead vegetative cover, topography, interfering structures, and location. Thus, the most common method of determining the elevation will probably be the use of USGS quadrangles. The method used needs to be identified on DWR Form 429 (Table 3). The important matter is that all measurements at a well use the same RP, as the elevation of that point can be more accurately established at a later date. The equipment and supplies needed for establishing the RP are shown in Table 4. If possible, establish a clearly displayed reference mark (RM) in a location near the well; for example, a lag bolt set into a nearby telephone pole or set in concrete in the ground. The RM is an arbitrary datum established by permanent marks and is used to check the RP or to re-establish an RP should the original RP be destroyed or need to be changed. Clearly locate the RP and RM on a site sketch that goes into the well folder (see Table 3). Include the distance and bearing between the RP and the RM and the height of the lag bolt above the ground surface. Photograph the site, including the RP and RM locations; draw an arrow to the RP and RM on the photograph(s) using an indelible marker, and place the photos in the well file.
Table 4. Equipment and Supply List
Equipment and supplies needed for (a) all measurements, (b) establishing permanent RP, (c) steel tape method, (d) electric sounding tape method, (e) sonic water-level meter, and (f) automated measurements with pressure transducer. (a) All measurements GPS instrument, digital camera, watch, calculator, and maps General well data form (DWR Form 429; see Table 3) Pens, ballpoint with non-erasable blue or black ink, for writing on field forms and equipment log books Well file with previous measurements Measuring tape, graduated in feet, tenths, and hundredths of feet Two wrenches with adjustable jaws and other tools for removing well cap Key(s) for opening locks and clean rags (b) Establishing a permanent reference point Steel tape, graduated in feet, tenths, and hundredths of feet Calibration and maintenance log book for steel tape Paint (bright color), permanent marker, chisel, punch, and(or) casing-notching tool
DWR Groundwater Elevation Monitoring Guidelines 12

Table 4. Equipment and Supply List (continued)
(c) Steel tape method DWR field form 1213 (see Table 5) Steel tape, graduated in feet, tenths, and hundredths of feet Calibration and maintenance log book for steel tape Weight (stainless steel, iron, or other noncontaminating material – do not use lead) Strong ring and wire, for attaching weight to end of tape. Wire should be strong enough to hold weight securely, but not as strong as the tape, so that if the weight becomes lodged in the well the tape can still be pulled free. Carpenters’ chalk (blue) or sidewalk chalk Disinfectant wipes, and deionized or tap water for cleaning tape. (d) Electric sounding tape method DWR field form 1213 (see Table 5) Steel tape, graduated in feet, tenths, and hundredths of feet An electric tape, double-wired and graduated in feet, tenths, and hundredths of feet, accurate to 0.01 ft. Electric sounding tapes commonly are mounted on a hand-cranked and powered supply reel that contains space for the batteries and some device (“indicator”) for signaling when the circuit is closed. Electric-tape calibration and maintenance log book; manufacturer’s instructions. Disinfectant wipes, and deionized or tap water for cleaning tape. Replacement batteries, charged. (e) Sonic water-level meter method DWR field form 1213 (see Table 5) Temperature probe with readout and cable Sonic water-level meter with factory cover plate Custom sized cover plates for larger well diameters Replacement batteries (f) Automated measurements with pressure transducer Transducer field form (see Figures 1 and 2 in Drost, 2005: http://pubs.usgs.gov/of/2005/1126/pdf/ofr20051126.pdf ) Transducer, data logger, cables, suspension system, and power supply. Data readout device (i.e., laptop computer loaded with correct software) and data storage modules. Spare desiccant, and replacement batteries. Well cover or recorder shelter with key. Steel tape (with blue carpenters’ chalk or sidewalk chalk) or electric sounding tape, both graduated in hundredths of feet. Te
ools, including high-impedance (digital) multimeter, connectors, crimping tool, and contact-burnishing tool or artist’s raser.
DWR Groundwater Elevation Monitoring Guidelines 13
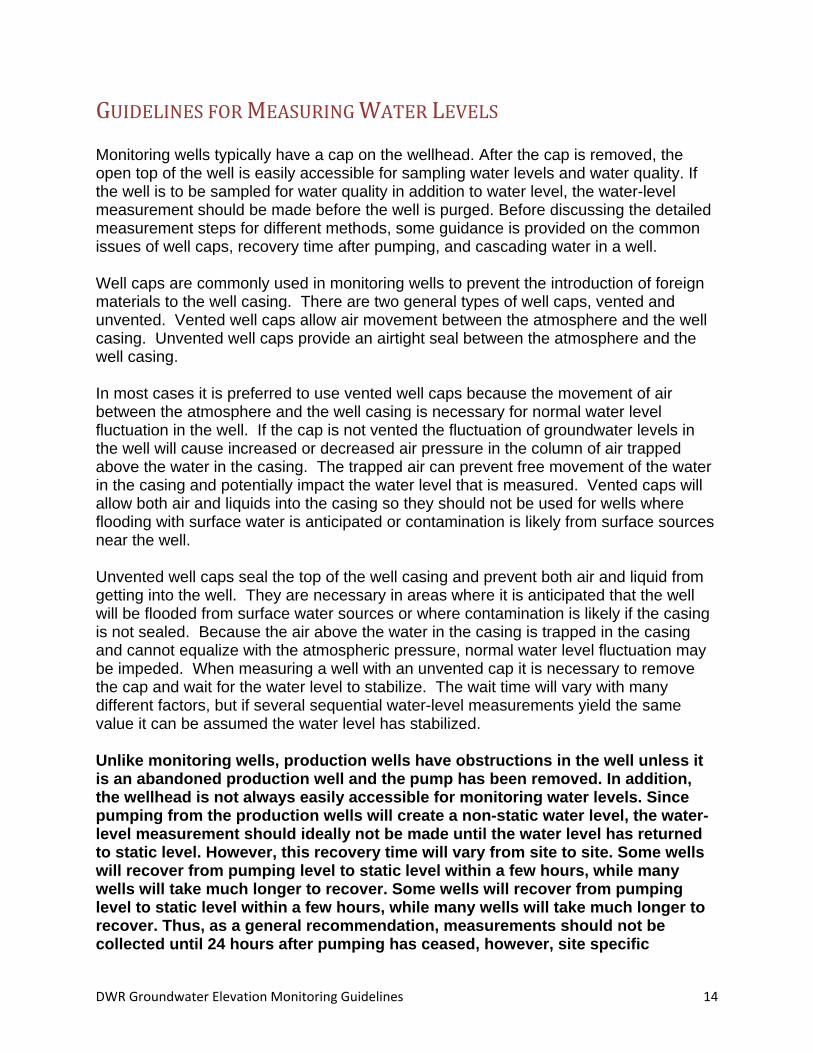
GUIDELINES FOR MEASURING WATER LEVELS Monitoring wells typically have a cap on the wellhead. After the cap is removed, the open top of the well is easily accessible for sampling water levels and water quality. If the well is to be sampled for water quality in addition to water level, the water-level measurement should be made before the well is purged. Before discussing the detailed measurement steps for different methods, some guidance is provided on the common issues of well caps, recovery time after pumping, and cascading water in a well. Well caps are commonly used in monitoring wells to prevent the introduction of foreign materials to the well casing. There are two general types of well caps, vented and unvented. Vented well caps allow air movement between the atmosphere and the well casing. Unvented well caps provide an airtight seal between the atmosphere and the well casing. In most cases it is preferred to use vented well caps because the movement of air between the atmosphere and the well casing is necessary for normal water level fluctuation in the well. If the cap is not vented the fluctuation of groundwater levels in the well will cause increased or decreased air pressure in the column of air trapped above the water in the casing. The trapped air can prevent free movement of the water in the casing and potentially impact the water level that is measured. Vented caps will allow both air and liquids into the casing so they should not be used for wells where flooding with surface water is anticipated or contamination is likely from surface sources near the well. Unvented well caps seal the top of the well casing and prevent both air and liquid from getting into the well. They are necessary in areas where it is anticipated that the well will be flooded from surface water sources or where contamination is likely if the casing is not sealed. Because the air above the water in the casing is trapped in the casing and cannot equalize with the atmospheric pressure, normal water level fluctuation may be impeded. When measuring a well with an unvented cap it is necessary to remove the cap and wait for the water level to stabilize. The wait time will vary with many different factors, but if several sequential water-level measurements yield the same value it can be assumed the water level has stabilized. Unlike monitoring wells, production wells have obstructions in the well unless it is an abandoned production well and the pump has been removed. In addition, the wellhead is not always easily accessible for monitoring water levels. Since pumping from the production wells will create a non-static water level, the water-level measurement should ideally not be made until the water level has returned to static level. However, this recovery time will vary from site to site. Some wells will recover from pumping level to static level within a few hours, while many wells will take much longer to recover. Some wells will recover from pumping level to static level within a few hours, while many wells will take much longer to recover. Thus, as a general recommendation, measurements should not be collected until 24 hours after pumping has ceased, however, site specific
DWR Groundwater Elevation Monitoring Guidelines 14

conditions may require deviating from this. The time since pumping should be noted on the field form. Water may enter a well above the water level, drip or cascade down the inside of the well, and lead to false water level measurements. Sometimes cascading water can be heard dripping or flowing down the well and other times it is discovered when water levels are abnormally shallow and/or difficult to determine. Both steel tapes and electric sounding tapes can give false readings. A steel tape may be wet from the point where water is entering the well making it hard to see the water mark where the tape intersects the water level in the well. An electric sounding tape signal may start and then stop as it is lowered down the well. If this happens, you can lightly shake the tape. The signal often becomes intermittent when water is running down the tape, but remains constant in standing water. On most electric sounding tapes, the sensitivity can be turned down to minimize false readings. It should be noted when a water level measurement is taken from a well with cascading water. (1) Steel Tape Method
The graduated steel-tape (wetted-tape) procedure is considered to be the most accurate method for measuring water levels in nonflowing wells. A graduated steel tape is commonly marked to 0.01 foot. When measuring deep water levels (>500 ft), thermal expansion and stretch of the steel tape starts to become significant (Garber and Koopman, 1968). The method is most accurate for water levels less than 200 feet below land surface. The equipment and supplies needed for this method are shown in Table 4. The following issues should be considered with this method:
• It may be difficult or impossible to get reliable results if water is dripping into the well or condensing on the well casing.
• If the well casing is angled, instead of vertical, the depth to water should be corrected, if possible. This correction should be recorded in the field folder.
• Check that the tape is not hung up on obstructions.
Before making a measurement: 1. Maintain the tape in good working condition by periodically checking the tape for rust, breaks, kinks, and possible stretch. Record all calibration and maintenance data associated with the steel tape in a calibration and maintenance log book. 2. If the steel tape is new, be sure that the black sheen on the tape has been dulled so that the tape will retain the chalk. 3. Prepare the field forms (DWR Form 1213; see Table 5). Place any previous measured water-level data for the well into the field folder.
DWR Groundwater Elevation Monitoring Guidelines 15

4. Check that the RP is clearly marked on the well and accurately described in the well file or field folder. If a new RP needs to be established, follow the procedures above. 5. In the field, wipe off the lower 5 to 10 feet of the tape with a disinfectant wipe, rinse with de-ionized or tap water, and dry the tape. 6. If possible, attach a weight to the tape that is constructed of stainless steel or other noncontaminating material to protect groundwater quality in the event that the weight is lost in the well. Do not attach a weight for production wells. Making a measurement: 1. If the water level was measured previously at the well, use the previous measurement(s) to estimate the length of tape that should be lowered into the well. Preferably, use measurements that were obtained during the same season of the year. 2. Chalk the lower few feet of the tape by pulling the tape across a piece of blue carpenter’s chalk or sidewalk chalk (the wetted chalk mark identifies that part of the tape that was submerged). 3. Slowly lower the weight (for monitoring wells only) and tape into the well to avoid splashing when the bottom end of the tape reaches the water. Develop a feel for the weight of the tape as it is being lowered into the well. A change in this weight will indicate that either the tape is sticking to the side of the casing or has reached the water surface. Continue to lower the end of the tape into the well until the next graduation (a whole foot mark) is at the RP and record this number on DWR Form 1213 (Table 5) next to “Tape at RP” as illustrated on Figure 4. 4. Rapidly bring the tape to the surface before the wetted chalk mark dries and becomes difficult to read. Record the number to the nearest 0.01 foot in the column labeled as “Tape at WS.” 5. If an oil layer is present, read the tape at the top of the oil mark to the nearest 0.01 foot and use this value for the “Tape at WS” instead of the wetted chalk mark. Mark an “8” in the QM column of DWR Form 1213 (see Table 5) to indicate a questionable measurement due to oil in the well casing. There are methods to correct for oil, such as the use of a relatively inexpensive water-finding paste. The paste is applied to the lower end of the steel tape and the top of the oil shows as a wet line and the top of the water shows as a distinct color change. Since oil density is about three-quarters that of water, the water level can be estimated by adding three-quarters of the thickness of the oil layer to the oil-water interface elevation (U.S. Geological Survey, 2006).
DWR Groundwater Elevation Monitoring Guidelines 16

6. Subtract the “Tape at WS” number from the “Tape at RP” number and record the difference (to the nearest 0.01 ft) as “RP to WS”. This reading is the depth to water below the RP. 7. Wipe and dry off the tape and re-chalk based on the first measurement. 8. Make a second measurement by repeating steps 3 through 5, recording the time of the second measurement on the line below the first measurement (Table 5). The second measurement should be made using a different “Tape at RP” than that used for the first measurement. If the second measurement does not agree with the original within 0.02 of a foot (0.2 of a foot for production wells), make a third measurement, recording this measurement and time on the row below the second measurement with a new time. If more than two readings are taken, record the average of all reasonable readings.
After making a measurement: 1. Clean the exposed portion of the tape using a disinfectant wipe, rinse with de-ionized or tap water, and dry the tape. Do not store a steel tape while dirty or wet.
DWR Groundwater Elevation Monitoring Guidelines 17

Table 5. Groundwater level data form for manual measurements (DWR Form 1213).
DWR Groundwater Elevation Monitoring Guidelines 18
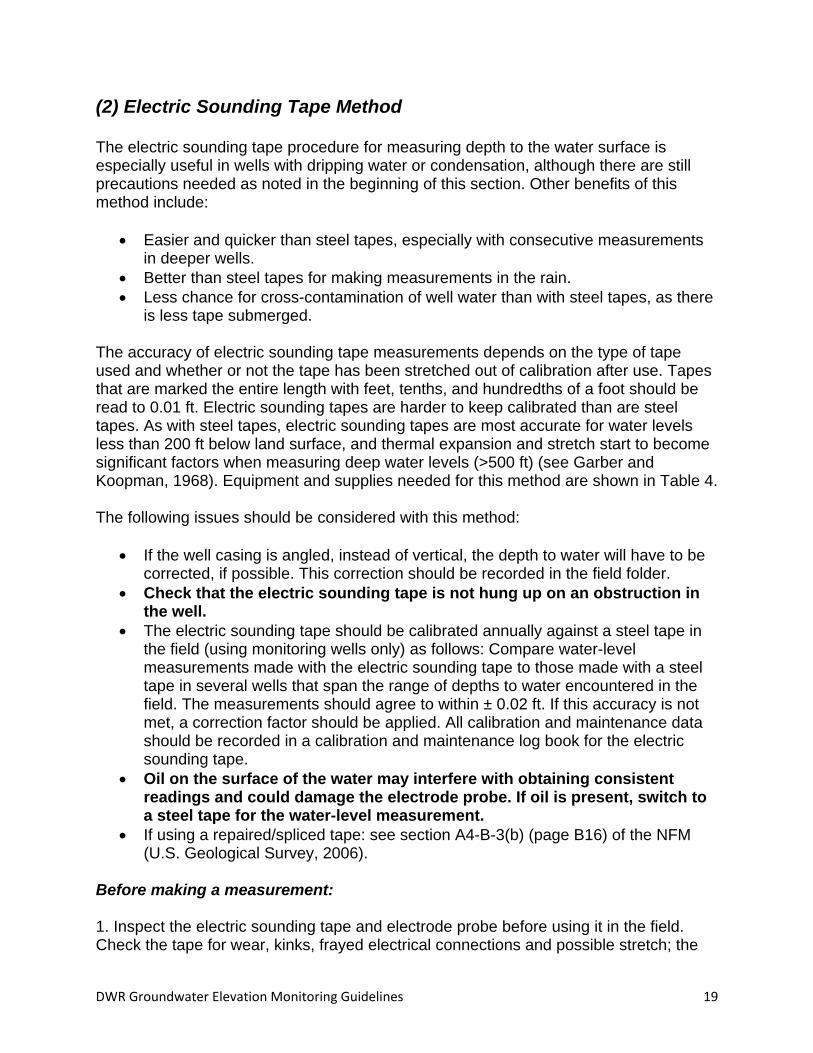
(2) Electric Sounding Tape Method The electric sounding tape procedure for measuring depth to the water surface is especially useful in wells with dripping water or condensation, although there are still precautions needed as noted in the beginning of this section. Other benefits of this method include:
• Easier and quicker than steel tapes, especially with consecutive measurements in deeper wells.
• Better than steel tapes for making measurements in the rain. • Less chance for cross-contamination of well water than with steel tapes, as there
is less tape submerged. The accuracy of electric sounding tape measurements depends on the type of tape used and whether or not the tape has been stretched out of calibration after use. Tapes that are marked the entire length with feet, tenths, and hundredths of a foot should be read to 0.01 ft. Electric sounding tapes are harder to keep calibrated than are steel tapes. As with steel tapes, electric sounding tapes are most accurate for water levels less than 200 ft below land surface, and thermal expansion and stretch start to become significant factors when measuring deep water levels (>500 ft) (see Garber and Koopman, 1968). Equipment and supplies needed for this method are shown in Table 4. The following issues should be considered with this method:
• If the well casing is angled, instead of vertical, the depth to water will have to be corrected, if possible. This correction should be recorded in the field folder.
• Check that the electric sounding tape is not hung up on an obstruction in the well.
• The electric sounding tape should be calibrated annually against a steel tape in the field (using monitoring wells only) as follows: Compare water-level measurements made with the electric sounding tape to those made with a steel tape in several wells that span the range of depths to water encountered in the field. The measurements should agree to within ± 0.02 ft. If this accuracy is not met, a correction factor should be applied. All calibration and maintenance data should be recorded in a calibration and maintenance log book for the electric sounding tape.
• Oil on the surface of the water may interfere with obtaining consistent readings and could damage the electrode probe. If oil is present, switch to a steel tape for the water-level measurement.
• If using a repaired/spliced tape: see section A4-B-3(b) (page B16) of the NFM (U.S. Geological Survey, 2006).
Before making a measurement: 1. Inspect the electric sounding tape and electrode probe before using it in the field. Check the tape for wear, kinks, frayed electrical connections and possible stretch; the
DWR Groundwater Elevation Monitoring Guidelines 19

cable jacket tends to be subject to wear and tear. Test that the battery and replacement batteries are fully charged. 2. Check the distance from the electrode probe’s sensor to the nearest foot marker on the tape, to ensure that this distance puts the sensor at the zero foot point for the tape. If it does not, a correction must be applied to all depth-to-water measurements. Record this in an equipment log book and on the field form. 3. Prepare the field forms (DWR Form 1213; see Table 5) and place any previous measured water-level data for the well into the field folder. 4. After reaching the field site, check that the RP is clearly marked on the well and is accurately described in the well file or field folder. If a new RP needs to be established, follow the procedures above. 5. Check the circuitry of the electric sounding tape before lowering the electrode probe into the well. To determine proper functioning of the tape mechanism, dip the electrode probe into tap water and observe whether the indicator needle, light, and/or beeper (collectively termed the “indicator” in this document) indicate a closed circuit. For an electric sounding tape with multiple indicators (sound and light, for instance), confirm that the indicators operate simultaneously. If they do not operate simultaneously, determine which is the most accurate and use that one. 6. Wipe off the electrode probe and the lower 5 to 10 feet of the tape with a disinfectant wipe, rinse with de-ionized or tap water, and dry. Making a measurement: 1. If the water level was measured previously at the well, use the previous measurement(s) to estimate the length of tape that should be lowered into the well. Preferably, use measurements that were obtained during the same season of the year. 2. Lower the electrode probe slowly into the well until the indicator shows that the circuit is closed and contact with the water surface is made. Avoid letting the tape rub across the top of the well casing. Place the tip or nail of the index finger on the insulated wire at the RP and read the depth to water to the nearest 0.01 foot. Record this value in the column labeled “Tape at RP”, with the appropriate measurement method code and the date and time of the measurement (see Table 5). 3. Lift the electrode probe slowly up a few feet and make a second measurement by repeating step 2 and record the second measurement with the time in the row below the first measurement in Table 5. Make all readings using the same deflection point on the indicator scale, light intensity, or sound so that water levels will be consistent between measurements. If the second measurement does not agree with the first measurement within 0.02 of a foot (0.2 of a foot for production wells), make a third measurement,
DWR Groundwater Elevation Monitoring Guidelines 20

recording this measurement with the time in the row below the second measurement. If more than two readings are taken, record the average of all reasonable readings. After making a measurement:
1. Wipe down the electrode probe and the section of the tape that was submerged in the well water, using a disinfectant wipe and rinse thoroughly with de-ionized or tap water. Dry the tape and probe and rewind the tape onto the tape reel. Do not rewind or otherwise store a dirty or wet tape.
(3) Sonic Water-Level Meter Method This meter uses sound waves to measure water levels. It requires an access port that is 5/8 – inch or greater in diameter and measurement of the average air temperature in the well casing. The meter can be used to quickly measure water levels in both monitoring wells and production wells. Also, since this method does not involve contact of a probe with the water, there is no concern over cross contamination between wells. However, the method is not as accurate as the other methods, with a typical accuracy of 0.2 ft for water levels less than 100 ft or 0.2% for water levels greater than 100 ft. Equipment and supplies needed for this method are shown in Table 4. The following issues should be considered with this method:
• The accuracy of the meter decreases with well diameter and should not be used with well diameters greater than 10 inches.
• An accurate air temperature inside the well casing is necessary so that the variation of sound velocity with air temperature can be accounted for.
• Obstructions in the well casing can cause erroneous readings, especially if the obstruction is close to half the well diameter or more.
Before making a measurement: 1. Check the condition of the meter, especially the batteries. Take extra batteries to the field. 2. Take a temperature probe with a readout and 50-ft cable. 3. If open wellheads with diameter greater than the factory cover plate and less than 10 inches will be monitored, fabricate appropriately-sized cover plates using plastic or sheet metal.
DWR Groundwater Elevation Monitoring Guidelines 21

4. Prepare the field forms (DWR Form 1213; see Table 5). Place any previous measured water-level data for the well into the field folder. 5. Check that the RP is clearly marked on the well and accurately described in the well file or field folder. If a new RP needs to be established, follow the procedures above. Making a measurement: 1. If the water level was measured previously at the well, lower the temperature probe to about half that distance in the well casing. Preferably, use measurements that were obtained during the same season of the year. 2. Record this temperature in the comments column of DWR form 1213 (see Table 5). Use this temperature reading to adjust the temperature toggle switch on the sonic meter. 3. Select the appropriate depth range on the sonic meter. 4. For a covered wellhead, insert the meter duct into the access port and push the power-on switch. Record the depth from the readout. 5. For an open wellhead, slip the provided cover plate onto the wellhead to provide a seal. If the cover plate is not large enough, use a fabricated cover plate for diameters up to 10 inches. Record the depth from the readout. After making a measurement: 1. Make sure the temperature probe and the sonic meter are turned off and put away in their cases. (4) Pressure Transducer Method Automated water-level measurements can be made with a pressure transducer attached to a data logger. Care should be taken to choose a pressure transducer that accurately measures the expected range of groundwater levels in a well. Pressure-transducer accuracy decreases linearly with increases in the depth range (also known as pressure rating). A pressure transducer with a depth range of 0 to 10 ft (0 to 4.3 psi) has an accuracy of 0.01 ft while a pressure transducer with a depth range of 0 to 100 ft (0 to 43 psi) has an accuracy of 0.1 ft. But if the measurement range exceeds the depth range of a pressure transducer, it can be damaged. So it is important to have a good
DWR Groundwater Elevation Monitoring Guidelines 22

idea of the expected range of groundwater levels in a well, and then refer to the manufacturer’s specification when selecting a pressure transducer for that well.
Some of the advantages of automated monitoring include:
• No correction is required for angled wells, as pressure transducers only measure vertical water levels.
• A data logger can be left unattended for prolonged periods until data can be downloaded in the field.
• Downloaded data can be imported directly into a spreadsheet or database. Some of the disadvantages of automated monitoring include:
• It may be necessary to correct the data for instrument drift, hysteresis, temperature effects, and offsets. Most pressure transducers have temperature compensation built-in.
• Pressure transducers operate only in a limited depth range. The unit must be installed in a well in which the water level will not fluctuate outside the operable depth range for the specific pressure transducer selected. Wells with widely fluctuating water levels may be monitored with reduced resolution or may require frequent resetting of the depth of the pressure transducer.
• With some data loggers, previous water-level measurements may be lost if the power fails.
There are two types of pressure transducers available for measuring groundwater levels; non-vented (absolute) and vented (gauged). A non-vented pressure transducer measures absolute pressure, is relative to zero pressure, and responds to atmospheric pressure plus pressure head in a well (see Figure 5). A vented pressure transducer measures gauge pressure, is relative to atmospheric pressure, and only responds to pressure head in a well. Non-vented pressure transducer data require post processing. Barometric pressure data must be collected at the same time as the absolute pressure data at the well, and subtracted from each absolute pressure data record before the data can be used to calculate groundwater levels. Thus, if a non-vented pressure transducer is used, a barometric pressure transducer will also be needed near the well. This subject is usually covered in more detail by the manufacturer of the pressure transducer. In an area with little topographic relief, a barometer at one site should be sufficient for use by other sites within a certain radius (9 miles reported by Schlumberger http://www.swstechnology.com/ groundwater-monitoring/groundwater-dataloggers/baro-diver and 100 miles reported by Global Water http://www.globalw.com/support/barocomp.html). In an area of significant topographic relief, it would be advisable to have a barometer at each site.
DWR Groundwater Elevation Monitoring Guidelines 23

Vented pressure transducers can be programmed so no post processing of the data is necessary. The vent is usually a small tube in the communication cable that runs from the back of the pressure transducer to the top of the well. This vent enables the pressure transducer to cancel the effect of atmospheric pressure and record groundwater level as the distance from the RP to the WS (see Figure 5). However, if the vent is exposed to excessive moisture or submerged in water it can cause failure and damage to the pressure transducer. The existing well conditions should be considered when deciding which type of pressure transducer to use. Non-vented pressure transducers should be used when the top of a well or its enclosure may at any time be submerged in water. This can happen when artesian conditions have been observed or are likely, the well is completed at or below the LSD, or the well or its enclosure are susceptible to periods of high water. Otherwise, it is advisable to use a vented pressure transducer. The following guidelines are USGS guidelines from Drost (2005) and Freeman and others (2004) for the use of pressure transducers. These USGS guidelines have not been incorporated as yet in the NFM. The equipment and supplies needed for automated measurements of water level using a pressure transducer are shown in Table 4.
DWR Groundwater Elevation Monitoring Guidelines 24

Top of Casing(RP)
Well Casing
Land Surface Datum (LSD)
Han
gin
g D
epth
Water Surface (WS)
RP t
o W
S
LSD
to
WS
Pre
ssure
Hea
d
Hanging Point
Pressure Transducer
Barometer
Suspension Cable
(P baro)
(P meas)
(Pw)
Figure 5. Groundwater-level measurements using a pressure transducer (vented or non-vented) (modified from Drost, 2005).
DWR Groundwater Elevation Monitoring Guidelines 25
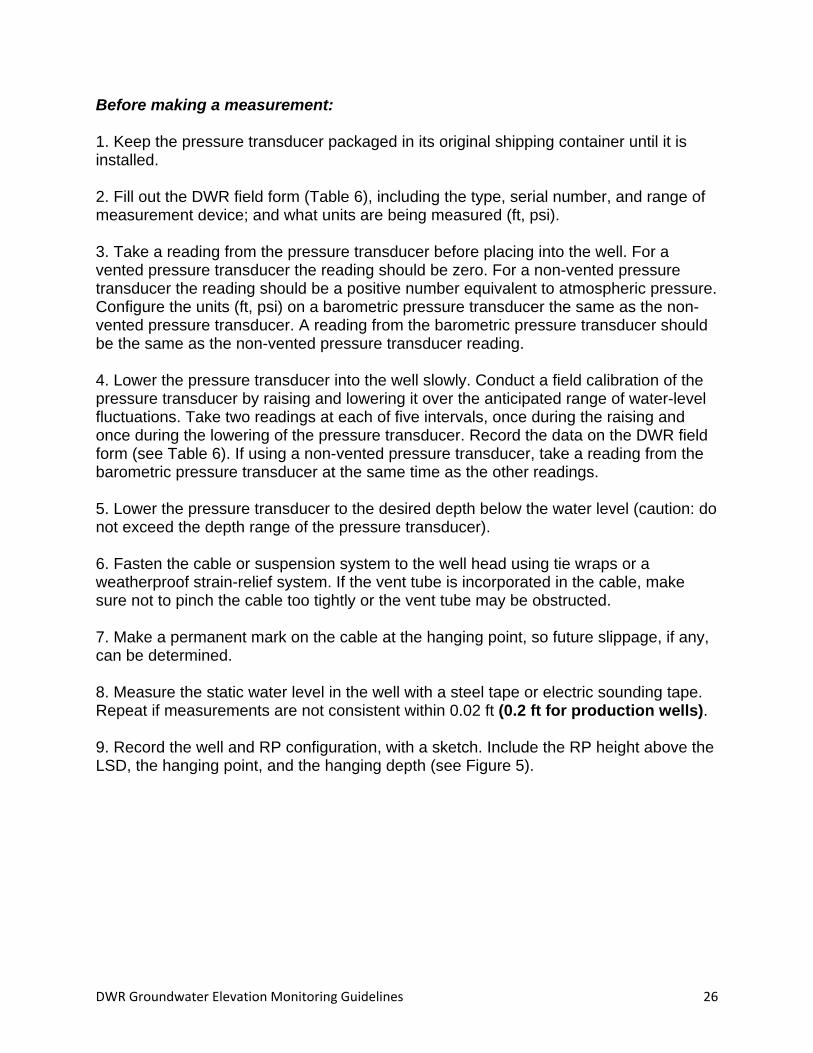
Before making a measurement: 1. Keep the pressure transducer packaged in its original shipping container until it is installed. 2. Fill out the DWR field form (Table 6), including the type, serial number, and range of measurement device; and what units are being measured (ft, psi). 3. Take a reading from the pressure transducer before placing into the well. For a vented pressure transducer the reading should be zero. For a non-vented pressure transducer the reading should be a positive number equivalent to atmospheric pressure. Configure the units (ft, psi) on a barometric pressure transducer the same as the non-vented pressure transducer. A reading from the barometric pressure transducer should be the same as the non-vented pressure transducer reading. 4. Lower the pressure transducer into the well slowly. Conduct a field calibration of the pressure transducer by raising and lowering it over the anticipated range of water-level fluctuations. Take two readings at each of five intervals, once during the raising and once during the lowering of the pressure transducer. Record the data on the DWR field form (see Table 6). If using a non-vented pressure transducer, take a reading from the barometric pressure transducer at the same time as the other readings. 5. Lower the pressure transducer to the desired depth below the water level (caution: do not exceed the depth range of the pressure transducer). 6. Fasten the cable or suspension system to the well head using tie wraps or a weatherproof strain-relief system. If the vent tube is incorporated in the cable, make sure not to pinch the cable too tightly or the vent tube may be obstructed. 7. Make a permanent mark on the cable at the hanging point, so future slippage, if any, can be determined. 8. Measure the static water level in the well with a steel tape or electric sounding tape. Repeat if measurements are not consistent within 0.02 ft (0.2 ft for production wells). 9. Record the well and RP configuration, with a sketch. Include the RP height above the LSD, the hanging point, and the hanging depth (see Figure 5).
DWR Groundwater Elevation Monitoring Guidelines 26

Table 6. Groundwater level data form for vented or non-vented pressure transducer with data logger.
DWR Groundwater Elevation Monitoring Guidelines 27

10. Connect the data logger, power supply, and ancillary equipment. Configure the data logger to ensure the channel, scan intervals, units, etc., selected are correct. Activate the data logger. Most data loggers will require a negative slope in order to invert water levels for ground-water applications (i.e., distance from the RP to the WS). If using a non-vented pressure transducer the data logger will not require a negative slope, but atmospheric pressure data will need to be collected by a barometric pressure transducer. Making a measurement: 1. Retrieve water-level data (to 0.01 ft) using instrument or data logger software. If using a non-vented pressure transducer, retrieve barometric pressure data. 2. Measure the water level with a steel tape or electric sounding tape (to 0.01 ft) and compare the reading with the value recorded by the pressure transducer and data logger. Record the reading and time in the file folder. If using a non-vented pressure transducer, subtract the barometric pressure value from the transducer pressure value to obtain the water level pressure value. The water level pressure can then be multiplied by 2.3067 to convert from psi of pressure to feet of water (Freeman and others, 2004). Report the calculated water level to the nearest 0.01 ft. 3. If the tape and pressure transducer readings differ by more than (the greater of 0.2 ft or) two times the accuracy of the specific pressure transducer, raise the pressure transducer out of the water and take a reading to determine if the cable has slipped, or whether the difference is due to drift. The accuracy of a pressure transducer is typically defined as 0.001 times the full scale of the pressure transducer (e.g., a 0 to 100 ft pressure transducer has a full scale of 100 ft). The accuracy of a specific pressure transducer should be specified by the manufacturer’s specifications. 4. If drift is significant, recalibrate the pressure transducer as described using a steel tape. If using a non-vented pressure transducer, keep the pressure transducer out of the water and calibrate to the barometric pressure transducer value. If field calibration is not successful, retrieve the transducer and send back to the manufacturer for re-calibration. 5. Use the multimeter (see Table 4) to check the charge on the battery, and the charging current supply to the battery. Check connections to the data logger, and tighten as necessary. Burnish contacts if corrosion is occurring. 6. Replace the desiccant, battery (if necessary), and data module. Verify the data logger channel and scan intervals, document any changes to the data logger program and activate the data logger. 7. If possible, wait until data logger has logged a value, and then check for reasonableness of data.
DWR Groundwater Elevation Monitoring Guidelines 28

GLOSSARY OF TERMS The following terms are used in this document. Although many are commonly used in the groundwater- and data-management fields, they are defined here to avoid confusion. Aquifer – A geologic formation from which useable quantities of groundwater can be extracted. A confined aquifer is bounded above and below by a confining bed of distinctly less permeable material. The water level in a well installed in a confined aquifer stands above the top of the confined aquifer and can be higher or lower than the water table that may be present in the material above it. In some cases, the water level can rise above the ground surface, yielding a flowing well. An unconfined aquifer is one with no confining beds between the saturated zone and the ground surface. The water level in a well installed in an unconfined aquifer stands at the same level as the groundwater outside of the well and represents the water table. An alternative and equivalent definition for an unconfined aquifer is an aquifer in which the groundwater surface is at atmospheric pressure. Atmospheric or barometric pressure – The force per unit area exerted against a surface by the weight of the air above that surface at any given point in the Earth’s atmosphere. At sea level, the atmospheric pressure is 14.7 psi. As elevation increases, atmospheric pressure decreases as there are fewer air molecules above the ground surface. The atmospheric pressure is measured by a barometer. This pressure reading is called the barometric pressure. Weather conditions can increase or decrease barometric pressure. Blue carpenter’s chalk – A primarily calcium carbonate chalk with some silica. It is primarily used to make chalk-lines for long lasting bright marks. Some other formulations of chalk (e.g., sidewalk chalk) substitute different ingredients such as rice starch for silica. Data logger – A microprocessor-based data acquisition system designed specifically to acquire, process, and store data. Data usually are downloaded from onsite data loggers for entry into office data systems. The storage device within a data logger is called the data module. A desiccant, such as, silica gel, calcium sulfate, or calcium chloride, is used to absorb and keep moisture away from the data module. Dedicated monitoring well – A well designed for the sole purpose of long-term monitoring.
DWR Groundwater Elevation Monitoring Guidelines 29
Domestic well – A water well used to supply water for the domestic needs of an individual residence or systems of four or fewer service connections. DWR Bulletin 118 – DWR publication on the status of California’s groundwater. Prior to this 2003 update, the latest Bulletin 118 was published in 1980. This publication defines the 515 basins to be monitored in the SB 6 monitoring program. The report reference is: California Department of Water Resources, 2003, California’s groundwater: Bulletin 118, 246 p., available online at: http://www.water.ca.gov/pubs/groundwater/bulletin_118/california's_groundwater__bulletin_118_-_update_2003_/bulletin118_entire.pdf Electric sounding tape – This term is used in this document to mean both the electric tape and the electrode probe attached to the end of the tape. This water-level measuring device is also known by many other names, including a sounder, an electric tape, an E tape, an electric sounder, an electric well sounder, a depth sounder, etc. Electrode probe – This is the electronic sensor in the electronic sounder attached to the end of the electric tape. It senses water based on the electrical conductivity and triggers an alert. GPS – This stands for global positioning system. These devices come in many sizes and costs. The handheld devices are capable of very accurate locations in the xy plane (latitude longitude). However, only very expensive and large GPS units are currently capable of accurate readings for the altitude (z direction). Groundwater – Water occurring beneath the ground surface in the zone of saturation. Groundwater basin – An alluvial aquifer or a stacked series of alluvial aquifers with reasonably well-defined boundaries in a lateral direction and having a definable bottom. Groundwater elevation – The elevation (generally referenced to mean sea level as the datum) to which water in a tightly cased well screened at a given location will rise. Other terms that may be used include groundwater level, hydraulic head, piezometric head, and potentiometric head. Groundwater surface – The highest elevation at which groundwater physically occurs in a given location in an aquifer (i.e., top of aquifer formation in a confined aquifer and the groundwater level or water table in an unconfined aquifer). Also referred to as a water surface in this document.
DWR Groundwater Elevation Monitoring Guidelines 30

Groundwater subbasin – A subdivision of a groundwater basin created by dividing the basin using geologic and hydrologic conditions or institutional boundaries. Hysteresis – The maximum difference in output, at any measured value within the specified range, when the value is approached first with an increasing and then a decreasing measured property. Hysteresis is expressed in percent of the full-scale output. Instrument Drift – A change in instrument output over a period of time that is not a function of the measured property. Drift is normally specified as a change in zero (zero drift) over time and a change in sensitivity (sensitivity drift) over time. Irrigation well – A well used to irrigate farmland. The water from the well is not intended for domestic purposes. Metadata – “data about data”; it is the data describing context, content and structure of records and their management through time. NFM – This stands for National Field Manual. This is a living, online, document of the USGS. It is the protocol document for USGS methods of surface water, groundwater, and water quality field activities. The portion of the NFM that related to the field methods of collecting groundwater levels is in the following reference: U.S. Geological Survey, 2006, Collection of water samples (ver. 2.0): U.S. Geological Survey Techniques of Water-Resources Investigations, book 9, chap. A4, September, accessed 12/30/09 at: http://pubs.water.usgs.gov/twri9A4/ Nonflowing well – A well in which the water level is below the land surface. Pressure head – The height of a column of groundwater above a point that is supported by pressure at that point. Pressure transducer – A type of measurement device that converts pressure-induced mechanical changes into an electrical signal. Production well – A well with a pump installed that is used to bring groundwater to the land surface. This is a general term that can be applied to a domestic well, irrigation well, or public-supply well.
DWR Groundwater Elevation Monitoring Guidelines 31

Public-supply well – A well that pumps groundwater from a relatively extensive saturated area and is used as part of a public water system, supplying water for human consumption to at least 3,300 people. SOGW – This stands for Subcommittee on Groundwater. This is a subcommittee of the Advisory Committee on Water Information, which is developing a national framework for groundwater in the United States. The reference for the SOGW work is: Subcommittee on Ground Water of the Advisory Committee on Water Information, 2009, A national framework for ground-water monitoring in the United States: final version approved by the Advisory Committee on Water Information, June 2009, 78 p., accessed 1/11/10 at: http://acwi.gov/sogw/pubs/tr/index.html Static water level – Groundwater level in a well during non-pumping conditions. Vent tube – A tube in the cable which connects to the pressure transducer, allowing atmospheric pressure to be in contact with one side of the strain gauge in the pressure sensor. It cancels out the barometric effects in the readings. Well casing – The metal or plastic pipe separating the well from the surrounding geologic material. Wellhead – The top of the well containing the casing hanger and the point at which the motor is attached for a vertical line shaft turbine pump or where the seal is secured for a submersible pump. Well purging – Pumping out standing groundwater from a monitoring well. This is done prior to water quality sampling of wells, but not before taking a water-level measurement.
DWR Groundwater Elevation Monitoring Guidelines 32

REFERENCES Alley, W.M., ed., 1993, Regional ground-water quality: New York, Van Nostrand Reinhold, 634 p. Department of Water Resources, 2003, California’s groundwater: Bulletin 118, 246 p., available online at: http://www.water.ca.gov/pubs/groundwater/bulletin_118/california's_groundwater__bulletin_118_-_update_2003_/bulletin118_entire.pdf Drost, B.W., 2005, Quality-assurance plan for ground-water activities, U.S. Geological Survey, Washington Water Science Center: U.S. Geological Survey Open-File Report 2005-1126, 27 p., available online at: http://pubs.usgs.gov/of/2005/1126/pdf/ofr20051126.pdf Freeman, L.A., Carpenter, M.C., Rosenberry, D.O., Rousseau, J.P., Unger, R., and McLean, J.S., 2004, Use of submersible pressure transducers in water-resources investigations: U.S. Geological Survey Techniques of Water-Resources Investigations, book 8, chapter A3, 52 p., available online at: http://pubs.usgs.gov/twri/twri8a3/pdf/twri8-a3.pdf Garber, M.S., and Koopman, F.C., 1968, Methods of measuring water levels in deep wells: U.S. Geological Survey Techniques of Water-Resources Investigations, book 8, chap. A1, 23 p., available online at: http://pubs.usgs.gov/twri/twri8a1/pdf/twri_8-A1_a.pdf Heath, R.C., 1976, Design of ground-water level observation-well programs: Ground Water, v. 14, no. 2, p. 71–77. Hopkins, J., 1994, Explanation of the Texas Water Development Board groundwater level monitoring program and water-level measuring manual: UM-52, 53 p., available online at: http://www.twdb.state.tx.us/publications/manuals/UM-52/Um-52.pdf
Sophocleous, M., 1983, Groundwater observation network design for the Kansas groundwater management districts, U.S.A.: Journal of Hydrology, vol. 61, pp. 371-389.
Subcommittee on Ground Water of the Advisory Committee on Water Information, 2009, A national framework for ground-water monitoring in the United States: final version approved by the Advisory Committee on Water Information, June 2009, 78 p., accessed 1/11/10 at: http://acwi.gov/sogw/pubs/tr/index.html
DWR Groundwater Elevation Monitoring Guidelines 33

DWR Groundwater Elevation Monitoring Guidelines 34
Taylor, C.J., and Alley, W.M., 2001, Ground-water-level monitoring and the importance of long-term water-level data: U.S. Geological Survey Circular 1217, 68 p., available online at: http://pubs.usgs.gov/circ/circ1217/pdf/circ1217_final.pdf U.S. Geological Survey, 2006, Collection of water samples (ver. 2.0): U.S. Geological Survey Techniques of Water-Resources Investigations, book 9, chap. A4, September, accessed 12/30/09 at: http://pubs.water.usgs.gov/twri9A4/