Aviation in Kansas City
Mark VanLoh, A.A.E. Director of Aviation


KCI FACTS AND STATISTICS
• 551 acres of pavement, 15.4 million sq. ft. of runways/taxiways or 2,125 road miles on the airport and another 52 miles of actual roads
• 189 miles of wire for airfield lighting • 23,000 parking spaces • 249,000 gallons of deicing fluid used last season by airlines • Busiest travel year 2000=approx. 12,000,000 passengers • Busiest travel day of the year=Sunday after Thanksgiving • Average revenue per seat mile = .16 cents • KCI pays the City of KC approximately $9-10 M annually for services • 1.2 million sq. ft. of terminal space-90 original gates GREEN EFFORTS: • New maintenance building uses underground piping with water to heat
and cool the facility instead of electricity and Freon. • CNG Busing. Less than .90 cents per gallon • Solar rooftop units this summer/fall

U.S. Airport Control The Federal Aviation controls, regulates and oversees the
airport’s operation and all planning aspects. The Director is responsible for day to day safety, security and
operation of the airport and also answers to the City Manager. KCI is within the city limits and follows all City building and
zoning codes. The City Council approves the award of all contracts and sets
policies for city employees.
The airport is merely a landlord that provides locational services to airlines, rental car companies and cargo operators while following federal guidelines from the FAA, TSA and EPA.

Airport Governance in the United States
City Government: KCI, Denver, Atlanta County Government: Ft. Lauderdale Airport Authority (independent appointed board): Dallas, Orlando, Nashville, Pittsburgh, Omaha, Des Moines State Control: Maryland, Connecticut, Rhode Island Bi-State: New York/New Jersey Port Authority Private Operator: Albany, Harrisburg, Stewart (NY), Atlantic City, New Haven, Westchester Independent/privately funded: Branson All commercial airports in the US are regulated by the Federal Aviation Administration, Homeland Security (TSA) and various entities such as the Environmental Protection Agency and local/state bodies (MODNR)

Federal Requirements for Airports Who they are:
FAA-Federal Aviation Administration TSA-Transportation Security Administration EPA-Environmental Protection Agency MODNR-Missouri Department of Natural Resources Sponsor/Grant Assurances: Prepare annual 5 year capital improvement program Audited annual financial report Annual airport certification inspection Security audits, tests, drills, scenarios EPA permits, testing water quality, monitoring wells Airport master plans, airport layout plans-nothing is constructed without FAA approval/permitting The airport may not sell, lease or transfer any property without approval by the Secretary of Transportation. All revenues generated by the airport will be expended by that airport for its operation. Provide without cost, land for use by the Federal Government.

General Federal Requirements. It will comply with all applicable Federal laws, regulations, executive orders, policies, guidelines, and requirements as they relate to the application, acceptance and use of Federal funds for this project including but not limited to the following: Federal Legislation a. Title 49, U.S.C., subtitle VII, as amended. b. Davis-Bacon Act - 40 U.S.C. 276(a), et seq.1 c. Federal Fair Labor Standards Act - 29 U.S.C. 201, et seq. d. Hatch Act – 5 U.S.C. 1501, et seq.2 e. Uniform Relocation Assistance and Real Property Acquisition Policies Act of 1970 Title 42 U.S.C. 4601, et seq.2 f. National Historic Preservation Act of 1966 - Section 106 - 16 U.S.C. 470(f).1 g. Archeological and Historic Preservation Act of 1974 - 16 U.S.C. 469 through 469c.1 h. Native Americans Grave Repatriation Act - 25 U.S.C. Section 3001, et seq. i. Clean Air Act, P.L. 90-148, as amended. j. Coastal Zone Management Act, P.L. 93-205, as amended. k. Flood Disaster Protection Act of 1973 - Section 102(a) - 42 U.S.C. 4012a.1 l. Title 49, U.S.C., Section 303, (formerly known as Section 4(f)) m. Rehabilitation Act of 1973 - 29 U.S.C. 794. n. Civil Rights Act of 1964 - Title VI - 42 U.S.C. 2000d through d-4. o. Age Discrimination Act of 1975 - 42 U.S.C. 6101, et seq. p. American Indian Religious Freedom Act, P.L. 95-341, as amended. q. Architectural Barriers Act of 1968 -42 U.S.C. 4151, et seq.1 r. Power plant and Industrial Fuel Use Act of 1978 - Section 403- 2 U.S.C. 8373.1 s. Contract Work Hours and Safety Standards Act - 40 U.S.C. 327, et seq.1 t. Copeland Anti kickback Act - 18 U.S.C. 874.1 u. National Environmental Policy Act of 1969 - 42 U.S.C. 4321, et seq.1 v. Wild and Scenic Rivers Act, P.L. 90-542, as amended. w. Single Audit Act of 1984 - 31 U.S.C. 7501, et seq.2 x. Drug-Free Workplace Act of 1988 - 41 U.S.C. 702 through 706.
The Rest of the Story-FAA Airport Required Regulations

Kansas City Aviation Department
• 525 Employees managing two airports (Police, Fire, Engineering, Maintenance, Finance, Eco-Devo) manage 77 buildings. Must be KCMO residents
• One of two Enterprise Funds for the city. (Water Dept.) No general funds used.
• $117,000,000 annual budget • 10 Million annual passengers at KCI • Top Destinations: Denver, Chicago, Las Vegas, LA, Atlanta • 47 daily non-stop destinations • 186 daily departures • 19,675 daily non-stop seats • Annual Total Economic Impact of KCI = $5.5B (2006 study)

What the Aviation Department doesn’t do…
• Control aircraft (FAA) • Passenger screening (TSA), rub-downs,
massages-dry or with scented oils, change diapers, deny boarding's, etc.
• Place airlines in terminal space • Handle bags/cargo (airlines) • Set ticket prices (airlines) • Determine airline routes (we do make
suggestions!) • Clean gates/restrooms (airlines)
The Region-Population/Passengers

2.3 2.2 2.2 2.2 2.1 2.1 2.1
2.0 1.9 1.9 1.8 1.8 1.8
0.0
0.5
1.0
1.5
2.0
2.520
12 E
st. P
opul
atio
n (M
illio
ns)
Source: 2012 estimated population, DemographicsNow.
KC’s Metro Area Comparison
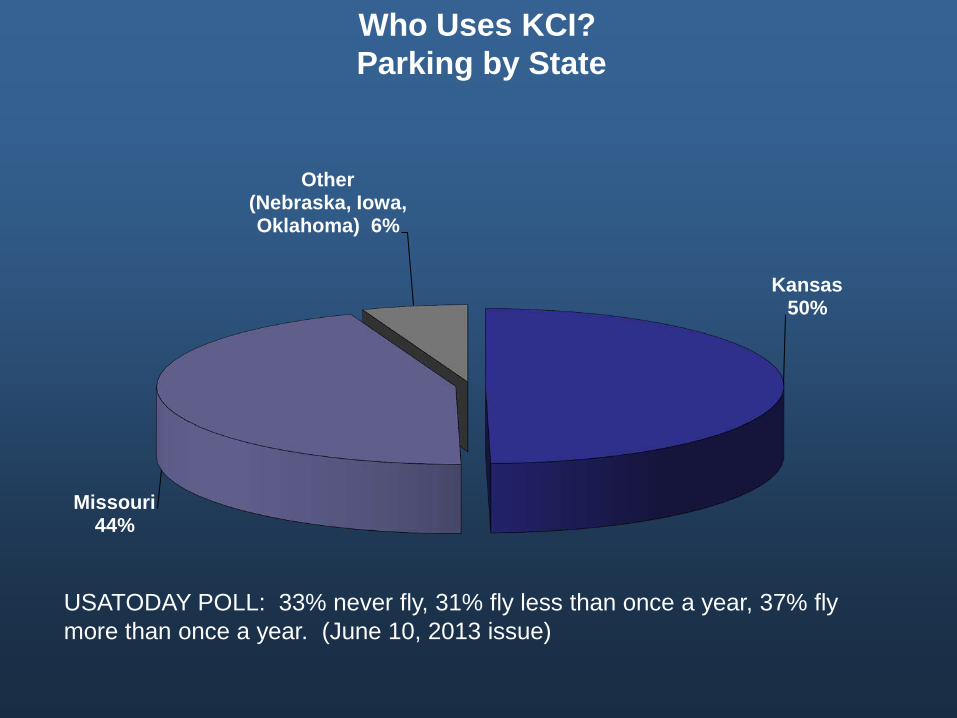
Who Uses KCI? Parking by State
Kansas 50%
Missouri 44%
Other (Nebraska, Iowa, Oklahoma) 6%
USATODAY POLL: 33% never fly, 31% fly less than once a year, 37% fly more than once a year. (June 10, 2013 issue)

Local Trip Origin by City
• Kansas City and Overland Park were the main local cities passengers traveled from prior to arriving at KCI
• The top 15 local trip origin cities account for 72% of all passengers at KCI
1 Kansas City 27%2 Overland Park 14%3 Olathe 5%4 Lawrence 3%5 Lees Summit 3%6 Lenexa 3%7 Topeka 3%8 Leawood 2%9 Shawnee 2%10 Prairie Village 2%11 Independence 2%12 Mission 1%13 Liberty 1%14 Saint Joseph 1%15 Blue Springs 1%
Total Top 15 72%All Other Zip Codes 28%
Trip Origin

60 min 2.2m 120 min
3.0m 180 min
6.2m
Drive Times from KCI City Miles Time
Topeka 73 1h10m Lincoln 179 2h55m Omaha 169 2h38m Des Moines 196 3h3m St. Louis 271 4h19m Springfield 193 3h14m
MCI Serves a Large Population

3 Hour Drive
19
MCI Draws Traffic From a Wide Area
2 Hour Drive
1 Hour Drive
4.9 Million O&D Passengers Originate From MCI = 100 Bookings

The Airline Business A History of “ups and downs”
Baggage Fees, drink fees, seat fees= $27 billion dollars worldwide last year.
Reduce capacity, control costs=smaller aircraft Revenue guarantees from small airports (Wichita, Columbia, Branson) Point to point service, i.e., The Mega Hub is dead! Mergers and bankruptcies

AirTran3%Frontier
4%
Continental6%
US Airways7%
Northwest8%
United9%
American9%
Midwest6%
Delta8%
Others1%
Southwest39%
Passengers by Marketing Carrier for 2Q09

Southwest 44%
American/USAir 18%
United 12%
Delta 19%
Frontier 6%
Others 1%

Kansas City Hub Attempts
TWA- the “world hub” concept (3 terminals) Braniff- no longer flying Eastern- no longer flying USAir- several mergers later … Braniff II- no longer flying Vanguard- 9/11-no longer flying Midwest (purchased by Republic/Frontier) Frontier Airlines-currently for sale

Air Service Marketing Efforts or Why Should an Airline Fly to Kansas City?
• Population, discretionary income, business demands, conventions
• Where do our residents want to go? • How are they getting there currently? (drive
market?) • What Airlines should be targeted? • Should we incentivize? • What do we know?


International Passengers per day each way YE Q3 2012 vs. YE Q3 2011, Passenger Origin and Destination (O&D) Survey
Transatlantic 301 PDEW (+3%) Transpacific
90 PDEW (+4%)
Canada 80 PDEW (+5%)
Caribbean, Central and South America 210 PDEW (+6%)
Mexico 190 PDEW (+1%)
International Traffic Growth

Source: Adjusted ARC.
Originating Airport for MCI Service Area to Mexico
ICT1%
OMA13%
DSM1%
LNK0%
MCI85%
YE Q3 2012 Originating Passengers

Mexico Market
Service Area Passengers Using
DSM, ICT, LNK or OMA
Cancun (CUN)
San Jose del Cabo (SJD)
Puerto Vallarta (PVR)
Mexico City (MEX)
Cozumel (CZM)
Guadalajara (GDL)
Monterrey (MTY)
Mazatlan (MZT)
Leon/Guanajuato (BJX)
Queretaro (QRO)
Other
Total
9,361
1,407
1,286
1,609
1,021
1,658
129
335
615
161
864
18,445
1
2
3
4
5
6
7
8
9
10
Rank
77,555
23,092
18,872
11,394
6,994
5,501
3,332
1,661
1,487
827
6,276
156,992
Source: Adjusted ARC and U.S. DOT, O&D Survey
MCI’s Top 10 Mexico Markets YE Q3 2012
O&D Passengers
68,195
21,685
17,587
9,786
5,972
3,843
3,203
1,327
872
665
5,413
138,547
YE Q3 2012 Total

When MCI Has the Only Nonstop Service, MCI Captures 90% of Service Area Passengers
MCI Does Not Have Nonstop
Service
MCI Has the Only Nonstop
Service in Region
MCI (85%) Other (15%)
MCI (90%) Other (10%)
Latest data indicate 33% of DSM, ICT, LNK and OMA service area passengers can be expected to shift to MCI when MCI obtains nonstop service

Thank you, Questions?


![· 2020. 9. 1. · Processing,” IMEC Website, 2020. [12]United States Department of Transportation Federal Aviation Administration, “UTM Concept of Operations](https://cdn.vdocuments.pub/doc/165x107/5fe643312b220054495606db/2020-9-1-processinga-imec-website-2020-12united-states-department-of.jpg)

