Download - USG Dan CT Kontras
7/27/2019 USG Dan CT Kontras
http://slidepdf.com/reader/full/usg-dan-ct-kontras 1/8
Value of Contrast-EnhancedUltrasonography in Assessingthe Vascularity of Liver MetastasesComparison With Contrast-EnhancedComputed Tomography
Yan-Ling Zheng, MD, Xiao-Yu Yin, MD, PhD, Xiao-Yan Xie, MD, PhD,
Hui-Xiong Xu, MD, PhD, Zuo-Feng Xu, MD, PhD, Guang-Jian Liu, MD, PhD,
Jin-Yu Liang, MD, Ming-De Lu, MD, PhD
Objective. The purpose of this study was to compare the capability of contrast-enhanced ultrasonog-
raphy (CEUS) and contrast-enhanced computed tomography (CECT) in evaluating the vascularity ofliver metastases. Methods. Both CEUS and CECT examinations were performed on 70 patients with
liver metastases, which were from colon carcinoma in 31, rectal carcinoma in 17, pancreatic carcino-
ma in 5, and others in 17. In patients with multiple lesions, the most easily observed lesion was
selected as the target lesion for evaluation of vascularity. Results. Peak enhancement of the target
lesion during the arterial phase was characterized as hyperenhancement, isoenhancement, hypo-
enhancement, and nonenhancement in 61 (87.1%), 6 (8.6%), 3 (4.3%), and 0 (0%) patients on CEUS,
respectively, and in 52 (74.3%), 8 (11.4%), 8 (11.4%), and 2 (2.9%) on CECT. Contrast-enhanced
ultrasonography showed more lesions with hyperenhancement than CECT (P < .01). The enhancement
pattern during the arterial phase was homogeneous, inhomogeneous, and rimlike in 30 (42.9%), 16
(22.9%), and 24 (34.2%) patients on CEUS and in 13 (18.6%), 8 (11.4%), and 49 (70%) on CECT.
Contrast-enhanced ultrasonography revealed more lesions with homogeneous enhancement than
CECT (P < .01). Contrast-enhanced ultrasonography showed dysmorphic vessels in 33 patients(47.1%) during the arterial phase, whereas CECT showed dysmorphic vessels in 27 (38.6%; P < .01).
Contrast-enhanced ultrasonography showed hypervascular lesions in 58.6% of patients, whereas
CECT showed hypervascular lesions in 12.9% (P < .01). Conclusions. Contrast-enhanced ultrasonog-
raphy was superior to CECT in assessing the vascularity of liver metastases. Key words: contrast-
enhanced computed tomography; contrast-enhanced ultrasonography; liver metastases; vascularity.
Received February 24, 2010, from the Departments of Medical Ultrasonics (Y.-L.Z., X.-Y.X., H.-X.X., Z.-F.X.,G.-J.L., J.-Y.L., M.-D.L.) and Hepatobiliary Surgery (X.-Y.Y., M.-D.L.), First Affiliated Hospital, and Instituteof Diagnostic and Interventional Ultrasound (Y.-L.Z.,
X.-Y.X., H.-X.X., Z.-F.X., G.-J.L., J.-Y.L., M.-D.L.), Sun Yat-Sen University, Guangzhou, China. Revision requested March 16, 2010. Revised manuscript accepted for pub-lication May 17, 2010.
Address correspondence to Xiao-Yu Yin, MD, PhD,Department of Hepatobiliary Surgery, First Affiliated Hospital, Sun Yat-Sen University, 510080 Guangzhou,Guangdong, China.
E-mail: [email protected]
AbbreviationsCECT, contrast-enhanced computed tomography;CEUS, contrast-enhanced ultrasonography; CT, comput-ed tomography; MRI, magnetic resonance imaging;TACE, transcatheter arterial embolization
ssessment of the vascularity of liver malignan-
cies is of clinical importance because it is one of
the major factors affecting therapeutic out-
comes, including systemic chemotherapy andtranscatheter arterial embolization (TACE). Braga et al1
used magnetic resonance imaging (MRI) to analyze the
vascularity of liver metastases in 16 patients with breast
cancer who underwent systemic chemotherapy and
found that patients with hypervascular liver lesions were
20.5 times more likely to have disease progression than
patients without hypervascular metastases. Taniai et al2
adopted contrast-enhanced computed tomography
(CECT) to evaluate the vascularity of liver metastases in
45 patients with colorectal cancer who were treated with
© 2010 by the American Institute of Ultrasound in Medicine • J Ultrasound Med 2010; 29:1403–1410 • 0278-4297/10/$3.50
A
Article
Article includes CME test
CME
CME
7/27/2019 USG Dan CT Kontras
http://slidepdf.com/reader/full/usg-dan-ct-kontras 2/8
TACE and found that TACE was effective in only
hypervascular colorectal liver metastases. Alba et
al3 used TACE as neoadjuvant treatment for 56
patients with hepatocellular carcinoma who had
131 nodules and were waiting for orthotopic livertransplantation. Subsequent pathologic exami-
nation confirmed that the antitumoral effect of
TACE was more remarkable in hypervascular
lesions compared with hypovascular ones.
Currently, the vascularity of liver lesions is main-
ly assessed by CECT, MRI, and digital subtraction
angiography. Of them, CECT and MRI have been
most commonly used because of their noninva-
siveness and convenience. However, they are not
real-time imaging modalities and easily miss the
early arterial phase, particularly in liver metas-
tases in which arterial perfusion is usually short-lasting.4 Digital subtraction angiography has
been used for arterial angiography and can clear-
ly illustrate the early arterial perfusion of lesions,
but it has disadvantages of invasiveness and radi-
ation exposure. On the other hand, both CECT
and digital subtraction angiography use iodinat-
ed contrast agents, which might be associated
with severe adverse reactions in some patients.5
Furthermore, they are contraindicated in patients
with renal insufficiency because the iodinated
contrast agents are excreted by the kidney.
Contrast-enhanced ultrasonography (CEUS) is a
recently developed technique that can depict the
blood perfusion of liver lesions in a real-time man-
ner.4,6 Because of its advantages of noninvasive-
ness, real-time scanning, and safety,7 enthusiasm
about CEUS for evaluating the vascularity of liver
lesions has grown rapidly. The aim of this study
was to compare the capability of CEUS and CECT
in assessing the vascularity of liver metastases.
Materials and Methods
Patients
From March 2004 to September 2008, CEUS
examinations were performed in 284 consecu-
tive patients with liver metastases in our hospital.
Among them, 70 patients had CECT examina-
tions in our hospital simultaneously. Seventy
patients who had both CEUS and CECT exami-
nations were included in the study. There were 39
male and 31 female patients with a mean age ±
SD of 56.6 ± 12.1 years (range, 32–75 years).
The diagnosis of liver metastases was estab-
lished by histopathologic examination in 23
patients and 2 contrast-enhanced imaging stud-
ies (CEUS, CECT, or MRI) in 47 patients. Tumor
sizes were 3.2 ± 1.8 cm (range, 0.9–8.2 cm).Twenty patients had single lesions, and the
remaining 50 had multiple lesions. The primary
malignancies consisted of colon carcinoma in 31,
rectal carcinoma in 17, pancreatic carcinoma in
5, gastric carcinoma in 3, pulmonary carcinoma
in 3, esophageal adenocarcinoma in 2, gallblad-
der carcinoma in 2, breast carcinoma in 2, blad-
der carcinoma in 1, uterine cervical cancer in 1,
renal carcinoma in 1, thyroid carcinoma in 1, and
ileal leiomyosarcoma in 1.
Informed consent was obtained from each
patient. The study was approved by the EthicsCommittee of the hospital.
Contrast-Enhanced Ultrasonographic
Technique and Image Analysis
The contrast agent used for CEUS was SonoVue
(Bracco SpA, Milan, Italy), a sulfur hexafluoride
(SF6)-filled microbubble agent that is stabi-
lized by phospholipids. Ultrasonographic
examinations were performed with an Acuson
Sequoia 512 scanner (Siemens Medical Solutions,
Mountain View, CA), which incorporated
Cadence contrast pulse sequencing software
and a 4V1 vector transducer with a frequency
range of 1 to 4 MHz. Contrast-specific contrast
harmonic imaging software was installed in the
system. A low–mechanical index real-time con-
trast-specific CEUS mode was used in the
examination, and the mechanical index value
indicated on the screen was between 0.1 and 0.2.
First, the whole liver was thoroughly scanned
using conventional gray scale ultrasonography,
and the target lesion was determined. In patients
with multiple lesions, the most easily observedlesion was selected as the target lesion for evalu-
ation of vascularity. Then a bolus of 2.4 mL of
SonoVue was injected via the antecubital vein,
followed by 5 mL of normal saline. The contrast
program was initiated at the same time. The tar-
get lesion was observed continuously during the
arterial phase (8–30 seconds after SonoVue injec-
tion). The rest of the liver was scanned to find
other lesions during the portal phase (31–120
seconds) and late phase (121–360 seconds).8–10
1404 J Ultrasound Med 2010; 29:1403–1410
Contrast-Enhanced Ultrasonography of Liver Metastasis Vascularity
7/27/2019 USG Dan CT Kontras
http://slidepdf.com/reader/full/usg-dan-ct-kontras 3/8
The entire process was recorded and stored on
the hard disk. The ultrasonographic examina-
tions were performed by physicians with at least
4 years of experience in CEUS.
Digital cine clips were analyzed offline in con-sensus by 2 physicians with at least 4 years of
experience in CEUS. The peak enhancement
level of the target lesion during the arterial phase
was evaluated and classified as nonenhance-
ment, hypoenhancement, isoenhancement,
and hyperenhancement by comparison with
the adjacent liver tissue.9 The enhancement pat-
tern was categorized as homogeneous (uniform
enhancement of the entire lesion), inhomoge-
neous (different levels of enhancement in differ-
ent parts of the lesion), and rimlike (a continuous
ring of enhancement seen at the periphery of thenodule). Vessels that were situated outside the
lesions and showed rapid flow of microbubbles
running into the lesions during the early arterial
phase were defined as dysmorphic vessels. The
time to the peak hyperenhancement level was
analyzed on the clips. According to the peak
enhancement level, enhancement pattern, and
enhancement area during the arterial phase, the
lesions were classified as having hypervascularity,
isovascularity, and hypovascularity. Tumors
meeting one of the following criteria were consid-
ered to have hypervascularity: (1) homogeneous
hyperenhancement and (2) an enhancement
area covering half or more of the lesion (either
ringlike or inhomogeneous). Isovascularity was
defined as homogeneous isoenhancement.
Tumors meeting one of the following criteria
were considered to have hypovascularity: (1)
hypoenhancement, (2) nonenhancement, and
(3) an enhancement area covering less than half
of the lesion (either ringlike or inhomogeneous).
Contrast-Enhanced Computed Tomographic Technique and Image Analysis
The contrast agent used for CECT was Ultravist
(Schering AG, Berlin, Germany), which contains
iopromide. It was administered via the antecubital
vein by power injection at a rate of 3 mL/s (single-
slice helical computed tomography [CT]) or 4
mL/s (64-slice helical CT) at a dose of 1.5 mL/kg.
Contrast-enhanced CT examinations were per-
formed with an Xpress SX single-slice helical CT
scanner (Toshiba Medical Systems Co, Ltd,
Tokyo, Japan) or an Aquilion 64-slice helical CT
scanner (Toshiba Medical Systems) within 14
days before or after the CEUS examinations. No
treatment was given during the interval between
the CEUS and CECT examinations. The scanning parameters were 5-mm collimation, 120 kV, and
250 mAs for single-slice helical CT and 0.5 × 64-
mm collimation, 120 kV, and 150 to 200 mAs for
64-slice helical CT. The standard dual-phase
scan procedure was used. After unenhanced
helical sequence scanning, the contrast agent
was administered. The arterial phase sequence
was obtained 25 to 30 seconds after injection,
followed by a portal venous phase sequence at 50
to 60 seconds.
Digital cine clips were analyzed offline in con-
sensus by 2 physicians with at least 5 years of experience in CECT. Contrast-enhanced CT
analysis was done on the same target lesions as
CEUS. By comparison with the adjacent liver
tissue, the peak enhancement level of the target
lesion was classified as nonenhancement, hypo-
enhancement, isoenhancement, and hyper-
enhancement during the arterial phase. Similar to
that for CEUS, the enhancement pattern on CECT
was categorized as homogeneous, inhomoge-
neous, and rimlike.11 Vessels showing blood flow
penetrating into the lesion during the arterial
phase on CECT were considered dysmorphic
vessels. The definitions of hypervascularity, iso-
vascularity, and hypovascularity on CECT were
the same as those on CEUS.
Statistical Analysis
The results are given as mean ± SD. The SPSS ver-
sion 10.0 software package (SPSS Inc, Chicago,
IL) was used for statistical analysis. A χ2 test was
used to compare the enhancement level, pattern,
dysmorphic vessels, and vascularity between
CEUS and CECT. The peak enhancement time was compared between the two groups using an
independent Student t test. Two-tailed P < .05
was considered statistically significant.
Results
With respect to the enhancement level of the tar-
get lesions, there were 61 patients (87.1%) with
hyperenhancement, 6 (8.6%) with isoenhance-
ment, 3 (4.3%) with hypoenhancement, and
J Ultrasound Med 2010; 29:1403–1410 1405
Zheng et al
7/27/2019 USG Dan CT Kontras
http://slidepdf.com/reader/full/usg-dan-ct-kontras 4/8
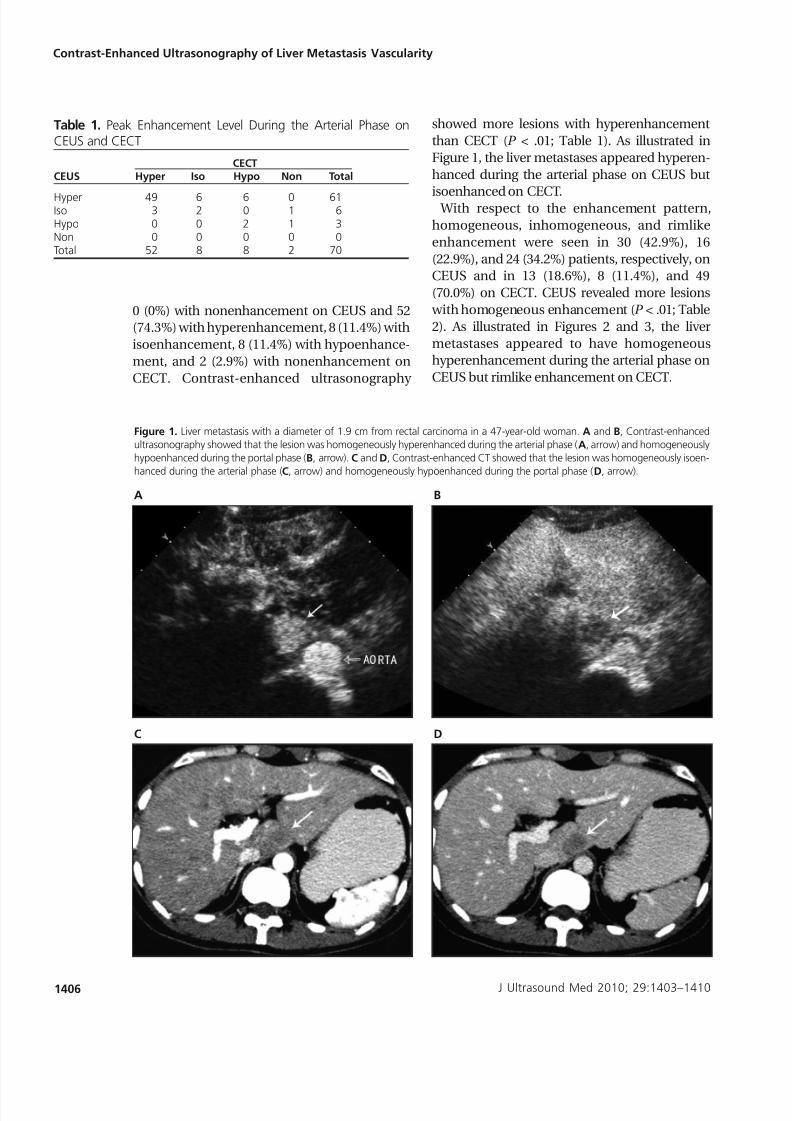
0 (0%) with nonenhancement on CEUS and 52
(74.3%) with hyperenhancement, 8 (11.4%) with
isoenhancement, 8 (11.4%) with hypoenhance-
ment, and 2 (2.9%) with nonenhancement on
CECT. Contrast-enhanced ultrasonography
showed more lesions with hyperenhancement
than CECT (P < .01; Table 1). As illustrated in
Figure 1, the liver metastases appeared hyperen-
hanced during the arterial phase on CEUS but
isoenhanced on CECT. With respect to the enhancement pattern,
homogeneous, inhomogeneous, and rimlike
enhancement were seen in 30 (42.9%), 16
(22.9%), and 24 (34.2%) patients, respectively, on
CEUS and in 13 (18.6%), 8 (11.4%), and 49
(70.0%) on CECT. CEUS revealed more lesions
with homogeneous enhancement (P < .01; Table
2). As illustrated in Figures 2 and 3, the liver
metastases appeared to have homogeneous
hyperenhancement during the arterial phase on
CEUS but rimlike enhancement on CECT.
J Ultrasound Med 2010; 29:1403–1410
Contrast-Enhanced Ultrasonography of Liver Metastasis Vascularity
Table 1. Peak Enhancement Level During the Arterial Phase onCEUS and CECT
CECTCEUS Hyper Iso Hypo Non Total
Hyper 49 6 6 0 61Iso 3 2 0 1 6Hypo 0 0 2 1 3Non 0 0 0 0 0Total 52 8 8 2 70
1406
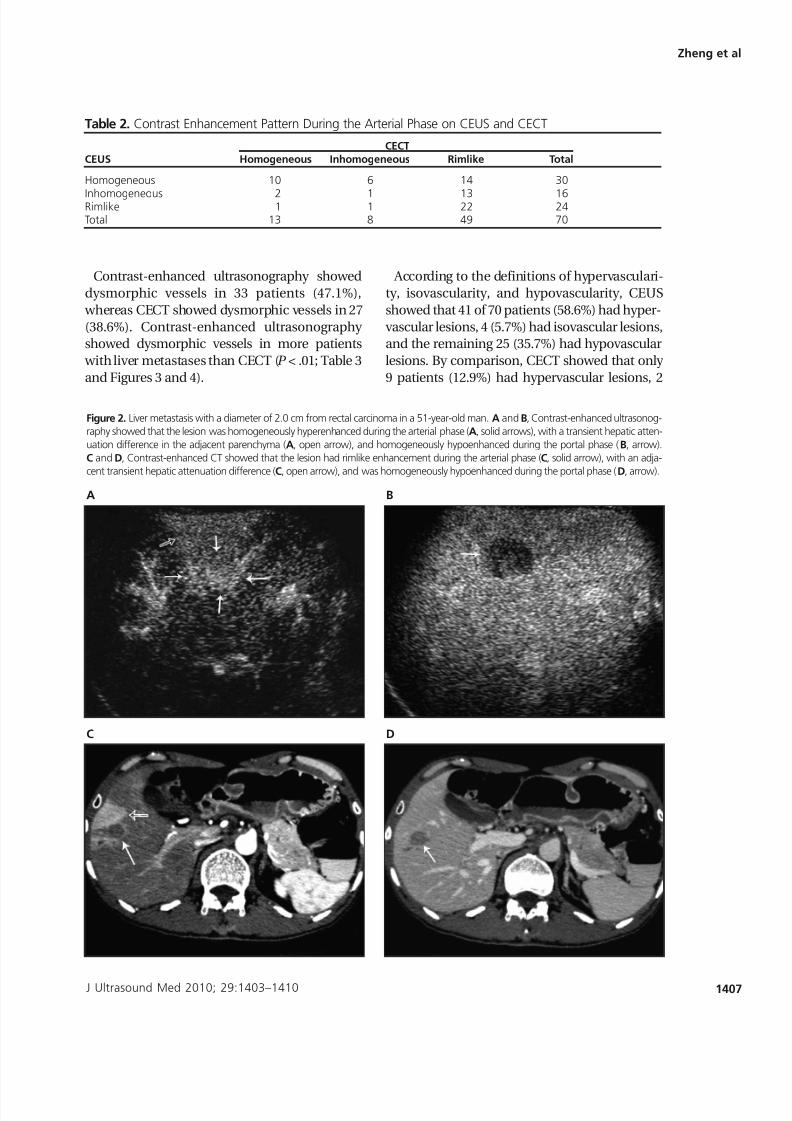
Figure 1. Liver metastasis with a diameter of 1.9 cm from rectal carcinoma in a 47-year-old woman. A and B, Contrast-enhanced
ultrasonography showed that the lesion was homogeneously hyperenhanced during the arterial phase (A, arrow) and homogeneously
hypoenhanced during the portal phase (B, arrow). C and D, Contrast-enhanced CT showed that the lesion was homogeneously isoen-
hanced during the arterial phase (C, arrow) and homogeneously hypoenhanced during the portal phase (D, arrow).
A
C
B
D
7/27/2019 USG Dan CT Kontras
http://slidepdf.com/reader/full/usg-dan-ct-kontras 5/8
7/27/2019 USG Dan CT Kontras
http://slidepdf.com/reader/full/usg-dan-ct-kontras 6/8
(2.9%) had isovascular lesions, and 59 (84.3%)
had hypovascular lesions (P < .01). In 9 hypervas-
cular lesions on CECT, 7 (77.8%) of them were
shown to be hypervascular on CEUS, and the
remaining 2 (22.2%) were isovascular. In 59 hypo-vascular lesions on CECT, 32 (54.2%) were shown
to be hypervascular on CEUS. On the other hand,
32 of 41 hypervascular lesions (78.0%) on CEUS
were shown to be hypovascular on CECT. These
findings illustrate that CEUS was more sensitive
than CECT for detecting the vascularity of liver
metastases.
Of the 32 lesions that were hypervascular on
CEUS but hypovascular on CECT, the time to
peak hyperenhancement on CEUS ranged from
9 to 19 seconds (mean, 15.8 ± 2.5 seconds) after
injection of the contrast agent. In 7 lesions that
were hypervascular on both CEUS and CECT, the
time to peak hyperenhancement on CEUS
ranged from 18 to 30 seconds (23.1 ± 4.2 seconds;
P < .01), suggesting that when the time to peak
enhancement of a lesion was too short, CECT was likely to underassess its vascularity.
Discussion
The vascularity status of liver metastases is one of
the major factors influencing therapeutic out-
comes. Braga et al1 treated 16 patients with liver
metastases from breast cancer using systemic
chemotherapy and found that patients with
hypervascular liver lesions assessed by MRI
were 20.5 times more likely to have tumor pro-
gression compared with those without hyper-
1408 J Ultrasound Med 2010; 29:1403–1410
Contrast-Enhanced Ultrasonography of Liver Metastasis Vascularity
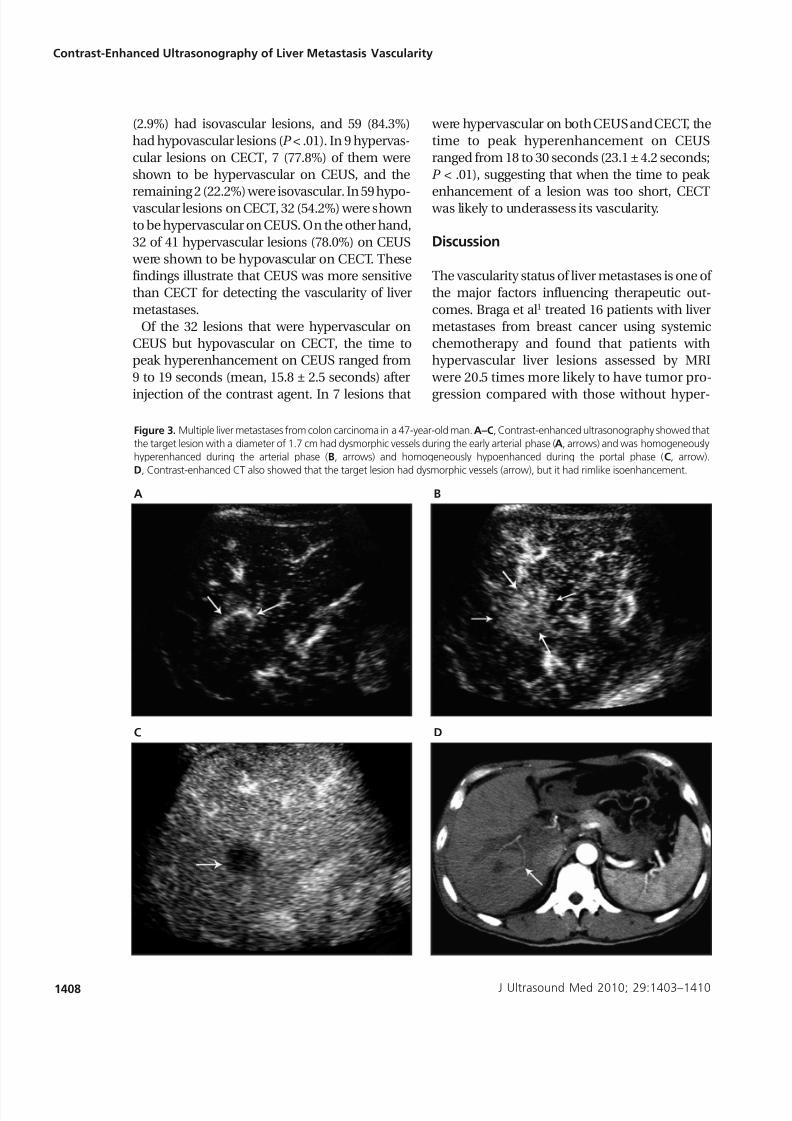
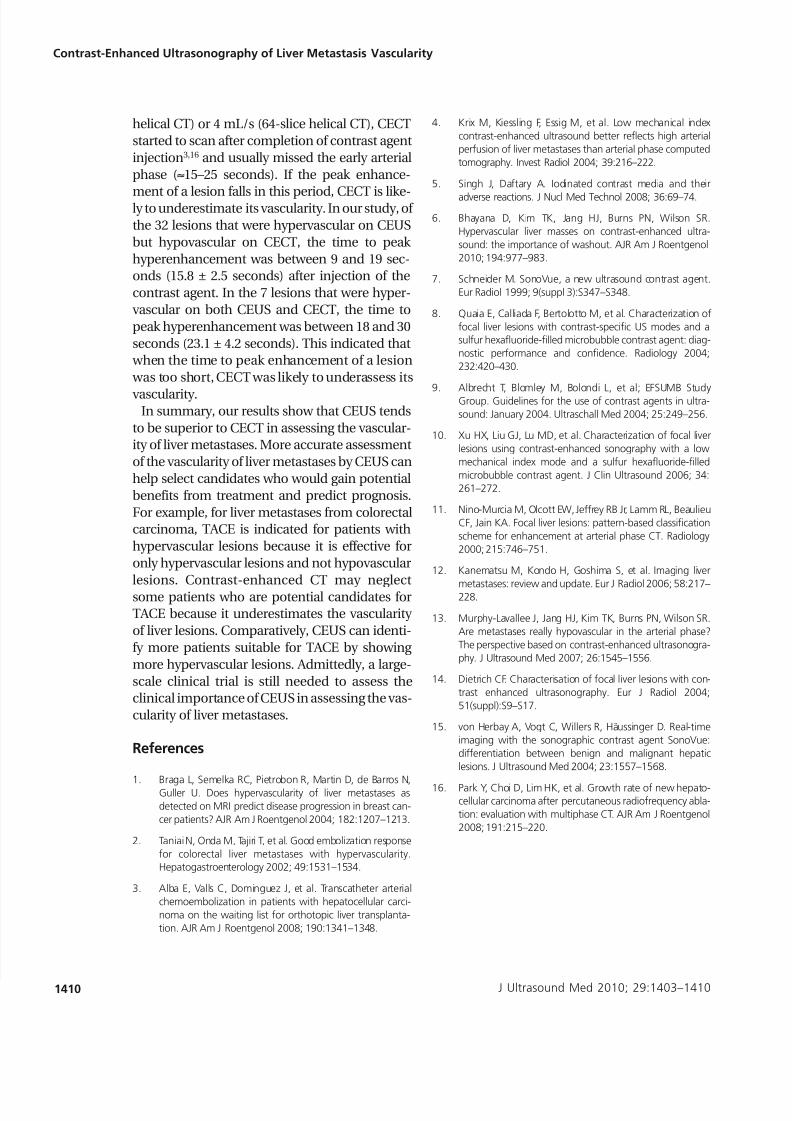
Figure 3. Multiple liver metastases from colon carcinoma in a 47-year-old man. A–C, Contrast-enhanced ultrasonography showed that
the target lesion with a diameter of 1.7 cm had dysmorphic vessels during the early arterial phase (A, arrows) and was homogeneously
hyperenhanced during the arterial phase (B, arrows) and homogeneously hypoenhanced during the portal phase (C, arrow).
D, Contrast-enhanced CT also showed that the target lesion had dysmorphic vessels (arrow), but it had rimlike isoenhancement.
A
C
B
D
7/27/2019 USG Dan CT Kontras
http://slidepdf.com/reader/full/usg-dan-ct-kontras 7/8
vascular metastases. Another study treated 45
patients with liver metastases from colorectal
carcinoma using TACE and showed that it was
effective in only hypervascular lesions assessed
by CECT.2 Hence, accurate assessment of the
vascularity status of liver metastases is of clinical
importance.
On the basis of CECT and MRI, liver metastaseshave predominantly been thought to be hypo-
vascular.12 Recently, Murphy-Lavallee et al13 used
CEUS to evaluate the vascularity of liver metas-
tases and found that 88% of them were hyper-
vascular during the early arterial phase.
However, there is still a lack of studies comparing
CEUS and CECT/MRI for assessing the vascular-
ity of liver metastases.
In this study, we compared CEUS and CECT for
evaluating the vascularity of liver metastases in
70 patients. Contrast-enhanced ultrasonography
showed that 43% of the metastatic lesions had
homogeneous enhancement, 47% had dysmor-
phic vessels, and 58.6% were hypervascular.
On the contrary, CECT showed homogeneous
enhancement in only 19% and dysmorphic ves-
sels in 39%, and only 12.9% of them were hyper-
vascular. In the 59 hypovascular lesions on CECT,
54.2% of them were shown to be hypervascular
on CEUS. On the other hand, 78% of hypervas-cular lesions on CEUS were shown to be hypo-
vascular on CECT. Among 3 patients with liver
metastases from breast and thyroid cancers that
were “classic” potentially hypervascular, CECT
showed hypervascular liver lesions in only 2 (1 in
breast cancer and 1 in thyroid cancer), whereas
CEUS revealed hypervascular lesions in all 3
(data not shown). These results suggest that
CEUS is more sensitive and accurate than CECT
for depicting the vascularity of liver metastases.
These findings might be attributed to the
following reasons. First, CEUS is a real-timedynamic scanning modality and can continu-
ously assess the vascularity of a lesion immedi-
ately after injection of a contrast agent.14,15
The dose of SonoVue used in CEUS was only
2.4 mL and was administered by bolus injection.
Contrast-enhanced ultrasonography would not
miss any time of enhancement during the whole
arterial phase and hence could accurately assess
the vascularity of a lesion. On the contrary, CECT
is an instant scanning modality and can assess
the vascularity of a lesion only at a certain point
in time during the arterial phase. Because the
dose of Ultravist used in CECT was 1.5 mL/kg
(60–100 mL in total) and was administered by
power injection at a rate of 3 mL/s (single-slice
J Ultrasound Med 2010; 29:1403–1410 1409
Zheng et al
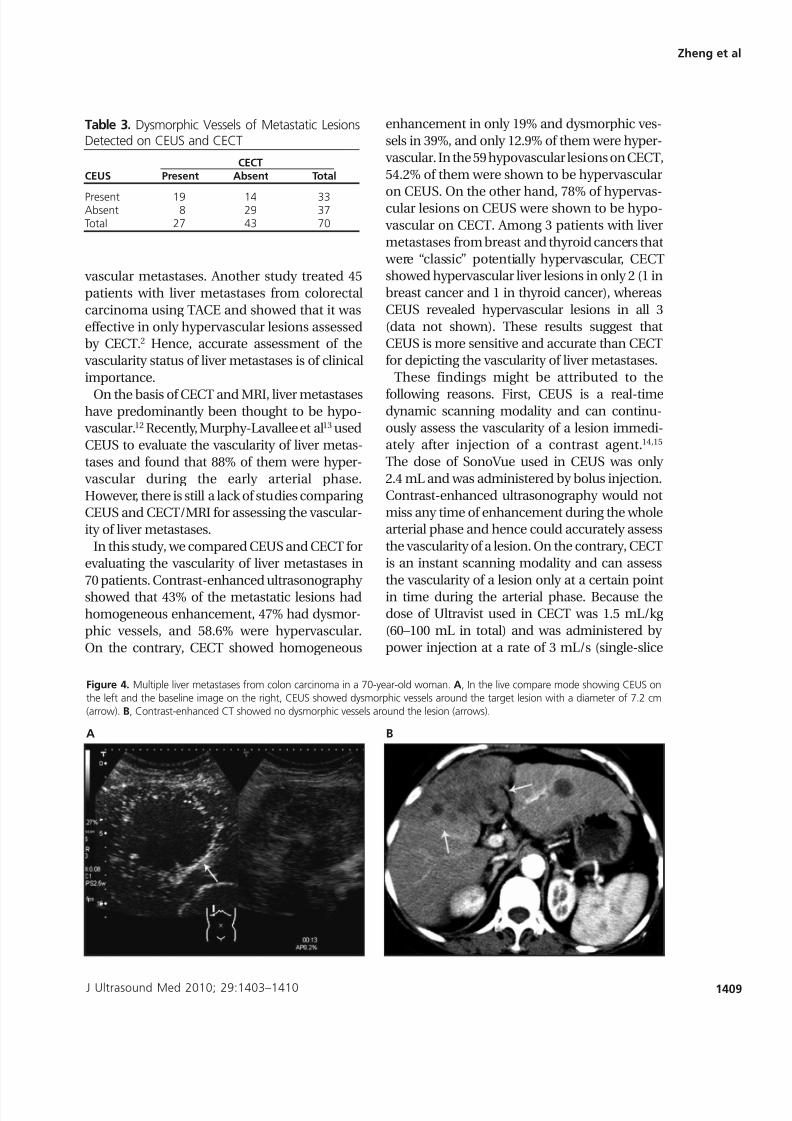
Figure 4. Multiple liver metastases from colon carcinoma in a 70-year-old woman. A, In the live compare mode showing CEUS on
the left and the baseline image on the right, CEUS showed dysmorphic vessels around the target lesion with a diameter of 7.2 cm
(arrow). B, Contrast-enhanced CT showed no dysmorphic vessels around the lesion (arrows).
A B
Table 3. Dysmorphic Vessels of Metastatic LesionsDetected on CEUS and CECT
CECTCEUS Present Absent Total
Present 19 14 33Absent 8 29 37Total 27 43 70
7/27/2019 USG Dan CT Kontras
http://slidepdf.com/reader/full/usg-dan-ct-kontras 8/8
helical CT) or 4 mL/s (64-slice helical CT), CECT
started to scan after completion of contrast agent
injection3,16 and usually missed the early arterial
phase (≈15–25 seconds). If the peak enhance-
ment of a lesion falls in this period, CECT is like-ly to underestimate its vascularity. In our study, of
the 32 lesions that were hypervascular on CEUS
but hypovascular on CECT, the time to peak
hyperenhancement was between 9 and 19 sec-
onds (15.8 ± 2.5 seconds) after injection of the
contrast agent. In the 7 lesions that were hyper-
vascular on both CEUS and CECT, the time to
peak hyperenhancement was between 18 and 30
seconds (23.1 ± 4.2 seconds). This indicated that
when the time to peak enhancement of a lesion
was too short, CECT was likely to underassess its
vascularity.In summary, our results show that CEUS tends
to be superior to CECT in assessing the vascular-
ity of liver metastases. More accurate assessment
of the vascularity of liver metastases by CEUS can
help select candidates who would gain potential
benefits from treatment and predict prognosis.
For example, for liver metastases from colorectal
carcinoma, TACE is indicated for patients with
hypervascular lesions because it is effective for
only hypervascular lesions and not hypovascular
lesions. Contrast-enhanced CT may neglect
some patients who are potential candidates for
TACE because it underestimates the vascularity
of liver lesions. Comparatively, CEUS can identi-
fy more patients suitable for TACE by showing
more hypervascular lesions. Admittedly, a large-
scale clinical trial is still needed to assess the
clinical importance of CEUS in assessing the vas-
cularity of liver metastases.
References
1. Braga L, Semelka RC, Pietrobon R, Martin D, de Barros N,
Guller U. Does hypervascularity of liver metastases as
detected on MRI predict disease progression in breast can-
cer patients? AJR Am J Roentgenol 2004; 182:1207–1213.
2. Taniai N, Onda M, Tajiri T, et al. Good embolization response
for colorectal liver metastases with hypervascularity.
Hepatogastroenterology 2002; 49:1531–1534.
3. Alba E, Valls C, Dominguez J, et al. Transcatheter arterial
chemoembolization in patients with hepatocellular carci-
noma on the waiting list for orthotopic liver transplanta-
tion. AJR Am J Roentgenol 2008; 190:1341–1348.
4. Krix M, Kiessling F, Essig M, et al. Low mechanical index
contrast-enhanced ultrasound better reflects high arterial
perfusion of liver metastases than arterial phase computed
tomography. Invest Radiol 2004; 39:216–222.
5. Singh J, Daftary A. Iodinated contrast media and their
adverse reactions. J Nucl Med Technol 2008; 36:69–74.
6. Bhayana D, Kim TK, Jang HJ, Burns PN, Wilson SR.
Hypervascular liver masses on contrast-enhanced ultra-
sound: the importance of washout. AJR Am J Roentgenol
2010; 194:977–983.
7. Schneider M. SonoVue, a new ultrasound contrast agent.
Eur Radiol 1999; 9(suppl 3):S347–S348.
8. Quaia E, Calliada F, Bertolotto M, et al. Characterization of
focal liver lesions with contrast-specific US modes and a
sulfur hexafluoride-filled microbubble contrast agent: diag-
nostic performance and confidence. Radiology 2004;
232:420–430.
9. Albrecht T, Blomley M, Bolondi L, et al; EFSUMB StudyGroup. Guidelines for the use of contrast agents in ultra-
sound: January 2004. Ultraschall Med 2004; 25:249–256.
10. Xu HX, Liu GJ, Lu MD, et al. Characterization of focal liver
lesions using contrast-enhanced sonography with a low
mechanical index mode and a sulfur hexafluoride-filled
microbubble contrast agent. J Clin Ultrasound 2006; 34:
261–272.
11. Nino-Murcia M, Olcott EW, Jeffrey RB Jr, Lamm RL, Beaulieu
CF, Jain KA. Focal liver lesions: pattern-based classification
scheme for enhancement at arterial phase CT. Radiology
2000; 215:746–751.
12. Kanematsu M, Kondo H, Goshima S, et al. Imaging liver
metastases: review and update. Eur J Radiol 2006; 58:217–228.
13. Murphy-Lavallee J, Jang HJ, Kim TK, Burns PN, Wilson SR.
Are metastases really hypovascular in the arterial phase?
The perspective based on contrast-enhanced ultrasonogra-
phy. J Ultrasound Med 2007; 26:1545–1556.
14. Dietrich CF. Characterisation of focal liver lesions with con-
trast enhanced ultrasonography. Eur J Radiol 2004;
51(suppl):S9–S17.
15. von Herbay A, Vogt C, Willers R, Häussinger D. Real-time
imaging with the sonographic contrast agent SonoVue:
differentiation between benign and malignant hepatic
lesions. J Ultrasound Med 2004; 23:1557–1568.
16. Park Y, Choi D, Lim HK, et al. Growth rate of new hepato-cellular carcinoma after percutaneous radiofrequency abla-
tion: evaluation with multiphase CT. AJR Am J Roentgenol
2008; 191:215–220.
1410 J Ultrasound Med 2010; 29:1403–1410
Contrast-Enhanced Ultrasonography of Liver Metastasis Vascularity


