economic impacts of immigrants in the toronto cma: a tax-benefit analysis the context and research...
TRANSCRIPT
Economic Impacts of Immigrants in Economic Impacts of Immigrants in the Toronto CMA: A Tax-Benefit the Toronto CMA: A Tax-Benefit
AnalysisAnalysis
The context and research questions
Data sourcesProfile of Toronto’s immigrantsEconomic impacts analysisConcluding discussions
Objectives of Canada’s Immigration Objectives of Canada’s Immigration ProgramProgram
DemographicEconomicSocialHumanitarian.
Economic consequencesEconomic consequences
immigrants’ economic impacts on the host society
the well-being of immigrants
Three Major Changes in Canada’s Three Major Changes in Canada’s Immigration Policy since Early Immigration Policy since Early 1980s.1980s.More newcomers were accepted from
non-traditional source countries than from the traditional source areas.
Emphasis was shifted from independent immigrants to family reunification and business immigrants.
After 1978, Canada switched to a policy of bringing in substantial numbers of refugees each year, rather than only at the time of special world events.

Myths about Immigrants in the Myths about Immigrants in the U.S. U.S.
Many recent immigrants are relatively unskilled. The assimilation experience is not sufficient for the recent immigrants to overcome their initial economic disadvantage. Therefore, they are more likely to participate in the welfare system and form a permanent underclass, further straining the provision of public services and leading to significant increases in the cost of maintaining the welfare state (Borjas, 1990; Borjas & Hilton, 1996; Thom, 1997).
Immigrants originating from some countries are more prone to welfare than those from other countries; and female-headed households are more likely to be welfare recipients than male-headed households (Borjas, 1990).
While family-reunification immigrants may also have skills, it is not clear whether their skills are wanted in the US economy because they are not assessed by the same criteria as for independent immigrants. If their skills do not match those deemed desirable, they are likely to become economic burdens (Brimelow, 1995).
Refugees are entitled to welfare immediately on arrival. Even after 20 years, refugees are still more likely to be on welfare than native-born Americans (Brimelow, 1995).

Forms of contributions and Forms of contributions and BurdensBurdens
Contributions:various types of tax paidparticipation in economic production investment in businesses consumption of goods and services.
Burdens welfare/UI benefitscost of public money for language training,
job skills training, education of immigrant children, and medicare.

Research QuestionsResearch Questions Do recent immigrants as a whole make positive net
economic contributions to Canada’s treasury?
Are family-reunification immigrants (including assisted relatives) more likely to be on welfare support? or do they also make positive net contributions?
Do business immigrants indeed make higher net contributions than all other classes of immigrants?
Are refugees lifetime paupers (as some U.S. studies suggest)?
If immigrants from different countries of origin have significantly different economic impacts, is it simply because of their difference in race/ethnicity, or can their varying abilities to contribute be explained by the differential human capital they brought with them to Canada?
As immigrants integrate and assimilate in the host society, do they move to the level of economic contribution displayed by the average Canadian?
Why Choosing Toronto CMA Why Choosing Toronto CMA for the Case Studyfor the Case Study it is the largest metropolitan city in Canada and has
the highest proportion of immigrants relative to its population size
About 40% of all immigrants who came to Canada landed in the Toronto CMA
Toronto CMA attracts a more diverse immigrant mix due to its employment opportunities, the availability of a variety of social assistance infrastructures, and its existing immigrant communities.
Toronto’s local economy is more sensitive to
economic impacts of immigrants than is the national economy.
Data and Methodology (1)Data and Methodology (1)
Data source -- IMDB:◦ LIDS
Age Gender family status country of last permanent residence level of education immigration class and year of landing.
◦ Tax returns total income employment income self-employment income investment income federal income tax social welfare benefit EI benefit number of immigrants who reported each type of income, tax
and benefit
Data and Methodology (2)Data and Methodology (2)
Method of data analysis: Balance-sheet approach
Indicators: ◦ per capita income tax contributions◦ per capita welfare benefit receipts◦ per capita UI benefit receipts◦ tax-benefit ratios◦ tax-benefit differences. ◦ % of immigrants reporting income tax (15 to 80
year old) ◦ welfare dependency rate (15 to 80 year old) ◦ UI usage rate (15 to 65 years old)
Limitations of This StudyLimitations of This Study
it does not include all forms of contributions and burdens;
the taxation data are for one tax year only (1985). The study results may not accurately reflect immigrants’ economic behaviours over time.
0
20000
40000
60000
80000
100000
120000
num
ber
of im
mig
rants
80 81 82 83 8485 86 87 88 89 90 91 9293 94 95landing year
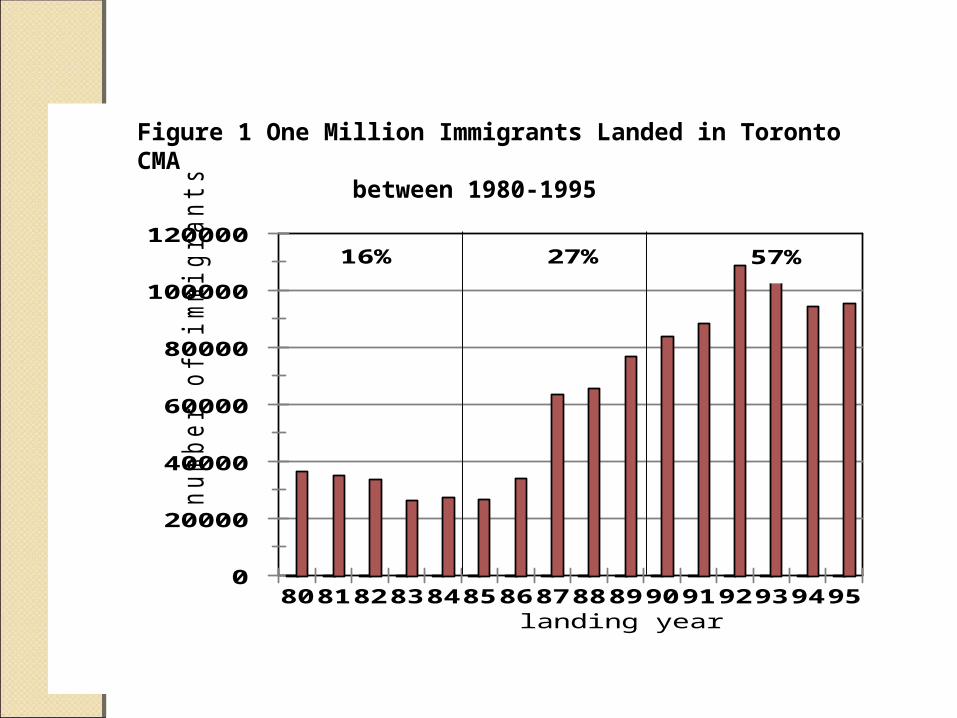
16% 27% 57%
Figure 1 One Million Immigrants Landed in Toronto CMA between 1980-1995
Landing Period
World Average
Traditional Areas
Other Europe Asia Latin America & Caribbeans
Africa
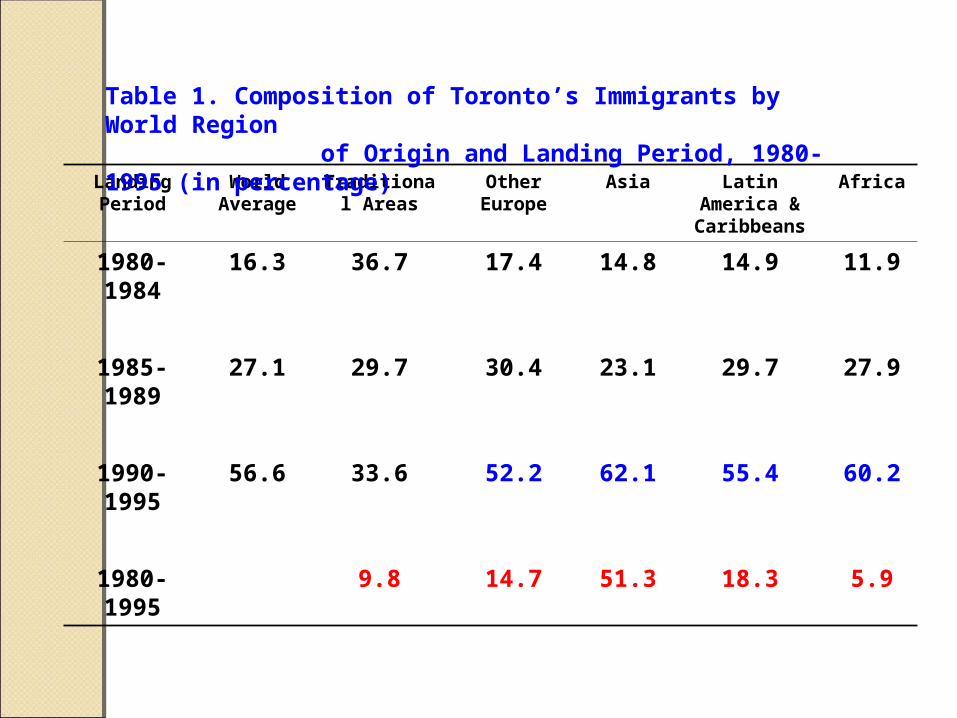
1980-1984 16.3 36.7 17.4 14.8 14.9 11.9
1985-1989 27.1 29.7 30.4 23.1 29.7 27.9
1990-1995 56.6 33.6 52.2 62.1 55.4 60.2
1980-1995 9.8 14.7 51.3 18.3 5.9
Table 1. Composition of Toronto’s Immigrants by World Region of Origin and Landing Period, 1980-1995 (in percentage)
Class World Average
Traditional Areas
Other Europe
Asia Latin America & Caribbeans
Africa
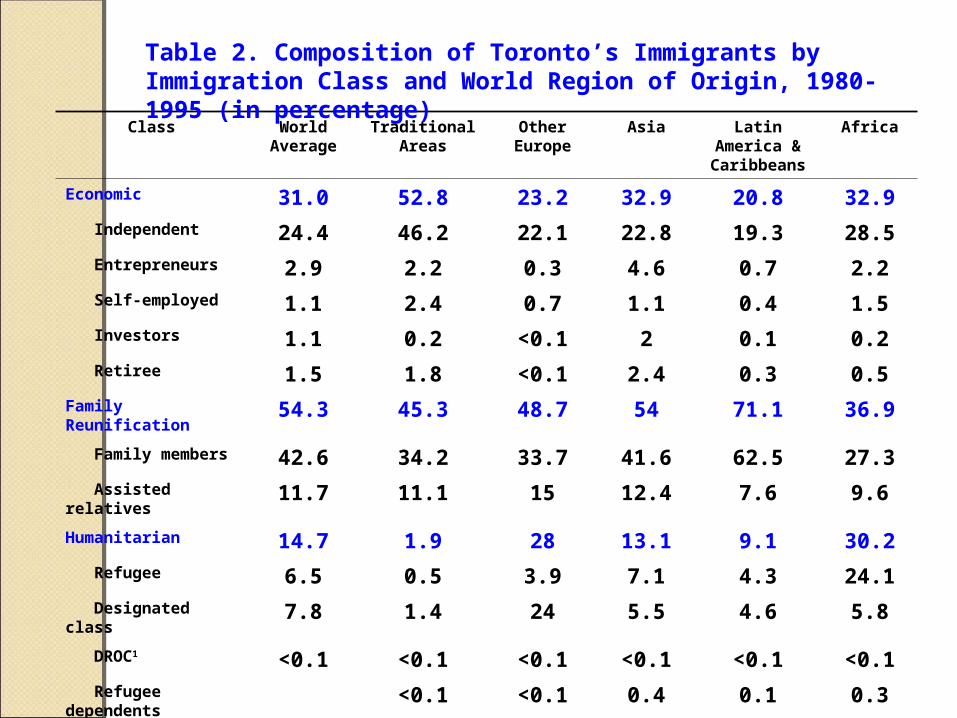
Economic 31.0 52.8 23.2 32.9 20.8 32.9
Independent 24.4 46.2 22.1 22.8 19.3 28.5
Entrepreneurs 2.9 2.2 0.3 4.6 0.7 2.2
Self-employed 1.1 2.4 0.7 1.1 0.4 1.5
Investors 1.1 0.2 <0.1 2 0.1 0.2
Retiree 1.5 1.8 <0.1 2.4 0.3 0.5
Family Reunification 54.3 45.3 48.7 54 71.1 36.9
Family members 42.6 34.2 33.7 41.6 62.5 27.3
Assisted relatives 11.7 11.1 15 12.4 7.6 9.6
Humanitarian 14.7 1.9 28 13.1 9.1 30.2
Refugee 6.5 0.5 3.9 7.1 4.3 24.1
Designated class 7.8 1.4 24 5.5 4.6 5.8
DROC1 <0.1 <0.1 <0.1 <0.1 <0.1 <0.1
Refugee dependents <0.1 <0.1 0.4 0.1 0.3
Total 100.0 100.0 100.0 100.0 100.0 100.0
Table 2. Composition of Toronto’s Immigrants by Immigration Class and World Region of Origin, 1980-1995 (in percentage)
Education World Average
Traditional Areas
Other Europe Asia Latin America & Caribbeans
Africa
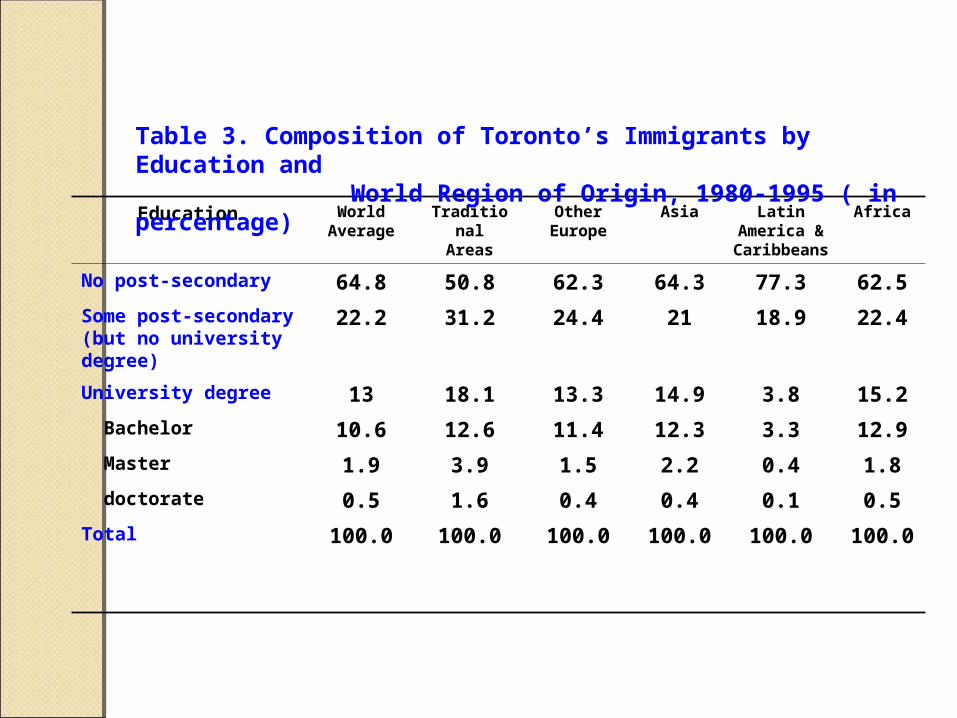
No post-secondary 64.8 50.8 62.3 64.3 77.3 62.5
Some post-secondary(but no university degree)
22.2 31.2 24.4 21 18.9 22.4
University degree 13 18.1 13.3 14.9 3.8 15.2
Bachelor 10.6 12.6 11.4 12.3 3.3 12.9
Master 1.9 3.9 1.5 2.2 0.4 1.8
doctorate 0.5 1.6 0.4 0.4 0.1 0.5
Total 100.0 100.0 100.0 100.0 100.0 100.0
Table 3. Composition of Toronto’s Immigrants by Education and World Region of Origin, 1980-1995 ( in percentage)
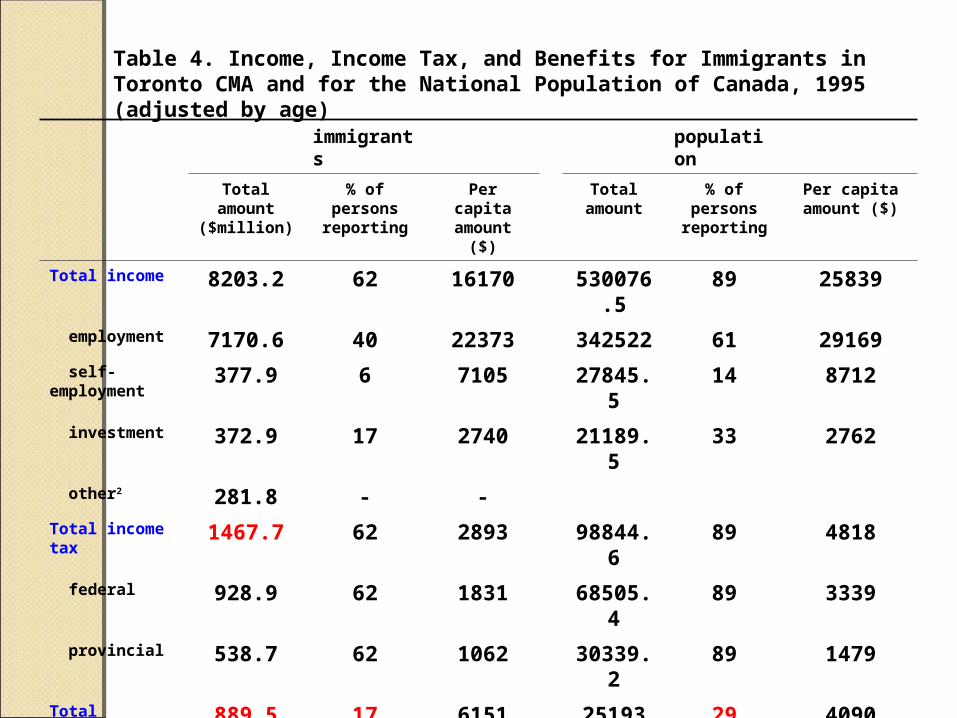
immigrants population
Total amount($million)
% of persons reporting
Per capita amount ($)
Total amount
% of persons reporting
Per capita amount ($)
Total income 8203.2 62 16170 530076.5 89 25839
employment 7170.6 40 22373 342522 61 29169
self-employment 377.9 6 7105 27845.5 14 8712
investment 372.9 17 2740 21189.5 33 2762
other2 281.8 - -
Total income tax 1467.7 62 2893 98844.6 89 4818
federal 928.9 62 1831 68505.4 89 3339
provincial 538.7 62 1062 30339.2 89 1479
Total benefits 889.5 17 6151 25193 29 4090
welfare 607.8 9 7813 12304 13 4007
U.I. 281.6 8 4216 12889 16 4173
Tax-benefit difference
578.2 73651.6
Tax-benefit ratio 1.7:1 3.9:1
Table 4. Income, Income Tax, and Benefits for Immigrants in Toronto CMA and for the National Population of Canada, 1995 (adjusted by age)
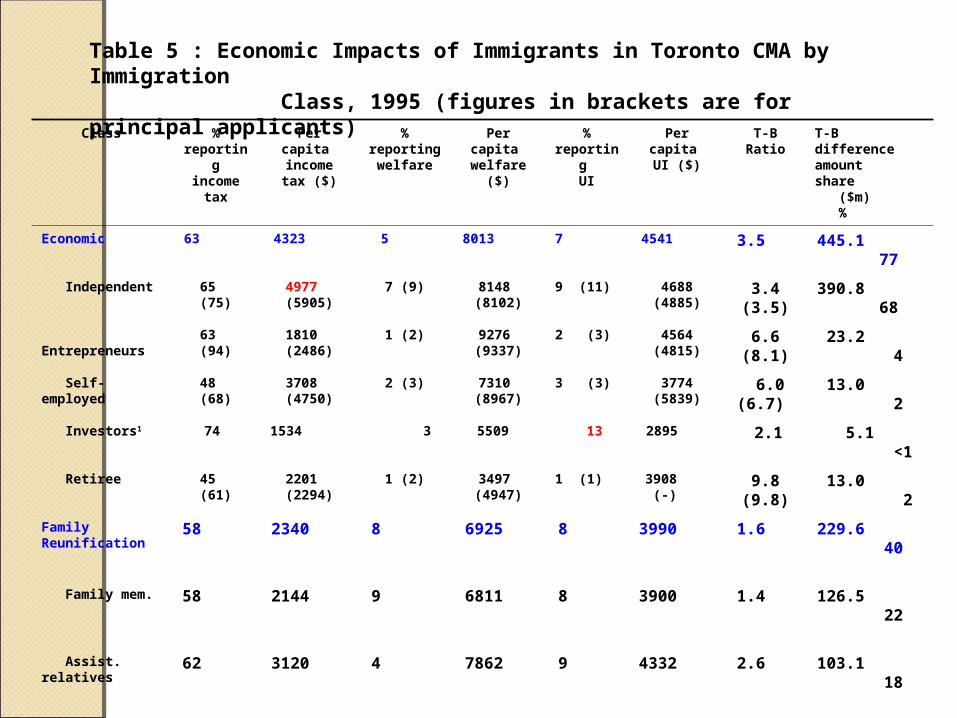
Class % reportingincome tax
Per capita income tax
($)
% reportingwelfare
Per capita welfare ($)
% reporting
UI
Per capita UI ($)
T-B Ratio T-B differenceamount share ($m) %
Economic 63 4323 5 8013 7 4541 3.5 445.1 77
Independent 65 (75) 4977 (5905) 7 (9) 8148 (8102) 9 (11) 4688 (4885) 3.4 (3.5) 390.8 68
Entrepreneurs 63 (94) 1810 (2486) 1 (2) 9276 (9337) 2 (3) 4564 (4815) 6.6 (8.1) 23.2 4
Self-employed 48 (68) 3708 (4750) 2 (3) 7310 (8967) 3 (3) 3774 (5839) 6.0 (6.7) 13.0 2
Investors1 74 1534 3 5509 13 2895 2.1 5.1 <1
Retiree 45 (61) 2201 (2294) 1 (2) 3497 (4947) 1 (1) 3908 (-) 9.8 (9.8) 13.0 2
Family Reunification
58 2340
8 6925
8 3990 1.6 229.6 40
Family mem. 58 2144
9 6811
8 3900 1.4 126.5 22
Assist. relatives 62 3120
4 7862
9 4332 2.6 103.1 18
Humanitarian 76 2324 24 8777
11 4447 0.7 -103.5 -18
Refugee (C-R) 69 1283 32 8910
9 4093 0.3 -129.3 -22
Designated class 81 3151 17 8549
14 4601 1.2 26.7 5
DORC 77 1374 <1 - <1 - 1.4 0.1 <1
Dependent of C-R 61 254 8 10904
<1 - 0.2 -1.0 -0.2
Average 62 2893 9 7813
8 4216 1.7 578.2 100
Table 5 : Economic Impacts of Immigrants in Toronto CMA by Immigration Class, 1995 (figures in brackets are for principal applicants)
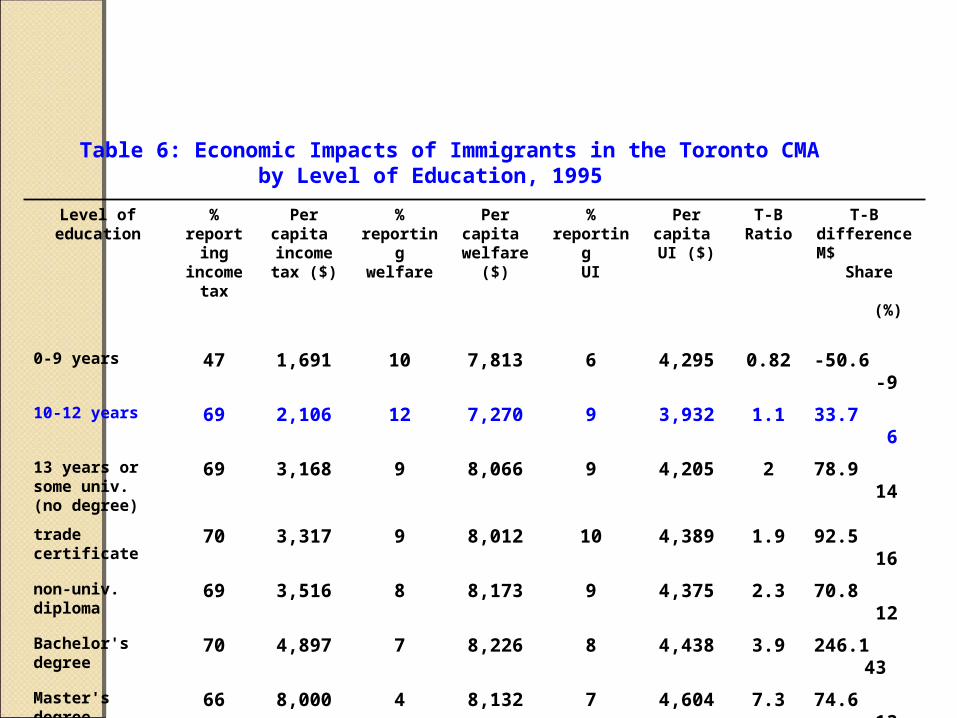
Level of education % reporting
income tax
Per capita income tax
($)
% reportingwelfare
Per capita welfare ($)
% reporting
UI
Per capita UI ($)
T-B Ratio
T-B differenceM$ Share (%)
0-9 years 47 1,691 10 7,813 6 4,295 0.82 -50.6 -9
10-12 years 69 2,106 12 7,270 9 3,932 1.1 33.7 6
13 years or some univ. (no degree)
69 3,168 9 8,066 9 4,205 2 78.9 14
trade certificate 70 3,317 9 8,012 10 4,389 1.9 92.5 16
non-univ. diploma 69 3,516 8 8,173 9 4,375 2.3 70.8 12
Bachelor's degree 70 4,897 7 8,226 8 4,438 3.9 246.1 43
Master's degree 66 8,000 4 8,132 7 4,604 7.3 74.6 13
Doctorate 65 13,229 5 8,939 5 4,557 15.9 32.2 5
Average 62 2,893 9 7,813 8 4,216 1.7 578.2 100
Table 6: Economic Impacts of Immigrants in the Toronto CMA by Level of Education, 1995

Table 7: Economic Impacts of Immigrants in the Toronto CMA by World Regions of Last Permanent Residence, 1995
Region % reporting
income tax
Per capita income tax
($)
% reportingwelfare
Per capita welfare
($)
% reporting
UI
Per capita UI ($)
T-B Ratio
T-B difference($m) share%
Traditional source areas
50 8262 2 7702 5 4652 9.7 279.5 48
Other European
69 3303 11 7887 12 5039 1.4 78.3 14
Asia 62 2187 8 7690 7 3857 1.5 188.5 32
Latin America &Caribbean
61 2490 13 7957 9 4055 1.1 21.6 4
Africa 72 3081 20 7798 9 4324 1.1 10.5 2
Average 62 2893 9 7813 8 4216 1.7 578.2 100
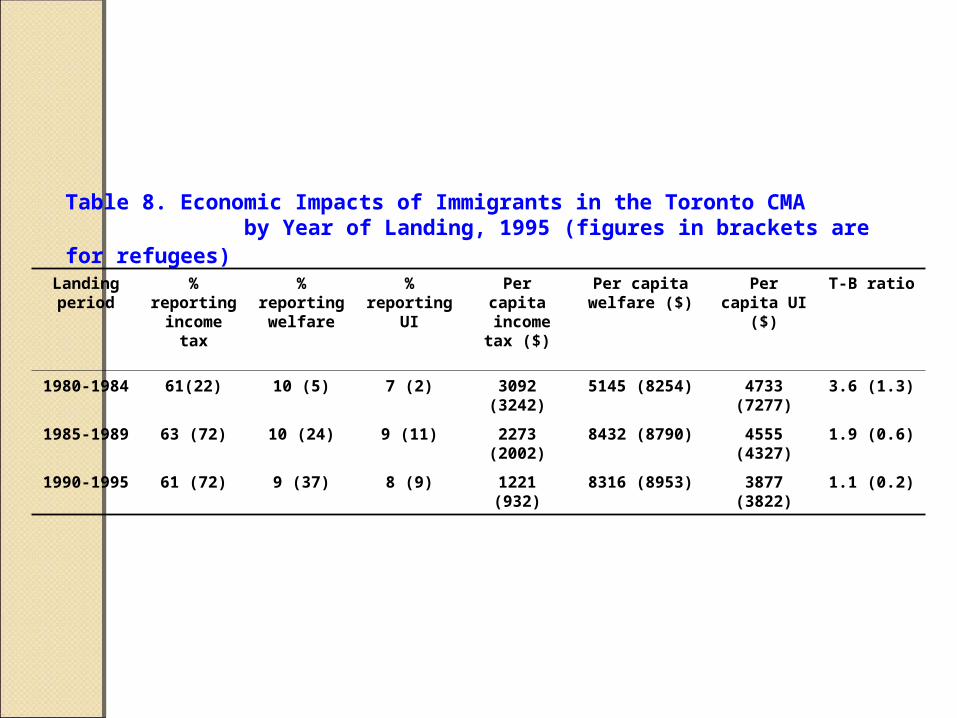
Landing period
% reporting income tax
% reporting welfare
% reporting UI
Per capita income tax
($)
Per capita welfare ($)
Per capita UI ($)
T-B ratio
1980-1984 61(22) 10 (5) 7 (2) 3092 (3242) 5145 (8254) 4733 (7277) 3.6 (1.3)
1985-1989 63 (72) 10 (24) 9 (11) 2273 (2002) 8432 (8790) 4555 (4327) 1.9 (0.6)
1990-1995 61 (72) 9 (37) 8 (9) 1221 (932) 8316 (8953) 3877 (3822) 1.1 (0.2)
Table 8. Economic Impacts of Immigrants in the Toronto CMA by Year of Landing, 1995 (figures in brackets are for refugees)

Research QuestionsResearch Questions Do recent immigrants as a whole make positive net
economic contributions to Canada’s treasury?
Are family-reunification immigrants (including assisted relatives) more likely to be on welfare support? or do they also make positive net contributions?
Do business immigrants indeed make higher net contributions than all other classes of immigrants?
Are refugees lifetime paupers (as some U.S. studies suggest)?
If immigrants from different countries of origin have significantly different economic impacts, is it simply because of their difference in race/ethnicity, or can their varying abilities to contribute be explained by the differential human capital they brought with them to Canada?
As immigrants integrate and assimilate in the host society, do they move to the level of economic contribution displayed by the average Canadian?
ConclusionsConclusions
1. Toronto’s immigrants (admitted between 1980 and 1995) did not obtain social assistance in excess of the income tax they pay. In other words, there is no evidence that these immigrants are an economic drain on the host society. Instead, they as a whole make positive net contributions to both Canada’s and Ontario’s treasuries.
2. Toronto’s immigrants in general have not been able to contribute to the governments’ coffers at the same level as the average Canadian does. Since a low T-B ratio is usually caused by low income and insecure employment, it is also indicative that Toronto’s immigrants have not achieved levels of economic performance and security comparable to those of the native born Canadians.

ConclusionsConclusions
3. there remain important internal differences. ◦ The economic immigrants have the
highest ability to pay income tax, especially the independent immigrants This proves that the point system has been working well for the economic well-being of Canada.
◦ The retirees are also able to make a substantial positive net contribution because they pay income taxes but receive (or are eligible for) little social assistance.
◦ Entrepreneurs and investors actually paid less than the average immigrants do; and the high UI usage rate of investors (including their spouses and dependents) is also unexpected.
ConclusionsConclusions
4. immigrants admitted for family reunification, especially assisted relatives, make net positive contributions to governments’ coffers, though their T-B ratio is lower than that for economic immigrants. So, they are not economic burdens to Canada and Toronto, as many have perceived.
5. The only immigrants who received more benefits than the amount of taxes they paid are refugees and their dependents. However, refugees do not seem to be life-time paupers, as those who have been in Canada for more than 10 year do pay more taxes than they collect benefit (albeit with a marginally greater-than-one T-B ratio). With refugees and their dependents accounting for only 7% of the immigrant population, the cost of providing benefits to them can be adequately offset by the positive income tax transfers from other immigrants in the Toronto CMA, or even offset by positive tax transfers from immigrants from non-traditional source areas only (see Tables 5 and 7).

ConclusionsConclusions
6. The differences in economic impacts between immigrants from the traditional source areas and the rest of the world cannot be fully explained by higher English or French proficiency in the former group. Many immigrants from the Caribbean and African countries do speak fluent English or French, but their levels of economic contribution are lower than those of the immigrants from the
traditional source areas. Their significantly different economic impacts are largely because of the differential human capital they brought with them to Canada.

ConclusionsConclusions
7. It is neither possible nor desirable to accept immigrants only from the traditional source countries, and to accept only economic immigrants who possess the most human capital
◦ the traditional source areas themselves would not meet Canada’s need for immigrants to shore up its population growth.
◦ to maximize economic contributions is only one of the four government objectives.
◦ it would be unfair for Canada to select only the best immigrants from the already talent- and capital-deprived countries, thus exacerbating the brain-drain problem in those countries.

Future Studies and Policy ImplicationsFuture Studies and Policy Implications More empirical studies of immigrants’ economic impacts are needed for
future changes to Canada’s immigration program. They should include as many forms of contributions and burdens as possible and balanced program goals.
On the basis of empirical studies, a critical contribution-benefit ratio acceptable to Canada can be developed and an appropriate mix of immigrants can then be determined to achieve the ratio.
The economic impacts of immigrants should also be periodically monitored against the critical contribution-benefit ratio and adjustment to immigrant mix be made if necessary.
More efforts and political willingness are needed to identify and remove all social and institutional barriers that obstruct immigrants from making economic contribution to their full ability.
A high degree of safeguards and monitoring is also needed to avoid abuse and misuse of Canada’s business immigrant program.
Because all Canadians (including newcomers) have equal entitlement to
normal family life, it should not be made more difficult for extended family members to apply for immigrating to Canada.
Canada should screen both external applicants and internal refugee claimants carefully to select and accept only genuine refugees. This is to the best interests of both Canada and the genuine refugees.