educational technology i report
TRANSCRIPT

• CIRCLE OR PIE GRAPH
• BAR GRAPH
• PICTORIAL GRAPH
• LINE GRAPH
• GRAPHIC ORGANIZER
A story is not the only way to communicate information. There are other ways we can learn new information!
• Physical Map• Relief Map• Commercial or Economic
Map• Political Map
Postscript--A Lot of Visual Symbols at Your Disposal
Like pictures, all other visual symbols are
worth a thousand words

PIE GRAPH• Can be used to show
the percentage of I whole or 100%
• Should have a title and it should have a key/legend
• May or may not show actual percentages
BAR GRAPH • Used in comparing the
magnitude of similar items at different ties or seeing relative sizes of the parts of a whole
• uses bars to show data. The bars can be vertical (up and down), or horizontal (across). The data can be in words or numbers.

PICTORIAL GRAPH
• Make use of picture symbols
• Uses pictures or symbols to show data. One picture often stands for more than one vote so a key is necessary to understand the symbols.
LINE GRAPH• Lines to represent
amounts of things.
• Uses points and lines on a grid to show change over a period of time.
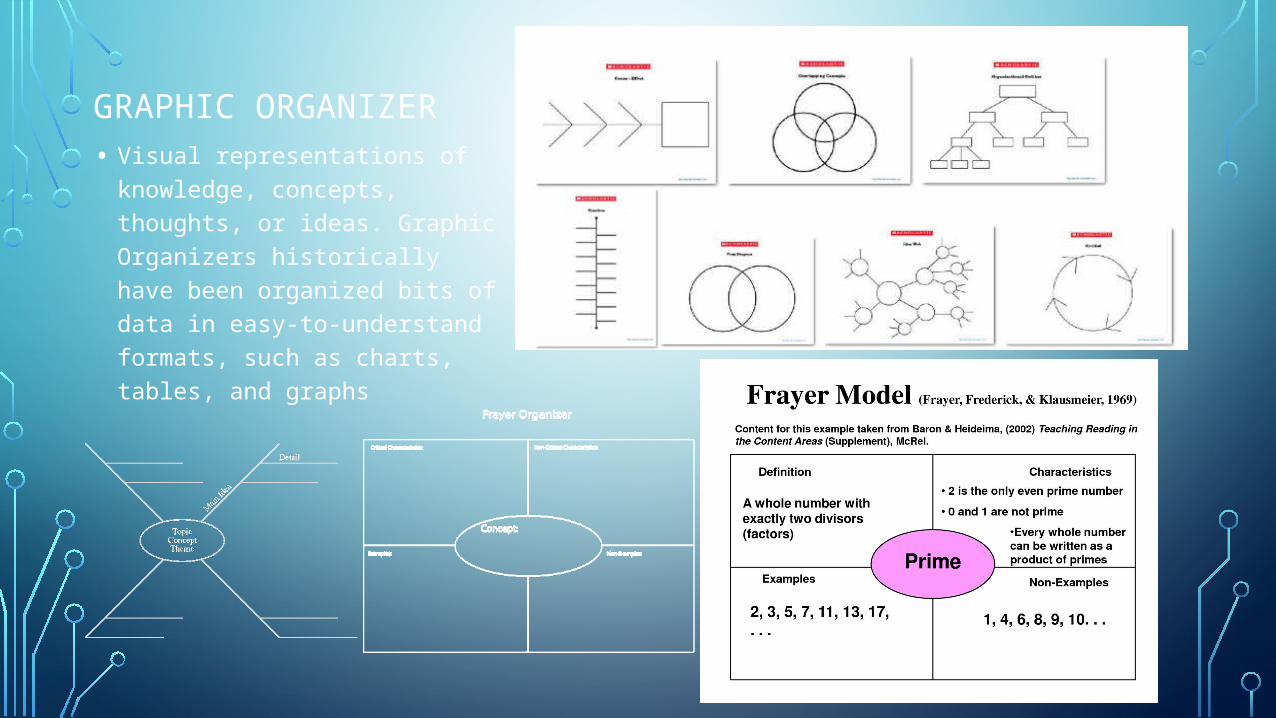
GRAPHIC ORGANIZER
• Visual representations of knowledge, concepts, thoughts, or ideas. Graphic Organizers historically have been organized bits of data in easy-to-understand formats, such as charts, tables, and graphs

MAPSPhysical Map-
Combines in a single projection data like altitude, temperature, rainfall, precipitation, vegetation and soil.
Relief Map-
Has three dimensional representations and show contours of the physical data of the earth or part of the earth.
Commercial or Economic Map-
Also called product or industrial map since they show land areas in relation to the economy.
Political Map-
Gives detailed information about country, provinces, cities and towns, roads and highways. Oceans, rivers and lakes are the main features of most political maps.

Scale- shows how much of the actual earth’s surface is represented by a given measurement on a map. E.g. 1 inch= 15 statute miles.
Symbols- usually a map has a legend that explains what each symbol means.
Color- the different colors of the map are part of the map language.
Geographic grids-
Meridian: north and south pole line
Parallels: lines drawn around a globe with all points along each line with an equal distance from the pole.
Longitude: distance in degrees of any place east or west of the prime meridian
Latitude: distance in degrees of any place north and south of the equator.
MAPS LANGUAGE

UNDERSTANDING MAPS, GRAPHS AND CHARTS
• Summing up:
The proper use of visual symbols will contribute to optimum learning. For these visual symbols to be at your fingertips, you ought to be skilled at making them.
The collection, preparation and use of these various visual symbols depends to a great extent on your resourcefulness and creativity. If you use them skillfully, your classroom may turn into a beehive of busy students.
1.Read the titles and subtitles.
2.Read the key, and/or the legend, and the scale of miles whenever any of these are present.
3.Read the information shown along the side and the bottom of graphs and charts and tables, if any.
4.Determine your purpose for reading the map, chart, table, or graph.
Creativity is intelligence having fun
Albert Einstein
POSTSCRIPT
• You may not realize it. But with visual symbols alone, you have an array of teaching materials to choose from. If you decide and commit yourself to using one visual symbol for every lesson, you will keep your teaching crispy and fresh. Only that this requires more preparation and more learning on your part. You must learn how to draw, sketch, make diagrams, graphs and charts. The computer can now do the graphs, the charts and some diagrams. You have to know what software to use and, of course, how to manipulate the computer.