民間企業設備 政府最終消費支出 2019年7~9月期四 …...国民総所得(gni)...
TRANSCRIPT

2019年7~9月期四半期別GDP速報 (2次速報値)Quarterly Estimates of GDP for July - September 2019 (Second Preliminary Estimates)
Ⅰ.国内総生産(支出側)及び各需要項目GDP (Expenditure Approach) and Its Components
1-1.1次速報値と2次速報値の比較(四半期値、実質、季節調整済前期比)
(2011暦年連鎖価格; 単位:%) (Chained (2011) Yen(seasonally adjusted) ; %)
1次速報値(2019.11.14公表)
2次速報値1次速報値
(2019.11.14公表)2次速報値
1st Prelim. 2nd Prelim. 1st Prelim. 2nd Prelim.
0.1 0.4
[0.2] [1.8]
0.2 0.6 0.2 0.6
0.1 0.6 0.1 0.4
0.4 0.5 0.2 0.3
0.3 0.5 0.2 0.3
除 く 持 ち 家 の帰 属 家 賃 0.4 0.6 0.2 0.2 Excluding Imputed Rent
1.4 1.6 0.0 0.0
0.9 1.8 0.1 0.3
*** *** -0.3 -0.2
0.6 0.7 0.1 0.2
0.5 0.7 0.1 0.1
0.8 0.9 0.0 0.0
*** *** -0.0 -0.0
0.9 1.6 0.2 0.4
*** *** -0.2 -0.2
-0.7 -0.6 -0.1 -0.1
0.2 0.3 -0.0 -0.1
(参考) (cf)
0.4 0.6 *** ***
0.1 0.5 *** ***
-0.0 -0.3 *** ***※1 : Changes from the previous quarter (seasonally adjusted)
※2 : Contributions to changes in GDP
※3 : 総固定資本形成は民間住宅、民間企業設備、公的固定資本形成から成る。
Gross Fixed Capital Formation consists of Private Residential Investment, Private Non-Resi. Investment and Public Investment.
※4 : 財貨・サービスの純輸出=財貨・サービスの輸出-財貨・サービスの輸入
Net Exports of Goods & Services = Exports of Goods & Services - Imports of Goods & Services
純輸出の寄与度は輸出と輸入の寄与度の差によって求めている。
The contribution is calculated as the contribution of Exports less that of Imports.
年 ・ 期
項 目
財 貨 ・ サ ー ビ ス の 輸 出
( 控 除 ) 財 貨 ・ サ ー ビ ス の 輸 入
( 再 掲 ) 総 固 定 資 本 形 成 ※ 3
民 間 企 業 設 備
公 的 需 要
財 貨 ・ サ ー ビ ス の 純 輸 出 ※ 4
政 府 最 終 消 費 支 出
公 的 固 定 資 本 形 成
民 間 在 庫 変 動
[年 率 換 算]
民 間 住 宅
民 間 需 要
国 内 需 要
家 計 最 終 消 費 支 出
前 期 比 ※1 寄 与 度 (対GDP) ※2
Private Demand
[Annual rate]***
Gross Domestic Product
Domestic Demand
***
2019/7~9
雇 用 者 報 酬 Compensation of Employees
Change in Public Inventories
Net Exports of Goods & Services※4
Exports of Goods & Services
(Regrouped) Gross Fixed CapitalFormation ※3
公 的 在 庫 変 動
国 民 総 所 得 ( G N I ) Gross National Income
最 終 需 要Final Sales ofDomestic Product
国 内 総 生 産 ( G D P )
民 間 最 終 消 費 支 出
Government Consumption
Public Demand
(Less) Imports of Goods & Services
Consumption of Households
Private Residential Investment
Private Non-Resi. Investment
Public Investment
Change in Private Inventories
Private Consumption
Comparison of the First Preliminary and the Second Preliminary Estimates(Quarterly Real Growth Rate, SeasonallyAdjusted Series, Quarter-to-Quarter)
Economic and Social Research Institute
Cabinet Office, Government of Japan
Released: 2019.12.9
内 閣 府 経済社会総合研究所国 民 経 済 計 算 部
令 和 元 年 12 月 9 日

Released: 2019.12.9
1-2.1次速報値と2次速報値の比較(四半期値、名目、季節調整済前期比)
(単位:%) (%;seasonally adjusted)
1次速報値(2019.11.14公表)
2次速報値1次速報値
(2019.11.14公表)2次速報値
1st Prelim. 2nd Prelim. 1st Prelim. 2nd Prelim.
0.3 0.6
[1.2] [2.4]
0.4 0.7 0.4 0.7
0.3 0.7 0.2 0.5
0.5 0.7 0.3 0.4
0.5 0.7 0.3 0.4
除 く 持 ち 家 の帰 属 家 賃 0.6 0.8 0.3 0.4 Excluding Imputed Rent
1.7 1.9 0.1 0.1
1.2 1.9 0.2 0.3
*** *** -0.3 -0.2
0.8 0.7 0.2 0.2
0.8 0.6 0.2 0.1
1.2 1.1 0.1 0.1
*** *** -0.0 -0.0
1.3 1.7 0.3 0.4
*** *** -0.1 -0.1
-1.9 -1.9 -0.3 -0.3
-1.3 -1.3 0.2 0.2
(参考1) (cf)
0.6 0.8 *** ***
0.3 0.6 *** ***
0.2 -0.1 *** ***※1 : Changes from the previous quarter (seasonally adjusted)
※2 : Contributions to changes in GDP
※3 : 総固定資本形成は民間住宅、民間企業設備、公的固定資本形成から成る。
Gross Fixed Capital Formation consists of Private Residential Investment, Private Non-Resi. Investment and Public Investment.
※4 : 財貨・サービスの純輸出=財貨・サービスの輸出-財貨・サービスの輸入Net Exports of Goods & Services = Exports of Goods & Services - Imports of Goods & Services
(参考2) 四半期デフレーター(季節調整系列) (cf)
1次速報値 2次速報値
1st Prelim. 2nd Prelim.
0.2 0.20.2 0.1
※5 : Changes from the previous quarter (seasonally adjusted)
2019/7~9
2019/7~9
家 計 最 終 消 費 支 出
[年 率 換 算]
民 間 住 宅
民 間 企 業 設 備
最 終 需 要
Private Non-Resi. Investment
[Annual rate]***
国 内 総 生 産 ( G D P )
***
民 間 最 終 消 費 支 出
Final Sales ofDomestic Product
前 期 比 ※1 寄 与 度 (対GDP) ※2
年 ・ 期
Consumption of Households
項 目
Domestic Demand
Private Consumption
民 間 需 要
国 内 需 要
Private Demand
Gross Domestic Product
Change in Private Inventories民 間 在 庫 変 動
Private Residential Investment
前期比 ※5
政 府 最 終 消 費 支 出
Net Exports of Goods & Services※4
公 的 固 定 資 本 形 成
(Regrouped) Gross Fixed CapitalFormation ※3
Public Investment
Government Consumption
財 貨 ・ サ ー ビ ス の 輸 出
公 的 在 庫 変 動
雇 用 者 報 酬 Compensation of Employees
Change in Public Inventories
( 再 掲 ) 総 固 定 資 本 形 成 ※ 3
(Less) Imports of Goods & Services
国 民 総 所 得 ( G N I ) Gross National Income
Comparison of the First Preliminary and the Second Preliminary Estimates (Quarterly Nominal GrowthRate, Seasonally Adjusted Series, Quarter-to-Quarter)
国 内 需 要 デ フ レ ー タ ー Domestic Demand Deflator
項 目
年 ・ 期
公 的 需 要 Public Demand
G D P デ フ レ ー タ ー GDP Deflator
( 控 除 ) 財貨 ・サービスの輸入
Exports of Goods & Services
財 貨 ・ サ ー ビ ス の 純 輸 出 ※ 4

Released: 2019.12.9
2-1.1次速報値と2次速報値の比較(年度値、実質、前年比)Comparison of the First Preliminary and the Second Preliminary Estimates(Annual Real Growth Rate, Fiscal Year)
(2011暦年連鎖価格; 単位:%) (Chained (2011) Yen ; %)
1次速報値(2019.11.14公表)
2次速報値1次速報値
(2019.11.14公表)2次速報値
1st Prelim. 2nd Prelim. 1st Prelim. 2nd Prelim.
0.7 0.3 *** ***
0.8 0.4 0.8 0.4
1.1 0.2 0.8 0.2
0.4 0.1 0.2 0.0
0.4 0.1 0.2 0.1
除 く 持 ち 家 の帰 属 家 賃 0.2 -0.1 0.1 -0.0 Excluding Imputed Rent
-4.3 -4.9 -0.1 -0.1
3.5 1.7 0.6 0.3
*** *** 0.1 0.0
-0.1 0.8 -0.0 0.2
0.9 0.9 0.2 0.2
-4.0 0.6 -0.2 0.0
*** *** -0.0 -0.0
0.9 0.6 0.2 0.1
*** *** -0.1 -0.1
1.6 1.6 0.3 0.3
2.2 2.2 -0.4 -0.4
(参考) (cf)
0.5 0.3 *** ***
0.2 -0.2 *** ***
2.1 2.4 *** ***※1 : Changes from the previous year
※2 : Contributions to changes in GDP
※3 : 総固定資本形成は民間住宅、民間企業設備、公的固定資本形成から成る。
Gross Fixed Capital Formation consists of Private Residential Investment, Private Non-Resi. Investment and Public Investment.
※4 : 財貨・サービスの純輸出=財貨・サービスの輸出-財貨・サービスの輸入
Net Exports of Goods & Services = Exports of Goods & Services - Imports of Goods & Services
純輸出の寄与度は輸出と輸入の寄与度の差によって求めている。
The contribution is calculated as the contribution of Exports less that of Imports.
民 間 最 終 消 費 支 出 Private Consumption
国 内 総 生 産 ( G D P )
年
項 目
前 年 比 ※1 寄 与 度 (対GDP) ※2
Gross Domestic Product
国 内 需 要 Domestic Demand
民 間 需 要 Private Demand
2018年度(Fiscal Year)
家 計 最 終 消 費 支 出 Consumption of Households
民 間 住 宅 Private Residential Investment
民 間 企 業 設 備 Private Non-Resi. Investment
( 再 掲 ) 総 固 定 資 本 形 成 ※ 3(Regrouped) Gross Fixed Capital
Formation ※3
財 貨 ・ サ ー ビ ス の 純 輸 出 ※ 4Net Exports of Goods & Services
※4
民 間 在 庫 変 動 Change in Private Inventories
公 的 在 庫 変 動
公 的 需 要 Public Demand
Government Consumption
Public Investment
政 府 最 終 消 費 支 出
公 的 固 定 資 本 形 成
Change in Public Inventories
財 貨 ・ サ ー ビ ス の 輸 出 Exports of Goods & Services
( 控 除 ) 財 貨 ・ サ ー ビ ス の 輸 入 (Less) Imports of Goods & Services
雇 用 者 報 酬 Compensation of Employees
国 民 総 所 得 ( G N I ) Gross National Income
最 終 需 要Final Sales ofDomestic Product
Released: 2019.12.9
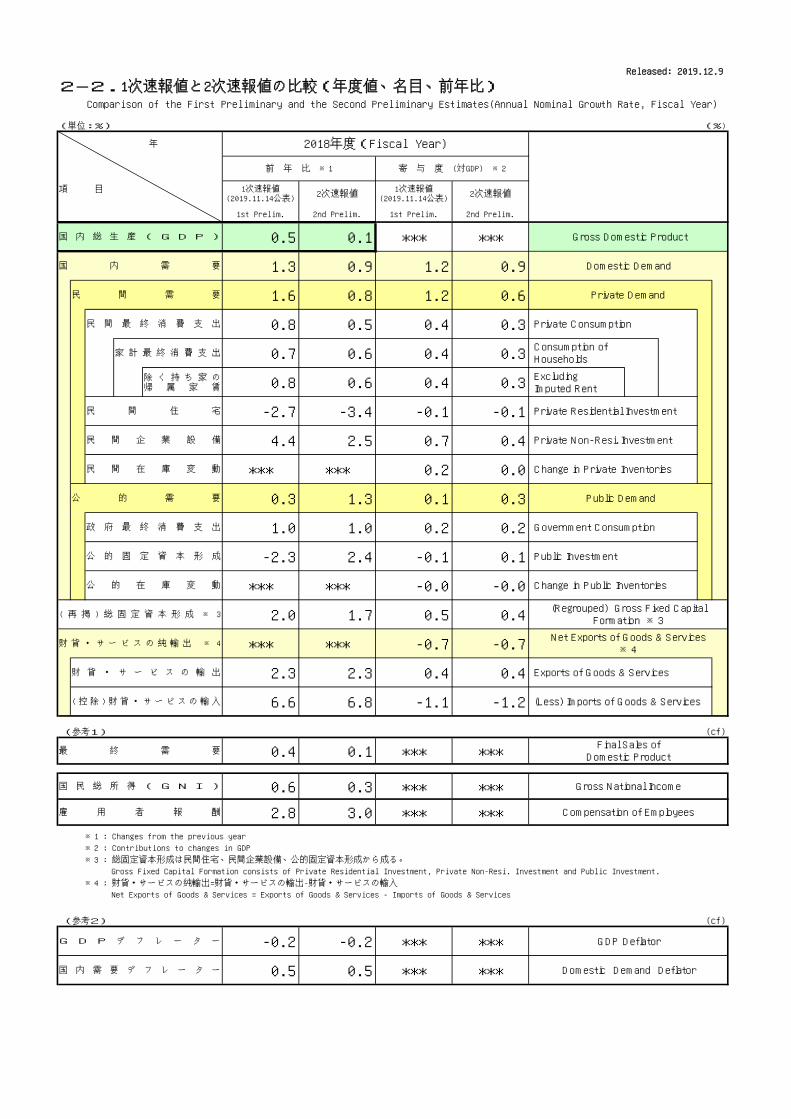
2-2.1次速報値と2次速報値の比較(年度値、名目、前年比)Comparison of the First Preliminary and the Second Preliminary Estimates(Annual Nominal Growth Rate, Fiscal Year)
(単位:%) (%)
1次速報値(2019.11.14公表)
2次速報値1次速報値
(2019.11.14公表)2次速報値
1st Prelim. 2nd Prelim. 1st Prelim. 2nd Prelim.
0.5 0.1 *** ***
1.3 0.9 1.2 0.9
1.6 0.8 1.2 0.6
0.8 0.5 0.4 0.3
0.7 0.6 0.4 0.3
除 く 持 ち 家 の帰 属 家 賃 0.8 0.6 0.4 0.3 Excluding Imputed Rent
-2.7 -3.4 -0.1 -0.1
4.4 2.5 0.7 0.4
*** *** 0.2 0.0
0.3 1.3 0.1 0.3
1.0 1.0 0.2 0.2
-2.3 2.4 -0.1 0.1
*** *** -0.0 -0.0
2.0 1.7 0.5 0.4
*** *** -0.7 -0.7
2.3 2.3 0.4 0.4
6.6 6.8 -1.1 -1.2
(参考1) (cf)
0.4 0.1 *** ***
0.6 0.3 *** ***
2.8 3.0 *** ***
※1 : Changes from the previous year
※2 : Contributions to changes in GDP
※3 : 総固定資本形成は民間住宅、民間企業設備、公的固定資本形成から成る。
Gross Fixed Capital Formation consists of Private Residential Investment, Private Non-Resi. Investment and Public Investment.
※4 : 財貨・サービスの純輸出=財貨・サービスの輸出-財貨・サービスの輸入
Net Exports of Goods & Services = Exports of Goods & Services - Imports of Goods & Services
(参考2) (cf)
-0.2 -0.2 *** *** GDP Deflator
0.5 0.5 *** ***国 内 需 要 デ フ レ ー タ ー Domestic Demand Deflator
財 貨 ・ サ ー ビ ス の 輸 出 Exports of Goods & Services
( 控 除 ) 財 貨 ・ サ ー ビ スの 輸入 (Less) Imports of Goods & Services
雇 用 者 報 酬 Compensation of Employees
国 民 総 所 得 ( G N I ) Gross National Income
最 終 需 要Final Sales ofDomestic Product
G D P デ フ レ ー タ ー
Government Consumption
Change in Public Inventories
( 再 掲 ) 総 固 定 資 本 形 成 ※ 3(Regrouped) Gross Fixed Capital
Formation ※3
財 貨 ・ サ ー ビ ス の 純 輸 出 ※ 4Net Exports of Goods & Services
※4
公 的 在 庫 変 動
Private Non-Resi. Investment
民 間 在 庫 変 動 Change in Private Inventories
公 的 需 要 Public Demand
年
項 目
前 年 比 ※1 寄 与 度 (対GDP) ※2
2018年度(Fiscal Year)
民 間 最 終 消 費 支 出 Private Consumption
Public Investment
国 内 総 生 産 ( G D P ) Gross Domestic Product
国 内 需 要 Domestic Demand
民 間 需 要 Private Demand
政 府 最 終 消 費 支 出
公 的 固 定 資 本 形 成
家 計 最 終 消 費 支 出 Consumption of Households
民 間 住 宅 Private Residential Investment
民 間 企 業 設 備
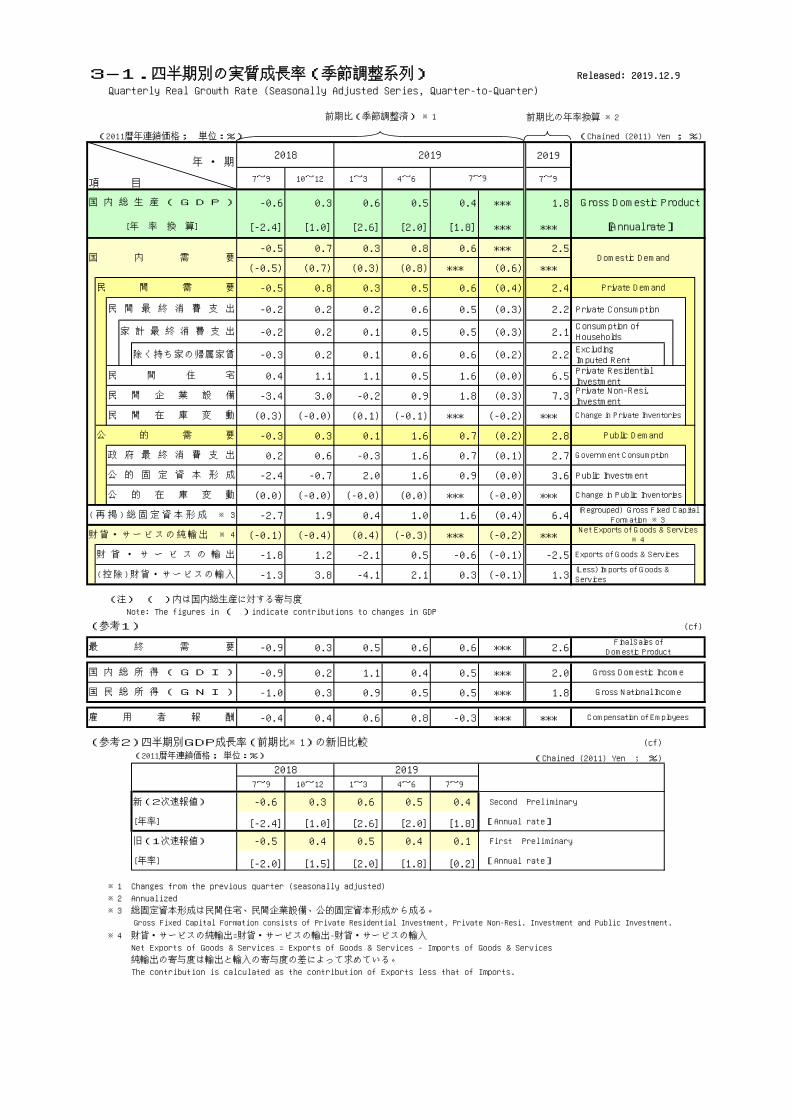
3-1.四半期別の実質成長率(季節調整系列)Quarterly Real Growth Rate (Seasonally Adjusted Series, Quarter-to-Quarter)
前期比の年率換算 ※2
(2011暦年連鎖価格; 単位:%) (Chained (2011) Yen ; %)
年 ・ 期2019
項 目 7~9 10~12 1~3 4~6 7~9
-0.6 0.3 0.6 0.5 0.4 *** 1.8
[-2.4] [1.0] [2.6] [2.0] [1.8] *** ***
-0.5 0.7 0.3 0.8 0.6 *** 2.5
(-0.5) (0.7) (0.3) (0.8) *** (0.6) ***
-0.5 0.8 0.3 0.5 0.6 (0.4) 2.4
-0.2 0.2 0.2 0.6 0.5 (0.3) 2.2 Private Consumption
-0.2 0.2 0.1 0.5 0.5 (0.3) 2.1
除く持ち家の帰属家賃 -0.3 0.2 0.1 0.6 0.6 (0.2) 2.2 Excluding Imputed Rent
0.4 1.1 1.1 0.5 1.6 (0.0) 6.5 Private Residential Investment
-3.4 3.0 -0.2 0.9 1.8 (0.3) 7.3 Private Non-Resi. Investment
(0.3) (-0.0) (0.1) (-0.1) *** (-0.2) ***
-0.3 0.3 0.1 1.6 0.7 (0.2) 2.8
0.2 0.6 -0.3 1.6 0.7 (0.1) 2.7
-2.4 -0.7 2.0 1.6 0.9 (0.0) 3.6 Public Investment
(0.0) (-0.0) (-0.0) (0.0) *** (-0.0) ***
-2.7 1.9 0.4 1.0 1.6 (0.4) 6.4
(-0.1) (-0.4) (0.4) (-0.3) *** (-0.2) ***
-1.8 1.2 -2.1 0.5 -0.6 (-0.1) -2.5
-1.3 3.8 -4.1 2.1 0.3 (-0.1) 1.3
(注) ( )内は国内総生産に対する寄与度
Note: The figures in ( )indicate contributions to changes in GDP
(参考1) (cf)
-0.9 0.3 0.5 0.6 0.6 *** 2.6
-0.9 0.2 1.1 0.4 0.5 *** 2.0
-1.0 0.3 0.9 0.5 0.5 *** 1.8
-0.4 0.4 0.6 0.8 -0.3 *** ***
(参考2)四半期別GDP成長率(前期比※1)の新旧比較 (cf)
(2011暦年連鎖価格; 単位:%) (Chained (2011) Yen ; %)
7~9 10~12 1~3 4~6 7~9
新(2次速報値) -0.6 0.3 0.6 0.5 0.4 Second Preliminary
[年率] [-2.4] [1.0] [2.6] [2.0] [1.8] [Annual rate]
旧(1次速報値) -0.5 0.4 0.5 0.4 0.1 First Preliminary
[年率] [-2.0] [1.5] [2.0] [1.8] [0.2] [Annual rate]
※1 Changes from the previous quarter (seasonally adjusted)
※2 Annualized
※3 総固定資本形成は民間住宅、民間企業設備、公的固定資本形成から成る。
Gross Fixed Capital Formation consists of Private Residential Investment, Private Non-Resi. Investment and Public Investment.
※4 財貨・サービスの純輸出=財貨・サービスの輸出-財貨・サービスの輸入
Net Exports of Goods & Services = Exports of Goods & Services - Imports of Goods & Services
純輸出の寄与度は輸出と輸入の寄与度の差によって求めている。
The contribution is calculated as the contribution of Exports less that of Imports.
(Less) Imports of Goods & Services
Domestic Demand
民 間 最 終 消 費 支 出
2018 2019
公 的 需 要
政 府 最 終 消 費 支 出
Compensation of Employees
Gross Domestic Income
Gross National Income
Net Exports of Goods & Services※4
Exports of Goods & Services
Final Sales ofDomestic Product
公 的 固 定 資 本 形 成
Released: 2019.12.9
前期比(季節調整済) ※1
Change in Public Inventories
(Regrouped) Gross Fixed CapitalFormation ※3
Gross Domestic Product
Change in Private Inventories
Consumption of Households
Private Demand
2018 2019
7~9
Government Consumption
Public Demand
[Annual rate]
国 内 総 生 産 ( G D P )
民 間 企 業 設 備
民 間 在 庫 変 動
民 間 住 宅
家 計 最 終 消 費 支 出
民 間 需 要
[年 率 換 算]
国 内 需 要
雇 用 者 報 酬
財貨・サービスの純輸出 ※4
(控除)財貨・サービスの輸入
財 貨 ・ サ ー ビ ス の 輸 出
公 的 在 庫 変 動
( 再 掲 ) 総 固 定 資 本 形成 ※ 3
最 終 需 要
国 民 総 所 得 ( G N I )
国 内 総 所 得 ( G D I )
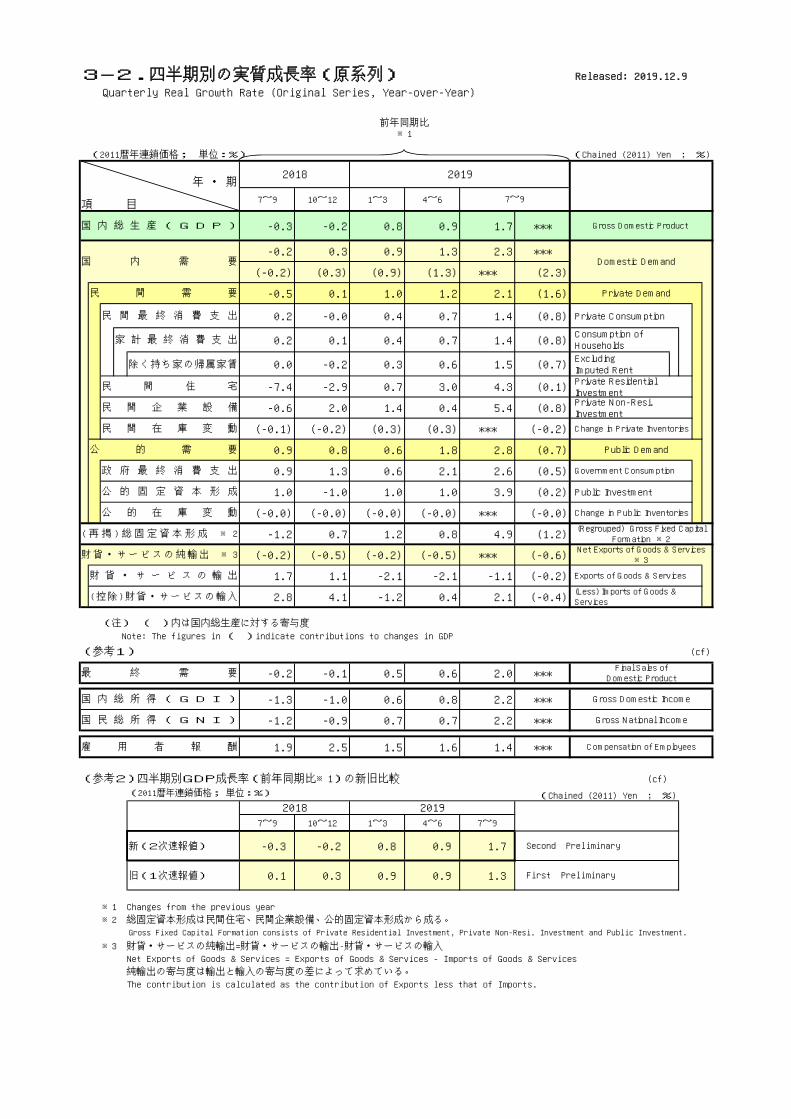
3-2.四半期別の実質成長率(原系列)Quarterly Real Growth Rate (Original Series, Year-over-Year)
(2011暦年連鎖価格; 単位:%) (Chained (2011) Yen ; %)
年 ・ 期
項 目 7~9 10~12 1~3 4~6
-0.3 -0.2 0.8 0.9 1.7 ***
-0.2 0.3 0.9 1.3 2.3 ***
(-0.2) (0.3) (0.9) (1.3) *** (2.3)
-0.5 0.1 1.0 1.2 2.1 (1.6)
0.2 -0.0 0.4 0.7 1.4 (0.8) Private Consumption
0.2 0.1 0.4 0.7 1.4 (0.8)
除く持ち家の帰属家賃 0.0 -0.2 0.3 0.6 1.5 (0.7) Excluding Imputed Rent
-7.4 -2.9 0.7 3.0 4.3 (0.1) Private Residential Investment
-0.6 2.0 1.4 0.4 5.4 (0.8) Private Non-Resi. Investment
(-0.1) (-0.2) (0.3) (0.3) *** (-0.2)
0.9 0.8 0.6 1.8 2.8 (0.7)
0.9 1.3 0.6 2.1 2.6 (0.5)
1.0 -1.0 1.0 1.0 3.9 (0.2) Public Investment
(-0.0) (-0.0) (-0.0) (-0.0) *** (-0.0)
-1.2 0.7 1.2 0.8 4.9 (1.2)
(-0.2) (-0.5) (-0.2) (-0.5) *** (-0.6)
1.7 1.1 -2.1 -2.1 -1.1 (-0.2)
2.8 4.1 -1.2 0.4 2.1 (-0.4)
(注) ( )内は国内総生産に対する寄与度
Note: The figures in ( )indicate contributions to changes in GDP
(参考1) (cf)
-0.2 -0.1 0.5 0.6 2.0 ***
-1.3 -1.0 0.6 0.8 2.2 ***
-1.2 -0.9 0.7 0.7 2.2 ***
1.9 2.5 1.5 1.6 1.4 ***
(参考2)四半期別GDP成長率(前年同期比※1)の新旧比較 (cf)
(2011暦年連鎖価格; 単位:%) (Chained (2011) Yen ; %)
7~9 10~12 1~3 4~6 7~9
新(2次速報値) -0.3 -0.2 0.8 0.9 1.7
旧(1次速報値) 0.1 0.3 0.9 0.9 1.3
※1 Changes from the previous year
※2 総固定資本形成は民間住宅、民間企業設備、公的固定資本形成から成る。
Gross Fixed Capital Formation consists of Private Residential Investment, Private Non-Resi. Investment and Public Investment.
※3 財貨・サービスの純輸出=財貨・サービスの輸出-財貨・サービスの輸入
Net Exports of Goods & Services = Exports of Goods & Services - Imports of Goods & Services
純輸出の寄与度は輸出と輸入の寄与度の差によって求めている。
The contribution is calculated as the contribution of Exports less that of Imports.
2018 2019
民 間 住 宅
Released: 2019.12.9
前年同期比※1
民 間 需 要 Private Demand
民 間 最 終 消 費 支 出
国 内 総 生 産 ( G D P ) Gross Domestic Product
国 内 需 要 Domestic Demand
家 計 最 終 消 費 支 出 Consumption of Households
2018 2019
7~9
Public Demand
Government Consumption
民 間 企 業 設 備
民 間 在 庫 変 動
公 的 需 要
政 府 最 終 消 費 支 出
Change in Private Inventories
国 民 総 所 得 ( G N I )
Second Preliminary
First Preliminary
Change in Public Inventories
Exports of Goods & Services
Gross National Income
(Regrouped) Gross Fixed CapitalFormation ※2
Gross Domestic Income
公 的 在 庫 変 動
雇 用 者 報 酬 Compensation of Employees
(控除)財貨・サービスの輸入 (Less) Imports of Goods & Services
国 内 総 所 得 ( G D I )
最 終 需 要Final Sales ofDomestic Product
公 的 固 定 資 本 形 成
( 再 掲 ) 総 固 定 資本形成 ※ 2
財貨・サービスの純輸出 ※3Net Exports of Goods & Services
※3
財 貨 ・ サ ー ビ ス の 輸 出
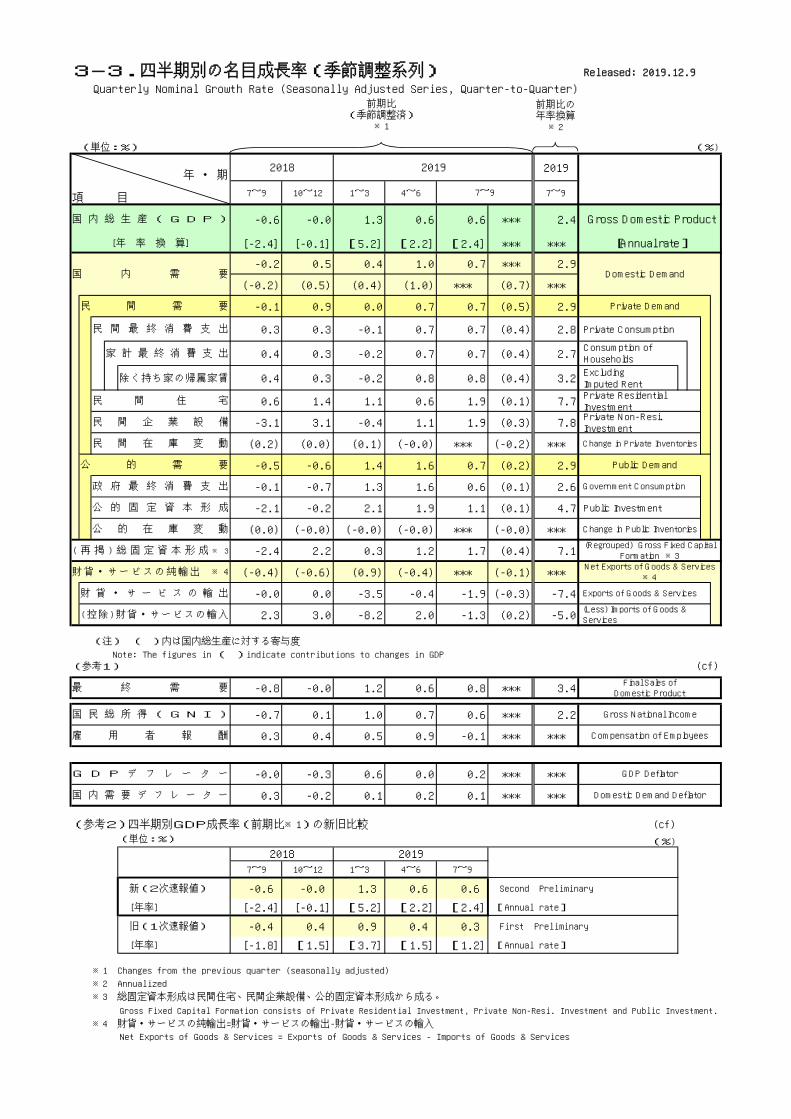
3-3.四半期別の名目成長率(季節調整系列)Quarterly Nominal Growth Rate (Seasonally Adjusted Series, Quarter-to-Quarter)
前期比の年率換算※2
(単位:%) (%)
年 ・ 期2019
項 目 7~9 10~12 1~3 4~6 7~9
-0.6 -0.0 1.3 0.6 0.6 *** 2.4
[-2.4] [-0.1] [5.2] [2.2] [2.4] *** ***
-0.2 0.5 0.4 1.0 0.7 *** 2.9
(-0.2) (0.5) (0.4) (1.0) *** (0.7) ***
-0.1 0.9 0.0 0.7 0.7 (0.5) 2.9
0.3 0.3 -0.1 0.7 0.7 (0.4) 2.8 Private Consumption
0.4 0.3 -0.2 0.7 0.7 (0.4) 2.7
除く持ち家の帰属家賃 0.4 0.3 -0.2 0.8 0.8 (0.4) 3.2 Excluding Imputed Rent
0.6 1.4 1.1 0.6 1.9 (0.1) 7.7 Private Residential Investment
-3.1 3.1 -0.4 1.1 1.9 (0.3) 7.8 Private Non-Resi. Investment
(0.2) (0.0) (0.1) (-0.0) *** (-0.2) ***
-0.5 -0.6 1.4 1.6 0.7 (0.2) 2.9
-0.1 -0.7 1.3 1.6 0.6 (0.1) 2.6
-2.1 -0.2 2.1 1.9 1.1 (0.1) 4.7 Public Investment
(0.0) (-0.0) (-0.0) (-0.0) *** (-0.0) ***
-2.4 2.2 0.3 1.2 1.7 (0.4) 7.1
(-0.4) (-0.6) (0.9) (-0.4) *** (-0.1) ***
-0.0 0.0 -3.5 -0.4 -1.9 (-0.3) -7.4
2.3 3.0 -8.2 2.0 -1.3 (0.2) -5.0
(注) ( )内は国内総生産に対する寄与度
Note: The figures in ( )indicate contributions to changes in GDP(参考1) (cf)
-0.8 -0.0 1.2 0.6 0.8 *** 3.4
-0.7 0.1 1.0 0.7 0.6 *** 2.2
0.3 0.4 0.5 0.9 -0.1 *** ***
-0.0 -0.3 0.6 0.0 0.2 *** ***
0.3 -0.2 0.1 0.2 0.1 *** ***
(参考2)四半期別GDP成長率(前期比※1)の新旧比較 (cf)(単位:%) (%)
7~9 10~12 1~3 4~6 7~9
新(2次速報値) -0.6 -0.0 1.3 0.6 0.6 Second Preliminary
[年率] [-2.4] [-0.1] [5.2] [2.2] [2.4] [Annual rate]
旧(1次速報値) -0.4 0.4 0.9 0.4 0.3 First Preliminary
[年率] [-1.8] [1.5] [3.7] [1.5] [1.2] [Annual rate]
※1 Changes from the previous quarter (seasonally adjusted)
※2 Annualized
※3 総固定資本形成は民間住宅、民間企業設備、公的固定資本形成から成る。
Gross Fixed Capital Formation consists of Private Residential Investment, Private Non-Resi. Investment and Public Investment.
※4 財貨・サービスの純輸出=財貨・サービスの輸出-財貨・サービスの輸入
Net Exports of Goods & Services = Exports of Goods & Services - Imports of Goods & Services
2018 2019
7~9
2018 2019
GDP Deflator
Domestic Demand Deflator
Compensation of Employees
Gross National Income
[Annual rate]
Domestic Demand
Public Demand
(Regrouped) Gross Fixed CapitalFormation ※3
Change in Private Inventories
民 間 需 要
国 内 需 要
民 間 最 終 消 費 支 出
[年 率 換 算]
財貨・サービスの純輸出 ※4
民 間 在 庫 変 動
公 的 需 要
民 間 住 宅
公 的 固 定 資 本 形 成
G D P デ フ レ ー タ ー
国 内 需 要 デ フ レ ー タ ー
Released: 2019.12.9
前期比(季節調整済)
※1
国 内 総 生 産 ( G D P ) Gross Domestic Product
( 再 掲 ) 総 固 定 資 本 形 成 ※ 3
家 計 最 終 消 費 支 出
民 間 企 業 設 備
Private Demand
財 貨 ・ サ ー ビ ス の 輸 出
雇 用 者 報 酬
国 民 総 所 得 ( G N I )
(控除)財貨・サービスの輸入
政 府 最 終 消 費 支 出
公 的 在 庫 変 動
最 終 需 要Final Sales ofDomestic Product
Consumption of Households
Net Exports of Goods & Services※4
Government Consumption
Change in Public Inventories
(Less) Imports of Goods & Services
Exports of Goods & Services
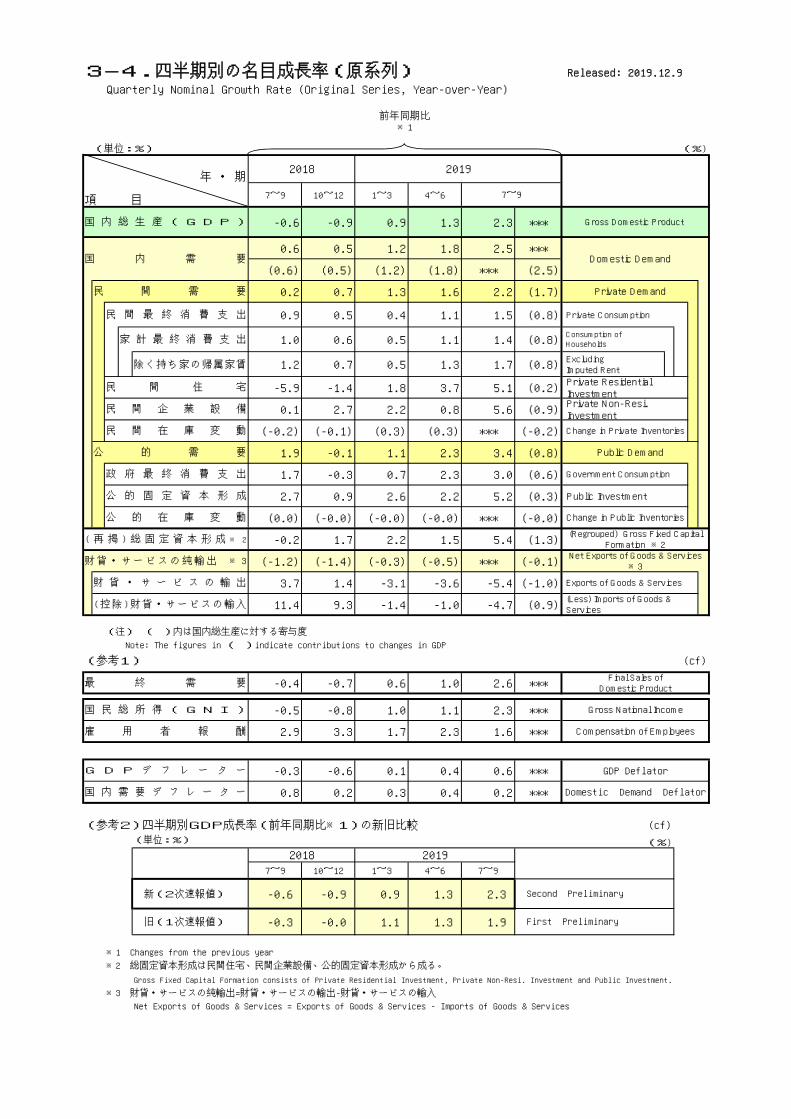
3-4.四半期別の名目成長率(原系列)Quarterly Nominal Growth Rate (Original Series, Year-over-Year)
(単位:%) (%)
年 ・ 期
項 目 7~9 10~12 1~3 4~6
-0.6 -0.9 0.9 1.3 2.3 ***
0.6 0.5 1.2 1.8 2.5 ***
(0.6) (0.5) (1.2) (1.8) *** (2.5)
0.2 0.7 1.3 1.6 2.2 (1.7)
0.9 0.5 0.4 1.1 1.5 (0.8) Private Consumption
1.0 0.6 0.5 1.1 1.4 (0.8)
除く持ち家の帰属家賃 1.2 0.7 0.5 1.3 1.7 (0.8) Excluding Imputed Rent
-5.9 -1.4 1.8 3.7 5.1 (0.2) Private Residential Investment
0.1 2.7 2.2 0.8 5.6 (0.9) Private Non-Resi. Investment
(-0.2) (-0.1) (0.3) (0.3) *** (-0.2)
1.9 -0.1 1.1 2.3 3.4 (0.8)
1.7 -0.3 0.7 2.3 3.0 (0.6)
2.7 0.9 2.6 2.2 5.2 (0.3) Public Investment
(0.0) (-0.0) (-0.0) (-0.0) *** (-0.0)
-0.2 1.7 2.2 1.5 5.4 (1.3)
(-1.2) (-1.4) (-0.3) (-0.5) *** (-0.1)
3.7 1.4 -3.1 -3.6 -5.4 (-1.0)
11.4 9.3 -1.4 -1.0 -4.7 (0.9)
(注) ( )内は国内総生産に対する寄与度
Note: The figures in ( )indicate contributions to changes in GDP
(参考1) (cf)
-0.4 -0.7 0.6 1.0 2.6 ***
-0.5 -0.8 1.0 1.1 2.3 ***
2.9 3.3 1.7 2.3 1.6 ***
-0.3 -0.6 0.1 0.4 0.6 *** GDP Deflator
0.8 0.2 0.3 0.4 0.2 ***
(参考2)四半期別GDP成長率(前年同期比※1)の新旧比較 (cf)(単位:%) (%)
7~9 10~12 1~3 4~6 7~9
新(2次速報値) -0.6 -0.9 0.9 1.3 2.3
旧(1次速報値) -0.3 -0.0 1.1 1.3 1.9
※1 Changes from the previous year
※2 総固定資本形成は民間住宅、民間企業設備、公的固定資本形成から成る。
Gross Fixed Capital Formation consists of Private Residential Investment, Private Non-Resi. Investment and Public Investment.
※3 財貨・サービスの純輸出=財貨・サービスの輸出-財貨・サービスの輸入
Net Exports of Goods & Services = Exports of Goods & Services - Imports of Goods & Services
公 的 固 定 資 本 形 成
(Less) Imports of Goods & Services
7~9
2018 2019
国 内 需 要 デ フ レ ー タ ー
雇 用 者 報 酬
公 的 需 要
(控除)財貨・サービスの輸入
財貨・サービスの純輸出 ※3
G D P デ フ レ ー タ ー
財 貨 ・ サ ー ビ ス の 輸 出
公 的 在 庫 変 動
( 再 掲 ) 総 固 定 資 本 形 成 ※ 2
政 府 最 終 消 費 支 出
国 民 総 所 得 ( G N I )
2019
Second Preliminary
First Preliminary
Government Consumption
(Regrouped) Gross Fixed CapitalFormation ※2
Domestic Demand Deflator
Final Sales ofDomestic Product
Private Demand
Change in Public Inventories
Gross National Income
Compensation of Employees
Public Demand
Net Exports of Goods & Services※3
Exports of Goods & Services
最 終 需 要
Released: 2019.12.9
前年同期比※1
民 間 在 庫 変 動
国 内 総 生 産 ( G D P ) Gross Domestic Product
Domestic Demand
民 間 需 要
民 間 最 終 消 費 支 出
家 計 最 終 消 費 支 出 Consumption of Households
国 内 需 要
民 間 住 宅
民 間 企 業 設 備
Change in Private Inventories
2018

4-1. 年次別の実質成長率Annual Real Growth Rate
(2011暦年連鎖価格; 単位:%) (Chained (2011) Yen ; %)
年
項 目 2016 2017 2017
0.9 1.9 0.3 *** 2.2 0.3 ***
0.1 1.5 0.4 *** 1.6 0.3 ***
(0.1) (1.5) *** (0.4) (1.6) *** (0.3)
-0.0 1.8 0.2 (0.2) 2.0 0.1 (0.1)
-0.0 1.1 0.1 (0.0) 1.3 -0.0 (-0.0) Private Consumption
-0.2 1.2 0.1 (0.1) 1.3 0.1 (0.0) Consumption of Households
除く持ち家の帰属家賃 -0.4 1.2 -0.1 (-0.0) 1.3 -0.2 (-0.1) Excluding Imputed Rent
6.3 -1.4 -4.9 (-0.1) 1.7 -6.7 (-0.2) Private Residential Investment
-0.4 4.3 1.7 (0.3) 4.0 2.1 (0.3) Private Non-Resi. Investment
(-0.1) (0.2) *** (0.0) (0.1) *** (-0.0)
0.6 0.5 0.8 (0.2) 0.2 0.8 (0.2)
0.7 0.3 0.9 (0.2) 0.2 0.9 (0.2)
0.6 0.5 0.6 (0.0) 0.5 0.3 (0.0) Public Investment
(-0.0) (0.0) *** (-0.0) (0.0) *** (0.0)
0.7 2.7 0.6 (0.1) 3.0 0.6 (0.1)
(0.8) (0.4) *** (-0.1) (0.6) *** (0.0)
3.6 6.5 1.6 (0.3) 6.8 3.4 (0.6)
-0.9 3.9 2.2 (-0.4) 3.4 3.4 (-0.6)
(注) ( )内は国内総生産に対する寄与度 Note: The figures in ( )indicate contributions to changes in GDP
(参考) (cf)
1.1 1.8 0.3 *** 2.0 0.3 ***
1.3 1.4 -0.3 *** 1.5 -0.4 ***
0.8 1.5 -0.2 *** 1.7 -0.3 ***
2.7 1.3 2.4 *** 1.2 2.4 ***
※1 Changes from the previous year
※2 総固定資本形成は民間住宅、民間企業設備、公的固定資本形成から成る。
Gross Fixed Capital Formation consists of Private Residential Investment, Private Non-Resi. Investment and Public Investment.
※3 財貨・サービスの純輸出=財貨・サービスの輸出-財貨・サービスの輸入
Net Exports of Goods & Services = Exports of Goods & Services - Imports of Goods & Services
純輸出の寄与度は輸出と輸入の寄与度の差によって求めている。
The contribution is calculated as the contribution of Exports less that of Imports.
Released: 2019.12.9
国 内 総 生 産 ( G D P )
民 間 企 業 設 備
Domestic Demand
公 的 固 定 資 本 形 成
民 間 在 庫 変 動
Private Demand
前年比※1
民 間 最 終 消 費 支 出
Public Demand
政 府 最 終 消 費 支 出
年 度(Fiscal Year) 暦 年(Calendar Year)
2018 2018
Gross Domestic Income
( 控除 )財貨・サービスの輸入
( 再 掲 ) 総 固 定 資 本 形 成 ※ 2
国 民 総 所 得 ( G N I )
Compensation of Employees
財 貨 ・ サ ー ビ ス の 輸 出
雇 用 者 報 酬
国 内 総 所 得 ( G D I )
(Less) Imports of Goods & Services
Gross National Income
Net Exports of Goods & Services※3
(Regrouped) Gross Fixed CapitalFormation ※2
財貨・サー ビス の純 輸出 ※ 3
Exports of Goods & Services
最 終 需 要Final Sales ofDomestic Product
公 的 在 庫 変 動 Change in Public Inventories
Gross Domestic Product
民 間 需 要
民 間 住 宅
Government Consumption
国 内 需 要
家 計 最 終 消 費 支 出
Change in Private Inventories
公 的 需 要
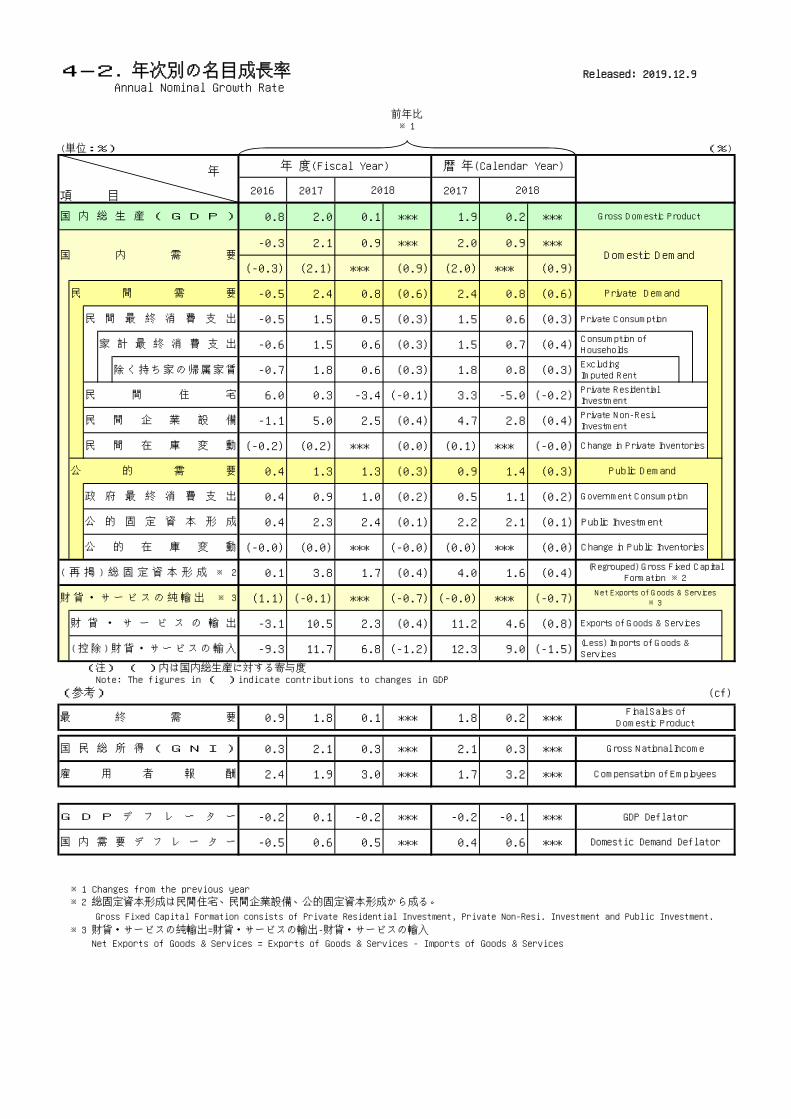
4-2. 年次別の名目成長率Annual Nominal Growth Rate
(単位:%) (%)
年
項 目 2016 2017 2017
0.8 2.0 0.1 *** 1.9 0.2 ***
-0.3 2.1 0.9 *** 2.0 0.9 ***
(-0.3) (2.1) *** (0.9) (2.0) *** (0.9)
-0.5 2.4 0.8 (0.6) 2.4 0.8 (0.6)
-0.5 1.5 0.5 (0.3) 1.5 0.6 (0.3) Private Consumption
-0.6 1.5 0.6 (0.3) 1.5 0.7 (0.4) Consumption of Households
除く持ち家の帰属家賃 -0.7 1.8 0.6 (0.3) 1.8 0.8 (0.3) Excluding Imputed Rent
6.0 0.3 -3.4 (-0.1) 3.3 -5.0 (-0.2) Private Residential Investment
-1.1 5.0 2.5 (0.4) 4.7 2.8 (0.4) Private Non-Resi. Investment
(-0.2) (0.2) *** (0.0) (0.1) *** (-0.0)
0.4 1.3 1.3 (0.3) 0.9 1.4 (0.3)
0.4 0.9 1.0 (0.2) 0.5 1.1 (0.2)
0.4 2.3 2.4 (0.1) 2.2 2.1 (0.1) Public Investment
(-0.0) (0.0) *** (-0.0) (0.0) *** (0.0)
0.1 3.8 1.7 (0.4) 4.0 1.6 (0.4)
(1.1) (-0.1) *** (-0.7) (-0.0) *** (-0.7)
-3.1 10.5 2.3 (0.4) 11.2 4.6 (0.8)
-9.3 11.7 6.8 (-1.2) 12.3 9.0 (-1.5)
(注) ( )内は国内総生産に対する寄与度 Note: The figures in ( )indicate contributions to changes in GDP
(参考) (cf)
0.9 1.8 0.1 *** 1.8 0.2 ***
0.3 2.1 0.3 *** 2.1 0.3 ***
2.4 1.9 3.0 *** 1.7 3.2 ***
-0.2 0.1 -0.2 *** -0.2 -0.1 *** GDP Deflator
-0.5 0.6 0.5 *** 0.4 0.6 ***
※1 Changes from the previous year※2 総固定資本形成は民間住宅、民間企業設備、公的固定資本形成から成る。
Gross Fixed Capital Formation consists of Private Residential Investment, Private Non-Resi. Investment and Public Investment.
※3 財貨・サービスの純輸出=財貨・サービスの輸出-財貨・サービスの輸入
Net Exports of Goods & Services = Exports of Goods & Services - Imports of Goods & Services
(Less) Imports of Goods & Services
国 民 総 所 得 ( G N I ) Gross National Income
民 間 住 宅
公 的 在 庫 変 動
( 再 掲 ) 総 固 定 資 本 形 成 ※ 2
Government Consumption
民 間 企 業 設 備
Change in Private Inventories
Change in Public Inventories
最 終 需 要Final Sales ofDomestic Product
国 内 需 要 デ フ レ ー タ ー Domestic Demand Deflator
民 間 在 庫 変 動
財貨・サービスの純輸出 ※ 3
財 貨 ・ サ ー ビ ス の 輸 出 Exports of Goods & Services
Net Exports of Goods & Services※3
Compensation of Employees
公 的 固 定 資 本 形 成
Public Demand
G D P デ フ レ ー タ ー
雇 用 者 報 酬
(控除 )財貨・サービスの輸入
(Regrouped) Gross Fixed CapitalFormation ※2
公 的 需 要
政 府 最 終 消 費 支 出
Released: 2019.12.9
前年比※1
国 内 総 生 産 ( G D P ) Gross Domestic Product
家 計 最 終 消 費 支 出
Private Demand
Domestic Demand国 内 需 要
民 間 需 要
民 間 最 終 消 費 支 出
年 度(Fiscal Year) 暦 年(Calendar Year)
2018 2018
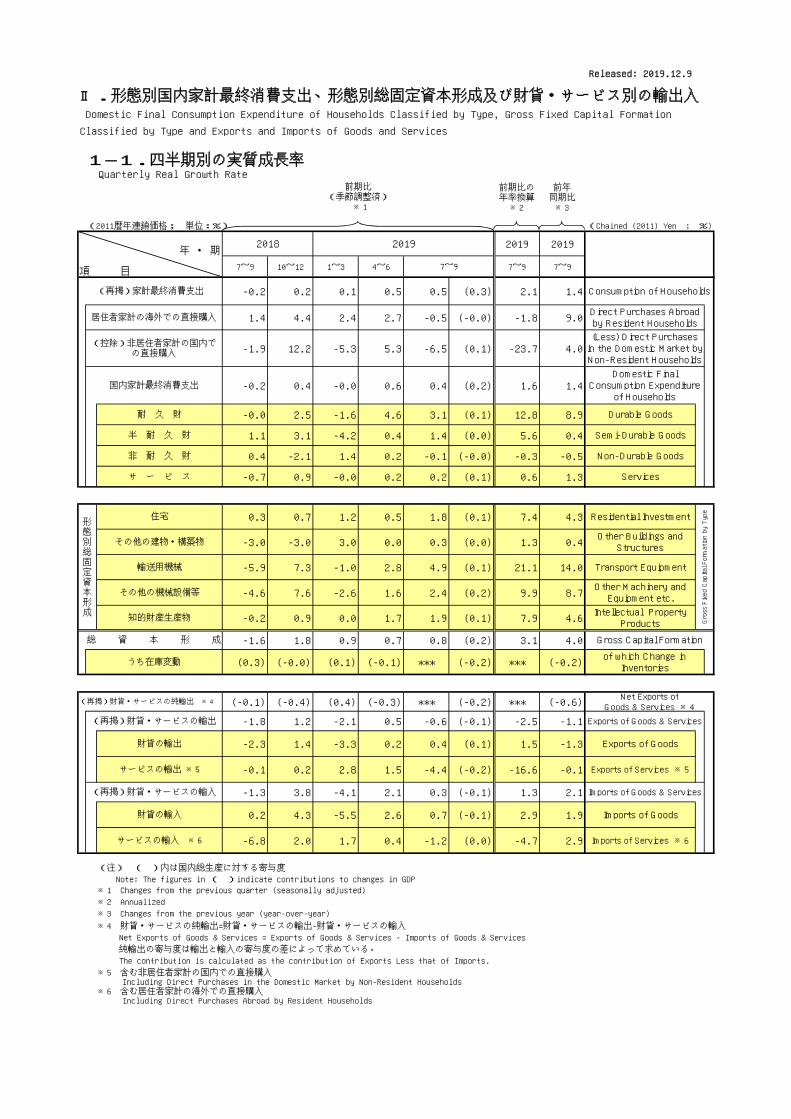
Ⅱ.形態別国内家計最終消費支出、形態別総固定資本形成及び財貨・サービス別の輸出入 Domestic Final Consumption Expenditure of Households Classified by Type, Gross Fixed Capital Formation
Classified by Type and Exports and Imports of Goods and Services
1-1.四半期別の実質成長率Quarterly Real Growth Rate
前期比の年率換算※2
前年同期比※3
(2011暦年連鎖価格; 単位:%) (Chained (2011) Yen ; %)
年 ・ 期2019 2019
項 目 7~9 10~12 1~3 4~6 7~9 7~9
-0.2 0.2 0.1 0.5 0.5 (0.3) 2.1 1.4
1.4 4.4 2.4 2.7 -0.5 (-0.0) -1.8 9.0
-1.9 12.2 -5.3 5.3 -6.5 (0.1) -23.7 4.0
-0.2 0.4 -0.0 0.6 0.4 (0.2) 1.6 1.4
-0.0 2.5 -1.6 4.6 3.1 (0.1) 12.8 8.9
1.1 3.1 -4.2 0.4 1.4 (0.0) 5.6 0.4
0.4 -2.1 1.4 0.2 -0.1 (-0.0) -0.3 -0.5
-0.7 0.9 -0.0 0.2 0.2 (0.1) 0.6 1.3
0.3 0.7 1.2 0.5 1.8 (0.1) 7.4 4.3
-3.0 -3.0 3.0 0.0 0.3 (0.0) 1.3 0.4
-5.9 7.3 -1.0 2.8 4.9 (0.1) 21.1 14.0
-4.6 7.6 -2.6 1.6 2.4 (0.2) 9.9 8.7
-0.2 0.9 0.0 1.7 1.9 (0.1) 7.9 4.6
-1.6 1.8 0.9 0.7 0.8 (0.2) 3.1 4.0
(0.3) (-0.0) (0.1) (-0.1) *** (-0.2) *** (-0.2)
(-0.1) (-0.4) (0.4) (-0.3) *** (-0.2) *** (-0.6)
-1.8 1.2 -2.1 0.5 -0.6 (-0.1) -2.5 -1.1
-2.3 1.4 -3.3 0.2 0.4 (0.1) 1.5 -1.3
-0.1 0.2 2.8 1.5 -4.4 (-0.2) -16.6 -0.1
-1.3 3.8 -4.1 2.1 0.3 (-0.1) 1.3 2.1
0.2 4.3 -5.5 2.6 0.7 (-0.1) 2.9 1.9
-6.8 2.0 1.7 0.4 -1.2 (0.0) -4.7 2.9
(注) ( )内は国内総生産に対する寄与度
Note: The figures in ( )indicate contributions to changes in GDP※1 Changes from the previous quarter (seasonally adjusted)
※2 Annualized
※3 Changes from the previous year (year-over-year)
※4 財貨・サービスの純輸出=財貨・サービスの輸出-財貨・サービスの輸入
Net Exports of Goods & Services = Exports of Goods & Services - Imports of Goods & Services
純輸出の寄与度は輸出と輸入の寄与度の差によって求めている。
The contribution is calculated as the contribution of Exports Less that of Imports.
※5 含む非居住者家計の国内での直接購入Including Direct Purchases in the Domestic Market by Non-Resident Households
※6 含む居住者家計の海外での直接購入Including Direct Purchases Abroad by Resident Households
2019
7~9
形態別総固定資本形成
うち在庫変動
住宅
その他の建物・構築物
輸送用機械
サ ー ビ ス
その他の機械設備等
知的財産生産物
サービスの輸入 ※6 Imports of Services ※6
総 資 本 形 成
財貨の輸出 Exports of Goods
サービスの輸出 ※5 Exports of Services ※5
財貨の輸入 Imports of Goods
(再掲)財貨・サービスの輸入 Imports of Goods & Services
(再掲)財貨・サービスの純輸出 ※4Net Exports of
Goods & Services ※4
(再掲)財貨・サービスの輸出 Exports of Goods & Services
of which Change inInventories
Gross Capital Formation
Services
Semi-Durable Goods
Residential Investment
Other Buildings andStructures
Gross Fixed Capital Formation by Type
Transport Equipment
Other Machinery andEquipment etc.
Intellectual PropertyProducts
Released: 2019.12.9
前期比(季節調整済)
※1
Non-Durable Goods
Consumption of Households(再掲)家計最終消費支出
居住者家計の海外での直接購入Direct Purchases Abroadby Resident Households
国内家計最終消費支出
Durable Goods
Domestic FinalConsumption Expenditure
of Households
(Less) Direct Purchasesin the Domestic Market byNon-Resident Households
耐 久 財
(控除)非居住者家計の国内での直接購入
半 耐 久 財
非 耐 久 財
2018

1-2.四半期別の名目成長率Quarterly Nominal Growth Rate
前期比の年率換算※2
前年同期比※3
(単位:%) (%)
年 ・ 期2019 2019
項 目 7~9 10~12 1~3 4~6 7~9 7~9
0.4 0.3 -0.2 0.7 0.7 (0.4) 2.7 1.4
2.7 3.5 0.8 1.5 -2.2 (-0.0) -8.5 3.4
-1.4 12.4 -5.2 5.5 -6.5 (0.1) -23.6 4.4
0.3 0.4 -0.3 0.7 0.6 (0.3) 2.3 1.5
0.3 3.5 -2.0 5.0 3.6 (0.2) 15.0 10.5
0.7 3.2 -3.8 0.6 1.5 (0.0) 6.0 1.3
2.0 -2.0 0.7 0.7 0.4 (0.1) 1.5 -0.2
-0.5 0.8 -0.2 0.2 0.2 (0.1) 0.7 1.0
0.5 1.1 1.2 0.6 2.1 (0.1) 8.7 5.1
-3.0 -2.2 3.2 0.5 0.6 (0.0) 2.5 2.2
-6.1 7.5 -1.5 3.0 4.4 (0.1) 18.9 13.4
-4.3 7.4 -2.6 1.5 2.1 (0.1) 8.7 8.1
0.2 0.8 -0.2 2.2 1.9 (0.1) 8.0 4.8
-1.4 2.1 0.7 1.0 0.8 (0.2) 3.2 4.4
(0.2) (-0.0) (0.1) (-0.0) *** (-0.2) *** (-0.2)
(-0.4) (-0.6) (0.9) (-0.4) *** (-0.1) *** (-0.1)
-0.0 0.0 -3.5 -0.4 -1.9 (-0.3) -7.4 -5.4
-0.3 0.1 -5.1 -0.9 -1.0 (-0.1) -3.9 -6.4
0.9 -0.5 2.9 1.7 -5.2 (-0.2) -19.1 -1.2
2.3 3.0 -8.2 2.0 -1.3 (0.2) -5.0 -4.7
4.3 3.5 -10.2 2.4 -1.4 (0.2) -5.4 -6.0
-4.9 1.0 0.5 0.4 -0.8 (0.0) -3.1 1.1
(注) ( )内は国内総生産に対する寄与度
Note: The figures in ( )indicate contributions to changes in GDP※1 Changes from the previous quarter (seasonally adjusted)
※2 Annualized
※3 Changes from the previous year (year-over-year)
※4 財貨・サービスの純輸出=財貨・サービスの輸出-財貨・サービスの輸入
Net Exports of Goods & Services = Exports of Goods & Services - Imports of Goods & Services
※5 含む非居住者家計の国内での直接購入
Including Direct Purchases in the Domestic Market by Non-Resident Households
※6 含む居住者家計の海外での直接購入Including Direct Purchases Abroad by Resident Households
前期比(季節調整済)
※1
居住者家計の海外での直接購入
知的財産生産物
住宅
(再掲)家計最終消費支出
国内家計最終消費支出
耐 久 財
2018 2019
7~9
(Less) Direct Purchases inthe Domestic Market byNon-Resident Households
(控除)非居住者家計の国内での直接購入
Domestic FinalConsumption Expenditure
of Households
Consumption of Households
Direct Purchases Abroadby Resident Households
Semi-Durable Goods
Durable Goods
Non-Durable Goods
Servicesサ ー ビ ス
非 耐 久 財
半 耐 久 財
(再掲)財貨・サービスの輸出 Exports of Goods & Services
Other Buildings andStructures
総 資 本 形 成
形態別総固定資本形成
Gross Fixed Capital Formation by Type
Intellectual PropertyProducts
Residential Investment
Transport Equipment輸送用機械
その他の建物・構築物
Other Machinery andEquipment etc.
その他の機械設備等
サービスの輸入 ※6 Imports of Services ※6
Released: 2019.12.9
(再掲)財貨・サービスの輸入 Imports of Goods & Services
財貨の輸入 Imports of Goods
財貨の輸出
Gross Capital Formation
Exports of Goods
サービスの輸出 ※5
うち在庫変動of which Change inInventories
Exports of Services ※5
(再掲)財貨・サービスの純輸出 ※4Net Exports of
Goods & Services ※4
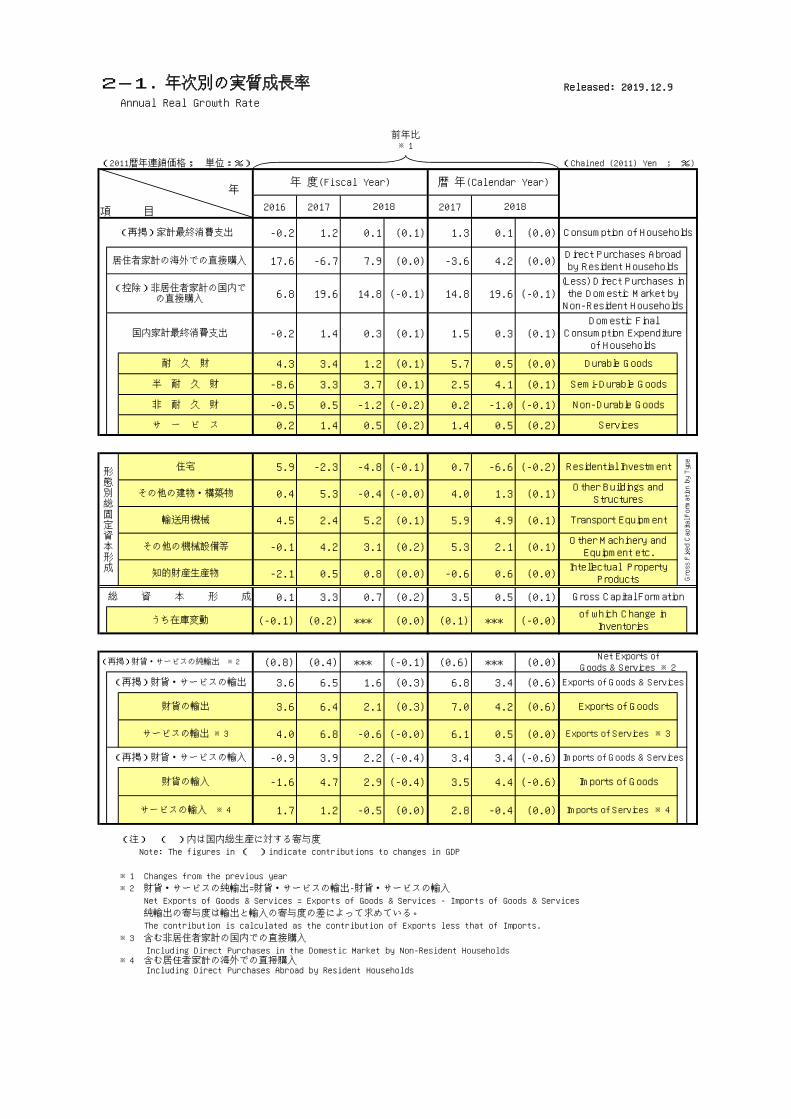
2-1. 年次別の実質成長率Annual Real Growth Rate
(2011暦年連鎖価格; 単位:%)
年
項 目 2016 2017 2017
-0.2 1.2 0.1 (0.1) 1.3 0.1 (0.0)
17.6 -6.7 7.9 (0.0) -3.6 4.2 (0.0)
6.8 19.6 14.8 (-0.1) 14.8 19.6 (-0.1)
-0.2 1.4 0.3 (0.1) 1.5 0.3 (0.1)
4.3 3.4 1.2 (0.1) 5.7 0.5 (0.0)
-8.6 3.3 3.7 (0.1) 2.5 4.1 (0.1)
-0.5 0.5 -1.2 (-0.2) 0.2 -1.0 (-0.1)
0.2 1.4 0.5 (0.2) 1.4 0.5 (0.2)
5.9 -2.3 -4.8 (-0.1) 0.7 -6.6 (-0.2)
0.4 5.3 -0.4 (-0.0) 4.0 1.3 (0.1)
4.5 2.4 5.2 (0.1) 5.9 4.9 (0.1)
-0.1 4.2 3.1 (0.2) 5.3 2.1 (0.1)
-2.1 0.5 0.8 (0.0) -0.6 0.6 (0.0)
0.1 3.3 0.7 (0.2) 3.5 0.5 (0.1)
(-0.1) (0.2) *** (0.0) (0.1) *** (-0.0)
(0.8) (0.4) *** (-0.1) (0.6) *** (0.0)
3.6 6.5 1.6 (0.3) 6.8 3.4 (0.6)
3.6 6.4 2.1 (0.3) 7.0 4.2 (0.6)
4.0 6.8 -0.6 (-0.0) 6.1 0.5 (0.0)
-0.9 3.9 2.2 (-0.4) 3.4 3.4 (-0.6)
-1.6 4.7 2.9 (-0.4) 3.5 4.4 (-0.6)
1.7 1.2 -0.5 (0.0) 2.8 -0.4 (0.0)
(注) ( )内は国内総生産に対する寄与度
Note: The figures in ( )indicate contributions to changes in GDP
※1 Changes from the previous year
※2 財貨・サービスの純輸出=財貨・サービスの輸出-財貨・サービスの輸入
Net Exports of Goods & Services = Exports of Goods & Services - Imports of Goods & Services
純輸出の寄与度は輸出と輸入の寄与度の差によって求めている。
The contribution is calculated as the contribution of Exports less that of Imports.
※3 含む非居住者家計の国内での直接購入
Including Direct Purchases in the Domestic Market by Non-Resident Households※4 含む居住者家計の海外での直接購入
Including Direct Purchases Abroad by Resident Households
Released: 2019.12.9
(Chained (2011) Yen ; %)
Non-Durable Goods
of which Change inInventories
Exports of Services ※3
前年比※1
Semi-Durable Goods
Services
年 度(Fiscal Year) 暦 年(Calendar Year)
2018 2018
Imports of Services ※4
Net Exports ofGoods & Services ※2
Imports of Goods
Gross Capital Formation
Gross Fixed Capital Formation by Type
Intellectual PropertyProducts
Exports of Goods & Services
Residential Investment
Other Buildings andStructures
Transport Equipment
Other Machinery andEquipment etc.
Imports of Goods & Services
Exports of Goods
(再掲)家計最終消費支出 Consumption of Households
居住者家計の海外での直接購入Direct Purchases Abroadby Resident Households
耐 久 財
国内家計最終消費支出
(Less) Direct Purchases inthe Domestic Market byNon-Resident Households
Durable Goods
Domestic FinalConsumption Expenditure
of Households
(控除)非居住者家計の国内での直接購入
サービスの輸入 ※4
サ ー ビ ス
財貨の輸入
その他の機械設備等
総 資 本 形 成
形態別総固定資本形成
住宅
(再掲)財貨・サービスの輸出
(再掲)財貨・サービスの輸入
(再掲)財貨・サービスの純輸出 ※2
財貨の輸出
サービスの輸出 ※3
非 耐 久 財
半 耐 久 財
うち在庫変動
輸送用機械
その他の建物・構築物
知的財産生産物
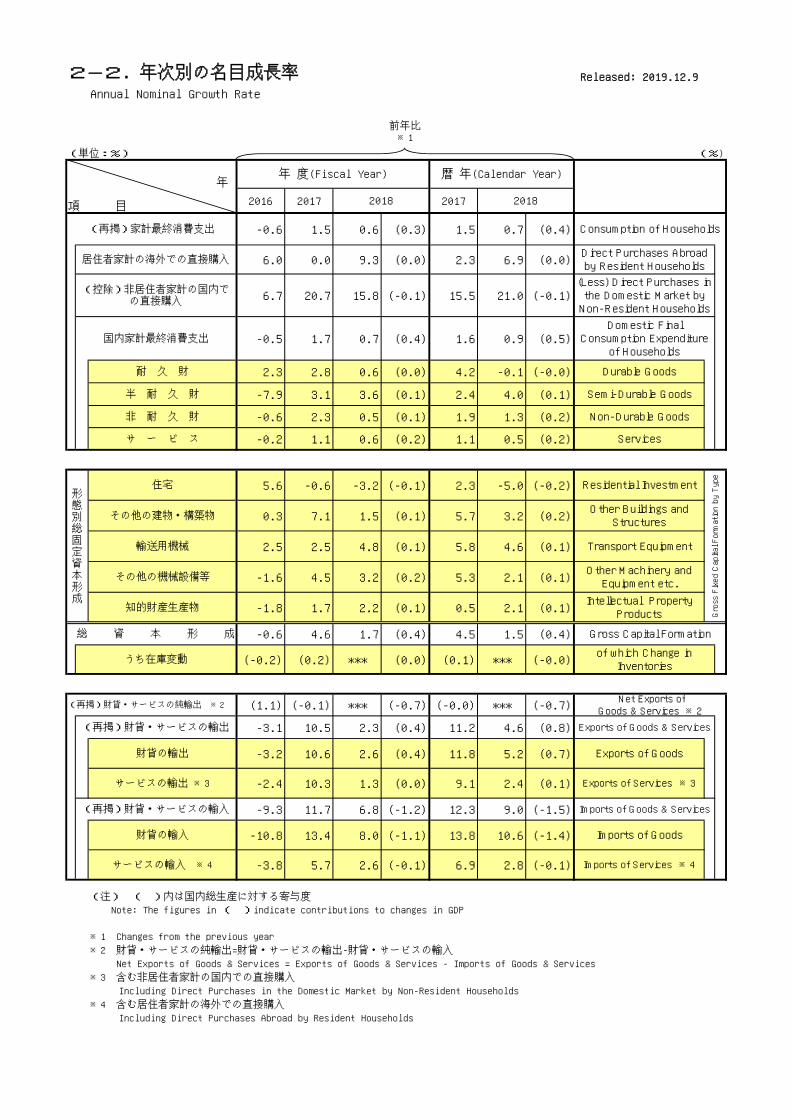
2-2. 年次別の名目成長率Annual Nominal Growth Rate
(単位:%) (%)
年
項 目 2016 2017 2017
-0.6 1.5 0.6 (0.3) 1.5 0.7 (0.4)
6.0 0.0 9.3 (0.0) 2.3 6.9 (0.0)
6.7 20.7 15.8 (-0.1) 15.5 21.0 (-0.1)
-0.5 1.7 0.7 (0.4) 1.6 0.9 (0.5)
2.3 2.8 0.6 (0.0) 4.2 -0.1 (-0.0)
-7.9 3.1 3.6 (0.1) 2.4 4.0 (0.1)
-0.6 2.3 0.5 (0.1) 1.9 1.3 (0.2)
-0.2 1.1 0.6 (0.2) 1.1 0.5 (0.2)
5.6 -0.6 -3.2 (-0.1) 2.3 -5.0 (-0.2)
0.3 7.1 1.5 (0.1) 5.7 3.2 (0.2)
2.5 2.5 4.8 (0.1) 5.8 4.6 (0.1)
-1.6 4.5 3.2 (0.2) 5.3 2.1 (0.1)
-1.8 1.7 2.2 (0.1) 0.5 2.1 (0.1)
-0.6 4.6 1.7 (0.4) 4.5 1.5 (0.4)
(-0.2) (0.2) *** (0.0) (0.1) *** (-0.0)
(1.1) (-0.1) *** (-0.7) (-0.0) *** (-0.7)
-3.1 10.5 2.3 (0.4) 11.2 4.6 (0.8)
-3.2 10.6 2.6 (0.4) 11.8 5.2 (0.7)
-2.4 10.3 1.3 (0.0) 9.1 2.4 (0.1)
-9.3 11.7 6.8 (-1.2) 12.3 9.0 (-1.5)
-10.8 13.4 8.0 (-1.1) 13.8 10.6 (-1.4)
-3.8 5.7 2.6 (-0.1) 6.9 2.8 (-0.1)
(注) ( )内は国内総生産に対する寄与度
Note: The figures in ( )indicate contributions to changes in GDP
※1 Changes from the previous year
※2 財貨・サービスの純輸出=財貨・サービスの輸出-財貨・サービスの輸入
Net Exports of Goods & Services = Exports of Goods & Services - Imports of Goods & Services
※3 含む非居住者家計の国内での直接購入
Including Direct Purchases in the Domestic Market by Non-Resident Households
※4 含む居住者家計の海外での直接購入
Including Direct Purchases Abroad by Resident Households
半 耐 久 財
(控除)非居住者家計の国内での直接購入
(Less) Direct Purchases inthe Domestic Market byNon-Resident Households
国内家計最終消費支出Domestic Final
Consumption Expenditureof Households
耐 久 財 Durable Goods
Semi-Durable Goods
非 耐 久 財
その他の機械設備等
Gross Capital Formation
Gross Fixed Capital Formation by Type
Non-Durable Goods
うち在庫変動of which Change inInventories
Servicesサ ー ビ ス
その他の建物・構築物
総 資 本 形 成
Transport Equipment
Other Buildings andStructures
Other Machinery andEquipment etc.
形態別総固定資本形成
住宅 Residential Investment
輸送用機械
Intellectual PropertyProducts
知的財産生産物
Released: 2019.12.9
(再掲)家計最終消費支出 Consumption of Households
前年比※1
居住者家計の海外での直接購入Direct Purchases Abroadby Resident Households
年 度(Fiscal Year) 暦 年(Calendar Year)
2018 2018
Imports of Services ※4
Exports of Services ※3
財貨の輸入
サービスの輸出 ※3
(再掲)財貨・サービスの輸入 Imports of Goods & Services
サービスの輸入 ※4
Imports of Goods
(再掲)財貨・サービスの純輸出 ※2 Net Exports of
Goods & Services ※2
(再掲)財貨・サービスの輸出
財貨の輸出 Exports of Goods
Exports of Goods & Services
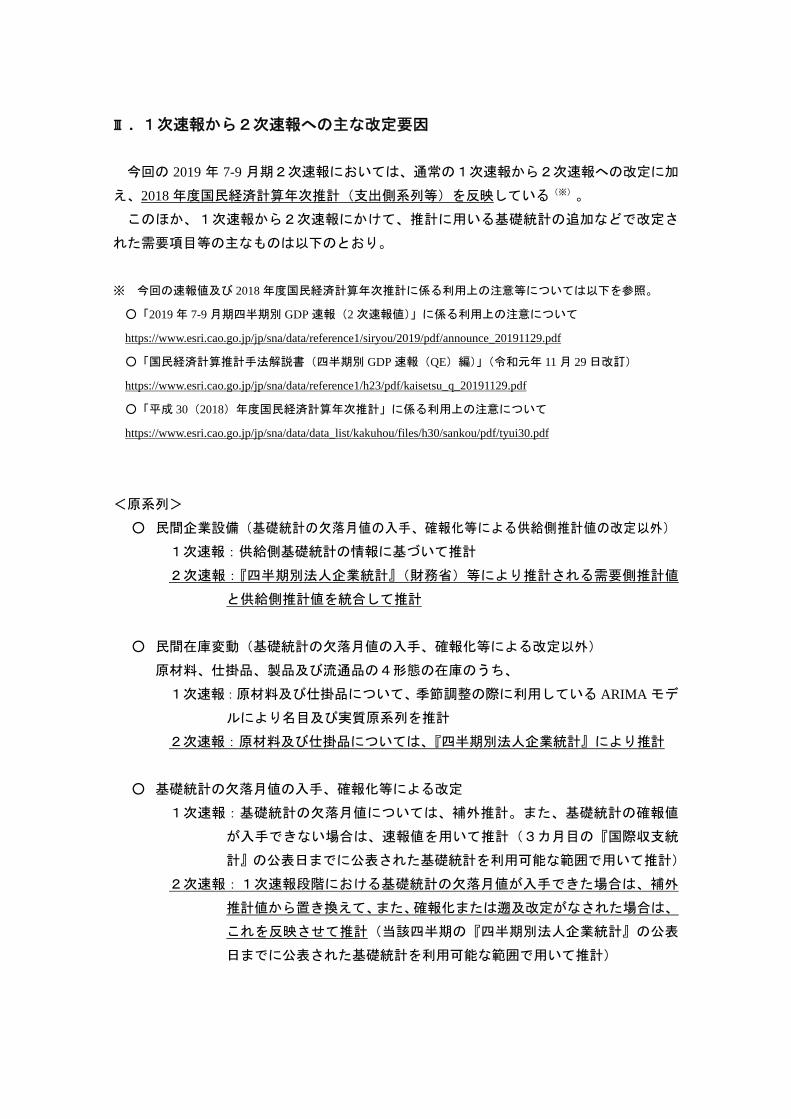
Ⅲ. 1次速報から2次速報への主な改定要因
今回の 2019年 7-9月期2次速報においては、通常の1次速報から2次速報への改定に加
え、2018年度国民経済計算年次推計(支出側系列等)を反映している(※)。
このほか、1次速報から2次速報にかけて、推計に用いる基礎統計の追加などで改定さ
れた需要項目等の主なものは以下のとおり。
※ 今回の速報値及び 2018年度国民経済計算年次推計に係る利用上の注意等については以下を参照。
○「2019年 7-9月期四半期別 GDP速報(2次速報値)」に係る利用上の注意について
https://www.esri.cao.go.jp/jp/sna/data/reference1/siryou/2019/pdf/announce_20191129.pdf
○「国民経済計算推計手法解説書(四半期別 GDP速報(QE)編)」(令和元年 11月 29日改訂)
https://www.esri.cao.go.jp/jp/sna/data/reference1/h23/pdf/kaisetsu_q_20191129.pdf
○「平成 30(2018)年度国民経済計算年次推計」に係る利用上の注意について
https://www.esri.cao.go.jp/jp/sna/data/data_list/kakuhou/files/h30/sankou/pdf/tyui30.pdf
<原系列>
○ 民間企業設備(基礎統計の欠落月値の入手、確報化等による供給側推計値の改定以外)
1次速報:供給側基礎統計の情報に基づいて推計
2次速報:『四半期別法人企業統計』(財務省)等により推計される需要側推計値
と供給側推計値を統合して推計
○ 民間在庫変動(基礎統計の欠落月値の入手、確報化等による改定以外)
原材料、仕掛品、製品及び流通品の4形態の在庫のうち、
1次速報:原材料及び仕掛品について、季節調整の際に利用している ARIMAモデ
ルにより名目及び実質原系列を推計
2次速報:原材料及び仕掛品については、『四半期別法人企業統計』により推計
○ 基礎統計の欠落月値の入手、確報化等による改定
1次速報:基礎統計の欠落月値については、補外推計。また、基礎統計の確報値
が入手できない場合は、速報値を用いて推計(3カ月目の『国際収支統
計』の公表日までに公表された基礎統計を利用可能な範囲で用いて推計)
2次速報:1次速報段階における基礎統計の欠落月値が入手できた場合は、補外
推計値から置き換えて、また、確報化または遡及改定がなされた場合は、
これを反映させて推計(当該四半期の『四半期別法人企業統計』の公表
日までに公表された基礎統計を利用可能な範囲で用いて推計)
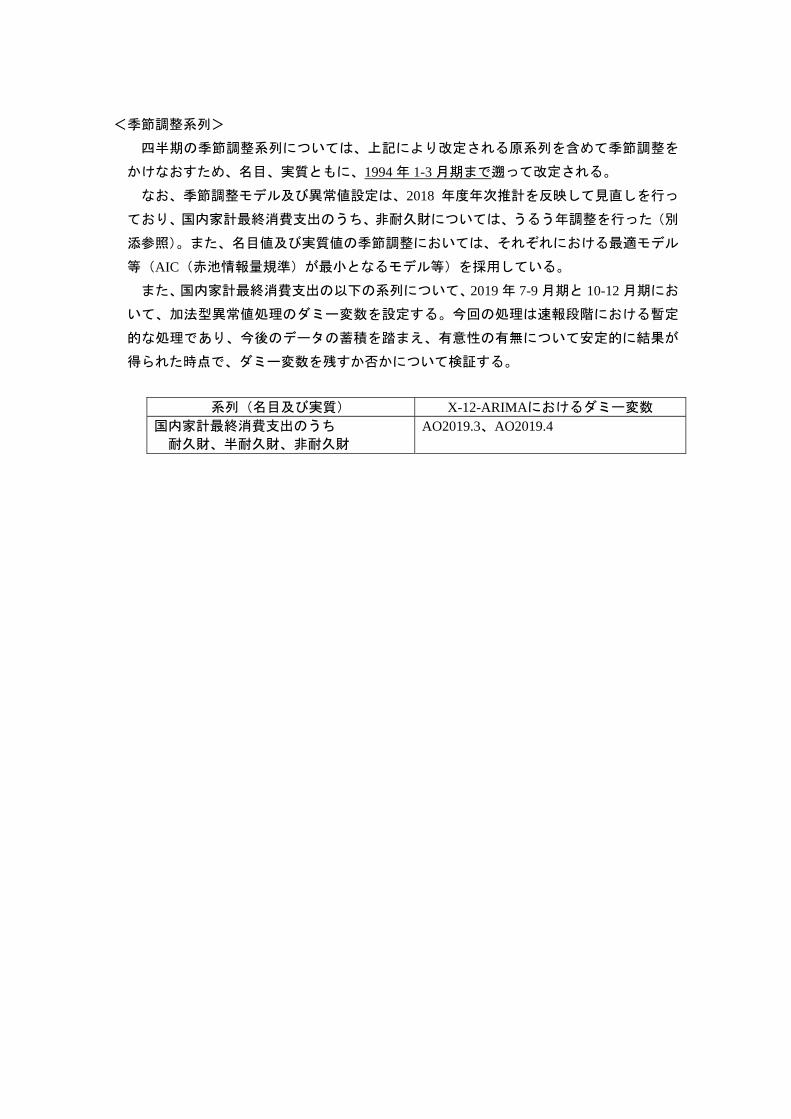
<季節調整系列>
四半期の季節調整系列については、上記により改定される原系列を含めて季節調整を
かけなおすため、名目、実質ともに、1994年 1-3月期まで遡って改定される。
なお、季節調整モデル及び異常値設定は、2018 年度年次推計を反映して見直しを行っ
ており、国内家計最終消費支出のうち、非耐久財については、うるう年調整を行った(別
添参照)。また、名目値及び実質値の季節調整においては、それぞれにおける最適モデル
等(AIC(赤池情報量規準)が最小となるモデル等)を採用している。
また、国内家計最終消費支出の以下の系列について、2019年 7-9月期と 10-12月期にお
いて、加法型異常値処理のダミー変数を設定する。今回の処理は速報段階における暫定
的な処理であり、今後のデータの蓄積を踏まえ、有意性の有無について安定的に結果が
得られた時点で、ダミー変数を残すか否かについて検証する。
系列(名目及び実質) X-12-ARIMAにおけるダミー変数国内家計最終消費支出のうち
耐久財、半耐久財、非耐久財
AO2019.3、AO2019.4
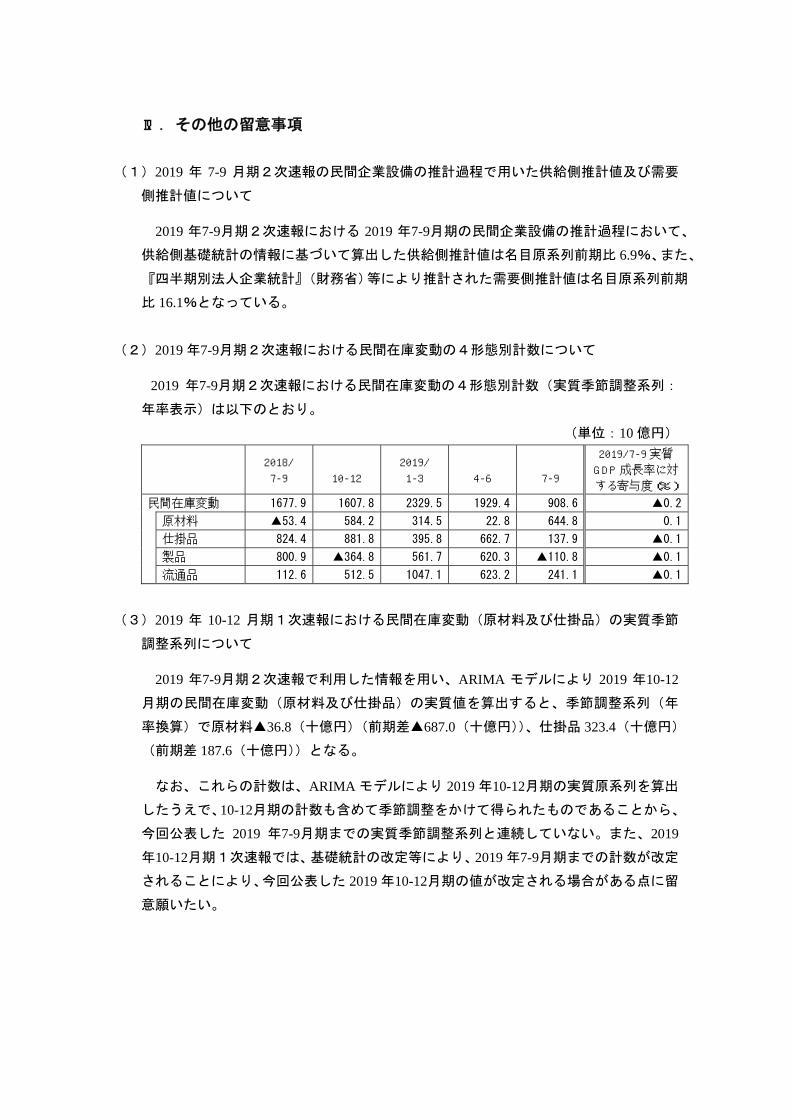
Ⅳ.その他の留意事項
(1)2019 年 7-9 月期2次速報の民間企業設備の推計過程で用いた供給側推計値及び需要
側推計値について
2019 年7-9月期2次速報における 2019 年7-9月期の民間企業設備の推計過程において、
供給側基礎統計の情報に基づいて算出した供給側推計値は名目原系列前期比 6.9%、また、
『四半期別法人企業統計』(財務省)等により推計された需要側推計値は名目原系列前期
比 16.1%となっている。
(2)2019年7-9月期2次速報における民間在庫変動の4形態別計数について
2019 年7-9月期2次速報における民間在庫変動の4形態別計数(実質季節調整系列:
年率表示)は以下のとおり。
(単位:10億円)
2018/
7-9 10-12
2019/
1-3 4-6 7-9
2019/7-9 実質
GDP成長率に対
する寄与度(%)
民間在庫変動 1677.9 1607.8 2329.5 1929.4 908.6 ▲0.2
原材料 ▲53.4 584.2 314.5 22.8 644.8 0.1
仕掛品 824.4 881.8 395.8 662.7 137.9 ▲0.1
製品 800.9 ▲364.8 561.7 620.3 ▲110.8 ▲0.1
流通品 112.6 512.5 1047.1 623.2 241.1 ▲0.1
(3)2019 年 10-12 月期1次速報における民間在庫変動(原材料及び仕掛品)の実質季節
調整系列について
2019 年7-9月期2次速報で利用した情報を用い、ARIMA モデルにより 2019 年10-12
月期の民間在庫変動(原材料及び仕掛品)の実質値を算出すると、季節調整系列(年
率換算)で原材料▲36.8(十億円)(前期差▲687.0(十億円))、仕掛品 323.4(十億円)
(前期差 187.6(十億円))となる。
なお、これらの計数は、ARIMAモデルにより 2019年10-12月期の実質原系列を算出
したうえで、10-12月期の計数も含めて季節調整をかけて得られたものであることから、
今回公表した 2019 年7-9月期までの実質季節調整系列と連続していない。また、2019
年10-12月期1次速報では、基礎統計の改定等により、2019年7-9月期までの計数が改定
されることにより、今回公表した 2019年10-12月期の値が改定される場合がある点に留
意願いたい。
Ⅴ.今後の四半期別 GDP速報の公表予定
2019年 10-12月期 1次速報値の公表予定
2020(令和 2)年 2月 17日(月)8時 50分
2019年 10-12月期 2次速報値の公表予定
2020(令和 2)年 3月 9日(月)8時 50分
2020年 1-3月期 1次速報値の公表予定
土日・祝日を除き、①「鉱工業生産・出荷・在庫指数(速報)」(2020年 3月分)
の公表日から 10日後又は②「貿易統計(輸出確報)」(2020年 3月分)の公表日
の 10日後のいずれかのうち遅い日付までに公表。(8時 50分)(具体的な日程に
ついては公表日の 10日前までにホームページ上に掲載する。)
2020年 1-3月期 2次速報値の公表予定
2020(令和 2)年 6月 8日(月)8時 50分
なお、上記の公表予定は現時点の予定であり、今後、基礎統計の公表予定の変更等によ
り、変更する可能性がある。
本件問合せ先:
内閣府 経済社会総合研究所 国民経済計算部 国民支出課東京都千代田区永田町 1-6-1
電話 03-6257-1638 (直通)
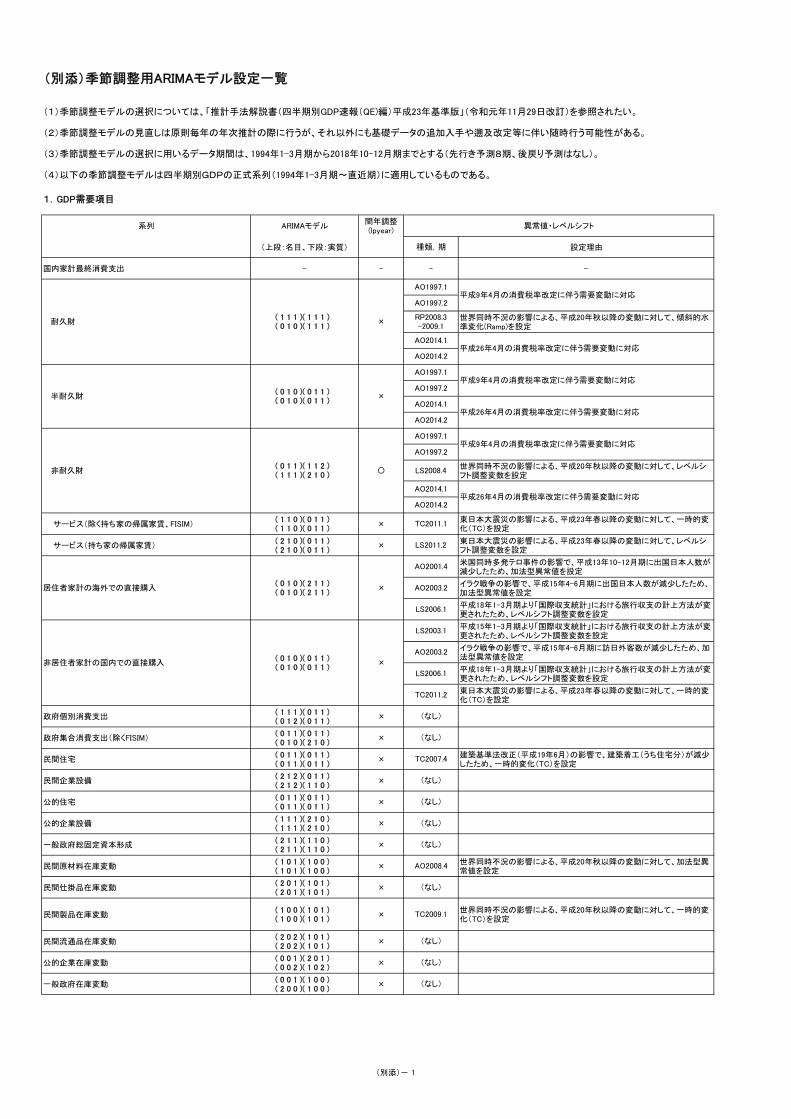
(別添)季節調整用ARIMAモデル設定一覧
1.GDP需要項目
系列 ARIMAモデル閏年調整(lpyear)
異常値・レベルシフト
(上段:名目、下段:実質) 設定理由
国内家計最終消費支出 - - -
世界同時不況の影響による、平成20年秋以降の変動に対して、傾斜的水準変化(Ramp)を設定
世界同時不況の影響による、平成20年秋以降の変動に対して、レベルシフト調整変数を設定
サービス(除く持ち家の帰属家賃、FISIM)( 1 1 0 )( 0 1 1 )( 1 1 0 )( 0 1 1 )
×東日本大震災の影響による、平成23年春以降の変動に対して、一時的変化(TC)を設定
サービス(持ち家の帰属家賃)( 2 1 0 )( 0 1 1 )( 2 1 0 )( 0 1 1 )
×東日本大震災の影響による、平成23年春以降の変動に対して、レベルシフト調整変数を設定
米国同時多発テロ事件の影響で、平成13年10-12月期に出国日本人数が減少したため、加法型異常値を設定
イラク戦争の影響で、平成15年4-6月期に出国日本人数が減少したため、加法型異常値を設定
平成18年1-3月期より「国際収支統計」における旅行収支の計上方法が変更されたため、レベルシフト調整変数を設定
平成15年1-3月期より「国際収支統計」における旅行収支の計上方法が変更されたため、レベルシフト調整変数を設定
イラク戦争の影響で、平成15年4-6月期に訪日外客数が減少したため、加法型異常値を設定
平成18年1-3月期より「国際収支統計」における旅行収支の計上方法が変更されたため、レベルシフト調整変数を設定
東日本大震災の影響による、平成23年春以降の変動に対して、一時的変化(TC)を設定
政府個別消費支出( 1 1 1 )( 0 1 1 )( 0 1 2 )( 0 1 1 )
×
政府集合消費支出(除くFISIM)( 0 1 1 )( 0 1 1 )( 0 1 0 )( 2 1 0 )
×
民間住宅( 0 1 1 )( 0 1 1 )( 0 1 1 )( 0 1 1 )
×建築基準法改正(平成19年6月)の影響で、建築着工(うち住宅分)が減少したため、一時的変化(TC)を設定
民間企業設備( 2 1 2 )( 0 1 1 )( 2 1 2 )( 1 1 0 )
×
公的住宅( 0 1 1 )( 0 1 1 )( 0 1 1 )( 0 1 1 )
×
公的企業設備( 1 1 1 )( 2 1 0 )( 1 1 1 )( 2 1 0 )
×
一般政府総固定資本形成( 2 1 1 )( 1 1 0 )( 2 1 1 )( 1 1 0 )
×
民間原材料在庫変動( 1 0 1 )( 1 0 0 )( 1 0 1 )( 1 0 0 )
×世界同時不況の影響による、平成20年秋以降の変動に対して、加法型異常値を設定
民間仕掛品在庫変動( 2 0 1 )( 1 0 1 )( 2 0 1 )( 1 0 1 )
×
民間製品在庫変動( 1 0 0 )( 1 0 1 )( 1 0 0 )( 1 0 1 )
×世界同時不況の影響による、平成20年秋以降の変動に対して、一時的変化(TC)を設定
民間流通品在庫変動( 2 0 2 )( 1 0 1 )( 2 0 2 )( 1 0 1 )
×
公的企業在庫変動( 0 0 1 )( 2 0 1 )( 0 0 2 )( 1 0 2 )
×
一般政府在庫変動( 0 0 1 )( 1 0 0 )( 2 0 0 )( 1 0 0 )
×
平成26年4月の消費税率改定に伴う需要変動に対応AO2014.2
AO2014.2平成26年4月の消費税率改定に伴う需要変動に対応
平成9年4月の消費税率改定に伴う需要変動に対応
(なし)
(なし)
AO2003.2
AO2014.1
AO2014.1
LS2006.1
TC2011.2
(なし)
(なし)
(なし)
AO1997.2
AO2003.2
AO2001.4
×
AO2014.2
LS2008.4
(1)季節調整モデルの選択については、「推計手法解説書(四半期別GDP速報(QE)編)平成23年基準版」(令和元年11月29日改訂)を参照されたい。
(2)季節調整モデルの見直しは原則毎年の年次推計の際に行うが、それ以外にも基礎データの追加入手や遡及改定等に伴い随時行う可能性がある。
(3)季節調整モデルの選択に用いるデータ期間は、1994年1-3月期から2018年10-12月期までとする(先行き予測8期、後戻り予測はなし)。
(4)以下の季節調整モデルは四半期別GDPの正式系列(1994年1-3月期~直近期)に適用しているものである。
TC2011.1
種類,期
半耐久財
AO1997.2
平成26年4月の消費税率改定に伴う需要変動に対応
( 0 1 0 )( 0 1 1 )( 0 1 0 )( 0 1 1 )
RP2008.3-2009.1
平成9年4月の消費税率改定に伴う需要変動に対応
-
AO1997.1
AO1997.1
LS2011.2
AO2014.1
耐久財
×
×
AO1997.2
( 1 1 1 )( 1 1 1 )( 0 1 0 )( 1 1 1 )
AO2008.4
(なし)
LS2006.1
(なし)
(なし)
TC2009.1
非居住者家計の国内での直接購入
AO1997.1
(なし)
( 0 1 1 )( 1 1 2 )( 1 1 1 )( 2 1 0 )
TC2007.4
(なし)
×
非耐久財
平成9年4月の消費税率改定に伴う需要変動に対応
( 0 1 0 )( 2 1 1 )( 0 1 0 )( 2 1 1 )
LS2003.1
( 0 1 0 )( 0 1 1 )( 0 1 0 )( 0 1 1 )
〇
居住者家計の海外での直接購入
(別添)- 1
東日本大震災の影響による、平成23年春以降の変動に対して、加法型異常値を設定
平成26年1月分以降の「国際収支統計」の見直しに対応
サービスの輸出 (除く非居住者家計の国内での直接購入、FISIM)
( 0 1 0 )( 0 1 1 )( 0 1 0 )( 0 1 1 )
× 平成26年1月分以降の「国際収支統計」の見直しに対応
平成26年1月分以降の「国際収支統計」の見直しに対応
世界同時不況の影響による、平成20年秋以降の変動に対して、レベルシフト調整変数を設定
平成26年1月分以降の「国際収支統計」の見直しに対応
サービスの輸入 (除く居住者家計の海外での直接購入、FISIM)
( 0 1 0 )( 0 1 1 )( 1 1 0 )( 0 1 1 )
× 平成26年1月分以降の「国際収支統計」の見直しに対応
当該項目の推計の基礎統計である「国際収支統計」において、平成7年以前については、本来なら本項目から控除されるべきである「金融派生商品」分が把握できないため、平成7年と8年の間で段差が生じている。よって、これを処理するため、レベルシフト調整変数を設定
平成26年1月分以降の「国際収支統計」の見直しに対応
当該項目の推計の基礎統計である「国際収支統計」において、平成7年以前については、本来なら本項目から控除されるべきである「金融派生商品」分が把握できないため、平成7年と8年の間で段差が生じている。よって、これを処理するため、レベルシフト調整変数を設定
平成26年1月分以降の「国際収支統計」の見直しに対応
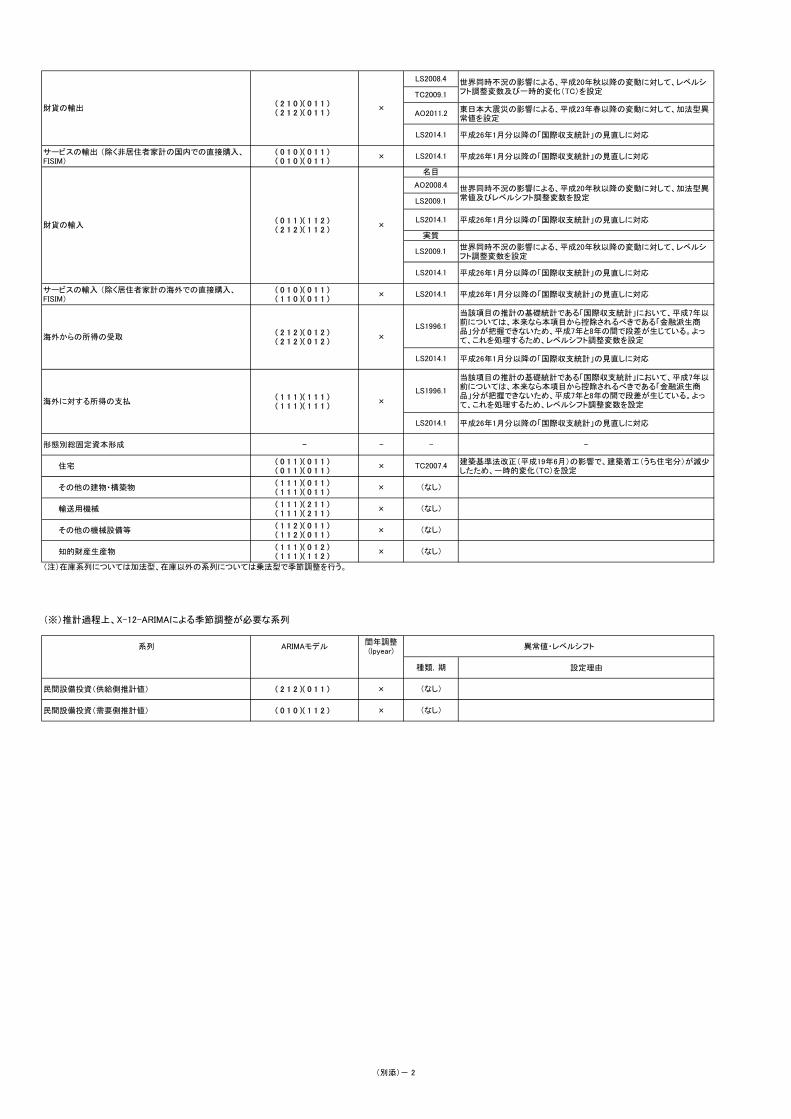
形態別総固定資本形成 - - -
住宅( 0 1 1 )( 0 1 1 )( 0 1 1 )( 0 1 1 )
×建築基準法改正(平成19年6月)の影響で、建築着工(うち住宅分)が減少したため、一時的変化(TC)を設定
その他の建物・構築物( 1 1 1 )( 0 1 1 )( 1 1 1 )( 0 1 1 )
×
輸送用機械( 1 1 1 )( 2 1 1 )( 1 1 1 )( 2 1 1 )
×
その他の機械設備等( 1 1 2 )( 0 1 1 )( 1 1 2 )( 0 1 1 )
×
知的財産生産物( 1 1 1 )( 0 1 2 )( 1 1 1 )( 1 1 2 )
×
(注)在庫系列については加法型、在庫以外の系列については乗法型で季節調整を行う。
(※)推計過程上、X-12-ARIMAによる季節調整が必要な系列
系列 ARIMAモデル閏年調整(lpyear)
異常値・レベルシフト
設定理由
民間設備投資(供給側推計値) ( 2 1 2 )( 0 1 1 ) ×
民間設備投資(需要側推計値) ( 0 1 0 )( 1 1 2 ) ×
(なし)
(なし)
(なし)
種類,期
海外からの所得の受取( 2 1 2 )( 0 1 2 )( 2 1 2 )( 0 1 2 )
×
海外に対する所得の支払( 1 1 1 )( 1 1 1 )( 1 1 1 )( 1 1 1 )
×
LS1996.1
-
LS2014.1
LS2014.1
LS1996.1
名目
TC2009.1
実質
AO2008.4
(なし)
LS2014.1
(なし)
TC2007.4
(なし)
LS2014.1
LS2014.1
LS2014.1
LS2014.1
LS2008.4
LS2009.1
財貨の輸入( 0 1 1 )( 1 1 2 )( 2 1 2 )( 1 1 2 )
AO2011.2×財貨の輸出
( 2 1 0 )( 0 1 1 )( 2 1 2 )( 0 1 1 )
世界同時不況の影響による、平成20年秋以降の変動に対して、加法型異常値及びレベルシフト調整変数を設定LS2009.1
世界同時不況の影響による、平成20年秋以降の変動に対して、レベルシフト調整変数及び一時的変化(TC)を設定
×
(別添)- 2
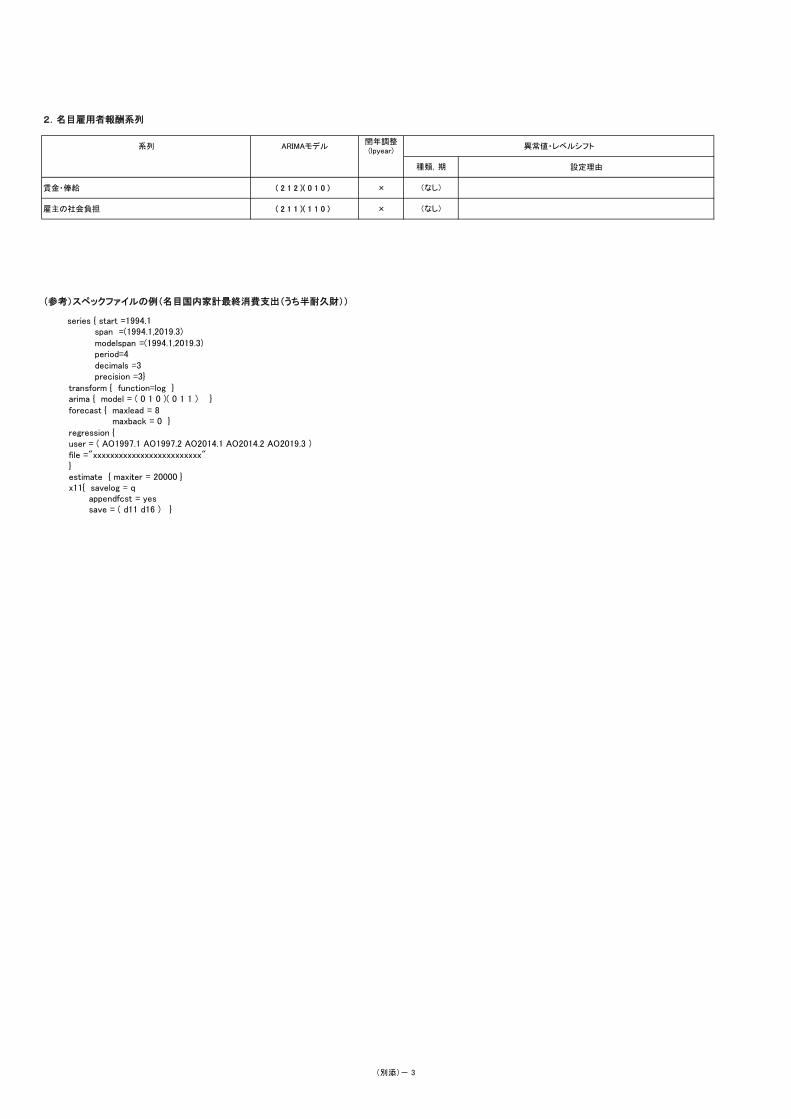
2.名目雇用者報酬系列
系列 ARIMAモデル閏年調整(lpyear)
異常値・レベルシフト
設定理由
賃金・俸給 ( 2 1 2 )( 0 1 0 ) ×
雇主の社会負担 ( 2 1 1 )( 1 1 0 ) ×
(参考)スペックファイルの例(名目国内家計最終消費支出(うち半耐久財))
(なし)
(なし)
種類,期
series { start =1994.1 span =(1994.1,2003.3) modelspan =(1994.1,2003.3) period=4 decimals =1 precision =1}
transform { function=log } arima { model = ( 0 1 0 )( 0 1 0 ) } forecast { maxlead = 8
maxback = 20 } regression { variables = ( lpyear )user = ( vat97 )file ="xxxxxxxxxxxxxxxxxxxxxxxxx"} estimate { maxtier = 20000 } x11{ savelog = q
appendfcst = yes
series { start =1994.1 span =(1994.1,2019.3) modelspan =(1994.1,2019.3) period=4 decimals =3 precision =3}
transform { function=log } arima { model = ( 0 1 0 )( 0 1 1 ) } forecast { maxlead = 8
maxback = 0 } regression { user = ( AO1997.1 AO1997.2 AO2014.1 AO2014.2 AO2019.3 )file ="xxxxxxxxxxxxxxxxxxxxxxxxx"} estimate { maxiter = 20000 } x11{ savelog = q
appendfcst = yessave = ( d11 d16 ) }
(別添)- 3