encapsulation of active compounds: particle
TRANSCRIPT
Encapsulation of Active Compounds:
Particle Characterization, Loading
Efficiency and Stability
Dissertation presented for obtaining the degree of:
Doctor of Philosophy in Chemical and Biological Engineering
by
University of Porto
by
Ivone Margarida Nunes Ferreira Vieira Peres
Supervisor:
Manuel Alvaro Neto Coelho
Co-Supervisor:
Maria do Carmo da Silva Pereira
Porto, 2011


ii
Resumo
Este trabalho de investigacao visou estudar a incorporacao/encapsulacao de
duas moleculas distintas, nomeadamente, a epigalocatequina galato (EGCG)
e o colagenio hidrolisado (CH) em partıculas compostas por maltodextrina e
goma arabica, com o objectivo de preservar as suas propriedades e aumentar
a sua estabilidade. EGCG e CH sao moleculas distintas, que apresentam
diferencas a nıvel da estrutura quımica e peso molecular, que corresponde a
458 Da e 3600 Da para a EGCG e o CH, respectivamente.
As moleculas de EGCG e CH foram incorporadas nas partıculas de mal-
todextrina e goma arabica, atraves de um processo de homogeneizacao e
secagem por atomizacao, com uma eficiencia de encapsulacao de 96% para
as partıculas contendo EGCG. No caso das partıculas contendo CH a 5%
e 25%, obteve-se uma eficiencia de encapsulacao de 87% e 85%, respectiva-
mente.
A morfologia e estrutura das partıculas contendo EGCG (EGCG/P)
foram caracterizadas por microscopia electronica de varrimento e de trans-
missao e por microscopia de forca atomica. As partıculas produzidas sao
esfericas ou enrugadas, de tamanho polidisperso, com diametros inferiores
a 20 µm, sendo estas resistentes a aplicacao de forca mecanica ate 8 MPa.
A analise do tamanho das EGCG/P em suspensao aquosa foi efectuada
aplicando um metodo de difraccao a laser e uma tecnica inovadora desig-
nada por nanoparticle tracking analysis. Os resultados obtidos confirmam
um distribuicao de tamanho polidispersa, com duas populacoes predomi-
nantes, cujos diametros hidrodinamicos medios correspondem a 40 nm e
400 nm. A aplicacao das tecnicas de picnometria de helio e porosimetria de
mercurio, permitiu concluir que as EGCG/P possuem uma estrutura interna
porosa. A estrutura dos conjugados de polissacarıdeos-EGCG e os mecan-

iii
ismos de imobilizacao da EGCG na matriz polimerica foram investigados
recorrendo a espectroscopia de infravermelho, em particular, a tecnica de
reflectancia total atenuada (RTA), bem como a ressonancia magnetica nu-
clear (RMN). Os resultados de RTA sugerem a encapsulacao da EGCG na
matriz de polissacarıdeos, preservando a sua estrutura e propriedades an-
tioxidantes. A medicao dos tempos de relaxacao nucleares e a aplicacao da
espectroscopia de RMN ordenada por difusao (DOSY), atraves do gradiente
de campo magnetico pulsado sugerem a incorporacao da EGCG na matriz de
polissacarıdeos-maltodextrina/goma arabica e evidenciam o potencial destes
sistemas polimericos na veiculacao e libertacao controlada de compostos ac-
tivos como a EGCG. As moleculas de EGCG encapsuladas mantem a sua ac-
tividade biologica, designadamente, anticancerosa, reduzindo a viabilidade
celular e induzindo a apoptose das celulas tumorais da prostata Du145.
Ensaios clonogenicos demonstraram que a encapsulacao da EGCG resulta
num maior efeito inibitorio na proliferacao das celulas (10-20%) a concen-
tracoes mais baixas (1-2 µm), comparativamente as moleculas de EGCG
nao encapsuladas. Estas observacoes destacam o uso destas partıculas de
polissacarıdeos na prevencao do cancro, na medida em que podem ser us-
adas na veiculacao de antioxidantes capazes de inibir etapas do processo de
tumorogenese.
A morfologia das partıculas contendo CH (CH/P) caracteriza-se essen-
cialmente por uma forma esferica e superfıcies lisas. A distribuicao de
tamanho das CH/P suspensas foi determinada recorrendo a difraccao a laser
e a semelhanca das EGCG/P, a distribuicao de tamanho obtida e bimodal,
com diametros hidrodinamicos medios de 30 nm e 300 nm. A presenca das
bandas caracterısticas de CH no espectro de RTA e dos sinais caracterısticos
de ressonancia no espectro de 1H RMN das CH/P confirmam a efectiva in-
corporacao do CH na matriz polimerica de maltodextrina e goma arabica.
A reducao dos coeficientes de difusao do CH incorporado nas partıculas
de maltodextrina-goma arabica, observada por RMN de difusao, e um forte
indıcio de um processo de associacao entre o CH e os polissacarıdeos, atraves
de ligacoes de hidrogenio. Ensaios de libertacao in vitro demonstram que
a difusao do CH da matriz das CH/P diminui em comparacao com o CH
livre, corroborando os resultados obtidos por RMN e RTA.
O presente estudo demonstra o potencial da matriz de carboidratos na
iv
preservacao das propriedades originais das moleculas de EGCG e CH, como
prova de conceito a ser utilizada como veıculo polimerico para transporte de
biomoleculas.


vi
Abstract
In this work, the loadind/entrapment of two distinct molecules, epigallocat-
echin gallate (EGCG) and collagen hydrolysate (CH), in maltodextrin-gum
arabic particles was investigated due to the potential of preserving their pro-
perties and increasing their stability. EGCG and CH are distinct molecules
with different chemical structure and molecular weight, 458 Da and 3600
Da, for EGCG and CH, respectively.
Maltodextrin-gum arabic particles loaded with EGCG (EGCG/P) and
CH (CH/P) were successfully produced by homogenization and spray-drying,
with an EGCG loading effciency of 96%. In the case of CH, the loading ef-
ficiency was 87% and 85% for CH/P with 5% and 25% of CH, respectively.
The morphology and structure of the EGCG loaded particles were char-
acterized by scanning and transmission electron microscopy and atomic force
microscopy. Spray-dried particles are spherical or corrugated, polydisperse
with diameters less than 20 µm and are resistant to mechanical strength,
up to 8 MPa. Dynamic light scattering and nanoparticle tracking analy-
sis of EGCG/P in aqueous suspension confirm a polydisperse size distribu-
tion, comprising two main populations, with mean average diameters of 40
nm and 400 nm. EGCG/P possess a porous internal structure as demon-
strated by helium pycnometry and mercury porosimetry. Attenuated to-
tal reflection-infrared (ATR) spectroscopy and nuclear magnetic resonance
(NMR) spectroscopy experiments, have been performed to determine the
structure of the epigallocatechin gallate-polysaccharide conjugates and to
clarify the mechanisms of drug immobilization into the polymer matrix.
ATR results indicate the entrapment of EGCG into the polysaccharide ma-
trix, preserving its chemical structure and related antioxidant properties.
Measurements of the nuclear relaxation times and application of diffusion
vii
ordered spectroscopy (DOSY), obtained through pulsed field gradient (PFG)
NMR experiments, suggest the entrapment of EGCG into the polysaccha-
ride matrix of maltodextrin/gum arabic and support the potential of these
vehicles for their sustained delivery and release. Encapsulated EGCG re-
tained its chemopreventive biological activity, reducing the cell viability and
inducing apoptosis of Du145 prostate cancer cells. Clonogenic assay demon-
strated that encapsulation of EGCG enhanced its inhibitory effect on cell
proliferation (10-20%) at lower concentrations (1-2 µM), compared with free
EGCG. These findings highlight the use of polysaccharide nanoparticles in
chemoprevention as they can be used to deliver natural antioxidants capable
of inhibiting steps of the tumorigenesis process.
CH/P morphology is mainly characterized by spherical shape with smooth
surfaces. Particle size distribution of the suspended CH/P was determined
using dynamic light scattering and similarly to EGCG/P, the size distri-
bution is bimodal with average hydrodynamic diameters of 30 nm and 300
nm. The presence of the CH characteristic bands in the ATR spectrum and
characteristic resonance signals in 1H NMR spectrum of CH/P defines the
successful entrapment of CH within the polymeric matrix of maltodextrin
and gum arabic. From the diffusion gradient NMR experiments, the reduc-
tion of the diffusion coefficients of CH incorporated in the maltodextrin-gum
arabic particles is a strong indication of an association process between CH
and polysaccharides, through hydrogen bonds. In vitro release experiments
show that the diffusion of CH from the CH/P matrix decreases in compar-
ison with free CH, corroborating the results obtained by NMR and ATR
measurements.
The present study demonstrates that the carbohydrate matrix is able to
preserve EGCG and CH original properties, as proof of concept to be used
as polymeric drug carrier.
viii
Acknowledgements
Many people contributed to this dissertation and I am grateful to all of them.
I would like to thank my supervisors Prof. Manuel Coelho e Prof. Maria
do Carmo Pereira for their scientific guidance and valuable contributions
during the course of this work.
I thank Dr. Galya Ivanova for her training and support in the nuclear
magnetic resonance experiments, but also for her helpful suggestions.
I would like to thank Prof. Simone for her help and assistance in the
MAE technology.
A special thanks to Sandra Rocha for her helpful comments, knowledge
and constructive discussions, that improved the quality of this thesis.
I would especially like to thank Joana Gomes for her support as friend
and colleague and Luıs Carlos who has been especially helpful.
Thanks to Eng. Pedro Goncalves for the technical support.
Lastly, I offer my regards to my family and friends who supported me
during the completion of this project.

CONTENTS x
Contents
1 Introduction 2
2 Background 6
2.1 Encapsulation concept . . . . . . . . . . . . . . . . . . . . . . 6
2.2 Encapsulation techniques . . . . . . . . . . . . . . . . . . . . 8
2.2.1 Coacervation . . . . . . . . . . . . . . . . . . . . . . . 8
2.2.2 Fluidized-bed coating . . . . . . . . . . . . . . . . . . 9
2.2.3 Spray-cooling/chilling . . . . . . . . . . . . . . . . . . 9
2.2.4 Freeze-drying . . . . . . . . . . . . . . . . . . . . . . . 10
2.2.5 Liposome entrapment . . . . . . . . . . . . . . . . . . 11
2.2.6 Extrusion . . . . . . . . . . . . . . . . . . . . . . . . . 11
2.2.7 Spray-drying . . . . . . . . . . . . . . . . . . . . . . . 12
2.3 Systems and Wall materials . . . . . . . . . . . . . . . . . . . 15
3 Materials and Methods 20
3.1 Materials . . . . . . . . . . . . . . . . . . . . . . . . . . . . . 20
3.2 Methods . . . . . . . . . . . . . . . . . . . . . . . . . . . . . . 21
3.2.1 Preparation of carbohydrate particles . . . . . . . . . 21
3.2.2 Characterization of carbohydrate particles . . . . . . . 21
3.2.2.1 Electron Microscopy: Scanning and Trans-
mission Electron Microscopy . . . . . . . . . 21
3.2.2.2 Atomic Force Microscopy . . . . . . . . . . . 23
3.2.2.3 Dynamic Light Scattering and Zeta Potential 24
3.2.2.4 Particle Tracking Analysis . . . . . . . . . . 26
3.2.3 Particle internal structure . . . . . . . . . . . . . . . . 27
3.2.3.1 Helium Pycnometry . . . . . . . . . . . . . . 27

xi CONTENTS
3.2.3.2 Mercury Porosimetry . . . . . . . . . . . . . 28
3.2.4 Determination of the loading efficiency . . . . . . . . . 30
3.2.4.1 Microwave-assisted extraction . . . . . . . . 30
3.2.5 Detection of active compounds . . . . . . . . . . . . . 31
3.2.5.1 Ultraviolet-Visible Spectroscopy . . . . . . . 31
3.2.5.2 Attenuated Total Reflection-Infrared Spec-
troscopy . . . . . . . . . . . . . . . . . . . . . 32
3.2.5.3 Nuclear Magnetic Resonance Spectroscopy . 33
3.2.6 Antioxidant activity . . . . . . . . . . . . . . . . . . . 38
3.2.6.1 Radical Capacity Scavenging Assay . . . . . 38
3.2.7 Release studies . . . . . . . . . . . . . . . . . . . . . . 40
3.2.7.1 Dialysis . . . . . . . . . . . . . . . . . . . . . 40
3.2.8 In vitro cell culture studies . . . . . . . . . . . . . . . 41
3.2.8.1 Cell line culture . . . . . . . . . . . . . . . . 41
3.2.8.2 Cell viability assay . . . . . . . . . . . . . . . 41
3.2.8.3 Caspase-3 activation assay . . . . . . . . . . 42
3.2.8.4 Clonogenic assay . . . . . . . . . . . . . . . . 42
3.2.8.5 Statistical analysis for in vitro studies . . . . 43
4 EGCG loaded particles 44
4.1 Introduction . . . . . . . . . . . . . . . . . . . . . . . . . . . . 44
4.2 Morphology and Structure of EGCG loaded particles . . . . . 47
4.3 Hydrodynamic Diameter and Zeta Potential of EGCG loaded
particles . . . . . . . . . . . . . . . . . . . . . . . . . . . . . . 52
4.4 Particle internal structure . . . . . . . . . . . . . . . . . . . . 55
4.5 Loading Efficiency and Antioxidant Activity . . . . . . . . . . 57
4.6 Intermolecular interactions of EGCG with particle wall ma-
terials . . . . . . . . . . . . . . . . . . . . . . . . . . . . . . . 61
4.6.1 Structure and NMR spectral characterization . . . . . 61
4.6.2 T1 Relaxation investigation . . . . . . . . . . . . . . . 65
4.6.3 Diffusion NMR spectroscopy . . . . . . . . . . . . . . 67
4.7 Release studies . . . . . . . . . . . . . . . . . . . . . . . . . . 69
4.8 Cytotoxicity Studies . . . . . . . . . . . . . . . . . . . . . . . 72
4.9 Conclusions . . . . . . . . . . . . . . . . . . . . . . . . . . . . 76

CONTENTS xii
5 Collagen hydrolysate loaded particles 78
5.1 Introduction . . . . . . . . . . . . . . . . . . . . . . . . . . . . 78
5.2 Physical characterization . . . . . . . . . . . . . . . . . . . . . 81
5.2.1 CH/P morphological characterization and loading . . 81
5.2.2 Particle size distribution and surface charge . . . . . . 84
5.3 CH/P inner structure . . . . . . . . . . . . . . . . . . . . . . 85
5.4 CH intermolecular interactions with MD/GA particles . . . . 87
5.4.1 ATR analysis . . . . . . . . . . . . . . . . . . . . . . . 87
5.4.2 NMR spectroscopy . . . . . . . . . . . . . . . . . . . . 88
5.5 In vitro release . . . . . . . . . . . . . . . . . . . . . . . . . . 90
5.6 Conclusions . . . . . . . . . . . . . . . . . . . . . . . . . . . . 91
6 Concluding Remarks 94
A Abbreviations and Symbols 98
A.1 Abbreviations . . . . . . . . . . . . . . . . . . . . . . . . . . . 98
A.2 Symbols . . . . . . . . . . . . . . . . . . . . . . . . . . . . . . 99
Bibliography 101

LIST OF FIGURES xiv
List of Figures
2.1 Schematic drawing of capsules and spheres: Capsule (a), Ir-
regular capsule (b), Capsule with two layers (walls) (c), Sphere
(d), Capsule with several cores (e), Group of capsules (f). . . 7
2.2 Typical spray-drying system with a centrifugal atomizer. . . . 14
2.3 Chemical structure of maltodextrin. . . . . . . . . . . . . . . 18
2.4 Chemical structure of gum arabic main components: D-galactose
(a), L-arabinose (b) and D-glucuronic acid (c). . . . . . . . . 19
4.1 Chemical structure of EGCG. . . . . . . . . . . . . . . . . . . 45
4.2 Morphology of spray-dried EGCG/P. The particles on the
bottom-right were intentionally crushed to show their internal
structure. Scale bars represent 100 µm (A), 50 µm (B), 40
µm (C), 20 µm (D), 10 µm (E) and 5 µm (F). . . . . . . . . . 48
4.3 Cryo-SEM micrograph of EGCG/P after re-suspension in ul-
trapure water. Scale bar represents 2 µm. . . . . . . . . . . . 49
4.4 Transmission electron microscopy images of EGCG loaded
nanoparticles. The scale bar is 200 nm. . . . . . . . . . . . . 49
4.5 AFM height images of EGCG/P. The signed area in image
(a) was zoomed (b) to evidence the spherical shape of the
particles. Scale bars represent 1 µm (a) and 200 nm (b). The
profile analysis of one particle is shown in image (c). . . . . . 50
4.6 AFM force-distance curves of EGCG/P. . . . . . . . . . . . . 51
4.7 Average hydrodynamic diameter distribution of EGCG/P and
MD/GA. Average value ± standard deviation, number of ex-
periments = 3. . . . . . . . . . . . . . . . . . . . . . . . . . . 52
4.8 Zeta Potential of EGCG/P. . . . . . . . . . . . . . . . . . . . 53
xv LIST OF FIGURES
4.9 Nanoparticle tracking analysis of EGCG/P: (a) Concentra-
tion (particles ×108/ml) vs particle diameter (nm). (b) 3D
plot of particle diameter, x (nm) vs concentration, y (particles
×108/ml) and relative scatter intensity, z (log scale). . . . . . 53
4.10 NTA of EGCG/P: (a) Concentration (1.82×10⁸ particles/ml)
vs particle diameter (nm) of the smallest particles. (b) Con-
centration (0.87×10⁸ particles/ml) vs particle diameter (nm)
of the middle range particles. (c) Concentration (1.26×10⁸
particles/ml) vs particle diameter (nm) of the biggest particles. 54
4.11 Curves for EGCG/P obtained from Hg porosimetry: pres-
sure/volume dependence (a) and pore size distribution (b). . 56
4.12 Confocal slicing of encapsulated EGCG. The scale bar is 1 µm. 58
4.13 ATR-IR spectra of EGCG/P (black line) and unloaded par-
ticles (gray line). The inset shows the spectrum of free EGCG. 58
4.14 Concentration effects of antioxidant-DPPH radical reactions
for free EGCG (gray line) and EGCG/P (black line). Average
value ± standard deviation, number of experiments = 3. . . . 59
4.15 Concentration effects of antioxidant-DPPH radical reactions
for EGCG/P (black line) and MD/GA (blue line). . . . . . . 59
4.16 400.15 MHz 1H NMR spectra of EGCG (a), MD/GA (b),
EGCG+MD/GA (c), EGCG+MD+GA (d) and EGCG/P
(e). The assignment of 1H resonances of EGCG and MD/GA
is included. . . . . . . . . . . . . . . . . . . . . . . . . . . . . 62
4.17 400.15 MHz 2D 1H/1H NOESY spectra of EGCG-MD/GA in
D2O. . . . . . . . . . . . . . . . . . . . . . . . . . . . . . . . . 65
4.18 400.15 MHz 2D DOSY spectra of EGCG-MD/GA in D2O, at
30. . . . . . . . . . . . . . . . . . . . . . . . . . . . . . . . . 69
4.19 In vitro EGCG release profile of both dialyzed samples, free
EGCG (in gray) and EGCG/P (in black), versus time in ul-
trapure water. . . . . . . . . . . . . . . . . . . . . . . . . . . . 70
4.20 Concentration effects of antioxidant-DPPH radical reactions
for EGCG and EGCG/P after dialysis (EGCG: 6.1 µM, EGCG/P
1: 5.5 µM, EGCG/P 2: 6.1 µM and EGCG/P 3: 6.1 µM). . . 70
4.21 In vitro EGCG release profile of both dialyzed samples, EGCG
(in gray) and EGCG/P (in black), versus time at pH 3. . . . 71

LIST OF FIGURES xvi
4.22 In vitro EGCG release profile of both dialyzed samples, free
EGCG (in gray) and EGCG/P (in black), versus time at pH
10. . . . . . . . . . . . . . . . . . . . . . . . . . . . . . . . . . 72
4.23 Viability of Du145 cells exposed for 64 h to free EGCG,
EGCG/P and unloaded nanoparticles, as assessed by MTT
reduction assay. *Significantly different from control (p < 0.01) 73
4.24 Activation of caspase-3 in Du145 cells exposed for 64 h to free
EGCG, EGCG/P and unloaded nanoparticles. *Significantly
different from control (p < 0.01). . . . . . . . . . . . . . . . . 73
4.25 Surviving fraction of DU145 assessed by clonogenic assay. (a)
Cells incubated with free and encapsulated EGCG, normal-
ized to initial EGCG concentration. (b) Cells incubated with
unloaded particles. . . . . . . . . . . . . . . . . . . . . . . . 74
5.1 Collagen triple helix structure. . . . . . . . . . . . . . . . . . 79
5.2 Visualization of MD/GA (a and b), and CH (5%) loaded par-
ticle size and surface morphology by scanning electron mi-
croscopy. Scale bars represent 300 µm (a), 100 µm (b), 300
µm (c), 100 µm (d) and 30 µm (e). . . . . . . . . . . . . . . . 82
5.3 Visualization of CH (25%) loaded particle size and surface
morphology by scanning electron microscopy. Scale bars rep-
resent 200 µm (a), 100 µm (b) and 50 µm (c). . . . . . . . . . 83
5.4 Average hydrodynamic diameter distribution of CH/P as de-
termined by DLS. Average value ± standard deviation, num-
ber of experiments = 3 . . . . . . . . . . . . . . . . . . . . . . 85
5.5 Pore size distribution determined by mercury porosimetry for
CH (5%) loaded particles. . . . . . . . . . . . . . . . . . . . . 86
5.6 ATR spectra of free collagen hydrolysate, collagen hydrolysate
loaded and unloaded particles. . . . . . . . . . . . . . . . . . 87
5.7 400.15 MHz 1H NMR spectra of unloaded (a), collagen hy-
drolysate (5%) loaded particles (b), collagen hydrolysate (25%)
loaded particles (c), collagen hydrolysate (d). . . . . . . . . . 88
xvii LIST OF FIGURES
5.8 In vitro release profile of free CH (in black) and collagen hy-
drolysate from CH (25%) loaded particles (in gray) versus
time in ultrapure water. Average ± standard deviation, num-
ber of experiments = 2. . . . . . . . . . . . . . . . . . . . . . 91

LIST OF TABLES xviii
List of Tables
4.1 Relative DPPH* Scavenging Capacity (RDSC) of free EGCG
and EGCG/P at different concentrations. . . . . . . . . . . . 60
4.2 Selected 1H chemical shifts (in ppm) and chemical shift dif-
ferences with respect to pure EGCG (in italics) of EGCG,
EGCG+MD/GA, EGCG+MD+GA and EGCG/P. . . . . . . 64
4.3 Selected spin-lattice relaxation times (T1, in s) determined
for selected 1H chemical shifts (in ppm) belonging to EGCG,
MD and GA in D2O at 30 . . . . . . . . . . . . . . . . . . . 66
4.4 Relative diffusion coefficients (related to TSP), with calcu-
lated standard deviations (in italics) of EGCG and MD/GA
in D2O at 30 for the samples studied. . . . . . . . . . . . . 68
5.1 Relative diffusion coefficients (related to TSP), with calcu-
lated standard deviations (in italics), of collagen hydrolysate,
MD and GA in D2O at 30 for the samples studied. . . . . 90

PREFACE xx
Preface
The research work presented in this dissertation was developed from 2007
to 2011 at the Faculty of Engineering, University of Porto, resulting in the
following publications that are published or submitted for publication:
Ferreira, I., Rocha, S., & Coelho, M. (2007). Encapsulation of antio-
xidants by spray-drying. Chemical Engineering Transactions, 11, 713-717.
Gomes, J. F. P. S., Rocha, S., Pereira, M. C., Ferreira, I., Moreno, S.,
Toca-Herrera, J., et al. (2010). Lipid/particle assemblies based on mal-
todextrin/gum arabic core as bio-carriers. Colloids and Surfaces B: Bioin-
terfaces, 76(2), 449-455.
Peres, I.; Rocha, S.; Pereira, M. d. C.; Coelho, M.; Rangel, M.; Ivanova,
G. (2010). NMR structural analysis of epigallocatechin gallate loaded polysac-
charide nanoparticles. Carbohydrate Polymers, 82, 86-866.
Rocha, S., Generalov, R., Pereira, M. C., Peres, I., Juzenas, P., & Coelho,
M. (2011). Epigallocatechin gallate-loaded polysaccharide nanoparticles for
prostate cancer chemoprevention. Nanomedicine, 6(1), 79-87.
Peres, I.; Rocha, S.; Gomes, J.; Morais, S.; Pereira, M. C.; Coelho, M.
(2011). Preservation of catechin antioxidant properties loaded in carbohy-
drate nanoparticles. Carbohydrate Polymers, 86, 147-153.
Peres, I.; Rocha, S.; Pereira, M. d. C.; Ivanova, G.; Coelho, M.; (2011).
Carbohydrate particle models as carriers of large proteins: preparation and
characterization of collagen hydrolysate loaded particles. Submitted to Acta
Biomaterialia.

Chapter 1. Introduction 2
Chapter 1
Introduction
The food & beverage and pharmaceutical industries apply encapsulation
process for a variety of reasons: encapsulation can protect the encapsulated
compound from degradation by reducing its reactivity to its outside envi-
ronment (e.g., oxygen, light and water); the material can be modified and
made easier to handle, maintaining its original physical properties; the pro-
duct can be tailor to control the release of the active compound in the desired
site of action; the flavor and/ or color of the encapsulated compound can
be masked; and it can be employed to separate components within a mix-
ture that would otherwise react with one another. During the recent years,
most major food companies around the world developed food and beverage
lines incorporating functional ingredients, also called nutraceuticals, which
provide health benefits that extend beyond basic nutrition. Often, these
functional ingredients may be unstable and sensitive to oxygen, thus pro-
ducing undesirable oxidation and reducing their shelf life. Encapsulation
can provide the necessary protection against oxidation [1], therefore, extend
the shelf life, enhance bioavailability and control the release of the bioactive
ingredients.
This thesis is focused on the encapsulation of bioactive compounds by
natural carbohydrate polymers. Carbohydrate particles were developed to
preserve the original properties of the encapsulated compounds, protecting
them from degradation, assuring their stability and consequently, allowing
their application in the industry. Epigallocatechin gallate (EGCG) and col-
lagen hydrolysate (CH) are the bioactive compounds considered, due to their
3 Chapter 1. Introduction
wide range of different biological activities.
In this work, EGCG and CH were encapsulated in a polymeric matrix
by spray-drying technology. Since spray-drying is an economical, flexible,
continuous operation, and produces particles of good quality, it is one of the
most widely used encapsulation technique in the industry.
EGCG, the most abundant catechin found in green tea, exhibits strong
antioxidant activity in diverse biochemical systems, due to its polyhydroxy-
lated structure. This polyhydroxylated structure allows catechins to act as
antioxidants either through the chelation of metals with redox properties or
by acting as scavengers of free radicals. Studies have shown that EGCG has
a variety of health effects, including antitumour, antioxidative and hypolipi-
demic activity [2]. EGCG has been demonstrated to inhibit matrix enzymes
(proteases), known to play an important role in tumor invasion and metas-
tases [3], inhibiting steps of the tumorigenesis process [4]. Preincubation of
collagenase with EGCG reduced the collagenase activity [5]. Collagenase
degrades collagen, a protein that plays an important role in the formation
of tissues and organs, and is involved in various functional expressions of
cells [6]. However, catechin stability is influenced by oxygen concentration
and most importantly by pH, increasing the rate of oxidation as the pH
value increases [7]. Upon consumption, catechins are exposed to alkaline
environment in gastro-intestinal tract, where they degrade. This instability
is one of the reasons for catechin poor bioavailability, which is less than
2-5%. Additionally, these catechins possess high systemic clearance [8]. To
overcome these drawbacks EGCG was encapsulated in maltodextrin-gum
arabic particles produced by homogenization and spray-drying, to preserve
its antioxidant properties and improve its bioavailability.
Collagen and collagen hydrolysate are currently used in diverse fields
including food, cosmetic and biomedical industries. Collagen is the major
structural element of all connective tissues, which major property is to pro-
vide tensile strength to tissues such as tendons, ligaments, skin, cartilage,
blood vessels, and bone [6]. More than 90% of the extracellular protein
in the tendon and bone, and more than 50% in the skin consist of colla-
gen. Collagen macromolecule is characterized by a triple helix configuration
of three polypeptide subunits maintained by hydrogen bonding between the
−NH group of glycine and the carbonyl group C=O of residues from another
Chapter 1. Introduction 4
polypeptide chain or by hydrogen bonding with water molecules [9]. The hy-
drolysis of collagen results in gelatin, a high molecular weight polypeptide.
Further enzymatic degradation of gelatin derives in collagen hydrolysate,
which contains peptides with a mean molecular weight of 3-6 kDa [10]. Due
to its biochemical and nutritional properties, it has been proposed that the
consumption of collagen hydrolysate might be beneficial for bone health, as
a bioavailable source of peptides [11]. Bioactive peptides isolated from CH
have shown several bioactivities such as antihypertensive and antioxidative
activities [10]. Moreover, in patients with osteoporosis, oral intake of col-
lagen hydrolysate with calcitonin had a stronger inhibitory effect on bone
resorption than calcitonin alone. CH represents a key nutrient for bone
health and thereby in the prevention of osteoporosis [12].
The most convenient route for the systemic delivery of proteins is oral,
although proteins are susceptible to hydrolysis and modification at gastric
pH and can be degraded by enzymes in the small intestine [13]. Bioavai-
lability via this route is poor for molecules of molecular mass greater than
several hundred daltons. Encapsulation and development of systems for oral
protein drug delivery represent a key to solve these limitations, because they
ensure physical protection to the encapsulated proteins against inactivation
during the gastrointestinal transit, maintain their chemical integrity and as-
sure their convenient delivery. These systems have generally been utilized
for prolonging the circulation half-lives of proteins or for delivering targeted
payloads of protein pharmaceuticals to specific tissues. Polymeric parti-
cles are promising candidates for oral delivery of proteins, such as CH, since
they can adhere to the intestinal membrane and can increase residence of in-
cluded compounds. A stable system of collagen hydrolysate-polysaccharides
was developed, applying the same procedure employed in the EGCG/P for-
mulation.
The objective of this research was to develop a system to ensure EGCG
and CH stability, allowing their application in the industry. EGCG and CH
loaded particles were produced by spray-drying technique, using as encapsu-
lating material a mixture of polysaccharides, such as, maltodextrin and gum
arabic. The results obtained demonstrate that the carbohydrate matrix is
able to preserve EGCG and CH properties, as proof of concept to be used
as polymer drug carrier.
5 Chapter 1. Introduction
This thesis is organized into six chapters. This chapter, introduction,
covers the objectives and scope of this work. Chapter 2, background, presents
an overview of the encapsulation concept, techniques and coating materials,
including the advantages and disadvantages of their application. Chapter 3,
materials and methods, describes the methodology involved in the prepara-
tion and characterization of the loaded and unloaded carbohydrate particles.
Chapter 4, catechin loaded particles, discusses the observations and results
obtained for the EGCG/P. Chapter 5, collagen hydrolysate loaded parti-
cles, analyzes the results achieved concerning the formulation and chara-
cterization of the CH/P, in comparison to EGCG/P. Chapter 6, concluding
remarks, summarizes the main findings of this thesis.
Chapter 2. Background 6
Chapter 2
Background
Contents
2.1 Encapsulation concept . . . . . . . . . . . . . . . 6
2.2 Encapsulation techniques . . . . . . . . . . . . . . 8
2.2.1 Coacervation . . . . . . . . . . . . . . . . . . . . . 8
2.2.2 Fluidized-bed coating . . . . . . . . . . . . . . . . 9
2.2.3 Spray-cooling/chilling . . . . . . . . . . . . . . . . 9
2.2.4 Freeze-drying . . . . . . . . . . . . . . . . . . . . . 10
2.2.5 Liposome entrapment . . . . . . . . . . . . . . . . 11
2.2.6 Extrusion . . . . . . . . . . . . . . . . . . . . . . . 11
2.2.7 Spray-drying . . . . . . . . . . . . . . . . . . . . . 12
2.3 Systems and Wall materials . . . . . . . . . . . . 15
2.1 Encapsulation concept
In recent years, a special attention is given to certain bioactive compounds,
due to their health benefits. The development of new functional foods and
pharmaceuticals requires technologies for incorporating health-promoting
compounds, without reducing their bioavailability or functionality. In order
to overcome the susceptibility and improve the stability of bioactive com-
pounds during processing and storage, encapsulation technology has been
applied in food, nutraceutical and pharmaceutical industries. Encapsulation
is a technique, which involves the incorporation of a chemically sensitive
7 Chapter 2. Background
compound in a matrix or sealed capsule, protecting it against adverse re-
action, preventing its degradation and increasing its shelf life [14]. Besides
protecting it from the harsh processing conditions and adverse storage envi-
ronment, the encapsulation of bioactive compounds can also achieve targeted
delivery and controlled release of entrapped substances to the specific site.
In addition, encapsulation may also be useful for taste and odour masking
purposes, since some active compounds often have very strong flavours.
There are numerous drug delivery systems, including the polymeric based
(polymeric particles) carriers, which are considered to be among the most
suitable systems for antioxidant delivery. Particles are solid colloidal struc-
tures composed of natural or synthetic polymers. Nanoparticles have a size
< 0.2 µm and microparticle’s size range from 0.2 to 5000 µm. Depending
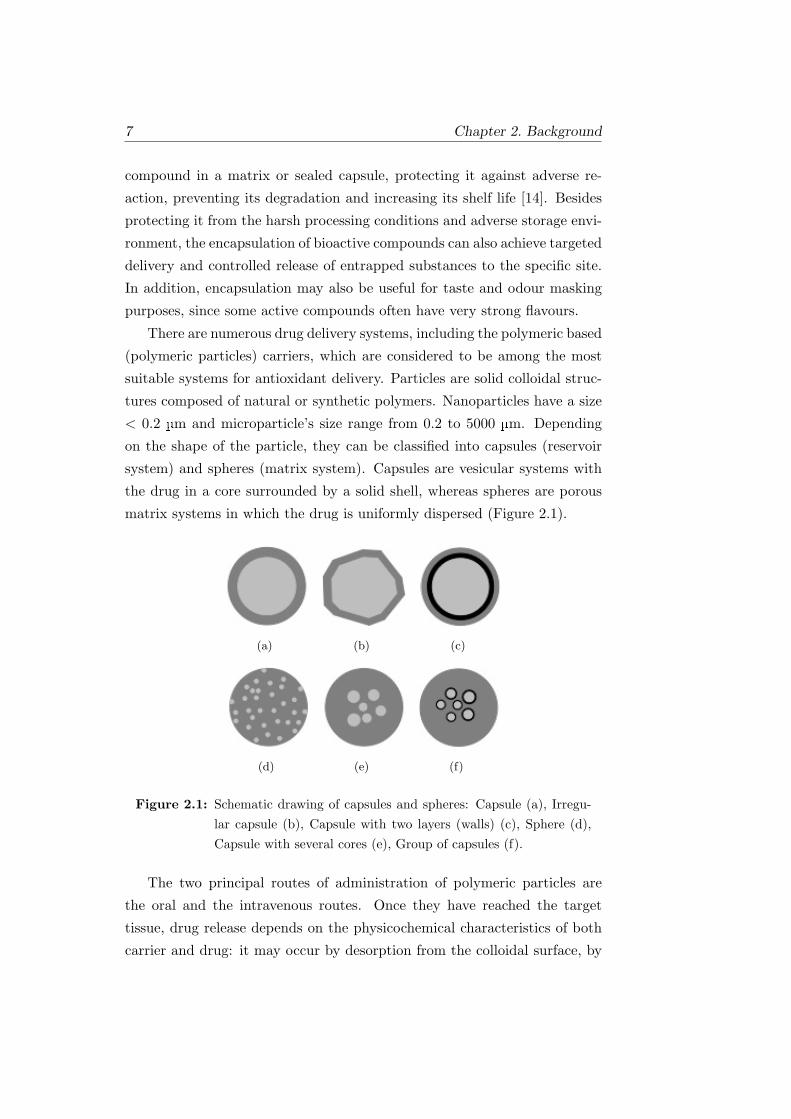
on the shape of the particle, they can be classified into capsules (reservoir
system) and spheres (matrix system). Capsules are vesicular systems with
the drug in a core surrounded by a solid shell, whereas spheres are porous
matrix systems in which the drug is uniformly dispersed (Figure 2.1).
(a) (b) (c)
(d) (e) (f)
Figure 2.1: Schematic drawing of capsules and spheres: Capsule (a), Irregu-lar capsule (b), Capsule with two layers (walls) (c), Sphere (d),Capsule with several cores (e), Group of capsules (f).
The two principal routes of administration of polymeric particles are
the oral and the intravenous routes. Once they have reached the target
tissue, drug release depends on the physicochemical characteristics of both
carrier and drug: it may occur by desorption from the colloidal surface, by
Chapter 2. Background 8
diffusion through the polymeric wall (capsules) or through the polymeric
matrix (spheres), or by particle erosion [15]. In controlled release systems,
degradation of the matrix material frequently occurs as a determining factor
for the release of the encapsulated compound at desired site, time and at
specific rate.
2.2 Encapsulation techniques
The selection of the encapsulation method depends on the physical and che-
mical properties of the compound to encapsulate and the coating material
(or matrix), and the final application. The selection of the encapsulation
method and matrix materials is interdependent [14].The current encapsula-
tion methods include coacervation [14], [16], fluidized-bed coating [14], [17],
spray-cooling/chilling [18], freeze-drying [19], [20], liposome entrapment, ex-
trusion [21] and spray-drying [22], [23], among others.
2.2.1 Coacervation
Coacervation is defined as the separation of colloidal systems into two liquid
phases. The basic mechanism involved in this method is the formation of an
emulsion and subsequent precipitation of the continuous phase around the
droplets of the discontinuous phase. It employs a three phase system, which
includes a manufacturing vehicle (solvent), the material to be encapsulated
and the coating material. Coacervation process consists of three steps: (i)
formation of the three immiscible phases while mixing under controlled con-
ditions; (ii) deposition of the coating material around the core material; (iii)
shrinkage and solidification of the liquid coating to form the solid micro-
capsules, by thermal, cross-linking or desolventization techniques [14], [16].
Natural extracts, such as Yerba mate extract, has been encapsulated by coa-
cervation in a polysaccharide based system of alginate-chitosan, to promote
its protection and controlled release, with a loading efficiency of 50% [24].
Coacervation technique is widely used in the industry, however, the coa-
cervation method possesses some drawbacks. This process is not well suited
for producing spheres in the low size range, is very expensive and rather
complex.
9 Chapter 2. Background
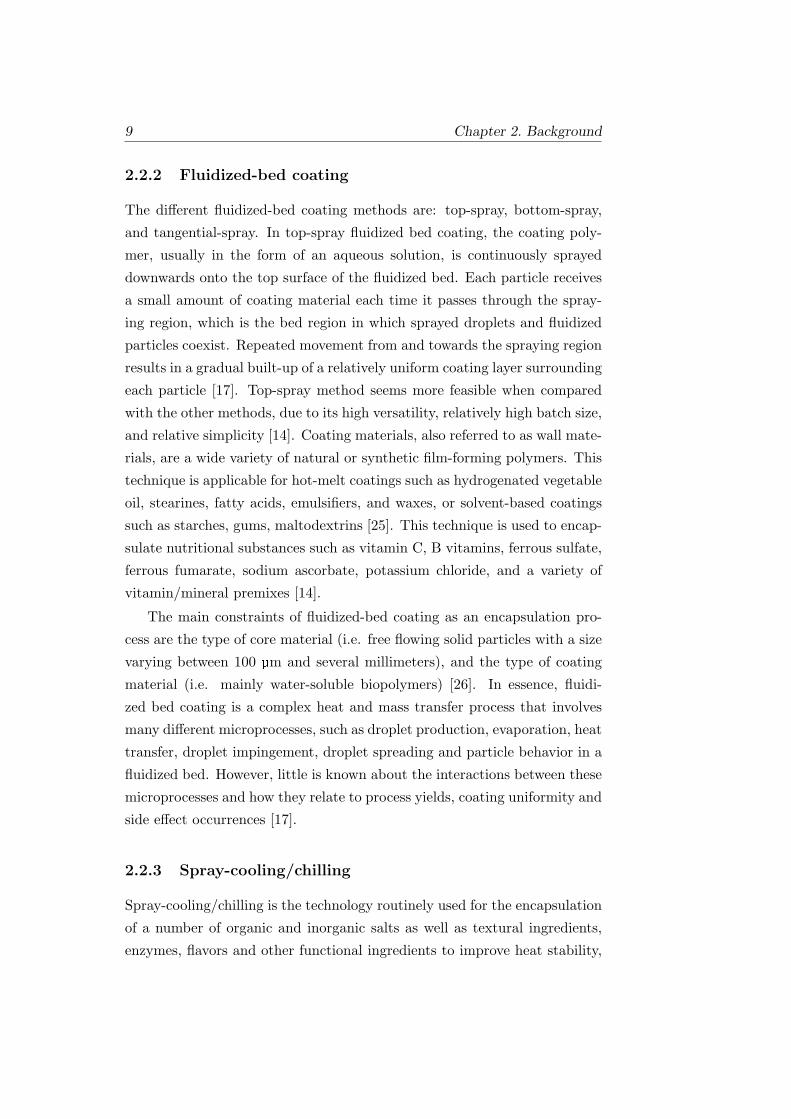
2.2.2 Fluidized-bed coating
The different fluidized-bed coating methods are: top-spray, bottom-spray,
and tangential-spray. In top-spray fluidized bed coating, the coating poly-
mer, usually in the form of an aqueous solution, is continuously sprayed
downwards onto the top surface of the fluidized bed. Each particle receives
a small amount of coating material each time it passes through the spray-
ing region, which is the bed region in which sprayed droplets and fluidized
particles coexist. Repeated movement from and towards the spraying region
results in a gradual built-up of a relatively uniform coating layer surrounding
each particle [17]. Top-spray method seems more feasible when compared
with the other methods, due to its high versatility, relatively high batch size,
and relative simplicity [14]. Coating materials, also referred to as wall mate-
rials, are a wide variety of natural or synthetic film-forming polymers. This
technique is applicable for hot-melt coatings such as hydrogenated vegetable
oil, stearines, fatty acids, emulsifiers, and waxes, or solvent-based coatings
such as starches, gums, maltodextrins [25]. This technique is used to encap-
sulate nutritional substances such as vitamin C, B vitamins, ferrous sulfate,
ferrous fumarate, sodium ascorbate, potassium chloride, and a variety of
vitamin/mineral premixes [14].
The main constraints of fluidized-bed coating as an encapsulation pro-
cess are the type of core material (i.e. free flowing solid particles with a size
varying between 100 µm and several millimeters), and the type of coating
material (i.e. mainly water-soluble biopolymers) [26]. In essence, fluidi-
zed bed coating is a complex heat and mass transfer process that involves
many different microprocesses, such as droplet production, evaporation, heat
transfer, droplet impingement, droplet spreading and particle behavior in a
fluidized bed. However, little is known about the interactions between these
microprocesses and how they relate to process yields, coating uniformity and
side effect occurrences [17].
2.2.3 Spray-cooling/chilling
Spray-cooling/chilling is the technology routinely used for the encapsulation
of a number of organic and inorganic salts as well as textural ingredients,
enzymes, flavors and other functional ingredients to improve heat stability,
Chapter 2. Background 10
delay release in wet environments, and/or convert liquid hydrophilic ingre-
dient into free flowing powders [18]. In spray-cooling and spray-chilling, the
core and wall mixtures are atomized into the cooled or chilled air, which
causes the wall to solidify around the core. In spray-chilling, the most com-
monly used coating materials are molten fractionated and hydrogenated
vegetable oils with a melting point of 32-42 , vegetable oils or other ma-
terials with a melting point of 45-12 are often used in spray-cooling.
However, a wide range of other encapsulating materials may be employed.
In spray-chilling, there is no mass transfer (i.e., evaporation from the at-
omized droplets); therefore these solidify into almost perfect spheres to give
free-flowing powders [14].
Microcapsules prepared by spray-cooling and spray-chilling are insoluble
in water due to the lipid coating. Consequently, these techniques tend to
be utilized for encapsulating water-soluble core materials such as minerals,
water-soluble vitamins, enzymes, acidulants, and some flavors. Another
disadvantage of spray-cooling and spray-chilling is that special handling and
storage conditions can be required.
2.2.4 Freeze-drying
Freeze-drying, also known as lyophilization, is a process used for the dehy-
dration of almost all heat-sensitive substances that are unstable in aqueous
solutions. Freeze-drying works by freezing the material and then reducing
the surrounding pressure and adding enough heat, to allow the frozen water
in the material to sublimate directly from the solid phase to the gas phase
[21]. Recently, Laine et al. (2008) encapsulated phenolic-rich cloudberry
extract by freeze-drying, using maltodextrins DE5-8 and DE18.5 as wall
materials. The microencapsulated cloudberry extract offered better protec-
tion for phenolics during storage, while the antioxidant activity remained
the same or even improved slightly [19].
Nevertheless, there is also some evidence of freeze-drying induced encap-
sulation being unable to improve stability or bioactivity. In addition, this
drying technique is less attractive than others because the costs of freeze-
drying are up to 50 times higher than spray-drying [20] and the storage
and transport of particles produced is extremely expensive, the commercial
applicability is also severely restricted by the long processing time [27].
11 Chapter 2. Background
2.2.5 Liposome entrapment
Liposomes are colloidal particles consisting of a membranous system formed
by lipid bilayers encapsulating an aqueous phase [21]. When phospholipids,
such as lecithin, are dispersed in an aqueous phase, the liposomes form spon-
taneously. One can have either aqueous or lipid-soluble material enclosed in
the liposome. The underlying mechanism for the formation of liposomes is
basically a hydrophilic-hydrophobic interaction between phospholipids and
water molecules. A major advantage of their use is the target delivery and
the ability to control the release rate of the incorporated materials. Bioac-
tive compounds encapsulated into liposomes can be protected from digestion
in the stomach, and show significant levels of absorption in the gastrointesti-
nal tract, leading to the enhancement of bioactivity and bioavailability [21].
Kirby et al. have developed a process to stabilize vitamin C in the aque-
ous inner core of liposomes. Encapsulation of vitamin C gave significant
improvements in its shelf life.
The main issues in liposome encapsulation the scaling up of the mi-
croencapsulation process at acceptable cost-in-use levels and the delivery
form of the liposome-encapsulated compound. Usually, liposome formula-
tions are kept in relatively dilute aqueous suspensions and this might be a
very serious drawback for the large-scale production, storage, and shipping
of encapsulated compounds [14].
2.2.6 Extrusion
Extrusion is an entrapping method, which involves forcing a core material
in a molten carbohydrate mass through a series of dies into a bath of dehy-
drating liquid. The pressure and temperature employed are typically <100
psi and seldom 115 [14]. In this process, the coating material hardens on
contacting the liquids, forming an encapsulating matrix to entrap the core
material. Extruded filaments are then separated from the liquid bath, dried
to decrease de moisture content and sized. High-dextrose equivalent corn
syrup and a combination of sucrose and maltodextrin are often used as the
encapsulation matrix [21]. Extrusion has been used to encapsulate different
types of flavors and vitamin C [27]. The major advantage of this method is
that the material is completely surrounded by the wall material, providing
Chapter 2. Background 12
a good stability against oxidation and therefore prolonging the shelf life.
The limitations of extrusion include its relatively high cost, low flavor
loading, low solubility in cold water, and high process temperature. Its
processing costs are estimated to be almost double in comparison to spray-
drying. The extruded product is not readily soluble in cold water and not
stable in beverage application because of its large particle size. Furthermore,
the compound to be extruded must be able to tolerate temperatures of 110-
120 for a long period of time.
2.2.7 Spray-drying
Spray-drying is widely used in large-scale production of encapsulated sub-
stances, such as antibiotics, medical ingredients, additives, vitamins and
polyphenols, among others. The merits of the process have ensured its
dominance; these include availability of equipment, low process cost, wide
choice of carrier solids, good retention of volatiles, good stability of the
finished product and large-scale production in continuous mode.
Spray-drying also offers some advantages to other drying methods; par-
ticle size of the powder is controlled in a single step, and the morphology
and the density of the particles can be controlled. Size and density are
particle properties, which are crucial for several delivery systems (e.g., pow-
ders for inhalation and suspensions for dermal delivery). Spray-drying can
be used for many heat-labile (low-boiling point) materials because of the
lower temperatures that the core material reaches [27]. The process involves
the homogenization of the substance to be encapsulated with the carrier
material at a different ratio. The mixture is then fed into a spray-dryer
and atomized with a nozzle or spinning wheel. Water is evaporated by the
hot air contacting the atomized material. The resulting capsules are then
transported to a cyclone separator for recovery (2.2).
In order to obtain good encapsulation efficiency and even if the wall
material is suitable, optimal spray-drying conditions must be used. The
main factors in spray-drying that must be optimized are feed temperature,
air inlet and air outlet temperatures [22]. The best spray-drying conditions
are a compromise between high air temperature, high solid concentration
of the solution, and easy pulverization and drying without expansion and
cracks of final particles [23].

13 Chapter 2. Background
Retention of core material during encapsulation by spray-drying is achie-
ved by chemical and physical properties of the wall and core materials
[20],[28], solid content of the dryer, processing temperature and also by
the nature and the performance of the encapsulating support, i.e. emulsion-
stabilizing capabilities, film-forming ability and low viscosity at a high con-
centration [28],[29]. The functionality profile of wall materials that are opti-
mal for spray-drying includes high solubility in water, low viscosity at high
concentration, effective emulsification, film-forming characteristics and effi-
cient drying properties. One limitation of the spray-drying technology is the
limited number of shell materials available. Since almost all spray-drying
processes in the food industry are carried out from aqueous feed formula-
tions, the shell material must be soluble in water at an acceptable level [14].
Typical shell materials include gum acacia, maltodextrins, hydrophobically
modified starch, and mixtures thereof. Other polysaccharides and proteins
can be used as wall materials in spray-drying, but their usage becomes very
time-consuming and expensive because of their low solubility in water: the
amount of water in the feed to be evaporated is much larger due to the lower
dry matter content and the amount of active compound in the feed must be
reduced accordingly [14]. There is an optimum infeed solid’s level for each
carrier material, which is the level at which the maximum solubility of the
carrier is achieved. This is typically determined experimentally for a given
dryer and carrier system [30]. There are various types of spray-dryers used
in the industry, differing in size, shape, airflow, type of atomization, etc. In
spite of this, they all have the same basic parts in common as shown in 2.2.

Chapter 2. Background 14
Figure 2.2: Typical spray-drying system with a centrifugal atomizer.
Drying air is most commonly heated by direct firing with natural gas
since it is clean burning. The material to be dried (infeed) is prepared
separately in a mix tank where materials are dissolved, homogenized and
then it is pumped into the atomizer. Atomization is typically accomplished
by either a single-fluid high-pressure spray nozzle or centrifugal wheel [30].
The goal of this stage is to create a maximum heat-transferring surface
between the dry air and the liquid in order to optimize heat and mass
transfers. Spray-dryers working in cocurrent, i.e., product and drying air
enter the dryer flowing in the same direction, have lower drying times and
do not subject the active substance to as much heat as counter current
systems. In cocurrent process the hot air inlet temperature is typically 150-
220, evaporation occurs instantaneously and for which dry powders will be
exposed to moderate temperatures (typically 50-80 ) which limits thermal
degradations. The atomized infeed is cooled by water evaporation and only
rises to the dryer exit air temperature when the drying rates low. Drying
chamber shape generally is cylindrical with either a conical or flat-bottom.
After leaving the drying chamber, the dry product passes through a cyclone
collector, sieve, and finally is packaged in a moisture barrier container.
The selection of the wall material is another factor that governs the
encapsulation efficiency by spray-drying.

15 Chapter 2. Background
2.3 Systems and Wall materials
The criteria for selecting a coating material are mainly based on the physico-
chemical properties such as solubility, molecular weight, glass/melting tran-
sition, crystallinity, diffusibility, film forming and emulsifying properties.
Moreover, the costs should also be considered. Thus, judicious choice of
encapsulating material according to the desired application is an important
task [23]. The matrix is designed to protect the encapsulated compound
from factors that may cause its deterioration, to prevent a premature in-
teraction between the encapsulated material and other substances, to limit
volatile losses, and also to allow controlled or sustained release under desired
conditions [31]. Depending on the core material and the characteristics de-
sired in the final product, wall materials can be selected from a wide variety
of natural and synthetic polymers. Usually, the wall materials employed for
encapsulation by spray-drying are milk or whey proteins, gelatin, low mole-
cular weight carbohydrates, hydrocolloids like gum arabic and more recently
local materials, such as mesquite gum [23], [32], [33].
Mesquite gum represents an alternative to some commonly used ma-
terials, since it has been reported as a good encapsulating agent. It is a
neutral salt of a complex acidic branched polysaccharide formed by a core
of β-D-galactose residues, comprising a (1-3)-linked backbone with (1-6)-
linked branches, bearing L-arabinose, L-rhamnose, β-D-glucuronate and 4-
O-methyl-β-D-glucuronate as single sugar or oligosaccharide side chains. It
also contains a small amount of protein (up to 6%) [34]. Mesquite gum has
been reported as having the ability to encapsulate orange peel oil (80.5%
of the starting oil) but to a lesser extent than gum arabic (93.5% of the
starting oil) [35]. Cardamom-based oil microcapsules were successfully pro-
duced by spray-drying using mesquite gum [33]. The stability against drop
coalescence of the emulsions was elevated for all the gum:oil ratios studied.
High flavor retention (83.6%) was attained during microencapsulation by
spray-drying when a proportion of 4:1 gum:oil was used. This confirmed the
interesting emulsifying properties and good flavor-encapsulation ability that
qualify mesquite gum as an alternative encapsulating medium. Mesquite
gum has a disadvantage in comparison with other gums, in that it has darker
color.

Chapter 2. Background 16
The functional properties of proteins allow them to be a good coating
material for encapsulation by spray-drying. Furthermore, proteins possess
high binding properties for the flavor compounds. The most commonly
used proteins for encapsulating food ingredients by spray-drying are milk or
whey proteins and gelatin [23]. Because they possess functional properties
required for microcapsule forming wall material [36], whey proteins have
been successfully used as wall system to encapsulate anhydrous milk fat by
spray-drying and an encapsulation yield greater than 90% was obtained [37].
Heat treatments of whey proteins were shown to affect the functional pro-
perties of spray-dried powder probably by protein denaturation [38]. During
spray-drying the temperature of the drying droplet increases slightly, while
its water content decreases at the same time. Protein denaturation, espe-
cially globular proteins, can occur only when two parameters are combined:
high temperature and high water activity of the drying droplet. As a result,
it is very difficult to predict the effect of spray-drying process on the stability
of wall proteins [23].
Likewise, gelatin is a water-soluble protein with wall-forming ability in
spray-drying [32] and it consists mainly in glycine, proline and 4- hydroxy-
proline residues [21]. Based on the drying characteristic curves, Imagi et al.
(1992) showed that, compared to maltodextrin, pullulan, glucose, maltose
and mannitol, gelatin had all the properties of an effective entrapping agent:
high emulsifying activity, high stabilizing activity and a tendency to form a
fine dense network upon drying [39]. The addition of a small amount (1%
(w/w)) of gelatin could increase the retention of ethyl butyrate when gum
arabic is used as emulsifier. According to Yoshii et al. (2001), the early for-
mation of the surface crust due to the presence of gelatin, prevented the loss
of ethyl butyrate emerged from the unstable ethyl butyrate emulsion [40].
Pierucci et al. (2006) reported that pea protein can be considered as a good
coating agent for the microencapsulation of ascorbic acid [41]. In all cases,
it should be noticed that there are sometimes certain issues that may limit
the use of proteins as encapsulating agents, for example, labelling, allergy
and precipitation when protein based microcapsules are added to products
having pH near their isoelectric point.
Carbohydrates such as starches, corn syrup solids, chitosan and mal-
todextrins have been usually used as encapsulating agents. These materials
17 Chapter 2. Background
are considered as good encapsulating agents because they exhibit low vis-
cosities at high solids contents and good solubility, but most of them do not
possess the interfacial properties required for high encapsulation efficiency
and generally associated with other encapsulating materials such as gums
or proteins [23].
Chitosan is a cationic polymer obtained from chitin comprising copoly-
mers of β(1→ 4)-glucosamine and N-acetyl-D-glucosamine. Chitin is a na-
tural polysaccharide found particularly in the shell of crustacean, cuticles of
insects and cell walls of fungi and is the second most abundant polymeri-
zed carbon found in nature [42]. Chitosan is a hydrophilic, biocompatible,
and biodegradable polysaccharide of low toxicity. In recent years, it has
been used for development of oral controlled drug delivery systems. In pre-
vious studies, sustained-release carriers of vitamin C have been prepared
by using cross-linked chitosan as a wall material by spray-drying technique
[14]. Chitosan has also been used as a wall material in spray-drying of olive
leaf extract (OLE) [43]. The loading percent of polyphenolic compounds
was 27%, and the OLE loaded microspheres normally had a smooth surface
morphology. The FTIR spectroscopy results indicated that the majority
of the OLE in the chitosan microsphere was physically encapsulated in the
chitosan matrix. Hu et al. (2008) also successfully encapsulated tea ca-
techins in chitosan-tripolyphosphate (CS-TPP) nanoparticles by ionotropic
gelation method. Under the acidic conditions, the -NH3+ protonized from
-NH2 of chitosan can interact with an anion such as tripolyphosphate to
form microgel particles [44]. The entrapment efficiency of chitosan particles
was low, varying from 20% to 50%, depending mainly on the chitosan mole-
cular weight and the proportion between chitosan and the ionic cross linker
(sodium tripolyphosphate). Additionally, chitosan is only soluble in acidic
environment, which decreases the availability of catechins in the gastroin-
testinal tract. Many factors affect the entrapment efficiency of the drugs
in chitosan microspheres, e.g. nature of the drug, chitosan concentration,
drug polymer ratio, stirring speed, etc. Generally a low concentration of
chitosan shows low encapsulation efficiency. However, at higher concentra-
tions, chitosan forms highly viscous solutions, which are difficult to process
[45].

Chapter 2. Background 18
Maltodextrins are hydrolyzed starches produced by partially hydrolysis
of starch with acid or enzymes, consisting of β-D-glucose units linked mainly
by glycosidic bonds (1→4) and are usually classified according to their dex-
trose equivalency (DE). Hydrolyzed starches have the advantages of being
low cost, bland in flavor, and good flavor protection against oxidation. Mal-
todextrins are reported to improve shelf life of orange oil [46] and carrot
carotene. Wagner and Warthesen, also reported that storage stability of
core materials increased as hydrolyzed starches DE increased [47]. The DE
of a maltodextrin determines its reducing capacity and is inversely related to
its average molecular weight [48]. Maltodextrins are widely used for flavors
and polyphenol encapsulation. Maltodextrins provide good oxidative stabi-
lity to encapsulated oil, but exhibit poor emulsifying capacity and emulsion
stability and low oil retention. Ethanol extracts of black carrots, which con-
tain a high level of anthocyanins, have been spray-dried using maltodextrins
as a carrier and coating agents [49]. High air inlet temperatures (>160-180
) caused greater anthocyanin losses, while the maltodextrin of DE 20-21
gave the highest anthocyanin content powder at the end of the drying pro-
cess. Maltodextrin can also be mixed with gum arabic as wall material to
provide a better protection of the encapsulated compound. A mixture of
maltodextrin (60%) and gum arabic (40%) has been used for encapsulation
of procyanidins from grape seeds [50].The ratio of core substance to wall
material was 30:70 w/w, while the concentration of the slurry was 20% w/v.
The encapsulation efficiency was up to 88.8%, and the procyanidin was not
changed during drying and the procyanidin microcapsule membrane was un-
interrupted and with fairly good integrity. The stability of the products was
obviously improved by spray-drying [21]. Maltodextrin chemical structure
is illustrated in Figure 2.3.
Figure 2.3: Chemical structure of maltodextrin.

19 Chapter 2. Background
Gum arabic, a natural plant exudates polysaccharide of acacia, is a well-
known effective wall material for many years and stills a good choice as wall
material due to its stable emulsion and good volatile retention [51]. Gum
arabic is predominantly a branched chain, complex polysaccharide that is
either neutral or slightly acidic, depending on the pH. It is a highly hetero-
geneous material that possesses both hydrophilic and hydrophobic affinities.
This polysaccharide is characterized by a high proportion of carbohydrate,
in which D-galactose and L-arabinose are the predominant monosaccharides
responsible for the hydrophilic affinity, and a low proportion of protein (ap-
proximately 2%), mostly composed of hydroxyproline. The carbohydrate
structure consists of a backbone of 1,3-linked β-D-galactopyranosyl units
with extensive branching at the C6 position. The branches consist of galac-
tose and arabinose, which terminate with rhamnose and glucuronic acid [52].
The chemical structure of the main components of gum arabic, D-galactose
(40%), L-arabinose (24%) and D-glucuronic acid (21%) are illustrated in
Figure 2.4.
(a) (b) (c)
Figure 2.4: Chemical structure of gum arabic main components: D-galactose(a), L-arabinose (b) and D-glucuronic acid (c).
Gum arabic has been the most widely used encapsulating material in
encapsulation by spray-drying, mainly because of its good emulsifying ca-
pacity and low viscosity in aqueous solution, which aids the spray-drying
process. The emulsification properties of the gum arabic are attributed
to the presence of the protein fraction. Kanakdande, Bhosale and Singhal
(2007) reported that gum arabic is a better wall material for encapsulation
of cumin oleoresin by spray-drying as compared to other wall materials [53].
In addition, it provides good retention of volatile substances and confers
effective protection against oxidation [48]. Problems associated with the use
of gum arabic in encapsulation are high cost and limited supply.
Chapter 3. Materials and Methods 20
Chapter 3
Materials and Methods
Contents
3.1 Materials . . . . . . . . . . . . . . . . . . . . . . . 20
3.2 Methods . . . . . . . . . . . . . . . . . . . . . . . . 21
3.2.1 Preparation of carbohydrate particles . . . . . . . 21
3.2.2 Characterization of carbohydrate particles . . . . . 21
3.2.3 Particle internal structure . . . . . . . . . . . . . . 27
3.2.4 Determination of the loading efficiency . . . . . . . 30
3.2.5 Detection of active compounds . . . . . . . . . . . 31
3.2.6 Antioxidant activity . . . . . . . . . . . . . . . . . 38
3.2.7 Release studies . . . . . . . . . . . . . . . . . . . . 40
3.2.8 In vitro cell culture studies . . . . . . . . . . . . . 41
3.1 Materials
Gum arabic (250 kDa) and maltodextrin (1000 Da) were purchased from
Sigma-Aldrich Co. (USA) and Grain Processing Corporation (USA), res-
pectively. Catechins Sunphenon EGCG (458 Da) and Collagen hydrolysate
HM (3600 Da) were purchased from Taiyo Kaguku (Japan) and Copalis
(France), respectively. All chemicals were used without further purifica-
tion. The ultrapure water (resistivity of 18.2 MΩ.cm) was obtained using
an EasyPure RF purification system (Nanopure Diamond Water Purifica-
tion, Barnstead Thermo Scientific, USA).
21 Chapter 3. Materials and Methods
3.2 Methods
3.2.1 Preparation of carbohydrate particles
Gum arabic was dissolved in ultrapure water at 50 to 60 adding the mal-
todextrin, in a proportion of 60 wt.%, under magnetic stirring for 30 min to
form an aqueous suspension. The suspension was homogenized at a constant
speed (9500 rpm) with a dispersing device IKA DI25 Basic (Staufen, Ger-
many). The resultant suspension was fed to a spray-dryer (designed by Niro
A/S) at the following conditions: inlet air temperature between 150-170 ,
outlet air temperature between 50 and 60 and a liquid feed flow rate of
10 ml/min. The spray-dried powder was then collected to the spray-dryer’s
glass collecting vessel. The epigallocatechin gallate (EGCG) and collagen
hydrolysate (CH) loaded particles, were prepared following the same pro-
cedure but adding EGCG and CH, respectively, to the suspension before
homogenization, in the desired proportion (wt.%).
3.2.2 Characterization of carbohydrate particles
3.2.2.1 Electron Microscopy: Scanning and Transmission Elec-
tron Microscopy
There are two common types of electron microscopes: scanning and trans-
mission. Scanning electron microscopy (SEM) permits the observation and
characterization of heterogeneous organic and inorganic materials on a na-
nometer (nm) to micrometer (µm) scale. This technique is extensively used
due to its capability of obtaining three-dimensional-like surface images of a
very wide range of materials. In SEM, the area to be examined is irradiated
with a finely focused electron beam, which may be swept in a raster across
the surface of the specimen to form images or may be static to obtain an
analysis at one position. The types of signals produced from the interaction
of the electron beam with the sample, can be used to examine many cha-
racteristics of the sample, such as, surface topography, morphology, crystal-
lography and composition [54]. In recent years, cryo-preparation equipment
was developed for the conventional scanning electron microscope. This inno-
vation has enabled unique SEM observation of rapidly cooled soft or liquid
specimens at low-to-medium magnification (50-50000x) [55].

Chapter 3. Materials and Methods 22
Transmission electron microscopy (TEM), on the other hand, produces
an image that is a projection of the entire object, including the surface and
the internal structures. The incoming electron beam interacts with the sam-
ple as it passes through the entire thickness of the sample. Therefore, objects
with different internal structures can be differentiated because they give dif-
ferent projections. However, the projection is of necessity two-dimensional
against the view screen and relations in the z-axis between structures are
lost. Besides, the samples need to be thin, or they will absorb too much of
the electron beam.
In this study, SEM analysis of the spray-dried particles was performed on a
JEOL SEM 6301F microscope (Tokyo, Japan). The samples in solid state
were previously fixed on a brass stub using double-sided adhesive tape. Then
they were coated with a thin layer of platinum in vacuum to be electrically
conductive. Micrographs were taken at an excitation voltage of 7 kV. Cryo-
genic scanning electron microscopy was used for EGCG/P characterization
in aqueous suspension. Samples were fixed on a holder with a layer of
carbon-rich conductive glue (conductive to allow discharge of electrons) and
rapidly frozen with liquid nitrogen. The holder with frozen material was
held in liquid nitrogen to be coupled to a rod and pulled back into a small
cylindrical container. This is done to transfer the sample to the high vacuum
cryo-unit and prevent too much contamination with gas particles while sli-
ding the sample into the cryo-chamber. The cryo-chamber is equipped with
a knife that can be handled from outside by means of a level to fracture the
sample for applications in which imaging of the surface of inner structures is
aimed. Next, the temperature was raised slightly to sublime any condensed
water off the surface of the sample, which was then coated with a thin layer
of gold-palladium for good conductance of electrons. Finally the entire or
fractioned material was further inserted into the observation chamber with a
rod. For TEM analysis, EGCG/P were suspended in PBS (46 mg/ml) and
5 µl were placed on glow discharged formvar-coated Ni grids and stained
with 1% filtered uranyl acetate solution. The grids were analyzed in a Zeiss
microscope (Germany) operated at 60 kV.
23 Chapter 3. Materials and Methods
3.2.2.2 Atomic Force Microscopy
Atomic force microscopy (AFM), is powerful tool in imaging that can pro-
vide three-dimensional images of surface topography of biological specimens
in ambient liquid or gas environments. The high resolution (in the nano-
meter range) of the atomic force microscope allows topographical imaging
of samples [56] and also provides information about the mechanical proper-
ties of materials such as stiffness, viscoelasticity, hardness, or adhesion force
between the probe and sample can be extracted from the collected force-
distance curves by mathematical analysis [57]. An AFM consists of a sharp
tip at the end of a flexible cantilever which is moved across a sample surface
by piezoelectric actuators. The cantilever deflection may be measured in
different ways in order to reproduce the sample topography. Force measure-
ments can be correlated with topography measurements. Operating modes
can be classified as contact, non-contact and intermittent. In intermittent
mode, the cantilever oscillates near its resonant frequency and lightly taps
the surface during scanning. The tip rapidly moves in and out of the sample
surface with an amplitude which is sufficiently high to overcome adhesion
forces so that it stays in contact only for a short fraction of the oscilla-
tion period. Forces that act between the sample and the tip will not only
cause a change in the oscillation amplitude, but also change in the resonant
frequency and phase of the cantilever. The amplitude can be presented in
height (topography) or interaction (amplitude or phase) images.
EGCG/P shape and mechanical strength were studied by AFM, using a
JPK NanoWizard II BioAFM microscope (Berlin, Germany) assembled on
a Carl ZEISS Axiovert 200 (biomaGUNE, San Sebastian, Spain). Standard
glass cover slips of 0.17 mm thickness were washed with acetone and cleaned
with tissue paper before being immersed in a 2% Hellmanex solution for 30
min. To decrease the negative charge density of the glass cover slips surface,
they were coated with cationic PEI and rinsed with ultrapure water (0.01
M, NaCl 0.5 M). The substrates were then washed with ultrapure water and
placed in a UV cleaner apparatus for 30 min. Afterward the substrate was
incubated in a particle suspension (0.1 mg/ml) for 20 min and subsequently
washed with water. The substrate was mounted into the cover slip holder
with 500 µl of buffer solution. AFM imaging was obtained with unmodified
Chapter 3. Materials and Methods 24
silicon nitride tips (DNP, Veeco Instruments, USA) operating in intermittent
contact mode. The nominal radius of curvature of the cantilevers was 20 nm
and the spring constant of the cantilever, kc, was calculated by the thermal
method and corresponds to 336±18 mN/m.
3.2.2.3 Dynamic Light Scattering and Zeta Potential
Dynamic Light Scattering (DLS) is the technique most used to determine
the size of particles and size distribution in dispersion. Shining a monochro-
matic light beam, such as a laser, onto a solution with particles in Brownian
motion, causes a Doppler Shift when the light hits the moving particle,
changing the wavelength of the incoming light. This change is related to
the particle size. It is possible to determine the particle size distribution
and give a description of the particle’s motion in the medium, measuring its
diffusion coefficient and using the autocorrelation function. The diffusion
coefficient, D, which is characteristic of the Brownian motion can be related
to kB, the Boltzmann constant, T , the temperature, η, the viscosity and,
dp, the particle hydrodynamic diameter, using the Stokes-Einstein relation
[58]:
D =kBT
3πηdp(3.1)
The hydrodynamic average intensity radius of the particles, RH , can be
calculated from Eq. 3.1:
RH =kB
6πηD(3.2)
When a particle suspension is illuminated, the intensity of the light scat-
tered fluctuates with time because of the Brownian movement of the par-
ticles. DLS consists of measuring these fluctuations as a function, in order
to deduce the diffusion coefficient D and, thus, dp. The time period nec-
essary to detect fluctuations ranges between 10−4 and 10−3 s, with small
particles moving faster than large ones. A photocorrelator determines an
autocorrelation function as a function G(τ) of time. For a monomodal dis-
tribution, G(τ) is proportional to exp(−2DK2τ), where K is the scattering
25 Chapter 3. Materials and Methods
vector, which is a function of n, the refraction index of the medium, λ, the
wavelength and θ, the detection angle. For a multi-modal distribution, the
interpretation of G(τ) is more complex because it is a sum of several expo-
nentials, each of which corresponds to one of the particle populations. The
major difficulty is in determining the contribution of each population to the
overall signal. Moreover, if the intensity due to one of the populations is
very low compared to the intensity scattered by the others, this population
of particles will be very difficult to detect. This situation arises when one
particle population accounts only for an overly small fraction of the total. As
we mentioned above, the intensity distribution is an oscillatory function of
dp, so particles of a specified size may correspond to weak detection intensity
at a fixed detection angle. This can be overcome in the case of multimodal
particle size and particle size distributions, by performing measurements at
different detection angles. In this case, the compilation of results collected
at each detection angle results in a complex mathematical analysis. In case
of a monomodal particle size and particle size distributions, light scattering
is a very efficient and fast technique.
The concept of zeta potential is another important parameter to study
the particle stability in suspension. The zeta potential is determined by
electrophoretic mobility, applying the Henry equation (Eq. 3.3). The elec-
trophoretic mobility is obtained performing an electrophoresis experiment on
the sample and measuring the velocity of the particles using Laser Doppler
Velocimetry. The magnitude of the zeta potential gives an indication of the
potential stability of the colloidal system. One system is colloidal when one
of the three states of matter; gas, liquid and solid, is finely dispersed in
one of the others. If all the particles in suspension have a large negative or
positive zeta potential then they will tend to repel each other and there is
no tendency to flocculate or aggregate. However, if the particles have low
zeta potential values then there is no force to prevent the particles com-
ing together and flocculating. The general dividing line between stable and
unstable suspensions is generally taken at either +30 mV or -30 mV. An
important consequence of the existence of electrical charges on the surface
of particles is that they will exhibit certain effects under the influence of
an applied electric field. When an electric field is applied across an elec-
trolyte, charged particles suspended in the electrolyte are attracted towards
Chapter 3. Materials and Methods 26
the electrode of opposite charge. This movement is called electrophoresis.
Viscous forces acting on the particles tend to oppose this movement. When
equilibrium is reached between these two opposing forces, the particles move
with constant velocity. The velocity of a particle in an electric field is com-
monly referred to as its electrophoretic mobility. With this knowledge we
can obtain the zeta potential of the particle by application of the Henry
equation [59]:
UE =2ezf (ka)
3η(3.3)
where z is the zeta potential, UE , is the electrophoretic mobility, e, is
the dielectric constant, η, is the viscosity and f (ka) is the Henry’s function.
For aqueous medium and moderate electrolyte concentration, f (ka) is 1.5.
It is the electrophoretic mobility that is directly measured and converted to
zeta potential, according to Smoluchowski equation (Eq. 3.5):
z =ηUEe
(3.4)
The essence of a classical micro-electrophoresis system is a cell with
electrodes at either end to which a potential is applied. Particles move
towards the electrode of opposite charge, their velocity is measured and
expressed in unit field strength as their mobility.
Measurements of particle size and zeta potential of the particles were
performed by dynamic light scattering and Laser Doppler Velocimetry, res-
pectively, using a Zetasizer Nano ZS (Malvern Ltd, UK). Spray-dried par-
ticles were dispersed in ultrapure water and the resulting suspension was
evaluated.
3.2.2.4 Particle Tracking Analysis
Nanoparticle Tracking Analysis (NTA) is a unique technique of visualizing
and analyzing particles in liquids from 10 to 1000 nm [60]. Based on a
laser illuminated microscopic technique, Brownian motion of nanoparticles
is analyzed in real-time by a CCD camera, each particle being simultane-
ously but separately visualized and tracked by a dedicated particle tracking
27 Chapter 3. Materials and Methods
image analysis program. NTA tracks all random particles movements and
calculates the diffusion coefficient. Then using the Stokes-Einstein equation
(Eq. 3.1) particle size (hydrodynamic diameter) is estimated. Nanoparti-
cle tracking analysis experiments were performed using a digital microscope
LM10 System (NanoSight, Salisbury, UK). A small amount of the diluted
sample in ultrapure water was introduced into the chamber by a syringe.
EGCG/P were observed using the digital microscope. The video images of
the particle movement under Brownian motion were analyzed by the NTA
image analysis software (NanoSight, version 2.0). For each sample analysis,
50-70 s video clips were taken.
3.2.3 Particle internal structure
The use of mercury porosimetry to obtain apparent density as well as the
use of helium pycnometry to obtain true density, allowed the determination
of the total porosity, εp, of the spray-dried particles, according to Eq. 3.5:
εp =(
1− ρbulkρtrue
)× 100% (3.5)
where ρbulk is apparent density and ρtrue is true density, determined by
mercury porosimetry and helium pycnometry, respectively. Porosity des-
cribes the fraction of voids in a given volume of a material, i.e., the total
porosity is the ratio between the volume of voids and the overall volume of
material.
3.2.3.1 Helium Pycnometry
True density is defined as the ratio of the mass to the volume occupied by
that mass. Therefore, the contributions to the volume made by pores or
internal voids are excluded. True density is also often termed as helium dis-
placement density. Measuring the true density is accomplished by employing
Archimedes principle of fluid displacement and Boyle’s law to determine the
volume. The displaced fluid is a gas, which can penetrate the finest pores
and thereby obtain maximum accuracy. Helium (He) is usually used in
these experiments as its small dimensions assure penetration into crevices
and pores approaching one Angstrom (A) in dimension. Its behavior as an
Chapter 3. Materials and Methods 28
ideal gas is also desirable as the instrument uses the ideal gas equation to
measure the volume occupied by the sample [61].
True density of the spray-dried particles was determined using a He
pycnometer. EGCG/P and CH/P samples were weighted and placed in
a cylinder of known volume, which was flushed with He and closed. The
pressure inside the cylinder was adjusted to a predetermined value and its
exact value was noted. A second, similar cylinder of known volume was
filled with He, under a different, known pressure. A valve was then opened
between these two cylinders and the new pressure was noted. The ratio
between these two pressures is directly related to the volume occupied by the
solid material in the sample, providing the density of the particle skeleton.
The measurements were repeated at least three times.
3.2.3.2 Mercury Porosimetry
Porosity parameters of spray-dried particles such as pore size distribution,
total surface area, average pore diameters and apparent density were evalua-
ted by mercury (Hg) porosimetry. Apparent density is defined as the volume
occupied by the solid, including the pores and interparticle voids, divided
by the solid mass. It is also known as the bulk density and is less than
the true density. Hg porosimetry is based on the concept that the struc-
ture of porous solids can be characterized by forcing a non-wetting liquid
to penetrate their pores [61]. The mercury porosimeter is a device, which is
capable of generating suitably high pressures and measuring simultaneously
both the pressure and volume of mercury taken up by a porous material.
Mercury does not wet most substances and will only penetrate pores when
forced to do so under high pressure. Entry of mercury into pores requires
applying pressure in inverse proportion to pore size. In other words, large
pores will fill first, with smaller pores filling at increasingly higher pressures.
Eq. 3.6, known as the Washburn equation [62], is the basis of the mercury
porosimeter method for measuring pore size distribution:
Dpore =−4γcosθ
P(3.6)
where Dpore is the pore diameter, γ is the surface tension, θ is the con-
tact angle and P is the applied pressure. Mercury exhibits a high contact

29 Chapter 3. Materials and Methods
angle against most solids. Reported contact angles vary, with 130° being
the most widely used value. Liquid mercury has a high surface tension,
usually its value is taken to be 0.485 N/m at 25 . High pressure mercury
porosimeters can normally attain maximum pressures of 20 000 psi or 60 000
psi (140 kPa-420 MPa). The measurable pore size ranges from a maximum
of 500 µm to a minimum of 6 nm (for the 20 000 psi system) or 3 nm (for
the 60 000 psi system). In porosimetry, mercury filling apparatus is used to
evacuate the sample and then to surround the sample with mercury. Eva-
cuation is achieved by exposing the sample to a vacuum. The sample to be
analyzed is contained inside a penetrometer, which is a long glass capillary
tube, the sample end being a bulb shape. Using the vacuum control on
the filling apparatus, gases and vapors are removed from the sample. The
vacuum valve is closed and the penetrometer titled so that the stem end is
immersed in mercury. The vent control valve is then slowly opened such
that air fills the mercury chamber. Mercury is forced up the capillary stem
and into the bulb. The filled penetrometer is then removed and inserted
in the high pressure porosimeter for pore analysis. The construction of the
glass penetrometer is key to pore measurement. A metal sheath fits over
the capillary section. A metal seal is attached to the sample end of the
penetrometer as a base electrode. The construction is thus mercury-glass-
metal, or conductor-insulator-conductor. In this way a coaxial capacitor is
created. The capacitance changes as a result of the change in mercury level
within the penetrometer. The mercury level will change as porous samples
are filled with mercury under increasingly high pressure [62]. As mentioned
above, porosity parameters were determined by means of a high-pressure
porosimeter [63], a Quantachrome Poremaster (33/60). Total intruded vo-
lume of mercury (Vtot), total surface area (S), mean pore diameter (dmean),
volume pore size distribution (Dv(d)), total porosity and apparent density
(ρbulk) were calculated from the intrusion data with Quantachrome Pore-
master software, version 3.0 [64]. Total pore surface area was calculated by
Eq. 3.7
S =1
γ |cosθ|
∫ Vtot
0pdV (3.7)
where p is the pressure, V is the intruded volume of mercury, γ is the
Chapter 3. Materials and Methods 30
surface tension, θ is the contact angle of mercury. The mean pore diameter
was calculated by Eq. 3.8
dmean = 4 · VtotS
(3.8)
based on the assumption of cylindrical shape of pores open at the ends.
Median pore diameter (dmean) is the pore diameter at which 50% of the
total intruded volume of mercury is intruded. Dv(d) is defined as the pore
volume per unit interval of pore radius by Eq. 3.9
Dv (d) =p
d· dVdp
(3.9)
Intrusion pressure values were directly converted into the corresponding
pore size by using the Washburn equation (Eq. 3.6). The pore size distribu-
tion was determined from the volume of mercury intruded at each pressure
increment, while the total porosity was based on the total intruded volume.
3.2.4 Determination of the loading efficiency
3.2.4.1 Microwave-assisted extraction
Microwave-assisted extraction (MAE) is a novel process that uses microwave
energy to heat the solvents and the sample to increase the mass transfer rate
of the solutes from the sample matrix into the solvent [65]. The combination
of solvents and heat is expected to increase the extraction yield as compared
to other methods. Because of the heat produced, microwave-assisted solvent
extraction takes 10-30 min, whereas the other methods can take hours or
days to complete. The heat produced by microwaves is due to the interaction
of the radiation with the dielectric field associated with polar molecules and
ions [66]. The amount of solvent used in microwave extraction is also con-
siderably less than the amount used in the other extraction processes [67].
MAE is a relatively new extraction technique and has been successfully em-
ployed to extract tea polyphenols and tea caffeine from green tea leaves [68],
piperine from black pepper [66], capsaicinoids from capsicum [69], pheno-
lic compounds from grape seeds [70], puerarin from Radix puerariae [71],

31 Chapter 3. Materials and Methods
and color pigments from paprika [72]. This technique has a number of ad-
vantages over the traditional extraction methods: since it is not extensive
and not restricted in solvent selectivity, no concentration/ evaporation step
is required, and the possibility of contaminating the sample with solvent
impurities is much lower [72].
In this work, MAE was used to determine the active compound loading
efficiency. MAE experiments were performed with a MARS-X 1500W Mi-
crowave Accelerated Reaction System for extraction and digestion (CEM
Corp., Mathews, NC, USA). Samples of 10.0 mg of free EGCG, EGCG/P
and control (unloaded) particles were suspended in 15 ml of methanol and
transferred to the glass extraction vessels. Samples were extracted at two
selected temperatures (90 and 110 ), with constant medium stirring, at
100% magnetron power, for 15 min. In the case of the collagen hydrolysate
loaded particles (CH/P), samples of 15.0 mg of collagen hydrolysate (CH)
alone, and 300 mg of CH/P and control particles were suspended in 15 ml of
NaCl 5 mg/ml and transferred to the glass extraction vessels. Samples were
extracted at 100 for 15 min. The maximum vessel pressure cut off was
set at 1.38Ö106 Pa. Once the extraction was completed, the samples were
cooled for 10 min. The pellet (particles without the active compound) was
discarded and the supernatant (extracted EGCG and CH) analyzed by UV-
VIS spectroscopy. The loading efficiency was determined according to the
EGCG and CH absorbance obtained at 276 nm and in the range of 250-270
nm, respectively. All experiments were performed, at least, in triplicate.
3.2.5 Detection of active compounds
3.2.5.1 Ultraviolet-Visible Spectroscopy
Ultraviolet-visible (UV-Vis) spectroscopy is used to obtain the absorbance
spectra of a compound in solution or as a solid. What is actually being
observed spectroscopically is the absorbance of light energy or electromag-
netic radiation, which excites electrons from the ground state to the first
singlet excited state of the compound or material. The UV-Vis region of
energy for the electromagnetic spectrum covers 1.5 - 6.2 eV which relates
to a wavelength range of 800-200 nm. The Beer-Lambert Law, Eq. 3.10, is
the principle behind absorbance spectroscopy. For a single wavelength, A
Chapter 3. Materials and Methods 32
is absorbance, ε is the molar absorptivity of the compound or molecule in
solution (M−1cm−1), b is the path length of the cuvette or sample holder
(usually 1 cm), and c is the concentration of the solution (M).
A = εbc (3.10)
All UV-visible spectra were obtained using a UV-1700 PharmaSpec Spec-
trometer, Kyoto, Japan.
3.2.5.2 Attenuated Total Reflection-Infrared Spectroscopy
Attenuated total reflection-Infrared spectroscopy (ATR-IR) is one of the
most useful techniques for identifying molecular structures, which is based
on the analysis of absorption peaks at certain wave numbers (expressed
in cm−1). In the last years, the combination of Fourier transform algo-
rithm with attenuated total reflectance (ATR) techniques has improved
the conventional IR spectroscopy with various and important advantages.
Thus, ATR-IR spectroscopy is direct and nondestructive, requires only small
amounts of dried material (just a few milligrams) and is a quick method.
ATR-IR is a well-established analytical tool applicable to full-spectrum cha-
racterization of chemical and biological species without particular sample
preparation [73]. The basic premise of the technique involves placing the
sample in contact with an infrared transmitting crystal with a high refrac-
tive index. The infrared beam is directed through the crystal, penetrating
the surface of the sample, and obtaining spectral information of that sur-
face. An advantage of this technique is that it requires very little sample
preparation; simply place the sample in contact with the crystal [74]. In
addition, ATR provides information on the effect of environmental factors
on an analyte’s vibrational characteristics. Reaction kinetics can be studied
by ATR-IR using the Beer-Lambert law (Eq. 3.10). The distance b that
the evanescent wave travels through the sample (the path length) is deter-
mined by the wavelength of light, the angle of incidence and the indices of
refraction for the ATR crystal and the medium being probed [75].
ATR-IR spectra of spray-dried particles were recorded employing a FTLA
2000 Series Laboratory FT-IR Spectrometer (Ettlingen, Germany). The
samples were analyzed in solid state and the spectra measured in a fre-
quency range between 4000 and 400 cm−1.
33 Chapter 3. Materials and Methods
3.2.5.3 Nuclear Magnetic Resonance Spectroscopy
Nuclear magnetic resonance (NMR) spectroscopy is one of the most powerful
experimental methods for investigation of the structure and intermolecular
interactions of multicomponent systems [76]. NMR is based on the magnetic
properties of the atomic nucleus. NMR is a property that magnetic nuclei
have in a magnetic field and applied electromagnetic (EM) pulse or pulses,
which cause the nuclei to absorb energy from the EM pulse and radiate this
energy back out. This is a technique that provides information about the
structure and dynamic of a sample subject to a static magnetic field, from
the analysis of the interaction between the magnetic moments of the sample
nuclei and an applied electromagnetic wave.
The NMR phenomenon is based on the fact that nuclei of atoms have
magnetic properties that can be utilized to yield chemical information.
Quantum mechanically subatomic particles (protons, neutrons and elec-
trons) have spin. In some atoms (e.g. 12C, 16O, 32) these spins are paired
and cancel each other out so that the nucleus of the atom has no overall
spin. However, in many atoms (1H and 13C, 31P, 15N, 19F) the nucleus does
possess an overall spin (I). All nuclei with non-zero spins have magnetic
moments (µ), but the nonspherical nuclei also have an electric quadrupole
moment (eQ). In quantum mechanical terms, the nuclear magnetic moment
of a nucleus will align with an externally applied magnetic field of strength
B0 in only 2I+1 ways, either with or against the applied field B0.
The orientations that a nucleus’ magnetic moment can take against an
external magnetic are not of equal energy. Spin states which are oriented
parallel to the external field are lower in energy than in the absence of an ex-
ternal field. In contrast, spin states whose orientations oppose the external
field are higher in energy than in the absence of an external field. Where an
energy separation exists there is a possibility to induce a transition between
the various spin states. By irradiating the nucleus with electromagnetic ra-
diation of the correct energy (as determined by its frequency), a nucleus
with a low energy orientation can be induced to “transition” to an orienta-
tion with a higher energy. The absorption of energy during this transition
forms the basis of the NMR method. In a given sample of a specific NMR-
active nucleus, the nuclei will be distributed throughout the various spin
Chapter 3. Materials and Methods 34
states available. As the energy separation between these states is compara-
tively small, energy from thermal collisions is sufficient to place many nuclei
into higher energy spin states. The number of nuclei in each spin state is
described by the Boltzmann distribution:
Nupper/Nlower = e−γB0/kT (3.11)
where theN values are the numbers of nuclei in the respective spin states,
γ is the magnetogyric ratio, h is Planck’s constant, B0 is the external mag-
netic field strength, k is the Boltzmann constant, and T is the temperature.
At room temperature, the upper and lower energy spin states are almost
equally populated with only a very small excess in the lower energy state
that represents spins aligned with the applied field. The amount of signal in-
tensity that can be observed in any spectroscopic method is proportional to
the population difference between the two energy levels involved. In NMR,
the energy separation of the spin states is comparatively very small, at room
temperature, and while NMR is very informative from a chemistry stand-
point, quantum mechanically it is considered to be an insensitive technique.
Fourier Transform (FT-NMR) NMR instruments are mainly used at the
present time. In FT-NMR, all frequencies in a spectral width are irradiated
simultaneously with a radio frequency pulse. Following the pulse, the nuclei
magnetic moments find themselves in a non-equilibrium condition. They
begin a process called “relaxation”, by which they return to thermal equi-
librium. A time domain emission signal (called free induction decay (FID))
is recorded by the instrument as the nuclei magnetic moments relax back to
equilibrium with the applied magnetic field. A frequency domain spectrum
that we are familiar with is then obtained by Fourier transformation of the
FID.
The precise resonant frequency of the energy transition is dependent on
the effective magnetic field at the nucleus. This field is affected by electron
shielding which is in turn dependent on the chemical environment. As a
result, information about the nucleus’ chemical environment can be derived
from its resonant frequency. In general, the more electronegative the nucleus
is, the higher the resonant frequency. Other factors such as ring currents
(anisotropy) and bond strain affect the frequency shift. The dependence
of the transition energy on the position of a particular atom in a molecule

35 Chapter 3. Materials and Methods
gives NMR spectroscopy it’s utility for structural characterization. The re-
sonance frequencies of different nuclei in an atom are described by a relative
shift compared to the frequency of a standard. This relative shift is called
chemical shift (δ). The effective magnetic field is also affected by the orienta-
tion of neighboring nuclei. This effect is known as spin-spin coupling which
can cause splitting of the signal for each type of nucleus into two or more
lines. The size of the splitting (coupling constant or J) is independent of the
magnetic field and is therefore measured as an absolute frequency (usually
Hertz). The number of splittings indicates the number of chemically bonded
nuclei in the vicinity of the observed nucleus.
In NMR spectroscopy a huge number of pulse sequences and techniques
have been created to overcome the low sensitivity of the method and gain
more information in the study of the structure and dynamic in both che-
mical and biological systems. The most common nuclei observed using this
technique are 1H and 13C, but also 31P, 19F, 29Si and 77Se. The NMR
spectroscopy can be employed for investigations of the molecular structure
and stereochemistry, inter- and intra-molecular interactions, intermolecular
inclusion complex formation, reaction mechanisms, etc., due to the large
number of spectral parameters, such as chemical shifts, spin-spin coupling
constants, Nuclear Overhauser Effect (NOE), translation diffusion and rela-
xation times (T1, T2), that can be measured and analyzed. It is a totally
non-invasive technique, particularly suited to study molecular dynamics and
translational diffusion, and hence structural details in biological and physi-
ological systems [77].
The combined application of diffusion ordered NMR spectroscopy (DOSY)
and measurement of the nuclear spin-lattice relaxation times (T1) offers a
chance to gain insight into the structure of intermolecular aggregates in solu-
tion [77]. DOSY is nowadays a well-established technique for characterizing
the structure and dynamics of complex systems. DOSY provides a means
for “virtual separation” of compounds, by providing a 2D map in which one
axis is the chemical shift while the other is that of the diffusion coefficient
[77]. The method uses a special pulse sequence to obtain a series of NMR
spectra using field gradients and is capable of determining diffusion coeffi-
cients of molecules without any concentration gradient. The intensity of the
detected proton signal belonging to a particular molecular entity at a certain

Chapter 3. Materials and Methods 36
gradient level is dependent mostly on the rate of diffusion of that molecule as
the gradient eliminates more signal intensity of molecules in faster motion.
The analysis of attenuation in signal intensity as a function of diffusion time,
gradient strength, or gradient time (depending on the experimental setup)
provides the related diffusion coefficients [78]. The self-diffusion coefficients
and structural properties of the molecules are connected by the dependence
of their self-diffusion coefficients on the molecular size, weight, shape, etc
[77], [79], [80]. Self-diffusion is the random translational motion of molecules
driven by their internal kinetic energy. Translational diffusion and rotational
diffusion can be distinguished from each other. Diffusion is related to mole-
cular size, as becomes apparent from the Stokes-Einstein equation:
D =kbT
f(3.12)
whereD is the diffusion coefficient, kb is the Boltzmann constant, T is the
temperature, and f is the friction coefficient. Therefore, DOSY experimental
technique has become a valuable tool for studies of molecular interactions
in solution [77].
All NMR experiments have been recorded on a Bruker Avance III 400
spectrometer, operating at 400.15 MHz for protons, equipped with pulse
gradient units, capable of producing magnetic field pulsed gradients in the
z-direction of 50 G/cm. The spectra have been acquired in D2O solution at
30 in 5 mm tubes. Sodium trimethylsilyl-[2,2,3,3-d4]-propionate (TSP)
has been used as an internal standard for both the chemical shift and the dif-
fusion measurements. For NMR analysis of EGCG/P the following samples
were prepared: unloaded (MD/GA), EGCG loaded particles (EGCG/P),
physical mixture of EGCG and unloaded particles (EGCG+MD/GA), and
physical mixtures of EGCG, MD and GA (EGCG+MD+GA), mixing the
components in the same proportion employed in the preparation of EGCG/P.
With the exception of EGCG, in all cases 20 mg of solute, 600 µl D2O and 20
µl 0.05 mM solution of TSP in D2O were used. NMR spectra of EGCG were
recorded in D2O at concentration of 10 mg/ml. Two-dimensional 1H/1H
correlation spectra (COSY) and gradient-selected 1H/13C heteronuclear sin-
gle quantum coherence (HSQC) spectra were recorded using the standard
Bruker software. 2D-COSY spectra were acquired with a multiple quantum
37 Chapter 3. Materials and Methods
filter, gradient pulses for selection, a gradient ratio of 16:12:40 and a rela-
xation delay of 1.5 s. A total of 2048 data points in F2 and 512 data points
in F1 over a spectral width of 6500 Hz were collected. 2D 1H/13C HSQC
experiments via double inept transfer, using sensitivity improvement and
decoupling during the acquisition were carried out with a spectral width of
ca. 6000 Hz for 1H and 28000 Hz for 13C, a relaxation delay of 1.5 s, FT size
2 K Ö 256 W. The two-dimensional nuclear Overhauser effect spectroscopy
(NOESY) experiments were acquired in phase-sensitive mode with gradient
pulses in the mixing time, using the standard pulse sequences with optimized
mixing time of 400 ms. Generally, 64 scans and 512 F1 slices were obtained
and the spectral width in both dimensions was 6500 Hz. The spin-lattice
relaxation rates were measured using the inversion-recovery pulse sequence,
(180°- τ - 90°). Thirty two τ increments were used for the experiments, with
values between 0.01 and 13.0 s and relaxation delay of 13 s. Relaxation
times were calculated by exponential regression analysis of recovery curves
of longitudinal magnetization components. The DOSY experiments were
performed using the bipolar longitudinal eddy current delay (BPPLED -
Bipolar Pulsed Field Gradient Longitudinal Eddy Delay) pulse sequence
[81].The experimental conditions (amount of the solute and the solvent,
temperature, air flow, sample rotation) for all DOSY experiments were kept
constant. Before all NMR experiments, the temperature was equilibrated
and maintained at 30 , as measured using the spectrometer thermocouple
system. The diffusion coefficient of TSP (6.68 × 10⁻¹⁰ m2s−1, calculated
standard deviation of 3.1×10⁻³) obtained from 1H DOSY experiments was
used as an internal reference for the diffusion measurements. The spectra
were recorded in 5 mm NMR tubes with an air flow of 535 l/h. Typically,
in each experiment a number of 32 spectra of 16K data points and 64 scans
were collected, with values for the duration of the magnetic field pulse gra-
dients (δ) of 4 or/and 5 ms, diffusion times (∆) of 160 - 200 ms and an eddy
current delay set to 5 ms. The pulse gradient (g) was incremented from 2 to
95% of the maximum gradient strength in a linear ramp. The spectra were
first processed in the F2 dimension by standard Fourier transform and after
baseline correction the diffusion dimension was processed with the Bruker
Topspin software package (version 2.1). The diffusion coefficients are calcu-
lated by exponential fitting of the data belonging to individual columns of
Chapter 3. Materials and Methods 38
the 2D matrix. The diffusion coefficients (D) were obtained by measuring
the signal intensity at more than one place in the spectra. Between five and
ten different measurements were done for the determination of each diffusion
coefficient. All diffusion coefficients are given as a ratio D/DTSP according
procedure published before [82] and average values have been calculated.
Collagen hydrolysate loaded particles were also studied by NMR. Sam-
ples of CH/P, MD/GA and CH were prepared by dissolving 20 mg of solute
in 600 µl D2O, containing 20 µl solution of TSP (0.05 mM) in D2O. The
NMR and DOSY analysis of these samples were carried out, applying the
procedure described above for EGCG/P.
3.2.6 Antioxidant activity
3.2.6.1 Radical Capacity Scavenging Assay
Several analytical methods are established to evaluate the antioxidant acti-
vity of a large variety of compounds both in pure form and in complex mix-
ture, namely, the 2,2-diphenyl-1-picrylhydrazyl (DPPH*) radical scavenging
capacity assay (RDSC). The DPPH method is based on the scavenging of
the stable DPPH radical by the antioxidant and may be utilized in aqueous
and nonpolar organic solvents and also be used to examine both hydrophilic
and lipophilic antioxidants. The RDSC uses an area under the curve (AUC)
in calculation and reports the RDSC values in trolox equivalents (TE) per
mass of testing material, which makes it possible to compare data from
different laboratories and different times and which may better meet the
needs of antioxidant research. In addition, the high-throughput assay using
DPPH* was demonstrated for possible application in establishing the EC50
values for selected antioxidant samples [83].
Antioxidant activity of free EGCG, EGCG/P and unloaded particles
(MD/GA) was determined according to the RDSC [83] in a 96-well plate,
using a SynergyTM 2 Multi-Detection Microplate Reader (BioTek Instru-
ments, Vermont, USA). Five different EGCG concentrations, between 5.00
and 30.00 µM, were used for free EGCG and EGCG/P analysis. A sample
of unloaded particles was also analyzed. The assay was performed as fol-
lows: 100 µl of DPPH* methanol solution (0.208 mM) was added to 100 µl
of sample into each well, using an eight channel micropipette followed by
39 Chapter 3. Materials and Methods
gentle shaking. The absorption was measured at 515 nm immediately after
shaking and read once per minute for 90 min. A blank with the mixture of
100 µl water and 100 µl methanol, and a control with the mixture of 100 µl
methanol and 100 µl DPPH* (0.208 mM) were also measured. The percen-
tage of radical remaining at 40 min (%DPPH* remaining) was determined
according to the following equation:
%DPPH∗remaining =
Asample −AblankAcontrol −Ablank
× 100 (3.13)
where Asample, Ablank and Acontrol stand for the absorbance of sample,
blank and control reactions at 40 min. EC50 values for the selected antio-
xidant samples were calculated. EC50 represents the required concentration
of a selected antioxidant to reduce the DPPH* concentration to 50% of its
original in the reaction mixture. The EC50 parameter is also commonly
used to evaluate and compare the antioxidant activity and was determined
by plotting the %DPPH* remaining at 40 min against the EGCG concen-
trations. To estimate the total DPPH* scavenging capacity of each sample,
the percentage of DPPH* quenched (%DPPH* quenched) was determined
according to the following equation:
%DPPH∗quenched =
(1−
Asample −AblankAcontrol −Ablank
)× 100 (3.14)
where Asample, Ablank and Acontrol stand for the absorbance of the certain
concentration of a selected sample, blank and the control at 515 nm mea-
sured at the reaction time t. The values of %DPPH* quenched obtained
from equation 3.14 were plotted against the reaction time and the value of
the area under the curve (AUC) was determined. Trolox demonstrated a
linear relation between AUC and concentration changes with a correlation
coefficient (r2) of 0.9982. The RDSC values were determined, according to
equation 3.15:
RDSC =AUCsampleAUCtrolox
× molaritytroloxmolaritysample
(3.15)

Chapter 3. Materials and Methods 40
The RDSC value was determined using a standard curve prepared with
trolox at five concentrations within the linear range of 16-75 µM. Triplicate
reactions were carried out for each concentration of antioxidant sample.
3.2.7 Release studies
3.2.7.1 Dialysis
Membrane diffusion techniques permit the determination of the release of
a variety of drugs from the carrier. The carrier is suspended in a small
volume of the continuous phase, and separated from a large bulk of sink
phase by a dialysis membrane permeable to the drug. The drug diffuses
out of the sample and through the membrane to the sink, wherein it is
periodically assayed [84]. This technique is widely used for studying drug
release kinetics of nanoparticulate carrier systems [85], [86].
EGCG in vitro release studies from EGCG/P were performed using di-
alysis membranes of regenerated cellulose (Spectra/Por, Netherlands).
EGCG/P suspensions (3 ml) were placed into the regenerated cellulose di-
alysis membrane (molecular weight cut-off (MWCO) 1 kDa) and dialyzed
against 80 ml ultrapure water. The dialysis was performed at room tempe-
rature under magnetic stirring. Free EGCG molecules, which diffuse to the
membrane exterior, were monitored by UV-Vis spectroscopy at 276 nm (Syn-
ergyTM 2 Multi-Detection Microplate Reader, BioTek Instruments, USA).
The concentration of EGCG released was calculated from the standard cali-
bration curve of EGCG solution. Antioxidant activity of released EGCG was
studied by High-Throughput Relative DPPH* Radical Scavenging Capacity
Assay, as described above. These studies were performed in triplicates in
identical manner. The in vitro release profile of CH from CH/P was also
investigated by dialysis, applying the procedure reported previously. CH
(25%) loaded particles were suspended in ultrapure water (60 mg/ml), with
constant magnetic stirring in regenerated cellulose dialysis membrane with
a 10 kDa MWCO. CH concentration outside the membrane was monitored
over time by UV-Vis spectroscopy (at 270 nm) and the concentration of CH
released was calculated from the standard calibration curve of CH solution.
These experiments were repeated two times.
41 Chapter 3. Materials and Methods
3.2.8 In vitro cell culture studies
3.2.8.1 Cell line culture
Human prostate carcinoma Du145 cells were grown in surface-treated Nun-
clon culture dishes (Nunc AS, Roskilde, Denmark) using a standard RPMI-
1640 medium supplemented with 10% (v/v) fetal bovine serum, 1% (w/v)
penicillin and streptomycin, and 1% l-glutamine. All cell culture dishes were
maintained at 37 in 95% humidified atmosphere and 5% CO2. For subcul-
turing, approximately 5×10⁵ cells were seeded per 25 cm2 culture flask and
split twice a week. Viable cells were counted using an automated Coulter
counter (Vi-Cell XR, Beckman-Coulter Inc., Miami, FL, USA). For cyto-
toxicity experiments, the cells were harvested from the splitting culture and
seeded in six-well plates (clonogenic assay) or in 25 cm2 flasks (viability and
apoptotic assays) at a density of 200 cells/well and 0.15×10⁶ cells/flask, res-
pectively. Nanoparticles (NPs) were incubated with cells at a concentration
of 0.9 mg/ml (for EGCG/P the mass corresponds to 100 µM EGCG), for
64 h at 37 for viability and apoptotic assays, and at concentrations from
0.009 to 0.9 mg/ml (1-100 µM EGCG) for 9 days at 37 for clonogenic
assay. The medium was not changed or replenished during the incubation
time. After that, the cells were washed with RPMI medium and the assays
were carried out. Only the overall end point effects (cell viability and clono-
genic potential) of both EGCG/P and free EGCG were studied to compare
their activity.
3.2.8.2 Cell viability assay
Cell viability was determined by the MTT (3-[4,5-dimethylthiazol-2-yl]-2,5-
diphenyltetrazolium bromide) reduction assay, which relies on the reduction
of MTT by mitochondrial dehydrogenases. MTT reagent (50 µl/ml of 2
mg/ml MTT) was added to each flask, which was incubated at 37 for
4 h. The cells were then washed twice with ice-cold PBS solution. The
crystallized formazan was subsequently dissolved in DMSO. The absorbance
of the samples was measured at 570 nm using a plate reader (Multiscan EX,
type 355, Labsystems, Helsinki, Finland). Background absorbance values, as
assessed from cell-free wells, were subtracted from the absorption values of
each test sample. Percentage of MTT reduction was calculated by dividing

Chapter 3. Materials and Methods 42
absorbance of the sample by the absorbance of a control (cells treated in
an identical manner but without EGCG or particles). Averages from three
replicates were used for each sample and control.
3.2.8.3 Caspase-3 activation assay
Du145 cells were grown as previously described. EGCG/P were dissolved in
PBS buffer and incubated with cells at an EGCG final concentration of 100
µM for 64 h. Toxicity of the samples was evaluated by activation of caspase-
3, measured using the CASP3C colorimetric 96-well plate assay kit (Sigma,
MO, USA), following the manufacture’s instructions. Caspase-3 is activated
in response to different inducers of apoptosis. Upon activation through pro-
teolytic processing, caspase triggers substrate proteolysis and other changes
that result in chromatin condensation, DNA fragmentation, and ultimately
the apoptotic phenotype. The detection of activated caspase-3 could there-
fore be a valuable and specific tool for identifying apoptotic cells in tissue
sections, even before all the morphological features of apoptosis occur [87].
Briefly, confluent cells were incubated with EGCG (either free or loaded)
and unloaded particles for 64 h. Subsequently, cells were trypsinized, con-
centrated by centrifugation and the cell pellet was lysed in 100 µl hypotonic
lysis buffer (Promega); 40 µl of each cell lysate were used in duplicate to de-
termine caspase-3 activation. The remaining cell lysate was used to measure
total cellular protein concentration with the Fluka protein reagent absorbing
at 595 nm, using bovine serum albumin as standard. Values shown are the
mean of three independent assays.
3.2.8.4 Clonogenic assay
EGCG, free or loaded in carbohydrate particles, was dissolved in PBS buffer
and added to the cells at different concentrations (1, 2, 5, 10, 25, 75 and
100 µM in EGCG content). After the incubation period (9 days), survival
and proliferation of the cells were determined by methylene blue staining.
The medium was discarded and cells were washed with 0.9% NaCl and
fixed with 70% ethanol. The cells were then stained with methylene blue
solution (10% in 0.01% w/v NaOH). The number of colonies with 50 or more
cells/colony was determined. The surviving fraction was calculated by the
43 Chapter 3. Materials and Methods
number of colonies counted divided by the number of colonies plated with a
correction for the plating efficiency (PE), defined as the number of colonies
observed/the number of cells plated of a control sample:
Surviving fraction = Number of colonies/ Number of cells seeded ÖPE
3.2.8.5 Statistical analysis for in vitro studies
Values are reported as mean ±STD. Student’s t-test statistical analysis was
used to determine statistical significance between cells exposed to assay me-
dia and cells exposed to EGCG and EGCG/P.
Chapter 4. EGCG loaded particles 44
Chapter 4
EGCG loaded particles
Contents
4.1 Introduction . . . . . . . . . . . . . . . . . . . . . 44
4.2 Morphology and Structure of EGCG loaded par-
ticles . . . . . . . . . . . . . . . . . . . . . . . . . . 47
4.3 Hydrodynamic Diameter and Zeta Potential of
EGCG loaded particles . . . . . . . . . . . . . . . 52
4.4 Particle internal structure . . . . . . . . . . . . . 55
4.5 Loading Efficiency and Antioxidant Activity . . 57
4.6 Intermolecular interactions of EGCG with par-
ticle wall materials . . . . . . . . . . . . . . . . . . 61
4.6.1 Structure and NMR spectral characterization . . . 61
4.6.2 T1 Relaxation investigation . . . . . . . . . . . . . 65
4.6.3 Diffusion NMR spectroscopy . . . . . . . . . . . . 67
4.7 Release studies . . . . . . . . . . . . . . . . . . . . 69
4.8 Cytotoxicity Studies . . . . . . . . . . . . . . . . . 72
4.9 Conclusions . . . . . . . . . . . . . . . . . . . . . . 76
4.1 Introduction
Epigallocatechin gallate (EGCG) belongs to the group of the polyphenolic
compounds. EGCG chemical structure is illustrated in Figure 4.1.

45 Chapter 4. EGCG loaded particles
Figure 4.1: Chemical structure of EGCG.
Free radicals and oxidative stress (OS) are related to certain degenera-
tive diseases including cancer, cardiovascular disease, diabetes, autoimmune
disorders and neurological disorders [88]. OS can cause cellular damage and
subsequent cell death, because the reactive oxygen species (ROS) oxidize
vital cellular components such as lipids, proteins, and DNA [89]. ROS are
produced in cells, due to a partial reduction of the oxygen molecule during
the cellular metabolism. Free radicals, also classified as ROS, are highly
reactive molecules containing unpaired electrons that cause oxidative stress
[90]. The intermediate steps of oxygen reduction are the formation of the
superoxide anion radical (O−2 ), hydrogen peroxide (H2O2) and hydroxyl ra-
dical (OH·), corresponding to the steps of reduction by one, two and three
electrons, respectively. Further ground-state molecular oxygen (triplet), as a
diradical, can be electronically excited to singlet molecular oxygen [91]. Pe-
roxynitrate (O2NOO−) is a nonradical reactive specie formed from the nitric
oxide and superoxide anion radicals. Singlet oxygen is now recognized as the
main intermediate in photosensitized cell killing [92]. Photosensitized oxida-
tion induces pathological effects such as cell damage, mutations, cell death
and photooxidation of cell constituents, such as proteins and DNA [93].
Singlet oxygen can also be generated by aminoacids and proteins absorbing
ultraviolet [94] or directly by infrared radiation [95], [96]. Singlet oxygen
besides acts as an intermediate for activation or impairment of cell signa-
ling pathways by producing oxidation products, which are either positive or
negative regulators [97]. The half-lives of the major reactive oxygen species
are vastly different, underscoring the necessity for different types of defense
Chapter 4. EGCG loaded particles 46
mechanisms [98]. Cells possess mechanisms that help maintaining their nor-
mal redox balance, ensuring that ROS generation is transitory [89]. What
is the main protective mechanism? Human antioxidant defense is equipped
with enzymatic, hydrophilic scavengers (e.g. flavonoids) and lipophilic sca-
vengers (e.g. tocopherols and carotenoids). Cells synthesize some of these
compounds, but the main part is obtained from dietary sources. The cell’s
ability to produce adequate amounts of antioxidants is determined by age,
inheritance, nutrition and stress [99]. Antioxidant defense mechanisms in-
clude: removal of O2, scavenging reactive oxygen/nitrogen species or their
precursors, inhibition of ROS formation, binding of metal ions needed for
the catalysis of ROS generation and up-regulation of endogenous antioxi-
dant defenses. The protective efficacy of antioxidants depends on the type
of ROS that are generated, the place of generation (body barriers such as
the blood brain barrier reduce the permeability of most antioxidants) and
the severity of the damage [100]. Epidemiological studies have shown that a
diet enriched in antioxidants is associated with reduced risk of such disorders
[90]. Polyphenols from green tea including flavonoids, such as, catechins, are
effective antioxidants because they act as free radical scavengers, and chela-
tors of metal ions [101], thus protecting DNA damage and organelles from
damage. They may protect tissues against free oxygen radicals and lipid
peroxidation. Their biological activities include antithrombotic, vasodila-
tory and anticarcinogenic effects, as well as anti-inflammatory, antiallergic,
antiulcer, antibacterial and antiviral properties [102].
Biological properties of polyphenols depend on their bioavailability, which
includes: availability for absorption, absorption, tissue distribution and
bioactivity [103]. Oral administration is the most efficient delivery system
of antioxidants, but serious pre-systemic eliminations of green tea catechins
had been reported after oral administration. Oral bioavailability (fraction
that enters the bloodstream) of tea catechins is very low, less than 2-5%
[104], [105], and their systemic clearance is also high [104], [106]. Catechins
bioavailability is affected by several factors, such as their chemical proper-
ties, conjugation form in the intestine, intestinal absorption and available
enzymes catalyzing the metabolism. New delivery systems need to be de-
veloped in order to improve catechin solubility, stability, permeability and
bioavailability. Utilization of nanoscale vehicles loaded with antioxidants
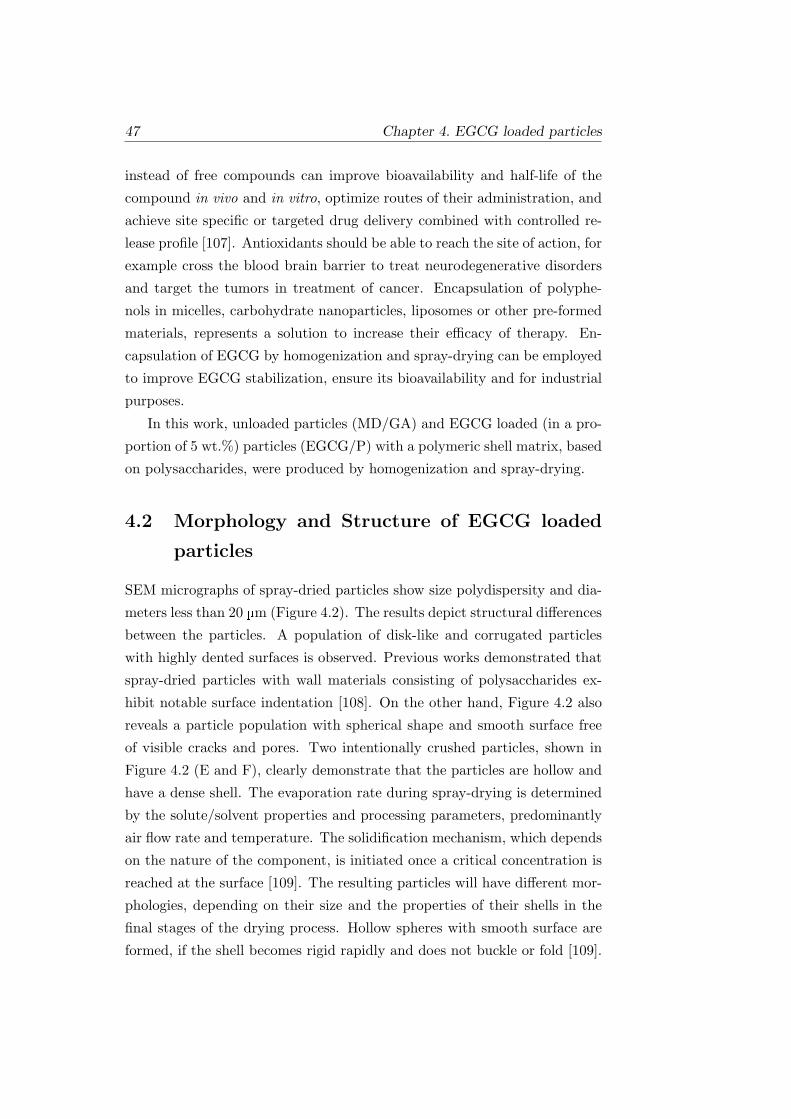
47 Chapter 4. EGCG loaded particles
instead of free compounds can improve bioavailability and half-life of the
compound in vivo and in vitro, optimize routes of their administration, and
achieve site specific or targeted drug delivery combined with controlled re-
lease profile [107]. Antioxidants should be able to reach the site of action, for
example cross the blood brain barrier to treat neurodegenerative disorders
and target the tumors in treatment of cancer. Encapsulation of polyphe-
nols in micelles, carbohydrate nanoparticles, liposomes or other pre-formed
materials, represents a solution to increase their efficacy of therapy. En-
capsulation of EGCG by homogenization and spray-drying can be employed
to improve EGCG stabilization, ensure its bioavailability and for industrial
purposes.
In this work, unloaded particles (MD/GA) and EGCG loaded (in a pro-
portion of 5 wt.%) particles (EGCG/P) with a polymeric shell matrix, based
on polysaccharides, were produced by homogenization and spray-drying.
4.2 Morphology and Structure of EGCG loaded
particles
SEM micrographs of spray-dried particles show size polydispersity and dia-
meters less than 20 µm (Figure 4.2). The results depict structural differences
between the particles. A population of disk-like and corrugated particles
with highly dented surfaces is observed. Previous works demonstrated that
spray-dried particles with wall materials consisting of polysaccharides ex-
hibit notable surface indentation [108]. On the other hand, Figure 4.2 also
reveals a particle population with spherical shape and smooth surface free
of visible cracks and pores. Two intentionally crushed particles, shown in
Figure 4.2 (E and F), clearly demonstrate that the particles are hollow and
have a dense shell. The evaporation rate during spray-drying is determined
by the solute/solvent properties and processing parameters, predominantly
air flow rate and temperature. The solidification mechanism, which depends
on the nature of the component, is initiated once a critical concentration is
reached at the surface [109]. The resulting particles will have different mor-
phologies, depending on their size and the properties of their shells in the
final stages of the drying process. Hollow spheres with smooth surface are
formed, if the shell becomes rigid rapidly and does not buckle or fold [109].
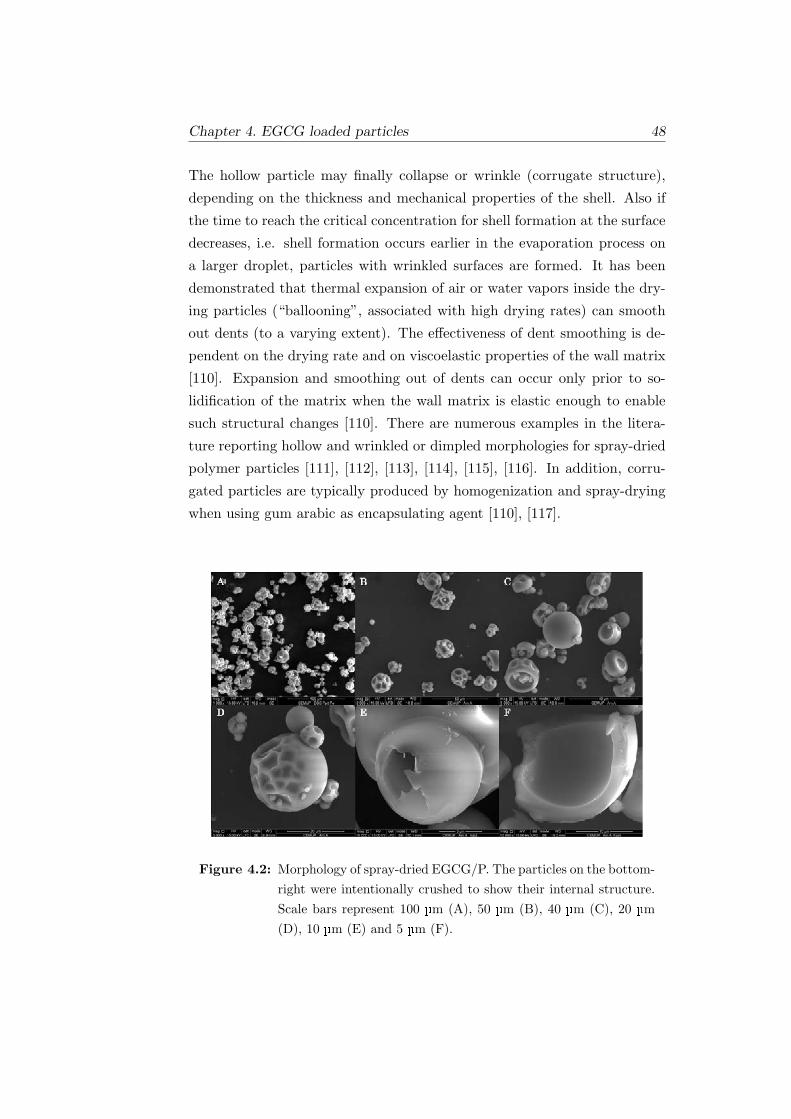
Chapter 4. EGCG loaded particles 48
The hollow particle may finally collapse or wrinkle (corrugate structure),
depending on the thickness and mechanical properties of the shell. Also if
the time to reach the critical concentration for shell formation at the surface
decreases, i.e. shell formation occurs earlier in the evaporation process on
a larger droplet, particles with wrinkled surfaces are formed. It has been
demonstrated that thermal expansion of air or water vapors inside the dry-
ing particles (“ballooning”, associated with high drying rates) can smooth
out dents (to a varying extent). The effectiveness of dent smoothing is de-
pendent on the drying rate and on viscoelastic properties of the wall matrix
[110]. Expansion and smoothing out of dents can occur only prior to so-
lidification of the matrix when the wall matrix is elastic enough to enable
such structural changes [110]. There are numerous examples in the litera-
ture reporting hollow and wrinkled or dimpled morphologies for spray-dried
polymer particles [111], [112], [113], [114], [115], [116]. In addition, corru-
gated particles are typically produced by homogenization and spray-drying
when using gum arabic as encapsulating agent [110], [117].
Figure 4.2: Morphology of spray-dried EGCG/P. The particles on the bottom-right were intentionally crushed to show their internal structure.Scale bars represent 100 µm (A), 50 µm (B), 40 µm (C), 20 µm(D), 10 µm (E) and 5 µm (F).
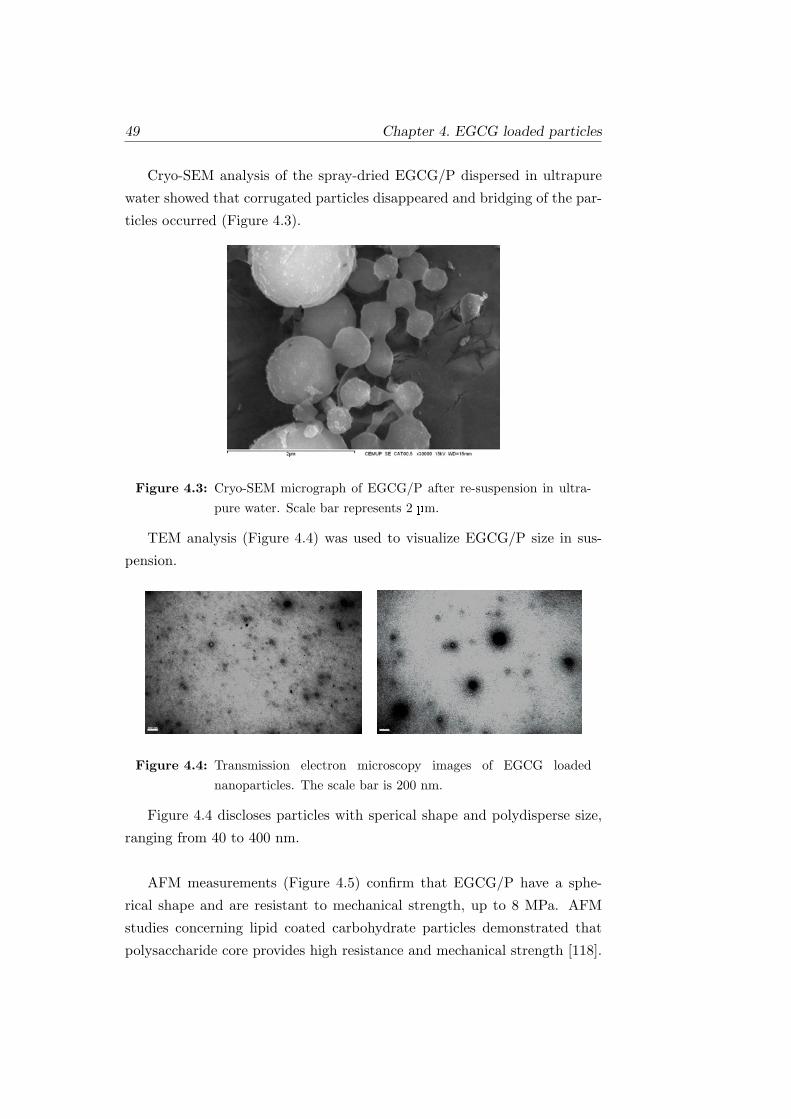
49 Chapter 4. EGCG loaded particles
Cryo-SEM analysis of the spray-dried EGCG/P dispersed in ultrapure
water showed that corrugated particles disappeared and bridging of the par-
ticles occurred (Figure 4.3).
Figure 4.3: Cryo-SEM micrograph of EGCG/P after re-suspension in ultra-pure water. Scale bar represents 2 µm.
TEM analysis (Figure 4.4) was used to visualize EGCG/P size in sus-
pension.
Figure 4.4: Transmission electron microscopy images of EGCG loadednanoparticles. The scale bar is 200 nm.
Figure 4.4 discloses particles with sperical shape and polydisperse size,
ranging from 40 to 400 nm.
AFM measurements (Figure 4.5) confirm that EGCG/P have a sphe-
rical shape and are resistant to mechanical strength, up to 8 MPa. AFM
studies concerning lipid coated carbohydrate particles demonstrated that
polysaccharide core provides high resistance and mechanical strength [118].

Chapter 4. EGCG loaded particles 50
(a)
(b)
(c)
Figure 4.5: AFM height images of EGCG/P. The signed area in image (a) waszoomed (b) to evidence the spherical shape of the particles. Scalebars represent 1 µm (a) and 200 nm (b). The profile analysis ofone particle is shown in image (c).
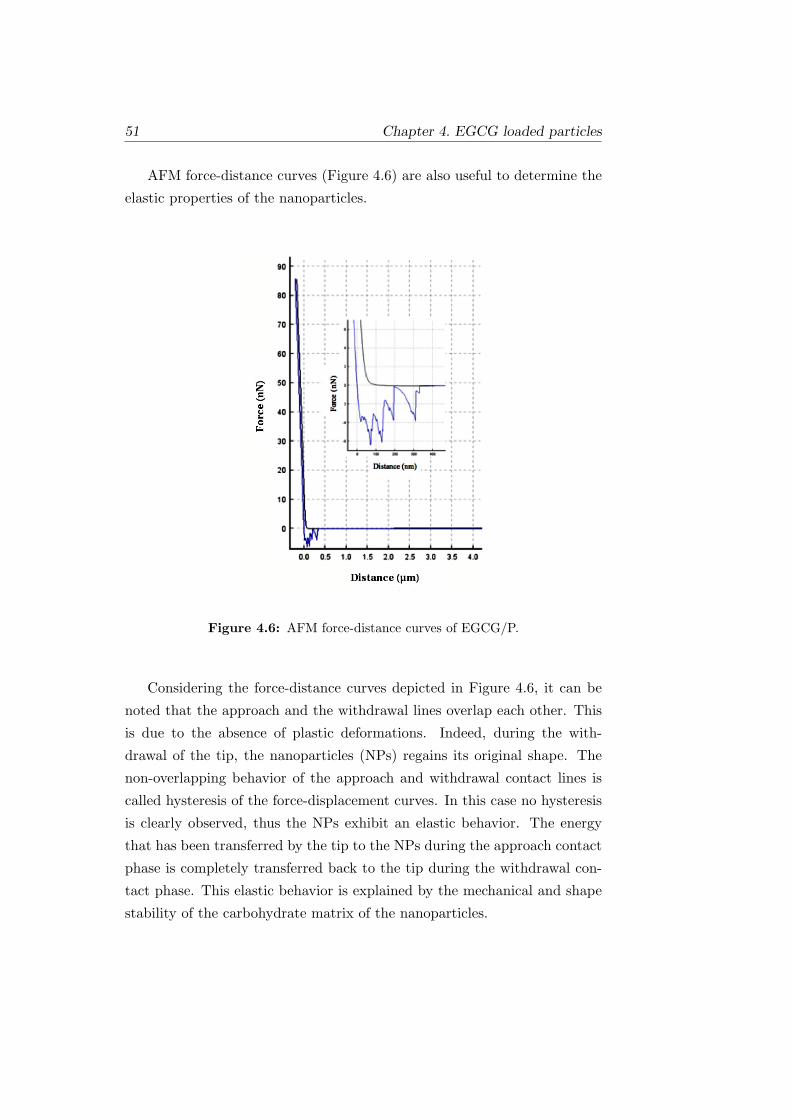
51 Chapter 4. EGCG loaded particles
AFM force-distance curves (Figure 4.6) are also useful to determine the
elastic properties of the nanoparticles.
Figure 4.6: AFM force-distance curves of EGCG/P.
Considering the force-distance curves depicted in Figure 4.6, it can be
noted that the approach and the withdrawal lines overlap each other. This
is due to the absence of plastic deformations. Indeed, during the with-
drawal of the tip, the nanoparticles (NPs) regains its original shape. The
non-overlapping behavior of the approach and withdrawal contact lines is
called hysteresis of the force-displacement curves. In this case no hysteresis
is clearly observed, thus the NPs exhibit an elastic behavior. The energy
that has been transferred by the tip to the NPs during the approach contact
phase is completely transferred back to the tip during the withdrawal con-
tact phase. This elastic behavior is explained by the mechanical and shape
stability of the carbohydrate matrix of the nanoparticles.
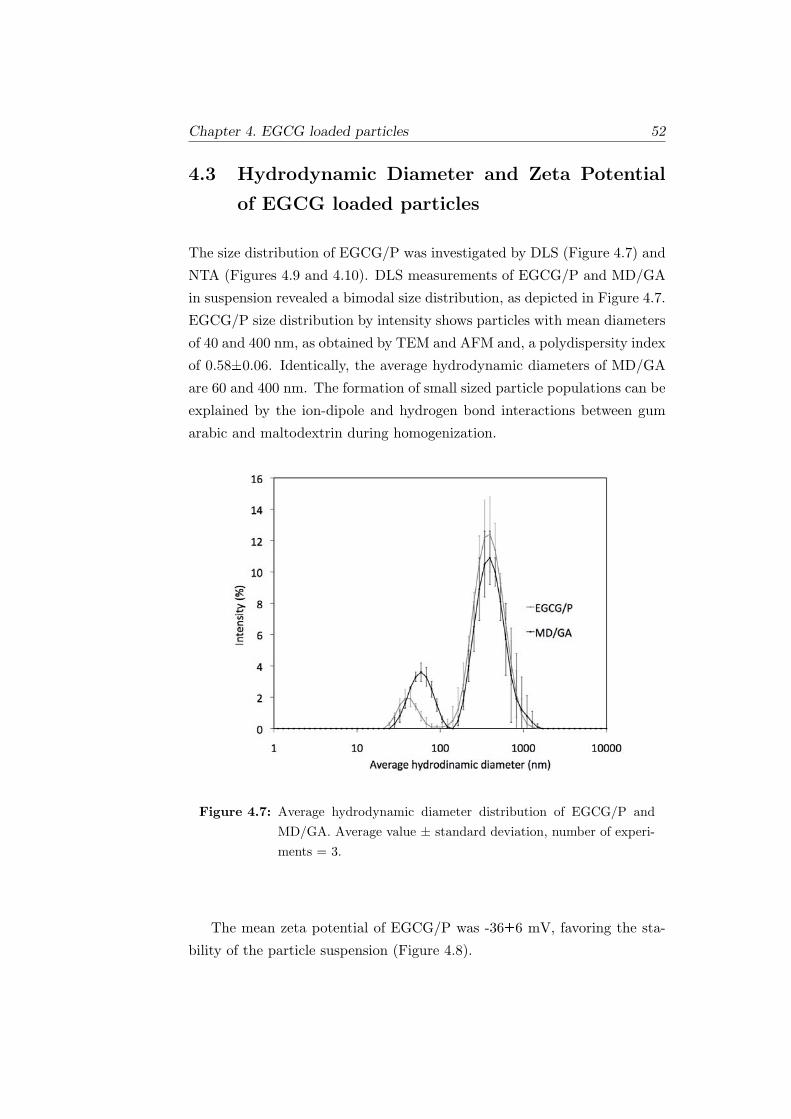
Chapter 4. EGCG loaded particles 52
4.3 Hydrodynamic Diameter and Zeta Potential
of EGCG loaded particles
The size distribution of EGCG/P was investigated by DLS (Figure 4.7) and
NTA (Figures 4.9 and 4.10). DLS measurements of EGCG/P and MD/GA
in suspension revealed a bimodal size distribution, as depicted in Figure 4.7.
EGCG/P size distribution by intensity shows particles with mean diameters
of 40 and 400 nm, as obtained by TEM and AFM and, a polydispersity index
of 0.58±0.06. Identically, the average hydrodynamic diameters of MD/GA
are 60 and 400 nm. The formation of small sized particle populations can be
explained by the ion-dipole and hydrogen bond interactions between gum
arabic and maltodextrin during homogenization.
Figure 4.7: Average hydrodynamic diameter distribution of EGCG/P andMD/GA. Average value ± standard deviation, number of experi-ments = 3.
The mean zeta potential of EGCG/P was -36±6 mV, favoring the sta-
bility of the particle suspension (Figure 4.8).

53 Chapter 4. EGCG loaded particles
Figure 4.8: Zeta Potential of EGCG/P.
NTA is based on a laser illuminate microscopic techinque, as EGCG/P
are very weak scatterers, therefore to be able to observe the smallest par-
ticles, it was necessary to use blue laser and a more sensitive camera (an-
dor). As a consequence of using an andor camera, it wasn’t possible to use
Extended Dynamic Range to track and size accurately all particles in one
analysis (Figure 4.9). For this reason the sample was analysed in parts,
according to their size range in different dilutions (Figure 4.10).
(a) (b)
Figure 4.9: Nanoparticle tracking analysis of EGCG/P: (a) Concentration(particles ×108/ml) vs particle diameter (nm). (b) 3D plot ofparticle diameter, x (nm) vs concentration, y (particles ×108/ml)and relative scatter intensity, z (log scale).
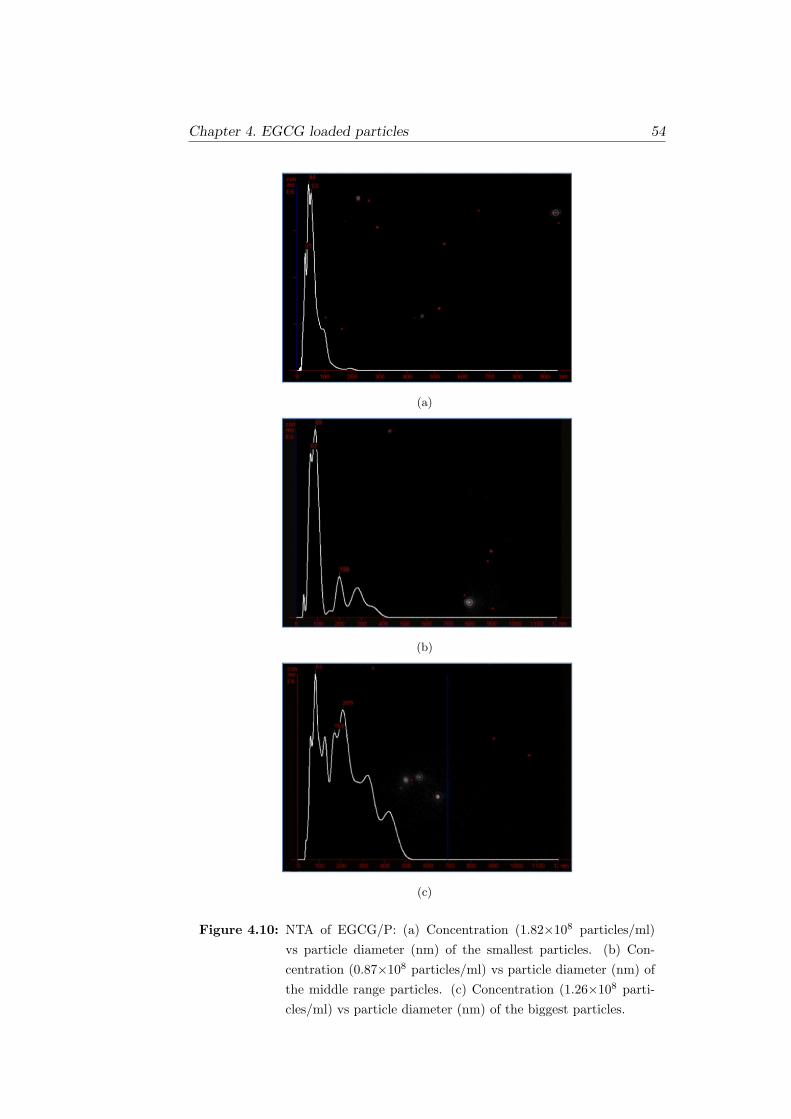
Chapter 4. EGCG loaded particles 54
(a)
(b)
(c)
Figure 4.10: NTA of EGCG/P: (a) Concentration (1.82×10⁸ particles/ml)vs particle diameter (nm) of the smallest particles. (b) Con-centration (0.87×10⁸ particles/ml) vs particle diameter (nm) ofthe middle range particles. (c) Concentration (1.26×10⁸ parti-cles/ml) vs particle diameter (nm) of the biggest particles.
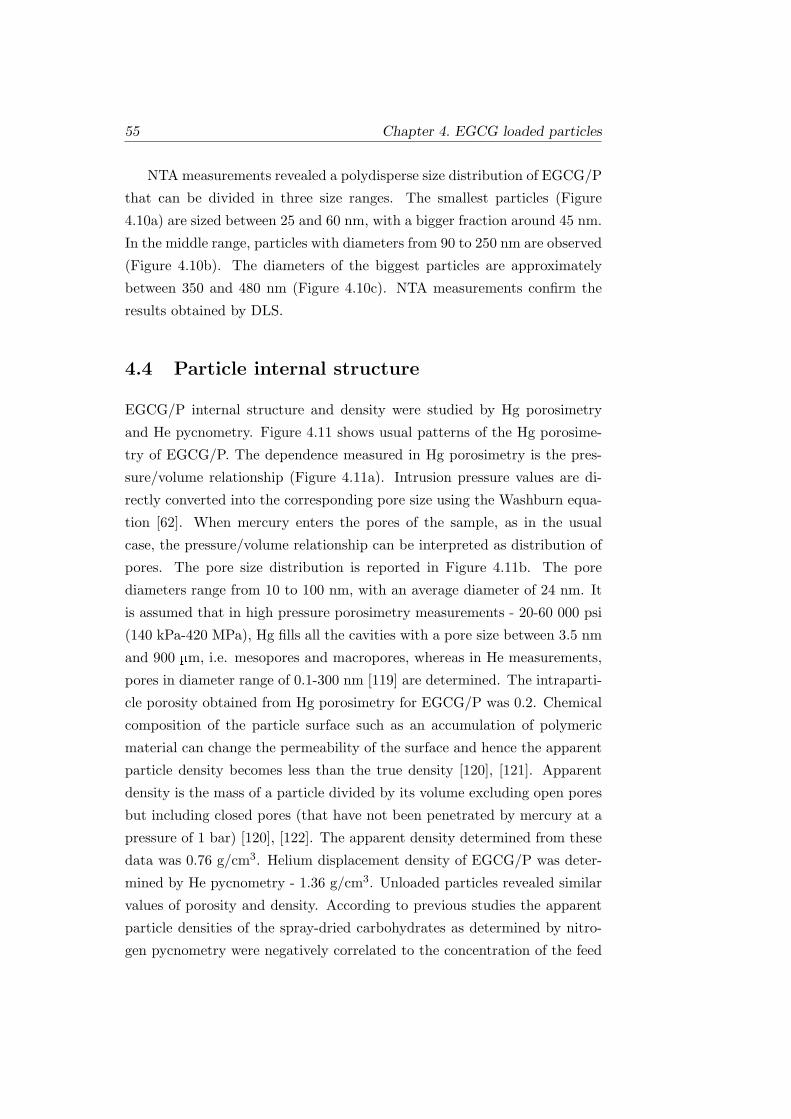
55 Chapter 4. EGCG loaded particles
NTA measurements revealed a polydisperse size distribution of EGCG/P
that can be divided in three size ranges. The smallest particles (Figure
4.10a) are sized between 25 and 60 nm, with a bigger fraction around 45 nm.
In the middle range, particles with diameters from 90 to 250 nm are observed
(Figure 4.10b). The diameters of the biggest particles are approximately
between 350 and 480 nm (Figure 4.10c). NTA measurements confirm the
results obtained by DLS.
4.4 Particle internal structure
EGCG/P internal structure and density were studied by Hg porosimetry
and He pycnometry. Figure 4.11 shows usual patterns of the Hg porosime-
try of EGCG/P. The dependence measured in Hg porosimetry is the pres-
sure/volume relationship (Figure 4.11a). Intrusion pressure values are di-
rectly converted into the corresponding pore size using the Washburn equa-
tion [62]. When mercury enters the pores of the sample, as in the usual
case, the pressure/volume relationship can be interpreted as distribution of
pores. The pore size distribution is reported in Figure 4.11b. The pore
diameters range from 10 to 100 nm, with an average diameter of 24 nm. It
is assumed that in high pressure porosimetry measurements - 20-60 000 psi
(140 kPa-420 MPa), Hg fills all the cavities with a pore size between 3.5 nm
and 900 µm, i.e. mesopores and macropores, whereas in He measurements,
pores in diameter range of 0.1-300 nm [119] are determined. The intraparti-
cle porosity obtained from Hg porosimetry for EGCG/P was 0.2. Chemical
composition of the particle surface such as an accumulation of polymeric
material can change the permeability of the surface and hence the apparent
particle density becomes less than the true density [120], [121]. Apparent
density is the mass of a particle divided by its volume excluding open pores
but including closed pores (that have not been penetrated by mercury at a
pressure of 1 bar) [120], [122]. The apparent density determined from these
data was 0.76 g/cm3. Helium displacement density of EGCG/P was deter-
mined by He pycnometry - 1.36 g/cm3. Unloaded particles revealed similar
values of porosity and density. According to previous studies the apparent
particle densities of the spray-dried carbohydrates as determined by nitro-
gen pycnometry were negatively correlated to the concentration of the feed
Chapter 4. EGCG loaded particles 56
solution during spray drying: 1.54 g/cm3, 1.45 g/cm3 for lactose 5% and lac-
tose 20% w/w, respectively; and 1.52 g/cm3, 1.33 g/cm3 for sucrose/dextran
20% w/w and sucrose/dextran 50% w/w, respectively. The apparent parti-
cle density of mannitol 15% w/w was 1.47 g/cm3 [119]. Apparent particle
densities close to the true density of the materials are correlated to either a
network-like structure (porous solid) or completely gas permeable particles
[121]. In contrast, lower apparent densities seem to be related to hollow par-
ticle appearance, which is corroborated by our results (Figure 4.2). Particle
structure and density have been related to the crystallization propensity of
carbohydrates. Hollow particles were shown to be formed by amorphous
carbohydrates (e.g. lactose), whereas particles with network-like structure
(porous solid) were more likely to be obtained from crystalline carbohy-
drates (e.g. mannitol) [109], [120]. Both gum arabic and maltodextrin are
amorphous materials and film forming excipients [123] thus prone to form
hollow particles.
(a) (b)
Figure 4.11: Curves for EGCG/P obtained from Hg porosimetry: pres-sure/volume dependence (a) and pore size distribution (b).
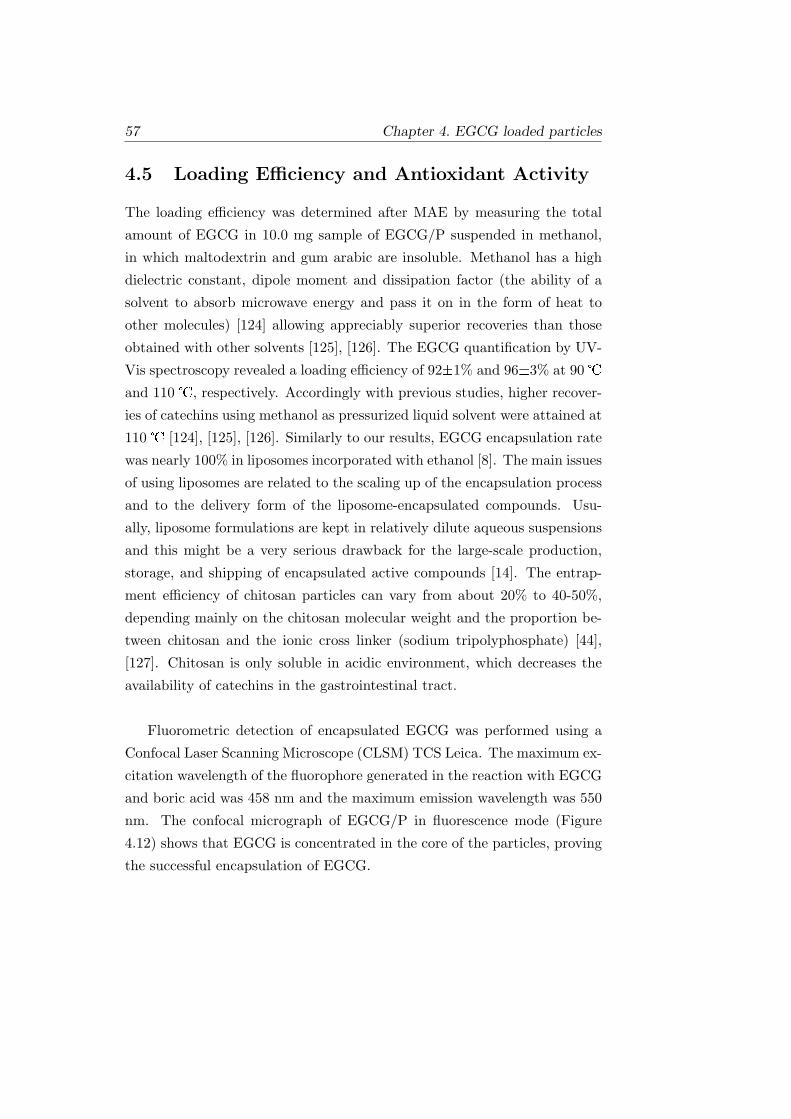
57 Chapter 4. EGCG loaded particles
4.5 Loading Efficiency and Antioxidant Activity
The loading efficiency was determined after MAE by measuring the total
amount of EGCG in 10.0 mg sample of EGCG/P suspended in methanol,
in which maltodextrin and gum arabic are insoluble. Methanol has a high
dielectric constant, dipole moment and dissipation factor (the ability of a
solvent to absorb microwave energy and pass it on in the form of heat to
other molecules) [124] allowing appreciably superior recoveries than those
obtained with other solvents [125], [126]. The EGCG quantification by UV-
Vis spectroscopy revealed a loading efficiency of 92±1% and 96±3% at 90
and 110 , respectively. Accordingly with previous studies, higher recover-
ies of catechins using methanol as pressurized liquid solvent were attained at
110 [124], [125], [126]. Similarly to our results, EGCG encapsulation rate
was nearly 100% in liposomes incorporated with ethanol [8]. The main issues
of using liposomes are related to the scaling up of the encapsulation process
and to the delivery form of the liposome-encapsulated compounds. Usu-
ally, liposome formulations are kept in relatively dilute aqueous suspensions
and this might be a very serious drawback for the large-scale production,
storage, and shipping of encapsulated active compounds [14]. The entrap-
ment efficiency of chitosan particles can vary from about 20% to 40-50%,
depending mainly on the chitosan molecular weight and the proportion be-
tween chitosan and the ionic cross linker (sodium tripolyphosphate) [44],
[127]. Chitosan is only soluble in acidic environment, which decreases the
availability of catechins in the gastrointestinal tract.
Fluorometric detection of encapsulated EGCG was performed using a
Confocal Laser Scanning Microscope (CLSM) TCS Leica. The maximum ex-
citation wavelength of the fluorophore generated in the reaction with EGCG
and boric acid was 458 nm and the maximum emission wavelength was 550
nm. The confocal micrograph of EGCG/P in fluorescence mode (Figure
4.12) shows that EGCG is concentrated in the core of the particles, proving
the successful encapsulation of EGCG.

Chapter 4. EGCG loaded particles 58
Figure 4.12: Confocal slicing of encapsulated EGCG. The scale bar is 1 µm.
ATR-IR spectrum of EGCG/P (Figure 4.13) shows two absorption bands
at 1560 cm−1 and 1475 cm−1, not present in the spectrum of unloaded par-
ticles, which are attributed to C=C stretching of aromatic rings [128]. The
results confirm that EGCG molecules are incorporated in the carbohydrate
matrix by intermolecular dipole-dipole interactions, since no chemical inte-
raction was detected. In addition, this also indicates that EGCG chemical
integrity was maintained after the spray-drying process.
Figure 4.13: ATR-IR spectra of EGCG/P (black line) and unloaded particles(gray line). The inset shows the spectrum of free EGCG.
Figure 4.14 represents the values of DPPH* quenched at different EGCG
concentrations for both free EGCG and EGCG/P samples.
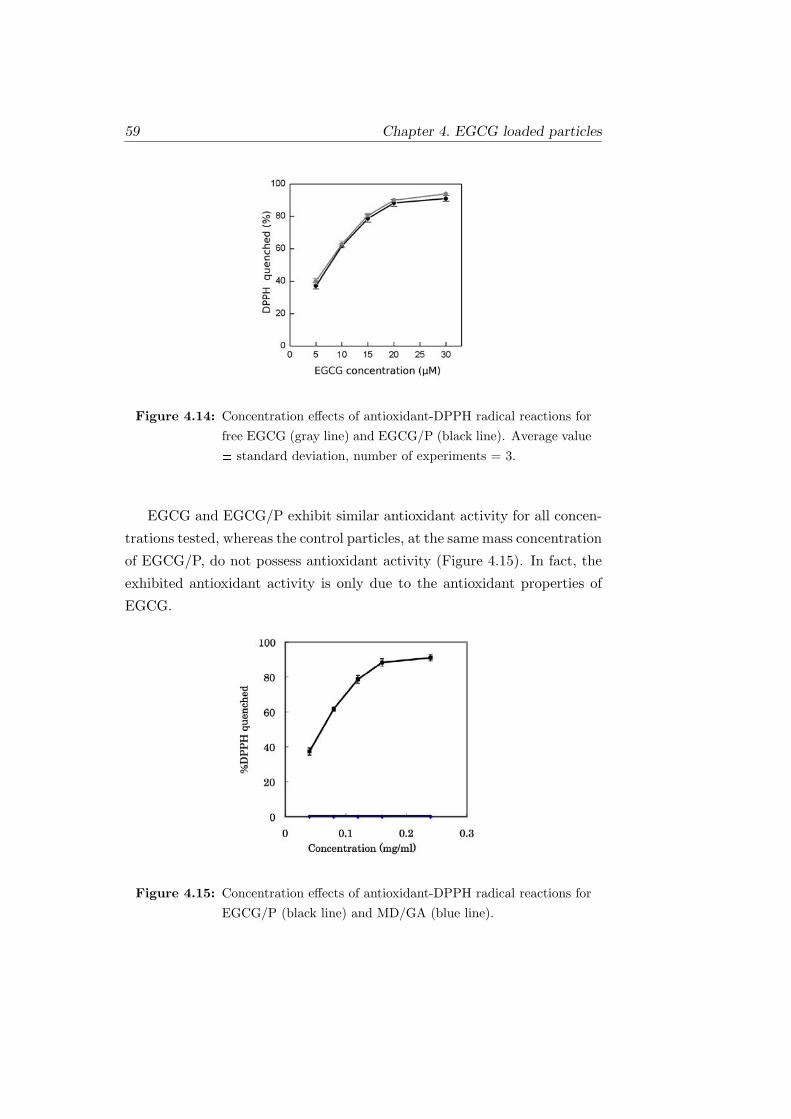
59 Chapter 4. EGCG loaded particles
Figure 4.14: Concentration effects of antioxidant-DPPH radical reactions forfree EGCG (gray line) and EGCG/P (black line). Average value± standard deviation, number of experiments = 3.
EGCG and EGCG/P exhibit similar antioxidant activity for all concen-
trations tested, whereas the control particles, at the same mass concentration
of EGCG/P, do not possess antioxidant activity (Figure 4.15). In fact, the
exhibited antioxidant activity is only due to the antioxidant properties of
EGCG.
Figure 4.15: Concentration effects of antioxidant-DPPH radical reactions forEGCG/P (black line) and MD/GA (blue line).

Chapter 4. EGCG loaded particles 60
The EC50 average values attained for free EGCG and EGCG/P were
7.3±0.5 and 7.6±0.3 µM, respectively. RDSC values of free EGCG and
EGCG/P at several concentrations are presented in Table 4.1.
Table 4.1: Relative DPPH* Scavenging Capacity (RDSC) of free EGCG andEGCG/P at different concentrations.
Standard concentration (µM) RDSC value (µM TE/µM) 1
Free EGCG EGCG/P
5.00 8.02±0.37 7.48±0.51
10.00 6.03±0.10 6.12±0.29
15.00 5.25±0.06 5.37±0.14
20.00 4.57±0.08 4.62±0.16
30.00 3.42±0.01 3.34±0.05
1Data correspond to the mean ± standard deviation of triplicate measurements.
RDSC is expressed in terms of trolox equivalents (TE) per unit of EGCG
in order to compare the free radical scavenging capacities of antioxidants.
Trolox can be applied to report the relative radical scavenging capacities
of both hydrophilic and lipophilic antioxidants, which allow to compare di-
rectly the DPPH* scavenging capacities of these antioxidants [83]. The study
confirmed that EC50 values and RDSC determined at different concentra-
tions are similar for both EGCG free and EGCG/P, which demonstrates
that the loading method preserved the original antioxidant properties of the
EGCG. The main objective of this study was to provide information about
the antioxidant and radical scavenging potential of EGCG before and after
incorporation in the carbohydrate matrix. The results obtained from these
experiments demonstrated that free EGCG and EGCG/P manifested strong
antioxidant and radical scavenging activities.
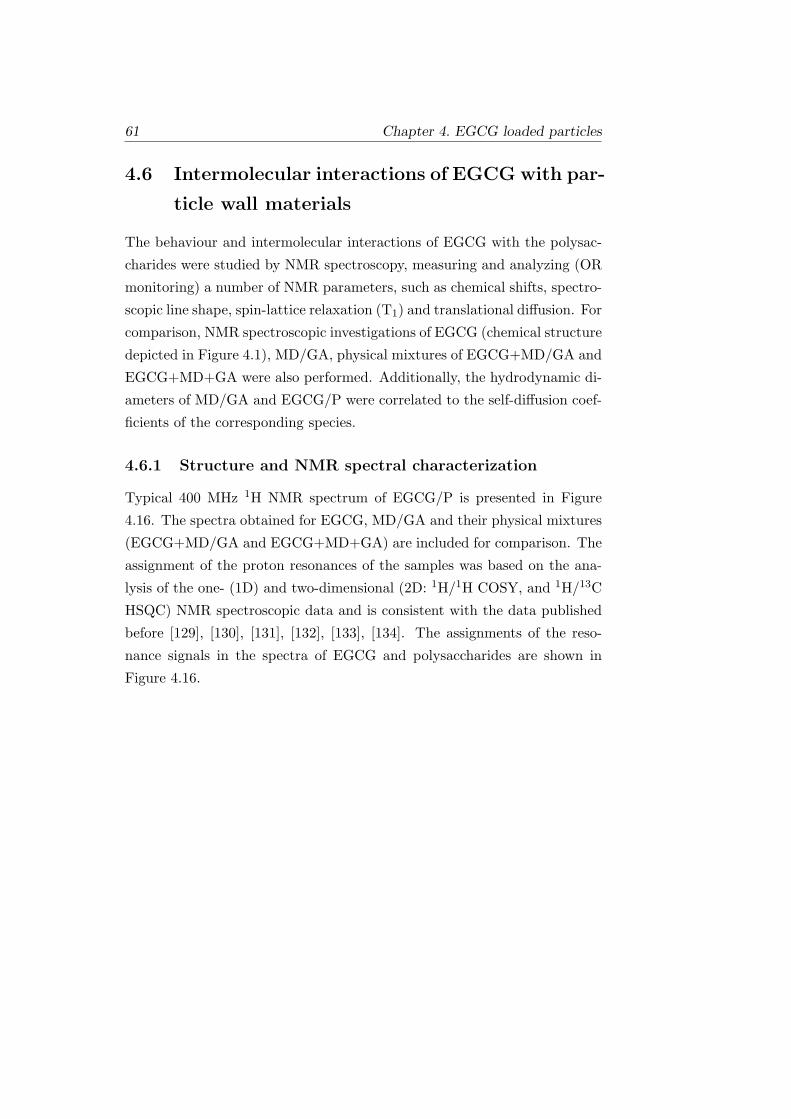
61 Chapter 4. EGCG loaded particles
4.6 Intermolecular interactions of EGCG with par-
ticle wall materials
The behaviour and intermolecular interactions of EGCG with the polysac-
charides were studied by NMR spectroscopy, measuring and analyzing (OR
monitoring) a number of NMR parameters, such as chemical shifts, spectro-
scopic line shape, spin-lattice relaxation (T1) and translational diffusion. For
comparison, NMR spectroscopic investigations of EGCG (chemical structure
depicted in Figure 4.1), MD/GA, physical mixtures of EGCG+MD/GA and
EGCG+MD+GA were also performed. Additionally, the hydrodynamic di-
ameters of MD/GA and EGCG/P were correlated to the self-diffusion coef-
ficients of the corresponding species.
4.6.1 Structure and NMR spectral characterization
Typical 400 MHz 1H NMR spectrum of EGCG/P is presented in Figure
4.16. The spectra obtained for EGCG, MD/GA and their physical mixtures
(EGCG+MD/GA and EGCG+MD+GA) are included for comparison. The
assignment of the proton resonances of the samples was based on the ana-
lysis of the one- (1D) and two-dimensional (2D: 1H/1H COSY, and 1H/13C
HSQC) NMR spectroscopic data and is consistent with the data published
before [129], [130], [131], [132], [133], [134]. The assignments of the reso-
nance signals in the spectra of EGCG and polysaccharides are shown in
Figure 4.16.
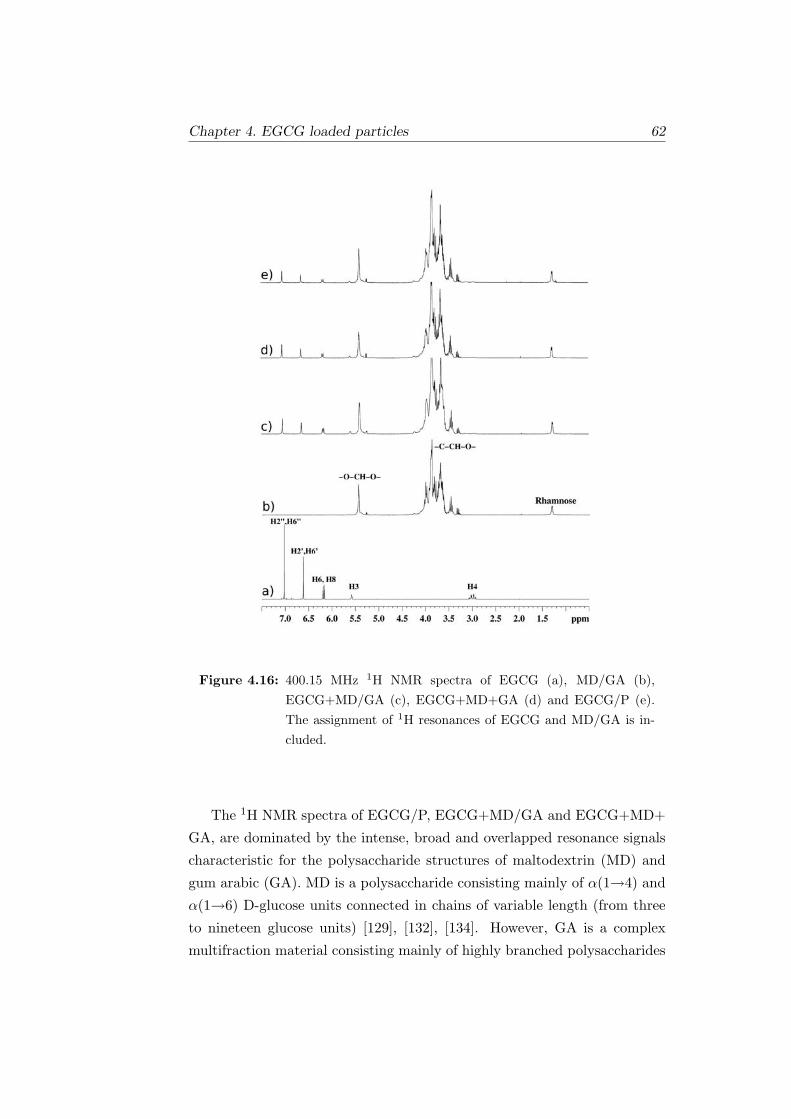
Chapter 4. EGCG loaded particles 62
Figure 4.16: 400.15 MHz 1H NMR spectra of EGCG (a), MD/GA (b),EGCG+MD/GA (c), EGCG+MD+GA (d) and EGCG/P (e).The assignment of 1H resonances of EGCG and MD/GA is in-cluded.
The 1H NMR spectra of EGCG/P, EGCG+MD/GA and EGCG+MD+
GA, are dominated by the intense, broad and overlapped resonance signals
characteristic for the polysaccharide structures of maltodextrin (MD) and
gum arabic (GA). MD is a polysaccharide consisting mainly of α(1→4) and
α(1→6) D-glucose units connected in chains of variable length (from three
to nineteen glucose units) [129], [132], [134]. However, GA is a complex
multifraction material consisting mainly of highly branched polysaccharides
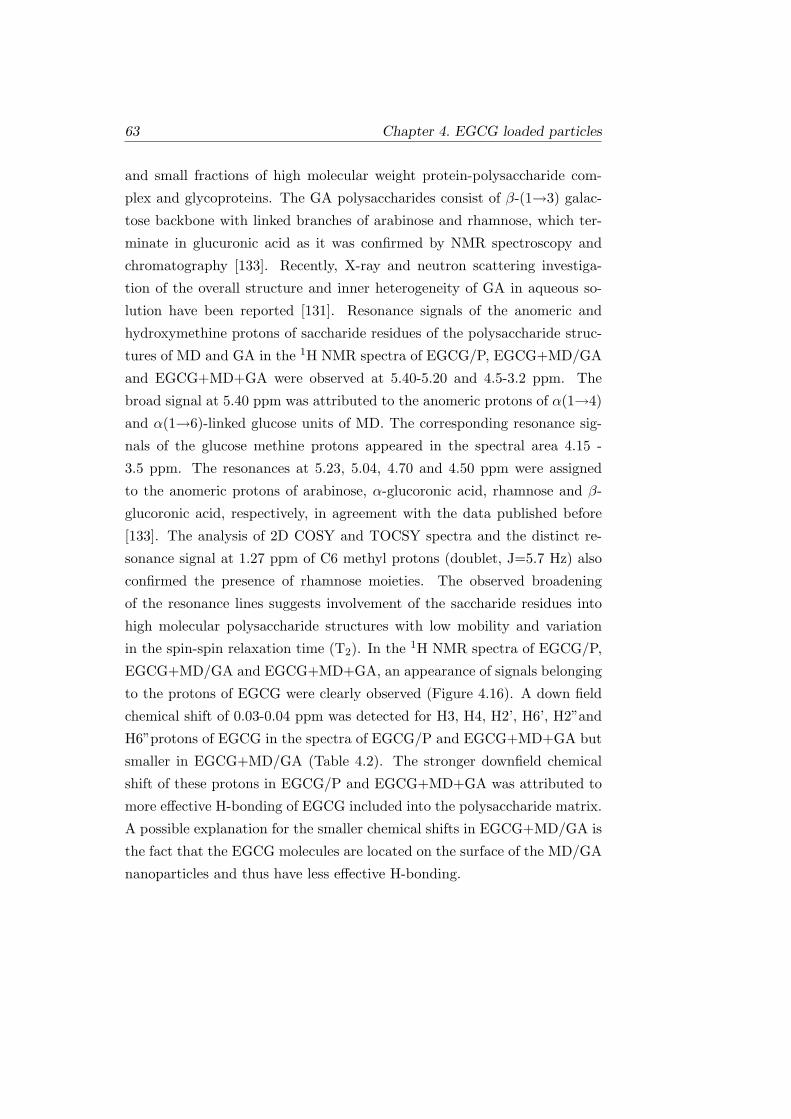
63 Chapter 4. EGCG loaded particles
and small fractions of high molecular weight protein-polysaccharide com-
plex and glycoproteins. The GA polysaccharides consist of β-(1→3) galac-
tose backbone with linked branches of arabinose and rhamnose, which ter-
minate in glucuronic acid as it was confirmed by NMR spectroscopy and
chromatography [133]. Recently, X-ray and neutron scattering investiga-
tion of the overall structure and inner heterogeneity of GA in aqueous so-
lution have been reported [131]. Resonance signals of the anomeric and
hydroxymethine protons of saccharide residues of the polysaccharide struc-
tures of MD and GA in the 1H NMR spectra of EGCG/P, EGCG+MD/GA
and EGCG+MD+GA were observed at 5.40-5.20 and 4.5-3.2 ppm. The
broad signal at 5.40 ppm was attributed to the anomeric protons of α(1→4)
and α(1→6)-linked glucose units of MD. The corresponding resonance sig-
nals of the glucose methine protons appeared in the spectral area 4.15 -
3.5 ppm. The resonances at 5.23, 5.04, 4.70 and 4.50 ppm were assigned
to the anomeric protons of arabinose, α-glucoronic acid, rhamnose and β-
glucoronic acid, respectively, in agreement with the data published before
[133]. The analysis of 2D COSY and TOCSY spectra and the distinct re-
sonance signal at 1.27 ppm of C6 methyl protons (doublet, J=5.7 Hz) also
confirmed the presence of rhamnose moieties. The observed broadening
of the resonance lines suggests involvement of the saccharide residues into
high molecular polysaccharide structures with low mobility and variation
in the spin-spin relaxation time (T2). In the 1H NMR spectra of EGCG/P,
EGCG+MD/GA and EGCG+MD+GA, an appearance of signals belonging
to the protons of EGCG were clearly observed (Figure 4.16). A down field
chemical shift of 0.03-0.04 ppm was detected for H3, H4, H2’, H6’, H2”and
H6”protons of EGCG in the spectra of EGCG/P and EGCG+MD+GA but
smaller in EGCG+MD/GA (Table 4.2). The stronger downfield chemical
shift of these protons in EGCG/P and EGCG+MD+GA was attributed to
more effective H-bonding of EGCG included into the polysaccharide matrix.
A possible explanation for the smaller chemical shifts in EGCG+MD/GA is
the fact that the EGCG molecules are located on the surface of the MD/GA
nanoparticles and thus have less effective H-bonding.

Chapter 4. EGCG loaded particles 64
Table 4.2: Selected 1H chemical shifts (in ppm) and chemical shift differenceswith respect to pure EGCG (in italics) of EGCG, EGCG+MD/GA,EGCG+MD+GA and EGCG/P.
Proton EGCG EGCG+MD/GA EGCG+MD+GA EGCG/P
H2”, H6” 7.018 7.046 7.047 7.048
0.028 0.029 0.030
H2’, H6’ 6.604 6.637 6.643 6.645
0.033 0.039 0.041
H6, H8 6.17 6.184 6.177 6.175
0.014 0.007 0.005
H3 5.567 5.581 5.597 5.598
0.014 0.030 0.031
H4 2.984 3.017 3.033 3.033
0.033 0.049 0.049
Despite the 1H/1H NOESY spectra of EGCG/P (Figure 4.17) being
dominated by nuclear Overhauser effects (NOE) between the protons belon-
ging to the polysaccharide chains, weak signals were detected due to inter-
molecular dipole-dipole interactions between H2”, H6” protons of EGCG
(7.05 ppm) and glucose methine protons of MD/GA in the spectral area
4.15-3.5 ppm. The dipole-dipole interactions between EGCG and MD/GA
protons confirm the entrapment of EGCG into the polysaccharide matrix of
maltodextrin-gum arabic of EGCG/P.
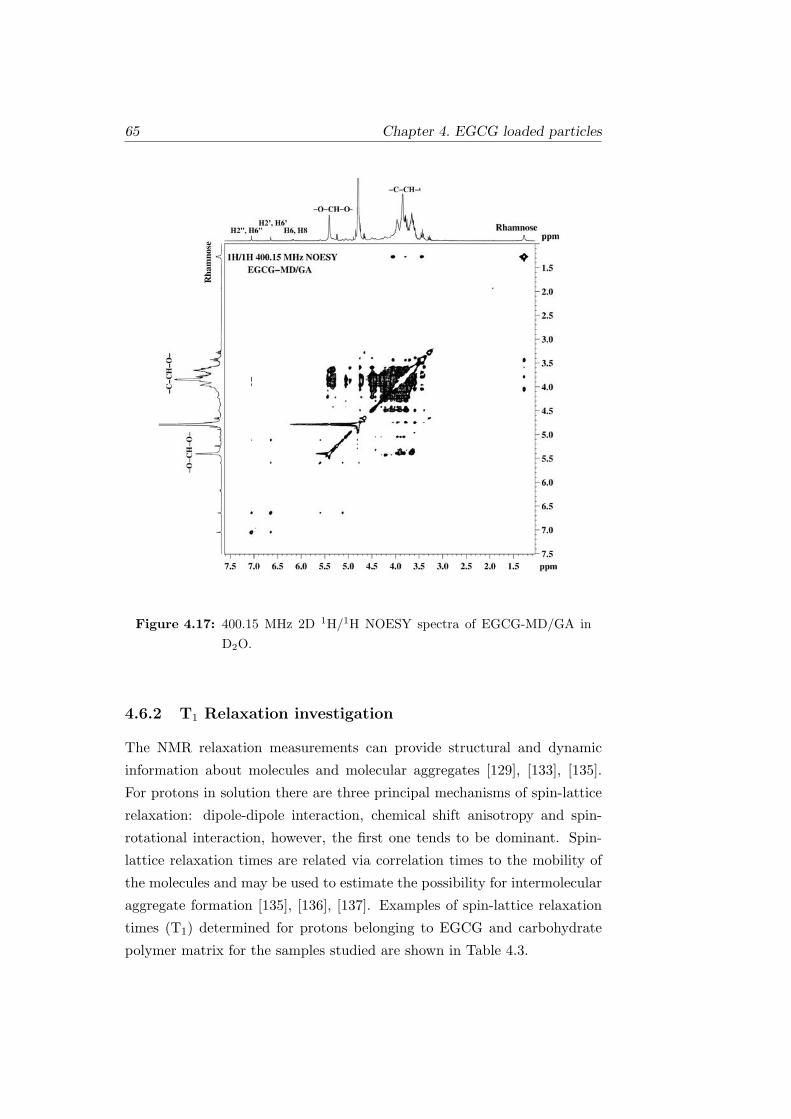
65 Chapter 4. EGCG loaded particles
Figure 4.17: 400.15 MHz 2D 1H/1H NOESY spectra of EGCG-MD/GA inD2O.
4.6.2 T1 Relaxation investigation
The NMR relaxation measurements can provide structural and dynamic
information about molecules and molecular aggregates [129], [133], [135].
For protons in solution there are three principal mechanisms of spin-lattice
relaxation: dipole-dipole interaction, chemical shift anisotropy and spin-
rotational interaction, however, the first one tends to be dominant. Spin-
lattice relaxation times are related via correlation times to the mobility of
the molecules and may be used to estimate the possibility for intermolecular
aggregate formation [135], [136], [137]. Examples of spin-lattice relaxation
times (T1) determined for protons belonging to EGCG and carbohydrate
polymer matrix for the samples studied are shown in Table 4.3.

Chapter 4. EGCG loaded particles 66
Table 4.3: Selected spin-lattice relaxation times (T1, in s) determined for se-lected 1H chemical shifts (in ppm) belonging to EGCG, MD andGA in D2O at 30 .
SampleEGCG (δ, ppm) MD and GA (δ, ppm)
7.03 6.6 6.17 5.4 5.23 4.1-3.5 3.4 3.3 1.28
EGCG 1.691 1.242 1.833
MD/GA 0.907 1.958 0.558 1.339 2.017 0.715
EGCG+MD/GA 1.384 1.149 1.379 0.885 1.908 0.576 1.323 2.002 0.693
EGCG+MD+GA 1.321 1.115 1.316 0.875 1.828 0.559 1.323 2.142 0.701
EGCG/P 1.26 1.021 1.275 0.889 1.818 0.56 1.304 1.941 0.666
The relaxation times of protons from the individual functional groups
of EGCG and polysaccharides MD and GA vary according to their internal
mobility but the overall trends observed were identical for all groups. Only
insignificant T1 s alterations were detected for MD and GA protons in the
presence of EGCG probably due to more effective dipole-dipole interaction
between the rigid polymer molecules and EGCG. The relaxation times of
EGCG protons were significantly longer than when it was encapsulated or
physically mixed with MD/GA or MD+GA. Considering the complex struc-
tures and the high molecular weight of the species presented into MD and
GA, the decreased T1 s of EGCG were attributed mainly to the increased
viscosity of the medium. It is significant to note that the measured rela-
xation times of EGCG in both physical mixtures were closely similar but
longer than those in EGCG/P, even though the samples have been pre-
pared at the same concentration and no difference in the viscosity could
be assumed. This indicates that the microenvironments of the protons of
EGCG in the EGCG/P and both physical mixtures (EGCG+MD/GA and
EGCG+MD+GA) are different. The results strongly suggest that in the
case of EGCG/P the EGCG molecules are entrapped into the MD/GA ma-
trix of the nanoparticles.
67 Chapter 4. EGCG loaded particles
4.6.3 Diffusion NMR spectroscopy
Diffusion ordered NMR spectroscopy (DOSY) was used to analyze overall
structure of EGCG/P, to clarify the origin of the EGCG-polysaccharide
interactions and to locate the EGCG molecules into the MD/GA matrix.
The pulsed field gradient spin echo NMR technique is a straightforward
procedure for measuring the diffusion coefficients of individual species. Par-
ticularly, useful information can be obtained regarding the size, molecular
weight and shape of the species in solution under given conditions. In or-
der to get insight into the structural modifications of the species presented
in the EGCG/P and to account for changes in the solvent viscosity and
minor fluctuations of samples temperature, it was useful to use an inter-
nal diffusion reference [79], [82], [77]. Since modifications of the solution
composition could induced changes in the viscosity and these changes affect
equally all species in the solution, the use of reference allows one to take
into account the variation in solvent properties and correct the measured
diffusion values [82]. The reference compounds should have chemical inert-
ness, well resolved signals, negligible diffusion coefficient dependence on the
solutes concentration and ideally presented already in the solution as either
reference for chemical shifts or quantitative determination. Therefore, we
found it useful to use TSP not only as chemical shift reference but also as
an internal diffusion reference and all diffusion coefficients presented in Ta-
ble 4.4 are given as a ratio D/DTSP according procedure published before
[82]. As it was mentioned above, MD and GA are complex structures that
mainly consist of saccharide units connected in chains of variable length.
Typically, EGCG is at least one half of the average size of MD and much
less portion of those of GA. Therefore, it was found reasonable to compare
the diffusion coefficient of EGCG, MD and GA in EGCG/P with that of
the pure EGCG, MD/GA and both physical mixtures (EGCG+MD/GA
and EGCG+MD+GA). Special care was taken to perform all experiments
under identical conditions of concentration and temperature. Self-diffusion
coefficients (D) of EGCG molecules present in EGCG/P, EGCG+MD/GA
and EGCG+MD+GA were determined from the resonance signals of H2”
and H6” protons of gallate moiety (at 7.03 ppm). The corresponding values
of D for MD and GA were determined from the resonance signals of the
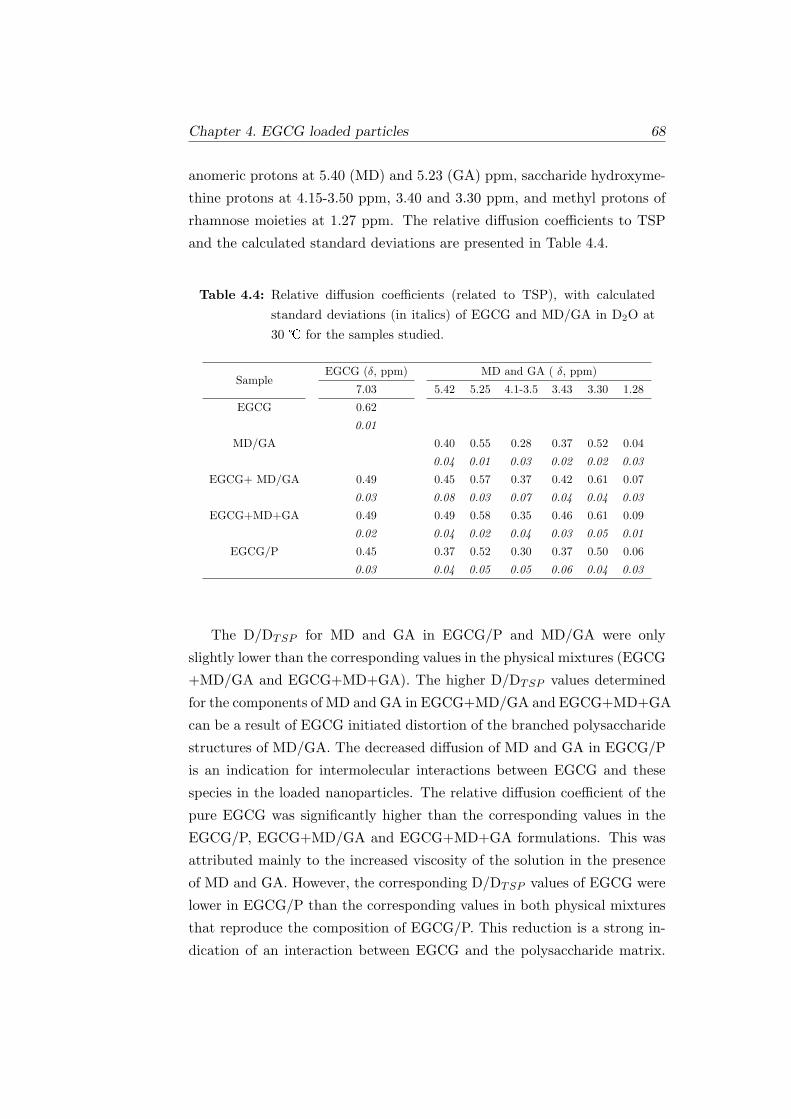
Chapter 4. EGCG loaded particles 68
anomeric protons at 5.40 (MD) and 5.23 (GA) ppm, saccharide hydroxyme-
thine protons at 4.15-3.50 ppm, 3.40 and 3.30 ppm, and methyl protons of
rhamnose moieties at 1.27 ppm. The relative diffusion coefficients to TSP
and the calculated standard deviations are presented in Table 4.4.
Table 4.4: Relative diffusion coefficients (related to TSP), with calculatedstandard deviations (in italics) of EGCG and MD/GA in D2O at30 for the samples studied.
SampleEGCG (δ, ppm) MD and GA ( δ, ppm)
7.03 5.42 5.25 4.1-3.5 3.43 3.30 1.28
EGCG 0.62
0.01
MD/GA 0.40 0.55 0.28 0.37 0.52 0.04
0.04 0.01 0.03 0.02 0.02 0.03
EGCG+ MD/GA 0.49 0.45 0.57 0.37 0.42 0.61 0.07
0.03 0.08 0.03 0.07 0.04 0.04 0.03
EGCG+MD+GA 0.49 0.49 0.58 0.35 0.46 0.61 0.09
0.02 0.04 0.02 0.04 0.03 0.05 0.01
EGCG/P 0.45 0.37 0.52 0.30 0.37 0.50 0.06
0.03 0.04 0.05 0.05 0.06 0.04 0.03
The D/DTSP for MD and GA in EGCG/P and MD/GA were only
slightly lower than the corresponding values in the physical mixtures (EGCG
+MD/GA and EGCG+MD+GA). The higher D/DTSP values determined
for the components of MD and GA in EGCG+MD/GA and EGCG+MD+GA
can be a result of EGCG initiated distortion of the branched polysaccharide
structures of MD/GA. The decreased diffusion of MD and GA in EGCG/P
is an indication for intermolecular interactions between EGCG and these
species in the loaded nanoparticles. The relative diffusion coefficient of the
pure EGCG was significantly higher than the corresponding values in the
EGCG/P, EGCG+MD/GA and EGCG+MD+GA formulations. This was
attributed mainly to the increased viscosity of the solution in the presence
of MD and GA. However, the corresponding D/DTSP values of EGCG were
lower in EGCG/P than the corresponding values in both physical mixtures
that reproduce the composition of EGCG/P. This reduction is a strong in-
dication of an interaction between EGCG and the polysaccharide matrix.
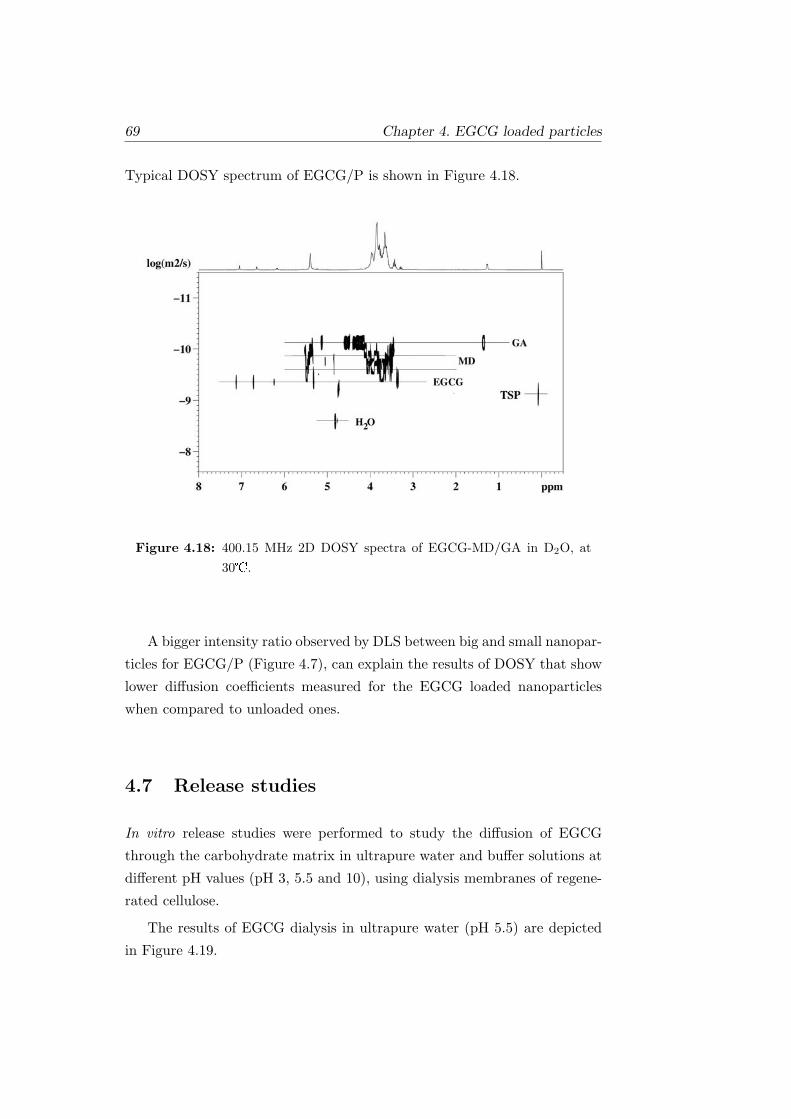
69 Chapter 4. EGCG loaded particles
Typical DOSY spectrum of EGCG/P is shown in Figure 4.18.
Figure 4.18: 400.15 MHz 2D DOSY spectra of EGCG-MD/GA in D2O, at30.
A bigger intensity ratio observed by DLS between big and small nanopar-
ticles for EGCG/P (Figure 4.7), can explain the results of DOSY that show
lower diffusion coefficients measured for the EGCG loaded nanoparticles
when compared to unloaded ones.
4.7 Release studies
In vitro release studies were performed to study the diffusion of EGCG
through the carbohydrate matrix in ultrapure water and buffer solutions at
different pH values (pH 3, 5.5 and 10), using dialysis membranes of regene-
rated cellulose.
The results of EGCG dialysis in ultrapure water (pH 5.5) are depicted
in Figure 4.19.
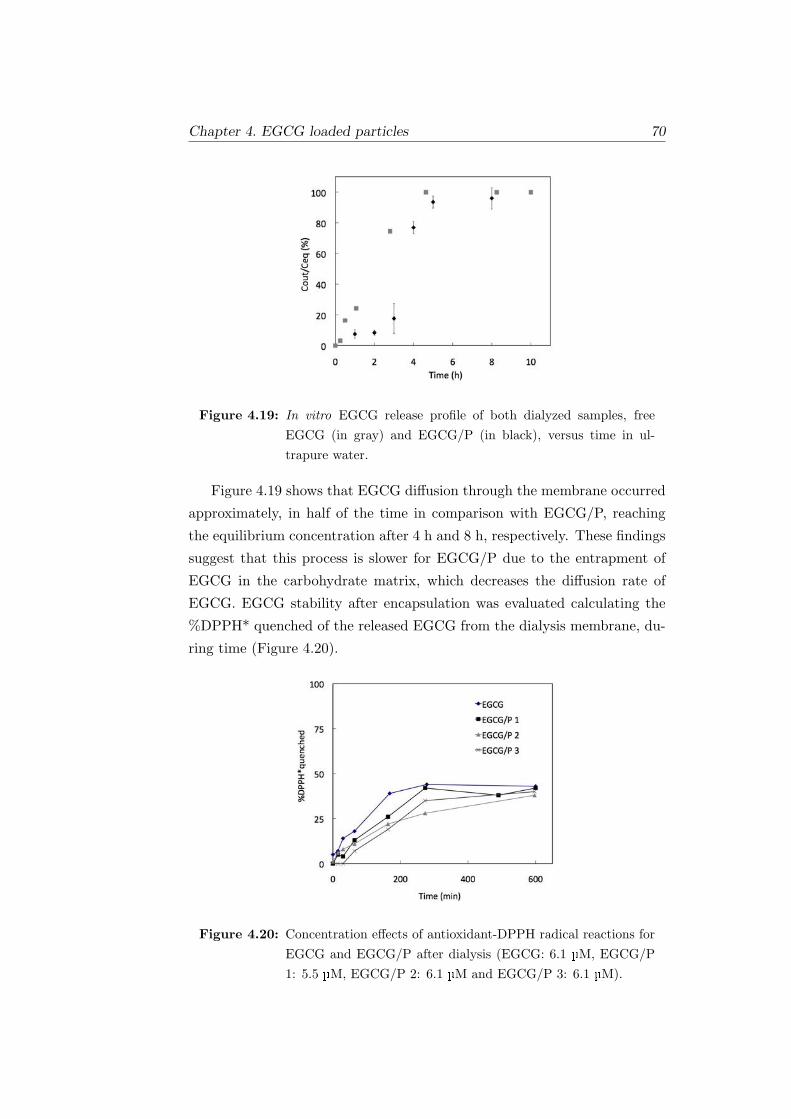
Chapter 4. EGCG loaded particles 70
Figure 4.19: In vitro EGCG release profile of both dialyzed samples, freeEGCG (in gray) and EGCG/P (in black), versus time in ul-trapure water.
Figure 4.19 shows that EGCG diffusion through the membrane occurred
approximately, in half of the time in comparison with EGCG/P, reaching
the equilibrium concentration after 4 h and 8 h, respectively. These findings
suggest that this process is slower for EGCG/P due to the entrapment of
EGCG in the carbohydrate matrix, which decreases the diffusion rate of
EGCG. EGCG stability after encapsulation was evaluated calculating the
%DPPH* quenched of the released EGCG from the dialysis membrane, du-
ring time (Figure 4.20).
Figure 4.20: Concentration effects of antioxidant-DPPH radical reactions forEGCG and EGCG/P after dialysis (EGCG: 6.1 µM, EGCG/P1: 5.5 µM, EGCG/P 2: 6.1 µM and EGCG/P 3: 6.1 µM).
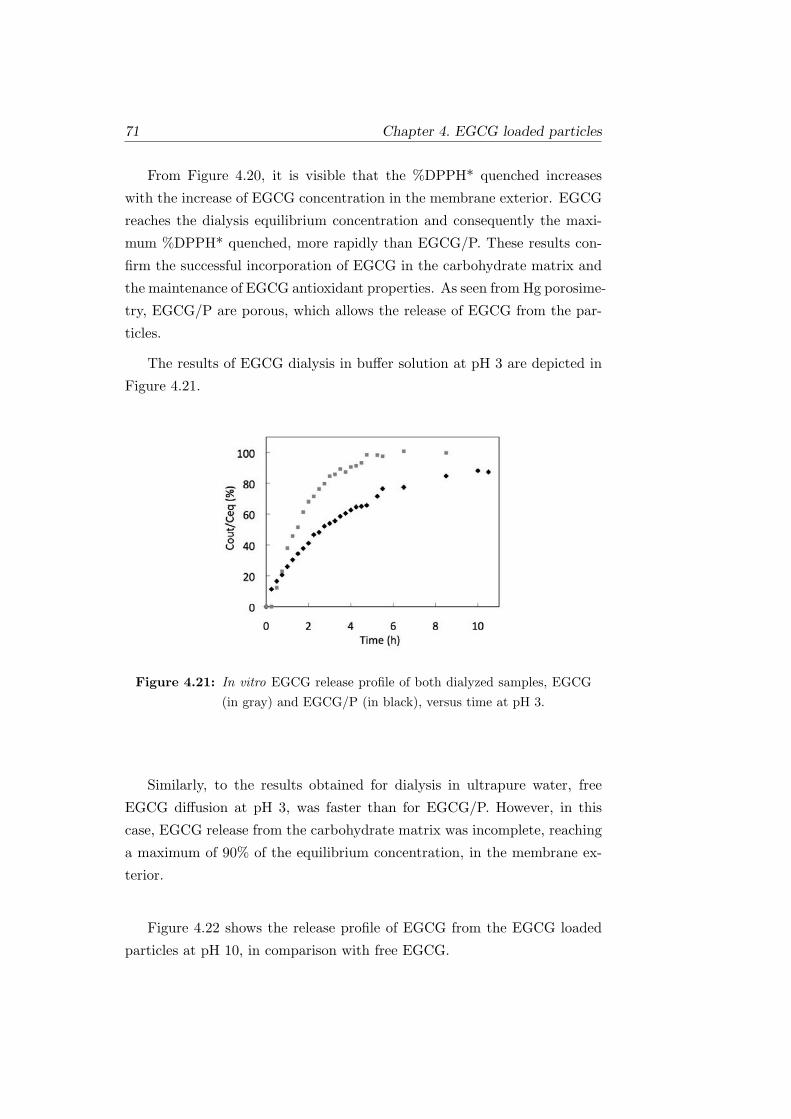
71 Chapter 4. EGCG loaded particles
From Figure 4.20, it is visible that the %DPPH* quenched increases
with the increase of EGCG concentration in the membrane exterior. EGCG
reaches the dialysis equilibrium concentration and consequently the maxi-
mum %DPPH* quenched, more rapidly than EGCG/P. These results con-
firm the successful incorporation of EGCG in the carbohydrate matrix and
the maintenance of EGCG antioxidant properties. As seen from Hg porosime-
try, EGCG/P are porous, which allows the release of EGCG from the par-
ticles.
The results of EGCG dialysis in buffer solution at pH 3 are depicted in
Figure 4.21.
Figure 4.21: In vitro EGCG release profile of both dialyzed samples, EGCG(in gray) and EGCG/P (in black), versus time at pH 3.
Similarly, to the results obtained for dialysis in ultrapure water, free
EGCG diffusion at pH 3, was faster than for EGCG/P. However, in this
case, EGCG release from the carbohydrate matrix was incomplete, reaching
a maximum of 90% of the equilibrium concentration, in the membrane ex-
terior.
Figure 4.22 shows the release profile of EGCG from the EGCG loaded
particles at pH 10, in comparison with free EGCG.
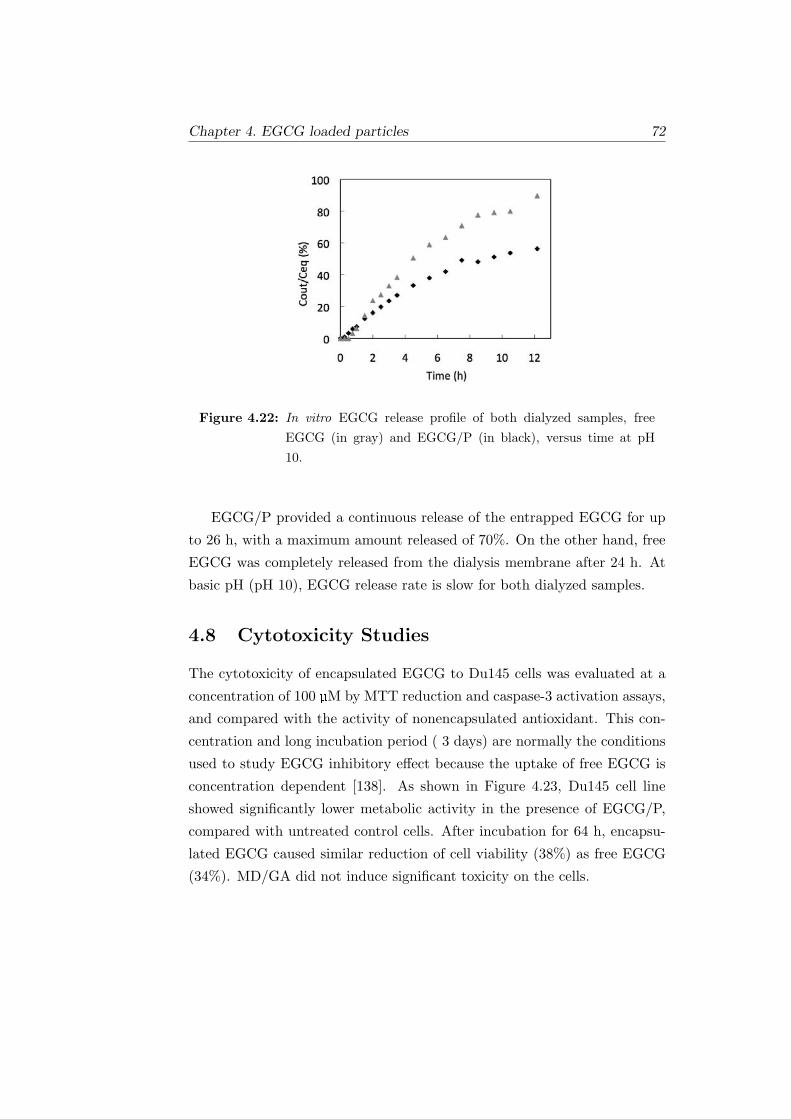
Chapter 4. EGCG loaded particles 72
Figure 4.22: In vitro EGCG release profile of both dialyzed samples, freeEGCG (in gray) and EGCG/P (in black), versus time at pH10.
EGCG/P provided a continuous release of the entrapped EGCG for up
to 26 h, with a maximum amount released of 70%. On the other hand, free
EGCG was completely released from the dialysis membrane after 24 h. At
basic pH (pH 10), EGCG release rate is slow for both dialyzed samples.
4.8 Cytotoxicity Studies
The cytotoxicity of encapsulated EGCG to Du145 cells was evaluated at a
concentration of 100 µM by MTT reduction and caspase-3 activation assays,
and compared with the activity of nonencapsulated antioxidant. This con-
centration and long incubation period ( 3 days) are normally the conditions
used to study EGCG inhibitory effect because the uptake of free EGCG is
concentration dependent [138]. As shown in Figure 4.23, Du145 cell line
showed significantly lower metabolic activity in the presence of EGCG/P,
compared with untreated control cells. After incubation for 64 h, encapsu-
lated EGCG caused similar reduction of cell viability (38%) as free EGCG
(34%). MD/GA did not induce significant toxicity on the cells.
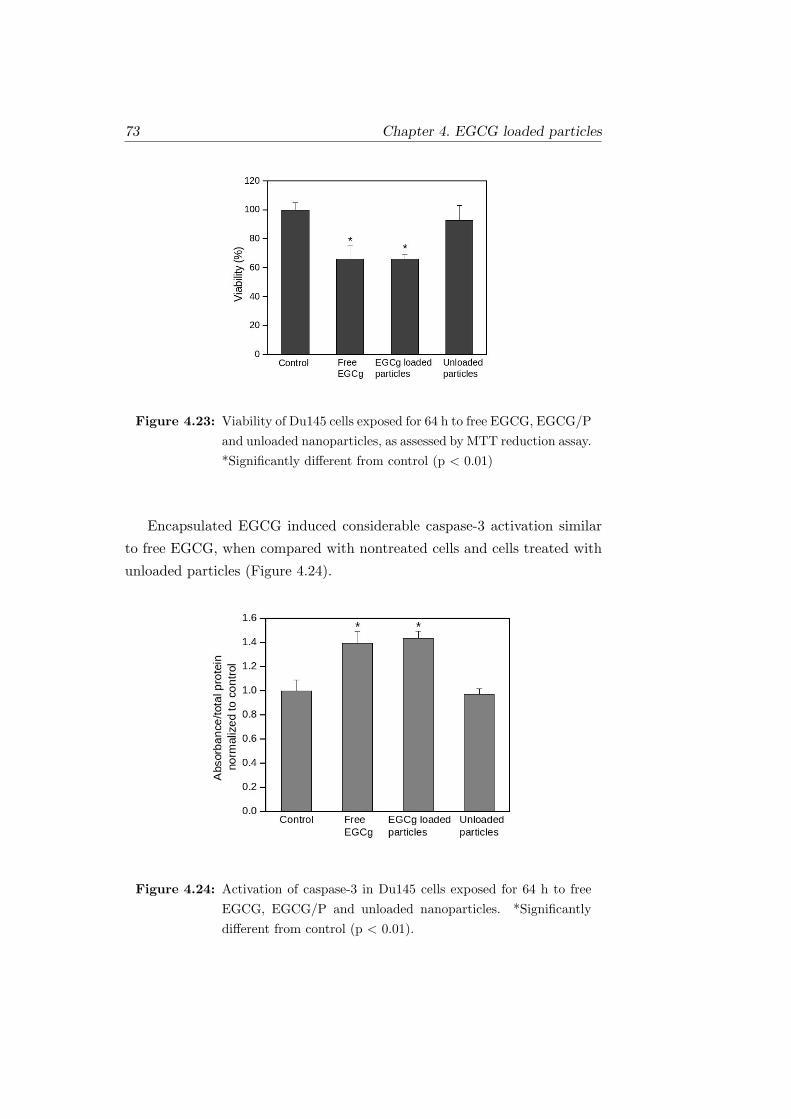
73 Chapter 4. EGCG loaded particles
Figure 4.23: Viability of Du145 cells exposed for 64 h to free EGCG, EGCG/Pand unloaded nanoparticles, as assessed by MTT reduction assay.*Significantly different from control (p < 0.01)
Encapsulated EGCG induced considerable caspase-3 activation similar
to free EGCG, when compared with nontreated cells and cells treated with
unloaded particles (Figure 4.24).
Figure 4.24: Activation of caspase-3 in Du145 cells exposed for 64 h to freeEGCG, EGCG/P and unloaded nanoparticles. *Significantlydifferent from control (p < 0.01).

Chapter 4. EGCG loaded particles 74
Clonogenic assay, a standard analysis for screening cytotoxic activity of
drugs, was used to study the effect of EGCG/P at different concentrations
on prostate cancer cells. This assay is much more sensitive than that pre-
viously described due to very low cell-seeding density. Treatment of Du145
cells with increasing concentrations of encapsulated EGCG from 0 to 10 µM
resulted in a concentration-dependent decline in cell survival, as evidenced
by the reduction in surviving fraction (Figure 4.25a). The effectiveness of
encapsulated EGCG was higher when compared with free EGCG at low
concentration (1 and 2 µM). At concentrations of 25 µM or higher, all cells
died. The surviving fraction of cells treated with MD/GA was similar or
higher to the control sample (no treatment), confirming that the carbohy-
drate matrix is not toxic to Du145 cells (Figure 4.25b). Statistical analysis
established that MD/GA at 1 mg/ml significantly increase the surviving
fraction, compared with the control (p < 0.05).
(a) (b)
Figure 4.25: Surviving fraction of DU145 assessed by clonogenic assay. (a)Cells incubated with free and encapsulated EGCG, normalized toinitial EGCG concentration. (b) Cells incubated with unloadedparticles.
Encapsulated EGCG, at a concentration of 100 µM, was able to reduce
cell viability and induce caspase-3 activation in cultured prostate cancer
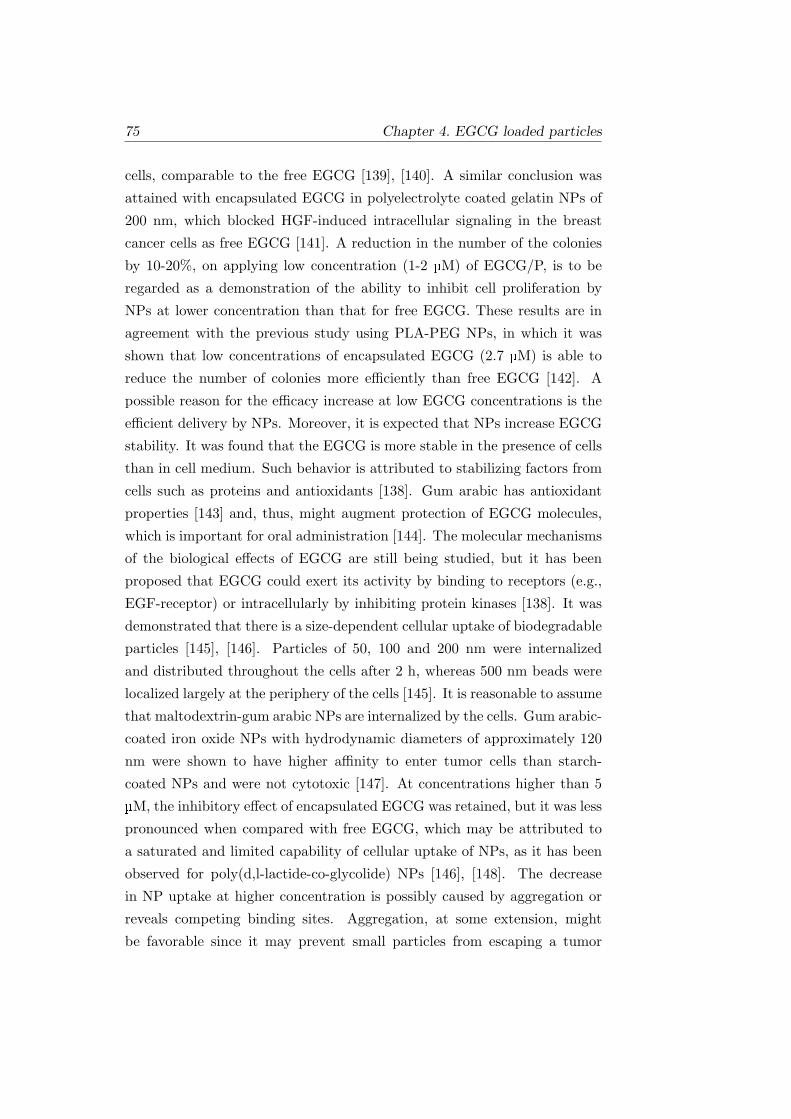
75 Chapter 4. EGCG loaded particles
cells, comparable to the free EGCG [139], [140]. A similar conclusion was
attained with encapsulated EGCG in polyelectrolyte coated gelatin NPs of
200 nm, which blocked HGF-induced intracellular signaling in the breast
cancer cells as free EGCG [141]. A reduction in the number of the colonies
by 10-20%, on applying low concentration (1-2 µM) of EGCG/P, is to be
regarded as a demonstration of the ability to inhibit cell proliferation by
NPs at lower concentration than that for free EGCG. These results are in
agreement with the previous study using PLA-PEG NPs, in which it was
shown that low concentrations of encapsulated EGCG (2.7 µM) is able to
reduce the number of colonies more efficiently than free EGCG [142]. A
possible reason for the efficacy increase at low EGCG concentrations is the
efficient delivery by NPs. Moreover, it is expected that NPs increase EGCG
stability. It was found that the EGCG is more stable in the presence of cells
than in cell medium. Such behavior is attributed to stabilizing factors from
cells such as proteins and antioxidants [138]. Gum arabic has antioxidant
properties [143] and, thus, might augment protection of EGCG molecules,
which is important for oral administration [144]. The molecular mechanisms
of the biological effects of EGCG are still being studied, but it has been
proposed that EGCG could exert its activity by binding to receptors (e.g.,
EGF-receptor) or intracellularly by inhibiting protein kinases [138]. It was
demonstrated that there is a size-dependent cellular uptake of biodegradable
particles [145], [146]. Particles of 50, 100 and 200 nm were internalized
and distributed throughout the cells after 2 h, whereas 500 nm beads were
localized largely at the periphery of the cells [145]. It is reasonable to assume
that maltodextrin-gum arabic NPs are internalized by the cells. Gum arabic-
coated iron oxide NPs with hydrodynamic diameters of approximately 120
nm were shown to have higher affinity to enter tumor cells than starch-
coated NPs and were not cytotoxic [147]. At concentrations higher than 5
µM, the inhibitory effect of encapsulated EGCG was retained, but it was less
pronounced when compared with free EGCG, which may be attributed to
a saturated and limited capability of cellular uptake of NPs, as it has been
observed for poly(d,l-lactide-co-glycolide) NPs [146], [148]. The decrease
in NP uptake at higher concentration is possibly caused by aggregation or
reveals competing binding sites. Aggregation, at some extension, might
be favorable since it may prevent small particles from escaping a tumor
Chapter 4. EGCG loaded particles 76
interstitium. The size of liposomes containing EGCG was shown to strongly
influence the accumulation of the active molecule in basal cell carcinomas
[8]. Large vesicles (> 300 nm) were more readily entrapped by the tumor.
4.9 Conclusions
EGCG was encapsulated by spray-drying using a combination of maltodex-
trin and gum arabic, as wall materials. The spray-drying technique and the
process conditions selected were effective in encapsulating and stabilizing
EGCG. Carbohydrate particles have proved to be adequate vehicles for the
encapsulation of natural antioxidants because they maintain the antioxidant
activity of EGCG. High loading efficiency was obtained, which is a promising
result for scaling up the process and pharmaceutical applications. Cytotoxic
studies suggest that these polysaccharide NPs can be used as nanochemo-
preventive tools as they can be used to deliver natural antioxidants capable
of inhibiting steps of the tumorigenesis process.

Chapter 5. Collagen hydrolysate loaded particles 78
Chapter 5
Collagen hydrolysate loaded
particles
Contents
5.1 Introduction . . . . . . . . . . . . . . . . . . . . . 78
5.2 Physical characterization . . . . . . . . . . . . . . 81
5.2.1 CH/P morphological characterization and loading 81
5.2.2 Particle size distribution and surface charge . . . . 84
5.3 CH/P inner structure . . . . . . . . . . . . . . . . 85
5.4 CH intermolecular interactions with MD/GA
particles . . . . . . . . . . . . . . . . . . . . . . . . 87
5.4.1 ATR analysis . . . . . . . . . . . . . . . . . . . . . 87
5.4.2 NMR spectroscopy . . . . . . . . . . . . . . . . . . 88
5.5 In vitro release . . . . . . . . . . . . . . . . . . . . 90
5.6 Conclusions . . . . . . . . . . . . . . . . . . . . . . 91
5.1 Introduction
Collagen is a multifunctional protein that plays an important role in the
formation of tissues and organs, and is involved in various functional ex-
pressions of cells [6]. The major property of collagen is to provide ten-
sile strength to tissues such as tendons, ligaments, skin, cartilage, blood
vessels, and bones [149]. Collagen consists of three polypeptide α-chains

79 Chapter 5. Collagen hydrolysate loaded particles
wound together in a rod-like helical structure. Each molecule is 300 nm in
length and 1.5 nm in diameter with a molecular weight of 300 kDa. The
sequence of amino acid residues in the chains is very specific: glycine is every
third residue in repeating sequence; Gly-X-Y and proline and hydroxypro-
line amino acids are X and Y, respectively. Collagen triple helix structure
is depicted in Figure 5.1.
Figure 5.1: Collagen triple helix structure.
The molecular structure is stabilized by a net of intra and inter-chain
hydrogen bonds between the –NH group of glycine and the carbonyl group
C=O of residues from another polypeptide chain or by hydrogen bonds with
water molecules [150]. From the twenty-seven types of collagens already
identified, collagen type I is the most abundant and the most investigated
for biomedical applications [42]. Type I collagen is the major structural
protein distributed throughout the whole body accounting for 25% of total
body protein and for 80% of total conjunctive tissue in humans [151]. It is an
important component of bone, being the main extra cellular matrix protein
for calcification, which also plays a role in osteoblast differentiation [152].
It is widely known that the digestion of collagen proteins or hydrolysates
in vivo will generate peptides that may be useful for organic biosynthetic
processes.
Collagen hydrolysate (CH) is obtained by enzymatic proteolysis of colla-
gen and contains 20 amino acids, predominantly glycine, proline and hydro-
xyproline. Its average molecular weight ranging from 3 to 6 kDa is one of the
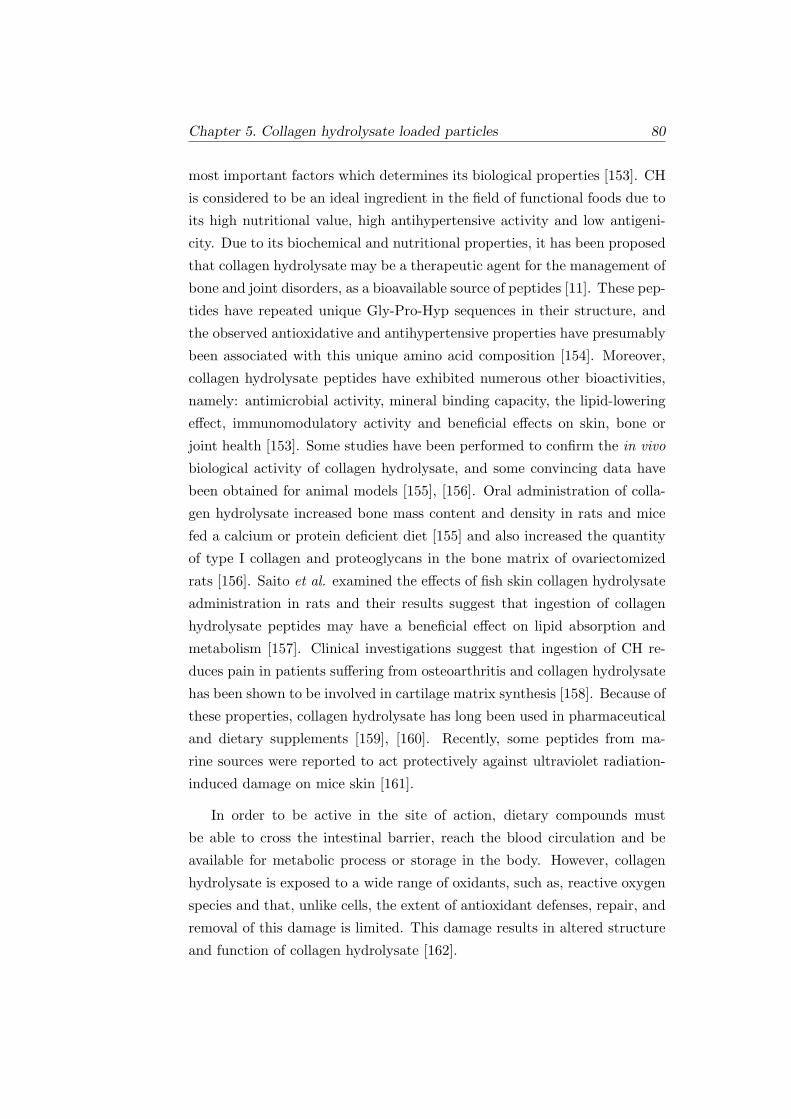
Chapter 5. Collagen hydrolysate loaded particles 80
most important factors which determines its biological properties [153]. CH
is considered to be an ideal ingredient in the field of functional foods due to
its high nutritional value, high antihypertensive activity and low antigeni-
city. Due to its biochemical and nutritional properties, it has been proposed
that collagen hydrolysate may be a therapeutic agent for the management of
bone and joint disorders, as a bioavailable source of peptides [11]. These pep-
tides have repeated unique Gly-Pro-Hyp sequences in their structure, and
the observed antioxidative and antihypertensive properties have presumably
been associated with this unique amino acid composition [154]. Moreover,
collagen hydrolysate peptides have exhibited numerous other bioactivities,
namely: antimicrobial activity, mineral binding capacity, the lipid-lowering
effect, immunomodulatory activity and beneficial effects on skin, bone or
joint health [153]. Some studies have been performed to confirm the in vivo
biological activity of collagen hydrolysate, and some convincing data have
been obtained for animal models [155], [156]. Oral administration of colla-
gen hydrolysate increased bone mass content and density in rats and mice
fed a calcium or protein deficient diet [155] and also increased the quantity
of type I collagen and proteoglycans in the bone matrix of ovariectomized
rats [156]. Saito et al. examined the effects of fish skin collagen hydrolysate
administration in rats and their results suggest that ingestion of collagen
hydrolysate peptides may have a beneficial effect on lipid absorption and
metabolism [157]. Clinical investigations suggest that ingestion of CH re-
duces pain in patients suffering from osteoarthritis and collagen hydrolysate
has been shown to be involved in cartilage matrix synthesis [158]. Because of
these properties, collagen hydrolysate has long been used in pharmaceutical
and dietary supplements [159], [160]. Recently, some peptides from ma-
rine sources were reported to act protectively against ultraviolet radiation-
induced damage on mice skin [161].
In order to be active in the site of action, dietary compounds must
be able to cross the intestinal barrier, reach the blood circulation and be
available for metabolic process or storage in the body. However, collagen
hydrolysate is exposed to a wide range of oxidants, such as, reactive oxygen
species and that, unlike cells, the extent of antioxidant defenses, repair, and
removal of this damage is limited. This damage results in altered structure
and function of collagen hydrolysate [162].

81 Chapter 5. Collagen hydrolysate loaded particles
Polymeric delivery systems have been developed to stabilize proteins
and maintain their chemical integrity, assuring their convenient delivery.
Polymers have also been widely investigated for use in protein-polymer con-
jugates. These systems have generally been utilized for prolonging the cir-
culation half-lives of proteins or for delivering targeted payloads of protein
pharmaceuticals to specific tissues.
In this study, CH loaded (in a proportion of 5 and 25 wt.%) particles
were produced by spray-drying to provide CH a long-term stability, by its
incorporation in a polysaccharide matrix, based on maltodextrin and gum
arabic. This innovative protein-carbohydrate system protects CH from oxi-
dation and allows its incorporation in functional food, particularly, bevera-
ges, since CH/P in solution doesn’t exhibit color, odor or taste. CH/P were
characterized in solid state and aqueous medium.
5.2 Physical characterization
5.2.1 CH/P morphological characterization and loading
Figures 5.2 and 5.3 show SEM micrographs of spray-dried unloaded parti-
cles and CH loaded particles. Results clearly demonstrated differences in
shape and size, showing a wide size distribution ranging from 400 nm to 50
µm. CH/P morphology differs from spherical shape with extensive dented
surface to a smooth surface with no visible dents. The variation of surface
morphology may be attributed to a number of drying parameters such as
drying rate and the particle composition, namely, the amount of CH loaded
in the particle. Formation of dented surfaces of spray-dried particles was
attributed to the shrinkage of the particles during the drying and cooling
process [110]. Moreover, GA molecules interact strongly among themselves
forming a multilayer framework, while their interaction with and among
MD molecules is not so strong, producing “holes” in the structure [163]. Fi-
gure 5.2a shows that the main population observed in the unloaded particles
is disk-like and corrugated with highly dented surfaces. The formation of
spherical particles with smooth surface observed in Figures 5.2c and 5.2d
is probably, attributed to a higher content in maltodextrin (low molecular
weight sugar) in their composition. Low molecular weight sugars usually act
as plasticizers preventing shrinkage of the surface during drying [164].
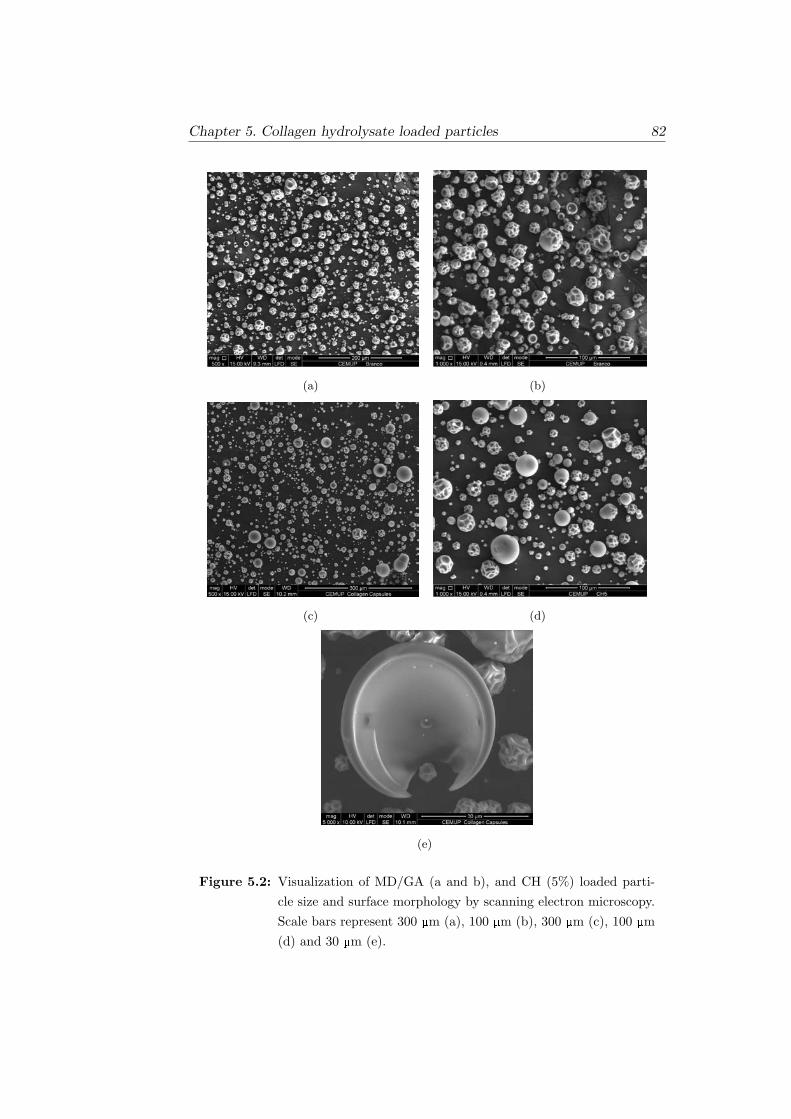
Chapter 5. Collagen hydrolysate loaded particles 82
(a) (b)
(c) (d)
(e)
Figure 5.2: Visualization of MD/GA (a and b), and CH (5%) loaded parti-cle size and surface morphology by scanning electron microscopy.Scale bars represent 300 µm (a), 100 µm (b), 300 µm (c), 100 µm(d) and 30 µm (e).
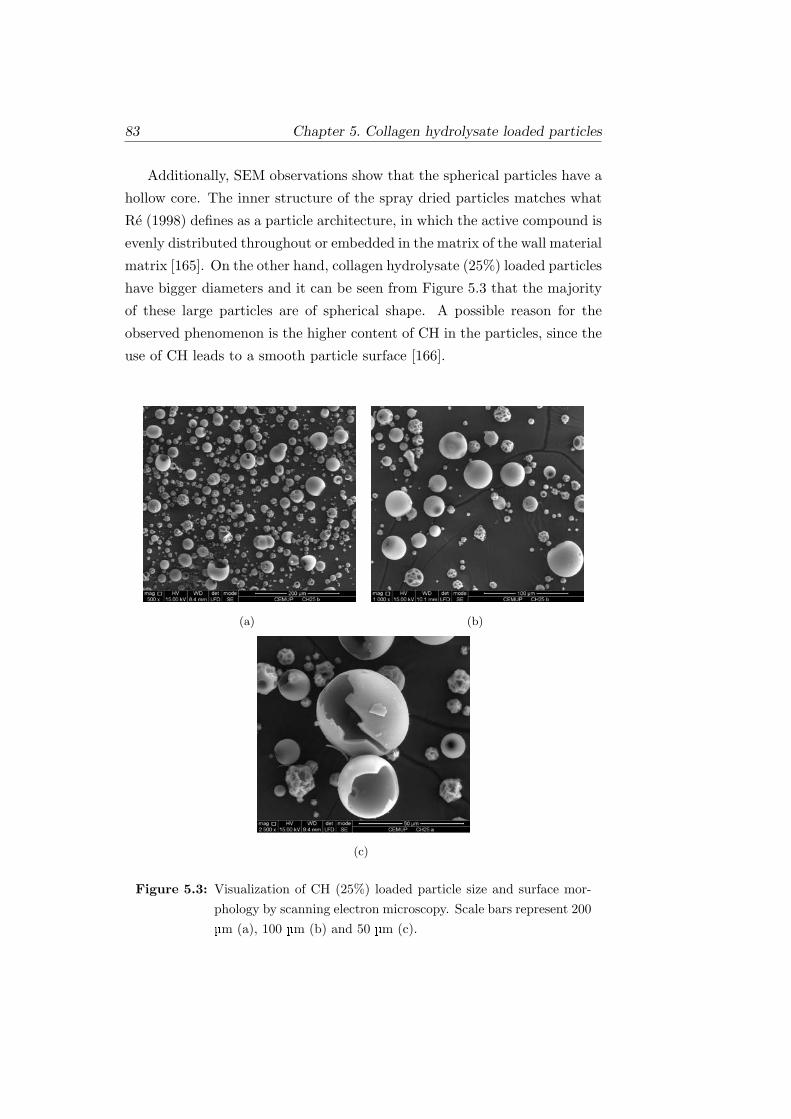
83 Chapter 5. Collagen hydrolysate loaded particles
Additionally, SEM observations show that the spherical particles have a
hollow core. The inner structure of the spray dried particles matches what
Re (1998) defines as a particle architecture, in which the active compound is
evenly distributed throughout or embedded in the matrix of the wall material
matrix [165]. On the other hand, collagen hydrolysate (25%) loaded particles
have bigger diameters and it can be seen from Figure 5.3 that the majority
of these large particles are of spherical shape. A possible reason for the
observed phenomenon is the higher content of CH in the particles, since the
use of CH leads to a smooth particle surface [166].
(a) (b)
(c)
Figure 5.3: Visualization of CH (25%) loaded particle size and surface mor-phology by scanning electron microscopy. Scale bars represent 200µm (a), 100 µm (b) and 50 µm (c).
Chapter 5. Collagen hydrolysate loaded particles 84
From Figure 5.3 it is visible that the collapse of some particles occurred.
According to Walton and Mumford (1999) as the solid concentration of
the feed increases, the concentration gradient within the drying droplet de-
creases, foreseeing the critical surface concentration required for selective
diffusion is attained more rapidly, and volatile retention is increased. How-
ever, it may be that, an increase in feed concentration simply increases the
barrier to mass transfer, therefore, increasing volatile retention. If this were
the case, the particles would tend to expand, rupture and collapse, or form
blowholes during drying [167]. It is clear from SEM micrographs that the
wall thickness of the spherical particles decreases with the amount of CH
loaded in the particles. This population of particles, particularly presented
in the 25% CH samples, shows holes or are broken, as depicted in Figure 5.3.
Collagen hydrolysate was extracted from the carbohydrate particles by
MAE, with a loading efficiency of 86±7% and 85±4%, for particles loaded
with 5% and 25% of CH, respectively. A comparison has been made of
the recoveries obtained, employing different extracting temperatures and
the higher loading efficiency was achieved at 100 . This high loading ef-
ficiency indicates that this encapsulation method is suitable for preparing
the CH/P formulations, in agreement with the values obtained previously
for the catechin loaded particles (96±3%) [168].
5.2.2 Particle size distribution and surface charge
The particle size distribution of the suspended CH/P was determined using
dynamic light scattering. CH/P size distribution was bimodal, comprising
two populations of particles with average hydrodynamic diameters of 30 nm
and 300 nm (Figure 5.4). These average hydrodynamic diameters are in the
same range as the obtained for EGCG/P and MD/GA [168].

85 Chapter 5. Collagen hydrolysate loaded particles
Figure 5.4: Average hydrodynamic diameter distribution of CH/P as deter-mined by DLS. Average value ± standard deviation, number ofexperiments = 3
The surface charge of particles has a significant influence on the suspen-
sion stability, on the particle interactions with charged substances and on
the adherence of drug delivery systems onto biological surfaces. The mea-
sured zeta potential of the CH/P surface was approximately -32±5 mV and
-38±5 mV, for CH 5% and 25% loaded particles, respectively, indicating a
strong negative charge at the particle’s surface. In general, a zeta potential
of ±30 mV is required as a minimum for a physical stable suspension solely
stabilized by electrostatic repulsion [169]. Similarly to EGCG/P, the high
negative zeta potential obtained for CH/P indicates the colloid stability and
that there is no tendency to the formation of particle aggregates.
5.3 CH/P inner structure
The true density of the spray-dried CH/P as determined by helium pycnome-
try, ρtrue, was 1.01 g/cm3 and 1.37 g/cm3, for collagen hydrolysate 5% and
25% loaded particles, respectively. True density considers only the volume
of the particles that is not permeable to the displacing gas (He).
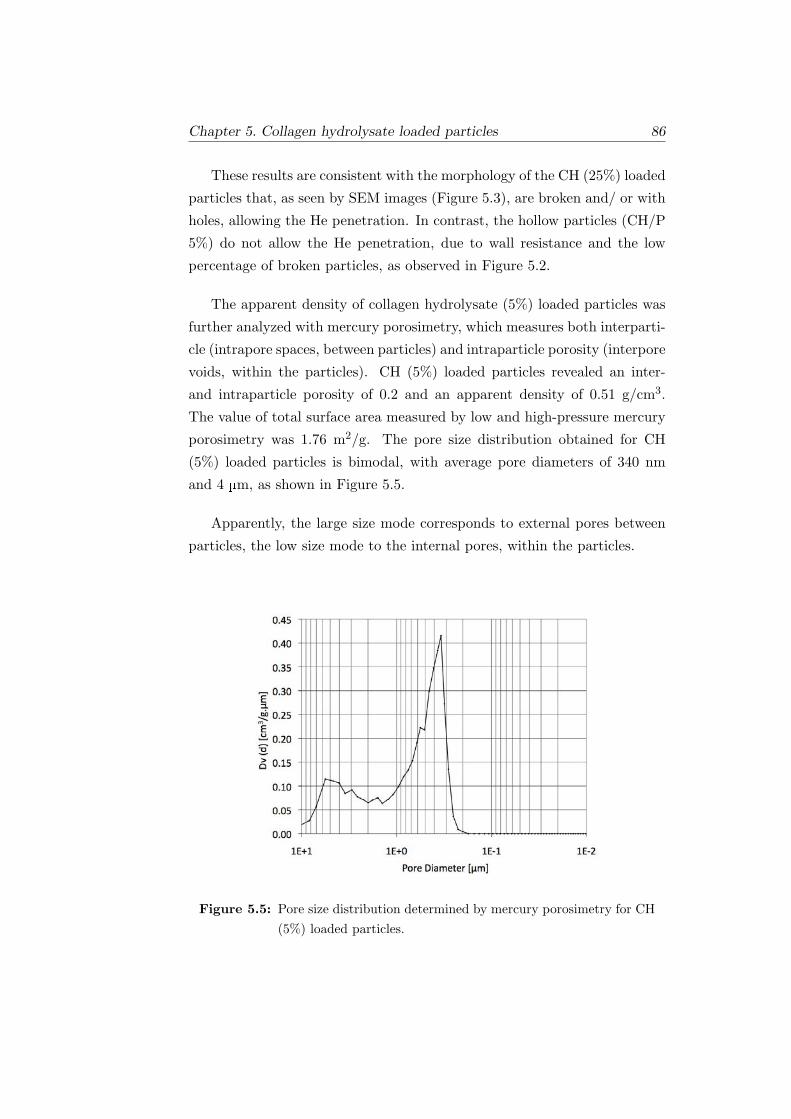
Chapter 5. Collagen hydrolysate loaded particles 86
These results are consistent with the morphology of the CH (25%) loaded
particles that, as seen by SEM images (Figure 5.3), are broken and/ or with
holes, allowing the He penetration. In contrast, the hollow particles (CH/P
5%) do not allow the He penetration, due to wall resistance and the low
percentage of broken particles, as observed in Figure 5.2.
The apparent density of collagen hydrolysate (5%) loaded particles was
further analyzed with mercury porosimetry, which measures both interparti-
cle (intrapore spaces, between particles) and intraparticle porosity (interpore
voids, within the particles). CH (5%) loaded particles revealed an inter-
and intraparticle porosity of 0.2 and an apparent density of 0.51 g/cm3.
The value of total surface area measured by low and high-pressure mercury
porosimetry was 1.76 m2/g. The pore size distribution obtained for CH
(5%) loaded particles is bimodal, with average pore diameters of 340 nm
and 4 µm, as shown in Figure 5.5.
Apparently, the large size mode corresponds to external pores between
particles, the low size mode to the internal pores, within the particles.
Figure 5.5: Pore size distribution determined by mercury porosimetry for CH(5%) loaded particles.

87 Chapter 5. Collagen hydrolysate loaded particles
5.4 CH intermolecular interactions with MD/GA
particles
5.4.1 ATR analysis
The ATR spectra of the CH loaded particles are shown in Figure 5.6, in
comparison to the corresponding spectra of free collagen hydrolysate and un-
loaded particles. Collagen hydrolysate shows a characteristic ATR spectrum,
with adsorption bands of amide I at approximately 1650 cm−1 [170]. The
amide I band results from the stretching vibration of the peptide carbonyl
group (C=O). The intensity of the characteristic collagen hydrolysate ab-
sorption bands increases from the CH (5%) loaded particles to the CH (25%)
loaded particles, due to the higher amount of the collagen hydrolysate loaded
in the particles. The presence of these bands in the CH/P is not visible in
the unloaded particle’s spectrum. In addition, GA is a mixture of branched
polysaccharides and glycoprotein containing numerous functional groups,
which may be responsible for hydrogen bonds, between MD/GA/CH.
Figure 5.6: ATR spectra of free collagen hydrolysate, collagen hydrolysateloaded and unloaded particles.
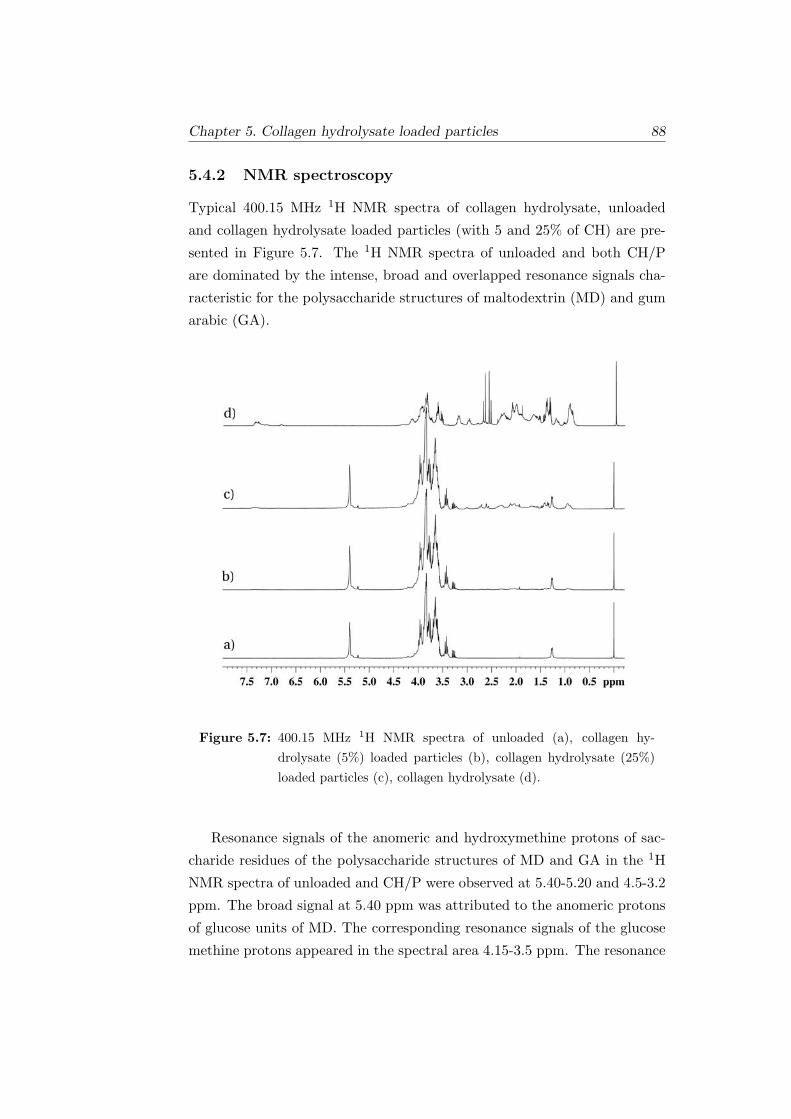
Chapter 5. Collagen hydrolysate loaded particles 88
5.4.2 NMR spectroscopy
Typical 400.15 MHz 1H NMR spectra of collagen hydrolysate, unloaded
and collagen hydrolysate loaded particles (with 5 and 25% of CH) are pre-
sented in Figure 5.7. The 1H NMR spectra of unloaded and both CH/P
are dominated by the intense, broad and overlapped resonance signals cha-
racteristic for the polysaccharide structures of maltodextrin (MD) and gum
arabic (GA).
Figure 5.7: 400.15 MHz 1H NMR spectra of unloaded (a), collagen hy-drolysate (5%) loaded particles (b), collagen hydrolysate (25%)loaded particles (c), collagen hydrolysate (d).
Resonance signals of the anomeric and hydroxymethine protons of sac-
charide residues of the polysaccharide structures of MD and GA in the 1H
NMR spectra of unloaded and CH/P were observed at 5.40-5.20 and 4.5-3.2
ppm. The broad signal at 5.40 ppm was attributed to the anomeric protons
of glucose units of MD. The corresponding resonance signals of the glucose
methine protons appeared in the spectral area 4.15-3.5 ppm. The resonance

89 Chapter 5. Collagen hydrolysate loaded particles
signal at 1.27 ppm was assigned to C6 methyl protons of rhamnose moi-
eties from GA. The assignment of the resonance signals of MD and GA is
in agreement to the data published recently [171]. Proton NMR spectra
of collagen hydrolysate and collagen hydrolysate loaded samples are usu-
ally complex because of the large number of components in the samples,
resulting in spectra with complex line shapes and significant overlap of the
resonance signals. However, resonance signals appearing in 1H NMR spectra
(between 4.5 and 0.5 ppm and in the aromatic spectral area) containing col-
lagen hydrolysate could be assigned to the most abundant amino acids (Gly,
Ala, Pro, HyPro, and Glu) in the complex structure of collagen hydrolysate
[149]. The observed broadening of the resonance lines suggests involvement
of the saccharide and peptide residues into high molecular structures with
low mobility and variation in the spin-spin relaxation time (T2). In both,1H NMR spectra of CH/P (loaded with 5 and 25% of collagen hydrolysate)
were observed resonance signals characteristic of collagen hydrolysate. This
shows that collagen hydrolysate is incorporated into the polymeric matrix
of polysaccharide particles. Diffusion ordered NMR spectroscopy (DOSY)
was used to analyze overall structure of CH/P, to clarify the origin of the
collagen hydrolysate-polysaccharide interactions and to determine the loca-
tion of collagen hydrolysate into the carbohydrate matrix. The pulsed field
gradient spin echo (PFGSE) NMR technique is a straight forward procedure
for measuring the diffusion coefficients of individual species. Useful infor-
mation can be obtained regarding the size, molecular weight and shape of
the species in solution under given conditions. In order to get insight into
the structural modifications of the species presented in the CH/P and to ac-
count for changes in the solvent viscosity and minor fluctuations of samples
temperature, we found it useful to use an internal diffusion reference [82],
[77]. Since modifications of the solution composition could induce changes
in the viscosity and these changes affect equally all species in the solution,
the use of reference allows one to take into account the variation in solvent
properties and correct the measured diffusion values. We found it useful to
use TSP not only as chemical shift reference but also as an internal diffu-
sion reference and all diffusion coefficients presented in Table 5.1 are given
as a ratio D/DTSP according procedure published before [82]. Self-diffusion
coefficients (D) of the collagen hydrolysate (DCH) present in CH/P at con-

Chapter 5. Collagen hydrolysate loaded particles 90
centration of 5 and 25% collagen hydrolysate were determined from the
resonance signals at 1.02 ppm. The corresponding values of D for MD and
GA (DMD and DGA) were determined from the resonance signals at 5.50
and 1.27 ppm, respectively. The results are presented in Table 5.1. The
diffusion coefficients measured for MD and GA in CH/P are similar to the
corresponding values in the unloaded particles. However, the diffusion co-
efficients of collagen hydrolysate in the both CH/P samples are lower than
the corresponding values in the free collagen hydrolysate. The reduction of
the diffusion coefficients of collagen hydrolysate in the collagen hydrolysate
loaded particles samples studied is a strong indication of an association
process between collagen hydrolysate and polysaccharides, due to hydrogen
bonds between their polar (OH, COOH, NH2, NH) functional groups.
Table 5.1: Relative diffusion coefficients (related to TSP), with calculatedstandard deviations (in italics), of collagen hydrolysate, MD andGA in D2O at 30 for the samples studied.
Sample DCH DMD DGA
Collagen hydrolysate 0.55
0.0004
Unloaded particles 0.36 0.04
0.04 0.03
Collagen hydrolysate (5%) loaded particles 0.50 0.34 0.03
0.02 0.02 0.001
Collagen hydrolysate (25%) loaded particles 0.46 0.33 0.04
0.0001 0.02 0.02
5.5 In vitro release
Drug release from a polymeric matrix is controlled by several factors, such
as the solubility of the drug within the surrounding medium, the size of
the drug molecule and its mobility within the polymeric network, and the
dissolution rate of the polymer and polymer-drug interactions [172]. The in
vitro release profile of CH in ultrapure water, is illustrated in Figure 5.8.

91 Chapter 5. Collagen hydrolysate loaded particles
Figure 5.8: In vitro release profile of free CH (in black) and collagen hy-drolysate from CH (25%) loaded particles (in gray) versus timein ultrapure water. Average ± standard deviation, number ofexperiments = 2.
The release rate of collagen hydrolysate from the CH (25%) loaded par-
ticles is compared to free CH (Figure 5.8). The free molecules of CH are
completely released after 8 h. On the contrary, it is visible that the diffusion
rate of CH from the polymeric matrix to the dialysis solution decreases in
average 30% over the time, compared to free CH molecules. The maximum
concentration of CH detected in the dialysis solution is equivalent to 65% of
the loaded CH in the particles. These results show evidence of the entrap-
ment of CH in the maltodextrin-gum arabic matrix, which are supported by
the interactions between CH and the polysaccharides described in the ATR
and NMR analysis.
5.6 Conclusions
CH loaded particles were produced by spray-drying technique, using a car-
bohydrate matrix of maltodextrin and gum arabic. Particles of different size,
zeta potential and surface morphology were obtained by varying the amount
of CH used in the formulation. CH was entrapped into the polymer matrix,
with high loading efficiency, and without undergoing any chemical changes
during particles preparation. ATR and NMR studies demonstrate that CH
Chapter 5. Collagen hydrolysate loaded particles 92
chemical integrity was preserved after the spray-drying process and that it
is incorporated in the matrix by hydrogen bonds between MD/GA/CH. The
studied particles present good functionality and potential for foods, beve-
rages and nutraceuticals purposes, since they were able to mask the CH
undesirable taste and odor and also its yellow color. This method may be
generally applied to carry and delivery active compounds in powder form
with extended shelf life, optimized technological, functional and organoleptic
characteristics.

Chapter 6. Concluding Remarks 94
Chapter 6
Concluding Remarks
In this thesis, the approach to the preservation of epigallocatechin gallate
and collagen hydrolysate therapeutic properties is based on a carbohydrate
particle formulation followed by spray-drying.
Spray-drying is a common process used for encapsulation in the phar-
maceutical and food industries because it is a simple inexpensive method
in which polysaccharides can be used to entrap and protect sensitive com-
pounds. A combination of maltodextrin and gum arabic, two components
already used in pharmaceutical and food industries (US FDA approved), was
used to protect EGCG and CH from degradation, increasing their stability
and bioavailability.
EGCG exhibits antioxidant, anti-bacterial, anti-inflammatory, chemo-
preventive and antitumor activities. However, EGCG as a polyphenol is
susceptible to oxidation and consequently, its low bioavailability and short
half-life limit its therapeutic application. To overcome this drawback EGCG
was incorporated in a maltodextrin-gum arabic matrix, guarantying its phy-
sical and chemical protection and therefore improving its bioavailability.
The EGCG loading efficiency determined at the optimum extraction
temperature was 96±3%, which is a promising result for scaling up the pro-
cess and pharmaceutical applications. ATR results confirmed the presence
of EGCG within the carbohydrate matrix by intermolecular dipole-dipole
interactions, maintaining its integrity after the spray-drying process. NMR
spectroscopy has been applied to study the structure and composition of
EGCG loaded particles. Diffusion ordered NMR spectroscopy combined

95 Chapter 6. Concluding Remarks
with spin-lattice relaxation time determinations provided valuable informa-
tion on the structure and intermolecular interactions of EGCG/P. The de-
creased translation diffusivity and spin-lattice relaxation times of the species
presented in the EGCG/P suggest the entrapment of EGCG in the polysac-
charide matrix and predict the potential of these vehicles for sustained deliv-
ery/release of EGCG. These results are supported by the significant changes
observed for the dynamic parameters of EGCG. NMR study show how a
synergistic combination of NMR spectroscopic techniques can be used to
characterize the structural behaviour of complex nanoscaled intermolecular
aggregates and better understand this EGCG polymer based vehicle. An-
tioxidant activity assay revealed that the functional activity of EGCG was
preserved even after the spray-drying process. This result demonstrates that
spray-drying is a viable and rapid approach to produce antioxidant particles
that retain high potency. Maltodextrin and gum arabic, were studied as
carriers for cancer prevention and therapy. This study confirmed the ability
of nanoparticles to retain EGCG inhibitory effects of the proliferative acti-
vity of prostate cancer cells. Furthermore, the system was not cytotoxic to
Du145 prostate cells, suggesting that the polysaccharide nanoparticles can
be used as nanochemopreventive tools.
The synthetic approach to the formulation of particles with the capability
to incorporate small to large-sized molecules in the carbohydrate matrix and
simultaneously allowing the entrapment of other medium-sized molecules in
the mesopores can be extended to other systems foreseeing chemical stabi-
lization and protection from degradation in adverse conditions for pharma-
ceutical applications and, particularly, as drug delivery systems.
Based on these findings, collagen hydrolysate, a macromolecule, was in-
corporated with success into the carbohyrate matrix studied. Polysaccharide
particles have proved to be adequate vehicles for the entrapment of colla-
gen hydrolysate, with a loading efficiency of 86±7% and 85±4%, for CH/P
with 5% and 25% of CH loaded, respectively. SEM observations clearly
demonstrated differences in size and shape, comparing to EGCG/P. CH/P
morphology differs from spherical shape with indentation to a main popu-
lation of hollow particles with a smooth surface and large size, which is
superior for CH/P (25%). The lower true density obtained for the CH (5%)
loaded particles can be explained by their morphology and wall resistance,
Chapter 6. Concluding Remarks 96
as seen by SEM images.
Structural interactions between the carbohydrate matrix and the colla-
gen hydrolysate were studied by ATR and NMR spectroscopy. These studies
confirm the incorporation of CH within the matrix and suggest an associ-
ation process between collagen hydrolysate and polysaccharides, through
hydrogen bonds among their polar functional groups. In vitro release pro-
files reveal that the diffusion rate of CH from the polymeric matrix to the
dialysis solution decreases in average 30% over the time, compared to free
CH molecules. These findings are supported by the NMR-DOSY results of
the diffusion coefficients.
The encapsulation process studied allows obtaining stable and handling
spray-dried loaded powders with extended shelf life and improved dissolu-
tion/release rate, which could find application in the food and pharmaceu-
tical fields. Thus, the information gained from this research contributes to
enhancing the activity and stability of bioactive compounds, such as EGCG
and CH.

Chapter A. Abbreviations and Symbols 98
Appendix A
Abbreviations and Symbols
A.1 Abbreviations
A Absorbance
AFM Atomic force microscopy
ATR-IR Attenuated total reflection - infrared spectroscopy
AUC Value of the area under the curve
BPPLED Bipolar pulsed field gradient longitudinal eddy delay
CH Collagen hydrolysate
CH/P Collagen hydrolysate loaded particles
CLSM Confocal laser scanning microscopy
COSY Two-dimensional 1H/1H correlation spectrosocopy
Cryo-SEM Cryogenic scanning electron microscopy
DE Dextrose equivalency
DLS Dynamic light scattering
DOSY Diffusion ordered NMR spectroscopy
DPPH* 2, 2,diphenyl-1-picrylhydrazyl radical
EGCG Epigallocatechin gallate
EGCG/P Epigallocatechin gallate loaded particles
FTIR Fourier transform infrared spectroscopy
GA Gum arabic
He Helium
Hg Mercury
HSQC Heteronuclear single quantum coherence spectroscopy
99 Chapter A. Abbreviations and Symbols
MAE Microwave-assisted extraction
MD Maltodextrin
MD/GA Maltodextrin-gum arabic particles (unloaded particles)
MWCO Molecular weight cut-off
NMR Nuclear magnetic resonance
NOESY Nuclear Overhauser effect spectroscopy
NPs Nanoparticles
NTA Nanoparticle tracking analysis
OLE Olive leaf extract
OS Oxidative stress
PE Plating efficiency
PFGSE Pulsed field gradient spin echo
RDSC Relative DPPH* scavenging capacity
ROS Reactive oxygen species
SEM Scanning electron microscopy
TE Trolox equivalents
TEM Transmission electron microscopy
TSP Sodium trimethylsilyl-[2,2,3,3-d4]-propionate
UV-Vis Ultraviolet-visible spectroscopy
A.2 Symbols
b Path length of the cuvette or sample holder
c Concentration
dp Particle hydrodynamic diameter
dmean Mean pore diameter
D Diffusion coefficient
Dpore Pore diameter
Dv(d)v Volume pore size distribution
e Dielectric constant
f Friction coefficient
f (ka) Henry’s function
g Pulse gradient
G(τ) Autocorrelation function as a function of time

Chapter A. Abbreviations and Symbols 100
kB Boltzmann constant
K Scattering vector
n Refraction index of the medium
P Pressure
r2 Correlation coefficient
RH Hydrodynamic average intensity radius of the particles
S Total surface area
T Temperature
T1 Nuclear spin-lattice relaxation time
T2 Nuclear spin-lattice relaxation time
UE Electrophoretic mobility
V Volume
Vtot Total intruded volume of mercury
z Zeta potential
γ Surface tension
δ Magnetic field pulse gradients
∆ Diffusion times
ε Molar absorptivity
εp Total porosity
η Viscosity
θ Contact angle
θ Detection angle
λ Wavelength
ρbulk Bulk density
ρtrue True density

BIBLIOGRAPHY 102
Bibliography
[1] P. M. M. Schrooyen, R. Meer, and C. G. Kruif, “Microencapsula-
tion: its application in nutrition,” Proceedings of the Nutrition Society,
vol. 60, pp. 475–479, 2001.
[2] D. L. McKay and J. B. Blumberg, “The role of tea in human health:
An update,” Journal of the American College of Nutrition, vol. 21,
no. 1, pp. 1–13, 2002.
[3] Q.-X. A. Sang, Y. Jin, R. G. Newcomer, S. C. Monroe, X. Fang, D. R.
Hurst, S. Lee, Q. Cao, and M. A. Schwartz, “Matrix metalloproteinase
inhibitors as prospective agents for the prevention and treatment of
cardiovascular and neoplastic diseases,” Current Topics in Medicinal
Chemistry, vol. 6, pp. 289–316, 2006.
[4] S. Rocha, R. Generalov, M. d. C. Pereira, I. Peres, P. Juzenas,
and M. A. Coelho, “Epigallocatechin gallate-loaded polysaccharide
nanoparticles for prostate cancer chemoprevention,” Nanomedicine,
vol. 6, no. 1, pp. 79–87, 2011.
[5] M. Makimura, M. Hirasawa, K. Kobayashi, J. Indo, S. Sakanaka,
T. Taguchi, and S. Otake, “Inhibitory effect of tea catechins on colla-
genase activity,” J Periodontol., vol. 64, no. 7, pp. 630–636, 1993.
[6] C. H. Lee, A. Singla, and Y. Lee, “Biomedical applications of col-
lagen,” International Journal of Pharmaceutics, vol. 221, pp. 1–22,
2001.
[7] A. Dube, K. Ng, J. A. Nicolazzo, and I. Larson, “Effective use of
reducing agents and nanoparticle encapsulation in stabilizing catechins
in alkaline solution,” Food Chemistry, vol. 122, pp. 662–667, 2010.
103 BIBLIOGRAPHY
[8] J.-Y. Fang, W.-R. Lee, S.-C. Shen, and Y.-L. Huanga, “Effect of lipo-
some encapsulation of tea catechins on their accumulation in basal cell
carcinomas,” Journal of Dermatological Science, vol. 42, no. 101-109,
p. 101, 2006.
[9] W. Friess, “Collagen - biomaterial for drug delivery,” European Jour-
nal of Pharmaceutics and Biopharmaceutics, vol. 45, pp. 113–136,
1998.
[10] V. Zague, “A new view concerning the effects of collagen hydrolysate
intake on skin properties,” Arch Dermatol Res, vol. 300, pp. 479–483,
2008.
[11] F. Cuneo, L. C. Paiva, A. M. P. Neto, S. S. Morais, and J. A. Farfan,
“Effect of dietary supplementation with collagen hydrolysates on bone
metabolism of postmenopausal women with low mineral density,” Ma-
turitas, vol. 65, pp. 253–257, 2010.
[12] J.-P. Bonjour, “Dietary protein: An essential nutrient for bone
health,” Journal of the American College of Nutrition, vol. 24, no. 6,
pp. 526–536, 2005.
[13] W. R. Gombotz and D. K. Pettit, “Biodegradable polymers for protein
and peptide drug delivery,” Bioconjugate Chem., vol. 6, pp. 332–351,
1995.
[14] K. G. H. Desai and H. J. Park, “Recent developments in microencapsu-
lation of food ingredients,” Drying Technology, vol. 23, pp. 1361–1394,
2005.
[15] P. R. Lockman, R. J. Mumper, M. A. Khan, and D. D. Allen,
“Nanoparticle technology for drug delivery across the blood-brain bar-
rier.” Drug Development and Industrial Pharmacy, vol. 28, no. 1, pp.
1–13, 2002.
[16] G. V. Barbosa-Canovas, E. Ortega-Rivas, P. Juliano, and H. Yan, Food
powders - phisical properties, processing, and functionality, ser. Food
engineering series. New York: Kluwer Academic/Plenum Publishers,
2005.

BIBLIOGRAPHY 104
[17] F. Ronsse, J. Pieters, and K. Dewettinck, “Modelling heat and mass
transfer in batch, top-spray fluidised bed coating processes,” Powder
Technology, vol. 190, pp. 170–175, 2009.
[18] S. Gouin, “Microencapsulation: industrial appraisal of existing tech-
nologies and trends,” Trends in Food Science & Technology, vol. 15,
pp. 330–347, 2004.
[19] P. Laine, P. Kylli, M. Heinonen, and K. Jouppila, “Storage stability
of microencapsulated cloudberry (Rubus chamaemorus) phenolics,” J.
Agric. Food Chem., vol. 56, pp. 11 251–11 261, 2008.
[20] S. A. Desobry, F. M. Netto, and T. P. Labuza, “Comparison of spray-
drying, drum-drying and freeze-drying for β-carotene encapsulation
and preservation,” Journal of Food Science, vol. 62, no. 6, pp. 1158–
1162, 1997.
[21] Z. Fang and B. Bhandari, “Encapsulation of polyphenols - a review,”
Trends in Food Science & Technology, vol. 21, pp. 510–523, 2010.
[22] Z. Liu, J. Zhou, Y. Zeng, and X. Ouyang, “The enhancement and en-
capsulation of agaricus bisporus flavor,” Journal of Food Engineering,
vol. 65, pp. 391–396, 2004.
[23] A. Gharsallaoui, G. Roudaut, O. Chambin, A. Voilley, and R. Saurel,
“Applications of spray-drying in microencapsulation of food ingredi-
ents: An overview,” Food Research International, vol. 40, pp. 1107–
1121, 2007.
[24] L. Deladino, P. S. Anbinder, A. S. Navarro, and M. N. Martino, “En-
capsulation of natural antioxidants extracted from ilex paraguarien-
sis,” Carbohydrate Polymers, vol. 71, no. 1, pp. 126 – 134, 2008.
[25] B. F. Gibbs, S. Kermasha, I. Alli, and C. N. Mulligan, “Encapsulation
in the food industry: a review.” International journal of food sciences
and nutrition, vol. 50, no. 3, pp. 213–224, 1999.
[26] K. Dewettinck, L. Deroo, W. Messens, and A. Huyghebaert, “Agglom-
eration tendency during top-spray fluidized bed coating with gums,”
105 BIBLIOGRAPHY
Lebensmittel-Wissenschaft und-Technologie, vol. 31, no. 6, pp. 576–
584, 1998.
[27] A. Madene, M. Jacquot, J. Scher, and S. Desobry, “Flavour encap-
sulation and controlled release - a review,” International Journal of
Food Science and Technology, vol. 41, pp. 1–21, 2006.
[28] M. Rosenberg, I. J. Kopelman, and Y. Talmon, “Factors affecting
retention in spray-drying microencapsulation of volatile materials,” J.
Agric. Food Chem., vol. 38, pp. 1288–1294, 1990.
[29] I. Goubet, J.-L. L. Quere, and A. J. Voilley, “Retention of aroma com-
pounds by carbohydrates: Influence of their physicochemical chara-
cteristics and of their physical state. a review,” J. Agric. Food Chem.,
vol. 46, pp. 1981–1990, 1998.
[30] G. A. Reineccius, “The spray drying of food flavors,” Drying Technol-
ogy, vol. 22, no. 6, pp. 1289–1324, 2004.
[31] F. Shahidi and X. Han, “Encapsulation of food ingredients,” Crit Rev
Food Sci Nutr., vol. 33, no. 6, pp. 501–547, 1993.
[32] S.-W. Lee, M.-H. Kim, and C.-K. Kim, “Encapsulation of ethanol by
spray drying technique: effects of sodium lauryl sulfate,” International
Journal of Pharmaceutics, vol. 187, pp. 193–198, 1999.
[33] C. I. Beristain, H. S. Garcıa, and E. J. Vernon-Carter, “Spray-
dried encapsulation of cardamom (Elettaria cardamomum) essential oil
with mesquite (Prosopis julifora) gum,” Lebensm.-Wiss. u.-Technol.,
vol. 34, pp. 398–401, 2001.
[34] J. Oses, M. Fabregat-Vazquez, R. Pedroza-Islas, S. A. Tomas, A. Cruz-
Orea, and J. I. Mate, “Development and characterization of composite
edible films based on whey protein isolate and mesquite gum,” Journal
of Food Engineering, vol. 92, pp. 56–62, 2009.
[35] C. Beristain and E. Vernon-Carter, “Studies on the interaction of ara-
bic (Acacia Senegal) and mesquite (Prosopis juliora) gum as emulsion
stabilizing agents for spray dried encapsulated orange peel oil.” Drying
Technology, vol. 29, pp. 645–667, 1995.

BIBLIOGRAPHY 106
[36] M. Rosenberg and T.-Y. Sheu, “Microencapsulation of volatiles by
spray-drying in whey protein-based wall systems,” Ini. Dairy Journal,
vol. 6, pp. 273–284, 1996.
[37] S. Young, X. Sarda, and M. Rosenberg, “Microencapsulating proper-
ties of whey proteins. 1. microencapsulation of anhydrous milk fat,”
Journal of Dairy Science, vol. 76, no. 10, pp. 2868–2877, 1993.
[38] A. Millqvist-Fureby, U. Elofsson, and B. Bergenstahl, “Surface com-
position of spray-dried milk protein-stabilised emulsions in relation to
pre-heat treatment of proteins,” Colloids and Surfaces B: Biointerfa-
ces, vol. 21, pp. 47–58, 2001.
[39] J. Imagi, T. Yamanouchi, K. Okada, M. Tanimoto, and R. Mat-
suno, “Properties of agents that effectively entrap liquid lipids,” Biosci
Biotechnol Biochem., vol. 56, no. 3, pp. 477–480, 1992.
[40] H. Yoshii, A. Soottitantawat, X.-D. Liu, T. Atarashi, T. Furuta,
S. Aishima, M. Ohgawara, and P. Linko, “Flavor release from spray-
dried maltodextrin gum arabic or soy matrices as a function of storage
relative humidity,” Innovative Food Science & Emerging Technologies,
vol. 2, pp. 55–61, 2001.
[41] A. Pierucci, L. Andrade, E. Baptista, N. Volpato, and M. Rocha-Leo,
“New microencapsulation system for ascorbic acid using pea protein
concentrate as coat protector.” J Microencapsul., vol. 23, no. 6, pp.
654–662, 2006.
[42] P. B. Malafaya, G. A. Silva, and R. L. Reis, “Natural-origin polymers
as carriers and scaffolds for biomolecules and cell delivery in tissue
engineering applications,” Advanced Drug Delivery Reviews, vol. 59,
pp. 207–233, 2007.
[43] S. L. Kosaraju, L. Dath, and A. Lawrence, “Preparation and charac-
terisation of chitosan microspheres for antioxidant delivery,” Carbohy-
drate Polymers, vol. 64, pp. 163–167, 2006.
[44] B. Hu, C. Pan, Y. Sun, Z. Hou, H. Ye, B. Hu, and X. Zeng, “Optimiza-
tion of fabrication parameters to produce chitosan-tripolyphosphate
107 BIBLIOGRAPHY
nanoparticles for delivery of tea catechins,” J. Agric. Food Chem.,
vol. 56, pp. 7451–7458, 2008.
[45] V. Sinha, A. Singla, S. Wadhawan, R. Kaushik, R. Kumria, K. Bansal,
and S. Dhawan, “Chitosan microspheres as a potential carrier for
drugs,” International Journal of Pharmaceutics, vol. 274, pp. 1–33,
2004.
[46] G. A. Reineccius and S. Anandaraman, “Stability of encapsulated or-
ange peel oil,” Food Technology, vol. 40, no. 11, pp. 88–93, 1986.
[47] L. A. Wagner and J. J. Warthesen, “Stability of spray-dried encapsu-
lated carrot carotenes,” Journal of Food Science, vol. 60, no. 5, pp.
1048–1053, 1995.
[48] A. M. Righetto and F. M. Netto, “Effect of encapsulating materials on
water sorption, glass transition and stability of juice from immature
acerola,” International Journal of Food Properties, vol. 8, pp. 337–346,
2005.
[49] S. Ersus and U. Yurdagel, “Microencapsulation of anthocyanin pig-
ments of black carrot (Daucuscarota L.) by spray drier,” Journal of
Food Engineering, vol. 80, pp. 805–812, 2007.
[50] L. Zhang, D. Mou, and Y. Du, “Procyanidins: Extraction and mi-
croencapsulation,” Journal of the Science of Food and Agriculture,
vol. 87, pp. 2192–2197, 2007.
[51] J. Loksuwan, “Characteristics of microencapsulated β-carotene formed
by spray drying with modified tapioca starch, native tapioca starch
and maltodextrin,” Food Hydrocolloids, vol. 21, pp. 928–935, 2007.
[52] Y.-H. Kuan, R. Bhat, C. Senan, P. A. Williams, and A. A. Karim,
“Effects of ultraviolet irradiation on the physicochemical and func-
tional properties of gum arabic,” J. Agric. Food Chem., vol. 57, pp.
9154–9159, 2009.
[53] D. Kanakdande, R. Bhosale, and R. S. Singhal, “Stability of cumin
oleoresin microencapsulated in different combination of gum arabic,
BIBLIOGRAPHY 108
maltodextrin and modiffied starch,” Carbohydrate Polymers, vol. 67,
pp. 536–541, 2007.
[54] J. Goldstein, D. Newbury, D. Joy, C. Lyman, P. Echlin, E. Lifshin,
L. Sawyer, and J. Michael, Scanning electron microscopy and x-ray
microanalysis, Volume 1, third edition ed., ser. Scanning electron mi-
croscopy and x-ray microanalysis. New York: Kluver Academic/
Plenim Publishers, 2003, vol. 1.
[55] L. Champion-Lapalu, A. Wilson, G. Fuchs, D. Martin, and J.-P.
Planche, “Cryo-scanning electron microscopy: A new tool for inter-
pretation of fracture studies in bitumen/polymer blends,” Energy &
Fuels, vol. 16, pp. 143–147, 2002.
[56] J. L. Alonso and W. H. Goldmann, “Feeling the forces: atomic force
microscopy in cell biology.” Life Sciences, vol. 72, no. 23, pp. 2553–
2560, 2003.
[57] M. J. Wozniak, N. Kawazoe, T. Tateishi, and G. Chen, “Monitoring
of mechanical properties of serially passaged bovine articular chon-
drocytes by atomic force microscopy.” Micron Oxford England 1993,
vol. 40, no. 8, pp. 870–875, 2009.
[58] M. Schneider and T. F. McKenna, “Comparative study of methods
for the measurement of particle size and size distribution of polymeric
emulsions,” Part. Part. Syst. Charact., vol. 19, pp. 28–37, 2002.
[59] H. Mirhosseini, C. Tan, N. Hamid, and S. Yusof, “Effect of arabic
gum, xanthan gum and orange oil on flavor release from diluted orange
beverage emulsion,” Food Chemistry, vol. 107, pp. 1161–1172, 2007.
[60] A. Malloy and B. Carr, “Nanoparticle tracking analysis - thehalosys-
tem,” Part. Part. Syst. Charact., vol. 23, pp. 197–204, 2006.
[61] P. Saravanapavan and L. L. Hench, “Mesoporous calcium silicate
glasses. II. textural characterisation,” Journal of Non-Crystalline
Solids, vol. 318, no. 1-2, pp. 14–26, 2003.
109 BIBLIOGRAPHY
[62] D. Brabazon and A. Raffer, “Advanced characterization techniques
for nanostructures,” in Emerging Nanotechnologies for Manufactur-
ing, W. Ahmed and M. J. Jackson, Eds. Boston: William Andrew
Publishing, 2010, pp. 59–91.
[63] C. A. L. y Leon, “New perspectives in mercury porosimetry,” Advances
in Colloid and Interface Science, vol. 76-77, pp. 341–372, 1998.
[64] S. Westermarck, A. M. Juppob, L. Kervinen, and J. Yliruusib, “Pore
structure and surface area of mannitol powder, granules and tablets
determined with mercury porosimetry and nitrogen adsorption,” Eu-
ropean Journal of Pharmaceutics and Biopharmaceutics, vol. 46, pp.
61–68, 1998.
[65] W. Duvernay, J. Assad, C. Sabliov, M. Lima, and Z. Xu, “Microwave
extraction of antioxidant components from rice bran,” Pharmaceutical
Engineering, vol. 25, no. 4, pp. 1–5, 2005.
[66] G. Raman and V. G. Gaikar, “Microwave-assisted extraction of piper-
ine from Piper nigrum,” Ind. Eng. Chem. Res., vol. 41, pp. 2521–2528,
2002.
[67] S. Shah, R. C. Richter, and H. S. Kingston, “Microwave-assisted or-
ganic extraction and evaporation: An integrated approach,” LCGC
North America, vol. 20, no. 3, pp. 280–286, 2002.
[68] X. Pan, G. Niu, and H. Liu, “Microwave-assisted extraction of tea
polyphenols and tea caffeine from green tea leaves,” Chemical Engi-
neering and Processing, vol. 42, pp. 129–133, 2003.
[69] O. J. Williams, G. V. Raghavan, V. Orsat, and J. Dai, “Microwave
assisted extraction of capsaicinoids from capsicum fruit,” Journal of
Food Biochemistry, vol. 28, pp. 113–122, 2004.
[70] N. Hong, V. Yaylayan, G. Raghavan, J. Par, and J. Blanger,
“Microwave-assisted extraction of phenolic compounds from grape
seed,” Nat Prod Lett., vol. 15, no. 3, pp. 197–204, 2001.
[71] Z. Guo, Q. Jin, G. Fan, Y. Duan, C. Qin, and M. Wen, “Microwave-
assisted extraction of effective constituents from a chinese herbal
BIBLIOGRAPHY 110
medicine radix puerariae,” Analytica Chimica Acta, vol. 436, pp. 41–
47, 2001.
[72] G. A. C. Kiss, E. Forgcs, T. Cserhti, T. Mota, H. Morais, and
A. Ramos, “Optimisation of the microwave-assisted extraction of pig-
ments from paprika (Capsicum annuum L.) powders,” Journal of
Chromatography A, vol. 889, pp. 41–49, 2000.
[73] J. Greener, B. Abbasi, and E. Kumacheva, “Attenuated total reflec-
tion fourier transform infrared spectroscopy for on-chip monitoring of
solute concentrations,” Lab Chip,, vol. 10, pp. 1561–1566, 2010.
[74] D. E. Bugay, “Characterization of the solid-state: spectroscopic tech-
niques,” Advanced Drug Delivery Reviews, vol. 48, pp. 43–65, 2001.
[75] J. N. S. Evans, “Biomolecular NMR spectroscopy.” Oxford University
Press, 1995.
[76] H. Gunther, NMR Spectroscopy. Basic principles, concepts and ap-
plication in chemistry, second edition ed., ser. Scanning electron mi-
croscopy and x-ray microanalysis. New York: John Wiley & Sons,
1994.
[77] Y. Cohen, L. Avram, and L. Frish, “Diffusion NMR spectroscopy in
supramolecular and combinatorial chemistry : An old parameter-new
insights,” Angewandte Chemie International Edition, vol. 44, no. 4,
pp. 520–544, 2005.
[78] D. Y. D. Atilla Ambrus, “Diffusion-ordered nuclear magnetic reso-
nance spectroscopy for analysis of DNA secondary structural ele-
ments,” Analytical Biochemistry, vol. 367, pp. 56–67, 2007.
[79] T. Brand, E. J. Cabrita, and S. Berger, “Intermolecular interaction
as investigated by NOE and diffusion studies,” Progress in Nuclear
Magnetic Resonance Spectroscopy, vol. 46, pp. 159–196, 2005.
[80] C. J. Johnson, “Diffusion ordered nuclear magnetic resonance spec-
troscopy: principles and applications,” Progress in Nuclear Magnetic
Resonance Spectroscopy, vol. 34, pp. 203–256, 1999.
111 BIBLIOGRAPHY
[81] D. Wu, A. Chen, and C. S. Johnson, “An improved diffusion ordered
spectroscopy experiment incorporating bipolar-gradient pulses,” Jour-
nal of Magnetic Resonance, vol. Series A, no. 115, pp. 260–264, 1995.
[82] E. J. Cabrita and S. Berger, “DOSY studies of hydrogen bond associa-
tion: Tetramethylsilane as a reference compound for diffusion studies,”
Magn. Reson. Chem., vol. 39, no. S1, pp. S142–S148, 2001.
[83] Z. Cheng, J. Moore, and L. L. Yu, “High-throughput relative DPPH
radical scavenging capacity assay,” J. Agric. Food Chem., vol. 54, pp.
7429–7436, 2006.
[84] I. Henriksen, S. A. Sande, G. Smistad, T. Agren, and J. Karlsen, “In
vitro evaluation of drug release kinetics from liposomes by fractional
dialysis,” International Journal of Pharmaceutics, vol. 119, pp. 231–
238, 1995.
[85] A. Geeze, M. Venier-Julienne, D. Mathieu, R. Filmon, R. Phan-Tan-
Luu, and J. Benoit, “Development of 5-iodo-2’-deoxyuridine milling
process to reduce initial burst release from PLGA microparticles,”
International Journal of Pharmaceutics, vol. 178, pp. 257–268, 1999.
[86] Y. Luo, D. Chen, L. Ren, X. Zhao, and J. Qin, “Solid lipid nanoparti-
cles for enhancing vinpocetine’s oral bioavailability,” Journal of Con-
trolled Release, vol. 114, pp. 53–59, 2006.
[87] W. R. Duan, D. S. Garner, S. D. Williams, C. L. Funckes-Shippy, I. S.
Spath, and E. A. G. Blomme, “Comparison of immunohistochemistry
for activated caspase-3 and cleaved cytokeratin 18 with the TUNEL
method for quantification of apoptosis in histological sections of pc-3
subcutaneous xenografts,” Journal of Pathology, vol. 199, no. 2, pp.
221–228, 2003.
[88] B. A. Warden, L. S. Smith, G. R. Beecher, D. A. Balentine, and B. A.
Clevidence, “Catechins are bioavailable in men and women drinking
black tea throughout the day,” The Journal of Nutrition, vol. 131,
no. 6, pp. 1731–1737, 2001.

BIBLIOGRAPHY 112
[89] Y. Gilgun-Sherki, E. Melamed, and D. Offen, “Oxidative stress
induced-neurodegenerative diseases: the need for antioxidants that
penetrate the blood brain barrier,” Neuropharmacology, vol. 40, pp.
959–975, 2001.
[90] D. V. Ratnam, D. Ankola, V. Bhardwaj, D. Sahana, and M. R. Kumar,
“Role of antioxidants in prophylaxis and therapy: A pharmaceutical
perspective,” Journal of Controlled Release, vol. 113, pp. 189–207,
2006.
[91] H. Sies, “Oxidative stress: oxidants and antioxidants,” Experimental
Physiology, vol. 82, pp. 291–295, 1997.
[92] J. Fuchs and J. Thiele, “The role of oxygen in cutaneous photodynamic
therapy,” Free Radic Biol Med., vol. 24, no. 5, pp. 835–847, 1998.
[93] P. Juzenas, W. Chen, Y.-P. Sun, M. A. N. Coelho, R. Generalov,
N. Generalova, and I. L. Christensen, “Quantum dots and nanopar-
ticles for photodynamic and radiation therapies of cancer,” Advanced
Drug Delivery Reviews, vol. 60, pp. 1600–1614, 2008.
[94] J. D. Carter, N. N. Cheng, Y. Qu, G. D. Suarez, and T. Guo,
“Nanoscale energy deposition by X-ray absorbing nanostructures,” J.
Phys. Chem. B, vol. 111, no. 40, pp. 11 622–11 625, 2007.
[95] A. A. Krasnovsky, N. N. Drozdova, A. V. Ivanov, and R. V. Ambart-
sumian, “Activation of molecular oxygen by infrared laser radiation in
pigment-free aerobic systems,” Biochemistry (Moscow), vol. 68, no. 9,
pp. 963–966, 2003.
[96] S. Jockusch, N. J. Turro, E. K. Thompson, M. Gouterman, J. B. Cal-
lisb, and G. E. Khalil, “Singlet molecular oxygen by direct excitation,”
Photochemical & Photobiological Sciences, vol. 7, pp. 235–239, 2008.
[97] L.-O. Klotz, K.-D. Kroncke, and H. Sies, “Singlet oxygen-induced si-
gnaling effects in mammalian cells,” Photochem. Photobiol. Sci., vol. 2,
pp. 88–94, 2003.
[98] H. Sies, “Strategies of antioxidant defense,” European Journal of Bio-
chemistry, vol. 215, no. 2, pp. 213–219, 1993.

113 BIBLIOGRAPHY
[99] T. Finkel and N. J. Holbrook, “Oxidants, oxidative stress and the
biology of ageing,” Nature, vol. 408, pp. 239–247, 2000.
[100] B. Halliwell, “Free radicals, antioxidants, and human disease: curios-
ity, cause, or consequence,” The Lancet, vol. 344, no. 8924, pp. 721–
724, 1994.
[101] C. Kandaswami and E. J. Middleton, “Free radical scavenging and
antioxidant activity of plant flavonoids,” Adv Exp Med Biol., vol. 366,
pp. 351–376, 1994.
[102] E. J. Middleton, C. Kandaswami, and T. C. Theoharides, “The effects
of plant flavonoids on mammalian cells: Implications for inflammation,
heart disease, and cancer,” Pharmacol Rev, vol. 52, no. 4, pp. 673–751,
2000.
[103] W. Stahl, H. v. d. Berg, J. Arthur, A. Bast, J. Dainty, R. M. Faulks,
C. Gaartner, G. Haenen, P. Hollman, B. Holst, F. J. Kelly, M. C. Poli-
dori, C. Rice-Evans, S. Southon, T. v. Vliet, and Jos, “Bioavailability
and metabolism,” Molecular Aspects of Medicine, vol. 23, pp. 39–100,
2002.
[104] K. Dvorakova, R. T. Dorr, S. Valcic, B. Timmermann, and D. S.
Alberts, “Pharmacokinetics of the green tea derivatives, EGCG, by
the topical route of administration in mouse and human skin,” Cancer
Chemother Pharmacol, vol. 43, no. 4, pp. 331–335, 1999.
[105] F. Catterall, L. J. King, M. N. Clifford, and C. Ioannides, “Bioavai-
lability of dietary doses of 3H-labelled tea antioxidants (+)-catechin
and (-)-epicatechin in rat,” Xenobiotica, vol. 33, no. 7, p. 743, 2003.
[106] Y. Cai, N. D. Anavy, and H.-H. S. Chow, “Contribution of presystemic
hepatic extraction to the low oral bioavailability of green tea catechins
in rats,” Drug Metabolism and Disposition, vol. 30, no. 11, pp. 1246–
1249, 2002.
[107] M. N. Kumar, R. A. Muzzarelli, C. Muzzarelli, H. Sashiwa, and A. J.
Domb, “Chitosan chemistry and pharmaceutical perspectives,” Chem.
Rev., vol. 104, pp. 6017–6084, 2004.
BIBLIOGRAPHY 114
[108] T. Y. Sheu and M. Rosenberg, “Microstructure of microcapsules con-
sisting of whey proteins and carbohydrates,” Journal of Food Science,
vol. 63, no. 3, pp. 491–494, 1998.
[109] R. Vehring, “Pharmaceutical particle engineering via spray drying,”
Pharmaceutical Research, vol. 25, no. 5, pp. 999–1022, 2008.
[110] M. Rosenberg, I. J. Kopelman, and Y. Talmon, “A scanning electron
microscopy study of microencapsulation,” Journal of Food Science,
vol. 50, no. 1, pp. 139–144, 1985.
[111] B. Baras, M. A. Benoit, and J. Gillard, “Parameters influencing the
antigen release from spray-dried poly(dl-lactide) microparticles,” In-
ternational Journal of Pharmaceutics, vol. 200, no. 1, pp. 133–145,
2000.
[112] Y. J. Fu, F. L. Mi, T. B. Wong, and S. S. Shyu, “Characteristic and
controlled release of anticancer drug loaded poly (D,L-lactide) mi-
croparticles prepared by spray drying technique,” Journal of Microen-
capsulation, vol. 18, no. 6, pp. 733–747, 2001.
[113] H. Y. Li and J. Birchall, “Chitosan-modified dry powder formulations
for pulmonary gene delivery,” Pharmaceutical Research, vol. 23, no. 5,
pp. 941–950, 2006.
[114] L. Mu and S. S. Feng, “Fabrication, characterization and in vitro re-
lease of paclitaxel (taxol (r)) loaded poly (lactic-co-glycolic acid) mi-
crospheres prepared by spray drying technique with lipid/cholesterol
emulsifiers,” Journal of Controlled Release, vol. 76, no. 3, pp. 239–254,
2001.
[115] T. Y. Ting, I. Gonda, and E. M. Gipps, “Microparticles of polyvinyl-
alcohol for nasal delivery .1. generation by spray-drying and spray-
desolvation,” Pharmaceutical Research, vol. 9, no. 10, pp. 1330–1335,
1992.
[116] F.-J. Wang and C.-H. Wang, “Sustained release of etanidazole from
spray dried microspheres prepared by non-halogenated solvents,”
Journal of Controlled Release, vol. 81, no. 3, pp. 263–280, 2002.
115 BIBLIOGRAPHY
[117] M. Rosenberg, Y. Talmon, and I. J. Kopelman, “The microstructure
of spray-dried microcapsules,” Food Microstructure, vol. 7, no. 1, pp.
15–23, 1988.
[118] J. F. P. S. Gomes, S. Rocha, M. C. Pereira, I. Peres, S. Moreno,
J. Toca-Herrera, and M. A. N. Coelho, “Lipid/particle assemblies
based on maltodextrin-gum arabic core as bio-carriers,” Colloids and
Surfaces B-Biointerfaces, vol. 76, no. 2, pp. 449–455, 2010.
[119] D. Alvarez and A. G. Borrego, “Apparent versus true density for
the volume-to-weight transformation in coal blends,” Journal of
Microscopy-Oxford, vol. 220, pp. 221–228, 2005.
[120] J. Elversson, K. Andersson, and A. Millqvist-Fureby, “An atomic force
microscopy approach for assessment of particle density applied to sin-
gle spray-dried carbohydrate particles,” Journal of Pharmaceutical
Sciences, vol. 96, no. 4, pp. 905–912, 2007.
[121] J. Elversson and A. Millqvist-Fureby, “Particle size and density in
spray drying - effects of carbohydrate properties,” Journal of Phar-
maceutical Sciences, vol. 94, no. 9, pp. 2049–2060, 2005.
[122] BS2955, Glossary of terms relating to powders, ser. Glossary of terms
relating to powders. London: British Standards Institution, 1958.
[123] J. Swarbrick, Encyclopedia of Pharmaceutical Technology, 3rd ed.
Taylor & Francis Group, 2006, vol. 6.
[124] C. S. Eskilsson and E. Bjorklund, “Analytical-scale microwave-assisted
extraction,” Journal of Chromatography A, vol. 902, no. 1, pp. 227–
250, 2000.
[125] Z. Pineiro, M. Palma, and C. G. Barroso, “Determination of catechins
by means of extraction with pressurized liquids,” Journal of Chro-
matography A, vol. 1026, no. 1-2, pp. 19–23, 2004.
[126] A. Perva-Uzunalic, M. Skerget, Z. Knez, B. Weinreich, F. Otto, and
S. Gruner, “Extraction of active ingredients from green tea (Camellia
sinensis): Extraction efficiency of major catechins and caffeine,” Food
Chemistry, vol. 96, no. 4, pp. 597–605, 2006.
BIBLIOGRAPHY 116
[127] L. Y. Zhang and S. L. Kosaraju, “Biopolymeric delivery system for
controlled release of polyphenolic antioxidants,” European Polymer
Journal, vol. 43, no. 7, pp. 2956–2966, 2007.
[128] A. Barras, A. Mezzetti, A. Richard, S. Lazzaroni, S. Roux, P. Mel-
nyk, D. Betbeder, and N. Monfilliette-Dupont, “Formulation and cha-
racterization of polyphenol-loaded lipid nanocapsules,” International
Journal of Pharmaceutics, vol. 379, no. 2, pp. 270–277, 2009.
[129] W. Pigman, D. Horton, and A. Herp, “The carbohydrates: chemistry
and biochemistry,” D. H. . A. H. W. Pigman, Ed., 2009, vol. 1.
[130] J. Xu, T. Tan, J.-C. Janson, L. Kenne, and C. Sandstrm, “NMR
studies on the interaction between (-)-epigallocatechin gallate and cy-
clodextrins, free and bonded to silica gels,” Carbohydrate Research,
vol. 342, no. 6, pp. 843–850, 2007.
[131] Y. Dror, Y. Cohen, and R. Yerushalmi-Rozen, “Structure of gum ara-
bic in aqueous solution,” Journal of Polymer Science: Part B: Polymer
Physics, vol. 44, no. 22, pp. 3265–3271, 2006.
[132] L. Ninni, A. Meirelles, and G. Maurer, “Thermodynamic proper-
ties of aqueous solutions of maltodextrins from laser-light scatter-
ing, calorimetry and isopiestic investigations,” Carbohydrate Poly-
mers, vol. 59, no. 3, pp. 289–303, 2005.
[133] D. D. Mclntyre, H. Ceri, and H. J. Vogel, “Nuclear magnetic resonance
studies of the heteropolysaccharides alginate, gum arabic and gum
xanthan,” Starch - Starke, vol. 48, no. 7-8, pp. 285–291, 1996.
[134] M. L. German, A. L. Blumenfeld, V. P. Yuryev, and V. B. Tolstogu-
zov, “An NMR study of structure formation in maltodextrin systems,”
Carbohydrate Polymers, vol. 11, no. 2, pp. 139–146, 1989.
[135] V. I. Bakhmutov, Practical NMR Relaxation for Chemists. Chich-
ester: John Wiley & Sons, 2004.
[136] S. W. R. Freeman and R. R. Ernst, “High-resolution NMR study of
relaxation mechanisms in a two-spin system,” J. Chem. Phys., vol. 52,
no. 3, pp. 1529–1544, 1970.

117 BIBLIOGRAPHY
[137] B. L. T. Ray Freeman, H. D. W. Hill and L. D. Hall, “Dipolar con-
tribution to NMR spin-lattice relaxation of protons,” J. Chem. Phys.,
vol. 61, no. 11, pp. 4466–4473, 1974.
[138] J. Hong, H. Lu, X. Meng, J. Ryu, Y. Hara, and Y. C.S., “Stability,
cellular uptake, biotransformation, and efflux of tea polyphenol (-)-
pigallocatechin-3-gallate in ht-29 human colon adenocarcinoma cells,”
Cancer Res., vol. 62, no. 24, pp. 7241–7246, 2002.
[139] L. Chung, T. Cheung, S. Kong, K. Fung, Y. Choy, Z. Chan, and
T. Kwok, “Induction of apoptosis by green tea catechins in human
prostate cancer du145 cells,” Life Sci., vol. 68, no. 10, pp. 1207–1214,
2001.
[140] A. Paschka, R. Butler, and C. Young, “Induction of apoptosis
in prostate cancer cell lines by the green tea component, (-)-
epigallocatechin-3-gallate,” Cancer Lett., vol. 130, no. 1-2, pp. 1–7,
1998.
[141] T. G. Shutava, S. S. Balkundi, P. Vangala, J. J. Steffan, R. L. Bigelow,
J. A. Cardelli, D. P. ONeal, and Y. M. Lvov, “Layer-by-layer-coated
gelatin nanoparticles as a vehicle for delivery of natural polyphenols,”
ACS Nano, vol. 3, no. 7, p. 18771885, 2009.
[142] I. A. Siddiqui, V. M. Adhami, D. J. Bharali, B. B. Hafeez, M. Asim,
S. I. Khwaja, N. Ahmad, H. Cui, S. A. Mousa, and H. Mukhtar, “In-
troducing nanochemoprevention as a novel approach for cancer con-
trol: Proof of principle with green tea polyphenol epigallocatechin-3-
gallate,” Cancer Res., vol. 69, no. 5, pp. 1712–1716, 2009.
[143] A. R. A. Abd-Allah, A. A. Al-Majed, A. M. Mostafa, O. A. Al-
Shabanah, A. G. E. L. Din, and M. N. Nagi, “Protective effect of
arabic gum against cardiotoxicity induced by doxorubicin in mice: A
possible mechanism of protection,” J Biochem Molecular Toxicology,
vol. 16, no. 5, pp. 254–259, 2002.
[144] M. P. Desai, V. Labhasetwar, E. Walter, R. J. Levy, and G. L. Amidon,
“The mechanism of uptake of biodegradable microparticles in caco-2

BIBLIOGRAPHY 118
cells is size dependent,” Pharmaceutical Research, vol. 14, no. 11, pp.
1568–1573, 1997.
[145] J. Rejman, V. Oberle, I. S. Zuhorn, and D. Hoekstra, “Size-dependent
internalization of particles via the pathways of clathrinand caveolae-
mediated endocytosis,” Biochem. J., vol. 377, pp. 159–169, 2004.
[146] F. Yan, C. Zhang, Y. Zheng, L. Mei, L. Tang, C. Song, H. Sun, and
L. Huang, “The effect of poloxamer 188 on nanoparticle morphology,
size, cancer cell uptake, and cytotoxicity,” Nanomedicine, vol. 6, no. 1,
pp. 170–178, 2010.
[147] L. Zhang, F. Yu, A. Cole, B. Chertok, A. David, J. Wang, and V. Yang,
“Gum arabic-coated magnetic nanoparticles for potential application
in simultaneous magnetic targeting and tumor imaging,” AAPS J.,
vol. 11, no. 4, pp. 693–699, 2009.
[148] M. G. Qaddoumi, H. Ueda, J. Yang, J. Davda, V. Labhasetwar, and
V. H. L. Lee, “The characteristics and mechanisms of uptake of PLGA
nanoparticles in rabbit conjunctival epithelial cell layers,” Pharmaceu-
tical Research, vol. 21, no. 4, pp. 641–648, 2004.
[149] G. Zernia and D. Huster, Investigation of Collagen Dynamics by Solid-
State NMR Spectroscopy, ser. Modern Magnetic Resonance. Springer
Netherlands, 2006.
[150] N. O. Metreveli, K. K. Jariashvili, L. O. Namicheishvili, D. V. Svin-
tradze, E. N. Chikvaidze, A. Sionkowska, and J. Skopinska, “UV-vis
and FT-IR spectra of ultraviolet irradiated collagen in the presence of
antioxidant ascorbic acid,” Ecotoxicology and Environmental Safety,
vol. 73, pp. 448–455, 2010.
[151] F. Guillerminet, H. Beaupied, V. Fabien-Soule, D. Tome, C.-L. Ben-
hamou, C. Roux, and A. Blais, “Hydrolyzed collagen improves bone
metabolism and biomechanical parameters in ovariectomized mice: An
in vitro and in vivo study,” Bone, vol. 46, pp. 827–834, 2010.
[152] Y. Takeuchi, K. Nakayama, and T. Matsumoto, “Differentiation and
cell surface expression of transforming growth factor-beta receptors are
119 BIBLIOGRAPHY
regulated by interaction with matrix collagen in murine osteoblastic
cells,” The Journal of Biological Chemistry, vol. 271, no. 7, pp. 3938–
3944, 1996.
[153] M. C. Gomez-Guillen, B. Gimenez, M. E. Lopez-Caballero, and M. M.
P, “Functional and bioactive properties of collagen and gelatin from
alternative sources: A review,” Food Hydrocolloids, pp. 1–15, 2011.
[154] S. E. Kim and E. Mendis, “Bioactive compounds from marine pro-
cessing byproducts - a review,” Food Research International, vol. 39,
pp. 383–393, 2006.
[155] J. Wu, M. Fujioka, K. Sugimoto, G. Mu, and Y. Ishimi, “Assess-
ment of effectiveness of oral administration of collagen peptide on bone
metabolism in growing and mature rats,” Journal of Bone and Mineral
Metabolism, vol. 22, pp. 547–553, 2004.
[156] Y. Nomura, K. Oohashi, M. Watanabe, and S. Kasugai, “Increase in
bone mineral density through oral administration of shark gelatin to
ovariectomized rats,” Nutrition, vol. 21, no. 11, pp. 1120–1126, 2005.
[157] M. Saito, C. Kiyose, T. Higuch, N. Uchida, and H. Susuki, “Effect of
collagen hydrolysates from salmon and trout skins on the lipid profile
in rats,” J. Agric. Food Chem., vol. 57, pp. 10 477–10 482, 2009.
[158] M. Nemati, M. Oveisi, H. Abdollahi, and S. O., “Differentiation of
bovine and porcine gelatins using principal component analysis,” Jour-
nal of Pharmaceutical and Biomedical Analysis, vol. 34, pp. 485–492,
2004.
[159] P. Benito-Ruiz, M. M. Camacho-Zambrano, J. N. Carrillo-Arcentales,
M. A. Mestanza-Peralta, C. A. Vallejo-Flores, S. V. Vargas-Lopez,
R. A. Villacıs-Tamayo, and L. A. Zurita-Gavilanes, “A randomized
controlled trial on the efficacy and safety of a food ingredient, collagen
hydrolysate, for improving joint comfort,” International Journal of
Food Sciences and Nutrition, vol. 60, no. S2, pp. 99–113, 2009.
[160] L. Zuckley, K. M. Angelopoulou, M. R. Carpenter, S. McCarthy, B. A.
Meredith, G. Kline, M. Rowinski, D. Smith, T. J. Angelopoulos, and
BIBLIOGRAPHY 120
J. M. Rippe, “Collagen hydrolysate improves joint function in adults
with mild symptoms of osteoarthritis of the knee,” Medicine & Science
in Sports & Exercise, vol. 36, no. 5, pp. S153–S154, 2004.
[161] H. Hou, B. Li, X. Zhao, Y. Zhuang, G. Ren, M. Yan, Y. Cai, X. Zhang,
and L. Chen, “The effect of pacific cod (Gadus macrocephalus) skin
gelatin polypeptides on uv radiation-induced skin photoaging in ICR
mice,” Food Chemistry, vol. 115, no. 3, pp. 945–950, 2009.
[162] M. D. Rees, E. C. Kennett, J. M. Whitelock, and M. J. Davies, “Oxida-
tive damage to extracellular matrix and its role in human pathologies,”
Free Radical Biology & Medicine, vol. 44, pp. 1973–2001, 2001.
[163] R. Pedroza-Islas, E. Vernon-Carter, C. Duran-Domınguez, and
S. Trejo-Martınez, “Using biopolymer blends for shrimp feedstuff mi-
croencapsulation - I. microcapsule particle size, morphology and mi-
crostructure,” Food Research International, vol. 32, pp. 367–374, 1999.
[164] Z. Y. Zhang, Q. N. Ping, and B. Xiao, “Microencapsulation and cha-
racterization of tramadol-resin complexes,” Journal of Controlled Re-
lease, vol. 66, pp. 107–113, 2000.
[165] M. I. Re, “Microencapsulation by spray drying,” Drying Technology,
vol. 16, pp. 1195–1236, 1998.
[166] H. Yushu and S. Venkatraman, “The effect of process variables on
the morphology and release characteristics of protein-loaded PLGA
particles,” Journal of Applied Polymer Science, vol. 101, no. 5, pp.
3053–3061, 2006.
[167] D. Walton and C. Mumford, “The morphology of spray-dried parti-
clesthe effect of process variables upon the morphology of spray-dried
particles,” Chemical Engineering Research and Design, vol. 77, no. 5,
pp. 442–460, 1999.
[168] I. Peres, S. Rocha, J. Gomes, S. Morais, M. C. Pereira, and M. Coelho,
“Preservation of catechin antioxidant properties loaded in carbohy-
drate nanoparticles,” Carbohydrate Polymers, vol. 86, no. 1, pp. 147 –
153, 2011.

121 BIBLIOGRAPHY
[169] R. H. Muller, C. Jacobs, and O. Kayser, “Nanosuspensions as par-
ticulate drug formulations in therapy rationale for development and
what we can expect for the future,” Advanced Drug Delivery Reviews,
vol. 47, no. 1, pp. 3–19, 2001.
[170] B. C. Vidal and M. L. S. Mello, “Collagen type I amide I band infrared
spectroscopy,” Micron, vol. 42, pp. 283–289, 2011.
[171] I. Peres, S. Rocha, M. C. Pereira, M. Coelho, M. Rangel, and
G. Ivanova, “NMR structural analysis of epigallocatechin gallate
loaded polysaccharide nanoparticles,” Carbohydrate Polymers, vol. 82,
pp. 861–866, 2010.
[172] E. Balmayor, K. Tuzlakoglu, H. Azevedo, and R. Reis, “Preparation
and characterization of starch-poly-ε-caprolactone microparticles in-
corporating bioactive agents for drug delivery and tissue engineering
applications,” Acta Biomaterialia, vol. 5, pp. 1035–1045, 2009.