estimation of change of moe in the scs based on cbr … · yang et al. (2000) used an improved...
TRANSCRIPT
Yunyan Du
2010-05-26
The State Key Laboratory of Resources and Environmental Information System Institute of Geographic Science and Natural Resources Research, CAS, Beijing
Estimation of change of MOEin the SCS based on CBR
Outline
Introduction
methodology
Case Study
Conclusion

1.Introduction
The importance of studying Meso‐scale
Ocean Eddies (MOEs)
The main methods to study change of MOEs
The advantages of using CBR to solve
problems about MOEs

Introduction— — The importance of studying MOEs
The MOE is one of the important factors that decide the change of the ocean. They play important roles in dynamics as well as
the transport of heat, salt, and other chemical properties in the ocean.In the recent decades, domestic and foreign
scientists have done lots of work on the China's offshore MOEs

Introduction—Three Main Ways to study change of MOEs
Numerical simulation method Yang et al. (2000) used an improved eddy-resolving POM model to simulate the
evolution of MOEs.Li et al. (2003) quantitatively simulated the developing mechanism of cold/warm
eddy in the SCS by using POM model.
Statistical methods Qian et al. (2000) studied the abnormal sea level, as well as its seasonal and yearly
variation in the SCS by examining T/P altimeter data.Lin (2005) statistically analyzed characteristics of eddies’ origin 、movement、
occurrence probability、contribution to the variation in sea level by studying the T/P mixed satellite ERS1 or ERS 2 altimeter.Application methods Using Remote sensing
Wang etc. (2001, 2004) calculated the eddy flow field by using remotely sensed altimeter data.
Ji (2002) used Hough ellipse detection method to automatically identify MOEs.Ge et al. (2007) used multi-fractal technology to identify ocean eddy on the basis of
the self-similarity of its physical shape.

Introduction—The disadvantage of three main ways to study MOEs
Numerical simulation methodTime consuming is a big issue for this method as the parameters must be retuned and simulation must be rerun due to change of the boundary conditions when different regions are studied.Statistical methods There is no way for these methods to quantitatively predict the occurrence of ocean eddy.Remote sensing methodsIt is unable to analyze and predict its evolution trend
none of these methods is able to quantitatively and accurately describe the ocean eddy and its evolution. Therefore, a new method is in great of need.

Introduction — What is CBR
Case-based reasoning (CBR) means to solve problems and make decision based on reasoning from similar previously solved problems. 3 Advantages of this method:
simplifying knowledge acquisition, high problem-solving efficiency, enhanced resolution quality, and continuous knowledge accumulation etc.
Be capable to quantitatively analyze and predict geographic phenomena by examining enough existing historical data
Be able to effectively integrate all past research results and then perform quantitative analysis at a higher level by appropriate re-organization of historical cases.
Current CBR methods are not perfect enough to solve complicated geographical problems, particularly those
with significant zonal and territorial differentiation.

Introduction (cont.)
Objective of this paper :
From a new methodological perspective, uses CBR methods
to quantitatively analyze and estimate the change of MOEs.
Also improves the capability of traditional CBR method to
solve complicated geographical problems by developing new
representation model and similarity reasoning algorithm

2.methodology
Case Representation Model
Extracting Temporal and Spatial relationships
Case Similarity Calculation and Reasoning

2.1Case Representation Modelgeographical cases are represented by the three components,
including “problem’’, “geographical environment”, and “result”, which are different from the traditional two-mode model, including two components of “Problem” and “result”.

2.2 Extracting Temporal and Spatial relationships
Used rough set theory to extract the decision-making rules from historical cases of MOEs (Including three basic steps).
Descript the prior spatial relationships among MOE Cases based on rough set theory;
Discrete continuous variables in the spatial decision-making table using different methods based on different conditional attributes;
Simplify spatial relationships in the decision-making table using attribute simplifying algorithm.


2.3 Case Similarity Calculation and Reasoning
As spatial relationships among cases, as well as between cases and environment, were all considered in the representation model proposed in this study, In this study, general similarity among ocean eddy cases was calculated by the following equation:
)),((3)),((2)),((1),( jiCasesSwjiCaseaSwjiCaserSwjiCaseSimilarity ×+×+×=
Where w1
, w2
and w3
are weights assigned to different similarity coefficients and w1
+w2
+w3
=1.
),( jiCaseSimilarity
)),(( jiCaserS
)),(( jiCaseaS
)),(( jiCasesS
: Similarity coefficient among geo‐cases
: Similarity coefficient of spatial relationship among geo‐
cases
: Similarity coefficient of property attribute among geo‐
cases
: Similarity coefficient of spatial pattern among geo‐cases
1)(1
)),((1
)),(( =×= ∑∑==
n
kkjiCaser
n
kkjiCaser wSwS
k
1)(1
)),((1
)),(( =×= ∑∑==
m
kkjiCasea
m
kkjiCasea wDwS
k
)),(( jiCasesSLinear: Similarity Algorithm of Radius Vector Serial Based on BarycentreArea: Proved Similarity Algorithm of Polygonal Shapes Based on Mechanics
)1(
1
1 )),(()),((
∑=
∑=
×= n
k kw
n
k jiCasekSkw
jiCaseaS
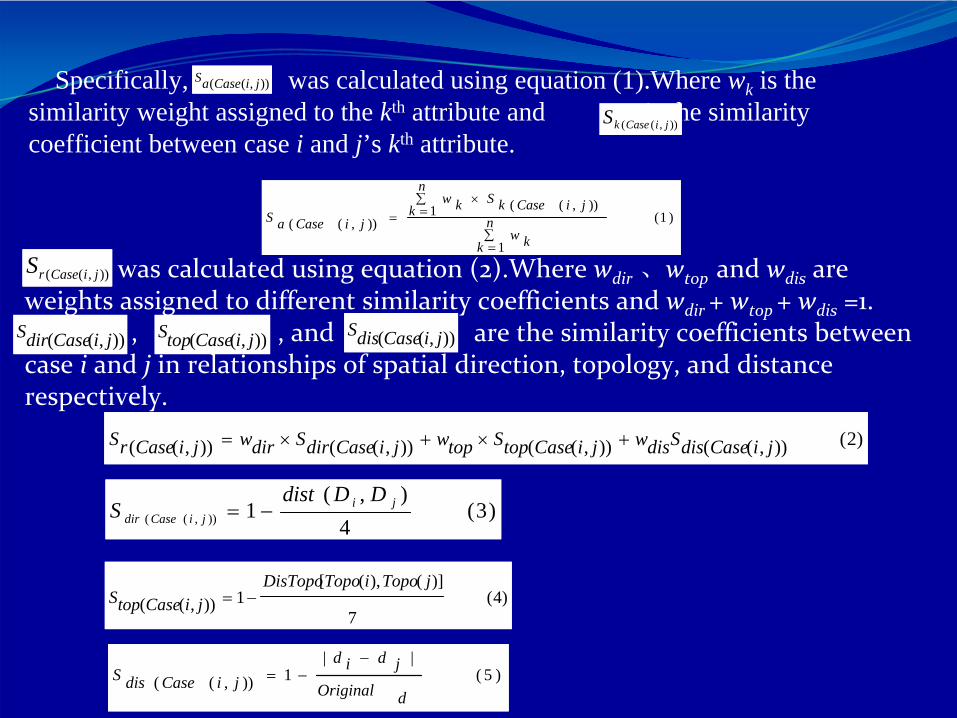
Specifically, was calculated using equation (1).Where wk is the similarity weight assigned to the kth attribute and is the similarity coefficient between case i and j’s kth attribute.
)),(( jiCaseaS
)),(( jiCasekS
was calculated using equation (2).Where wdir
、wtop
and wdis
are weights assigned to different similarity coefficients and wdir
+ wtop
+ wdis
=1., , and are the similarity coefficients between
case i
and j
in relationships of spatial direction, topology, and distance respectively.
)),(( jiCaserS
)2()),(()),(()),(()),(( jiCasedisSdiswjiCasetopStopwjiCasedirSdirwjiCaserS +×+×=
)),(( jiCasedirS )),(( jiCasetopS )),(( jiCasedisS
)3(4
),(1)),((
jijiCasedir
DDdistS −=
)4(7
)](),([1)),((
jTopoiTopoDisTopojiCasetopS −=
)5(||
1)),((dOriginaljdid
jiCasedisS−
−=

3 Case Study
Study Area
Estimation of Eddy Variation in the
SCS

3.1 Study AreaMethod proposed in this paper was tested by studying the MOEs developed in the SCS (0 ~ 23 ° N, 99 ~ 12l ° E) from November 2003 to February 2009. The study region has an area of 3.5 million square kilometers. The SCS is a semi-enclosed basin with complex seabed topography, usually showing unique mesoscale variations in marine environmental conditions due to the influence of East Asia Monsoon and the Kuroshio.Raw data used in this study include stratified numerically simulated global sea surface height abnormity (SSHA), sea surface temperature (SST), and marine current. These data have a spatialresolution of 1/32x1/32 degree and provided by Navy Research Laboratory (NRL). The data are substantiated by multiple satellite images.Typical ocean eddy is identified as those with a diameter no less than 100 km, height difference between eddy center and the outmost closed contour no less than 8 cm, life span no less than 20 days, visible annular flow on the current map of MOEs, and a current speed more than 0.5m/s in the eddy center.

Original data
CURRENT/SPEED SSHA SST
2008-8-16-
2008-09-18
Ocean Survey data SST Accuracy: 99.06%
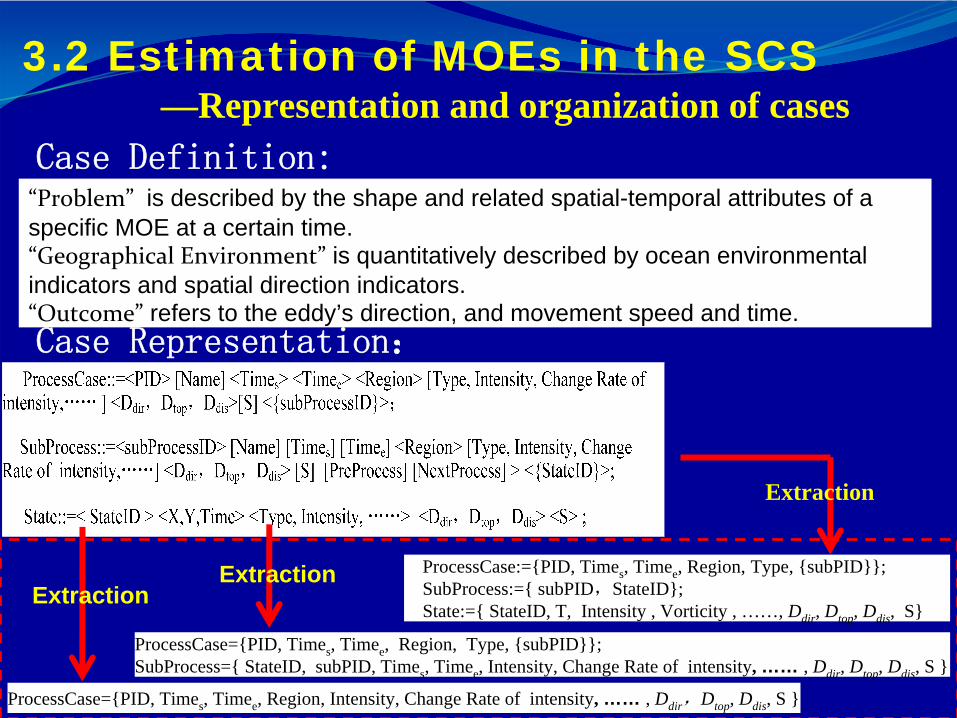
3.2 Estimation of MOEs in the SCS —Representation and organization of cases
Case Definition:
Case Representation:
“Problem”
is described by the shape and related spatial-temporal attributes of a specific MOE at a certain time.“Geographical Environment”
is quantitatively described by ocean environmental
indicators and spatial direction indicators.“Outcome”
refers to the eddy’s direction, and movement speed and time.
ProcessCase:={PID, Times , Timee , Region, Type, {subPID}};SubProcess:={ subPID,StateID};State:={ StateID, T, Intensity , Vorticity , ……, Ddir , Dtop , Ddis , S}
ProcessCase={PID, Times , Timee , Region, Type, {subPID}};SubProcess={ StateID, subPID, Times , Timee , Intensity, Change Rate of intensity, …… , Ddir , Dtop , Ddis , S }
ProcessCase={PID, Times , Timee , Region, Intensity, Change Rate of intensity, …… , Ddir ,Dtop , Ddis , S }
Extraction
ExtractionExtraction

Case Library
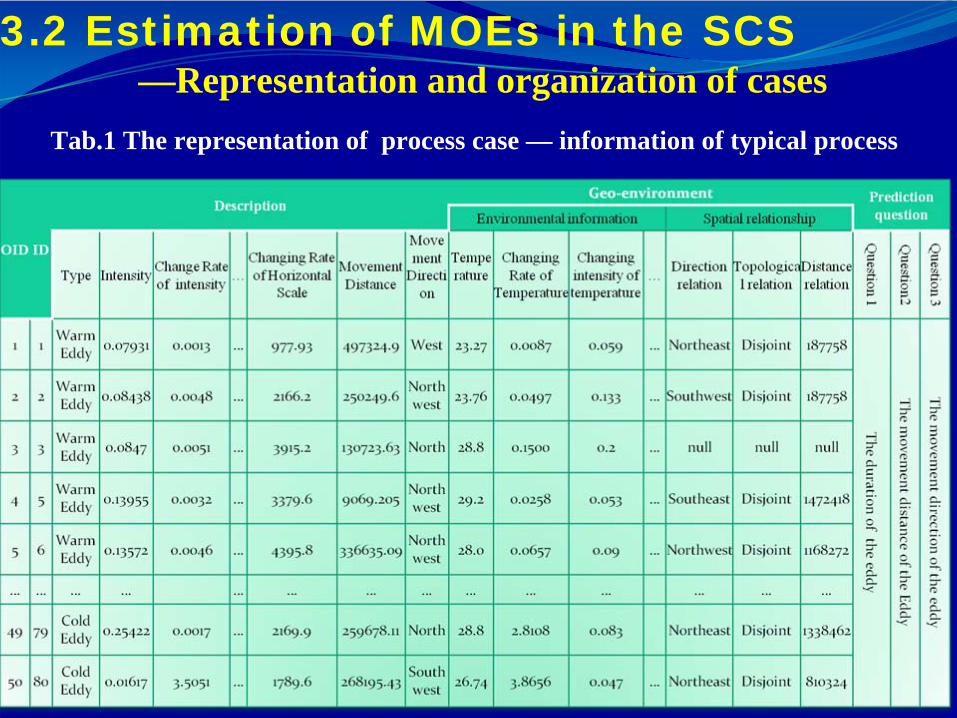
Tab.1 The representation of process case — information of typical process
3.2 Estimation of MOEs in the SCS —Representation and organization of cases

Tab.2 The representation of process case——information of typical Sub-process

Tab.3 The representation of process case——information of typical eddy state

Tab.4 Estimation result and accuracy of process
3.2 Estimation of MOEs in the SCS ——Similarity Calculation and Reasoning

Tab .5 estimation result and accuracy of the sub process duration

Tab .6 estimation result and accuracy of the sub process movement distance
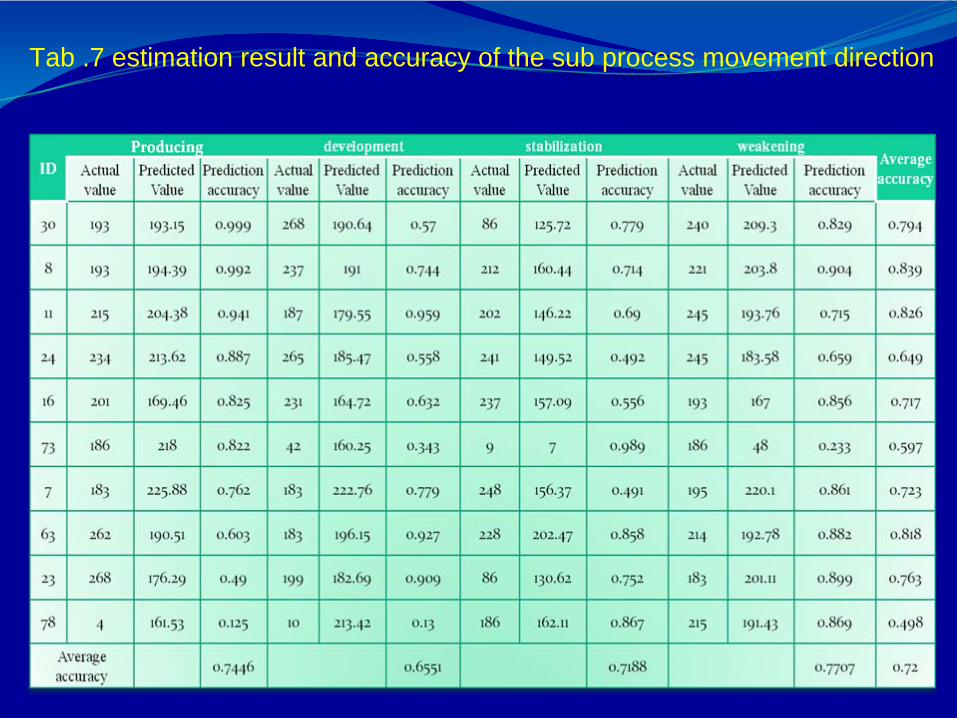
Tab .7 estimation result and accuracy of the sub process movement direction
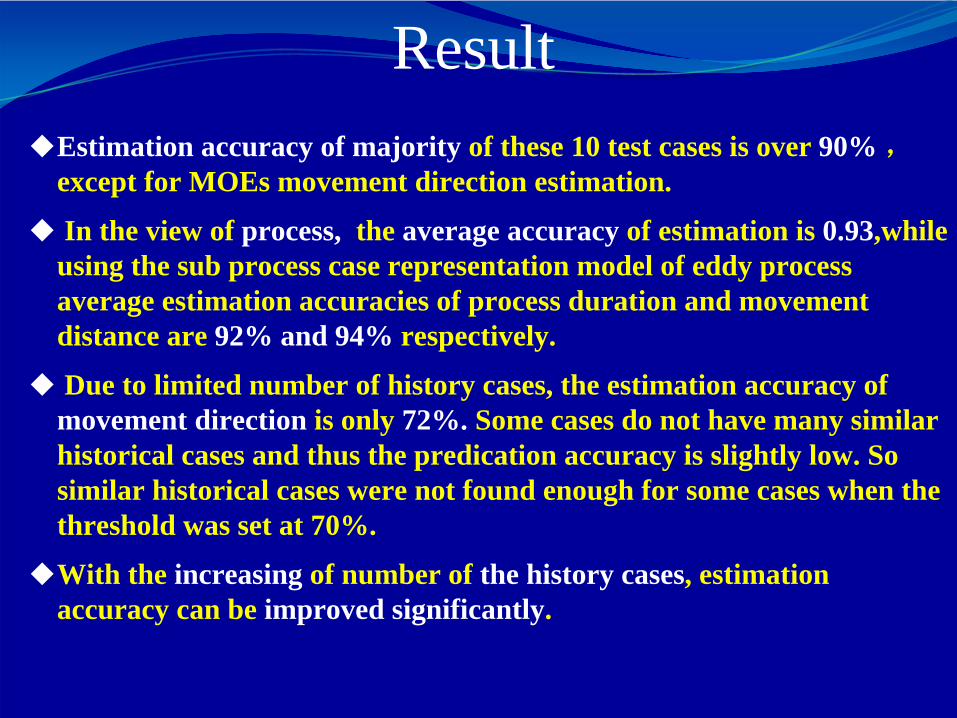
Estimation accuracy of majority of these 10 test cases is over 90% ,except for MOEs movement direction estimation.
In the view of process, the average accuracy of estimation is 0.93,while using the sub process case representation model of eddy process average estimation accuracies of process duration and movement distance are 92% and 94% respectively.
Due to limited number of history cases, the estimation accuracy of movement direction is only 72%. Some cases do not have many similar historical cases and thus the predication accuracy is slightly low. So similar historical cases were not found enough for some cases when the threshold was set at 70%.
With the increasing of number of the history cases, estimation accuracy can be improved significantly.
Result

4 ConclusionA new “geographic environment” component was introduced into case representation model, which was then used to study the change ofMOE in the SCS. Experiment result indicates that the method proposed in this paper is simple, flexible, and practical in studying MOE change with satisfactory estimation accuracy. The CBR method is able to provide solutions to some application-oriented problems and hence is capable to perform quantitative simulation and complex analysis to study change of MOE.Case library built using CBR can be dynamically updated. Self-training is also possible as more cases were accumulated. Continuously absorption of the high-quality data and improved research results will further boost estimation accuracy.This method shows great potentials in estimating rapid change of MOE.