evaluation of spatial dependence of point spread function
TRANSCRIPT
ORIGINAL ARTICLE Open Access
Evaluation of spatial dependence of pointspread function-based PET reconstructionusing a traceable point-like 22Na sourceTaisuke Murata1†, Kenta Miwa2*†, Noriaki Miyaji3, Kei Wagatsuma4, Tomoyuki Hasegawa5, Keiichi Oda6,Takuro Umeda3, Takashi Iimori1, Yoshitada Masuda1, Takashi Terauchi3 and Mitsuru Koizumi3
* Correspondence:[email protected]†Equal contributors2Department of RadiologicalSciences, School of Health Sciences,International University of Healthand Welfare, 2600-1 Kitakanemaru,Ohtawara, Tochigi 324-8501, JapanFull list of author information isavailable at the end of the article
Abstract
Background: The point spread function (PSF) of positron emission tomography (PET)depends on the position across the field of view (FOV). Reconstruction based on PSFimproves spatial resolution and quantitative accuracy. The present study aimed toquantify the effects of PSF correction as a function of the position of a traceablepoint-like 22Na source over the FOV on two PET scanners with a different detectordesign.
Methods: We used Discovery 600 and Discovery 710 (GE Healthcare) PET scannersand traceable point-like 22Na sources (<1 MBq) with a spherical absorber design thatassures uniform angular distribution of the emitted annihilation photons. The sourcewas moved in three directions at intervals of 1 cm from the center towards theperipheral FOV using a three-dimensional (3D)-positioning robot, and data wereacquired over a period of 2 min per point. The PET data were reconstructed byfiltered back projection (FBP), the ordered subset expectation maximization (OSEM),OSEM + PSF, and OSEM + PSF + time-of-flight (TOF). Full width at half maximum(FWHM) was determined according to the NEMA method, and total counts inregions of interest (ROI) for each reconstruction were quantified.
Results: The radial FWHM of FBP and OSEM increased towards the peripheral FOV,whereas PSF-based reconstruction recovered the FWHM at all points in the FOV ofboth scanners. The radial FWHM for PSF was 30–50 % lower than that of OSEM atthe center of the FOV. The accuracy of PSF correction was independent of detectordesign. Quantitative values were stable across the FOV in all reconstruction methods.The effect of TOF on spatial resolution and quantitation accuracy was less noticeable.
Conclusions: The traceable 22Na point-like source allowed the evaluation of spatialresolution and quantitative accuracy across the FOV using different reconstructionmethods and scanners. PSF-based reconstruction reduces dependence of the spatialresolution on the position. The quantitative accuracy over the entire FOV of the PETsystem is good, regardless of the reconstruction methods, although it dependsslightly on the position.
Keywords: Quantitative imaging, PET/CT, Point spread function, Resolutionmodeling, Spatial dependence
EJNMMI Physics
© The Author(s). 2016 Open Access This article is distributed under the terms of the Creative Commons Attribution 4.0 InternationalLicense (http://creativecommons.org/licenses/by/4.0/), which permits unrestricted use, distribution, and reproduction in any medium,provided you give appropriate credit to the original author(s) and the source, provide a link to the Creative Commons license, andindicate if changes were made.
Murata et al. EJNMMI Physics (2016) 3:26 DOI 10.1186/s40658-016-0162-3

BackgroundPositron emission tomography/computed tomography (PET/CT) using 18F-fluoro-2-de-
oxy-D-glucose (FDG) has become increasingly important for planning and evaluating
the outcomes of treatment [1, 2] and this modality requires accurate quantitation of
FDG uptake and distribution related to spatial resolution. However, a limitation associ-
ated with the PET/CT system is the degradation of spatial resolution that is attributed
to the positron range effect, photon non-collinearity, and detector-related effects in-
cluding the width of scintillator crystals, inter-crystal scattering, and inter-crystal pene-
tration [3–6]. Detector-response blurring at locations far from the center of the field of
view (FOV) is problematic [6, 7], particularly in the radial and axial dimensions.
Alessio et al. characterized the detector response using Monte Carlo simulations [7]
and empirical measurements [8]. The detector response in an empirical measurement
that separated radial and axial components was modeled as a point spread function
(PSF), and PSF information was incorporated into a three-dimensional (3D) iterative re-
construction [4, 6]. A reconstruction algorithm using PSF correction has been reported
to improve the spatial resolution in the scanner FOV. Such algorithms are provided
from the vendors under different names (SharpIR from GE, TrueX HD·PET from Sie-
mens and ×Sharp from Philips). However, PSF correction changes quantitative accuracy
due to the Gibbs ringing overshoot at the edges [4, 9]. Furthermore, although few stud-
ies have evaluated the effects of PSF correction using the National Electrical Manufac-
turers Association (NEMA) body phantom located at the center of the FOV [10, 11],
the relationship between FDG uptake at any location throughout the FOV and the ac-
curacy of PSF correction remains unclear. The spatial resolution of the scanner can be
measured by placing a point source within the scanner and acquiring scan data at vary-
ing locations in both the radial and axial dimension [6, 8].
A point-like 22Na source (<1 MBq) that is appropriately related to the national stand-
ard in Japan was developed for PET calibration [12, 13]. The radioactivity of this source
was calibrated with a Germanium-semiconductor spectrometer at an accredited cali-
bration center (Japanese Radioisotope Association, Tokyo, Japan); the level of uncer-
tainty in the measurement was <1.5 % (k = 2). The long half-life of 2.6 years and low
maximum positron energy of 0.546 MeV render traceable point-like 22Na sources favor-
able for direct comparisons of spatial resolution and quantitation accuracy among PET
scanners [13].
The present study aimed to quantify the effects of PSF correction as a function of the
position of a traceable point-like 22Na source over the FOV of two types of PET
scanners.
MethodsTraceable point-like 22Na source
The traceable point-like 22Na source is described in detail elsewhere [12]. Briefly, the
source consisted of a spherical aluminum capsule (outer diameter, 3.0 mm) and a
spherical ion exchange resin bead (diameter 0.5 mm) with a surface that absorbs 22Na.
The influence of absorbed attenuation and scatter was negligible [12, 13]. The amount
of source radioactivity was 0.3 MBq at the time of the comparison of PET scanners.
Murata et al. EJNMMI Physics (2016) 3:26 Page 2 of 10

PET scanner
We used Discovery PET/CT 600 and Discovery PET/CT 710 scanners (GE Healthcare,
Milwaukee, WI, USA). Table 1 shows the features of two PET devices compared herein.
The Discovery 600 comprises 24 rings of 512 bismuth germinate (BGO) crystals (4.7 ×
6.3 × 30 mm), covering transaxial and axial FOV of 700 and 157 mm, respectively. The
spatial resolution at 1 cm from the center of the FOV was 4.9 mm at full width at half
maximum (FWHM) according to NEMA NU2-2007 [14]. The Discovery 710 comprises
24 rings of 576 lutetium-yttrium oxyorthosilicate (LYSO) crystals (4.2 × 6.3 × 25 mm),
covering transaxial and axial FOV of 700 and 157 mm, respectively. The spatial resolution
at 1 cm from the center of the FOV was 4.7 mm at FWHM according to NEMA [15].
3D-positioning robot and data acquisition
The point-like 22Na source was moved throughout the FOV using a 3D-positioning
robot (IAI Co. Ltd., Shizuoka, Japan) that allowed motions with an accuracy of
±0.02 mm (Fig. 1a). The robot was controlled by coded software running on a per-
sonal computer. The orientation accuracy of robot positioning was verified before
each acquisition in three dimensions [6]. Data acquisition in each direction started
with the source positioned at the center of the FOV. The source was then moved to
the peripheral 30 cm of the transaxial FOV at 1 cm intervals in the directions of the
x-, y-, and xy-axes (Fig. 1b). The xy-axis was moved in an oblique 45° direction, for
example (x,y = 0, 0), (x,y = 1, 1), and (x,y = 2, 2), namely, at √2-cm intervals. PET data
were acquired for 2 min at each point in 3D list mode.
Image reconstruction
We reconstructed PET data using the following algorithms: filtered back projection
(FBP), baseline ordered subset expectation maximization (OSEM), OSEM + PSF,
and OSEM + PSF + time-of-flight (TOF; Discovery 710 only). The PSF modeling
used in this study was the SharpIR algorithm conceived by Alessio et al. [7, 8].
Thirty-one data series for the x- and y-axes and 22 data series for the xy-axis di-
vided into each measured point were reconstructed. The iterative reconstruction
parameters of the Discovery 600 were 2 iterations and 16 subsets for OSEM, and 3
iterations and 16 subsets for OSEM + PSF. The iterative reconstruction parameters
of the Discovery 710 were 2 iterations and 18 subsets for OSEM, and 3 iterations
Fig. 1 Point-like 22Na source setup for PET acquisition. Source is attached to the tip of a robot (a) andmoved across three directions (b)
Murata et al. EJNMMI Physics (2016) 3:26 Page 3 of 10

and 18 subsets for OSEM + PSF and OSEM + PSF + TOF. The image matrix was
256 × 256 (pixel size, 2.73 mm) and slice thickness was 3.27 mm. A smoothing fil-
ter was not used for post-processing. Attenuation and scatter were not corrected.
The normalization scan was performed using a uniform cylindrical 18F-filled phan-
tom located at the center of the FOV.
FWHM analysis
The spatial resolution in the scanner FOV was determined from the FWHM of the PSF
obtained from the activity distribution from the point-like 22Na source. The FWHM in
three directions for each measured point was calculated according to the NEMA re-
quirements (NEMA-NU2-2012) [16]. The maximum value of the PSF was determined
using a parabolic fit of the peak point and its two nearest-neighbor points. The position
at half of the profile maximum value was determined by linear interpolation between
adjacent pixels. The pixel size was set to 1.56 mm by reducing the reconstructed FOV
width when evaluating the FWHM.
Quantitative analysis
Data were analyzed using OsiriX software (Pixmeo, Bernex, Switzerland). Circular re-
gions of interest (ROI) were defined around the source position to obtain the total
ROI value. We placed ROI on 21 image planes around the central image plane within
a range of ±10 image planes to cover the entire smeared radioactivity in the axial dir-
ection. The sum of the ROI values derived from 21 image planes was defined as ROI-
total. Scattered 1.275-MeV γ rays along with β+ decay of 22Na might increase ROI
values when the radius of the ROI is larger. In the present study, the ROI radius was
set to 16 mm so that the uniformity in the field of view was evaluated using the trace-
able point-like source in a way that is independent of the partial volume effect, on the
basis of a previous study [13]. The recovery coefficient (RC), a function of radial dis-
tance from the center of the FOV, served as a quantitative index [14], as follows:
RC ¼ ROItotal � νpixel= Rsource=εð Þ
where νpixel is the volume of pixel in cc, Rsource is the emission rate of 0.511-MeV γ rays
from the 22Na source in s−1, and ε is the β+ branching ratio of 22Na.
Table 1 Comparison of device features
Discovery 600 Discovery 710
Transaxial FOV (mm) 700 700
Axial FOV (mm) 157 157
No. of ring 24 24
No. of individual crystals 12,288 13,824
No. of crystals/ring 512 576
No. of image planes 47 47
Crystal size (mm) 4.7 × 6.3 × 30 4.2 × 6.3 × 25
Crystal array per block 8 × 6 9 × 6
Scintillator material BGO LYSO
Coincidence window (nsec) 9.5 4.9
Murata et al. EJNMMI Physics (2016) 3:26 Page 4 of 10
ResultsThe images of the point source for FBP and OSEM were broad and faint when lo-
cated far from the center of the FOV, whereas hot spots for PSF and PSF + TOF
became sharp and dense throughout the FOV. The trends of results from the Dis-
covery 600 and 710 scanners were almost identical.
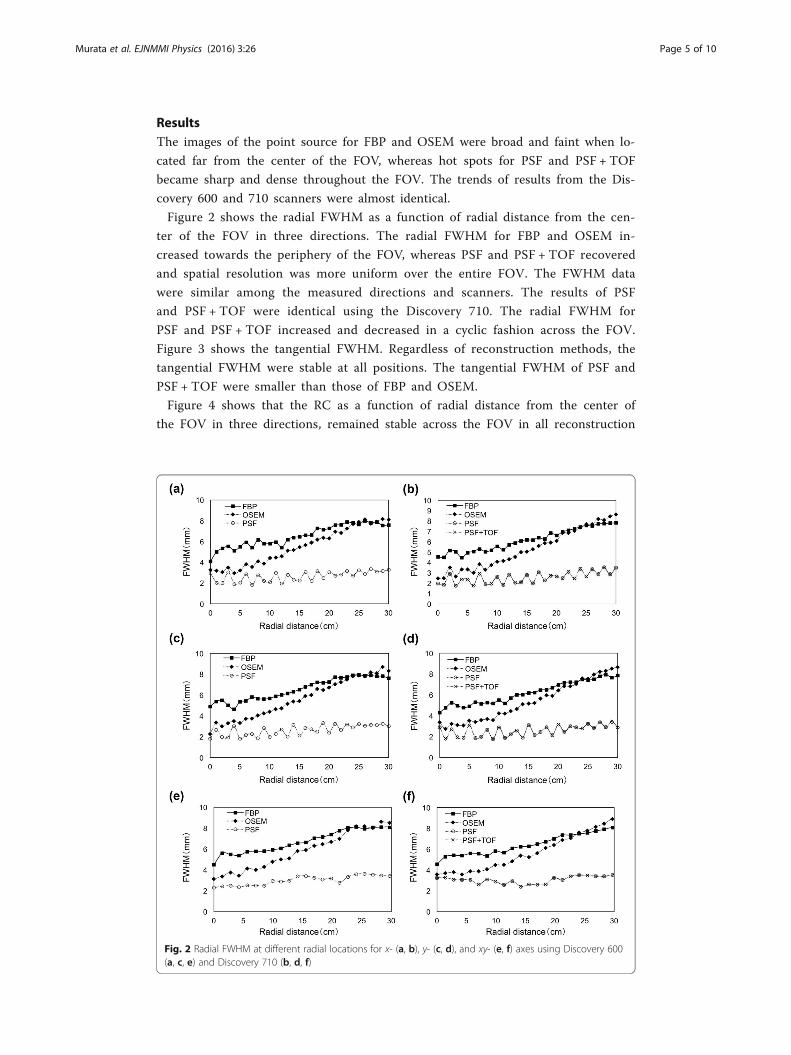
Figure 2 shows the radial FWHM as a function of radial distance from the cen-
ter of the FOV in three directions. The radial FWHM for FBP and OSEM in-
creased towards the periphery of the FOV, whereas PSF and PSF + TOF recovered
and spatial resolution was more uniform over the entire FOV. The FWHM data
were similar among the measured directions and scanners. The results of PSF
and PSF + TOF were identical using the Discovery 710. The radial FWHM for
PSF and PSF + TOF increased and decreased in a cyclic fashion across the FOV.
Figure 3 shows the tangential FWHM. Regardless of reconstruction methods, the
tangential FWHM were stable at all positions. The tangential FWHM of PSF and
PSF + TOF were smaller than those of FBP and OSEM.
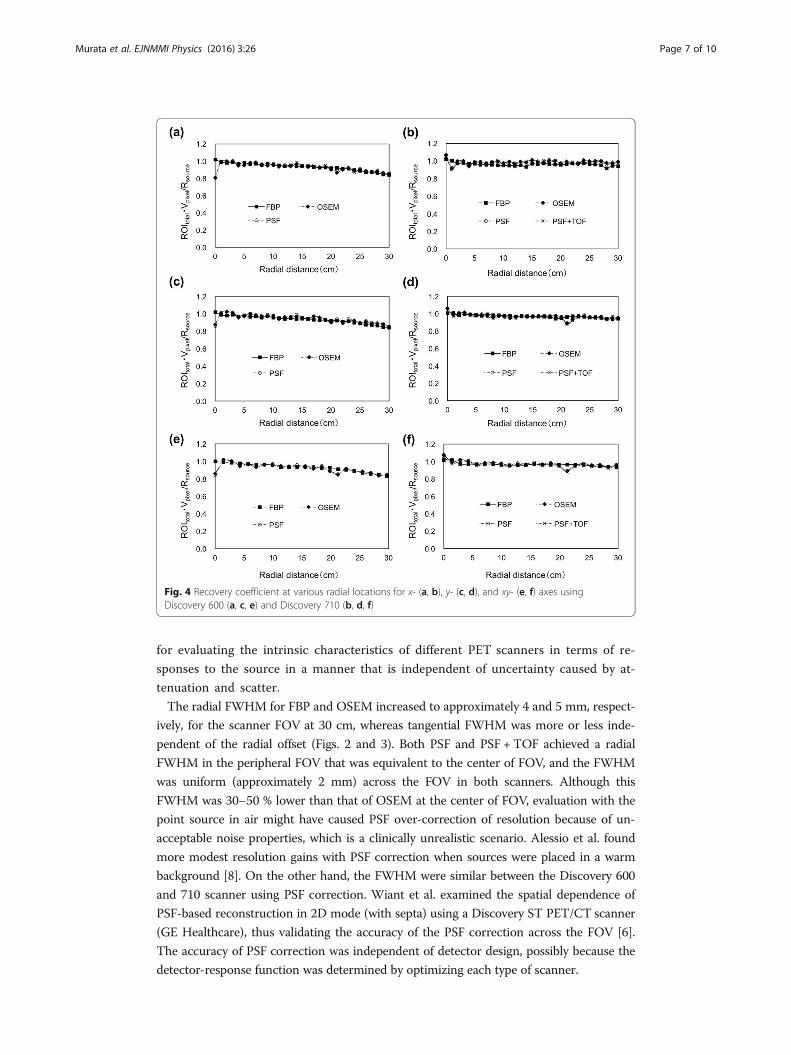
Figure 4 shows that the RC as a function of radial distance from the center of
the FOV in three directions, remained stable across the FOV in all reconstruction
Fig. 2 Radial FWHM at different radial locations for x- (a, b), y- (c, d), and xy- (e, f) axes using Discovery 600(a, c, e) and Discovery 710 (b, d, f)
Murata et al. EJNMMI Physics (2016) 3:26 Page 5 of 10

methods, in particular for the Discovery 600, and fluctuated only at the center of
the FOV in both scanners.
DiscussionWe evaluated the spatial dependence of PSF-based PET reconstruction using a trace-
able 22Na point-like source on two PET scanners with different detector designs. The
results showed that PSF correction improves spatial resolution and does not affect
quantitative values over the entire FOV.
The methodology used to measure the response of the PET system that deter-
mines the spatial dependence of the PSF inside the FOV is important. Several fac-
tors must be considered to obtain an accurate response from the PET system, such
as the source dimensions, type of isotope, media surrounding the point source (air,
water, or warm radioactive background), and the number and position of measure-
ments to account for all possible responses of the system [17]. In particular, at-
tenuation and scattering owing to the source (phantom) and its correction produce
uncertainty in performance evaluations. We adopted a 22Na point-like source that
is traceable to a national standard, and a 3D-positioning robot. Although the 22Na
point-like source has been proposed for PET calibration [12, 13], it is also useful
Fig. 3 Tangential FWHM at various moving radial locations for x- (a, b), y- (c, d), and xy- (e, f) axes usingDiscovery 600 (a, c, e) and Discovery 710 (b, d, f)
Murata et al. EJNMMI Physics (2016) 3:26 Page 6 of 10
for evaluating the intrinsic characteristics of different PET scanners in terms of re-
sponses to the source in a manner that is independent of uncertainty caused by at-
tenuation and scatter.
The radial FWHM for FBP and OSEM increased to approximately 4 and 5 mm, respect-
ively, for the scanner FOV at 30 cm, whereas tangential FWHM was more or less inde-
pendent of the radial offset (Figs. 2 and 3). Both PSF and PSF + TOF achieved a radial
FWHM in the peripheral FOV that was equivalent to the center of FOV, and the FWHM
was uniform (approximately 2 mm) across the FOV in both scanners. Although this
FWHM was 30–50 % lower than that of OSEM at the center of FOV, evaluation with the
point source in air might have caused PSF over-correction of resolution because of un-
acceptable noise properties, which is a clinically unrealistic scenario. Alessio et al. found
more modest resolution gains with PSF correction when sources were placed in a warm
background [8]. On the other hand, the FWHM were similar between the Discovery 600
and 710 scanner using PSF correction. Wiant et al. examined the spatial dependence of
PSF-based reconstruction in 2D mode (with septa) using a Discovery ST PET/CT scanner
(GE Healthcare), thus validating the accuracy of the PSF correction across the FOV [6].
The accuracy of PSF correction was independent of detector design, possibly because the
detector-response function was determined by optimizing each type of scanner.
Fig. 4 Recovery coefficient at various radial locations for x- (a, b), y- (c, d), and xy- (e, f) axes usingDiscovery 600 (a, c, e) and Discovery 710 (b, d, f)
Murata et al. EJNMMI Physics (2016) 3:26 Page 7 of 10

The radial FWHMs for PSF and PSF + TOF slightly increased and decreased in a cyc-
lic fashion across the FOV (Fig. 2). This could be explained by the location of the point
source within a pixel. The maximum pixel value was underestimated due to the pos-
ition of the source relative to the grid of pixel separation [18]. The point spread func-
tion of hotspots became deformed (sharp and dense) by PSF correction, and thus the
location of a point source in a pixel is thought to considerably influence the FWHM.
This problem can be addressed to decrease the FOV or increase the matrix size.
Time-of-flight could reduce axial blurring to recognize the correct axial plane of ori-
gin for each line-of-response (LOR) [19]. However, TOF did not affect the spatial reso-
lution of the entire transaxial FOV (Figs. 2 and 3). The FWHM of spatial uncertainty
using TOF was around 7–8 cm since the time resolution of LYSO was 500 psec; thus,
TOF does not directly improve spatial resolution [20].
Quantitative performance among different reconstructions across FOV has not
previously been evaluated. The RC was stable across the FOV in all reconstruction
methods using both scanners. We calculated the total ROI values covering the
traceable 22Na point-like source to create a quantitative index. Although the degree
of smearing of radioactivity differed depending on the reconstruction methods,
ROItotal remained constant across all reconstruction methods. We found that PSF
correction does not impact the total quantified value regardless of changes in peak
height and the shape of the PSF. The integral of the modeled PSF normally equals
unity and therefore it has no effect on the total reconstructed activity, only on
how exactly that activity is distributed in the PET image. This is confirmed by the
results that the curves for OSEM, OSEM with PSF, and OSEM with TOF and PSF
are identical. The RC fluctuated only at the center of FOV in both scanners. The
uncertainty of measurement at the center of the FOV in PET is due to a geometric
factor, which principally results in avoiding taking measurements at the center of
the FOV during quantitative analyses [13]. The RC of PSF and PSF + TOF were
identical. The point-like 22Na source was small and independent of absorber at-
tenuation and scatter, and thus TOF gain was not obtained [20].
The results shown in Fig. 4 revealed that the quantification is indeed position
dependent, with excellent performance near the center of the FOV, and a slight under-
estimation near the edge of the FOV. The detector efficiency variations and geometric
factors such as the solid angle subtended are typically corrected by the normalization
scan for the uniformity across the FOV [21]. Nevertheless, the RC decreased slightly to-
wards the periphery of the FOV in all reconstruction methods. We consider that this
might be due to the uncertainty of a standard normalization method using cylindrical
water phantoms and the uncertainty of attenuation and scatter corrections.
The present study has several limitations. First, several PSF modeling with different
principles are provided by vendors. Differences in PSF modeling might have influenced
the results. Further study with other PSF modeling algorithms is required to assess the
relationship between the location of FDG uptake inside the FOV and the accuracy of
PSF correction. Second, we evaluated spatial resolution and quantitative accuracy using
only one point source in air. A point source in air is a very artificial object, very differ-
ent from the tracer distributions in human bodies which are seen in clinical routine.
Further study should evaluate the influence of attenuation and scattering using a hot
point source surrounded by activity and a phantom with hot spheres of different sizes
Murata et al. EJNMMI Physics (2016) 3:26 Page 8 of 10
in a warm background in a more realistic imaging scenario to verify the advantages and
disadvantages of PSF and TOF correction in the FOV periphery [22].
ConclusionsA traceable 22Na point-like source allowed evaluations of spatial resolution and quanti-
tative accuracy among different reconstructions across the FOV. We found that PSF-
based reconstruction reduces dependence of the spatial resolution on the position. The
quantitative accuracy over the entire FOV of the PET system is good, regardless of the
reconstruction methods, although it depends slightly on the position. PSF correction
might benefit the acquisition of PET images from obese patients that occupy most of
the FOV and of small or distal lesions such as nodal metastases [23].
AcknowledgementsThis work was supported in part by KAKENHI Grant-in-Aid for Young Scientists (B) (No.16K19831) and Grant-in-Aid forScientific Research (C) (General) (No.15K08701) and from the Ministry of Education, Culture, Sports, Science and Tech-nology (MEXT), the Japanese Government, and a Special Research Grant (No.2015-1011) from Kitasato University Schoolof Allied Health Sciences.
Authors’ contributionsTM was responsible for acquisitions, reconstructions, and data analysis and participated in the study design. KMparticipated in the design and drafted the manuscript. NM, KW, TU, TI, and YM assisted with acquisitions,reconstructions, and analysis of data. TH and KO were responsible for the phantom preparations and helped with thestudy design. TT and MK drafted the manuscript and revised it critically. All authors read and approved the finalmanuscript.
Competing interestsThe authors declare that they have no competing interests.
Author details1Department of Radiology, Chiba University Hospital, 1-8-1 Inohana, Chuo-ku, Chiba-shi, Chiba 260-8677, Japan.2Department of Radiological Sciences, School of Health Sciences, International University of Health and Welfare, 2600-1Kitakanemaru, Ohtawara, Tochigi 324-8501, Japan. 3Department of Nuclear Medicine, Cancer Institute Hospital ofJapanese Foundation for Cancer Research, 3-8-31 Ariake, Koto-ku, Tokyo 135-8550, Japan. 4Research Team forNeuroimaging, Tokyo Metropolitan Institute of Gerontology, 35-2 Sakae-cho, Itabashi-ku, Tokyo 173-0015, Japan.5School of Allied Health Sciences, Kitasato University, 1-15-1 Kitasato, Minami-ku, Sagamihara, Kanagawa 252-0373,Japan. 6Department of Neurological Technology, Faculty of Health Sciences, Hokkaido University of Science, 7-Jo15-4-1 Maeda, Teine, Sapporo, Hokkaido 006-8585, Japan.
Received: 18 May 2016 Accepted: 16 October 2016
References1. Scripes PG, Yaparpalvi R. Technical aspects of positron emission tomography/computed tomography in
radiotherapy treatment planning. Semin Nucl Med. 2012;42:283–8.2. Wahl RL, Jacene H, Kasamon Y, et al. From RECIST to PERCIST: evolving considerations for PET response criteria in
solid tumors. J Nucl Med. 2009;50 Suppl 1:122–50.3. Rahmim A, Zaidi H. PET versus SPECT: strengths, limitations and challenges. Nucl Med Commun. 2008;29:193–207.4. Rahmim A, Qi J, Sossi V. Resolution modeling in PET imaging: theory, practice, benefits, and pitfalls. Med Phys.
2013;40:064301.5. Moses WW. Fundamental limits of spatial resolution in PET. Nucl Instrum Methods Phys Res A. 2011;648 Suppl 1:236–40.6. Wiant D, Gersh JA, Bennett M, Bourland JD. Evaluation of the spatial dependence of the point spread function in
2D PET image reconstruction using LOR-OSEM. Med Phys. 2010;37:1169–82.7. Alessio AM, Kinahan PE, Lewellen TK. Modeling and incorporation of system response functions in 3-D whole
body PET. IEEE Trans Med Imaging. 2006;25:828–37.8. Alessio AM, Stearns CW, Tong S, Ross SG, Kohlmyer S, Ganin A, et al. Application and evaluation of a measured
spatially variant system model for PET image reconstruction. IEEE Trans Med Imaging. 2010;29:938–49.9. Kidera D, Kihara K, Akamatsu G, Mikasa S, Taniguchi T, Tsutsui Y, et al. The edge artifact in the point-spread
function-based PET reconstruction at different sphere-to-background ratios of radioactivity. Ann Nucl Med. 2016;30:97–103.
10. Lee YS, Kim JS, Kim KM, Kang JH, Lim SM, Kim HJ. Performance measurement of PSF modeling reconstruction(True X) on Siemens Biograph TruePoint TrueV PET/CT. Ann Nucl Med. 2014;28:340–8.
11. Tong S, Alessio AM, Kinahan PE. Noise and signal properties in PSF-based fully 3D PET image reconstruction: anexperimental evaluation. Phys Med Biol. 2010;55:1453–73.
12. Hasegawa T, Sato Y, Oda K, Wada Y, Murayama H, Yamada T. Semi-quantitative and simulation analyses of effectsof γ rays on determination of calibration factors of PET scanners with point-like (22)Na sources. Phys Med Biol.2011;56:6031–45.
Murata et al. EJNMMI Physics (2016) 3:26 Page 9 of 10

13. Hasegawa T, Oda K, Wada Y, Sasaki T, Sato Y, Yamada T, et al. Validation of novel calibration scheme withtraceable point-like (22)Na sources on six types of PET scanners. Ann Nucl Med. 2013;27:346–54.
14. De Ponti E, Morzenti S, Guerra L, Pasquali C, Arosio M, Bettinardi V, et al. Performance measurements for the PET/CT Discovery-600 using NEMA NU 2-2007 standards. Med Phys. 2011;38:968–74.
15. Bettinardi V, Presotto L, Rapisarda E, Picchio M, Gianolli L, Gilardi MC. Physical performance of the new hybrid PET/CT Discovery-690. Med Phys. 2011;38:5394–411.
16. National Electrical Manufacturers Association. NEMA NU 2-2012 performance measurements of positron emissiontomographs. Rosslyn, VA: National Electrical Manufacturers Association; 2012.
17. Rapisarda E, Bettinardi V, Thielemans K, Gilardi MC. Image-based point spread function implementation in a fully3D OSEM reconstruction algorithm for PET. Phys Med Biol. 2010;55:4131–51.
18. McCall KC, Barbee DL, Kissick MW, Jeraj R. PET imaging for the quantification of biologically heterogeneoustumours: measuring the effect of relative position on image-based quantification of dose-painting targets. PhysMed Biol. 2010;55:2789–806.
19. Moses WW. Time of flight in PET revisited. IEEE Trans Nucl Sci. 2003;50:1325–30.20. Surti S. Update on time-of-flight PET imaging. J Nucl Med. 2015;56:98–105.21. Saha GB. Basics of PET imaging: physics, chemistry, and regulations. New York: Springer Science+Business Media,
Inc.; 2010.22. Matheoud R, Ferrando O, Valzano S, Lizio D, Sacchetti G, Ciarmiello A, et al. Performance comparison of two
resolution modeling PET reconstruction algorithms in terms of physical figures of merit used in quantitativeimaging. Phys Med. 2015;31:468–75.
23. Bellevre D, Blanc Fournier C, Switsers O, Dugué AE, Levy C, Allouache D, et al. Staging the axilla in breast cancerpatients with 18F-FDG PET: how small are the metastases that we can detect with new generation clinical PETsystems? Eur J Nucl Med Mol Imaging. 2014;41:1103–12.
Submit your manuscript to a journal and benefi t from:
7 Convenient online submission
7 Rigorous peer review
7 Immediate publication on acceptance
7 Open access: articles freely available online
7 High visibility within the fi eld
7 Retaining the copyright to your article
Submit your next manuscript at 7 springeropen.com
Murata et al. EJNMMI Physics (2016) 3:26 Page 10 of 10