extraordinary wavelength dispersion of
TRANSCRIPT
Japan Advanced Institute of Science and Technology
JAIST Repositoryhttps://dspace.jaist.ac.jp/
Title
Extraordinary wavelength dispersion of
birefringence in cellulose triacetate film with
anisotropic nanopores
Author(s)
Nobukawa, Shogo; Shimada, Hikaru; Aoki,
Yoshihiko; Miyagawa, Azusa; Doan, Vu Ahn;
Yoshimura, Hiroshi; Tachikawa, Yutaka; Yamaguchi,
Masayuki
Citation Polymer, 55(15): 3247-3253
Issue Date 2014-05-22
Type Journal Article
Text version author
URL http://hdl.handle.net/10119/13504
Rights
Copyright (C)2014, Elsevier. Licensed under the
Creative Commons Attribution-NonCommercial-
NoDerivatives 4.0 International license (CC BY-
NC-ND 4.0).
[http://creativecommons.org/licenses/by-nc-
nd/4.0/] NOTICE: This is the author's version of
a work accepted for publication by Elsevier.
Shogo Nobukawa, Hikaru Shimada, Yoshihiko Aoki,
Azusa Miyagawa, Vu Ahn Doan, Hiroshi Yoshimura,
Yutaka Tachikawa, Masayuki Yamaguchi, Polymer,
55(15), 2014, 3247-3253,
http://dx.doi.org/10.1016/j.polymer.2014.05.037
Description
Nobukawa et al. 1
Extraordinary wavelength dispersion of birefringence in cellulose triacetate film with 1
anisotropic nanopores 2
3
Shogo NOBUKAWA1*, Hikaru SHIMADA1, Yoshihiko AOKI1, Azusa MIYAGAWA1, Vu Ahn 4
DOAN1†, Hiroshi YOSHIMURA2, Yutaka TACHIKAWA3, and Masayuki YAMAGUCHI1** 5
6
1School of Materials Science, Japan Advanced Institute of Science and Technology, 1-1 Asahidai, 7
Nomi, Ishikawa 923-1292, Japan 8
2DIC Corporation, Chiba Plant, 12 Yawata-kaigandori, Ichihara, Chiba 290-8585, Japan 9
3DIC Corporation, Central Research Laboratories, 631 Sakado, Sakura, Chiba 285-8668, Japan 10
11
*Corresponding author: 12
Tel: +81-761-51-1626 13
School of Materials Science, Japan Advanced Institute of Science and Technology, 1-1 Asahidai, 14
Nomi, Ishikawa 923-1292, Japan 15
E-mail: [email protected] (S. N.) 16
17
**Corresponding author: 18
Tel: +81-761-51-1621 19
School of Materials Science, Japan Advanced Institute of Science and Technology, 1-1 Asahidai, 20
Nomi, Ishikawa 923-1292, Japan 21
E-mail: [email protected] (M. Y.) 22
23
†Present address: Hanoi University of Science and Technology, 1 Dai Co Viet Road, Hanoi, 24
Vietnam 25
26
Nobukawa et al. 2
ABSTRACT 1
We examined birefringence in a stretched film of cellulose triacetate (CTA) after extraction 2
of an immiscible component. The CTA film plasticized by di(2-ethylhexyl) adipate (DOA), which 3
was added as the immiscible additive, exhibited negative birefringence to the same degree as the 4
pure CTA film. Following removal of DOA from the film by immersion into methanol, the 5
birefringence of the blend film changed dramatically from negative to positive. Moreover, the 6
wavelength dependence also changed from ordinary to extraordinary, in which the absolute value of 7
birefringence increases with wavelength. Scanning electron microscope (SEM) images revealed 8
nanoscale ellipsoidal pores in the film after the extraction, suggesting that DOA was segregated and 9
formed ellipsoidal domains in the CTA matrix during annealing and stretching. According to an 10
optical theory for the nanoporous structure, we found that the form birefringence contributes to 11
control of the optical properties of the CTA film. This phenomenon could be utilized in the design 12
of high-performance optical films, such as quarter waveplate, because sign and wavelength 13
dispersion of birefringence can be controlled even for a single component film. 14
15
Keywords: Nano-porous structure, Cellulose triacetate, Birefringence 16
17
18
Nobukawa et al. 3
INTRODUCTION 1
Cellulose esters for use in optical films have been studied because they have favorable 2
optical properties including transparency, thermostability, chemical resistance, and dimensional 3
stability [1-6]. In particular, birefringence (∆n), which is defined as the difference between two 4
refractive indices, is one of the most important properties of optical films such as retardation and 5
protection films [6-8]. Modern high-performance display devices, e.g., three-dimensional (3D) and 6
organic electro luminescence (EL) displays, require a quarter waveplate with well-controlled ∆n and 7
wavelength dispersion [6, 7]. 8
For a quarter waveplate, the proportionality relationship between ∆n and wavelength is 9
important. To improve the optical properties of films, copolymerization [7, 9], blending with other 10
polymers or with additives [10-16], and lamination [17] have to be used because the wavelength 11
dispersion is determined only by the chemical structure of the polymers. However, these methods 12
exhibit some problems; copolymerization reduces thermo-resistance, and polymer blending with low 13
compatibility decreases film transparency. With lamination, the thermal expansion mismatch 14
between polymer sheets restricts the useful temperature range. 15
The birefringence of polymeric materials has three components given by: 16
17
FGO nnnn ∆+∆+∆=∆ (1) 18
19
Nobukawa et al. 4
Here, ∆nO, ∆nG, and ∆nF are orientation, glassy and form birefringence, respectively. The first 1
term pertains to the chain orientation and the second is related to the distortion of chemical structure 2
due to an applied force. The third term is associated with anisotropic nanostructures such as 3
ellipsoidal structures. Based on an anisotropic dielectric theory [18] for the form birefringence, 4
Ibn-Elhaj and Schadt [19] improved the birefringence of polymer thin films by the anisotropic 5
nano-corrugated surface pattern. Therefore, the nano-porous structure possibly modifies 6
birefringence of the polymeric films. 7
Moreover, many studies investigated porous structures in polymeric films for the application 8
for separation membranes and separators in lithium ion second cells [20-22]. In general, porous 9
films are prepared by using a thermo-induced phase separation (TIPS) of the matrix polymers and 10
small amount of immiscible components, which are removed by immersing the films into selective 11
solvents. We think that the porous structure by the TIPS technique contributes to the optical 12
anisotropy, i.e., the form birefringence in cellulose ester films. 13
Because ∆nG in equation (1) is negligibly small compared to other terms for the 14
hot-stretched polymer films, the birefringence property of stretched cellulose ester films can be 15
modified by incorporation of an anisotropic nano-structure. In this study, the optical birefringence 16
and its wavelength dispersion of cellulose triacetate (CTA, Figure 1), used as a model polymer, was 17
improved with anisotropic nano-pores. 18
19
Nobukawa et al. 5
[Figure 1] 1
2
In order to design nano-porous structure such as sea-island structures in CTA films, the 3
phase separation technique can be utilized. Since CTA is a crystalline polymer that is insoluble in 4
most solvents, such as methanol, removal of low-mass molecules (LMs) from the sea-island structure 5
can be accomplished using the immersion method. Based on this idea, di(2-ethylhexyl) adipate 6
(DOA, Figure 1) was used as the immiscible LM and the pores were formed from sea-island 7
structures resulting from phase separation of the CTA/DOA blend. In order to investigate the form 8
birefringence, effects of chain orientation, crystallinity, and moisture content on birefringence of 9
CTA film were also discussed. 10
11
EXPERIMENTAL 12
Samples 13
The CTA used in this study was produced by the Daicel Corporation (Japan). The degree 14
of acetylation per pyranose unit of CTA was 2.96, as determined by 1H-NMR spectroscopy. The 15
weight-average and number-average molecular weights (Mw and Mn) of CTA were 3.5 × 10⁵ and 16
1.3 × 10⁵, respectively, as determined by gel permeation chromatography (GPC, HLC-8020 Tosoh, 17
Japan) with TSK-GEL® GMHXL compared with polystyrene standards. DOA was used as a 18
plasticizer to prepare the domains. DOA is commercially available and was supplied by Daihachi 19
Nobukawa et al. 6
Chemical Industry (Japan). 1
CTA and CTA/DOA films were prepared using a solution-casting method; melt processing 2
is not applicable because thermal degradation takes place near the melting point of CTA (around 3
300 °C). CTA and DOA in a ratio of 10/1 wt/wt were dissolved in a binary solvent of 4
dichloromethane/methanol (9/1 vol/vol) and a 3 wt% solution was prepared. The solvent was 5
evaporated at room temperature (RT) for 1 day at ordinary pressure and dried in vacuo for 1 day 6
without controlling humidity. Since DOA is not volatile, the composition of the blend film was 7
controlled by the ratio of components. The film thickness was 100–150 µm. 8
9
[Table 1] 10
11
Measurements 12
Dynamic mechanical analysis (DMA) of the sample films was performed to measure storage 13
and loss moduli (E′ and E″, respectively) at 10 Hz as a function of temperature using a tensile 14
oscillatory rheometer (DVE-E4000, UBM, Japan) from 0 to 250 °C at a heating rate of 2 °C min-1. 15
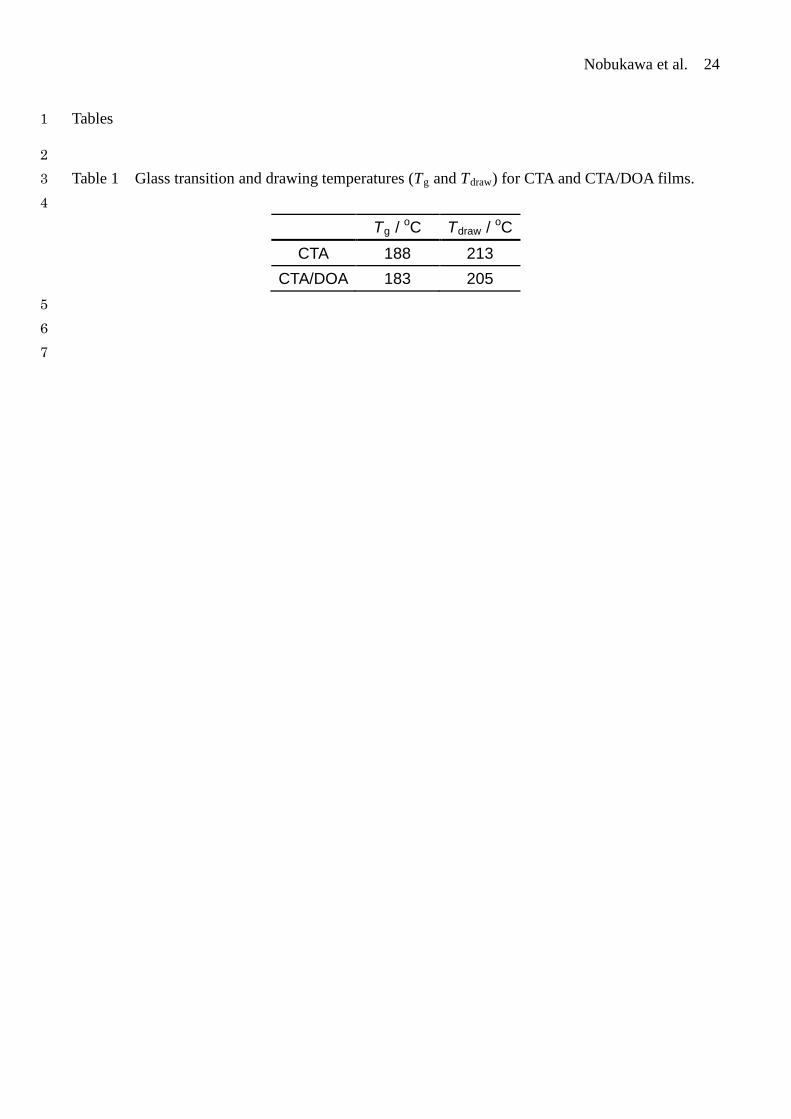
The glass transition temperature (Tg) was estimated from a peak of E″ in the DMA data and is shown 16
in Table 1. 17
A hot-stretching test for the films was carried out with a strain rate of 0.05 s-1 using a tensile 18
drawing machine (DVE-3, UBM, Japan). To avoid the thermal history effect, the films were annealed 19
Nobukawa et al. 7
for 10 min before stretching. The drawing temperatures (Tdraw) were adjusted to obtain the same 1
stress levels for CTA and CTA/DOA films, as shown in Table 1. The films were immediately 2
quenched by cold air blowing after stretching to avoid relaxation of molecular orientation. 3
The orientation birefringence (∆n) of the films was measured as a function of wavelength 4
using an optical birefringence analyzer (KOBRA-WPR, Oji Scientific Instruments, Japan). The 5
details of the optical system have been described previously [23]. Refractive indices at various 6
wavelengths of CTA and DOA were measured by using an Abbe refractometer (DR-M2, Atago, 7
Japan). 8
To remove DOA, the stretched and unstretched films were immersed in methanol for at least 9
8 hours and dried in vacuo for 1 day at RT. The complete removal of DOA from the film was 10
confirmed by the 1H-NMR spectra before/after immersion using an AVANCE III NMR 400 (Bruker 11
Corporation, Germany). The obtained films were kept in a humidity chamber (IG420, Yamato, 12
Japan) at 25 °C and 50% relative humidity (RH) for 1 day to avoid the effects of uncontrolled 13
moisture on the optical properties, as previously reported [24]. The moisture content of the films 14
was determined using a Karl Fisher moisture meter (Mitsubishi Chemical Analytec Co. Ltd, Japan). 15
The morphology of the films was examined using a scanning electron microscope (SEM) 16
(S4100, Hitachi Ltd, Japan) with an acceleration voltage of 20 kV. Prior to the observation, the 17
surfaces of the films were coated with Pt-Pd in an ion-sputter machine (E1010, Hitachi Ltd, Japan). 18
In order to examine the sea-island structure in CTA/DOA films, a light scattering (LS) measurement 19
Nobukawa et al. 8
was carried out at room temperature by using a LS analyzer (DYNA-3000, Otsuka Electronics Co., 1
Ltd., Japan). The correlation length, which reflects the morphology of CTA/DOA films, was 2
estimated from the LS data. 3
The wide-angle X-ray diffraction (WAXD) pattern was measured at RT using a powder 4
X-ray diffractometer (RINT-2500, Rigaku, Japan) by refractive mode to evaluate the crystallinity of 5
CTA in the films. The experiments were carried out using CuKa radiation at 40 kV and 30 mA at a 6
scanning rate of 1° min-1 over 2 hours (Bragg angle range from 5 to 60°). 7
8
RESULTS and DISCUSSION 9
Plasticization effect of DOA on dynamic mechanical property of CTA 10
Dynamic mechanical properties of polymeric materials represent miscibility or 11
immiscibility of the blends. Furthermore, the properties are also an important consideration when 12
preparing a stretched film by melt processing because the applied stress affects the chain orientation 13
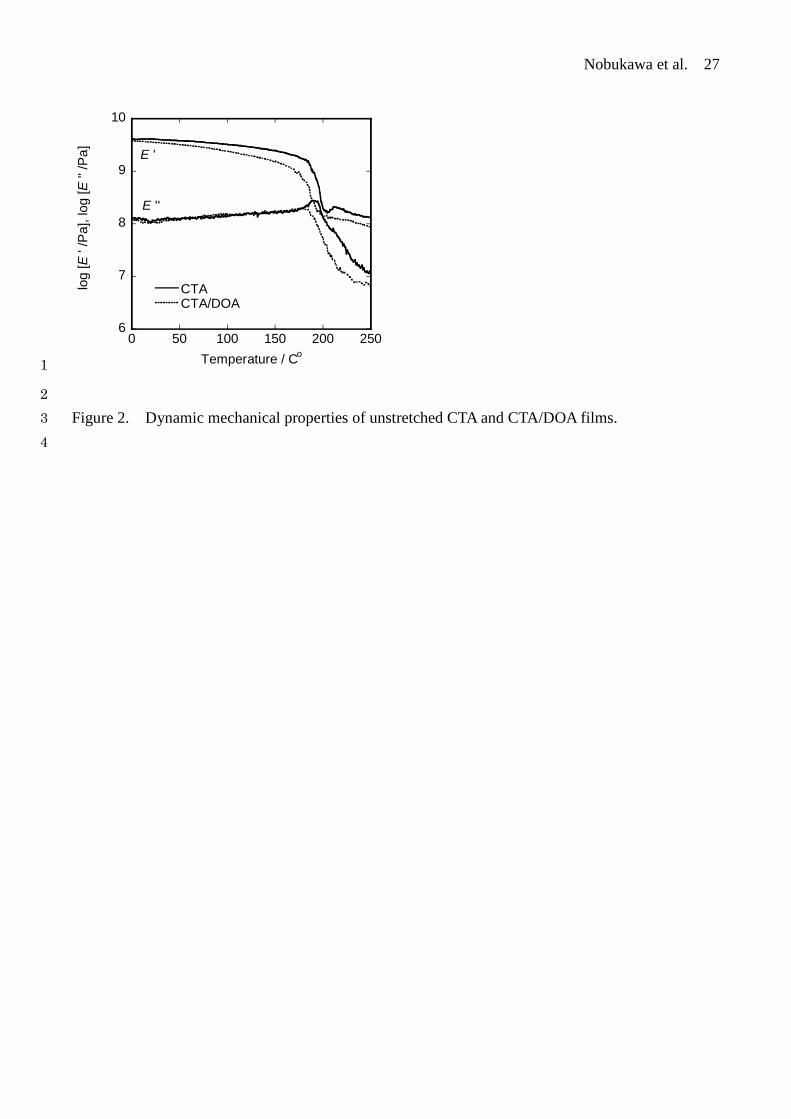
of the polymer. Figure 2 shows the temperature dependence of E′ and E″ for CTA and CTA/DOA 14
films. The glass-to-rubber transition of the blend shifted to a lower temperature and broadened 15
compared with that of the bulk, implying that DOA acts as a plasticizer for CTA. Yamaguchi et al. 16
[25] reported that DOA plasticizes cellulose acetate propionate (CAP), an analog of CTA. The 17
addition of DOA was reported to decrease the Tg of CAP by 35 °C compared with only 5 °C for CTA, 18
suggesting that the solubility of DOA and CTA is lower than that of DOA and CAP. Therefore, DOA 19

Nobukawa et al. 9
is possibly immiscible with CTA on the molecular level, although the blend film was transparent 1
after solution casting. 2
The rubbery plateau is also observed for general uncross-linked polymers owing to chain 3
entanglement, and the value is at least 0.1 to 1 MPa. In Figure 2, E′ curves for CTA and CTA/DOA 4
also represent the rubbery plateau beyond 200 °C. However, the plateau modulus is over 10 MPa, 5
which is much larger than the general value. This suggests that microcrystallites of CTA act as 6
cross-link points. Furthermore, the plateaus in both curves represent the same level, meaning that the 7
cross-link densities of CTA are comparable in bulk and blend. If the crystallite size is not affected by 8
the presence of DOA, the degrees of crystallinity for CTA are similar in both systems. 9
10
[Figure 2] 11
12
Orientation birefringence of CTA and CTA/DOA 13
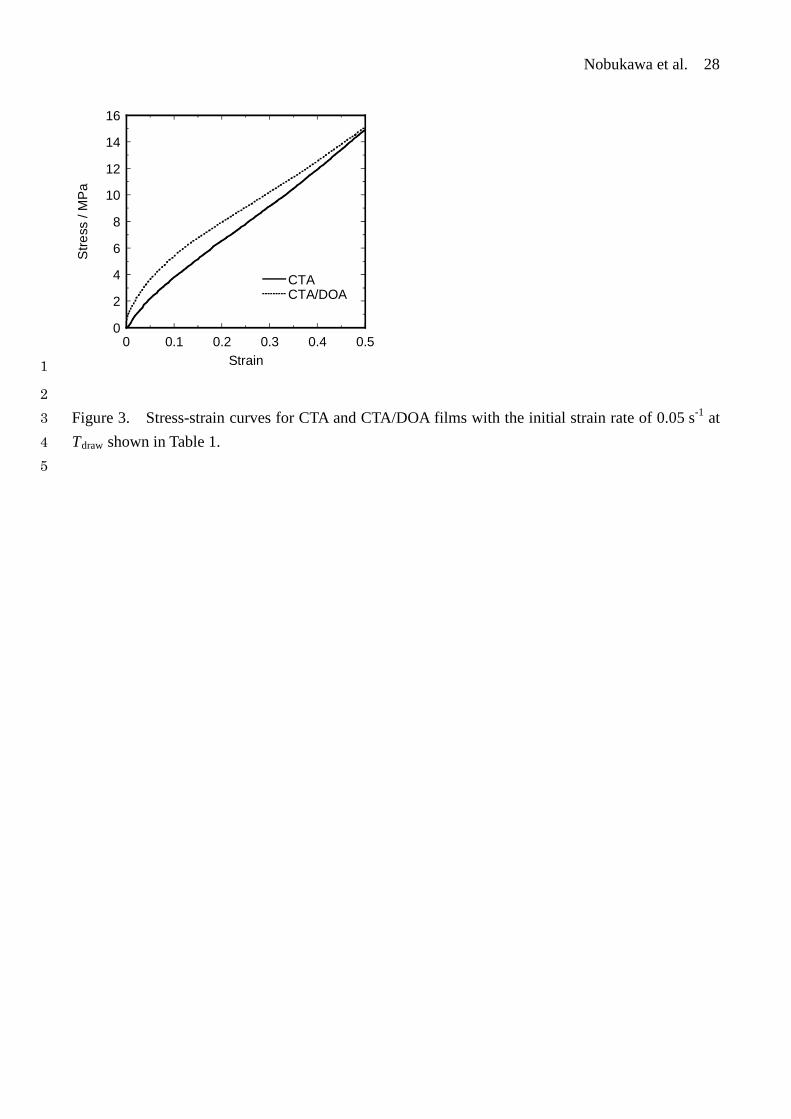
Solution-cast films of CTA and CTA/DOA were uniaxially stretched with a draw ratio of 1.5 14
at Tdraw, as shown in Table 1. Stress–strain curves were obtained during stretching, as shown in 15
Figure 3. The figure demonstrates the same stress level for the two stretched films, indicating that the 16
chain orientations of CTA in bulk and blend are similar, as discussed later. 17
18
[Figure 3] 19
Nobukawa et al. 10
1
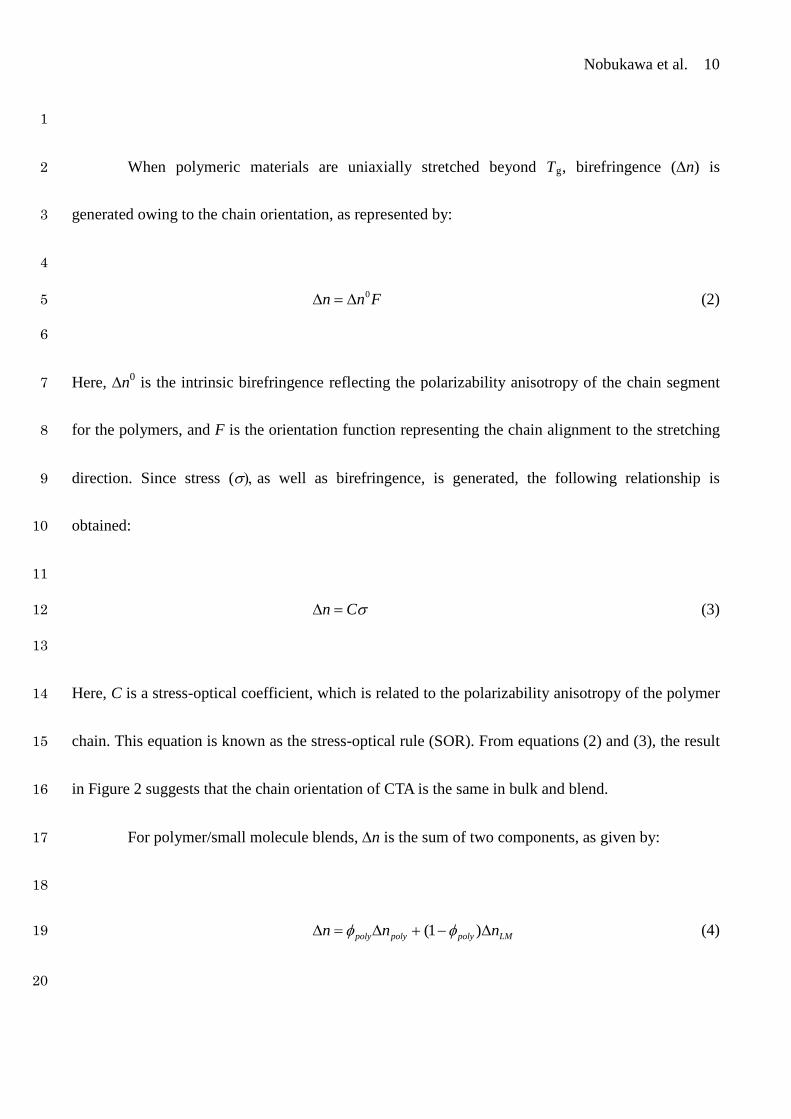
When polymeric materials are uniaxially stretched beyond Tg, birefringence (∆n) is 2
generated owing to the chain orientation, as represented by: 3
4
Fnn 0∆=∆ (2) 5
6
Here, ∆n0 is the intrinsic birefringence reflecting the polarizability anisotropy of the chain segment 7
for the polymers, and F is the orientation function representing the chain alignment to the stretching 8
direction. Since stress (σ), as well as birefringence, is generated, the following relationship is 9
obtained: 10
11
σCn =∆ (3) 12
13
Here, C is a stress-optical coefficient, which is related to the polarizability anisotropy of the polymer 14
chain. This equation is known as the stress-optical rule (SOR). From equations (2) and (3), the result 15
in Figure 2 suggests that the chain orientation of CTA is the same in bulk and blend. 16
For polymer/small molecule blends, ∆n is the sum of two components, as given by: 17
18
LMpolypolypoly nnn ∆−+∆=∆ )1( φφ (4) 19
20

Nobukawa et al. 11
where φpoly is the volume fraction of the polymer, and ∆npoly and ∆nLM are the birefringence values of 1
the two components in the pure state. However, the dynamic mechanical data in Figure 2 indicate 2
that CTA is not completely miscible with DOA; that is, phase separation occurs. Since the CTA/DOA 3
film seems to be transparent, the separated domain of DOA might be smaller than wavelength of 4
visible lights (at least 400 nm), which is related to the Mie scattering. Therefore, the form 5
birefringence (∆nF) caused by the separated domain should be considered, as represented by: 6
7
FDOACTACTACTA nnnn ∆+∆−+∆=∆ )'1(' φφ (5) 8
9
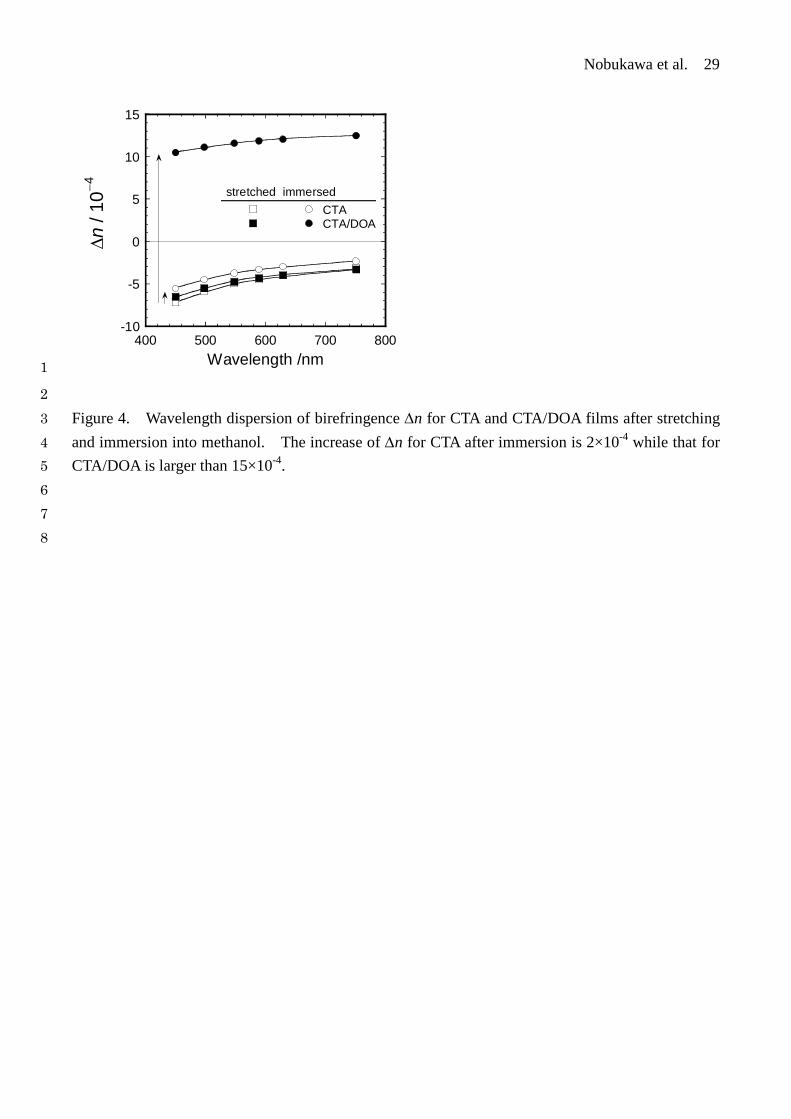
The prime mark in φ′CTA represents the separated CTA-rich phase in the blend system. Figure 4 10
shows the wavelength dependence of orientation birefringence (∆n) of CTA and CTA/DOA films 11
after stretching. As seen in the figure, ∆n data for the two films are comparably negative, and both 12
curves exhibit ordinary wavelength dependence, that is, the absolute value decreases with 13
wavelength increasing. The result means that the second and third terms on the right-hand side of 14
equation (5) are negligibly small. The form birefringence ∆nF is observed in phase-separated 15
systems composed of two or three phases having different refractive indices. Actually, since the 16
refractive indices (n) of CTA and DOA are almost similar (1.48 and 1.44 at 589 nm, respectively), 17
∆nF can be negligible as explained later. 18
19
Nobukawa et al. 12
[Figure 4] 1
2
Abd Manaf et al. [14] found that the addition of tricresyl phosphate (TCP) changed the ∆n 3
of CTA from negative to positive because the orientation of TCP was affected by intermolecular 4
nematic interaction (NI) with the matrix polymer. Using their birefringence data from 5
polymer/aromatic molecule blends, Nobukawa et al. [15, 16] reported that the rigid and anisotropic 6
structure of the LM enhances the NI strength. As shown in Figure 4, the second term, 7
(1-φ′CTA)∆nDOA, which is originated from DOA, is small. There are two possible explanations for 8
this. The first possibility, from the above discussion, is the absence of NI between CTA and DOA, 9
that is, the orientation of DOA is almost zero. The second possible influence is that the CTA matrix 10
phase does not contain DOA because of phase separation as discuss below. 11
12
Phase separation in stretched CTA/DOA film 13
In order to investigate the phase separation in stretched CTA/DOA film, a static light 14
scattering (LS) experiment was performed at room temperature. According to the statistical 15
approaches by Debye and Bueche [26], the scattered intensity of depolarized light, I, is given as a 16
function of scattered vector q and the correlation length ξ, 17
18
( )2221 qAI
ξ+= (6) 19
Nobukawa et al. 13
1
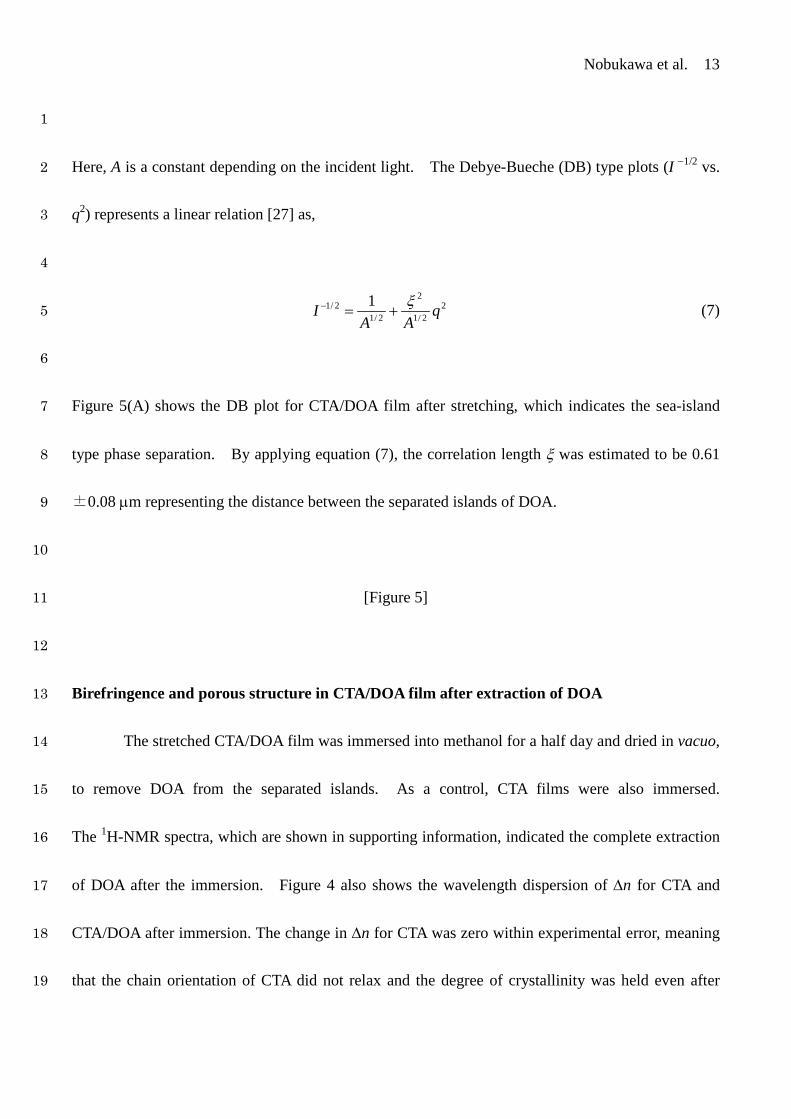
Here, A is a constant depending on the incident light. The Debye-Bueche (DB) type plots (I −1/2 vs. 2
q2) represents a linear relation [27] as, 3
4
22/1
2
2/12/1 1 q
AAI ξ
+=− (7) 5
6
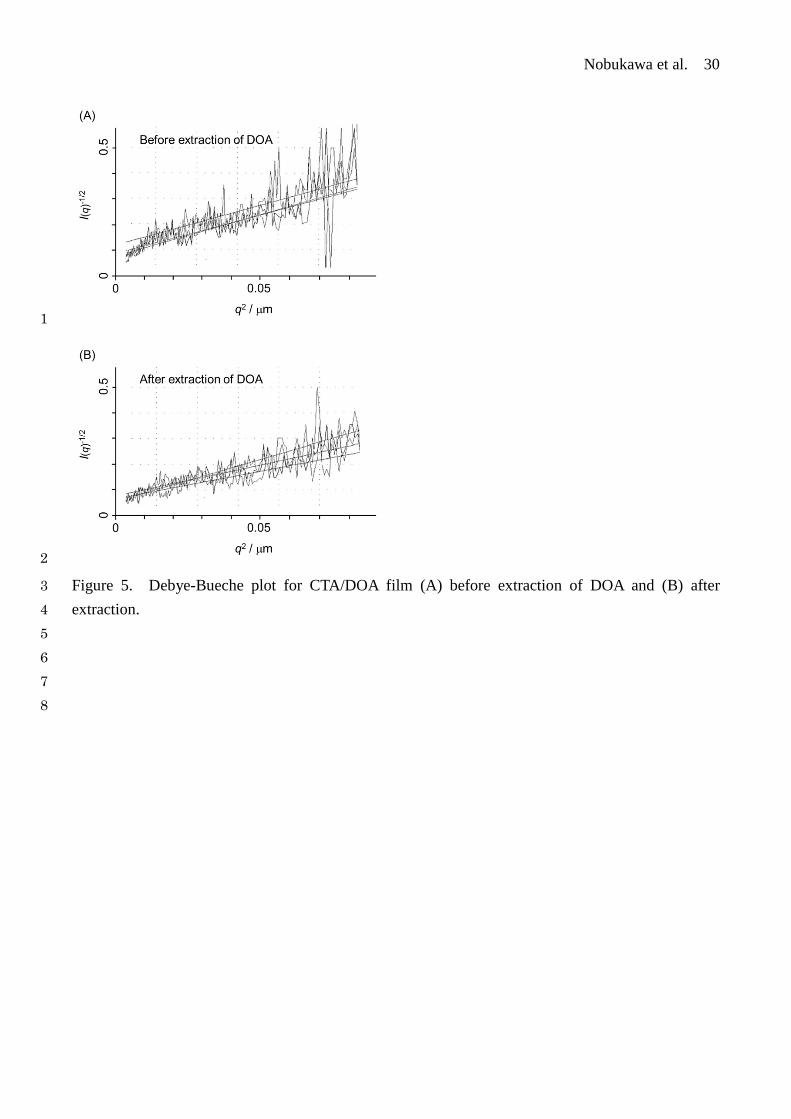
Figure 5(A) shows the DB plot for CTA/DOA film after stretching, which indicates the sea-island 7
type phase separation. By applying equation (7), the correlation length ξ was estimated to be 0.618
±0.08 µm representing the distance between the separated islands of DOA. 9
10
[Figure 5] 11
12
Birefringence and porous structure in CTA/DOA film after extraction of DOA 13
The stretched CTA/DOA film was immersed into methanol for a half day and dried in vacuo, 14
to remove DOA from the separated islands. As a control, CTA films were also immersed. 15
The 1H-NMR spectra, which are shown in supporting information, indicated the complete extraction 16
of DOA after the immersion. Figure 4 also shows the wavelength dispersion of ∆n for CTA and 17
CTA/DOA after immersion. The change in ∆n for CTA was zero within experimental error, meaning 18
that the chain orientation of CTA did not relax and the degree of crystallinity was held even after 19
Nobukawa et al. 14
immersion. In contrast, the ∆n of CTA/DOA dramatically changed from negative to positive after 1
removal of DOA. Since nanoscale DOA domains existed in the CTA/DOA before immersion, 2
nanoscale pores might appear. The LS data of CTA/DOA film after the extraction, which is shown 3
in Figure 5(B), exhibits the similar ξ (=0.63±0.13 µm) to the film before extraction, suggesting that 4
the nano pores are still maintained in CTA film. In order to investigate the morphology of the film, 5
images were taken using scanning electron microscopy (SEM). 6
Figure 6 compares the SEM images for unstretched, annealed and stretched CTA/DOA films 7
after immersion. The unstretched film before annealing shown in Figure 6(A) was not subject to 8
phase separation because no structures such as pores were observed in the surface or cross-section. In 9
Figure 6(B), pores are visible in the cross-section of the unstretched films following the extraction. 10
After stretching, ellipsoidal pores appeared, as shown in Figure 6(C). By assuming the affine 11
deformation, the aspect ratio of DOA domain should be 1.5/0.8 (long axis/short axis), which is 12
consistent with that of the ellipsoidal pore in Figure 6(C). Therefore, the SEM images suggest that 13
DOA domains appear because of annealing above Tg, and the spherical domains are deformed into 14
needle shapes by stretching. 15
16
[Figure 6] 17
18
Effects of moisture and crystallinity on birefringence 19
Nobukawa et al. 15
The effects of moisture and crystallinity on total birefringence of CTA film were confirmed 1
as below. Abd Manaf et al. [24] investigated the effect of moisture on the ∆n of CTA by controlling 2
the humidity. According to them, 1 wt% water content increases the ∆n of CTA by −2 × 10⁻⁴. As 3
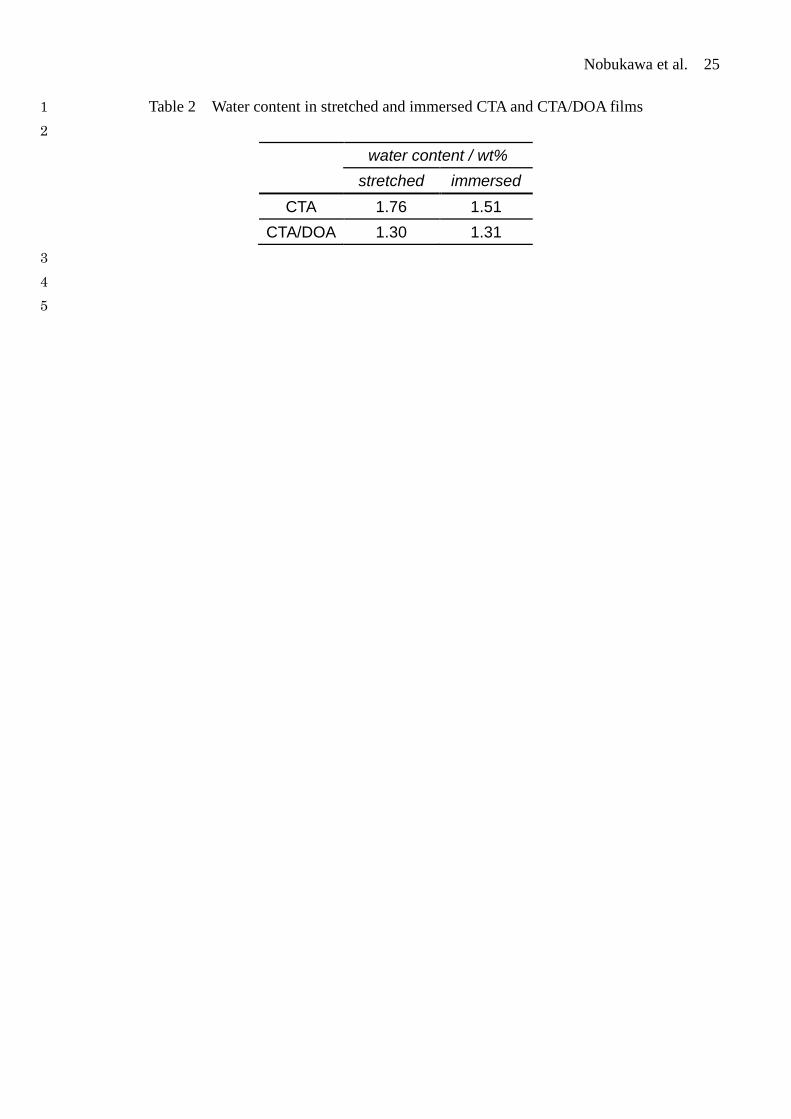
seen in Table 2, the water contents in CTA and CTA/DOA films do not change after the immersion in 4
methanol. Hence, the moisture effect is negligible for ∆n change, as shown in Figure 4. 5
In general, crystalline and amorphous regions in crystalline and semi-crystalline polymers, 6
including CTA, contribute to orientation birefringence, as represented by the following equation: 7
8
aacccc FnxFnxn 00 )1( ∆−+∆=∆ (8) 9
10
Here, xc is the degree of crystallinity. The subscripts c and a represent crystalline and amorphous 11
regions, respectively. For generally crystalline polymers, such as poly(ethylene 2,6-naphthalate), the 12
two intrinsic birefringences, ∆nc0 and ∆na
0, are not the same [28]. Therefore, the degree of 13
crystallinity changes the total birefringence. 14
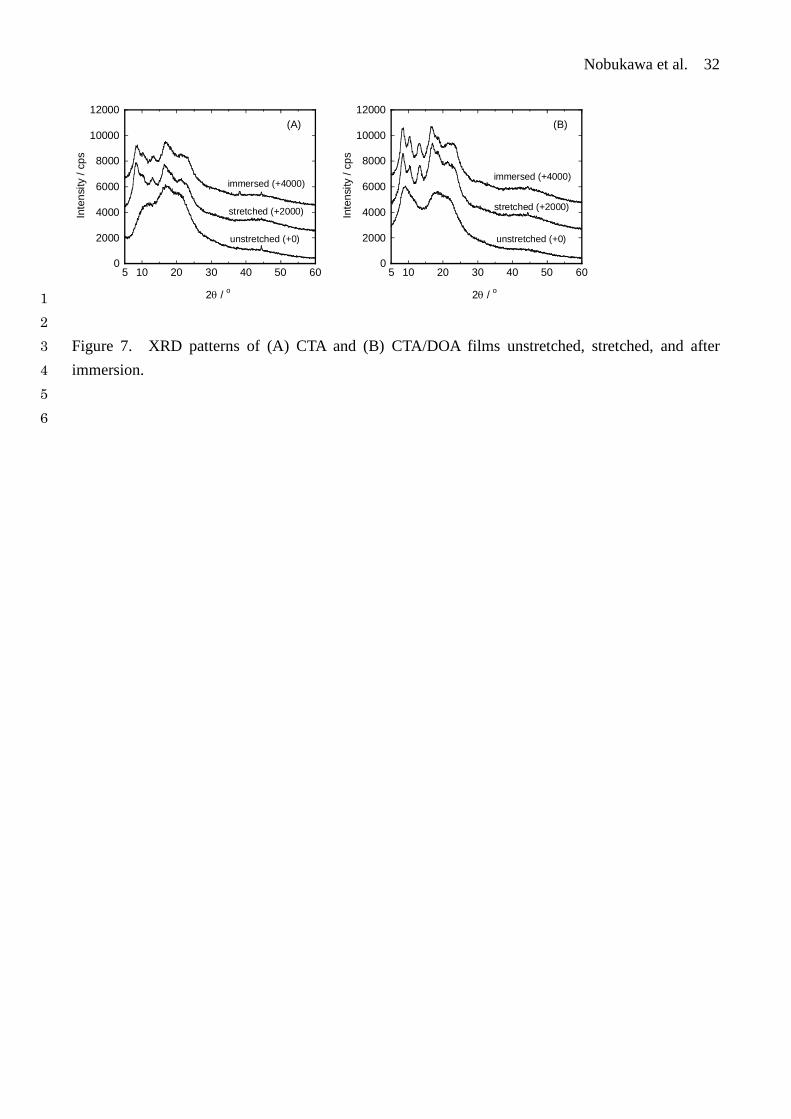
Figure 7 shows the X-ray diffraction (XRD) patterns for CTA and CTA/DOA films scanned 15
under various conditions. The unstretched films for both systems showed broad peaks, which 16
agrees with data reported by Cao et al. [29]. However, stretched and immersed films showed strong 17
peaks reflecting crystalline structure and implying that the crystallization was induced by the hot 18
stretching. According to equation (6), the ∆n of CTA should be discussed by considering the two 19
components from crystalline and amorphous regions. However, since the XRD patterns for 20
Nobukawa et al. 16
stretched and immersed films were similar, the degree of crystallinity was not changed by the 1
stretching process. Hence, the effects of crystallinity and moisture content on ∆n can be ignored. 2
3
[Figure 7] 4
5
What is the reason for the birefringence change? As represented by equation (5), the form 6
birefringence (∆nF) can be found in separate phases with very different refractive indices (n’s). 7
Moreover, since the porous structure that appeared after the extraction of DOA is filled with air, the 8
difference in refractive index is much larger than that between CTA and DOA. Based on this idea, 9
the form birefringence observed in CTA/DOA films is discussed in the next section. 10
11
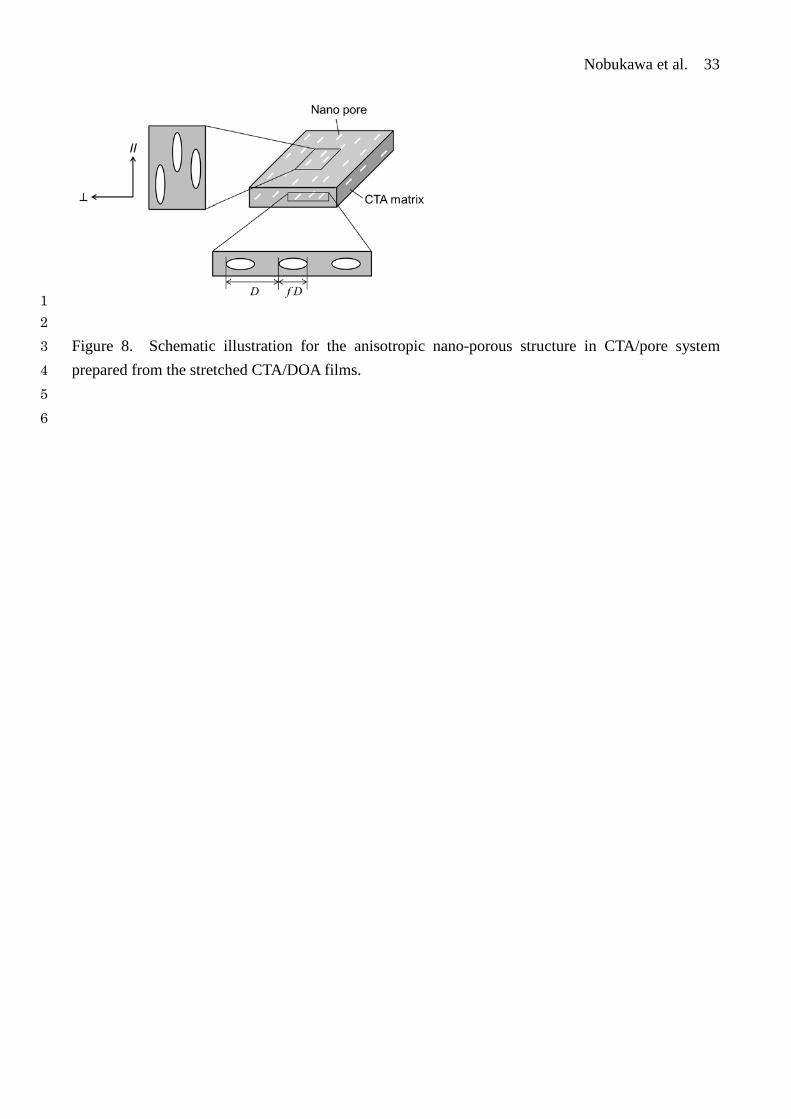
Form birefringence in anisotropic porous CTA. 12
As can be seen in Figure 6(C), the stretched CTA/DOA film after the extraction of DOA had 13
an anisotropic porous structure. Figure 8 is a simplified depiction of the anisotropic porous 14
structure of the stretched CTA blend film after removal of DOA by the extraction method. 15
Definitions of D and f are represented in the figure. 16
17
[Figure 8] 18
19
Nobukawa et al. 17
Ibn-Elhaj and Schadt [19] examined the contribution of anisotropic nano-corrugated pattern 1
to the optical birefringence of thin polymeric films, based on the anisotropic dielectric theory. 2
However, the theory was developed by utilizing a zero-order approximation where electric field and 3
displacement vector are constant [30]. Therefore, Richter et al. [31] determined the form 4
birefringence (∆nF) in the grating system with anisotropic microstructures by applying more precise 5
second-order solution given by, 6
7
⊥−=∆ ,2//,2 nnnF (9) 8
[ ]2/1
22
20
2
,0
2/122//,0
)1(
)1(
+−=
+−=
⊥dmpoly
dmpoly
fnnfnnn
fnnfn
(10) 9
2/1
2,0
6//,0
2
22222
22,0,2
2/1
2222222
2//,0//,2
11)1(31
))(1(31
−−
+=
−−
+=
⊥⊥⊥ nnnn
ffDnn
nnffDnn
dmpoly
dmpoly
pl
pl
(11) 10
11
Here, the number in subscript following n represents the approximation order for the equation 12
solution, and l is the light wavelength. The refractive indices of polymer and pore (or domain) are 13
denoted by npoly and ndm, respectively. 14
From equations (9)–(11), the third term in equation (5) can be calculated for CTA/DOA 15
(before extraction) and porous CTA (after extraction) films. To fit the calculated result to the 16
Nobukawa et al. 18
experimental data for CTA/pore film in Figure 4, f was determined to be 0.005, and D was 0.6 µm as 1
estimated from the LS data. These values seem to be consistent with the SEM image. However, f 2
value is not consistent with the concentration of DOA (= 0.09), suggesting that the pore size will be 3
reduced owing to the osmotic pressure difference between the CTA and methanol phases during the 4
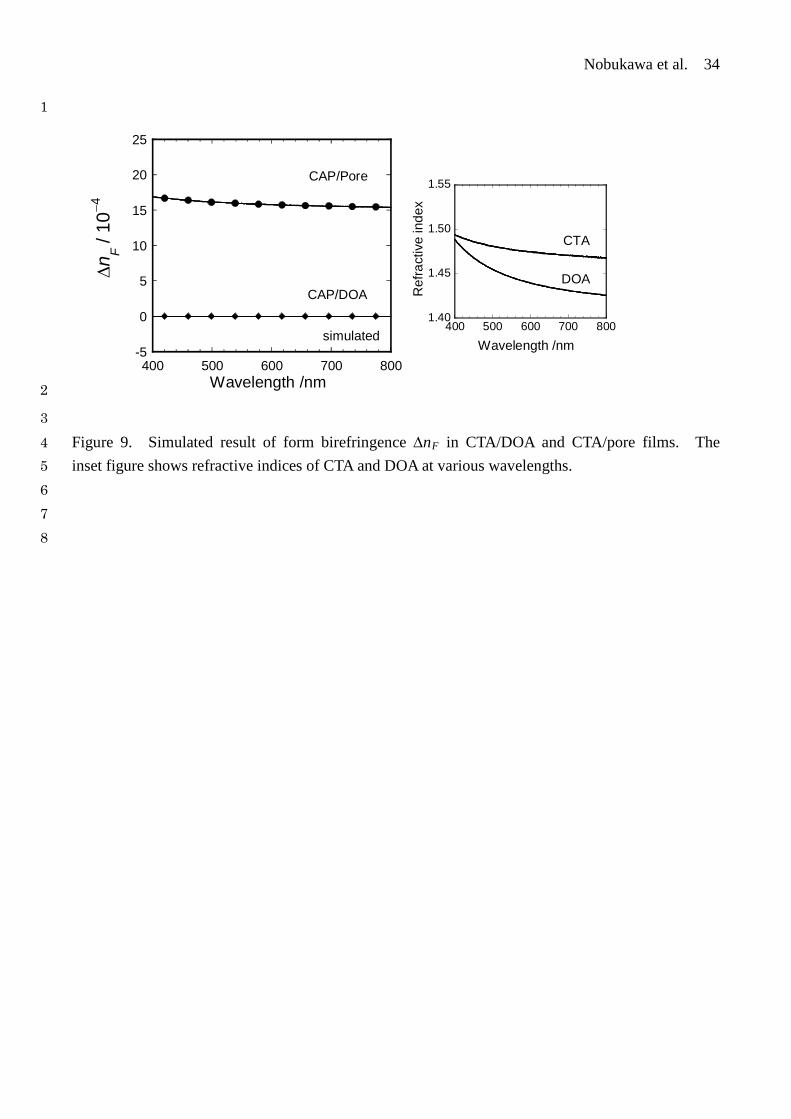
extraction. The calculated results are shown in Figure 9. The refractive indices at various 5
wavelengths for CTA and DOA are shown in the figure while that for pore is 1.0. As shown in the 6
figure, the contribution of ∆nF in CTA/DOA film is smaller than 10−6 while that in the CTA/pore film 7
is 15 × 10−4. In addition, the weaker wavelength dependence of the calculated ∆nF agrees with the 8
change of ∆n from the CTA/DOA and CTA/pore films represented in Figure 4. 9
10
[Figure 9] 11
12
We conclude that the form birefringence Fn∆ , which is generated by the extraction of 13
immiscible plasticizer, may change total birefringence of CTA film from negative to positive. 14
Furthermore, since Fn∆ and the orientation birefringence On∆ exhibit weak and strong 15
wavelength dependences, respectively, the total birefringence ( OF nn ∆+∆= ) shows extraordinary 16
dependence. 17
In order to control the total birefringence of CTA/pore film, both On∆ and Fn∆ should be 18
considered. The former can be controlled by the experimental conditions such as the stretching 19
Nobukawa et al. 19
ratio and temperature as reported in many papers. In contrast, the latter has not been investigated. 1
The theory represented by equations (9)-(11) does not predict the stretching ratio dependence of 2
Fn∆ . We think that these stretching conditions will change size and aspect ratio of the pore. In 3
the future work, the relationship between the pore size and Fn∆ should be investigated by varying 4
the preparation conditions of the nanoporous film. 5
6
Conclusions 7
We investigated orientation birefringence in a nanoporous film of cellulose triacetate (CTA), 8
which was prepared from CTA/di(2-ethylhexyl) adipate (DOA) by immersion into methanol to 9
extract DOA. Before the extraction, although the CTA/DOA film showed phase separation due to 10
low miscibility, the orientation birefringence of CTA/DOA was negative and similar to that of CTA, 11
implying that the DOA domains make no contribution to the birefringence. After the extraction, the 12
birefringence of CTA became positive. Based on the results of moisture content, XRD and SEM, we 13
think that the anisotropic porous structure of the CTA film after extraction is responsible for the 14
birefringence change. 15
The form birefringence of the anisotropic microstructure was estimated according to surface 16
gratings theory. As a result, agreement between theoretical and experimental results was achieved. 17
We suggest that, even in films comprising a single component, the optical birefringence property can 18
be modified by anisotropic nanopores created by the immersion method. 19

Nobukawa et al. 20
1
Acknowledgement 2
This work was partly supported by a Grant-in-Aid for Young Scientists B (25870268), and 3
by a grant from the Kyoto Technoscience Center in 2013. The authors would like to thank Otsuka 4
Electronics Co., Ltd. for the measurement of light scattering. 5
6

Nobukawa et al. 21
REFERENCES 1
1. Edgar KJ, Buchanan CM, Debenham JS, Rundquist PA, Seiler BD, Shelton MC, and Tindall 2 D. Prog. Polym. Sci. 2001;26:1605-1688. 3
2. Law PW, Longdon A, and Willins GG. Macromol. Symp. 2004;208:293-322. 4 3. Ohno T and Nishio Y. Macromolecules 2007;40:3468-3476. 5 4. Maeda A and Inoue T. Nihon Reoroji Gakkaishi 2011;39:159-163. 6 5. Songsurang K, Miyagawa A, Abd Manaf ME, Phulkerd P, Nobukawa S, and Yamaguchi M. 7
Cellulose 2012;20:83-96. 8 6. Yamaguchi M, Abd Manaf ME, Songsurang K, and Nobukawa S. Cellulose 9
2012;19:601-613. 10 7. Uchiyama A, Ono Y, Ikeda Y, Shuto H, and Yahata K. Polym. J. 2012;44:995-1008. 11 8. Tagaya A and Koike Y. Polymer J. 2012;44:306-314. 12 9. Tagaya A, Ohkita H, Harada T, Ishibashi K, and Koike Y. Macromolecules 13
2006;39:3019-3023. 14 10. Saito H and Inoue T. J. Poly. Sci. Part-B Poly. Phys. 1987;25:1629-1636. 15 11. Tagaya A, Iwata S, Kawanami E, Tsukahara H, and Koike Y. App. Opt. 2001;40:3677-3683. 16 12. Uchiyama A and Yatabe T. Japan J. App. Phys. Part-1 2003;42:3503-3507. 17 13. Rao YQ, Chen JL, and Ishikawa T. Control of Birefringence Dispersion Utilizing 18
Nanocomposites. In: Company EK, editor. US Patent, vol. US 2007/0042137 A1. United 19 State, 2005. 20
14. Abd Manaf ME, Tsuji M, Shiroyama Y, and Yamaguchi M. Macromolecules 21 2011;44:3942-3949. 22
15. Nobukawa S, Urakawa O, Shikata T, and Inoue T. Macromolecules 2010;43:6099-6105. 23 16. Nobukawa S, Aoki Y, Yoshimura H, Tachikawa Y, and Yamaguchi M. J. Appl. Polym. Sci. 24
2013;130:3465-3472. 25 17. Cho CK, Kim JD, Cho K, Park CE, Lee SW, and Ree M. J. Adh. Sci. Tech. 26
2000;14:1131-1143. 27 18. Flanders DC. Appl. Phys. Lett. 1983;42:492-494. 28 19. Ibn-Elhaj M and Schadt M. Nature 2001;410:796-799. 29 20. Lloyd DR, Kinzer KE, and Tseng HS. J. Membr. Sci. 1990;52:239-261. 30 21. Lloyd DR, Kim SS, and Kinzer KE. J. Membr. Sci. 1991;64:1-11. 31 22. Matsuyama H, Ohga K, Maki T, Tearamoto M, and Nakatsuka S. J. Appl. Polym. Sci. 32
2003;89:3951-3955. 33 23. Yamaguchi M, Okada K, Abd Manaf ME, Shiroyama Y, Iwasaki T, and Okamoto K. 34
Macromolecules 2009;42:9034-9040. 35 24. Abd Manaf ME, Tsuji M, Nobukawa S, and Yamaguchi M. Polymers 2011;3:955-966. 36 25. Yamaguchi M, Iwasaki T, Okada K, and Okamoto K. Acta Mater. 2009;57:823-829. 37
Nobukawa et al. 22 26. Debye P and Bueche AM. J. Appl. Phys. 1949;20:518-525. 1 27. Pogodina NV, Siddiquee SK, van Egmond JW, and Winter HH. Macromolecules 2
1999;32:1167-1174. 3 28. Stein RS, Onogi S, Sasaguri K, and Keedy DA. J. Appl. Phys. 1963;34:80-89. 4 29. Cao SG, Shi YQ, and Chen GW. J. Membr. Sci. 2000;165:89-97. 5 30. Born M and Wolf E. Principles of optics. Chapt. 14. London: Cambridge University Press, 6
1999. pp. 735. 7 31. Richter I, Sun PC, Xu F, and Fainman Y. Appl. Opt. 1995;34:2421-2429. 8 9
10
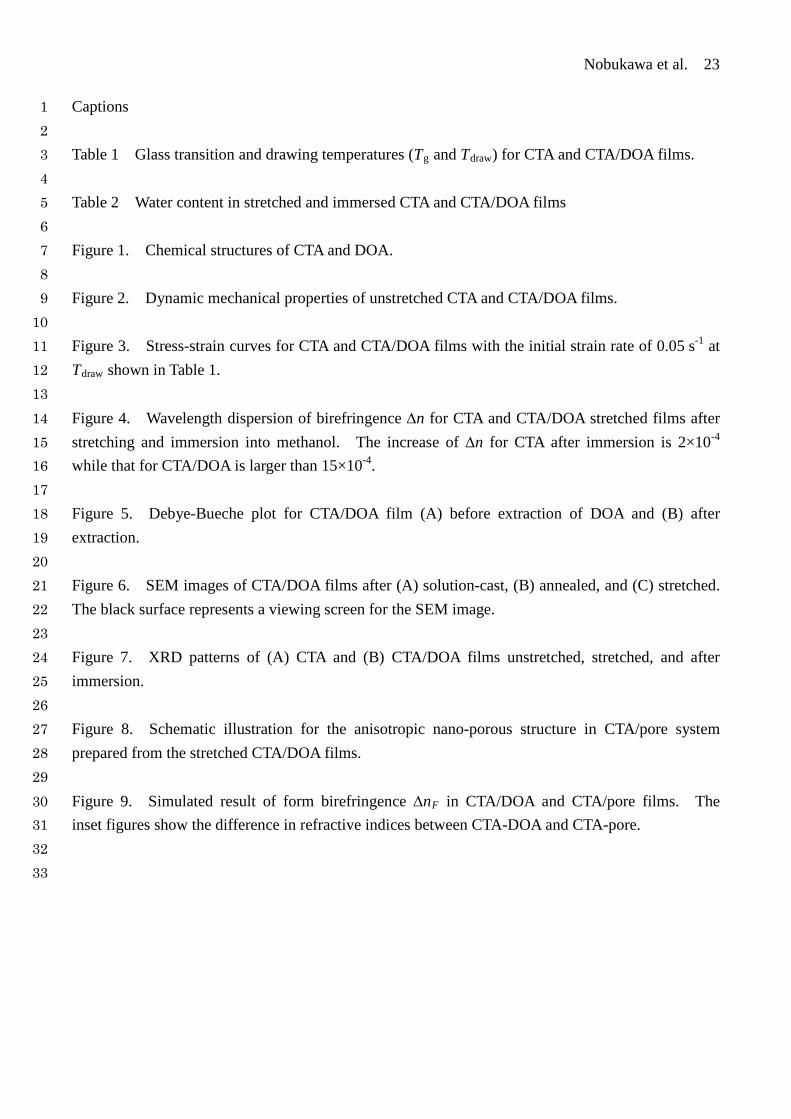
Nobukawa et al. 23 Captions 1 2 Table 1 Glass transition and drawing temperatures (Tg and Tdraw) for CTA and CTA/DOA films. 3 4 Table 2 Water content in stretched and immersed CTA and CTA/DOA films 5 6 Figure 1. Chemical structures of CTA and DOA. 7 8 Figure 2. Dynamic mechanical properties of unstretched CTA and CTA/DOA films. 9 10 Figure 3. Stress-strain curves for CTA and CTA/DOA films with the initial strain rate of 0.05 s-1 at 11 Tdraw shown in Table 1. 12 13 Figure 4. Wavelength dispersion of birefringence ∆n for CTA and CTA/DOA stretched films after 14 stretching and immersion into methanol. The increase of ∆n for CTA after immersion is 2×10⁻⁴ 15 while that for CTA/DOA is larger than 15×10-4. 16 17 Figure 5. Debye-Bueche plot for CTA/DOA film (A) before extraction of DOA and (B) after 18 extraction. 19 20 Figure 6. SEM images of CTA/DOA films after (A) solution-cast, (B) annealed, and (C) stretched. 21 The black surface represents a viewing screen for the SEM image. 22 23 Figure 7. XRD patterns of (A) CTA and (B) CTA/DOA films unstretched, stretched, and after 24 immersion. 25 26 Figure 8. Schematic illustration for the anisotropic nano-porous structure in CTA/pore system 27 prepared from the stretched CTA/DOA films. 28 29 Figure 9. Simulated result of form birefringence ∆nF in CTA/DOA and CTA/pore films. The 30 inset figures show the difference in refractive indices between CTA-DOA and CTA-pore. 31 32 33
Nobukawa et al. 24
Tables 1
2 Table 1 Glass transition and drawing temperatures (Tg and Tdraw) for CTA and CTA/DOA films. 3
4
Tg / oC Tdraw / oC CTA 188 213
CTA/DOA 183 205 5
6 7
Nobukawa et al. 25
Table 2 Water content in stretched and immersed CTA and CTA/DOA films 1 2
water content / wt% stretched immersed
CTA 1.76 1.51 CTA/DOA 1.30 1.31
3 4 5

Nobukawa et al. 26 Figures 1 2 3
4 5 Figure 1. Chemical structures of CTA and DOA. 6 7 8
(A)
O
OO
O
(B)
OOO
CH2OAc
OAcAcO
n
Nobukawa et al. 27
6
7
8
9
10
0 50 100 150 200 250
CTACTA/DOA
log
[E '
/Pa]
, log
[E ''
/Pa]
Temperature / Co
E '
E ''
1
2 Figure 2. Dynamic mechanical properties of unstretched CTA and CTA/DOA films. 3 4
Nobukawa et al. 28
0
2
4
6
8
10
12
14
16
0 0.1 0.2 0.3 0.4 0.5
CTACTA/DOA
Stre
ss /
MP
a
Strain 1
2 Figure 3. Stress-strain curves for CTA and CTA/DOA films with the initial strain rate of 0.05 s-1 at 3 Tdraw shown in Table 1. 4 5
Nobukawa et al. 29
-10
-5
0
5
10
15
400 500 600 700 800
CTACTA/DOA
∆n /
10−4
Wavelength /nm
stretched immersed
1
2 Figure 4. Wavelength dispersion of birefringence ∆n for CTA and CTA/DOA films after stretching 3 and immersion into methanol. The increase of ∆n for CTA after immersion is 2×10⁻⁴ while that for 4 CTA/DOA is larger than 15×10-4. 5 6 7 8
Nobukawa et al. 30
1
2
Figure 5. Debye-Bueche plot for CTA/DOA film (A) before extraction of DOA and (B) after 3 extraction. 4 5 6 7 8

Nobukawa et al. 31
1
2
3 4 Figure 6. SEM images of CTA/DOA films after (A) solution-cast, (B) annealed, and (C) stretched. 5 The black surface represents a viewing screen for the SEM image. 6 7 8
Nobukawa et al. 32
0
2000
4000
6000
8000
10000
12000
10 20 30 40 50 60
Inte
nsity
/ cp
s
2θ / o5
immersed (+4000)
stretched (+2000)
unstretched (+0)
(A)
0
2000
4000
6000
8000
10000
12000
10 20 30 40 50 605
Inte
nsity
/ cp
s
2θ / o
immersed (+4000)
stretched (+2000)
unstretched (+0)
(B)
1 2 Figure 7. XRD patterns of (A) CTA and (B) CTA/DOA films unstretched, stretched, and after 3 immersion. 4 5 6
Nobukawa et al. 33
1 2 Figure 8. Schematic illustration for the anisotropic nano-porous structure in CTA/pore system 3 prepared from the stretched CTA/DOA films. 4 5 6
Nobukawa et al. 34 1
-5
0
5
10
15
20
25
400 500 600 700 800Wavelength /nm
∆nF /
10−4
CAP/DOA
CAP/Pore
simulated1.40
1.45
1.50
1.55
400 500 600 700 800
Wavelength /nm
Ref
ract
ive
inde
x
DOA
CTA
2
3 Figure 9. Simulated result of form birefringence ∆nF in CTA/DOA and CTA/pore films. The 4 inset figure shows refractive indices of CTA and DOA at various wavelengths. 5 6 7 8
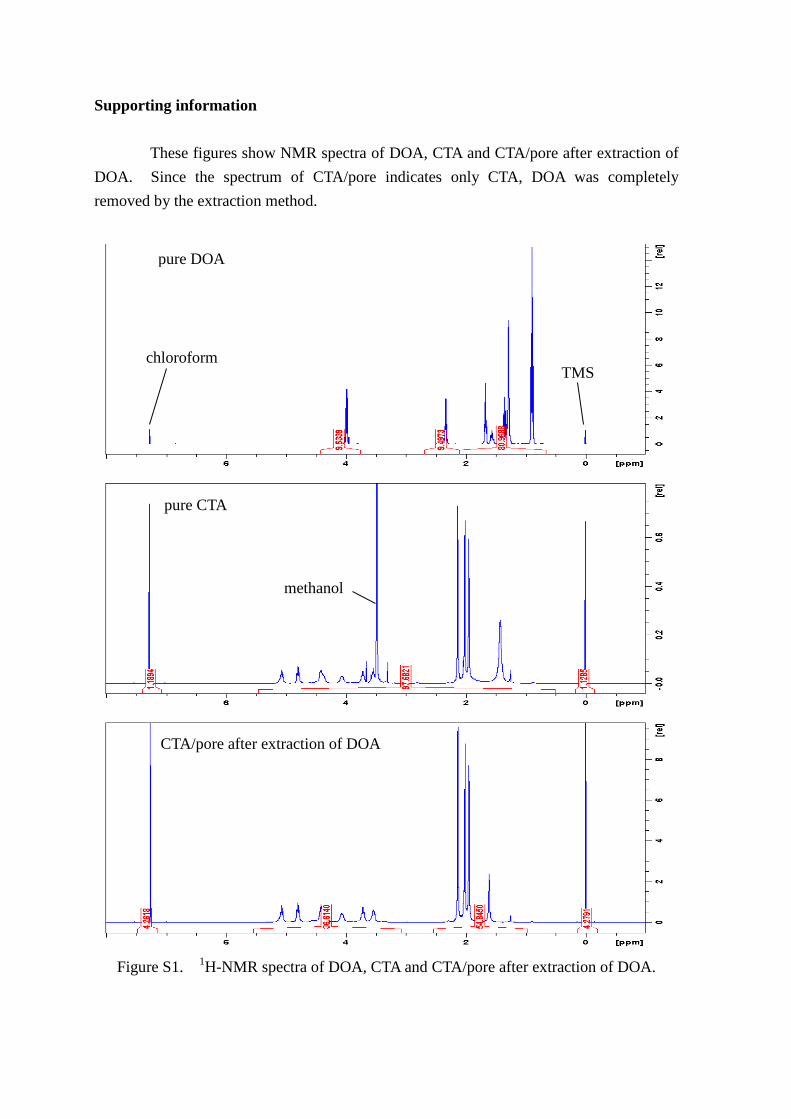
Supporting information These figures show NMR spectra of DOA, CTA and CTA/pore after extraction of DOA. Since the spectrum of CTA/pore indicates only CTA, DOA was completely removed by the extraction method.
Figure S1. 1H-NMR spectra of DOA, CTA and CTA/pore after extraction of DOA.
pure DOA
CTA/pore after extraction of DOA
pure CTA
chloroform
methanol
TMS