facilities services & admin began tracking recurring tasks ... indoor spaces also have pre ......
TRANSCRIPT
FACILITIES SERVICESBALANCED SCORECARD REPORTFY2017 Q3 (JAN - MAR 2017)
FACILITIES SERVICES ACCOMPLISHMENTS
Strategic Planning & Continuous Improvement Held the 2017 All‐staff meeting, which announced multiple Distinguished Staff Award nominees
and two winners (a first!).
Developed and printed the FS Customer Care booklet, a custom built and comprehensive guide on improving customer interactions.
Held first building coordinator meeting in 7 years, providing a forum for information sharing and process improvement. Future meetings to occur quarterly.
Launched Customer Care Team front porch and UW Connect as an email management system.
Facilities Employee Services Coordinated with FS departments to post quarterly accomplishments at the training center.
Encouraged the use of NIOSH phone app as part of the Ladder Safety Hands On training.
Developed multiple project and time saving tools including automated excel workbooks and project‐specific Trello and visual boards.
Payroll and HR assisted employees across FS in signing up for Met Life when campus deadline and process were unclear.
Building Services Department All managers are now participating in Leadership Development Intensive (LDI) courses.
UW Recycling completed its move to Publication Services Building and installed the MiniMax program in Meany Hall.
Had 14 teams participate in Lean Poster Showcase at UW Intellectual House.
Launched a Lean team to develop a process around custodial closet supply availability and set standard stock levels (min/max).
UW Recycling staff presented “Minimizing Waste and Maximizing Recycling” at the Washington Higher Education Sustainability Conference in Spokane, WA.
Campus Operations / Engineering Services • Completed a 2‐day Strategy retreat to collaborate and refocus on Engineering Services’ mission,
vision, values and Core Functions for next 2 years; adding alignment with FS and UW’s strategic plans.
• Established a GIS‐based process with FOMS and the Elevator Shop for the UW Spill Prevention Plan (EPA Requirement), allowing mapping and mobile device input in lieu of a time‐consuming paper process.

Finance & Business Services FS Stores had its best annual inventory audit to date, using fewer staff and less hours, with an
accuracy of 97% (up from 93% in 2016) – also eliminating unnecessary stock items.
Presented at a University Surplus conference (USPA), demonstrating their improvements through mobile application and database integrations.
Fleet removed 12 minivans due to success of the 30‐passenger shuttle bus program and increased UCar vehicle availability at South Campus Center, UW Tower, NW Hospital and Sandpoint.
Launched a new customer‐facing website as a part of the FS goal of being easy to do business with ‐‐ bringing all of our services into a single location that aligns with TAP standards.
FS Stores Procurement created a visual management board and a suite of new metrics to continue improvements which have already saved taxpayers and campus customers almost $2 million through reductions in the procurement surcharge rate.
Negotiated and signed contract with Citation Collection Services to transfer collections to a T2 integrated subsidiary for integrated collections processing.
Transportation Services Sales & Admin began tracking recurring tasks associated with the start of each quarter, when it
is hectic, to improve customer experience.
Maintenance added customer survey machines (Happy‐or‐Not) in multiple garages to collect customer feedback on cleanliness and safety of garages.
Began scheduling preventive maintenance according to equipment usage, reducing overall labor hours spent maintaining equipment, increasing efficiency and adding value.
Started testing new parking lot sweeper equipment (FOD‐Razor) with the goal of creating cleaning efficiencies in large surface lots.
Facilities Maintenance & Construction Regulated Materials (RMO) conducted multiple surveys and projects, without the use of
consultants, resulting in time and money savings.
The RMO team is now paperless, making it more efficient and sustainable.
Health Sciences Zone implemented a post overtime accountability reporting program to review efficiencies, how occupants are impacted and successes.
HSZ removed 50 wooden ladders that were no longer in compliance, a result of the Ladder Safety Program.
Northeast Zone Received over $120K in rebates for completed lighting projects and saved over $100K in lifetime energy usage.
Central and Northeast Zones built new Lean visual boards to use as a platform to improve work on a daily basis and increase engagement.

EXECUTIVE SUMMARY
Facilities Services Management System, or How We Improve, utilizes a mix of Balanced Scorecard (BSC) and Lean Systems to align staff and processes around achiveing the vision of becoming a world-class organization providing exceptional service, anytime, anywhere. Nearly all strategies utilizing BSC are developed around the alignment of objectives and measures to four themes – customer experience, innovation, internal capacity and financial stewardship. Objectives provide general goals such as “be easy to do business with” while measures directly support those goals with key performance indicators (KPIs). Targets for the KPIs are typically set above benchmarks and increase in difficulty once a target has been met consistently. It is with that, we must note to all attendees of the BSC report out, that failing to meet the target is not necessarily negative, rather it indicates motion towards higher standards of excellence.
The Balanced Scorecard report for the quarter ending March 31st 2017 (Q3 FY2017) is summarized by individual measures below.
CUSTOMER EXPERIENCE
C1.1 PREVENTIVE VS CORRECTIVE MAINTENANCE This measure aims to increase preventive maintenance to get ahead of issues before they start. Past and more recent data shows this measure hovering around 17-18% with no upward trend. Future targets are set to incrementally increase to the ideal 75% state (APPA Level 2 – Comprehensive Stewardship). The (new) Q3 target was not met.
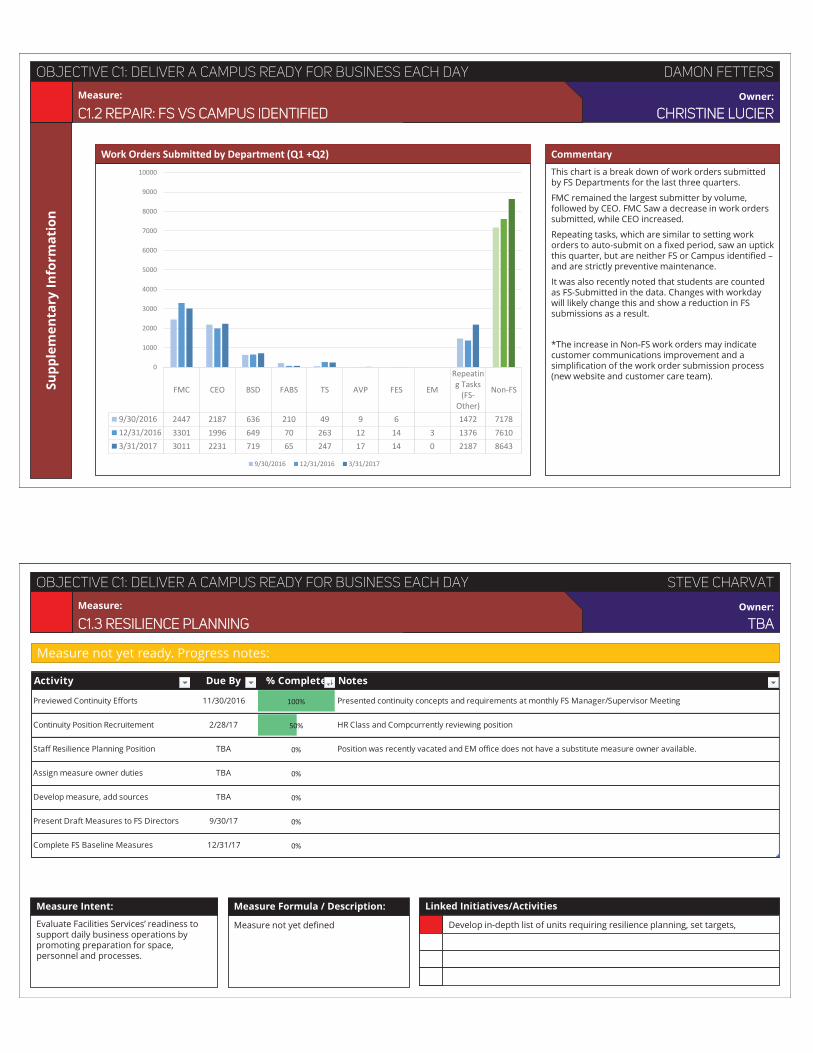
C1.2 REPAIR: FS VS CAMPUS IDENTIFIED Measure C1.2 was developed to encourage employee identification of issues ahead of customer needs. For Q3 FY2017, the target of 60% was not met. Work order submissions have increased, but the overall ratio has remained at 50% for multiple quarters.
C1.3 RESILIENCE PLANNING FS aims to increase emergency readiness through a Resilience Planning measure by tracking the status (implemented/up-to-date) of continuity plans throughout FS units. The measure is still in its planning stages, as the recruitment for a Continuity Support continues.
C2.1 GROUNDS RESOURCE UTILIZATION Landscape areas around campus are prioritized and evaluated on pre-determined service level targets (high to low levels of maintenance and care). Grounds crew efforts impact APPA levels for these areas, which are compared to the service level targets. These scores are used alter resource levels to maintain optimal campus grounds. No data was submitted on these scores for the most recent quarter.
C2.2: DESIGNATED BUILDING SPACES AT APPA LEVEL 1 or 2 Similar to Grounds Resource Utilization, indoor spaces also have pre-determined APPA level targets. Over 80 spaces have been identified as a priority for custodial units to maintain at the highest APPA levels. Unfortunately, the most recent quarter’s data was lost when the vendor, used to store the data, shut down their servers before backups could be retrieved.
C3.1 EXPAND REACH – NUMBER OF IMPRESSIONS Impressions, or interactions with customers, is one way to determine how well informed our customer base is of our efforts to deliver world-class service. By measuring number of web visits, email opens and social media views we can get a rough KPI for outreach efforts. This measure has not launched with a data set yet, and a target has not been determined.
C3.2 RESPONSE TIMES The measure of Response Times, an indicator of how timely our initial FS response is to customer requests, did not meet its target of 90%. An increase from 76% to 79% occurred over the last quarter due to process changes and data recording accuracy improvements.
C3.3 DEADLINES MET Deadlines Met compares the target and actual completion times of work orders in maintenance shops. The percent of work orders completed on or before set deadlines remained at 88% for Q3. A target of 90%, which has yet to be met, is a lofty goal based on past data.
C3.4 LOCATION BASED FEEDBACK Happy-or-Not kiosks record customer satisfaction data at the point of interaction. From May 2016 to Feb 2017 kiosks were placed in garages to gauge cleanliness. In March 2017, 4 more were purchased and placed outside of restrooms

with a similar purpose. A target of 80% positive feedback has been set for all results, no month has yet to reach this target, the highest being 75% in Feb 2017.
C3.5 COMPLETION OF SERVICE SURVEY This measure sets out to improve customer interactions by tying surveys to individual transactions, allowing for a quicker response to customer needs than the previous biennial survey. The measure is still new and has yet to set a target, but Q3 data shows a 95% satisfaction rate – which is much higher than expected.
EMBRACE INNOVATION
P1.1 LEAN MATURITY The measure of Lean Maturity, with the goal of developing teams to utilize the 4 Key Systems (Strategy Deployment, Visual Management, Standard Follow-up and Daily Kaizen) has yet to be implemented. A secondary measure, participation in regular huddles, increased from a 49% to 50% over the last quarter (a record). The target of 80% has yet to be reached.
P1.2 IDEA IMPLEMENTATION The measure of Idea Implementation, an indication of Lean culture, did not meet its target of 2 ideas per person per month. For the second quarter in a row, ideas implemented per person remained below 0.75. This is likely due to lingering effects of organizational change and the addition of new teams adjusting to lean systems.
P2.1 WATER CONSERVATION Water Conservation, which aims to reduce water usage across campus, missed its targeted reduction goal. Water usage increased 0.8% from previous quarter to 1,149,000 gallons per day (rolling 12-mo avg) due to higher irrigation use, building occupancy, construction activities, and equipment failures. Water use is expected to continue rising as a result of planned projects and increasing occupied square footage.
P2.2 ENERGY CONSERVATION Energy Conservation, another measure assessing campus sustainability, did not meet its target. Energy use intensity increased 1.1% from previous quarter to 191.3 kBtu/ft2/year. This is 3.7% below the 2008 baseline and shows that energy conservation projects can offset an increasingly energy intensive campus.
P2.3‐1 CARBON FOOTPRINT REDUCTION – SCOPE 1 & 2 Scope 1 & 2 tracks UW’s progress towards reducing greenhouse gas emissions with a target of being 15% below the 2005 baseline by 2020. This last year, the reduction was only 3.25% from that of the baseline, which is primarily due to ongoing campus expansion. The UW will likely not meet the 2020 target unless energy-saving initiatives are implemented and/or carbon credits are purchased.
P2.3‐2 CARBON FOOTPRINT REDUCTION – SCOPE 3 Scope 3 tracks UW’s progress towards reducing greenhouse gas emissions via travel. In 2016 the reduction surpassed the current 11% target and even the 2020 target, with a reduction of 18% from that of the 2005 baseline year – which is likely attributed to the introduction of a Lightrail stop on UW campus.
P2.4 DIVERSION RATE The major indicator of UW’s recycling and composting efforts is the Diversion Rate measure. With a goal of 70% waste diverted from the landfill by 2020. This quarter FS diverted 62% of waste, which was not enough to meet the FY2017 quarterly target of 67%.
BUILD CAPACITY
L1.1 EMPLOYEE ENGAGEMENT The measure of employee engagement, which aims to increase employee job satisfaction, skills and work efficiency, is still in the planning stage. A promising measure of surveying a sample population each quarter has been suggested but requires further discussion and planning.
L2.1 FS‐WIDE INCIDENT RATE Facilities Services aims to continually reduce the injury incident rate for all employees with a goal of becoming better every year (i.e.: to beat the previous record). For Q1 CY2017 there were 18 recordable incidents (a rate of 1.98 per 100 employees) with a target of 1.97 – the target was not met by a factor of 0.01 incidents per 100 people.

L3.1 RECOGNIZING, RESPECTING, & LISTENING Employee recognition drives engagement, increases retention, and promotes good leadership. While not every recognition event can be easily recorded, employees that are recognized by team or by name through monthly Lean Huddle surveys have been listed in place of a quantitative measure on slide L3.1.
FINANCIAL STEWARSHIP
F1.1 RECHARGE CENTER WORKING CAPITAL Working capital in excess of 60 days’ worth may indicate customers are being charged too much for services and is the maximum allowable by UW standards. FS has set a target of less than 10 days working capital to as closely align revenue with overhead as possible. This quarter the overall target was not met, as Facilities Construction was out of target at -15 days while Motor Pool was within target at 9 days.
F1.2 DIRECT LABOR TO JOB AVAILABILITY By comparing labor hours applied directly to work orders with the total labor hours on site, FS intends to lower the charge rate to customers and increase productivity. Of the three units measured, Campus Operations exceeded the target by 7%, Maintenance fell short by 3%, and Construction failed to meet the target by 8%--contributing to a negative budget balance.
F1.3 AIM WORK ORDER ACTUAL VS ESTIMATE To reduce customer dissatisfaction and misallocation of resources, Facilities has set a goal to improve work order estimates quoted to customers. In Q3 FY2017, FS closed the gap by a significant amount with 42.7% of work orders within 10% of the estimated budget. The target of 50% was not met.
F1.4 STEAM COST UW cost to produce steam consistently remains below the cost of Enwave Seattle, the commercial company that provides steam to downtown Seattle and shows that UW heating systems are operating at an effective cost. Comparisons are made in the cost to produce 1000 lbs. of steam. In 2014, Enwave’s average yearly cost was $14.78 per 1000 lbs.; in Q3 FY2017, UW’s was $9.64 per 1000lbs.
F1.5 RESOURCE CONSERVATION ROI The Resource Conservation ROI, a measure of the financial soundness of completed energy-conservation projects, exceeded the target of “cost effective” and reported an ROI of $5.77 return on every $1 invested. The Gowen Hall Coil Replacement Project completed in the last quarter will avoid $500,640 over its lifetime with a net capital investment of only $86,821.

12:00 PM
Perspective Objective # Measure Time Owner Target Actual Target Actual Target Actual Target Actual Target Actual
C2.1 Grounds Resource Utililization 12:05 PMHoward Nakase
185% 244
C2.2Selected Public Spaces at APPA 1 or 2 goal
12:11 PMVictor
CardonaN/A 71% N/A 53% N/A No data
C1.1Preventive vs Corrective Maintenance
12:17 PM TBD N/A 17.6% N/A 16.9% >17% 16.9%
C1.2Preventive vs Corrective Maintenance
12:23 PMChristine
Lucier>60% 49% >60% 50% >60% 50%
C1.3 Resilience Planning 12:29 PM TBD
P2.1 Water conservation 12:35 PM Joe Cook < 1039 1111 < 1039 1118 <1028 1110 <1028 1149 <1028 1158
P2.2 Energy conservation 12:41 PM Joe Cook < 176.7 185.4 < 176.7 185.7 <172.7 189.4 <172.7 189.3 <172.7 191.3
P2.3-1Carbon footprint reduction Scope 1 & 2
12:47 PMDavid
Ogrodnik> 11% >12% No data
P2.3-2 Carbon footprint reduction Scope 3 12:53 PMDavid
Ogrodnik> 11% >12% No data
P2.4 Waste diversion 12:59 PM Liz Gignilliat > 65% 64.0% > 65% 61.7% >67% 65.4% >67% 64.5% >67% 62.3%
L1Hire, train and develop for excellence
L1.1 Employee Engagement 1:05 PMClayton
Brainerd
L3Recognize and celebrate contributions
L3.1 Recognizing, Respecting, Listening 1:10 PMClayton
Brainerd
BREAK (10 minutes) 1:15 PM All
Build capacity L2Create a safe and injury-free environment
L2.1 FS-wide incident rate 1:25 PM Tracey Mosier <2 2.7 <2 2.2 <2 2.3 <2 1.9 <2 2.0
C3.1Expand reach - number of impressions
1:31 PM Elena Fox N/A 42%
C3.2 Response times 1:37 PM Tyler Quandt >90% 82% >90% 76% >90% 79%
C3.3 Deadlines Met 1:43 PM Rich Dierck >90% 87% >90% 88% >90% 88%
C3.4 Location-based Feedback 1:49 PM Elena Fox >80% 73% >80% 75% >80% 65%
C3.5 Completion of Service Survey 1:55 PMJennifer Connors
N/A 84% N/A 95%
F1.1 Recharge Center Working Capital 2:01 PM Lori Natsume <60 7, 12 <10 9, -6 <10 13, -4 <10 16, -20 <10 9, -15
F1.2 Direct Labor to Job Availability 2:07 PM Lori Natsume =3 2 =3 2 =3 2 =3 1 =3 1
F1.3 AiM Work Order Actual vs Estimate 2:13 PM Eric Dauplaise >80% 25.5% >80% 30.7% >50% 29.5% >50% 26.2% >50% 42.7%
F1.4 Steam Cost 2:19 PM Mark K. <14.78 $ 9.89 <14.78 $ 10.67 <14.78 $ 11.62 <14.78 $ 10.78 <14.78 $ 9.64
F1.5Resource Conservation Program: RCM ROI
2:25 PM Norm Menter >1 3.69 >1 2.15 >1 11.28 >1 6.53 >1 5.77
P1.1Lean Maturity (formerly Lean Participation)
2:31 PM Kevin Kramer >80% 45.8% >80% 46.4% >80% 47.3% >80% 49.3% >80% 50.1%
P1.2 Employee idea implementation 2:37 PM Kevin Kramer >2 1.08 >2 1.15 >2 1.06 >2 0.71 >2 0.72
FY2017 BSC - Q3
New Measure (Q1 FY2017)
New Measure (Q1 FY2017)
New Measure (Q1 FY2017)
New Measure (Q1 FY2017)
3/31/173/31/16 6/30/16 9/30/16 12/31/16
New Measure (Q1 FY2017)
New Measure (Q2 FY2017)
New Measure (Q3 FY2017)
New Measure (Q3 FY2017)
See individual and team recognitions on the presentation slide
Deliver cost-effective services
P2Champion environmental stewardship
F1
Measure in Planning / Development Phase
3.3%
18.1%
Enhance the customer / stakeholder experience
Enhance the customer / stakeholder experience
Build capacity
C1Deliver a campus ready for business each day
C2Provide quality campus spaces and places
Reduce Cost / Increase Value
P1Engage all staff in continuous improvement
Measure in Planning / Development Phase
New Measure (Q1 FY2017)
Embrace Innovation
Embrace Innovation
Enhance the customer / stakeholder experience
C3Be easy to do business with
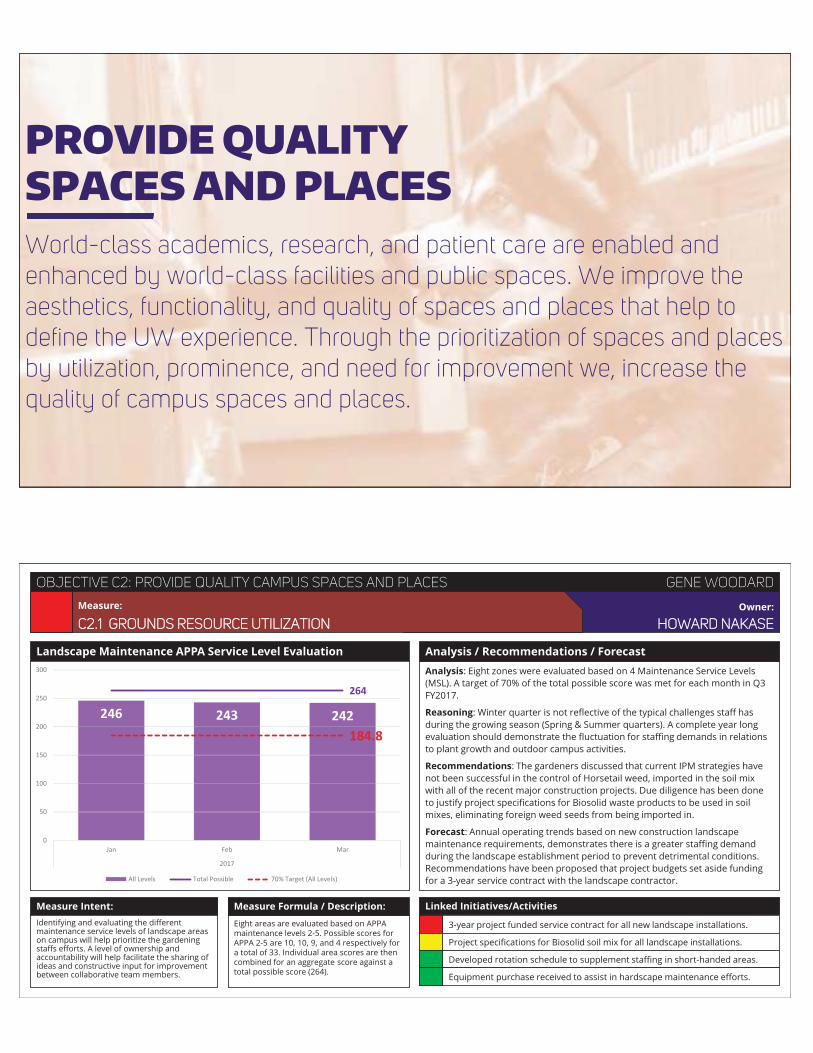
PROVIDE QUALITYSPACES AND PLACESWorld-class academics, research, and patient care are enabled and enhanced by world-class facilities and public spaces. We improve the aesthetics, functionality, and quality of spaces and places that help to define the UW experience. Through the prioritization of spaces and places by utilization, prominence, and need for improvement we, increase the quality of campus spaces and places.
Measure Intent:
Analysis / Recommendations / Forecast
Measure Formula / Description: Linked Initiatives/Activities
G Measure: Owner:
Landscape Maintenance APPA Service Level Evaluation
Identifying and evaluating the different maintenance service levels of landscape areas on campus will help prioritize the gardening staffs efforts. A level of ownership and accountability will help facilitate the sharing of ideas and constructive input for improvement between collaborative team members.
Eight areas are evaluated based on APPA maintenance levels 2-5. Possible scores for APPA 2-5 are 10, 10, 9, and 4 respectively for a total of 33. Individual area scores are then combined for an aggregate score against a total possible score (264).
Analysis: Eight zones were evaluated based on 4 Maintenance Service Levels (MSL). A target of 70% of the total possible score was met for each month in Q3 FY2017.
Reasoning: Winter quarter is not reflective of the typical challenges staff has during the growing season (Spring & Summer quarters). A complete year long evaluation should demonstrate the fluctuation for staffing demands in relations to plant growth and outdoor campus activities.
Recommendations: The gardeners discussed that current IPM strategies have not been successful in the control of Horsetail weed, imported in the soil mix with all of the recent major construction projects. Due diligence has been done to justify project specifications for Biosolid waste products to be used in soil mixes, eliminating foreign weed seeds from being imported in.
Forecast: Annual operating trends based on new construction landscape maintenance requirements, demonstrates there is a greater staffing demand during the landscape establishment period to prevent detrimental conditions. Recommendations have been proposed that project budgets set aside funding for a 3-year service contract with the landscape contractor.
3-year project funded service contract for all new landscape installations.
Project specifications for Biosolid soil mix for all landscape installations.
Developed rotation schedule to supplement staffing in short-handed areas.
Equipment purchase received to assist in hardscape maintenance efforts.
OBJECTIVE C2: PROVIDE QUALITY CAMPUS SPACES AND PLACES GENE WOODARD
C2.1 GROUNDS RESOURCE UTILIZATION HOWARD NAKASE
246 243 242
264
184.8
0
50
100
150
200
250
300
Jan Feb Mar
2017
All Levels Total Possible 70% Target (All Levels)

Supp
lem
enta
ry In
form
atio
n
G Measure: Owner:
-
1
2
3
4
5
6
7
8
9
10
1 2 3 4 5 6 7 8
Q3
Lvl2
Lvl3
Lvl4
Lvl5
OBJECTIVE C2: PROVIDE QUALITY CAMPUS SPACES AND PLACES GENE WOODARD
C2.1 GROUNDS RESOURCE UTILIZATION HOWARD NAKASE
Monthly Landscape Maintenance Zone Service Level % of Possible
Individual Zone Service Level Evaluation Results
Maps of Maintenance Zones
Landscape Evaluation Field Solution
90% 90%94%
96% 95%
86%
93% 93%96%94%
88%91%
50%
60%
70%
80%
90%
100%
Jan Feb Mar
2017
Level 2 % Possible
Level 3 % Possible
Level 4 % Possible
Level 5 % Possible
Measure Intent:
Analysis / Recommendations / Forecast
Measure Formula / Description: Linked Initiatives/Activities
G Measure: Owner:
66
78 68
71.2%
52.6%
-
10
20
30
40
50
60
70
80
90
0.0%
10.0%
20.0%
30.0%
40.0%
50.0%
60.0%
70.0%
80.0%
90.0%
100.0%
Q1 Q2 Q3
FY2017Buildings Insp Buildings Insp at APPA 2 or 1 % Inspected APPA 2 or 1
% Building Spaces Inspected at APPA Level 2 or Higher
To increase and/or maintain cleaning levels by prioritizing and tracking high-profile/usage public spaces.
The percent of selected building spaces at APPA rating 1 or 2.
81 selected buildings were based on traffic and profile, with selected hallways, classrooms, entryways, and restrooms.
Analysis: Data for Q3 APPA levels was lost due to a server being shut down unexpectedly before data could be pulled. Only number of buildings inspected is known. No target has been set yet for this measure.
Reasoning: Vendor holding server information ended its business practices. A new vendor is being reviewed.
Recommendations: Take paper surveys of APPA levels of spaces until new vendor contract has been launched and data can be entered into new system.
Forecast: Continued measurement will drive behavior that results in closing the gap over time. However... until we have more data we cannot establish a target.
OBJECTIVE C2: PROVIDE QUALITY CAMPUS SPACES AND PLACES GENE WOODARD
C2.2: DESIGNATED BUILDING SPACES AT APPA LEVEL 1 or 2 VICTOR CARDONA
?

DELIVER A CAMPUS READY FOR BUSINESS EACH DAYSo that the campus community can focus on achieving their purpose, Facilities Services delivers campus buildings and infrastructure to meet the requirements of the university. We optimize delivery of essential services and mitigate disruption when the unexpected occurs. By focusing on resilient systems and work processes, we deliver quality services, given events in and outside of our direct control.
Measure Intent:
Analysis / Recommendations / Forecast
Measure Formula / Description: Linked Initiatives/Activities
G Measure: Owner:
OBJECTIVE C1: DELIVER A CAMPUS READY FOR BUSINESS EACH DAY DDAMON FETTERS
C1.1 PREVENTIVE VS CORRECTIVE MAINTENANCE TBD
Projected PM/CM Ratio (Actual Work Hours)
A well-developed PM program minimizes unplanned outages and pre-mature failures of systems and components. A 75% ratio of Preventive Maintenance to 25% Corrective Maintenance is considered APPA Level 2, Comprehensive Stewardship.
Ratio (%) of actual work hours of planned vs corrective maintenance retrieved from AiM work orders.
Analysis: Q3 2017 showed no change to the ratio from the previous quarter. The PM:CM ratio held steady at 16.9%. The target has been reset with a new projection.
Reasoning: With the departure of the PM program manager and a change in leadership for FMC, no significant progress has been made this quarter. Target shown is based on a projection.
Recommendations: Working with FMC to increase focus on PM program and pilot efforts in the Northeast Zone. Collaborate with AiM team to track current performance and refine future WO process. Set targets for PM:CM ratio based on PM program implementation. Define methods to collect data for non - AiM units.
Forecast: A new target line has been set from current status due to the impact of Al Boukhari's departure. As efforts get underway in the Northeast Zone of FMC, we should see incremental improvements moving forward gaining more momentum as front-line staff are engaged in this strategic effort.
Planned Maintenance Program to be completed by Q2 2018
Customer Service Triage Lean
BAM! (Brick and Mortar) Scheduling System
18.4
%
16.9
%
18.9
%
18.4
%
18.4
%
16.9
%
18.9
%
18.4
%
17.6
%
16.9
%
16.9
%
17% 17% 16%
23%
52%
60%
67%73%
78%81%
17%20%
24%29%
35%
42%
75%
0.0%
10.0%
20.0%
30.0%
40.0%
50.0%
60.0%
70.0%
80.0%
90.0%
100.0%
Q1 Q2 Q3 Q4 Q1 Q2 Q3 Q4 Q1 Q2 Q3 Q4 Q1 Q2 Q3 Q4
2015 2015 2015 2015 2016 2016 2016 2016 2017 2017 2017 2017 2018 2018 2018 2018
ACTUAL RATIO Original Target New Target APPA LVL 2

Supp
lem
enta
ry In
form
atio
n
G Measure: Owner:
OBJECTIVE C1: DELIVER A CAMPUS READY FOR BUSINESS EACH DAY DDAMON FETTERS
C1.1 PREVENTIVE VS CORRECTIVE MAINTENANCE TBD
CEO PM to CM Ratio
CommentaryThe trend over the past 3 FYs shows a traditional dip in PM % during the second quarter.
It also shows that FMC effort greatly influences the combined percentage.
In FY17 the cyclic dip occurred in the first quarter of FY17 (one quarter early) and remained flat for the next two quarters in FMC affecting the overall percentage and limiting any statistical improvement.
3,08
2
2,76
9
3,13
0
3,27
8
3,08
2
2,76
9
3,13
0
3,27
8
2,84
4
2,50
0
2,82
7
11,7
61
11,8
33
12,0
94
12,1
65
11,7
61
11,8
33
12,0
94
12,1
65
10,7
19
11,6
31
12,2
39
0%
10%
20%
30%
40%
50%
60%
70%
80%
90%
100%
0%
10%
20%
30%
40%
50%
60%
70%
80%
90%
100%
Q1 Q2 Q3 Q4 Q1 Q2 Q3 Q4 Q1 Q2 Q3 Q4
2015 2016 2017 2018
PM Hours CM Hours ALL FS PM:CM
FMC PM to CM Ratio
7,36
9
6,37
7
7,20
8
6,73
5
7,36
9
6,37
7
7,20
8
6,73
5
6,12
4
5,93
4
6,15
9
34,6
11
33,1
48
32,1
44
32,1
57
34,6
11
33,1
48
32,1
44
32,1
57
31,2
56
29,8
91
31,9
39
0%
10%
20%
30%
40%
50%
60%
70%
80%
90%
100%
0%
10%
20%
30%
40%
50%
60%
70%
80%
90%
100%
Q1 Q2 Q3 Q4 Q1 Q2 Q3 Q4 Q1 Q2 Q3 Q4
2015 2016 2017 2018
FMC PM Hours FMC CM Hours ALL FS PM:CM
0
5000
10000
15000
20000
25000
30000
35000
40000
45000
Q1 Q2 Q3 Q4 Q1 Q2 Q3 Q4 Q1 Q2 Q3 Q4
2015 2016 2017 2018
Total CEO Hours Total FMC Hours
Total Labor Hours
Measure Intent:
Analysis / Recommendations / Forecast
Measure Formula / Description: Linked Initiatives/Activities
G Measure: Owner:
Percentage of FS Staff Identified Issues (Work Orders)
To create a culture of FS staff awareness of their surroundings and to identify and repair issues before the customers complain.
Percentage of corrective work orders submitted by FS staff vs those submitted by customers through complaints, FS Works, or AiM.
Analysis: The measure did not meet the target of 60%, but decreased slightly from the previous quarter. The total number of work orders submitted increased by 6%.
Reasoning: This is the third reporting quarter for this measure. The target of 60% is based on past totals & baseline data. Education and awareness are experiencing a slow rollout.
Recommendations: Staff education and awareness training. Fine tuning of data to remove automated work orders (gutter cleaning, etc) and mislabeled students to gain a more accurate PM:CM ratio.
Forecast: With training the measure should close the gap on the target. However, based on past numbers, without any momentum, the percent of FS identified work orders will remain around 50%. Work order numbers will continue to increase each quarter as reporting methods improve.
Customer Service Training Initiative
Customer Care Team Outreach (info sessions)
OBJECTIVE C1: DELIVER A CAMPUS READY FOR BUSINESS EACH DAY DAMON FETTERS
C1.2 REPAIR: FS VS CAMPUS IDENTIFIED CHRISTINE LUCIER
33414 33330 30247
7017 7684 8492
31039 3076230280
7177 7610 8643
51.8% 52.0% 50.0% 49.4% 50.2% 49.6%
60.0%
0
10000
20000
30000
40000
50000
60000
70000
0.0%
10.0%
20.0%
30.0%
40.0%
50.0%
60.0%
70.0%
80.0%
90.0%
100.0%
All All All Q1 Q2 Q3
FY2014 FY2015 FY2016 FY2017
# FS Work Orders # Non-FS WO's % FS Work Order Target
Supp
lem
enta
ry In
form
atio
n
G Measure: Owner:
Work Orders Submitted by Department (Q1 +Q2) CommentaryThis chart is a break down of work orders submitted by FS Departments for the last three quarters.
FMC remained the largest submitter by volume, followed by CEO. FMC Saw a decrease in work orders submitted, while CEO increased.
Repeating tasks, which are similar to setting work orders to auto-submit on a fixed period, saw an uptick this quarter, but are neither FS or Campus identified –and are strictly preventive maintenance.
It was also recently noted that students are counted as FS-Submitted in the data. Changes with workday will likely change this and show a reduction in FS submissions as a result.
*The increase in Non-FS work orders may indicate customer communications improvement and a simplification of the work order submission process (new website and customer care team).
OBJECTIVE C1: DELIVER A CAMPUS READY FOR BUSINESS EACH DAY DAMON FETTERS
C1.2 REPAIR: FS VS CAMPUS IDENTIFIED CHRISTINE LUCIER
FMC CEO BSD FABS TS AVP FES EM
Repeating Tasks
(FS-Other)
Non-FS
9/30/2016 2447 2187 636 210 49 9 6 1472 717812/31/2016 3301 1996 649 70 263 12 14 3 1376 76103/31/2017 3011 2231 719 65 247 17 14 0 2187 8643
0
1000
2000
3000
4000
5000
6000
7000
8000
9000
10000
9/30/2016 12/31/2016 3/31/2017
Measure Intent:
Analysis / Recommendations / Forecast
Measure Formula / Description: Linked Initiatives/Activities
G Measure: Owner:
Resilience Plan Updates by Unit (chart in development)
Evaluate Facilities Services’ readiness to support daily business operations by promoting preparation for space, personnel and processes.
Measure not yet defined
Analysis: Measure has not yet been built. No analysis available.
Reasoning: Measurement is still under development. A system of data collection must be built prior to the first report.
Recommendations: …
Forecast: ...
Develop in-depth list of units requiring resilience planning, set targets,
OBJECTIVE C1: DELIVER A CAMPUS READY FOR BUSINESS EACH DAY STEVE CHARVAT
C1.3 RESILIENCE PLANNING TBA
BARC Plan Name Plan Status Last Access Date
Last Completion Date
AVP Overdue 07/31/2014 04/08/2013
Building Services Overdue 04/07/2014 08/01/2013
Campus Engineering and Records Due 06/29/2015 05/23/2013
Campus Operations In-Progress 07/02/2015
Facilities Employee Services Current 07/11/2016 10/12/2012
Facilities Maintenance & Construction Overdue 01/31/2014 05/24/2013
Finance and Business Services (FABS) In-Progress 02/20/2014
Power Plant Due 07/02/2015 07/02/2015
Strategic Planning Overdue 07/31/2014 04/19/2013
Transportation Services Overdue 03/14/2016 06/20/2013
UW Emergency Management (UWEM) Current 07/29/2014 04/08/2013
Identify Modes & AudienceAnalysis- This measure asserts that a crucial step in enhancing FS’ reputation is to raise awareness among our constituencies through outreach. After initial ground work is completed (1, 2, 3 below) this measure will track TOTAL Impressions [a compilation of: Web, Blog and, Facebook posts, Email, Social Media impressions, and Event contacts] against targets for each unit.
Recommendations- Measure owner will work with each FS unit to:
1. Identify modes for impressions
2. Identify audiences
3. Set goals for # of impressions
The goals reflect plans each unit will develop over the coming year to impact customers with key messages that are relevant to them such as: budget planning, fiscal year close, beginning/end of quarter, season change, Cherry blossoms, etc.
Forecast- anticipate that units will adjust goals upward as systems are in place to manage and produce impressions. Anticipate that greater number of impressions will generate enhanced reputation reflected in C3.4 and C3.5
Activity Due By % Complete Notes
Previewed Continuity Efforts 11/30/2016 100% Presented continuity concepts and requirements at monthly FS Manager/Supervisor Meeting
Continuity Position Recruitement 2/28/17 50% HR Class and Compcurrently reviewing position
Staff Resilience Planning Position TBA 0% Position was recently vacated and EM office does not have a substitute measure owner available.
Assign measure owner duties TBA 0%
Develop measure, add sources TBA 0%
Present Draft Measures to FS Directors 9/30/17 0%
Complete FS Baseline Measures 12/31/17 0%
Measure not yet ready. Progress notes:

CHAMPION ENVIRONMENTAL STEWARDSHIPFacilities Services delivers energy and manages infrastructure, which impacts the environment. Through innovation and collaboration, we actively conserve resources and are leaders in the University’s sustainability efforts.
Measure Intent:
Analysis / Recommendations / Forecast
Measure Formula / Description: Linked Initiatives/Activities
G Measure: Owner:
1,091
1,158
1,028
0
200
400
600
800
1000
1200
9/08
12/0
83/
096/
099/
0912
/09
3/10
6/10
9/10
12/1
03/
116/
119/
1112
/11
3/12
6/12
9/12
12/1
23/
136/
139/
1312
/13
3/14
6/14
9/14
12/1
43/
156/
159/
1512
/15
3/16
6/16
9/16
12/1
63/
17
Gal
lons
(100
0s) /
Day
Target (5% below 1082 kGPD baseline, effective 7/16)
Good
Average Daily Water Consumption for Previous Rolling 12-Month
Water conservation is one of the best indicators of our impact as a champion of environmental stewardship.
Central campus annual water consumption in gallons/total number of days. Data taken from 7 main meters serving ~13.7M ft2 of building area and ~6.3M ft2 of irrigated landscaped area. Excludes non-central buildings served directly by SPU. Excludes water used from rainwater harvesting.
Analysis: 1,158,000 gpd average daily water consumption for previous rolling 12 months is 7% above the baseline year and failed to meet the 5% reduction target. Water usage is 0.8% higher than last quarter’s rolling 12-M period. Total annual usage of 421.6M gal versus 407M gal in prior year.
Reasoning: Largest-ever shutdown of CCW Central Cooling Water system to install new piping toward Life Sciences Bldg required city water backup and partial pipe draining. Equipment failures at IMA water heaters and UWMC SA forced dumping steam condensate to sewer. H-Wing’s cooling tower tube bundle leaking. CPD construction activities using water. Building occupations.
Recommendations: Replace H-Wing cooling tower. Implement measures found by Resource Conservation Team, including replacement of single-pass city-water cooled equipment and lowering humidity setpoints. Identify and replace old assets before failure to avoid waste. Other ideas are to reduce incoming water PRV settings; expand automated irrigation; subsurface water pipe leak detection; harvest roof rainwater
Forecast: Short term, usage will increase this spring due to continued work cleaning building cooling towers and draining Drumheller for biennial cleaning. State climatologist predicts warmer-than-usual Jul-Aug-Sept summer months, so irrigation and cooling tower use likely to remain high over summer. Long term, completion and occupancy of new ARCF, Nano, LSB, CSEII, Burke, Fluke, UWMC Exp Ph 2, North Campus Housing buildings will add to usage.
New CCW pipe installed toward Life Sciences Bldg, completed April 2017
At PLC controls, alarms being added to help find steam heat exchanger leaks
Drumheller Fountain now being drained for biennial cleaning
H-Wing cooling tower tube bundle leaking, needs replacement
OBJECTIVE P2: CHAMPION ENVIRONMENTAL STEWARDSHIP JOHN CHAPMAN
P2.1 WATER CONSERVATION JOE COOK

Supp
lem
enta
ry In
form
atio
n
G Measure: Owner:
OBJECTIVE P2: CHAMPION ENVIRONMENTAL STEWARDSHIP JOHN CHAPMAN
P2.1 WATER CONSERVATION JOE COOK
Impacts: weather, and CPD projects using water near ends of bienniums
• For central campus only, water+sewer costs of ~$8.97M during year ending March 2017 are an increase of ~$338k over prior year. Higher cost due to higher usage, plus 0.5% higher water rate and 3.9% higher sewer rate compared to year prior. Water+Sewer Cost = $0.024/gallon = $18.03/CCF
• For 12-M ending March 2017 versus prior year, Central Plant cooling tower makeup up 8% to 37.2M gal, steam makeup up 15.6% to 22.2M gal (14.3% of total feedwater vs 13% in year prior), overall CP water usage steady at 63.5M gal
• Largest-ever shutdown of CCW system to add new pipes toward Life Sciences Bldg refilled 700k gallons from Central Plant, plus city water backup at ~11 pieces of critical process equipment during shutdown.
• H-Wing cooling tower tube bundle leaking, needs replacement. J-Wing’s cooling tower switched off emergency city water backup in mid-Oct 2016 after heat exchanger to CCW installed
• Many building cooling towers cleaned in Feb & March
• CPD projects using some additional water for fire flow tests, pipe pressure testing and flushing, dust control
• Versus last yr – Heating Degree Days up to 4188 (from 3880), Cooling Degree Days down to 260 (from 430)
• State climatologist predicts higher-than-normal tempsfor Jul-Aug-Sept, so more irrigation and cooling tower usage expected
• More students and staff on campus - 72976 FTE in 2014/15 versus 59802 FTE in 2008/09 per AASHE
CommentaryNew WCUP utility plant now operating
New WCUP utility plant nearly complete
0100200300400500
Cool
ing
Degr
ee D
ays -
Rolli
ng 1
2M
Sep Dec Mar Jun
0
2,000
4,000
6,000
Heat
ing
Degr
ee D
ays -
Rolli
ng 1
2M
Sep Dec Mar Jun
1,091 1,158
1,028
0
500
1000
9/08
3/09
9/09
3/10
9/10
3/11
9/11
3/12
9/12
3/13
9/13
3/14
9/14
3/15
9/15
3/16
9/16
3/17
Gallo
ns (1
000s
) / D
ay
Target (5% below 1082 kGPD baseline, effective 7/16)
Measure Intent:
Analysis / Recommendations / Forecast
Measure Formula / Description: Linked Initiatives/Activities
G Measure: Owner:
198.6
191.3
172.7
0
20
40
60
80
100
120
140
160
180
200
220
6/08
9/08
12/0
83/
096/
099/
0912
/09
3/10
6/10
9/10
12/1
03/
116/
119/
1112
/11
3/12
6/12
9/12
12/1
23/
136/
139/
1312
/13
3/14
6/14
9/14
12/1
43/
156/
159/
1512
/15
3/16
6/16
9/16
12/1
63/
17
EUI,
kBtu
/ft2 /
year
Current Target (13% below 198.6 EUI, effective 7/2016)
Annual Energy Use Intensity (Site) for Previous 12-mo Period
Energy conservation is one of the best indicators of our impact as a champion of environmental stewardship.
Central campus annual electricity used (in kBtu) per GSF + annual fuel used (in kBtu) per GSF (adjusted for heating degree days). Excludes non-central campus energy usage. Excludes on-site renewable energy usage.
Analysis: 191.3 kBtu/ft2/year annual energy consumption (normalized for heating degree days) for previous rolling 12- month period is 3.7% below the 198.6 EUI baseline and failed to meet 13% reduction target. Normalized energy usage is 1.1% higher than last quarter’s rolling 12-month period. Actual annual energy usage (non-weather adjusted) is 2,632,062 mmBtu versus prior year's 2,495,876 mmBtu.Reasoning: Denny occupied October 2016. UWPD occupied June 2016. UWMC Expansion Floors 5,6,7 occupied 1st Qtr 2016. Sound Transit ongoing. Leaking IMA water heaters steam condensate dumped to sewer for several months until replacement in Dec 2016. UWMC South Addition currently dumping condensate to sewer until failing steam traps replaced. WCUP pipe replacement work sent some condensate to sewer while new CHW piping installed.Recommendations: Plan for whole-building HVAC replacements instead of partial TIs such as Schmitz Flrs 2-4 Renovation. Identify and replace old assets before failure to avoid waste such as IMA water heaters dumping condensate to drain. Proceed with ideas found by Resource Conservation Team, including variable frequency drive installs, Building Automation System upgrades, leaking steam valve replacements, controls adjustments such as temperature and static pressure resets; repairs to economizers, steam traps, insulation, etc.Forecast: Savings from energy conservation projects may be offset by new energy-intensive buildings Nano-Engineering, ARCF, UWMC Phase 2, Life Sciences Building.
Leaking steam valves have been replaced, more to be replaced
Wallace Hall work in spring will connect to WCUP in lieu of building chiller/CT
H-Wing desiccant air drier replaced with refrigerated air drier in July 2016
OBJECTIVE P2: CHAMPION ENVIRONMENTAL STEWARDSHIP JOHN CHAPMAN
P2.2 ENERGY CONSERVATION JOE COOK
Good

Supp
lem
enta
ry In
form
atio
n
G Measure: Owner:
OBJECTIVE P2: CHAMPION ENVIRONMENTAL STEWARDSHIP JOHN CHAPMAN
P2.2 ENERGY CONSERVATION JOE COOK
Normalized EUI by Energy Source• For central campus only, energy costs of ~$26.8M during the year
ending December 2016 are a increase of ~$612k compared to the prior year. Electricity rate increased 7.4% to $0.068/kWh while gas rate decreased 17.7% to $0.42/therm over previous year.
• For 12-months ending March 2017 versus year prior, Central Plant chiller usage down 3.8% to 21,505,680 ton-hours, steam usage up 5.2% to 1,299,339 klbs, turbine generator electricity up 3.3% to 19,000,534 kWh, diesel generator electricity up 2.7% to 122,604 kWh, compressed air steady at 917,555 kCF
• Compared to previous period, electricity EUI down 0.1% and fuel EUI up 1.6%. Some shift toward fuel due to more turbine generator electricity. Fuel EUI also up when dorms taken off steam.
• Current plan targets an additional 2% reduction per year to achieve Climate Action Plan goals for greenhouse gas emission reductions. For central campus only, capital cost to reduce energy use by 2% in 2016 is estimated to be ~$6.7M (based on several assumed unknown variables such as installing projects with maximum 10-year simple payback period and ~300k GSF growth per year).
• Compared to 10-year averages, this 12-M period’s heating degree days remain below normal at 4188 (vs 4396 average) and cooling degree days are near normal at 260 (vs 245 average).
• For this measure, data includes buildings supplied by electricity from East and West Receiving Stations (~15.7M ft2 incl parking garages ) and UW Central Plant steam (~12.8M ft2), and excludes buildings supplied directly by public utilities SCL (electricity) and PSE (natural gas). EUI (Site) includes energy consumed on the campus-level as metered by public utilities at Receiving Stations (electricity) and Central Plant (natural gas and fuel oil). Excludes on-site renewable energy usage.
• UW Energy Dashboard: http://dashboard.mckinstry.com/uw/
Commentary
12,232,093 13,034,193
-
2,000,000
4,000,000
6,000,000
8,000,000
10,000,000
12,000,000
14,000,000
16,000,000
GSF
12,260,014
16,111,733
-
2,000,000
4,000,000
6,000,000
8,000,000
10,000,000
12,000,000
14,000,000
16,000,000
18,000,000
GSF
Electricity – Central Campus Area Served Fuel – Central Campus Area Served
Actual Energy Use, Non-Normalized
812,535 987,101
1,552,989 1,645,251
0
500,000
1,000,000
1,500,000
2,000,000
2,500,000
3,000,000
MM
Btu
Electricity Fuel
69.761.7
124.5 129.6
0
25
50
75
100
125
150
EUI,
kBtu
/ft2 /
year
Electricity (excluding Turbine energy), kBtu/ft2/year
Fuel (including Turbine energy), kBtu/ft2/year
Measure Intent:
Analysis / Recommendations / Forecast
Measure Formula / Description: Linked Initiatives/Activities
G Measure: Owner:
-2.16%-1.06%
-4.66%
-0.31%
7.02%
3.20%
6.85%
1.71%
6.85% 6.91%
3.25%
11%
-6%
-4%
-2%
0%
2%
4%
6%
8%
10%
12%
2006 2007 2008 2009 2010 2011 2012 2013 2014 2015 2016
Percent MgCO2e Reduction from 2005 Baseline Calendar Year
Estimating Scope 1 & 2 carbon emissions measures UW’s progress towards meeting its carbon footprint reduction goal. Scope 1 emissions originate from UW-owned equipment & facilities. Scope 2 emissions originate from non-UW facilities that produce the steam & electricity UW uses.
Annual percent metric ton carbon dioxide equivalent (MgCO2e) emissions reduction is calculated by comparing estimated calendar year MgCO2e emissions relative to estimated baseline calendar year 2005 emissions.
Analysis: The UW is not currently on target to reduce annual Scope 1 & 2 carbon footprint emissions to 15% below the 2005 baseline calendar year by 2020.Reasoning: Power Plant emissions comprise 84% of 2016 Scope 1 & Scope 2 emissions. Year-to-year differences in weather, Power Plant turbine generator electrical production, and boiler fuel type usage (oil vs. natural gas) cause annual percent MgCO2e reduction values to vary. However, the overall trend indicates that the UW is not on target to reduce its carbon footprint sufficiently to meet the 15% carbon emissions reduction goal. Recommendations: FS should continue to implement carbon and energy-saving projects throughout the Seattle campus. Plans for converting the Seattle Campus heating systems from steam to hot water have been put on hold due to changes in the GHG accounting protocol and scarcity of capital resources. Exploration of the viability and associated cost of purchasing carbon offsets or allowances should continue.Forecast: The UW will not meet its carbon footprint reduction goal without implementing energy-saving initiatives or purchasing offsets. Developing and implementing energy-saving initiatives prior to 2020 will reduce or eliminate the need to purchase carbon credits. Note: A project has been started to update the UW “facility” baseline emissions estimate, and to account for changes to the GHG protocol which now includes regional electricity-related emissions.
Facility Services Resource Conservation Program Initiatives
Fleet Services Fuel Conversion (E85 & Electric)
OBJECTIVE P2: CHAMPION ENVIRONMENTAL STEWARDSHIP JOHN CHAPMAN
P2.3-1 CARBON FOOTPRINT REDUCTION – SCOPE 1 & 2 DAVID OGRODNIK
Goo
d

Supp
lem
enta
ry In
form
atio
n
G Measure: Owner:
Power Plant , -0.21%Seattle Buildings , -5.24%
Seattle Vehicles , 10.04%
Landfill , 46.49%
Tacoma , -7.78%
Bothell , -36.82%
-80.00%
-60.00%
-40.00%
-20.00%
0.00%
20.00%
40.00%
60.00%
2005 2006 2007 2008 2009 2010 2011 2012 2013 2014 2015 2016
Power Plant Seattle Buildings Seattle Vehicles Landfill Tacoma Bothell
Percent MgCO2e Reduction from 2005 Baseline Calendar Year• Scope 1 includes “direct” emissions from UW
equipment and facilities (natural gas heating, vehicle fleets, landfill). Scope 2 includes “energy import” emissions from non-UW facilities that generate the steam and electricity purchased by UW-owned facilities.
• Increasing landfill %MgCO2e reduction is expected to continue as landfill emissions decrease with landfill age.
• Increased 2016 Seattle vehicle %MgCO2e reduction is associated with the use of alternative fuels.
• Decreased 2016 Power Plant %MgCO2e reduction is attributed to the relative increased use of: 1) less efficient steam boilers, and 2) the steam turbine to generate electricity.
• Seattle building %MgCO2e reduction remains stable.
• Increasing Tacoma %MgCO2e reduction (suggesting decreased natural gas and electricity consumption) requires verification.
• Decreased 2016 Bothell %MgCO2e reduction is associated with Puget Sound Energy’s increased distribution of coal-generated electricity.
• 2015 and 2016 (SeaTac Airport Station) heating degree day values (⁰F) are 3855 and 3827, respectively. This suggests that weather had a relatively minor influence on 2016 Power Plant and Seattle building data relative to 2015 data.
Commentary
Goo
d
OBJECTIVE P2: CHAMPION ENVIRONMENTAL STEWARDSHIP JOHN CHAPMAN
P2.3-1 CARBON FOOTPRINT REDUCTION – SCOPE 1 & 2 DAVID OGRODNIK
Measure Intent:
Analysis / Recommendations / Forecast
Measure Formula / Description: Linked Initiatives/Activities
G Measure: Owner:
4.36%
6.93% 6.80%
15.68%
9.30%
6.89%7.94% 8.00%
9.73% 10.03%
18.07%
11%
0%
2%
4%
6%
8%
10%
12%
14%
16%
18%
20%
2006 2007 2008 2009 2010 2011 2012 2013 2014 2015 2016
Goo
d
Percent MgCO2e Reduction from 2005 Baseline Calendar Year
Estimating Scope 3 carbon emissions measures UW’s progress towards meeting its carbon footprint reduction goal. Scope 3 emissions originate from sources not classifiable as Scope 1 or 2. UW includes commuting, professional travel, and off-campus medical facilities in Scope 3.
Annual percent metric ton carbon dioxide equivalent (MgCO2e) emissions reduction is calculated by comparing estimated calendar year MgCO2e emissions relative to estimated baseline calendar year 2005 emissions.
Analysis: In 2016 the reduction rate surged to 18% and surpassed the current target of 11%. This is the highest reduction year on record.
Why: The UW has reduced its Scope 3 carbon footprint emissions by reducing Seattle Campus commuting and professional travel relative to the 2005 baseline year. Startup of the UW Link light rail station has resulted in reduced commuting carbon emissions.
Recommendations: Continued reduction in commuting and professional travel is required to meet UW’s carbon footprint reduction goal.
Forecast: The UW will not meet its carbon footprint reduction goal without continuing to reduce commuting and professional travel. However, the UW could decide to purchase carbon credits beginning 2020 to offset carbon footprint emissions in excess of its 15% carbon footprint reduction goal. Reducing commuting, professional travel, and energy use at off-campus medical facilities prior to 2020 will reduce or eliminate the need to purchase RECs and/or carbon credits in the future. Note: 2016 Scope 1 + Scope 2 + Scope 3 MgCO2e reduction (10.1%) is less than the 2020 calendar 15% reduction goal.
FS Commuter Service Initiatives (UPASS, etc.)
OBJECTIVE P2: CHAMPION ENVIRONMENTAL STEWARDSHIP JOHN CHAPMAN
P2.3-2 CARBON FOOTPRINT REDUCTION – SCOPE 3 DAVID OGRODNIK

Supp
lem
enta
ry In
form
atio
n
G Measure: Owner:
Seattle Commuting , 29.28%
Professional Travel , 17.82%
Off Campus Medical , -5.22%
-30.00%
-20.00%
-10.00%
0.00%
10.00%
20.00%
30.00%
40.00%
2005 2006 2007 2008 2009 2010 2011 2012 2013 2014 2015 2016
Seattle Commuting Professional Travel Off Campus Medical
OBJECTIVE P2: CHAMPION ENVIRONMENTAL STEWARDSHIP JOHN CHAPMAN
P2.3-2 CARBON FOOTPRINT REDUCTION – SCOPE 3 DAVID OGRODNIK
• Scope 3 includes “other” emissions that are not classifiable as Scope 1 or 2. Scope 3 includes carbon emissions for which the UW wishes to take responsibility. These include commuting (students, faculty and staff); professional travel (air travel); the Harborview Medical Center, and the Regional Primate Research Center.
• Increased 2016 Seattle commuting %MgCO2e reduction is associated with use of the Central Link light rail and changing commuter patterns.
• Increased 2016 professional travel %MgCO2e reduction is associated with reduced air travel-related expenditures.
• Decreased 2016 off-campus medical %MgCO2e reduction is associated with increased natural gas and steam consumption. Note: Updated 2015 and 2016 Regional Primate Research Center data is not currently available.
Percent MgCO2e Reduction from 2005 Baseline Calendar Year
Goo
d
Commentary
Measure Intent:
Analysis / Recommendations / Forecast
Measure Formula / Description: Linked Initiatives/Activities
G Measure: Owner:
58.9
%
59.3
%
56.4
%
57.2
% 60.9
%
60.8
%
60.4
%
59.3
% 62.9
%
63.4
% 67.1
%
66.4
%
61.5
%
62.1
%
64%
61.7
% 65.4
%
64.5
%
62.3
%
67%
64%
45%
50%
55%
60%
65%
70%
Q1 Q2 Q3 Q4 Q1 Q2 Q3 Q4 Q1 Q2 Q3 Q4 Q1 Q2 Q3 Q4 Q1 Q2 Q3
FY2013 FY2014 FY2015 FY2016 FY2017
Diversion Rate Target Rolling 12-Month Diversion Rate
Goo
d
Quarterly Diversion Rate
Diversion rate is the key outcome indicator of success at promoting recycling and composting on the UW campus.
The percentage of campus waste that is being diverted from landfill, accumulated through fiscal year.
Improved bulky material collection (FMC, corp yard)
University waste characterization study in high waste generation areas
Improved food waste collection from UWMC and HFS
OBJECTIVE P2: CHAMPION ENVIRONMENTAL STEWARDSHIP JOHN CHAPMAN
P2.4 DIVERSION RATE LIZ GIGNILLIAT
Increased adoption of the MiniMax waste program
Analysis: The target for Q3 and was not met:• The waste diversion rate for Q3 was 62%.• The rolling 12-month diversion rate was 64%• The fiscal year goal is 67%, in line with our 70% goal by 2020. • The City of Seattle’s diversion rate as of 2015 was 58%, with a goal of 70% by 2022.
Reason: Our recycling rates continue to go up while our landfill rates continue to go down due to our ongoing waste infrastructure improvements on campus and our education efforts.
Recommendations: In order to stay on track to meet our goal of 70% waste diversion by 2020, we will invest in a waste characterization study to be more strategic in our diversion efforts. Continue collaboration with campus partners on targeted education programs, new buildings, and investment in infrastructural improvement and education.
Forecast: Given the results of the Cedar Grove route audit we completed in FY2016 and the impact it had on our food waste weights, we do not anticipate being able to reach our fiscal year 2017 goal of 67% waste diversion.
Supp
lem
enta
ry In
form
atio
n
G Measure: Owner:
OBJECTIVE P2: CHAMPION ENVIRONMENTAL STEWARDSHIP JOHN CHAPMAN
P2.4 DIVERSION RATE LIZ GIGNILLIAT
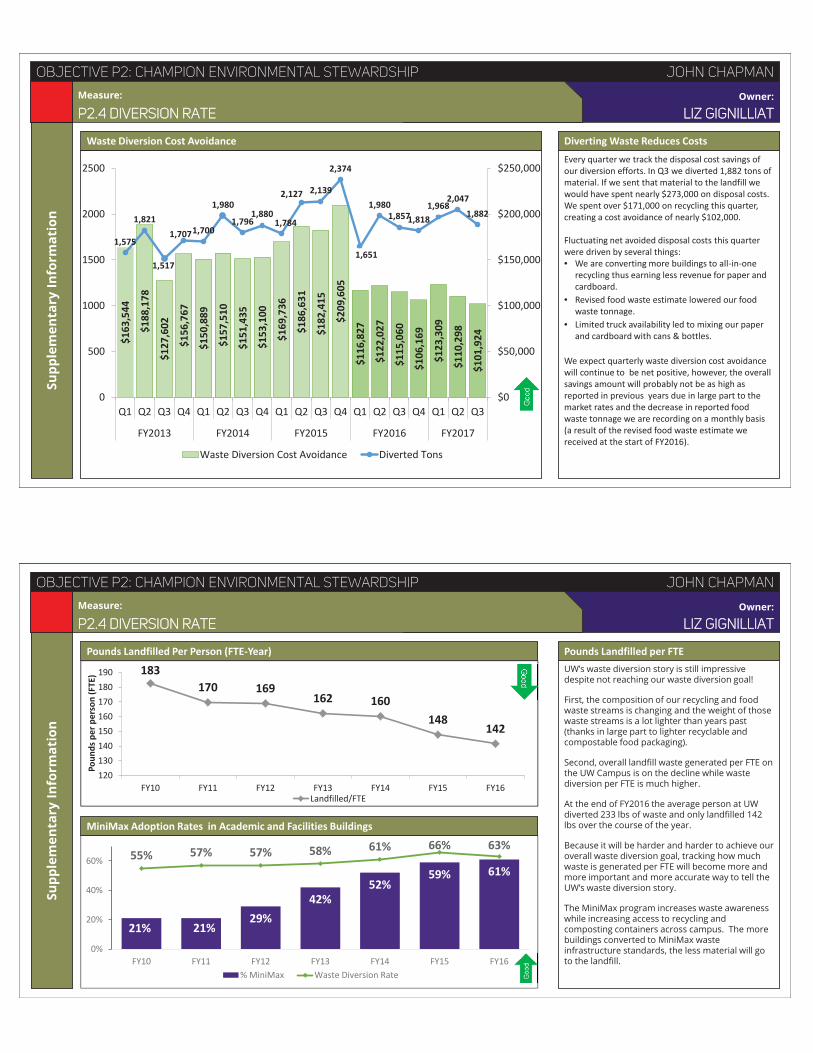
Waste Diversion Cost AvoidanceEvery quarter we track the disposal cost savings of our diversion efforts. In Q3 we diverted 1,882 tons of material. If we sent that material to the landfill we would have spent nearly $273,000 on disposal costs. We spent over $171,000 on recycling this quarter, creating a cost avoidance of nearly $102,000.
Fluctuating net avoided disposal costs this quarter were driven by several things:• We are converting more buildings to all-in-one
recycling thus earning less revenue for paper and cardboard.
• Revised food waste estimate lowered our food waste tonnage.
• Limited truck availability led to mixing our paper and cardboard with cans & bottles.
We expect quarterly waste diversion cost avoidance will continue to be net positive, however, the overall savings amount will probably not be as high as reported in previous years due in large part to the market rates and the decrease in reported food waste tonnage we are recording on a monthly basis (a result of the revised food waste estimate we received at the start of FY2016).
Diverting Waste Reduces Costs$1
63,5
44
$188
,178
$127
,602
$156
,767
$150
,889
$157
,510
$151
,435
$153
,100
$169
,736
$186
,631
$182
,415
$209
,605
$116
,827
$122
,027
$115
,060
$106
,169
$123
,309
$110
,298
$101
,924
1,575
1,821
1,517
1,7071,700
1,980
1,7961,880
1,784
2,127 2,139
2,374
1,651
1,9801,8571,818
1,9682,047
1,882
$0
$50,000
$100,000
$150,000
$200,000
$250,000
Q1 Q2 Q3 Q4 Q1 Q2 Q3 Q4 Q1 Q2 Q3 Q4 Q1 Q2 Q3 Q4 Q1 Q2 Q3
FY2013 FY2014 FY2015 FY2016 FY2017
0
500
1000
1500
2000
2500
Waste Diversion Cost Avoidance Diverted Tons
Supp
lem
enta
ry In
form
atio
n
G Measure: Owner:
OBJECTIVE P2: CHAMPION ENVIRONMENTAL STEWARDSHIP JOHN CHAPMAN
P2.4 DIVERSION RATE LIZ GIGNILLIAT
Pounds Landfilled Per Person (FTE-Year)UW’s waste diversion story is still impressive despite not reaching our waste diversion goal!
First, the composition of our recycling and food waste streams is changing and the weight of those waste streams is a lot lighter than years past (thanks in large part to lighter recyclable and compostable food packaging).
Second, overall landfill waste generated per FTE on the UW Campus is on the decline while waste diversion per FTE is much higher.
At the end of FY2016 the average person at UW diverted 233 lbs of waste and only landfilled 142 lbs over the course of the year.
Because it will be harder and harder to achieve our overall waste diversion goal, tracking how much waste is generated per FTE will become more and more important and more accurate way to tell the UW’s waste diversion story.
The MiniMax program increases waste awareness while increasing access to recycling and composting containers across campus. The more buildings converted to MiniMax waste infrastructure standards, the less material will go to the landfill.
Pounds Landfilled per FTE
183170 169
162 160148
142
120130140150160170180190
FY10 FY11 FY12 FY13 FY14 FY15 FY16
Poun
ds p
er p
erso
n (F
TE)
Landfilled/FTE
MiniMax Adoption Rates in Academic and Facilities Buildings
21% 21%29%
42%52%
59% 61%55% 57% 57% 58% 61% 66% 63%
0%
20%
40%
60%
FY10 FY11 FY12 FY13 FY14 FY15 FY16% MiniMax Waste Diversion Rate

HIRE, TRAIN, AND DEVELOPFOR EXCELLENCESustained world-class service must reflect the continuing, collaborative effort of all units, functions and employees. We must reinforce a continuous learning organization, growing and developing our people so that they are empowered to implement the changes that accomplish our goals. "Right person, right job, right skills" set up employees for success through hiring, training, coaching and other growth opportunities.
Measure Intent:
Analysis / Recommendations / Forecast
Measure Formula / Description: Linked Initiatives/Activities
G Measure: Owner:
To improve employee engagement, job satisfaction, and retention.
Measure not yet in place
OBJECTIVE L1: HIRE TRAIN, AND DEVELOP FOR EXCELLENCE PATTI COLAIZZO
L1.1 EMPLOYEE ENGAGEMENT & GROWTH CLAYTON BRAINERD
Sexual Harassment Prevention Training
HRP Payroll Systems Training
Employee EngagementAnalysis: This measure is still being built, there is no measurement to report at this time.
Reasoning: Employee engagement is increasingly difficult to measure on a frequent and recurring basis. Past efforts have used biennial employee satisfaction surveys (too much lag) or reported initiative efforts (not a measure) – neither of which resulted in meaningful change.
Recommendations: A possible solution, of surveying a small random sample of employees every quarter, has been suggested. Ideally this random survey could be used to track cultural change throughout Facilities Services on a quarterly basis without using the entire employee population. If that population is less than 200 in size, no employee would need to be surveyed more than once a year.
Forecast: Frequent measurement and reporting will allow for more meaningful discussion, faster reaction time, and better correlation to HR related initiatives/activities.

RECOGNIZE AND CELEBRATEINDIVIDUAL AND TEAM CONTRIBUTIONS
To develop a world-class culture that appreciates individual and team contributions to Facilities Services success and reputation, we celebrate accomplishments and recognize behavior that closely align to and promote organizational excellence.
Measure Intent:
Analysis / Recommendations / Forecast
Measure Formula / Description: Linked Initiatives/Activities
G Measure: Owner:
To create a dialogue about performance expectations, recognize efforts, and set a better course for the future of the employee.
Initiatives completed
Proposed Initiatives• Management by walking around looking for positive intent, acknowledging
the work, diffusing the rumor mill• Lean teams-newsletter blurb and FS monthly Leadership report out at 90
days• Supervisors going to the first and last day of a major job• Reward most impacted unit/shop/department idea with TBD?• Stepping Stones for Success-newsletter recognition for completed training,
something different for those promoted• Design FS thank you recognition cards. Distribute at FS Monthly Leadership
meetings-every attendee consider sending X number per month • 2017-recognize shops that complete HR/P training• FS Practical Leader 2-continue with certificates• 2016-Employee of the Year Award-being worked on by Senior Ops team• 2016-Team of the Year-being worked on by Senior Ops Team
OBJECTIVE L3: RECOGNIZE AND CELEBRATE …/… CONTRIBUTIONS PATTI COLAIZZO
L3.1 RECOGNIZING, RESPECTING, & LISTENING CLAYTON BRAINERD
Analysis: Implementation of FS IDP not completed.
Reasoning: Project not fully implemented this quarter due to planned timeline milestones (see initiatives pending below).
Recommendations: Continue the development of FS IDP initiatives as planned.
Forecast: Expect to have the FS IDP data developed by the end of next quarter.
4
37
29
2220
15
11 6
30
5
10
15
20
25
30
35
40
FABS CEO FMC TS BSD FES AVP UWEM
IDP Implemented IDP Missing
Analysis- This measure asserts that a crucial step in enhancing FS’ reputation is to raise awareness among our constituencies through outreach. After initial ground work is completed (1, 2, 3 below) this measure will track TOTAL Impressions [a compilation of: Web, Blog and, Facebook posts, Email, Social Media impressions, and Event contacts] against targets for each unit.
Recommendations- Measure owner will work with each FS unit to:
1. Identify modes for impressions
2. Identify audiences
3. Set goals for # of impressions
The goals reflect plans each unit will develop over the coming year to impact customers with key messages that are relevant to them such as: budget planning, fiscal year close, beginning/end of quarter, season change, Cherry blossoms, etc.
Forecast- anticipate that units will adjust goals upward as systems are in place to manage and produce impressions. Anticipate that greater number of impressions will generate enhanced reputation reflected in C3.4 and C3.5
Samantha Sun the Dental clinic Manager has written a formal letter of appreciation for the B and D wing custodial staff members. The reorganized and increased service to these operatory spaces is greatly appreciated.
Bob Jones was recognized for his idea about using a leaf blower, on low, to expedite the cleaning of large auditoriums.
Mee (Joyce) Young Lee was recognized for training Bagley on how to utilize their machinery to their best advantage.
HSB supervision team for taking initiative to close off a room and promptly contact Regulated Material Office to prevent any potential Asbestos exposure.
BSD - Foster School team is recognized for equitable open runs.
Zewdi on the BSD – I/J/K team for being proactive in regards to work place safety!
Johnson Hall Team has worked hard to improve their APPA level scores and are doing APPA level 2 work and better.
Johnson Hall and Physics Astronomy teams did very well at the recent FS Lean showcase which was a big public event for them and gave them some exposure.
Shirley Hammond (Physics Astronomy) planned a lovely "coffee break“ for her team, bringing coffee and food. It was well received and built comradery within the group.
Physics Astronomy did a presentation for our new vice provost. He reported to Gene Woodard that he was extremely impressed and now knows the "Whoop-whoop".
Recycling Operations/Admin Team counted 14 customer kudos and 44 internal recognitions in FY2017 Q3.
Customer recognized Angelina Quintero (BSD Project Crew) for deep cleaning showers in Suzz Library, saying “The showers look amazing!”
Environmental Storage Building area manager gave kudos to MC1 crew members, Angelina Quintero and Kong Yeung, for the floor cleaning.
Savery Hall Team worked together to take pics and set standards.
Swing Shift Project Team received 2 compliments from Communication bldg. and Schmitz Hall for floor work they did.
Window Washers - The occupants at Gould Hall were impressed with how the windows now look after a cleaning. The building coordinator mentioned enjoying the newly cleared views.
Kudos to shop 43, 50 & 51 staff for a great response and recovery when campus went down due to Seattle City Light power outage.
Records and Drafting was recognized for working together on the successful move from annex 7 to annex 2.
Jeff Muller was recognized by Records and Drafting for leading the collaboration with the sign shop and having a new, much-improved LEAN Huddle Board.
The FMC LED Focus Team is doing great work to execute LED lighting retrofits across campus. The Team communicates broadly, sharing best management practices and innovative solutions!
The Payroll Team did an outstanding job of manually correcting the skilled trades salary increases that went into effect 1/1/17, and did so in a very short turn around period of time.
Shuttle Team received 10 customer recognitions.
Shop 18 roofers, Ken Wick and David Paul, received kudos for their quick response to remove leaves and clear drains at MacKenzie Hall.
Shop 18 Glaziers have made progress removing/recycling many older materials in the Glass Shop. Ken Clark made arrangements to send glass to the Art Department on campus instead of the dumpster.
Mario Del Cid was acknowledged for his hard work at the Astro/Physics landscaping project. Looks great!
Ted Sweeney, Active Transportation Specialist, was nominated for the Distinguished Staff Award.
TS Sales & Administration recognized longtime teammate of 8 years, Gwen Hallet, who has moved on to work with NASA in Johnson Hall and welcomes new staff members Hung, Joi, and Alex!
Kevin Kramer (Strategic Planning) was recognized for automating an excel workbook for the elevator shop, saving up to 160 hours of repetitive work a year.
Kudos to Jeanna Vogt and Alicia Halberg for their work on launching the new website. It looks amazing!
UWEM increased number of informal "thank you notes“ from stakeholders/customers are being received and posted on the Staff Recognition Bulletin Board -- each time with a complementary loud ringing of the UWEM cowbell to notify the assembled associates to gather round and hear the good news.

EMBRACE A SAFE AND INJURY-FREE WORK ENVIRONMENTWe preserve and promote the health and welfare of our employees to deeply reinforce our commitment to the guiding principle of respecting every individual. By promoting and sustaining a safe, healthy, injury-free work environment, all employees identify and develop safe work practices and mitigate hazards in shared commitment to building a safe workplace where people care and protect one another.
Measure Intent:
Analysis / Recommendations / Forecast
Measure Formula / Description: Linked Initiatives/Activities
G Measure: Owner:
Incident Rates by Quarter CY2012-2017
Incident rate is the best proxy indicator for safety, and can reflect if our safety improvement efforts are successful.
Incident rate = the number of recordable incidents X hours worked YTD by 100 FTE*/ actual hours worked by all FTE. * Q1=50,000, Q2= 100,000, Q3=150,000, Q4= 200,000.
Analysis: The Q1 target of reducing the incident rate below the lowest annual quarterly average (2.0 for 2017) ever achieved was not met.
Reasoning: There were 18 recordable cases in FS in Q1 2017. This is seven cases higher that the lowest number ever achieved in Q1. Two departments met their target for the quarter, three (3) did not meet their departmental targets, one department is new and has no comparative data, and two departments (2) are continuing at an incident rate of zero (0). The cumulative incident rate for 2016 is 2.0.
Recommendations: • Reinforce the use of safe work practices, Hazard Review Checklists, field checks
and verify work plans and permits being completed and followed.• Possible disciplinary action for improper use of PPE after training.• OARS reports should be reviewed and lessons learned implemented within each
department, and FS wide when applicable. • Monthly Accident reports should be reviewed by senior leaders to understand
root causes and assist in implementing changes.
Forecast: FS is very close to reducing the incident rate below the lowest quarterly average ever met. This is achievable for Q2.
Compliance with required training
Accident Reports Reviewed by senior leaders
BSD Ergonomics Project
OBJECTIVE L2: EMBRACE A SAFE AND INJURY-FREE WORKPLACE STEVE CHARVAT
L2.1 FS-WIDE INCIDENT RATE TRACEY MOSIER
Good
3.4
1.2
2.8
2.0
4.0
1.9
3.1
2.5 2.4
1.6 1.7 1.8
2.92.6
2.12.4
1.9 2.02.0
0.0
0.5
1.0
1.5
2.0
2.5
3.0
3.5
4.0
4.5
Q1 Q2 Q3 Q4 Q1 Q2 Q3 Q4 Q1 Q2 Q3 Q4 Q1 Q2 Q3 Q4 Q1
2012 2013 2014 2015 2016 2017
Qtrly Incident Rate Target

Supp
lem
enta
ry In
form
atio
n
G Measure: Owner:
OBJECTIVE L2: EMBRACE A SAFE AND INJURY-FREE WORKPLACE STEVE CHARVAT
L2.1 FS-WIDE INCIDENT RATE TRACEY MOSIER
FY2017 Q1 Departments Compared
Incident Rate by Department CY2016
Good
BLS DATA for WA State 2015 Incident Rate
All industries 4.5Construction 5.0Heavy & CE construction 5.6Specialty trade contractors 6.1Passenger transportation 11.5Warehousing and storage 11.9Waste management 5.0Utilities 5.1Repair and maintenance 6.6
Q1 Incident Rates Compared to Previous Years CommentaryUpper Left: Chart displays cumulative yearly incident rates. Targets are based on best previous year of all recorded years.
Lower Left: Chart displays cumulative incident rates for CY2016 separated by department. Targets are based on departments previous best year incident rates.
Upper Right: Table of incident rates by department for the most recent quarter. Red indicates missing the target. Targets are based on the quarterly average of the previous best calendar year’s incident rates.
Lower Right: Industry data for reference. Industry rates are for entire calendar years.
2.1 1.2
1.9 1.6 2.6
2.0 -
3.4
2.5 2.5 2.0 2.0
-
0.5
1.0
1.5
2.0
2.5
3.0
3.5
4.0
2012 2013 2014 2015 2016 2017
4.4
3.42.4
2.0 1.9
0.0 0.0 0.00.0 0.2
2.9
0.9 1.80.0 0.0
0.50.0
1.0
2.0
3.0
4.0
5.0
ES TS FMC CEO BSD FES/EM AVP FABS
Incident Rate Target
Dept Incidents this Qtr Incident Rate Target RateFABS 0 0.00 0.45AVP 0 0.00 0.00FES/EM 0 0.00 0.00ES 1 4.44 0.00CEO 2 2.00 0.85TS 3 3.40 0.19BSD 5 1.85 1.84FMC 7 2.44 2.95FS Wide 18 1.98 1.97
Supp
lem
enta
ry In
form
atio
n
G Measure: Owner:
OBJECTIVE L2: EMBRACE A SAFE AND INJURY-FREE WORKPLACE STEVE CHARVAT
L2.1 FS-WIDE INCIDENT RATE TRACEY MOSIER
3 4 2
12
16 19
35
50
45
24
6
0
93
57 54
72
84 80
126
177 18
5
101
26
2
3%
7%
4%
17%
19%
24%
28% 28%
24%24%
23%
0%
0%
5%
10%
15%
20%
25%
30%
0
20
40
60
80
100
120
140
160
180
200
18-22 23-27 28-32 33-37 38-42 43-47 48-52 53-57 58-62 63-67 68-72 73-77
INJURY COUNT AGE GROUP SIZE % Injury
Injury Rate (count/population) by Age Group (2014-2016) n=216 Cause of Harm (Q1 2017)
Nature of Injury (Q1 2017)
5
5
2
1
1
1
1
1
1
0 1 2 3 4 5 6
Ergonomic Issues, Repetitive Motions,…
Overexertion, Overly Forceful Motions
Motor Vehicles, Bicycles, etc.
Fall of Less than 6', or on Stairs
Contact with Object: Bumped into…
Slip or Trip (No Fall)
Chemicals
Debris, Dust
Plants, Vegetation
7
5
2
2
2
0 1 2 3 4 5 6 7 8
Sprain, Strain, Twist
Pain, Irritation, Inflammation, Swelling
Bruise, Contusion
Cut, Laceration, Puncture, Scratch,Abrasion (Open Wound)
Eye or Vision Issues

BE EASY TO DO BUSINESS WITHTo allow our customers to focus on their missions, we make interactions with Facilities Services as efficient and customer focused as possible. We assess customer feedback and engage in proactive communications to continuously improve our processes.
Measure Intent:
Analysis / Recommendations / Forecast
Measure Formula / Description: Linked Initiatives/Activities
G Measure: Owner:
To improve relationships, knowledge, conversation and ease of access to information with customer base.
Measures total number of FS impressions (a compilation of Web visits, Blog impressions, Facebook Likes, Email opens, Social Media impressions, Event contacts) against goals set by each unit
OBJECTIVE C3: BE EASY TO DO BUSINESS WITH LUANN STOKKE
C.3.1 EXPAND REACH –NUMBER OF IMPRESSIONS ARI KASAPYAN
Open Rate of Email Campaigns (by CY)Analysis: The open rate (views) for email campaigns was 42% for this most recent quarter (Q1 CY2017). This is the first quarter this measure has been reported, there is no target set.
Reasoning: As we learn more about email campaign best practices we can adapt to understand best timing and formatting to more successfully reach our audience – be it internal or external to FS.
Recommendations: Future iterations of this measure can include website visits, which may tell the story of how effective our communications are (directing users to a simple source of information).
Forecast: As we continue to measure number of impressions we will gain a better understanding of our audience and create best practices around those lessons learned. In turn open rate (and possibly web visits) will increase over time.
24%
36% 35%38%
43% 44% 43%
52%
29%
40%36%
41%
35%31%
34%
42%
0%
10%
20%
30%
40%
50%
60%
0
50000
100000
150000
200000
250000
300000
Qtr2 Qtr3 Qtr4 Qtr1 Qtr2 Qtr3 Qtr4 Qtr1 Qtr2 Qtr3 Qtr4 Qtr1 Qtr2 Qtr3 Qtr4 Qtr1
2013 2014 2015 2016 2017
Total Emails Open Rate
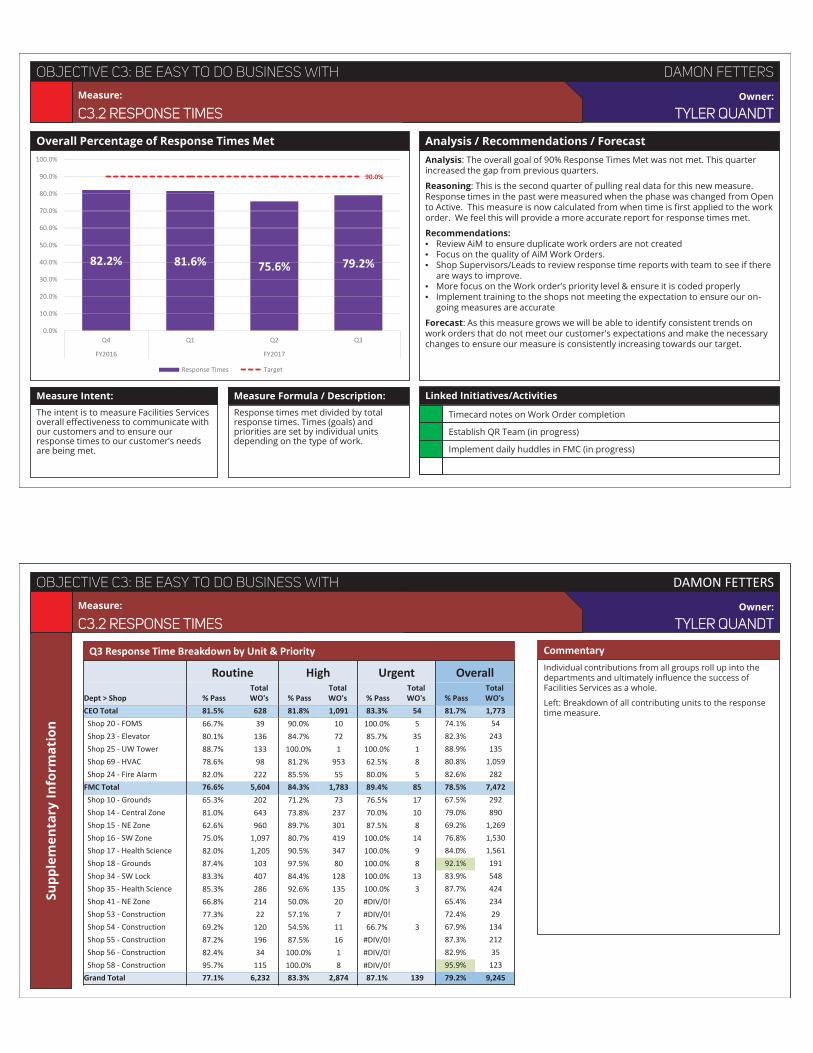
Measure Intent:
Analysis / Recommendations / Forecast
Measure Formula / Description: Linked Initiatives/Activities
G Measure: Owner:
Overall Percentage of Response Times Met
The intent is to measure Facilities Services overall effectiveness to communicate with our customers and to ensure our response times to our customer’s needs are being met.
Response times met divided by total response times. Times (goals) and priorities are set by individual units depending on the type of work.
Analysis: The overall goal of 90% Response Times Met was not met. This quarter increased the gap from previous quarters.
Reasoning: This is the second quarter of pulling real data for this new measure. Response times in the past were measured when the phase was changed from Open to Active. This measure is now calculated from when time is first applied to the work order. We feel this will provide a more accurate report for response times met.
Recommendations:• Review AiM to ensure duplicate work orders are not created• Focus on the quality of AiM Work Orders.• Shop Supervisors/Leads to review response time reports with team to see if there
are ways to improve.• More focus on the Work order’s priority level & ensure it is coded properly• Implement training to the shops not meeting the expectation to ensure our on-
going measures are accurate
Forecast: As this measure grows we will be able to identify consistent trends on work orders that do not meet our customer's expectations and make the necessary changes to ensure our measure is consistently increasing towards our target.
Timecard notes on Work Order completion
Establish QR Team (in progress)
Implement daily huddles in FMC (in progress)
OBJECTIVE C3: BE EASY TO DO BUSINESS WITH DAMON FETTERS
C3.2 RESPONSE TIMES TYLER QUANDT
82.2% 81.6% 75.6% 79.2%
90.0%
0.0%
10.0%
20.0%
30.0%
40.0%
50.0%
60.0%
70.0%
80.0%
90.0%
100.0%
Q4 Q1 Q2 Q3
FY2016 FY2017
Response Times Target
Supp
lem
enta
ry In
form
atio
n
G Measure: Owner:
OBJECTIVE C3: BE EASY TO DO BUSINESS WITH DAMON FETTERS
C3.2 RESPONSE TIMES TYLER QUANDT
Individual contributions from all groups roll up into the departments and ultimately influence the success of Facilities Services as a whole.
Left: Breakdown of all contributing units to the response time measure.
Q3 Response Time Breakdown by Unit & Priority Commentary
Routine High Urgent Overall
Dept > Shop % PassTotal WO's % Pass
Total WO's % Pass
Total WO's % Pass
Total WO's
CEO Total 81.5% 628 81.8% 1,091 83.3% 54 81.7% 1,773 Shop 20 - FOMS 66.7% 39 90.0% 10 100.0% 5 74.1% 54 Shop 23 - Elevator 80.1% 136 84.7% 72 85.7% 35 82.3% 243 Shop 25 - UW Tower 88.7% 133 100.0% 1 100.0% 1 88.9% 135 Shop 69 - HVAC 78.6% 98 81.2% 953 62.5% 8 80.8% 1,059 Shop 24 - Fire Alarm 82.0% 222 85.5% 55 80.0% 5 82.6% 282
FMC Total 76.6% 5,604 84.3% 1,783 89.4% 85 78.5% 7,472 Shop 10 - Grounds 65.3% 202 71.2% 73 76.5% 17 67.5% 292 Shop 14 - Central Zone 81.0% 643 73.8% 237 70.0% 10 79.0% 890 Shop 15 - NE Zone 62.6% 960 89.7% 301 87.5% 8 69.2% 1,269 Shop 16 - SW Zone 75.0% 1,097 80.7% 419 100.0% 14 76.8% 1,530 Shop 17 - Health Science 82.0% 1,205 90.5% 347 100.0% 9 84.0% 1,561 Shop 18 - Grounds 87.4% 103 97.5% 80 100.0% 8 92.1% 191 Shop 34 - SW Lock 83.3% 407 84.4% 128 100.0% 13 83.9% 548 Shop 35 - Health Science 85.3% 286 92.6% 135 100.0% 3 87.7% 424 Shop 41 - NE Zone 66.8% 214 50.0% 20 #DIV/0! 65.4% 234 Shop 53 - Construction 77.3% 22 57.1% 7 #DIV/0! 72.4% 29 Shop 54 - Construction 69.2% 120 54.5% 11 66.7% 3 67.9% 134 Shop 55 - Construction 87.2% 196 87.5% 16 #DIV/0! 87.3% 212 Shop 56 - Construction 82.4% 34 100.0% 1 #DIV/0! 82.9% 35 Shop 58 - Construction 95.7% 115 100.0% 8 #DIV/0! 95.9% 123
Grand Total 77.1% 6,232 83.3% 2,874 87.1% 139 79.2% 9,245

Measure Intent:
Analysis / Recommendations / Forecast
Measure Formula / Description: Linked Initiatives/Activities
G Measure: Owner:
Overall Percentage of Deadlines Met
The intent is to measure Facilities Services overall effectiveness to communicate with our customers and to ensure our deadlines are being met.
Deadlines met divided by total work orders. Times (goals) and priorities are set by individual units depending on the type of work.
Analysis: The overall goal of 90% Deadlines Met was not met. This quarter decreased the gap slightly from previous quarters.
Reasoning: This is the second quarter reporting data for this measure. Only two departments are incorporated into the measure. The baseline and target are expected to change as more units are added. Data included in the current numbers is exclusively from AiM, while added units may record and report using different tools.
Recommendations:• Review AiM to ensure duplicate work orders are not created• Review work orders that did not meet deadlines to see if there are ways to
improve.• Ensure coding for material purchases is correct.• Implement training to the shops not meeting the expectation to ensure our on-
going measures are accurate
Forecast: As we begin to collect more data, we will be able to see trends that affect this measure and work with our FS team’s to ensure we are meeting deadlines set for each work request that is created.
OBJECTIVE C3: BE EASY TO DO BUSINESS WITH DAMON FETTERS
C3.3 DEADLINES MET RICH DIERCK
86.8% 87.3% 87.8% 87.9%
90.0%
0.0%
10.0%
20.0%
30.0%
40.0%
50.0%
60.0%
70.0%
80.0%
90.0%
100.0%
Q4 Q1 Q2 Q3
FY2016 FY2017
Deadlines Met Target
Timecard notes on Work Order completion
Establish QR Team (in progress)
Implement daily huddles in FMC (in progress)
Supp
lem
enta
ry In
form
atio
n
G Measure: Owner:
OBJECTIVE C3: BE EASY TO DO BUSINESS WITH DAMON FETTERS
C3.3 DEADLINES MET RICH DIERCK
Individual contributions from all groups roll up into the departments and ultimately influence the success of Facilities Services as a whole.
Left: Breakdown of all contributing units to the deadlines met measure.
Q3 Deadlines Met Breakdown by Unit & Priority Commentary
Routine High Urgent Overall
Dept > Shop % PassTotal WO's % Pass
Total WO's % Pass
Total WO's % Pass
Total WO's
CEO 93.6% 498 80.1% 1,024 75.0% 48 84.2% 1,570 Shop 20 - FOMS 94.4% 36 100.0% 10 100.0% 2 95.8% 48 Shop 23 - Elevator 96.0% 100 80.0% 70 71.9% 32 86.6% 202 Shop 23 - Fire Alarm 90.2% 173 92.6% 54 80.0% 5 90.5% 232 Shop 25 - UW Tower 99.2% 121 100.0% 1 100.0% 1 99.2% 123 Shop 69 - HVAC 88.2% 68 79.1% 889 75.0% 8 79.7% 965
FMC 90.0% 4,831 85.7% 1,695 83.3% 78 88.8% 6,604 Shop 10 - Grounds 79.4% 170 83.1% 65 66.7% 15 79.6% 250 Shop 14 - Central Zone 91.2% 524 74.5% 216 50.0% 10 85.9% 750 Shop 15 - NE Zone 81.8% 726 86.3% 278 100.0% 5 83.2% 1,009 Shop 16 - SW Zone 90.8% 1,010 83.3% 408 100.0% 14 88.8% 1,432 Shop 17 - Health Science 93.7% 1,171 88.7% 353 88.9% 9 92.5% 1,533 Shop 18 - Grounds 94.9% 99 89.2% 74 87.5% 8 92.3% 181 Shop 34 - SW Lock 93.3% 418 90.8% 120 100.0% 11 92.9% 549 Shop 35 - Health Science 81.2% 85 96.9% 130 100.0% 3 90.8% 218 Shop 41 - NE Zone 90.9% 232 75.0% 16 #DIV/0! 89.9% 248 Shop 53 - Construction 79.2% 24 71.4% 7 #DIV/0! 77.4% 31 Shop 54 - Construction 86.0% 100 100.0% 7 66.7% 3 86.4% 110 Shop 55 - Construction 94.2% 155 92.9% 14 #DIV/0! 94.1% 169 Shop 56 - Construction 86.1% 36 100.0% 1 #DIV/0! 86.5% 37 Shop 58 - Construction 98.8% 81 100.0% 6 #DIV/0! 98.9% 87
Grand Total 90.3% 5,329 83.6% 2,719 80.2% 126 87.9% 8,174

Measure Intent:
Analysis / Recommendations / Forecast
Measure Formula / Description: Linked Initiatives/Activities
G Measure: Owner:
Percent of Positive Feedback (all kiosks)
To gather customer satisfaction data at the point of interaction (service areas) with the intent of adjusting priorities based on feedback and volume.
Percentage of customers rating service areas positively (positive ratings divided by total ratings, multiplied by 100). Secondary metrics by area available as supplementary information.
Analysis: The target of 80% Positive Feedback was not met. A 10% drop from previous quarter came with the addition of 4 more machines outside of restrooms.
Reasoning: We are learning more about the potential of these kiosks and peoples’ willingness to use them. In addition to assessing changes in customer satisfaction at more permanent locations as was initially planned, we now understand that kiosks placed temporarily at events and even at project sites can help provide planners with valuable lessons to inform future projects.
Recommendations: The data identify specific locations and times of day that pose challenges for meeting customer expectations. Investigation into what conditions and events may result in that challenge can reveal how and where to target additional efforts.
Forecast: April data for BSD/restrooms shows much more positive numbers, its predicted that next quarter’s overall percentage will increase as a result”
OBJECTIVE C3: BE EASY TO DO BUSINESS WITH LUANN STOKKE
C.3.4 LOCATION-BASED FEEDBACK ARI KASAPYAN
Customer Care Team supplemental feedback process established
We are scheduling additional placements- (i.e. on Shuttles, at Surplus, meetings)
66%
58% 60%64%
69% 68%71% 70% 70% 73% 75%
65%
80%
0%
10%
20%
30%
40%
50%
60%
70%
80%
90%
100%
0
1000
2000
3000
4000
5000
6000
7000
8000
Apr May Jun Jul Aug Sep Oct Nov Dec Jan Feb Mar
2016 2017
V Pos Pos Neg V Neg %Positive
Supp
lem
enta
ry In
form
atio
n
G Measure: Owner:
OBJECTIVE C3: BE EASY TO DO BUSINESS WITH LUANN STOKKE
C.3.4 LOCATION-BASED FEEDBACK ARI KASAPYAN
Positive Results by Question
Users were asked to rate on a scale of 4:• Please rate the cleanliness of this garage today.• Please rate the cleanliness of this restroom today.
The scale used::
FY2017 Q3 Submission Count
0%
10%
20%
30%
40%
50%
60%
70%
80%
90%
100%
Apr May Jun Jul Aug Sep Oct Nov Dec Jan Feb Mar
2016 2017
Month V Pos Pos Neg V Neg %Positive2017 6019 3736 1880 2350 70%
Jan 1602 978 389 561 73%Feb 1702 986 353 563 75%Mar 2715 1772 1138 1226 65%
0%
10%
20%
30%
40%
50%
60%
70%
80%
90%
100%
0
50
100
150
200
250
300
350
400
6AM
7AM
8AM
9AM
10AM
11AM
12PM
1PM
2PM
3PM
4PM
5PM
6PM
7PM
8PM
Restroom Results by Hour
CommentsRestroom surveys were started in March with the addition of 4 new Happy or Not machines.
Restrooms are typically cleaned in the morning and as traffic continues throughout the day cleanliness scores decreased as expected.

Measure Intent:
Analysis / Recommendations / Forecast
Measure Formula / Description: Linked Initiatives/Activities
G Measure: Owner:
How would you rate your satisfaction with overall service?
To measure the frequency of meeting customer expectations and overall service delivery feedback
The number of times customers identified that their expectations were met vs not met divided by the number of responses.
Analysis: The FY17 Q3 rate of satisfaction (Very Satisfied + Satisfied) is 95.3%. A target has not yet been set.
Reasoning: Data collection alignment is not yet in place. We are still working on streamlining surveys across FS to ensure consistency and continuity. FY17 Q2 and Q3 saw an adjustment in both the scale and questions, therefore the data analysis and comparison between FY17 Q2 and Q3 is unreliable. FY17 Q3 data was compiled under a “best fit” analysis for matching similar question categories. In addition, UCAR system users account for 85.6% of respondents.
Recommendations: Survey alignment should be complete this quarter which will allow for consistency and future reliable analysis for FY18 and beyond.
Forecast: N/A
OBJECTIVE C3: BE EASY TO DO BUSINESS WITH DAMON FETTERS
C3.5 COMPLETION OF SERVICE JENNIFER CONNORS
77.5%83.8%
17.8%16.2% 2.0%
2.6%
0%
20%
40%
60%
80%
100%
FY17 Q2 FY17 Q3
Very Satisfied Satisfied Dissatisfied Very Dissatisfied
Redevelop survey questions and survey for consistency
Ensure all surveys are consistent across FS (planned)
Customer Service Training (for All FS) – on schedule (not complete)
Look for new survey opportunities within services not represented
Supp
lem
enta
ry In
form
atio
n
G Measure: Owner:
OBJECTIVE C3: BE EASY TO DO BUSINESS WITH DAMON FETTERS
C3.5 COMPLETION OF SERVICE JENNIFER CONNORS
Unit Response Count Percent of TotalTS Events 53 1.3%Surplus 60 1.5%Recycling 24 0.6%Moving 30 0.7%Maintenance 353 8.5%UCAR Rentals 3539 85.6%Custodial 74 1.8%Construction 66 1.6%Grand Total 4199
Did We Meet Your Expectations (overall service)? – FY2017 Q3
Customer Participation by Unit
Rate Your Experience With Us. – FY2017 Q3
Customer Participation by question
Unit Response Count
Understanding my needs 549
Attention to Detail 596
Deadline met 550
Courteous staff 618
Response time 64
Effective information 651
The question of “Did we meet your expectations?” was asked different ways across each of the above units.
Moving and Surplus asked “Reflecting on this interaction with Moving/Surplus Services, my expectations were met” and had 5 answers – strongly agree, agree, neutral, disagree and strongly disagree. Scale was changed in April.
UCAR asked “Overall how would you rate our services” with a 1-5 answer choice
TS Events asked “Value of services delivered” with a 1-5 answer choice
Maintenance, Custodial, Construction and Recycling asked “Thinking about your overall experience with the service you received, how would you rate your satisfaction?” and had 4 answers – Very Satisfied, Satisfied, Dissatisfied and Very Dissatisfied.
45%
32%
84%
29%
77%
79%
65%
62%
53%
62%
12%
58%
23%
17%
33%
38%
0% 20% 40% 60% 80% 100%
Construction
Custodial
Ucar
Maintenance
Moving
Recycling
Surplus
TS Events
Very Satisfied Satisfied Dissatisfied Very dissatisfied
45.5%
78.1%
71.4%
77.5%
65.5%
47.7%
45.0%
15.6%
26.2%
17.9%
26.2%
42.1%
0% 20% 40% 60% 80% 100%
Providing effective service and statusinformation.
Time frame in which staff responded to yourrequest.
Courteous, professional staff.
Time frame in which work was completed.
Attention to detail and thoroughness of work.
Understanding my needs and requirements.
Very Satisfied Satisfied Dissatisfied Very Dissatisfied
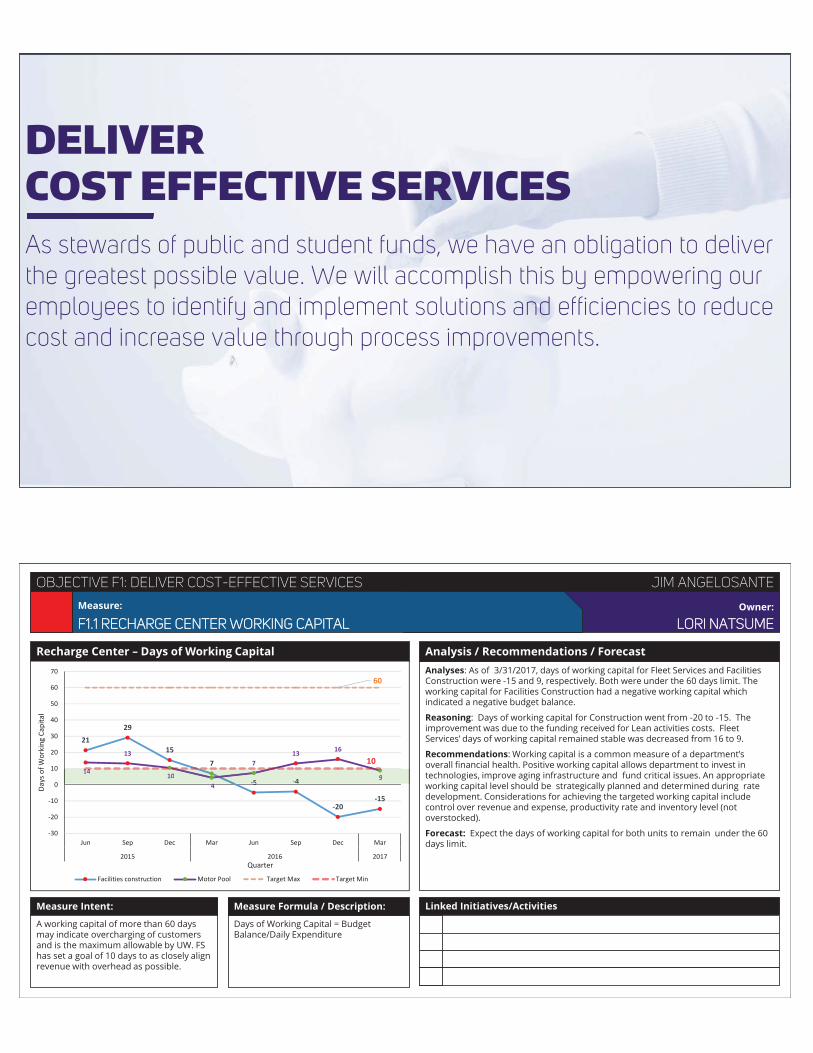
DELIVERCOST EFFECTIVE SERVICESAs stewards of public and student funds, we have an obligation to deliver the greatest possible value. We will accomplish this by empowering our employees to identify and implement solutions and efficiencies to reduce cost and increase value through process improvements.
Measure Intent:
Analysis / Recommendations / Forecast
Measure Formula / Description: Linked Initiatives/Activities
G Measure: Owner:
2129
15
7
-5 -4
-20-15
14
13
104
713 16
9
60
10
-30
-20
-10
0
10
20
30
40
50
60
70
Jun Sep Dec Mar Jun Sep Dec Mar
2015 2016 2017
Days
of W
orki
ng C
apita
l
Quarter
Facilities construction Motor Pool Target Max Target Min
Recharge Center – Days of Working Capital
A working capital of more than 60 days may indicate overcharging of customers and is the maximum allowable by UW. FS has set a goal of 10 days to as closely align revenue with overhead as possible.
Days of Working Capital = Budget Balance/Daily Expenditure
Analyses: As of 3/31/2017, days of working capital for Fleet Services and Facilities Construction were -15 and 9, respectively. Both were under the 60 days limit. The working capital for Facilities Construction had a negative working capital which indicated a negative budget balance.
Reasoning: Days of working capital for Construction went from -20 to -15. The improvement was due to the funding received for Lean activities costs. Fleet Services’ days of working capital remained stable was decreased from 16 to 9.
Recommendations: Working capital is a common measure of a department’s overall financial health. Positive working capital allows department to invest in technologies, improve aging infrastructure and fund critical issues. An appropriate working capital level should be strategically planned and determined during rate development. Considerations for achieving the targeted working capital include control over revenue and expense, productivity rate and inventory level (not overstocked).
Forecast: Expect the days of working capital for both units to remain under the 60 days limit.
OBJECTIVE F1: DELIVER COST-EFFECTIVE SERVICES JIM ANGELOSANTE
F1.1 RECHARGE CENTER WORKING CAPITAL LORI NATSUME
-5 -41414 10
49

Supp
lem
enta
ry In
form
atio
n
G Measure: Owner:
OBJECTIVE F1: DELIVER COST-EFFECTIVE SERVICES JIM ANGELOSANTE
F1.1 RECHARGE CENTER WORKING CAPITAL LORI NATSUME
Quarterly Balance by Unit
Fleet Services had a positive balance as of $121,761 as of March 31, 2017 which equates to positive 10 days working capital. There was a loss of 4 working capital days from the beginning of this biennium which represents a total loss of $39,234.
Construction had a negative balance of $342,616 as of March 31, 2017 which equates to negative 15 days working capital. There was a loss of 36 working capital days from the beginning of this biennium which represents a total loss of $939,505.
Commentary
$596,889
$697,957
$370,196
$166,767
$(117,339) $(102,982)
$(472,513)
$(342,616)
$167,031 $180,373 $139,423
$60,509 $104,122
$187,001 $220,224
$121,761
-$600,000
-$400,000
-$200,000
$0
$200,000
$400,000
$600,000
$800,000
Jun Sep Dec Mar Jun Sep Dec Mar
2015 2016 2017
FS Construction
Motor Pool
Measure Intent:
Analysis / Recommendations / Forecast
Measure Formula / Description: Linked Initiatives/Activities
G Measure: Owner:
Percent Hours Applied Directly to Work
To measure unit direct labor to job availability in delivering cost–effective services to clients. Compare total labor hours applied directly to work orders with the total labor hours on site. Higher direct labor to job availability could result a lower charge rate.
Direct labor to job availability % (excluding Supervisors) = hours applied directly to work orders/total hours on site/100
Analyses: The target of all 3 units meeting their individual goals was not met, only Operations succeeded in surpassing it’s target. The productive rate for Facilities Construction improved from previous quarter, but was still below the target of 79%. Maintenance saw a small drop in productivity (2%).
Reasoning: Because of the nature of business and operation, each unit has a different target. Facilities Construction has more estimating/planning and communication with clients, thus the direct labor to Job productivity level is lower. Facilities Maintenance and Campus Operations have less planning and estimating as 80% of labor are contributed to absorbed work orders.
Recommendations: The target for each unit was the level needed to generate enough recharges/revenue to balance budgets. Maximizing direct labor to job availability along with overhead cost reduction can offer clients a lower charge rate.
Forecast: October – February were slow months and it is expected that the productivity would be low. The target s for FY17 are 79% and 85% for Construction and Maintenance respectively.
OBJECTIVE F1: DELIVER COST-EFFECTIVE SERVICES JIM ANGELOSANTE
F1.2 DIRECT LABOR TO JOB AVAILABILITY LORI NATSUME
Goo
d
89%
90%
91%
92%
92%
85%
0%
10%
20%
30%
40%
50%
60%
70%
80%
90%
100%
Mar Jun Sep Dec Mar
2016 2017
Campus Operations
86%
85%
86%
84%
82%
85%
Mar Jun Sep Dec Mar
2016 2017
Facilities Maintenance
70%
68% 77
%
68%
71%
79%
Mar Jun Sep Dec Mar
2016 2017
Facilities Construction
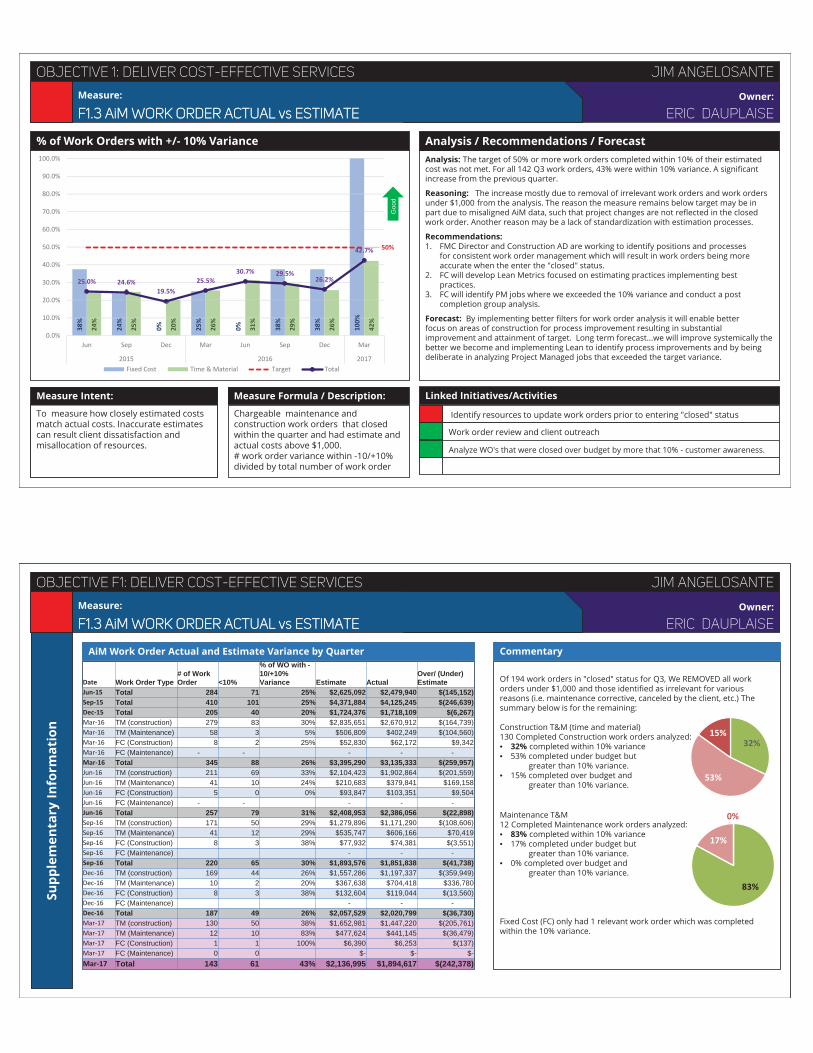
Measure Intent:
Analysis / Recommendations / Forecast
Measure Formula / Description: Linked Initiatives/Activities
G Measure: Owner:
% of Work Orders with +/- 10% Variance
To measure how closely estimated costs match actual costs. Inaccurate estimates can result client dissatisfaction and misallocation of resources.
Chargeable maintenance and construction work orders that closed within the quarter and had estimate and actual costs above $1,000.# work order variance within -10/+10% divided by total number of work order
JIM ANGELOSANTE
Analysis: The target of 50% or more work orders completed within 10% of their estimated cost was not met. For all 142 Q3 work orders, 43% were within 10% variance. A significant increase from the previous quarter.
Reasoning: The increase mostly due to removal of irrelevant work orders and work orders under $1,000 from the analysis. The reason the measure remains below target may be in part due to misaligned AiM data, such that project changes are not reflected in the closed work order. Another reason may be a lack of standardization with estimation processes.
Recommendations:1. FMC Director and Construction AD are working to identify positions and processes
for consistent work order management which will result in work orders being more accurate when the enter the "closed" status.
2. FC will develop Lean Metrics focused on estimating practices implementing best practices.
3. FC will identify PM jobs where we exceeded the 10% variance and conduct a post completion group analysis.
Forecast: By implementing better filters for work order analysis it will enable better focus on areas of construction for process improvement resulting in substantial improvement and attainment of target. Long term forecast...we will improve systemically the better we become and implementing Lean to identify process improvements and by being deliberate in analyzing Project Managed jobs that exceeded the target variance.
F1.3 AiM WORK ORDER ACTUAL vs ESTIMATE ERIC DAUPLAISE
Work order review and client outreach
Analyze WO's that were closed over budget by more that 10% - customer awareness.
OBJECTIVE 1: DELIVER COST-EFFECTIVE SERVICES
Goo
d
Identify resources to update work orders prior to entering "closed" status
38%
24%
0% 25%
0% 38%
38%
100%
24%
25%
20%
26%
31%
29%
26%
42%
50%
25.0% 24.6%19.5%
25.5%30.7% 29.5%
26.2%
42.7%
0.0%
10.0%
20.0%
30.0%
40.0%
50.0%
60.0%
70.0%
80.0%
90.0%
100.0%
Jun Sep Dec Mar Jun Sep Dec Mar
2015 2016 2017Fixed Cost Time & Material Target Total
Supp
lem
enta
ry In
form
atio
n
G Measure: Owner:
OBJECTIVE F1: DELIVER COST-EFFECTIVE SERVICES JIM ANGELOSANTE
F1.3 AiM WORK ORDER ACTUAL vs ESTIMATE ERIC DAUPLAISE
AiM Work Order Actual and Estimate Variance by Quarter
Of 194 work orders in "closed" status for Q3, We REMOVED all work orders under $1,000 and those identified as irrelevant for various reasons (i.e. maintenance corrective, canceled by the client, etc.) The summary below is for the remaining:
Construction T&M (time and material)130 Completed Construction work orders analyzed:• 32% completed within 10% variance• 53% completed under budget but
greater than 10% variance.• 15% completed over budget and
greater than 10% variance.
Maintenance T&M12 Completed Maintenance work orders analyzed:• 83% completed within 10% variance• 17% completed under budget but
greater than 10% variance.• 0% completed over budget and
greater than 10% variance.
Fixed Cost (FC) only had 1 relevant work order which was completed within the 10% variance.
Commentary
Date Work Order Type# of Work Order <10%
% of WO with -10/+10% Variance Estimate Actual
Over/ (Under) Estimate
Jun-15 Total 284 71 25% $2,625,092 $2,479,940 $(145,152)Sep-15 Total 410 101 25% $4,371,884 $4,125,245 $(246,639)Dec-15 Total 205 40 20% $1,724,376 $1,718,109 $(6,267)Mar-16 TM (construction) 279 83 30% $2,835,651 $2,670,912 $(164,739)Mar-16 TM (Maintenance) 58 3 5% $506,809 $402,249 $(104,560)Mar-16 FC (Construction) 8 2 25% $52,830 $62,172 $9,342 Mar-16 FC (Maintenance) - - - - -Mar-16 Total 345 88 26% $3,395,290 $3,135,333 $(259,957)Jun-16 TM (construction) 211 69 33% $2,104,423 $1,902,864 $(201,559)Jun-16 TM (Maintenance) 41 10 24% $210,683 $379,841 $169,158 Jun-16 FC (Construction) 5 0 0% $93,847 $103,351 $9,504 Jun-16 FC (Maintenance) - - - - -Jun-16 Total 257 79 31% $2,408,953 $2,386,056 $(22,898)Sep-16 TM (construction) 171 50 29% $1,279,896 $1,171,290 $(108,606)Sep-16 TM (Maintenance) 41 12 29% $535,747 $606,166 $70,419 Sep-16 FC (Construction) 8 3 38% $77,932 $74,381 $(3,551)Sep-16 FC (Maintenance) - - -Sep-16 Total 220 65 30% $1,893,576 $1,851,838 $(41,738)Dec-16 TM (construction) 169 44 26% $1,557,286 $1,197,337 $(359,949)Dec-16 TM (Maintenance) 10 2 20% $367,638 $704,418 $336,780 Dec-16 FC (Construction) 8 3 38% $132,604 $119,044 $(13,560)Dec-16 FC (Maintenance) - - -Dec-16 Total 187 49 26% $2,057,529 $2,020,799 $(36,730)Mar-17 TM (construction) 130 50 38% $1,652,981 $1,447,220 $(205,761)Mar-17 TM (Maintenance) 12 10 83% $477,624 $441,145 $(36,479)Mar-17 FC (Construction) 1 1 100% $6,390 $6,253 $(137)Mar-17 FC (Maintenance) 0 0 $- $- $-Mar-17 Total 143 61 43% $2,136,995 $1,894,617 $(242,378)
32%
53%
15%
83%
17%
0%

Measure Intent:
Analysis / Recommendations / Forecast
Measure Formula / Description: Linked Initiatives/Activities
G Measure: Owner:
Average Steam Cost per 1000lbs
To compare the steam cost per 1000 lbs. with Enwave Seattle’s average, based on Power Plant current steam system. The cost is dependent upon unit fuel cost, Power Plant operating cost, and distribution maintenance cost.
$/1000 lbs. =Total operating and Capital cost/Total Steam Produced/1000
Analysis: The target of keeping steam costs below that of Seattle’s main steam supplier, Enwave, was met for the 6th quarter in a row.
Reasoning: The lower fuel price (31% cost reduction started 11/1/2015) is the key factor to the overall lower steam cost as 60% of the steam cost is from the fuel. In addition, the average steam production was 116,432 units (1000lbs per unit) which was increased by 47% compared with last quarter, thus lowered the steam cost.
In addition to the fuel price reduction, minimized number of boilers running, keep up preventive maintenance schedule (less breakdown) and keep staff to a minimum level (increase productivity). T he higher steam cost in the summer months was due to a low demand in steam with same level of staffing cost.
Recommendations: Benchmarking the fuel cost of steam generation, in dollars per 1,000 pounds ($/1,000 lb) of steam, is an effective way to assess the efficiency of the steam system. Also taking advantage of the lower fuel price to co-generate more electricity would save the overall energy cost.
Forecast: Expect the steam cost to be lower than the national average. When fuel price goes down, the steam cost would go down as well.
OBJECTIVE F1: DELIVER COST-EFFECTIVE SERVICES JIM ANGELOSANTE
F1.4 STEAM COST MARK KIRSCHENBAUM
Good
16.0
1
11.2
3
11.9
7
13.8
5 18.6
1
11.4
9
11.6
4 15.3
4
16.0
0
9.22 9.89
10.6
7
11.6
2
10.7
8
9.64
14.78
10.75
0.00
2.00
4.00
6.00
8.00
10.00
12.00
14.00
16.00
18.00
20.00
Q1 Q2 Q3 Q4 Q1 Q2 Q3 Q4 Q1 Q2 Q3 Q4 Q1 Q2 Q3
2014 2015 2016 2017
UW Steam Cost Seattle Steam 12-mo Rolling Average
Supp
lem
enta
ry In
form
atio
n
G Measure: Owner:
OBJECTIVE F1: DELIVER COST-EFFECTIVE SERVICES JIM ANGELOSANTE
F1.4 STEAM COST MARK KIRSCHENBAUM
Average Steam Cost Per 1000 lbs CommentarySteam production is much lower during the warm summer months than during the winter months. Subsequently the "cost" of payroll, operations and water/sewer is a much larger component of the steam cost than during the winter months. (below chart)
Third quarter steam cost continued to drop as expected due to increased production.
Steam Production vs Temperature
-
20
40
60
80
100
120
140
160
0
10
20
30
40
50
60
70
80
Jan Feb Mar Apr May Jun Jul Aug Sep Oct Nov Dec
Stea
m P
rodu
ctio
n (lb
s)M
illio
ns
Avg
Cost
/ A
vg T
empe
ratu
re
Steam Production (avg) Seattle Low Temp (avg)
Seattle High Temp (avg) Steam Cost (avg)
Q1 Q2 Q3 Q4 Q1 Q2 Q3 Q4 Q1 Q2 Q3 Q4 Q1 Q2 Q32014 2015 2016 2017
Distribution $0.56 $0.43 $0.13 $0.37 $0.43 $0.21 $0.11 $0.14 $0.23 $0.16 $0.20 $0.27 $0.29 $0.21 $0.24Water/Sewer $1.03 $0.20 $0.15 $0.49 $1.52 $0.40 $0.30 $0.75 $1.44 $0.40 $0.40 $0.65 $1.12 $0.56 $0.29Operations $2.70 $1.20 $1.24 $2.08 $4.05 $0.42 $1.06 $3.39 $2.08 $0.98 $1.72 $1.99 $1.35 $1.75 $1.28Payroll $3.77 $1.86 $1.97 $3.01 $4.66 $2.68 $1.91 $3.17 $4.30 $2.14 $2.27 $2.92 $3.45 $2.73 $2.31Fuel $7.96 $7.55 $8.48 $7.90 $7.96 $7.79 $8.26 $7.89 $7.95 $5.54 $5.30 $4.84 $5.40 $5.53 $5.51Total $16.0 $11.2 $11.9 $13.8 $18.6 $11.4 $11.6 $15.3 $16.0 $9.22 $9.89 $10.6 $11.6 $10.7 $9.64Steam Production 191552396988371242239529173552321440328512264376193840401759373488288888237378349296420031
0
50
100
150
200
250
300
350
400
450
500
$-
$2
$4
$6
$8
$10
$12
$14
$16
$18
$20
Stea
m P
rodu
ctio
n –
Mill
ions
of L
bs
Aver
age
Mon
thly
Cos
t

Measure Intent:
Analysis / Recommendations / Forecast
Measure Formula / Description: Linked Initiatives/Activities
G Measure: Owner:
Resource Conservation Measure – Return on Investment
Insure completed RCM’s are cost effective.
Limit RCP investments to most cost effective projects.
RCM’s lifetime utility cost avoided must be greater than the net capital investment required to implement the measure.
ROI = LUCA / NCI
LUCA = Lifetime Utility Cost Avoided
NCI = Net Capital Investment
NCI = Funded Labor + Material Cost –Rebates & Grants Secured
Analysis: All RCM’s completed must be cost effective (IE: ROI>1.00). FY17,3 Qtr. ROI of $5.77 utility cost avoided for each $1 invested marks eleven straight quarters of positive ROI’s across 23 completed projects.
Reasoning: Using fact based decision making resulting from the comprehensive Energy Audit Process; Resource Conservation Projects are well planned, with reliable scopes, budgets and schedules resulting in positive ROI’s while reducing deferred maintenance backlog reducing the burden to Minor Capital Program.
Recommendations: Execution of RCM’s depend on close coordination and support of FS operational depts. Development of reliable spend plans, coordinated execution schedules, realistic resource assignments are bearing fruit in completed projects finishing on-budget/on-time. Rebate LEAN process for tracking rebate opportunities has increased revenue capture and accelerated capital turn rates.
Forecast: As the ROI increases the resulting positive cash flow should fund implementation of more of the $25 M in planned cost effective RCM’s, with potential to reduce utility cost by as much as $3.5 million annually. Completed RCM’s reduce deferred maintenance and repair backlog; thus increase staff focus on preventative maintenance and proactive repair. Successful energy audit program (11 million GSF audited in 30 months) should be replicated in capital planning and assessment of new minor capital projects.
FMC LED Lighting Team is scoping FY17-19 projects!
RCP/MC rolling out 17-19 Project Lists to CEO/FMC for coordination
OBJECTIVE F1: DELIVER COST-EFFECTIVE SERVICES JIM ANGELOSANTE
F1.5 RESOURCE CONSERVATION PROGRAM: RCM ROI NORM MENTER
1.14 1.42.41
3.69
2.15
11.28
6.535.77
15
5.7
1.0
0
2
4
6
8
10
12
Q4 Q1 Q2 Q3 Q4 Q1 Q2 Q3
FY 2015 FY 2016 FY 2017
UTI
LITY
$ S
AVED
PER
CAP
ITAL
$ IN
VEST
ED
Goo
d
Supp
lem
enta
ry In
form
atio
n
G Measure: Owner:
OBJECTIVE F1: DELIVER COST-EFFECTIVE SERVICES JIM ANGELOSANTE
F1.5 RESOURCE CONSERVATION PROGRAM: RCM ROI NORM MENTER
Completed Resource Conservation Measure - Return on Investment Details
Commentary• The Gowen Hall Heating Coil Replacement Project completed by CPD in FY17 Q3 is
noteworthy for a number of reasons:
• This is the first “Minor Capital Piggyback Project” completed by the Resource Conservation Program. RCP energy saving project was combined with a MC system renewal project, resulting in project cost efficiencies, reduced customer operational impacts , and a more efficient system operation.
• This project captured nearly $50,000 in utility rebates pushing cumulative captured utility reserves above $2 million for the first time! Utility reserves captured to date will be re-invested next biennium, further perpetuating this self-sustaining fund source as a hedge against continued reduction state allocations.
• The table above provides the relevant details that inform calculation of the measure.
• Cumulative Statistics illustrate the compounded impact of the program on key FS performance Indicators:
• $3.6M gross/$1.6M net capital investment in 23 completed projects• $2.0M in rebates and grants secured • $4.7M in utility cost avoided over the life of the improvements• 5,225 MgCO2e avoided annually (4.6% of 2005 UW baseline
emissions)• Cumulative ROI: $2.88 saved for $1 net investment.
Resource Conservation Projects FY 15.4 FY 16.1 FY 16.2 FY 16.3 FY 16.4 FY 17.1 FY 17.2 FY 17.3 CUMULATIVE
Utility Cost Avoided -Life $550,121 $1,506 $160,667 $106,520 $57,421 $673,283 $442,650 $500,640 $4,725,303
Gross Investment $615,700 $1,074 $66,609 $71,856 $26,666 $198,940 $143,606 $136,724 $3,671,862
Rebates/Grants $132,974 $0 $0 $42,986 $0 $139,258 $75,823 $49,903 $2,031,464
Net Capital Investment $482,726 $1,074 $66,609 $28,870 $26,666 $59,682 $67,783 $86,821 $1,640,398
Return on Investment 1.14 1.40 2.41 3.69 2.15 11.28 6.53 5.77 2.88
Carbon Avoided (MgCo2e/Yr) 673 3 85 48 26 1,929 218 1,086 5,225
Completed projects 2 1 5 1 1 1 1 1 23
Name: Completed projects: UW Tower Chiller Replacement and UW IBM Tivoli Software
Clark Hall retro Commissioning Initiative partnering w/ Shop 69
Shop 17-Insulation Projects MHSC Wings, I, RR, B, D, F
LED Lighting Retrofits: Shop 15 and 41-Electrical IMA Sports Courts
Shop 17-Insulation Projects MHSC Wings, DEF,K, C,G,H,H-add.
Shop 17-Steam Valve Replacement Projects MHSC: J & T Wing
Raitt Hall DDC Replacement Project
Gowen Hall Coil Replacement Project
Cumulative statistics since the start of the program in FY15.1

ENGAGE ALL EMPLOYEES INCONTINUOUS IMPROVEMENTEmployees have ideas, insight, and innovations that help us evolve, adapt, and innovate to thrive in a changing environment. To create a culture of natural workgroups and regular huddles, teams share thoughts, ideas, and best practices to improve the work on a daily basis. Facilities Services will mature the four key systems by embracing, accepting and implementing goal-focused ideas from all employees to create change.
G
Measure Intent:
Analysis / Recommendations / Forecast
Measure Formula / Description: Linked Initiatives/Activities
Measure: Owner:
25.7
%
24.6
%
29.6
%
33.2
%
35.0
%
36.9
%
42.0
%
44.7
%
45.8
%
46.4
%
47.3
%
49.3
%
50.1
%
80%
0%
10%
20%
30%
40%
50%
60%
70%
80%
90%
100%
Q1 Q2 Q3 Q4 Q1 Q2 Q3 Q4 Q1 Q2 Q3
FY2013 FY2014 FY2015 FY2016 FY2017Participation Rate Huddle Target
Percent of Employees Participating in Regular Huddles
Regular participation in Lean Huddles demonstrates a culture of change. Those closest to the work provide waste-eliminating solutions and stay engaged with their work.
The percentage of huddle participants reported on the Idea Count Survey divided by Employee Headcounts.
Analysis: The percent of employees participating in Lean Huddles (self reported) increased slightly from that of previous quarters to 50%. The target of 80% was not met.
Reasoning: Many new teams were added in Q3, but most have yet to begin reporting participation on the monthly survey. Separations may have also contributed to a low overall gain. Data has been adjusted to temporally fill in teams that did not report during this quarter, however later reports will not show temporary inclusions if the teams fail to report beyond 3 months of the deadline.
Recommendations: Continue building teams where there currently are none including within management levels. Develop regular huddle practices among existing teams to prevent teams lapsing in participation. Encourage management participation in gembas and team building.
Forecast: As the 25+ teams in FMC come online in the upcoming months participation should see a large increase. If that is sustainable will rely on management practices and new processes around team monitoring.
OBJECTIVE P1: ENGAGE ALL EMPLOYEES IN CONTINUOUS IMPROVEMENT LUANN STOKKE
P1.1 LEAN MATURITY KEVIN KRAMER
Director-level leaders standard work developed
Identify all missing teams at all levels of the org.
Goo
d
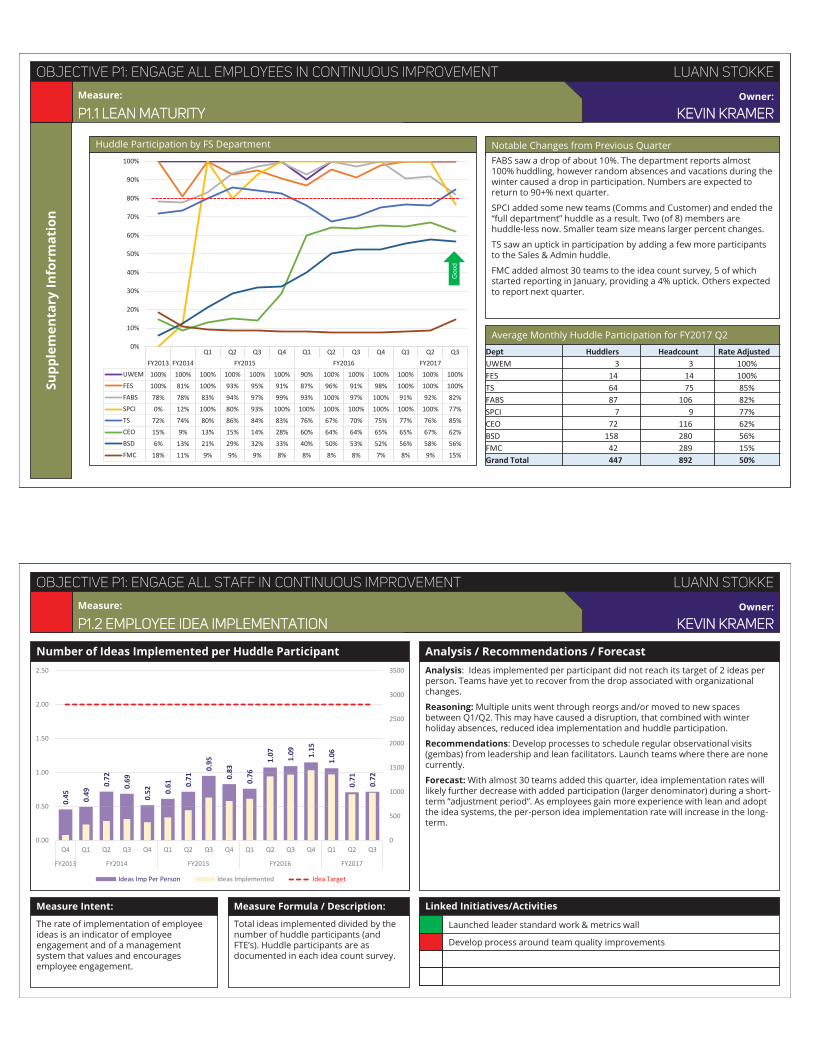
Supp
lem
enta
ry In
form
atio
n
G Measure: Owner:
Q1 Q2 Q3 Q4 Q1 Q2 Q3 Q4 Q1 Q2 Q3FY2013 FY2014 FY2015 FY2016 FY2017
UWEM 100% 100% 100% 100% 100% 100% 90% 100% 100% 100% 100% 100% 100%FES 100% 81% 100% 93% 95% 91% 87% 96% 91% 98% 100% 100% 100%FABS 78% 78% 83% 94% 97% 99% 93% 100% 97% 100% 91% 92% 82%SPCI 0% 12% 100% 80% 93% 100% 100% 100% 100% 100% 100% 100% 77%TS 72% 74% 80% 86% 84% 83% 76% 67% 70% 75% 77% 76% 85%CEO 15% 9% 13% 15% 14% 28% 60% 64% 64% 65% 65% 67% 62%BSD 6% 13% 21% 29% 32% 33% 40% 50% 53% 52% 56% 58% 56%FMC 18% 11% 9% 9% 9% 8% 8% 8% 8% 7% 8% 9% 15%
0%
10%
20%
30%
40%
50%
60%
70%
80%
90%
100%
OBJECTIVE P1: ENGAGE ALL EMPLOYEES IN CONTINUOUS IMPROVEMENT LUANN STOKKE
P1.1 LEAN MATURITY KEVIN KRAMER
Huddle Participation by FS Department Notable Changes from Previous QuarterFABS saw a drop of about 10%. The department reports almost 100% huddling, however random absences and vacations during the winter caused a drop in participation. Numbers are expected to return to 90+% next quarter.
SPCI added some new teams (Comms and Customer) and ended the “full department” huddle as a result. Two (of 8) members are huddle-less now. Smaller team size means larger percent changes.
TS saw an uptick in participation by adding a few more participants to the Sales & Admin huddle.
FMC added almost 30 teams to the idea count survey, 5 of which started reporting in January, providing a 4% uptick. Others expected to report next quarter.
Average Monthly Huddle Participation for FY2017 Q2
Goo
d
Dept Huddlers Headcount Rate AdjustedUWEM 3 3 100%FES 14 14 100%TS 64 75 85%FABS 87 106 82%SPCI 7 9 77%CEO 72 116 62%BSD 158 280 56%FMC 42 289 15%Grand Total 447 892 50%
Measure Intent:
Analysis / Recommendations / Forecast
Measure Formula / Description: Linked Initiatives/Activities
G Measure: Owner:
Number of Ideas Implemented per Huddle Participant
The rate of implementation of employee ideas is an indicator of employee engagement and of a management system that values and encourages employee engagement.
Total ideas implemented divided by the number of huddle participants (and FTE’s). Huddle participants are as documented in each idea count survey.
Analysis: Ideas implemented per participant did not reach its target of 2 ideas per person. Teams have yet to recover from the drop associated with organizational changes.
Reasoning: Multiple units went through reorgs and/or moved to new spaces between Q1/Q2. This may have caused a disruption, that combined with winter holiday absences, reduced idea implementation and huddle participation.
Recommendations: Develop processes to schedule regular observational visits (gembas) from leadership and lean facilitators. Launch teams where there are none currently.
Forecast: With almost 30 teams added this quarter, idea implementation rates will likely further decrease with added participation (larger denominator) during a short-term “adjustment period”. As employees gain more experience with lean and adopt the idea systems, the per-person idea implementation rate will increase in the long-term.
Launched leader standard work & metrics wall
Develop process around team quality improvements
OBJECTIVE P1: ENGAGE ALL STAFF IN CONTINUOUS IMPROVEMENT LUANN STOKKE
P1.2 EMPLOYEE IDEA IMPLEMENTATION KEVIN KRAMER
Goo
d
0.45 0.49
0.72
0.69
0.52 0.
61 0.71
0.95
0.83
0.76
1.07 1.09 1.
15
1.06
0.71
0.72
0
500
1000
1500
2000
2500
3000
3500
0.00
0.50
1.00
1.50
2.00
2.50
Q4 Q1 Q2 Q3 Q4 Q1 Q2 Q3 Q4 Q1 Q2 Q3 Q4 Q1 Q2 Q3
FY2013 FY2014 FY2015 FY2016 FY2017
Ideas Imp Per Person Ideas Implemented Idea Target

Supp
lem
enta
ry In
form
atio
n
G Measure: Owner:
OBJECTIVE P1: ENGAGE ALL STAFF IN CONTINUOUS IMPROVEMENT LUANN STOKKE
P1.2 EMPLOYEE IDEA IMPLEMENTATION KEVIN KRAMER
6 Month Rolling Averages (trends) of Idea Per Huddler by Department
Goo
d
Cultural Implications of LEAN participation
Above: chart shows a correlation between ideas per participant and percentage of employees regularly huddling. This chart may suggest that as LEAN is more widely adopted, the culture of idea generation will continue to grow and that 2 ideas per person is a realistic and sustainable future target. Left: Rolling averages of ideas per huddle participant by department. Rolling averages are used to normalize larger variations with the actual numbers.
-
0.50
1.00
1.50
2.00
2.50
5/1/
2012
7/1/
2012
9/1/
2012
11/1
/201
21/
1/20
133/
1/20
135/
1/20
137/
1/20
139/
1/20
1311
/1/2
013
1/1/
2014
3/1/
2014
5/1/
2014
7/1/
2014
9/1/
2014
11/1
/201
41/
1/20
153/
1/20
155/
1/20
157/
1/20
159/
1/20
1511
/1/2
015
1/1/
2016
3/1/
2016
5/1/
2016
7/1/
2016
9/1/
2016
11/1
/201
61/
1/20
173/
1/20
17
0
200
400
600
800
1,000
1,200
1,400
1,600
1,800
Ideas Generated Ideas Implemented
Regular Huddlers 12 per. Mov. Avg. (Ideas Per Person )
-
0.50
1.00
1.50
2.00
2.50
3.00
3.50
4.00
4.50
5.00
5.50
6.00
Jul Sep Nov Jan Mar May Jul Sep Nov Jan Mar May Jul Sep Nov Jan Mar
Q1 Q2 Q3 Q4 Q1 Q2 Q3 Q4 Q1 Q2 Q3
FY2013FY2014 FY2015 FY2016 FY2017
BSD
CEO
FABS
FES
FMC
SPCI
TS
UWEM