fungal mats in solid-state fermentation
TRANSCRIPT
Fungal Mats in Solid-State Fermentation
Promotor Prof. Dr. Ir. J. Tramper Hoogleraar in de Bioprocestechnologie, Wageningen Universiteit Co-promotor Dr. Ir. A. Rinzema Universitair docent sectie Proceskunde, Wageningen Universiteit Promotiecommissie
Prof. Dr. Ir. M.H. Zwietering Wageningen Universiteit Dr. Ir. M.J.R. Nout Wageningen Universiteit Dr. Ir. J. Hunik DSM Gist, Delft Dr. J. Dijksterhuis Centraalbureau voor Schimmelcultures, Utrecht
Dit onderzoek is uitgevoerd binnen de onderzoekschool VLAG
Yovita Siti Padmasari Rahardjo
Fungal Mats in Solid-State Fermentation
Proefschrift
ter verkrijging van de graad van doctor op gezag van de Rector Magnificus
van Wageningen Universiteit, Prof. Dr. Ir. L. Speelman
in het openbaar te verdedigen op maandag 18 april 2005
des namiddags te half twee in de Aula

Rahardjo, YSP. 2005. Fungal Mats in Solid-State Fermentation PhD Thesis, Wageningen University, Wageningen, The Netherlands ISBN: 90-8504-212-7
To my Father
In memory of my Mother, who knew me better than I know myself, and my Little Brother

Contents
Chapter 1 Introduction 9 Chapter 2 Limitations of membrane cultures as a model solid-state 17 fermentation system Chapter 3 Contribution of aerial hyphae of Aspergillus oryzae to respiration 29 in a model solid-state fermentation system Chapter 4 Aerial mycelia of Aspergillus oryzae accelerate α-amylase production 45 in a model solid-state fermentation system Chapter 5 Significance of bed porosity, bran and specific surface area in 57 solid-state cultivation of Aspergillus oryzae Chapter 6 Effect of low oxygen concentrations on growth and α-amylase 77 production of Aspergillus oryzae in model solid-state fermentation
systems Chapter 7 Modelling conversion and transport phenomena in solid-state 105 fermentation: A review and perspectives Summary 147 Samenvatting 151 Acknowledgements 157 Curriculum Vitae 161


Chapter 1
Introduction
9

Chapter 1
Solid-state fermentation
Solid-state fermentation (SSF) naturally occurs in our direct environment, at places where free-flowing water is nearly absent, such as in a compost bin, on bread, or on rotten fruit. Thanks to the SSF process, organic compounds are continuously recycled in nature. Since ancient times, the principle of SSF has been utilised to produce indigenous fermented food by people all over the world. Some examples are cheese in Europe and the Middle East, soy sauce, tempe and beverages in Asia, and fermented sorghum in Africa (Campbell-Platt 1994). The microorganisms, which are involved in SSF, synthesise enzymes that degrade polymeric substances into smaller and more easily digestible compounds. The same microorganisms also have abilities to consecutively convert the degraded compounds into enzymes and other types of (useful) products. Tempe, an Indonesian traditional product made from soybeans inoculated with Rhizopus sp., has a higher digestibility than the original beans and a pleasant flavour and texture (Mital and Garg 1990, Steinkraus 1994). The improved digestibility of tempe is due to the enzymatic degradation of biopolymers by the fungus. Aspergillus sp., which are used in soy sauce fermentation, produce extracellular enzymes that hydrolyse protein and starch of soybeans and wheat into amino acids and sugars (Yong and Wood 1977). These amino acids and sugars are the substrate for lactic-acid bacteria and yeasts, which produce the characteristic flavour of soy sauce in a second fermentation process. In the last two decades, various types of SSF products, including food and food ingredients, agro-industrial products, pharmaceutical products and many more, have been documented. An extensive review has recently been published on these issues. It covers the microorganisms and substrates used in, and specific metabolites produced by SSF (Pandey et al. 2000). For some specific products, it is also suggested that SSF offers higher yields and better product spectra (Hata et al. 1997, 1998; Ishida et al. 2000; de Vrije et al. 2001). Today there is increased interest in many aspects of SSF (Pandey 2003) like biochemistry, physical chemistry, and engineering (Raghavarao et al. 2003) and the design of SSF bioreactors (Durand 2003; Mitchell et al. 2003).
10

Introduction
Despite its prospects and the growing interest, SSF has received little attention compared to submerged fermentation (SmF) and consequently many biochemical engineering aspects of SSF are still poorly understood. The difficulties in process control and scaling-up of SSF cause the relatively slow development of SSF compared to SmF. In comparison to SmF, in which the microbial biomass as well as the substrates are homogeneously distributed in a liquid phase, SSF involves heterogeneous interactions of microbial biomass with moist solid substrate. In SSF, sugars and other nutrients are supplied from the moist substrate matrix, while oxygen is available in the continuous gas phase. The near absence of water in SSF promises a more efficient downstream process. However, the lack of water in SSF also causes a serious problem in heat removal, which is one of the major concerns in process control in SSF. As a designer, we need predictions of the heat production rate. It is well known that metabolic heat production is proportional to oxygen uptake. We know that oxygen supply in the biomass layer on the surface of or inside the substrate particles may be limited by diffusion (Oostra et al. 2001). Although oxygen diffusion limitation in microbial pellets in SmF has been extensively studied (Kobayashi et al. 1973; Metz and Kossen 1977; Thibault et al. 2000), still little is known about oxygen transfer in microbial mats on the surface of and inside the substrate particle in SSF. The research project that is presented in this thesis aimed at providing information on oxygen uptake kinetics and the consequent enzyme production in SSF at the substrate particle level.
Filamentous fungal mats
Although a broad range of microorganisms covering fungi, yeast and some bacteria can be used in SSF, this research focuses on filamentous fungi. Filamentous fungi are commonly used in SSF, due to their relatively high tolerance to low water activities, their high potential to excrete hydrolytic enzymes and their morphology. Filamentous fungi are featured as modular organisms (Carlile 1994), which grow by the repeated iteration of modules usually to yield a branching pattern. The tubular hypha that emerges from the spore elongates at the tip and at the same time along the hypha, new branches are formed.
11

Chapter 1
The branches continue branching to form a porous three-dimensional network of hyphae, which is known as mycelium. This unique morphological characteristic of filamentous fungi is suitable for SSF conditions. Their morphology allows filamentous fungi to colonise and penetrate the solid substrate in search for nutrients. Figure 1 shows a schematic drawing of the growth of filamentous fungi on a flat solid substrate. Initially, sparse mycelia grow inside the substrate matrix (layer 3), on the surface of the substrate (layer 2), and at a certain moment into the air (layer 1). As the mycelia continue to grow, (i) layer 1 becomes so dense that its pores get filled with water and it transforms into layer 2, (ii) the packing density or thickness of layer 2 increases to such an extent that the lower part becomes anaerobic, and (iii) oxygen is depleted in the substrate matrix. Under anaerobic conditions, the mycelia in layers 2 and 3 stop growing or start fermenting. When the pores of the mycelial mat are filled with water, it can be regarded as a biofilm layer or a thin layer of water filled with growing biomass.
pores, filled with liquid
penetrative mycelia (3)
wet mycelial layer (2)
aerial mycelia (1)
substrate
interface air-liquid
Figure 1. Mode of growth of filamentous fungi.
Outline of this thesis
The aim of this research was to acquire more knowledge about the growth and product formation of filamentous fungi and about phenomena governing these activities at the substrate particle level. In this research, Aspergillus oryzae was chosen as the model organism, because it is broadly used to produce enzymes and has a long history of safe
12

Introduction
use in the food industry. One of its hydrolytic enzymes, α-amylase, is chosen as a model product. Furthermore wheat flour and wheat grain are used as model substrates. Filamentous fungi penetrate the substrate matrix in SSF. This may give a higher degree or rate of substrate conversion, but the tight interaction between the mycelia and the solid substrate does not allow a complete recovery of the biomass, which hinders estimates of growth rates and yields. Cultivation on membrane filters is commonly used to prevent the penetration of hyphae into the substrate matrix and therefore to allow a complete recovery of the biomass. In the work described in Chapter 2, it was shown that in overcultures of A. oryzae on sterilised milled whole-wheat disks overlaid with a polycarbonate membrane, the presence of membrane filters reduced the maximum respiration rate (up to 50%), as well as biomass and α-amylase production. For this reason, in this research an SSF model system without membrane filters was used. Chapter 3 describes the significant contribution of aerial mycelia of A. oryzae, cultivated on an SSF model system made from sterilised wheat flour, to the overall oxygen uptake rate. This is attributed to the facts that A. oryzae forms abundant aerial mycelia and that oxygen diffusion in the gas-filled pores of the aerial mycelia layer is rapid. As can be expected from the high oxygen uptake rate in such a cultivation, the presence of aerial mycelia of A. oryzae resulted in a strong increase in fungal biomass and α-amylase (Chapter 4). Cultures of A. oryzae on wheat-flour model substrate produced twice the amounts of fungal biomass and α-amylase when aerial mycelia were formed. Heat production was estimated from the amount of oxygen uptake and it was shown that heat removal using evaporative cooling is theoretically feasible in cultures of A. oryzae with aerial mycelia, but shrinkage would require non-conventional fermenter types. Utilisation of the findings on the positive contribution of aerial mycelia in commercial SSF is very interesting. Chapter 5 however describes that there are other important factors that play a role in the oxygen uptake rate and α-amylase production during the growth of A. oryzae on wheat grain and wheat flour pellets. Due to the presence of the bran at the outside of the wheat grain, the high oxygen uptake rate observed during cultivation of A. oryzae on wheat flour model substrate was not reached on wheat grain. In cultures of A.
13
Chapter 1
oryzae on wheat-flour pellets, it was shown that extra open space around the substrate increased the oxygen uptake and α-amylase production rates. Furthermore, the cumulative oxygen uptake and α-amylase production per gram of initial substrate dry matter is proportional to the surface-area/volume ratio of the substrate particles. A. oryzae is an example of an aerobic fungus and it is known that oxygen supply into the mycelial mat can be hampered by diffusion limitation. Chapter 6 describes the effects of low oxygen concentrations on the growth and α-amylase production of A. oryzae. The effects on the hyphal elongation rate and branching frequency of young mycelia, on the radial growth rate of fungal colonies, and on the biomass and enzyme production rates of over-cultures were studied. For both the branching frequency of individual hyphae and the colony extension rate, similar Monod constants (KO2) of 0.1% (v/v in the gas phase) were found. However, experimental results showed that the specific α-amylase production rate in overcultures was already reduced at 0.25% (v/v) oxygen. In the concluding Chapter 7, the occurrence of micro-scale phenomena in SSF is explained and the consequences are discussed. The inevitable concentration gradients inside substrate particles and microbial biofilms in SSF are needed for the transport of substrates and products. Because of the complexity of an SSF system, mathematical models are needed to understand it. Models that have been proposed to describe coupled substrate conversion and diffusion and the resulting microbial growth in SSF and their experimental validation are critically evaluated. Based on recent findings in the field and from this research, important issues that need to be addressed in further modelling work are discussed.
References
Campbell-Platt G. 1994. Fermented foods – a world perspective. Food Research Int 27:253-257.
Carlile MJ. 1994. The success of the hypha and mycelium. In: The Growing Fungus (Gow NAR, Gadd GM (Eds)). London:Chapmann & Hall. pp.3-19.
14
Introduction
Durand A. 2003. Bioreactor designs for solid-state fermentation. Biochem Eng Journal 13:113-125.
Hata Y, Ishida H, Kojima Y, Ichikawa E, Kawato A, Suginami K, Imayasu S. 1997. Comparison of two glucoamylases produced by Aspergillus oryzae in solid-state culture (koji) and in submerged culture. J Ferment Bioeng 84:532-537.
Hata Y, Ishida H, Ichikawa E, Kawato A, Suginami K, Imayasu S. 1998. Nucleotide sequence of an alternative glucoamylase-encoding gene (glaB) expressed in solid-state culture of Aspergillus oryzae. Gene 207:127-134.
Ishida H, Hata Y, Kawato A, Abe Y, Suginami K, Imayasu S. 2000. Identification of functional elements that regulate the glucoamylase-encoding gene (glaB) expressed in solid-state culture of Aspergillus oryzae. Curr Gen 37:373-379.
Kobayashi T, van Dedem G, Moo-Yung M. 1973. Oxygen transfer into mycelial pellets. Biotechnol Bioeng 15:27-45.
Metz B, Kossen NWF. 1977. The growth of moulds in the form of pellets [in fermentation processes] - a literature review. Biotechnol Bioeng 19:781-799.
Mital BK, Garg SK. 1990. Tempeh – technology and food value. Food Rev Int 6:213-224.
Mitchell DA, Krieger N, Stuart DM, Pandey A. 2000. New developments in solid-state fermentation II: Rational approaches to the design, operation and scale-up of bioreactors. Proc Biochem 35:1211-1225.
Mitchell DA, von Meien OF, Krieger N. 2003. Recent developments in modelling of solid-stat fermentation: heat and mass transfer in bioreactors. Biochem Eng Journal 13:137-147.
Oostra J, le Comte EP, van den Heuvel JC, Tramper J, Rinzema A. 2001. Intra-particle oxygen diffusion limitation in solid-state fermentation. Biotechnol Bioeng 75:13-24.
Pandey A, Soccol CR, Mitchell D. 2000. New developments in solid-state fermentation: I-bioprocesses and products. Proc Biochem 35:1153-1169.
15
Chapter 1
16
Pandey A. 2003. Solid-state fermentation. Biochem Eng Journal 13:81-84.
Raghavarao KSMS, Ranganathan TV, Karanth NG. 2003. Some engineering aspects of solid-state fermentation. Biochem Eng Journal 13:127-135.
Steinkraus KH. 1994. Nutritional significance of fermented foods. Food Res Int 27:259-267.
Thibault J, Pouliot K, Agosin E, Perez-Correa R. 2000. Reassessment of the estimation of dissolved oxygen concentration profile and KLa in solid-state fermentation. Proc Biochem 36:9-18.
de Vrije T, Antoine N, Buitelaar RM, Bruckner S, Dissevelt M, Durand A, Gerlagh M, Jones EE, Luth P, Oostra J. 2001. The fungal biocontrol agent Coniothyrium minitans: production by solid-state fermentation, application and marketing. Appl Microbiol Biotechnol 56:58-68.
Yong FM, Wood BJ. 1977. Biochemical changes in experimental koji. J Food Technol 12:163-175.

Chapter 2
Limitations of membrane cultures as a model solid-state fermentation system
Yovita SP Rahardjo, Dagmara Korona, Sebastiaan Haemers, Frans J Weber, Johannes Tramper, Arjen Rinzema
Abstract
Aims: To examine the reliability of membrane cultures as a model Solid-State Fermentation (SSF) system. Methods and Results: In overcultures of Aspergillus oryzae on sterilized wheat flour discs overlaid with a polycarbonate membrane, we demonstrated that the presence of membrane filters reduced the maximum respiration rate (up to 50%), and biomass and α-amylase production. We also show that the advantage of membrane cultures, i.e. total recovery of biomass, is not very evident for the system used, while the changes in metabolism and kinetics are serious drawbacks. Conclusions: The use of membrane cultures is artificial and without substantial benefits and therefore has to be carefully considered. Significance and Impact of the Study: In future studies on kinetics and stoichiometry of SSF, one should not completely rely on experiments using membrane cultures as a model SSF system. Lett Appl Microbiol 2004;39:504-508.
17

Chapter 2
Introduction
Difficulties in determining biomass remain a major problem in Solid-State Fermentation (SSF) research (Weber et al. 1999; Raimbault 1998; Mitchell et al. 1989). Fungi are widely used in SSF, i.e. due to their ability to colonize and penetrate the solid substrate. The tight interaction between the mycelia and the solid substrate does not allow a complete recovery of the biomass, which hinders the estimate of growth rates and yields. A direct measurement of biomass dry weight is preferred above measurements of biomass components, such as glucosamine and protein, and metabolic measurements of biomass, such as respiration rate and carbon dioxide production. For a direct measurement of biomass, solid substrates overlaid with membrane filters were introduced (Mitchell et al. 1989). Membrane filters act as physical barrier to prevent the penetration of hyphae into the solid substrate and therefore this method allows a complete recovery of the biomass from the solid substrate. The membrane filters, however, might introduce some limitations by hindering enzyme or nutrient transport, as they are placed between the substrate and the biomass layer. Membrane filters have, in general and based on their pore size, a limited open surface area. Only through this open area, the transport of hydrolytic enzymes and nutrients can take place. Although Mitchell et al. (1989) already observed that the presence of the membrane filter affected the growth of Rhizopus oligosporus, it is not exactly known how much the membrane influences the cultivation. Several kinetics and stoichiometric studies on SSF were based on this method (Ikasari & Mitchell 1998a,b; Ooijkaas 2000; Nagel et al. 2001; Han et al. 2003) without considering the effect of the presence of the membranes. In this study, direct measurements of biomass as well as metabolic measurements were used to show the effect of membrane filters on the cultivation of Aspergillus oryzae on wheat flour discs. Respiration rate, α-amylase activity and residual starch and oligo/monomer concentrations were used as metabolic measurements. The presence of
18
Limitations of membrane cultures
the membrane filters had remarkable effects on the respiration rate and respiration quotient, as well as on biomass, α-amylase activity, and Carbon (C) recovery.
Materials and Methods
Micro-organism and substrate preparation
Aspergillus oryzae CBS570.64 was obtained from the Centraalbureau voor Schimmelcultures (CBS), Baarn, NL. Spore production and storage, and the preparation of sterile wheat flour discs from wheat grain were described in Rahardjo et al. (2002). The initial wet weight of each wheat flour disc was measured. The initial dry weight of three wheat-flour discs was determined and this value was used to calculate the dry weight of each wheat flour disc used in the experiments.
Fermentation experiments
Over-culture on wheat flour discs sealed with agar (cultures without membrane) The wheat flour discs were inoculated (5.5 x 10⁴ spores per disc) as described in Rahardjo et al. (2002). The spore suspension was diluted with sterilized demineralized water to reach the intended concentration. Membrane over-culture on wheat flour discs (membrane cultures) Each wheat flour disc was placed in a sterile polypropylene (PP) dish (diameter 45 mm) as used by Nagel et al. (2001). Three types of membranes (∅ 47 mm) were sterilized and laid on the discs, viz. 0.22 µm hydrophilic polycarbonate membrane (Poretics Corporation, Livermore, CA, USA), and 0.45 µm and 0.20 µm hydrophilic cellulose nitrate membrane (Schleicher & Schuell, Dassel, Germany). 100 µl of a diluted spore suspension was homogeneously spread on the membrane with a sterile bent glass rod (5.5 x 10⁴ spores per disc).
19
Chapter 2
Two parallel experiments were performed using one batch of wheat flour discs and one batch of spore suspension. One experiment was used to measure the respiration rate; the other experiment was used to determine biomass dry weight, glucose and α-amylase activity. Respiration rate measurement The set-up used to measure the respiration rate of each culture was described in Rahardjo et al. (2002). The outlet air was also analyzed for carbon dioxide (Series 1400 infrared carbon dioxide analyzer, Servomex, Zoetermeer, The Netherlands). Biomass, glucose, and α-amylase activity determination Petri and PP dishes without lids, containing an inoculated wheat flour disc, were put on a tray in a closed Perspex chamber. The chamber was placed in a 35oC incubator and aerated at 24 dm3.h-1 (Brooks flow meter, Brooks Instrument, Hatfield, PA, USA). The air was moistened using a bubble column filled with water at 35oC and filter-sterilized using a 0.2-µm hydrophobic membrane (Midisart 2000, Sartorius, Nieuwegein, The Netherlands) before it entered the chamber at the bottom. Two times per day, two Petri and PP dishes were taken out of the chamber. One dish was used to determine biomass dry weight; the other was used for α-amylase determination. Biomass was peeled from the substrate and from the membrane using a scalpel and dried to constant weight at 80oC. The substrate left was stored at –20oC before using it for free and total glucose determination. About 0.6 gram of substrate (weight before storage) was suspended in ca 20 ml demineralized water by grinding with an ultraturrax (Silverson L4R, Silverson Machine Ltd. Chesham Bucks, UK). From this mixture, 1.5 ml homogenate was centrifuged at 15300 rpm for 15 minutes (equal to 32 x g) and the supernatant was used for free glucose determination. From the same mixture, ca 0.1 ml homogenate was mixed with 4.5 ml amyloglucosidase solution (0.1065 gram amyloglucosidase (22.500 units/g DM, Rhizopus origin, Sigma) in phosphate buffer (pH 4.5, 50% 0.057M di-potassium phosphate and 50% 0.074M mono-potassium phosphate) and incubated overnight at
20

Limitations of membrane cultures
55oC to hydrolyze unused starch to glucose. A 1.5-ml homogenized hydrolysate was centrifuged at 15300 rpm for 15 minutes and the supernatant was used for total glucose determination. Glucose was determined using the GOD-PAP method (Roche, Almere, The Netherlands) as described in Tietz (1995). The α-amylase activities in the biomass and substrate layers were determined separately. The biomass layer was peeled off the substrate, and both the substrate and biomass layers were stored at –80oC. The frozen biomass was powdered using a micro-dismembrator (B. Braun Biotech, Melsungen, Germany) and stored at –80oC before α-amylase determination. Biomass powder was suspended in 30 ml phosphate buffer (pH 7, 19% 0.1M citric acid monohydrate and 81% 0.2M di-sodium phosphate) per gram of powder, while keeping it on ice. The α-amylase activity was determined in the supernatant obtained after centrifugation (15300 rpm, 15 min). About 0.6 gram of substrate was suspended in 30 ml phosphate buffer (see above) by grinding with an ultraturrax (Silverson L4R, Silverson Machine Ltd. Chesham Bucks, UK). From this mixture, 1.5 ml homogenate was centrifuged at 15300 rpm for 15 minutes and the supernatant was used for α-amylase determination. The α-amylase activity was determined using blocked p-nitrophenyl maltoheptaoside as substrate and excess α-glucosidase (HR reagent, Megazyme, Wicklow, Ireland) (Rauscher et al. 1985). 500-µl phosphate buffer (pH 7) and 100 µl HR reagent were mixed in a cuvette and incubated in a water bath at 35oC. After incubation, 100-µl (diluted) sample was added and mixed and the absorbance increase, due to the release of 4-nitrophenol, was measured at 405 nm in a spectrophotometer at 35oC (Beckman DU 640, Beckman Coulter, Fullertown, CA, USA). The activity of α-amylase in the samples was expressed in units per gram of initial substrate dry matter, using an extinction coefficient of 948 dm3.mol-1.mm-1 for 4-nitrophenol, measured under the conditions of the assay. One unit (U) of catalytic activity of α-amylase will liberate 1 µmol of 4-nitrophenol per minute under the assay conditions.
21

Chapter 2
Results
In this study, we compared overcultures of A. oryzae on wheat flour discs with agar sealing (cultures without membrane) and on membrane-covered wheat flour discs (as performed in Nagel et al. 2001, membrane cultures). An agar sealing was used in the cultures without membrane to prevent diffusion of oxygen from the bottom of the substrate layer and thereby prevent the growth of mycelia on the side and bottom and inside the substrate (penetrative mycelia). Both types of overcultures were performed in the same conditions and with the same inoculation. During the cultivation, we measured respiration rate, carbon dioxide production rate, biomass dry weight, starch and activity of α-amylase in the substrate layer and the biomass layer. Measurements were done in duplicate; both results are presented in the graph (Figure 2). The graphs show that the trends of the measurements are reproducible. Three types of membranes, viz. polycarbonate (PC), nitrocellulose (two different pore sizes), and polyamide (Nagel, unpublished results) were used for the respiration rate measurements in membrane cultures, while only PC membranes were used for the other measurements. PC membranes are broadly used in SSF studies (Mitchell et al. 1989; Wösten et al. 1991; Ikasari et al. 1998a,b) and were chosen as a representation of membrane filters in general.
0.0E+00
5.0E-05
1.0E-04
1.5E-04
2.0E-04
2.5E-04
0 50 100 150 200time (hours)
rO2 (
mol
.h-1
.g-1
IDM
)
Figure 1: Oxygen uptake rate per gram initial substrate dry matter (IDM) in time of overculture of A. oryzae on wheat flour discs with agar (cultures without membrane – line) and on membrane-covered wheat flour discs (membrane cultures – □) (PC0.22: polycarbonate-0.22 µm pore size).
22
Limitations of membrane cultures
Visual observation during cultures without membranes indicated that there were no mycelia inside the substrate layer and at the bottom of the substrate. In this cultivation, the growth of biomass continued only on the top surface of the substrate and biomass could easily be scraped off the surface. In membrane cultures, biomass could be scraped off the membrane filter and entirely separated from the substrate. Figure 1 shows that the respiration rate of cultures without membrane increased and reached a peak at about 90 hours, whereas the respiration rate of PC membrane cultures reached a much lower peak at ca 60 hours and then leveled off. In cultivations with the other two types of membrane filters, respiration rate profiles leveled off at the same value and at the same time (results not shown). Similar results were obtained previously with polyamide filters (Nagel, unpublished results). Figure 2A shows that after 60 hours the biomass dry weight was lower in membrane cultures, as was the respiration rate. Figure 2B shows that already after 20 hours, the total α-amylase activity and the α-amylase activity in the substrate layer in cultures without membrane were higher than in membrane cultures. The lower α-amylase activity in the substrate layer in membrane cultures was most probably due to the presence of the membrane, which had only 9.5% open surface area. Because of the lower α-amylase activity in the substrate layer in membrane cultures, it was expected that the level of free glucose was also lower. However, there was no significant difference in the average free glucose level (10 – 15 mg.g-1 IDM) in the substrate layers of both cultures during the entire cultivation (results not shown). The free glucose levels are also affected by the uptake into the biomass. This indicates that there was sufficient α-amylase in the substrate layer in membrane cultures to maintain the biomass growth there.
23

Chapter 2
0.E+00
2.E-03
4.E-03
6.E-03
8.E-03
1.E-02
0 20 40 60 80 100 120
biom
ass
(C m
ol.g
-1 ID
M)
A
0
5
10
15
20
25
30
0 20 40 60 80 100 120time (hours)
α-a
myl
ase
activ
ity (U
.g-1
IDM
) B
Figure 2(A): Biomass DM per gram of initial substrate dry matter of overculture of A. oryzae in time for cultures without membrane (○) and membrane cultures (□); (B): α-amylase activity per gram of initial substrate dry matter of overculture of A. oryzae in time (● is for cultures without membrane, ■ is for membrane cultures; black-filled symbols and lines are for α-amylase activity in both biomass and substrate layers, gray-filled symbols and dashed lines are for α-amylase activity in the substrate layer).
Discussion
It has been shown that respiration rate, biomass and α-amylase production for A. oryzae cultivated on wheat flour discs overlaid with membrane filters were lower than for A. oryzae cultivated directly on wheat flour discs. From the carbon dioxide production rate
24

Limitations of membrane cultures
and respiration rate, we calculated the overall respiration quotient (RQ) (Figure 3). We also calculated the C-recovery from the biomass dry weight, starch and carbon dioxide production for each measurement point (Figure 3) of both cultures. During the whole cultivation, the C-recovery in membrane cultures was higher than in cultures without membrane. The C-recovery of membrane cultures reached values close to 100% after around 60 hours, while the C recovery of cultures without membrane reached 100% only at the end. These time points correspond to the time points where the overall RQ values of both cultivations reached the value of 1. These differences indicate a different metabolism in both cultivations. There might be other metabolites, apart from biomass and carbon dioxide, formed from glucose in cultures without membrane, which were not measured and therefore need further studies. It seems that due to the presence of the membrane in membrane cultures, the amount of glucose consumed would be ‘just’ enough for biomass formation and carbon dioxide production. This is most likely due to the limited open surface area of membrane filters. The transport limitation of substrates and metabolites by membrane filters seems to be the main cause for altering the metabolism of the fungus.
50%
60%
70%
80%
90%
100%
110%
0 20 40 60 80 100 120time (hours)
C re
cove
ry (%
)
0
0.5
1
1.5
2
RQ
(rCO
2 /rO2 )
Figure 3: Percentage of C-recovery (calculated from biomass dry weight, total starch and carbon dioxide production) for cultures without membrane (●) and membrane cultures (■) and respiration quotient (RQ) of overculture of A. oryzae in time for cultures without membrane (line) and membrane cultures (□).
25

Chapter 2
It has always been assumed that the membrane only has a slight effect and the difference in the respiration rate, biomass production and metabolites formation due to the presence of the membrane has never been reported before. Our results clearly show that the presence of the membrane filters, made of any material, between the substrate matrix and the biomass significantly reduces the respiration rate. Although we did not measure biomass and α-amylase in membrane cultures using other type of membrane filters, based on the respiration rate measurements, we expect a similar reduction in biomass and α-amylase production for different filter types, similar to that in the cultivations on PC membranes. Furthermore, the disadvantages of membrane cultures in SSF studies, i.e. the changes in metabolism and kinetics, cannot be compensated by the only gain the membrane cultures offer, i.e. total recovery of biomass. In SSF with membrane cultures, precise measurements of biomass amount do not considerably improve the accuracy of, for example, kinetic studies. This is because of the fact that oxygen transfer in the biomass layer in SSF cultures, with or without membrane filter, remains problematic and as a consequence, homogeneous growth of aerobic biomass cannot be maintained. In this study we have shown that in the cultivation without membrane filters, we could obtain ‘complete’ biomass recovery and estimated that the unmeasured amount of biomass was negligible. We conclude that the use of membrane cultivation is artificial and without substantial benefits and therefore has to be carefully considered.
References
Han BZ, Ma Y, Rombouts FM, Nout MJR. 2003. Effects of temperature and relative humidity on growth and enzyme production by Actinomucor elegans and Rhizopus oligosporus during sufu pehtze preparation. Food Chem 81:27-34.
Ikasari L and Mitchell DA. 1998a. Oxygen uptake kinetics during solid-state fermentation with Rhizopus oligosporus. Biotechnol Techn 12:171-175.
26

Limitations of membrane cultures
27
Ikasari L and Mitchell DA. 1998b. Mimicking gas and temperature changes during enzyme production by Rhizopus oligosporus in solid-state fermentation. Biotechnol Lett 20:349-353.
Mitchell DA, Doelle HW, Greenfield PF. 1989. Suppression of penetrative hyphae of Rhizopus oligosporus by membrane filters in a model solid-state fermentation system. Biotechnol Techn 3:45-50.
Nagel FJI, Tramper J, Bakker MSN, Rinzema A. 2001. Model for on-line moisture-content control during solid-state fermentation. Biotechnol Bioeng 72:231-243.
Ooijkaas LP. 2000. Fungal biopesticide production by solid-state fermentation, growth and sporulation of Coniothyrium minitans. PhD. thesis. Wageningen University, Wageningen, The Netherlands.
Rahardjo YSP, Weber FJ, le Comte EP, Tramper J, Rinzema A. 2002. Contribution of aerial hyphae of Aspergillus oryzae to respiration in a model solid-state fermentation system. Biotechnol Bioeng 78:539-544.
Raimbault M. 1998. General and microbiological aspects of solid substrate fermentation. El J Biotechnol 1:1-15.
Rauscher E, Neumann U, Schaich E, von Bülow S, Wahlefeld AW. 1985. Optimized conditions for determining activity concentration of α-amylase in serum, with 1,4-α-D-4-nitrophenylmaltoheptaoside as substrate. Clin Chem 31:14-19.
Tietz NW. 1995. Clinical Guide to Laboratory Tests. 3rd ed. Philadelphia:WB Saunders Company. pp.268-273.
Weber FJ, Tramper J, Rinzema A. 1999. Quantitative recovery of fungal biomass grown on solid κ-carrageenan media. Biotechnol Techn 13:55-58.
Wösten HAB, Moukha SM, Sietsma JH, Wessels JGH. 1991. Localization of growth and secretion of proteins in Aspergillus niger. J Gen Microbiol 137:2017-2023.

Chapter 3
Contribution of aerial hyphae of Aspergillus oryzae to respiration in a model solid-state fermentation system
Yovita SP Rahardjo, Frans J Weber, E Paul le Comte, Johannes Tramper, Arjen Rinzema
Abstract
Oxygen transfer is for two reasons a major concern in scale-up and process control in industrial application of aerobic fungal Solid-State Fermentation (SSF): (1) heat production is proportional to oxygen uptake, and it is well known that heat removal is one of the main problems in scaled-up fermenters, and (2) oxygen supply to the mycelium on the surface of or inside the substrate particles may be hampered by diffusion limitation. This paper gives the first experimental evidence that aerial hyphae are important for fungal respiration in SSF. In cultures of A. oryzae on a wheat-flour model substrate, aerial hyphae contributed up to 75% of the oxygen uptake rate by the fungus. This is due to the fact that A. oryzae forms very abundant aerial mycelium and diffusion of oxygen in the gas-filled pores of the aerial hyphae layer is rapid. It means that diffusion limitation in the densely packed mycelium layer that is formed closer to the substrate surface and that has liquid-filled pores is much less important for A. oryzae than was previously reported for R. oligosporus and C. minitans. It also means that the overall oxygen uptake rate for A. oryzae is much higher than the oxygen uptake rate that can be predicted in the densely packed mycelium layer for R. oligosporus and C. minitans. This would imply that cooling problems become more pronounced. Therefore, it is very important to clarify the physiological role of aerial hyphae in SSF. Biotechnol Bioeng 2002;78:539-544.
29
Chapter 3
Introduction
Solid-State Fermentation (SSF) is the cultivation of microorganisms in a bed of most solid substrate with gas-filled pores. SSF has been broadly used since ancient times for the production of fermented food like soy-sauce koji, miso and tempe in the Orient (Raimbault 1998). Due to the rapid development of submerged fermentation (SmF) after 1940, most microbial products are produced by SmF in the West. However, SSF offers advantages compared to SmF for a number of fungal products (Pandey et al. 2000), probably because it resembles the natural habitat of fungi more than SmF. For example, for glucoamylase, it has been demonstrated that different genes are only expressed under SSF conditions (Ishida et al. 2000). Despite its prospects, SSF has received little attention in the previous decades and consequently many biochemical engineering aspects of SSF are still poorly understood. Oxygen transfer, for example, is a major concern in scale-up and process control on an industrial scale for two reasons: (1) heat production is proportional to oxygen uptake, and it is well known that heat removal is one of the main problems in scaled-up fermenters (Nagel et al. 2001b); and (2) oxygen supply to the mycelium on the surface of or inside the substrate particles may be hampered by diffusion limitation (Oostra et al. 2001a). Oxygen diffusion in mould pellets in SmF has been extensively studied (Metz and Kossen 1977), but little is known about intra-particle oxygen transfer in SSF. In SSF, fungal hyphae form a layer of biomass on the substrate particles. This fungal layer is basically a 3-dimensional net of hyphae with pores in between. These pores can be filled with liquid or with air. Nandakumar et al. (1996); Rajagopalan and Modak (1995a,b); and Thibault et al. (2000) assumed that the pores in this fungal layer are completely filled with water, and modelled the layer as a submerged biofilm. Based on simulation models, these authors concluded that oxygen diffusion in combination with oxygen consumption results in intra-particle gradients and oxygen limitation in part of the fungal layer. In contrast, Nopharatana et al. (1998) assumed that the pores in the fungal layer are filled with air, and neglected oxygen diffusion limitation. This was also implicitly assumed by
30

Contribution of aerial hyphae of Aspergillus oryzae
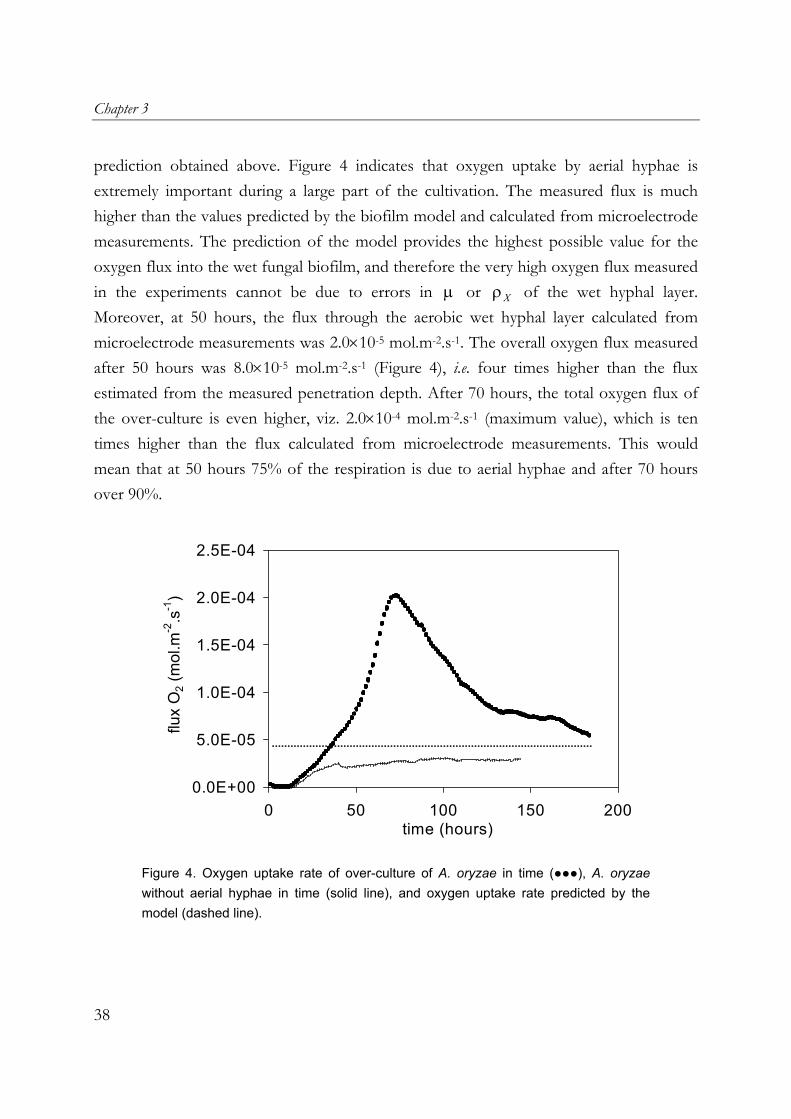
Georgiou and Shuler (1986); Mitchell et al. (1991); and Molin et al. (1993). Also, Wessels (1999) proposed the absence of water on the surface of aerial hyphae, due to the presence of a coating of hydrophobic proteins. If the pores of the fungal layer are mainly filled with air, it is probably justified to neglect oxygen diffusion limitation because the diffusivity of oxygen in air is sufficiently high. The important question remains whether the pores are filled with air or water. Recently, Oostra et al. (2001a,b) used micro-electrodes to study intra-particle oxygen transfer in SSF during cultivation of Rhizopus oligosporus and Coniothyrium minitans. They observed that the fungal biofilm consisted of (i) an upper layer with very sparse aerial hyphae and air-filled pores, and (ii) a lower layer with densely packed hyphae and liquid-filled pores (Figure 1). No oxygen gradients were measured in the layer of aerial hyphae, but steep oxygen concentration gradients were measured in the densely packed and wet hyphal layer and oxygen was absent at depths over 100 µm. They also showed that the contribution of aerial hyphae to respiration is negligible for the pertinent fungi and under the cultivation conditions used. This means that oxygen transfer at the particle level is seriously hampered by the slow diffusion in liquid, which significantly affects the cultivation process.
substrate
aerial hyphae
aerobic wet hyphal layer
anaerobic wet hyphal layer
penetrative hyphae
interface air-liquid
Figure 1. Schematic drawing of the fungal layer.
Contrary to R. oligosporus and C. minitans under the conditions used by Oostra et al. (2001a,b), Aspergillus oryzae, a fungus broadly used in SSF, forms very abundant aerial hyphae. By judging the appearance of its colonies, we expect that with this fungus the
31
Chapter 3
aerial hyphae are a significant fraction of the total biomass and may contribute significantly to the overall oxygen uptake. In this paper, experimental results showing the important contribution of aerial hyphae to oxygen uptake by SSF cultures of A. oryzae are reported and discussed.
Materials and Methods
Micro-organism
Aspergillus oryzae CBS570.64 was obtained from the Centraal Bureau voor Schimmelcultures (CBS), Baarn, NL. Spores were produced by cultivation of the fungus on malt extract agar (Oxoid, Oxoid Limited, Hampshire, UK) at 30oC for 7 days, as described by Nagel et al. (2001b). Spores suspensions in 20% glycerol were stored at -80oC in 1-mL aliquots.
Substrate preparation
One batch of commercial wheat grain, obtained from a local supplier, was stored at room temperature and used for all experiments. Wheat grains were milled with a Retsch mill (Retsch GmbH, Haan, Germany) to obtain wheat flour of 0.08 mesh (initial moisture content of the wheat flour 0.07 kg.kg-1 dry matter (DM)).
Cultivation method
Over-culture on wheat discs Equal masses of milled wheat grains (in DM) and demineralised water were homogeneously mixed. From this wheat dough, sterile discs (∅ 45 mm, 5 mm thick) were prepared as described by Nagel et al. (2001a). To prevent access of oxygen to the bottom of the wheat discs, the discs were sealed in agar. Petri dishes (∅ 50 mm) were filled with 3 ml 1.5% agar (Oxoid, Oxoid Limited, Hampshire, UK). Before the agar solution was solidified, the wheat discs were placed in the agar solution. After solidification of the agar,
32

Contribution of aerial hyphae of Aspergillus oryzae
the wheat discs were inoculated by homogeneously spreading 100µl (1.2×10⁵ spores) of a diluted spore suspension with a sterile bent glass rod over the disc. Fungal mat cultivated on wheat discs without aerial hyphae formation. To suppress the formation of aerial hyphae, inoculated wheat discs were covered with a sterile membrane. The wheat discs were placed in Petri dishes of ∅ 87 mm, which were filled with ±20 ml 1.5% agar. After solidification of the agar the wheat discs were inoculated, and a sterilised hydrophobic polycarbonate membrane (diameter 90 mm, thickness 10 µm, 3×10⁸ pores.cm-2 with a standard pore size of 0.2 µm, Poretics Corporation, Livermore, CA, USA) was laid on top of the wheat/agar disc.
Incubation
Gas Measurement Three Petri dishes without lids were placed in a closed and sterilised glass jar (∅ 120 mm, 70-mm high) to measure oxygen consumption. The closed jar was placed in a temperature-controlled cabinet at 35oC and aerated (3 L.h-1 at 273 K, 1 bar) using a mass flow controller (Brooks flow meter, Brooks Instrument, Hatfield, PA, USA). To prevent dehydration of the wheat discs, the air was humidified using a bubble column filled with water, which was placed in the temperature-controlled cabinet. The moistened air was filter sterilised using a 0.2-µm hydrophobic membrane (Midisart 2000, Sartorius, Nieuwegein, The Netherlands) before it entered the jar at the bottom. At the top of the jar, the outlet air was collected and subsequently dehumidified using a condenser with a cooler at 5oC before it was analysed for oxygen. Oxygen was analysed with a paramagnetic oxygen analyser (Xentra 4100 paramagnetic oxygen analyser, Servomex, Zoetermeer, The Netherlands).
Oxygen microelectrode measurement
Oxygen concentration profiles in the fungal mat were measured with oxygen microelectrodes (Ottengraf and van den Heuvel 1996; Revsbech and Ward 1983).
33
Chapter 3
Measurements were started by placing the tip of the electrode on top of the aerial layer (as the zero point) with the help of a microscope. Subsequently the microelectrode was pushed into the fungal mat with steps of 10 µm using a motor-driven micromanipulator with an accuracy of 1 µm. Further details are as described by Oostra et al. (2001a). The oxygen concentration profiles were fitted using Tablecurve 2D (AISN Software Inc., Mapleton) for Equation 4 (Appendix).
Membrane permeability
The membrane was placed in between two compartments (each ∅ 62 mm, 40-mm high). Nitrogen was blown through the upper compartment while air was blown through the lower compartment. Gas flows and other conditions (temperature, pressure and humidity) were similar to those used in the cultivation experiments. By measuring the oxygen concentration in the outgoing flow of the nitrogen compartment, the permeability of the membrane was assessed.
Results and Discussion
Model for diffusion limitation
It is known that oxygen transfer into the fungal layer can become limiting during cultivation of fungi on solid substrates (Oostra et al. 2001a,b). Diffusion limitation of oxygen in the wet hyphal layer combined with consumption of oxygen will result in oxygen depletion at a certain depth. For comparison with measured fluxes, we estimated the maximum possible oxygen flux into the wet hyphal layer using Equation 3 (Appendix). This estimate requires information on the intrinsic volumetric oxygen uptake rate in the biofilm (− in mol.m'''
Or -3.s-1) and the penetration depth of oxygen into the biofilm (δ in m). The former depends on the specific oxygen uptake rate and the packing density of the fungal hyphae; the latter depends on these parameters and the diffusion coefficient of oxygen in the wet fungal
34

Contribution of aerial hyphae of Aspergillus oryzae
biofilm. For A. oryzae grown at 35°C, we estimated that the volumetric oxygen uptake rate is = 0.90 mol.m'''
Or−
X
-3.s-1, using the specific growth rate ( = 0.3 hµ -1) observed in liquid culture (Spohr et al. 1997), a biomass dry-weight concentration in the wet hyphal layer of
= 300 kg·mρ -3 derived from the water content of the wet hyphal layer found by Nagel et al. (2001a), a biomass molecular weight of 0.024 kg·Cmol-1, and a biomass/oxygen yield coefficient of Y = 1.16 (Cmol.mol/X O
-1) (Nagel et al. 2001a). The diffusion coefficient for oxygen in water ( = 3.7×10eD -9 m2.s-1 at 35oC) was used as the oxygen diffusion coefficient in the biofilm (Oostra et al. 2001a). Using the above parameters and a saturated oxygen concentration in water of = 0.22 mol.m,O sC
J
-3 (at 35oC), a penetration depth = 4.3×10δ -5 m was calculated. Multiplying this value with the volumetric oxygen consumption rate gives a molar flux of oxygen = 3.8×10"
O-5 mol.m-2.s-1 (see Appendix).
This is the maximum oxygen flux into the wet fungal biofilm that can be attained, because high estimates were used for the specific growth rate, hyphal packing density and diffusion coefficient.
Experimental validation
Table I shows the penetration depth of oxygen in the wet hyphal layer and molar flux of oxygen from different experiments.
Table I. The penetration depth of oxygen and molar flux of oxygen from the model and experiments.
penetration depth of oxygen (δ), m
flux of O2, mol.m-2.s-1
Prediction of the model 4.3×10⁻⁵ 3.8×10⁻⁵
Micro-electrode measurement over-culture 50 hour
8.2×10⁻⁵
2.0×10⁻⁵
Oxygen consumption measurement over-culture 50 hour over-culture 75 hour over-culture without aerial hyphae > 50 hour
8.0×10⁻⁵
2.0×10⁻⁴
2.5×10⁻⁵
35
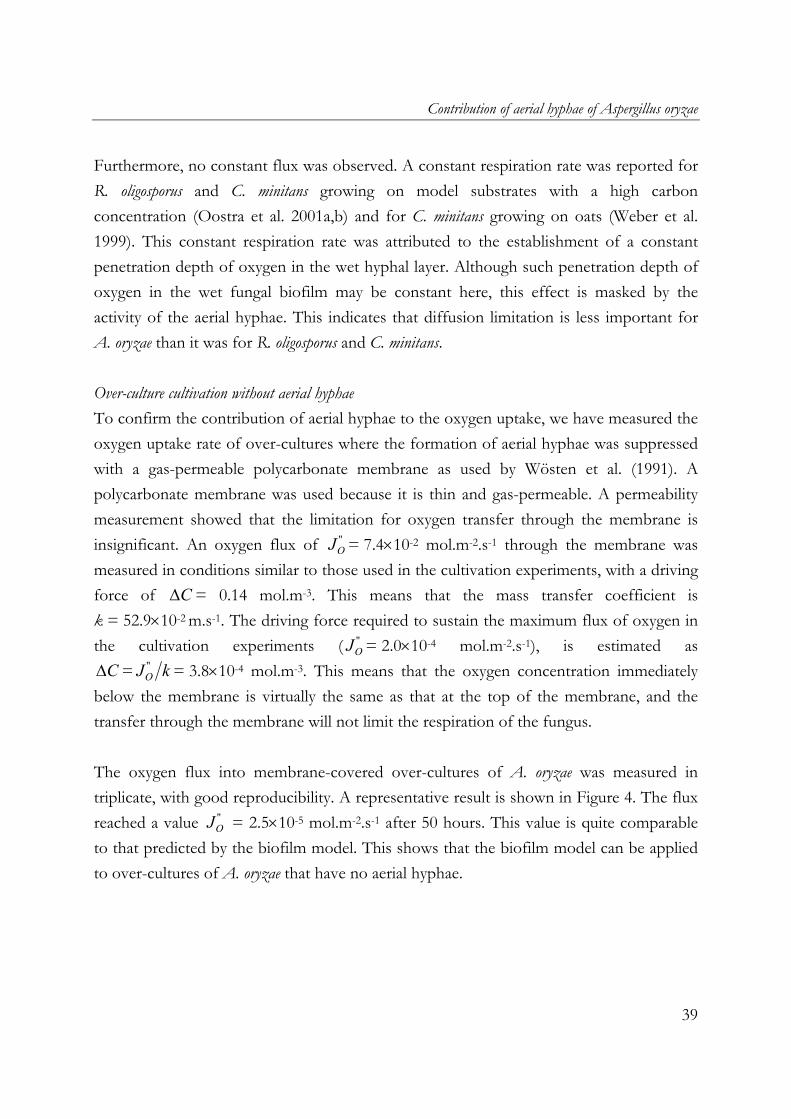
Chapter 3
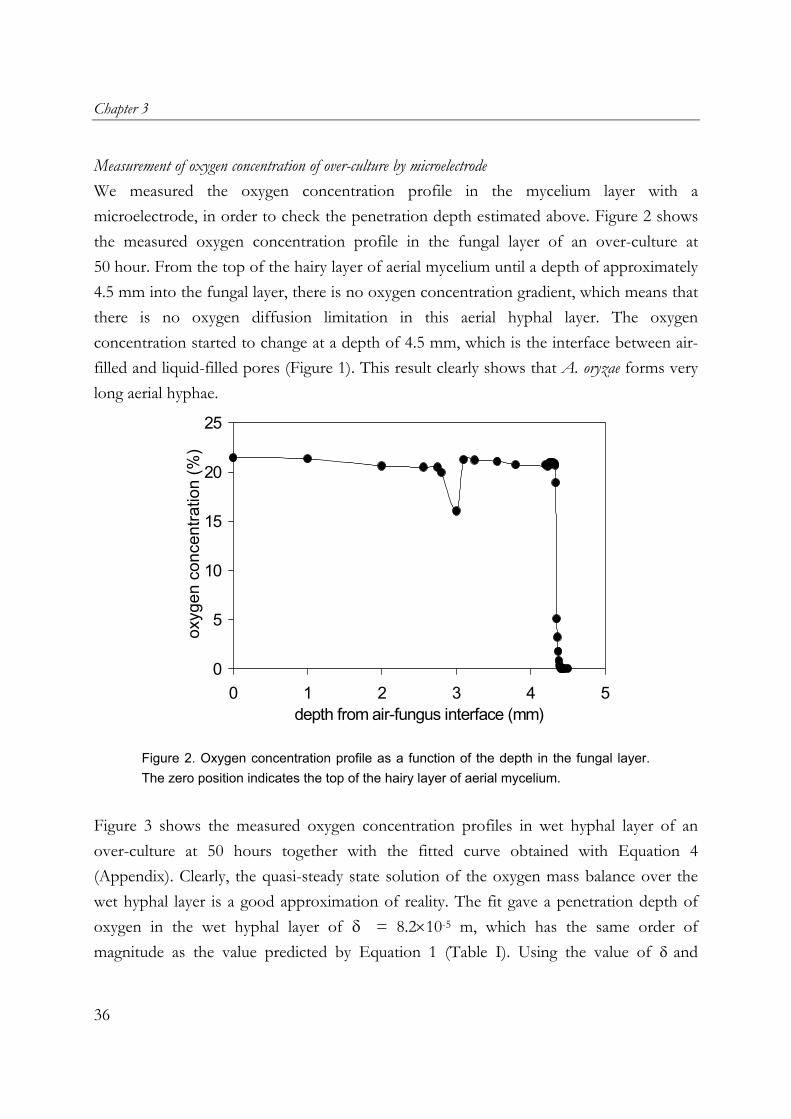
Measurement of oxygen concentration of over-culture by microelectrode We measured the oxygen concentration profile in the mycelium layer with a microelectrode, in order to check the penetration depth estimated above. Figure 2 shows the measured oxygen concentration profile in the fungal layer of an over-culture at 50 hour. From the top of the hairy layer of aerial mycelium until a depth of approximately 4.5 mm into the fungal layer, there is no oxygen concentration gradient, which means that there is no oxygen diffusion limitation in this aerial hyphal layer. The oxygen concentration started to change at a depth of 4.5 mm, which is the interface between air-filled and liquid-filled pores (Figure 1). This result clearly shows that A. oryzae forms very long aerial hyphae.
0
5
10
15
20
25
0 1 2 3 4 5depth from air-fungus interface (mm)
oxyg
en c
once
ntra
tion
(%)
Figure 2. Oxygen concentration profile as a function of the depth in the fungal layer. The zero position indicates the top of the hairy layer of aerial mycelium.
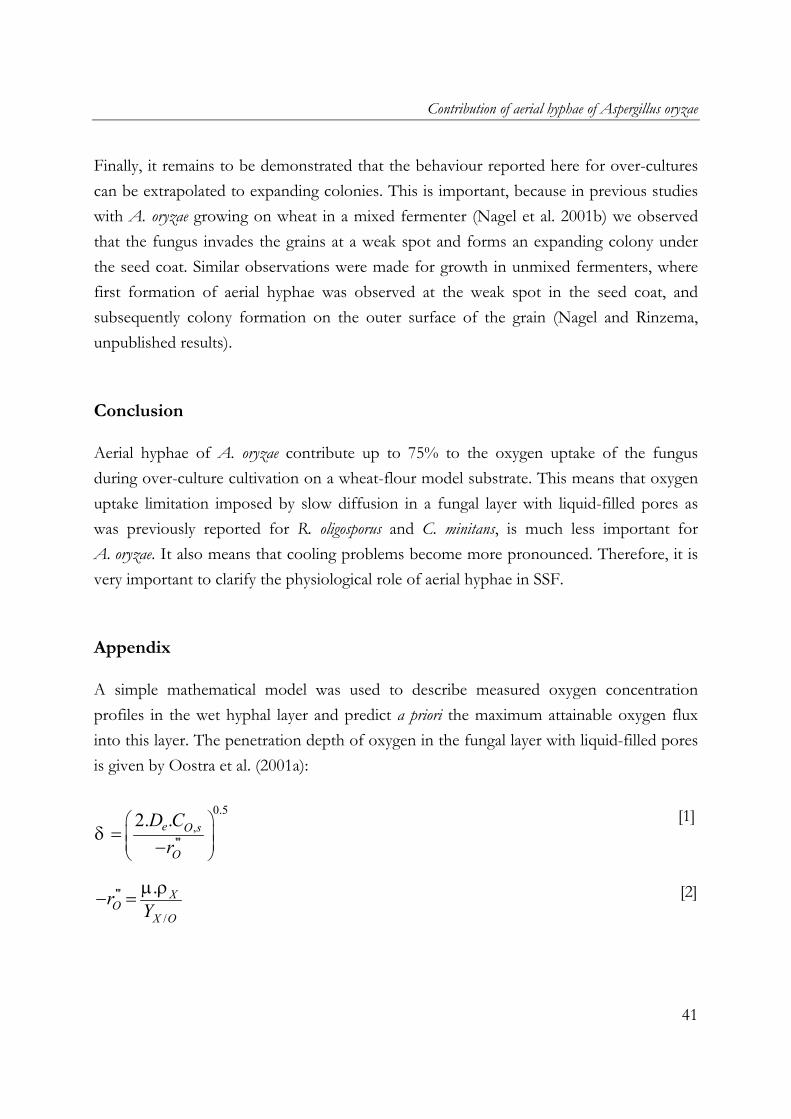
Figure 3 shows the measured oxygen concentration profiles in wet hyphal layer of an over-culture at 50 hours together with the fitted curve obtained with Equation 4 (Appendix). Clearly, the quasi-steady state solution of the oxygen mass balance over the wet hyphal layer is a good approximation of reality. The fit gave a penetration depth of oxygen in the wet hyphal layer of δ = 8.2×10⁻⁵ m, which has the same order of magnitude as the value predicted by Equation 1 (Table I). Using the value of δ and
36

Contribution of aerial hyphae of Aspergillus oryzae
Equations 1 and 3 (Appendix), the oxygen flux into this layer is calculated as = 2.0×10
"OJ
X
-5 mol.m-2.s-1.
-5
0
5
10
15
20
25
0 0.05 0.1 0.15 0.2 0.25
depth from air-liquid interface (mm)
oxyg
en c
once
ntra
tion
(%)
Figure 3. Fitted curve of an oxygen concentration profiles of an over-culture at 50 hours. Two experiments ( ) and ( ), which were used to fit Equation 3, are shown. Data points (o) were excluded from the fitting procedure. The zero position has been shifted from the top of the aerial hyphae to the interface between aerial hyphal and wet hyphal layer. The oxygen concentrations in the gas phase are shown as equilibrium values in the liquid phase at 35
oC.
The difference between the prediction of the model and the calculation of the experimental value for both penetration depth (δ ) and oxygen flux must be attributed to the fact that in the prediction we used high values for the parameters and that perhaps are not justified. However, the assumptions we used for both parameters are the most optimistic values. This means that the values predicted by the model are the lowest possible value for the penetration depth (δ ) and the highest possible value for the oxygen flux. This ideal condition probably can never be achieved in reality.
µ ρ
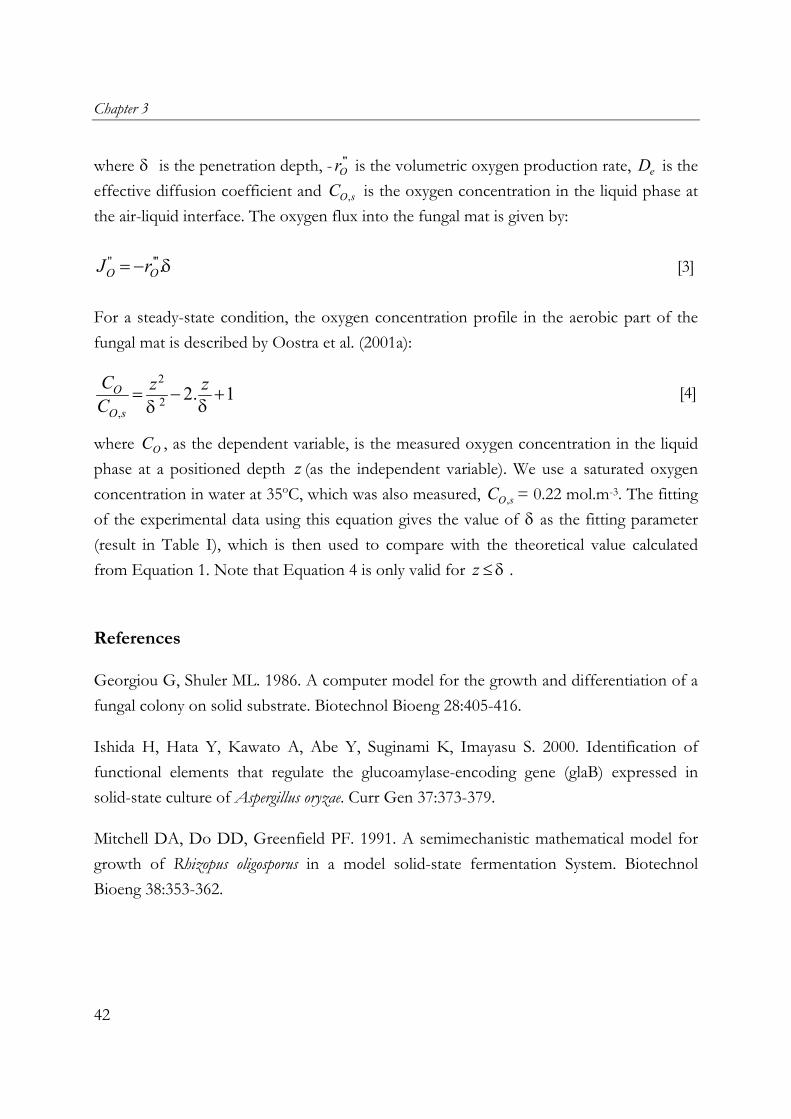
Over-culture cultivation The oxygen flux into over-cultures of A. oryzae on wheat discs was measured in triplicate, with good reproducibility. In Figure 4, a representative result is compared to the model
37
Chapter 3
prediction obtained above. Figure 4 indicates that oxygen uptake by aerial hyphae is extremely important during a large part of the cultivation. The measured flux is much higher than the values predicted by the biofilm model and calculated from microelectrode measurements. The prediction of the model provides the highest possible value for the oxygen flux into the wet fungal biofilm, and therefore the very high oxygen flux measured in the experiments cannot be due to errors in or of the wet hyphal layer. Moreover, at 50 hours, the flux through the aerobic wet hyphal layer calculated from microelectrode measurements was 2.0×10
µ Xρ
-5 mol.m-2.s-1. The overall oxygen flux measured after 50 hours was 8.0×10⁻⁵ mol.m-2.s-1 (Figure 4), i.e. four times higher than the flux estimated from the measured penetration depth. After 70 hours, the total oxygen flux of the over-culture is even higher, viz. 2.0×10⁻⁴ mol.m-2.s-1 (maximum value), which is ten times higher than the flux calculated from microelectrode measurements. This would mean that at 50 hours 75% of the respiration is due to aerial hyphae and after 70 hours over 90%.
0.0E+00
5.0E-05
1.0E-04
1.5E-04
2.0E-04
2.5E-04
0 50 100 150 200time (hours)
flux
O2 (
mol
.m-2
.s-1
)
Figure 4. Oxygen uptake rate of over-culture of A. oryzae in time (●●●), A. oryzae without aerial hyphae in time (solid line), and oxygen uptake rate predicted by the model (dashed line).
38
Contribution of aerial hyphae of Aspergillus oryzae
Furthermore, no constant flux was observed. A constant respiration rate was reported for R. oligosporus and C. minitans growing on model substrates with a high carbon concentration (Oostra et al. 2001a,b) and for C. minitans growing on oats (Weber et al. 1999). This constant respiration rate was attributed to the establishment of a constant penetration depth of oxygen in the wet hyphal layer. Although such penetration depth of oxygen in the wet fungal biofilm may be constant here, this effect is masked by the activity of the aerial hyphae. This indicates that diffusion limitation is less important for A. oryzae than it was for R. oligosporus and C. minitans. Over-culture cultivation without aerial hyphae To confirm the contribution of aerial hyphae to the oxygen uptake, we have measured the oxygen uptake rate of over-cultures where the formation of aerial hyphae was suppressed with a gas-permeable polycarbonate membrane as used by Wösten et al. (1991). A polycarbonate membrane was used because it is thin and gas-permeable. A permeability measurement showed that the limitation for oxygen transfer through the membrane is insignificant. An oxygen flux of = 7.4×10"
OJ
J
-2 mol.m-2.s-1 through the membrane was measured in conditions similar to those used in the cultivation experiments, with a driving force of = 0.14 mol.mC∆ -3. This means that the mass transfer coefficient is k = 52.9×10⁻² m.s-1. The driving force required to sustain the maximum flux of oxygen in the cultivation experiments ( = 2.0×10"
O-4 mol.m-2.s-1), is estimated as
=C∆ "OJ k= 3.8×10⁻⁴ mol.m-3. This means that the oxygen concentration immediately
below the membrane is virtually the same as that at the top of the membrane, and the transfer through the membrane will not limit the respiration of the fungus. The oxygen flux into membrane-covered over-cultures of A. oryzae was measured in triplicate, with good reproducibility. A representative result is shown in Figure 4. The flux reached a value = 2.5×10"
OJ -5 mol.m-2.s-1 after 50 hours. This value is quite comparable to that predicted by the biofilm model. This shows that the biofilm model can be applied to over-cultures of A. oryzae that have no aerial hyphae.
39

Chapter 3
Implications of the results
For fungi that form very abundant aerial mycelium, like A. oryzae, diffusion in the wet fungal layer covering the surface of the substrate particles does not limit the respiration rate. Instead, the amount of aerial mycelium is the rate-determining factor. This agrees very well with assumptions made in the modelling work of Nopharatana et al. (1998). Our results show that previous reports (Oostra et al. 2001a,b) on intra-particle oxygen transport in SSF do not present the whole story. Now that the importance of aerial hyphae for respiration has been demonstrated, this is not surprising. A. oryzae forms much more abundant aerial mycelium than C. minitans, regardless of the substrate used. R. oligosporus is an abundant aerial mycelium producer on grains and beans, but aerial hyphae formation was virtually absent on the media used in the studies of Oostra et al. (2001a). It would be interesting to re-examine the respiration of R. oligosporus using the more realistic wheat-flour model substrate, or a soybean-flour model substrate. It is important also to do experimental studies with other fungi that are known as aerial mycelium producers in order to determine the general validity of our results. For process control in SSF, the rapid respiration of aerial hyphae presents a serious problem, due to its proportionality to heat production. The intriguing question is of course what the physiological functions of aerial hyphae are, whether they make interesting metabolites or hydrolytic enzymes or perhaps supply oxygen to mycelium in the wet layer, i.e. act as the ‘lungs’ of fungal mycelium in SSF. If the aerial hyphae do not produce interesting enzymes or metabolites or facilitate production in the wet layer, it might be better to suppress their growth in order to reduce heat production. This can be achieved by using a mixed fermenter (Nagel et al. 2001b), in which no aerial hyphae were observed. If the aerial hyphae turn out to be important for production, it would be worthwhile to set up and validate models for aerial mycelium formation. As a basis, the model of Nopharatana et al. (1998) can be used. However, the real situation in SSF is more complex involving not only aerial hyphae formation in addition to a wet hyphal layer but also perhaps a situation in between. For this an extension of his model will be necessary.
40
Contribution of aerial hyphae of Aspergillus oryzae
Finally, it remains to be demonstrated that the behaviour reported here for over-cultures can be extrapolated to expanding colonies. This is important, because in previous studies with A. oryzae growing on wheat in a mixed fermenter (Nagel et al. 2001b) we observed that the fungus invades the grains at a weak spot and forms an expanding colony under the seed coat. Similar observations were made for growth in unmixed fermenters, where first formation of aerial hyphae was observed at the weak spot in the seed coat, and subsequently colony formation on the outer surface of the grain (Nagel and Rinzema, unpublished results).
Conclusion
Aerial hyphae of A. oryzae contribute up to 75% to the oxygen uptake of the fungus during over-culture cultivation on a wheat-flour model substrate. This means that oxygen uptake limitation imposed by slow diffusion in a fungal layer with liquid-filled pores as was previously reported for R. oligosporus and C. minitans, is much less important for A. oryzae. It also means that cooling problems become more pronounced. Therefore, it is very important to clarify the physiological role of aerial hyphae in SSF.
Appendix
A simple mathematical model was used to describe measured oxygen concentration profiles in the wet hyphal layer and predict a priori the maximum attainable oxygen flux into this layer. The penetration depth of oxygen in the fungal layer with liquid-filled pores is given by Oostra et al. (2001a):
[1]
0.5,
'''2. .e O s
O
D Cr
δ
=−
'''
/
. XO
X Or
Yµ ρ− = [2]
41
Chapter 3
where δ is the penetration depth, - is the volumetric oxygen production rate, is the effective diffusion coefficient and is the oxygen concentration in the liquid phase at the air-liquid interface. The oxygen flux into the fungal mat is given by:
'''Or
,O sCeD
" '''.O OJ r δ= − [3]
For a steady-state condition, the oxygen concentration profile in the aerobic part of the fungal mat is described by Oostra et al. (2001a):
[4]
2
2,
2. 1O
O s
C z zC δδ
= − +
where , as the dependent variable, is the measured oxygen concentration in the liquid phase at a positioned depth (as the independent variable). We use a saturated oxygen concentration in water at 35
OCz
oC, which was also measured, = 0.22 mol.m,O sC
δ≤
-3. The fitting of the experimental data using this equation gives the value of δ as the fitting parameter (result in Table I), which is then used to compare with the theoretical value calculated from Equation 1. Note that Equation 4 is only valid for . z
References
Georgiou G, Shuler ML. 1986. A computer model for the growth and differentiation of a fungal colony on solid substrate. Biotechnol Bioeng 28:405-416.
Ishida H, Hata Y, Kawato A, Abe Y, Suginami K, Imayasu S. 2000. Identification of functional elements that regulate the glucoamylase-encoding gene (glaB) expressed in solid-state culture of Aspergillus oryzae. Curr Gen 37:373-379.
Mitchell DA, Do DD, Greenfield PF. 1991. A semimechanistic mathematical model for growth of Rhizopus oligosporus in a model solid-state fermentation System. Biotechnol Bioeng 38:353-362.
42
Contribution of aerial hyphae of Aspergillus oryzae
Molin P, Gervais P, Lemière JP. 1993. A computer model based on reaction-diffusion equations for the growth of filamentous fungi on solid substrate. Biotechnol Progr 9:385-393.
Nagel FJI, Tramper J, Bakker MSN, Rinzema A. 2001a. Model for on-line moisture-content control during solid-state fermentation. Biotechnol Bioeng 72:231-243.
Nagel FJI, Tramper J, Bakker MSN, Rinzema A. 2001b. Temperature control in a continuously mixed bioreactor for solid-state fermentation. Biotechnol Bioeng 72:219-230.
Nandakumar MP, Thakur MS, Raghavarao KSMS, Ghildyal NP. 1996. Substrate particle size reduction by Bacillus coagulans in solid-state fermentation. Enz Microbial Technol 18:121-125.
Nopharatana M, Howes T, Mitchell DA. 1998. Modelling fungal growth on surfaces. Biotechnol Techn 12:313-318.
Oostra J, le Comte EP, van den Heuvel JC, Tramper J, Rinzema A. 2001a. Intra-particle oxygen diffusion limitation in solid-state fermentation. Biotechnol Bioeng 75:13-24.
Oostra J, le Comte EP, van den Heuvel JC, Tramper J, Rinzema A. 2001b. Quantification of oxygen transfer limtation during cultivation of Coniothyrium minitans on a solid substrate and its effect on growth and sporulation kinetics. Biotechnol Bioeng, Submitted.
Ottengraf SPP, Van den Heuvel JC. 1996. Microelectrodes. Willaert RG, Baron GV, De Backer L, editors. Immobilised living cell systems: Modelling and experimental methods. New York:John Wiley & Sons. pp.147-176.
Pandey A, Soccol CR, Mitchell DA. 2000. New developments in solid-state fermentation: I-bioprocesses and products. Proc Biochem 35:1153-1169.
Metz B, Kossen NWF. 1977. The growth of moulds in the form of pellets [in fermentation processes] - a literature review. Biotechnol Bioeng 19:781-799.
43

Chapter 3
44
Raimbault M. 1998. General and microbiological aspects of solid substrate fermentation. El J Biotechnol 1:1-15.
Rajagopalan S, Modak JM. 1995a. Evaluation of relative growth limitation due to depletion of glucose and oxygen during fungal growth on a spherical solid particle. Chem Eng Sci 50:803-811.
Rajagopalan S, Modak JM. 1995b. Modelling of heat and mass transfer for solid-state fermentation process in tray bioreactor. Bioproc Eng 13:161-169.
Revsbech NP, Ward DM. 1983. Oxygen microelectrode that is insensitive to medium chemical composition: Use in an acid microbial mat dominated by Cyanidium caldarium. Appl Environ Microbiol 45:755-759.
Spohr AB, Carlsen M, Nielsen J, Villadsen J. 1997. Morphological characterization of recombinant strains of Aspergillus oryzae producing α-amylase during batch cultivations. Biotechnol Lett 19:257-261.
Thibault J, Pouliot K, Agosin E, Pérez-Correa R. 2000. Reassessment of the estimation of dissolved oxygen concentration profile and KLa in solid-state fermentation. Proc Biochem 36:9-18.
Weber FJ, Tramper J, Rinzema A. 1999. A simplified material and energy balance approach for process development and scale-up of Coniothyrium minitans conidia production by solid-state cultivation in a packed-bed reactor. Biotechnol Bioeng 65:447-458.
Wessels JGH. 1999. Fungi in their own right. Fungal Genet Biol 27:124-145.
Wösten HAB, Moukha SM, Sietsma JH, Wessels JGH. 1991. Localization of growth and secretion of proteins in Aspergillus niger. J Gen Microbiol 137:2017-2023.
Chapter 4
Aerial mycelia of Aspergillus oryzae accelerate α-amylase production in a model solid-state fermentation system
Yovita SP Rahardjo, Frans J Weber, Sebastiaan Haemers, Johannes Tramper, Arjen Rinzema
Abstract
Aspergillus oryzae is commonly used in solid-state fermentation (SSF) and forms abundant aerial mycelia. Previously, we have shown that aerial mycelia are extremely important for the respiration of this fungus during growth on a wheat-flour model substrate. In this paper, we show that aerial mycelia of this fungus give a strong increase in fungal biomass and α-amylase production. Cultures of A. oryzae on wheat-flour model substrate produced twice the amounts of fungal biomass and α-amylase when aerial mycelia were formed. Utilization of these findings in commercial solid-state fermenters requires further research; results from packed beds of grain indicate that aerial mycelia are of limited importance there. Probably substrate pre-treatment and an increase in bed voidage are required. In addition, further research is required to improve our understanding of the physiological significance of aerial mycelia in SSF. Part of this chapter is In press in Enzyme Microb Technol.
45

Chapter 4
Introduction
Solid-state fermentation (SSF) has been used extensively for ages to produce oriental foods, such as koji and tempe (Raimbault 1998). Recently, a renewed interest in SSF has been documented for several reasons (Pandey et al. 2000): higher product concentrations can be obtained compared to submerged fermentation (Aidoo et al. 1982; Barrios-Gonzales et al. 1988; Lekha and Lonsane 1994), and certain products, like glucoamylase B (Ishida et al. 2000) or spores of biocontrol fungi (de Vrije et al. 2001), are only produced under SSF conditions. Filamentous fungi are the most suitable microorganisms for SSF, due to their relatively high tolerance to low water activities, their high potential to excrete hydrolytic enzymes and their morphology. Their morphology allows filamentous fungi to colonize and penetrate the solid substrate, which might partially compensate the lack of mixing in SSF. In previous studies, we proposed a conceptual representation of filamentous fungal growth on a solid substrate (Oostra et al. 2001; Rahardjo et al. 2002). The fungal layer is classified into a layer of aerial mycelia with air-filled pores, a layer of densely packed mycelia with liquid-filled pores, and a region with penetrating mycelia. Oxygen depletion occurs in the last two layers (Oostra et al. 2001; Rahardjo et al. 2002), which was shown to limit the macroscopic oxygen uptake rate and growth rate of the fungal mat for Coniothyrium minitans and Rhizopus oligoporus (Oostra et al. 2001; Oostra et al., unpublished results). However, we have also shown that fungi can apparently overcome this limitation by forming abundant aerial mycelia (Rahardjo et al. 2002). In cultures of Aspergillus oryzae on wheat flour model substrate, the macroscopic respiration rate increased by over a factor 7 when the fungus formed abundant aerial mycelia, compared to cultures in which aerial mycelia were suppressed by applying a gas-permeable membrane on top of the culture (Rahardjo et al. 2002). The increase in macroscopic respiration rate caused by aerial mycelia raises the question whether there is a concomitant increase in macroscopic growth rate and – more important – hydrolytic enzyme production rate. In this paper we show that aerial mycelia
46
Aerial mycelia accelerate α-amylase production
do increase the growth and α-amylase production rates in a culture of Aspergillus oryzae on wheat flour model substrate.
Materials and Methods
Micro-organism and substrate preparation
Aspergillus oryzae CBS570.64 was obtained from the Centraalbureau voor Schimmelcultures (CBS), Baarn, NL. Spores production and storage were described in Rahardjo et al. (2002). The preparation of sterile wheat flour discs from wheat grain was described in Rahardjo et al. (2002). The initial wet weight of each wheat flour disc was measured. The initial dry weight (IDM) of three wheat-flour discs was determined and this value was used to calculate the IDM of each wheat flour disc used in the experiments.
Fermentation experiments
The wheat flour discs were evenly inoculated or inoculated as overcultures (5.5 x 10⁴ spores/Petri) as described in Rahardjo et al. (2002). For the culture without aerial mycelia, a sterile polycarbonate membrane was laid on the inoculated wheat flour disc to suppress the formation of aerial mycelia. Two parallel experiments were performed with one batch of wheat flour discs and one batch of spore suspension. One experiment was used to measure the respiration rate; the other experiment was used to determine the biomass dry weight and the activity of α-amylase. Respiration rate measurement The set-up used to measure the respiration rate of each culture was described in Rahardjo et al. (2002). Biomass and α-amylase activity determination Petri dishes without lids, containing an inoculated wheat flour disc, were put on a tray in a closed Perspex chamber. The chamber was placed in a 35oC incubator and aerated at
47

Chapter 4
24 dm3.h-1 (Brooks flow meter, Brooks Instrument, Hatfield, PA, USA). The air was moistened using a bubble column filled with water at 35oC. The moistened air was filter-sterilized using a 0.2-µm hydrophobic membrane (Midisart 2000, Sartorius, Nieuwegein, The Netherlands) before it entered the chamber at the bottom. Two times per day, two Petri dishes were taken out of the chamber. One dish was used to determine biomass dry weight and the other was used for α-amylase determination. Biomass was peeled from the substrate using a scalpel and dried in an oven at 80oC until constant weight. The α-amylase activities in the biomass and substrate layers were determined separately. The biomass layer was peeled off the substrate, and both the substrate and biomass were stored at –80oC. The frozen biomass was powdered using a micro-dismembrator (B. Braun Biotech, Melsungen, Germany) and stored at –80oC before α-amylase determination. Biomass powder was suspended in 30 ml phosphate buffer (pH 7, 19% 0.1M citric acid monohydrate and 81% 0.2M di-sodium phosphate) per gram of powder, while keeping it on ice. The α-amylase activity was determined in the supernatant obtained after centrifugation (15300 rpm, 15 min, equal to 32 x g). About 0.6 gram of substrate was suspended in 30 ml phosphate buffer (see above) by grinding with an ultraturrax (Silverson L4R, Silverson Machine Ltd. Chesham Bucks, UK). From this mixture, 1.5 ml homogenate was centrifuged at 15300 rpm for 15 minutes and the supernatant was used for α-amylase determination. The α-amylase activity was determined using blocked p-nitrophenyl maltoheptaoside as substrate and excess levels of α-glucosidase (HR reagent, Megazyme, Wicklow, Ireland) (Rauscher et al., 1985). In the assay, 500 µl phosphate buffer pH 7 and 100 µl HR reagent were mixed in a cuvette and incubated in a water bath to adjust the temperature of the mixture to 35oC. After incubation, 100-µl (diluted) sample was added and mixed and the absorbance increase, which was due to the release of 4-nitrophenol, was measured at 405 nm in a spectrophotometer at 35oC (Beckman DU 640, Beckman Coulter, Fullertown, CA, USA). The activity of α-amylase in the samples was expressed in units per gram of initial substrate dry matter, using an extinction coefficient of 948 dm3.mol-1.mm-1 for 4-
48
Aerial mycelia accelerate α-amylase production
nitrophenol, measured under the conditions of the assay. One unit (U) of catalytic activity of α-amylase will liberate 1 µmol of 4-nitrophenol per minute under the assay conditions.
Results and Discussion
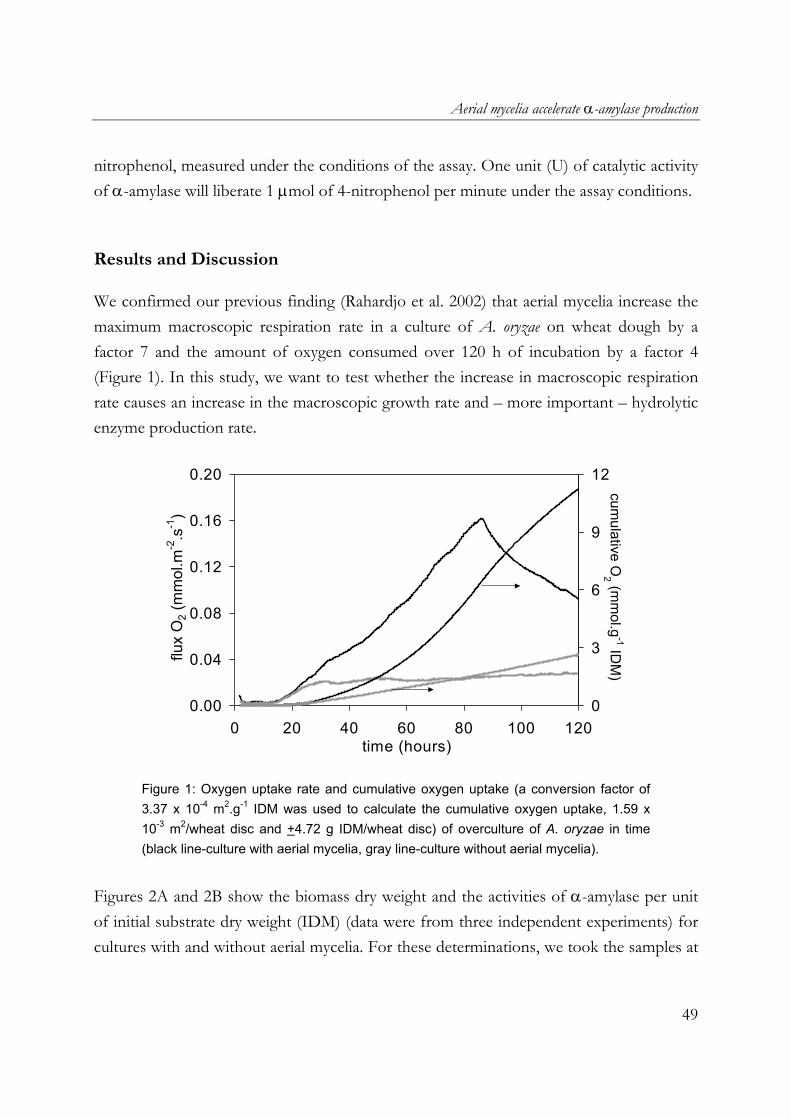
We confirmed our previous finding (Rahardjo et al. 2002) that aerial mycelia increase the maximum macroscopic respiration rate in a culture of A. oryzae on wheat dough by a factor 7 and the amount of oxygen consumed over 120 h of incubation by a factor 4 (Figure 1). In this study, we want to test whether the increase in macroscopic respiration rate causes an increase in the macroscopic growth rate and – more important – hydrolytic enzyme production rate.
0.00
0.04
0.08
0.12
0.16
0.20
0 20 40 60 80 100 120time (hours)
flux
O2 (
mm
ol.m
-2.s
-1)
0
3
6
9
12
cumulative O
2 (mm
ol.g-1 ID
M)
Figure 1: Oxygen uptake rate and cumulative oxygen uptake (a conversion factor of 3.37 x 10⁻⁴ m2.g-1 IDM was used to calculate the cumulative oxygen uptake, 1.59 x 10⁻³ m2/wheat disc and +4.72 g IDM/wheat disc) of overculture of A. oryzae in time (black line-culture with aerial mycelia, gray line-culture without aerial mycelia).
Figures 2A and 2B show the biomass dry weight and the activities of α-amylase per unit of initial substrate dry weight (IDM) (data were from three independent experiments) for cultures with and without aerial mycelia. For these determinations, we took the samples at
49

Chapter 4
random points in time in different experiments. The data points in figure 2A and 2B show that the trend of these measurements was quite reproducible.
0
2
4
6
8
10
0 20 40 60 80 100 12
biom
ass
(C m
mol
.g-1
IDM
) A
0
0
5
10
15
20
25
30
0 20 40 60 80 100 120time (hours)
α-a
myl
ase
activ
ity (U
.g-1
IDM
) B
Figure 2(A): Biomass dry weight per gram of initial substrate dry weight (data were from three independent batches) (◊ is for culture with aerial mycelia, o is for culture without aerial mycelia), (B): α-amylase activity per gram of initial substrate dry weight (data were from two independent batches) (empty symbols are for α-amylase in the substrate layer; full symbols are for total α-amylase activity) of overculture of A. oryzae on wheat flour disc in time.
The general trend is that the average biomass production rate and the average α-amylase production rate were higher in the cultures with aerial mycelia, in accordance with the respiration rates. Furthermore, the overall yield of α-amylase on substrate was also higher
50
Aerial mycelia accelerate α-amylase production
in the cultures with aerial mycelia. In the cultures with aerial mycelia, the biomass dry weight increased with a constant rate during the 115 hours of incubation, while the respiration rate increased until 87 hours and then declined, and the total α-amylase activity levelled off after 65 hours. These unrelated production rates of respiration, biomass and α-amylase require further studies. In the cultures without aerial mycelia, the biomass dry weight and the α-amylase activity remained constant after 40 hours, despite the fact that the respiration continued at a constant rate until 120 hours. This is not in agreement with the expected aerobic top layer with constant thickness in the wet fungal mat, which would result in constant macroscopic rates of respiration and growth (Oostra et al. 2001; Rahardjo et al. 2002). A possible explanation is that the constant oxygen uptake rate was used exclusively for maintenance in this cultivation. For both cultures, further research is needed to clarify the relationship between these macroscopic culture characteristics. The activities of α-amylase in the substrate layer and in the biomass layer were analysed separately. Comparable α-amylase activities were found in the substrate layer for the cultures with and without aerial mycelia (Figure 2B). In both cultures, the activity of α-amylase in the substrate layer remained almost constant during the fermentation. In the culture with aerial mycelia, the significant increase in total activity of α-amylase from 20 – 65 hours did not result in an increase in α-amylase activity in the substrate layer. At the end of the culture with aerial mycelia, almost 80% of the α-amylase was retained in the biomass layer and only about 20% of the α-amylase was recovered from the substrate layer. The diffusion of the enzyme from the biomass layer to the substrate layer seems to be slow, because the difference in activity remained large during the whole cultivation period. We have shown that aerial mycelia contribute to the increase in macroscopic growth rate and α-amylase production rate, in accordance with the increase in the respiration rate. As the biomass and α-amylase production rate in a culture with aerial mycelia is higher, the use of a production system that allows or promotes the formation of aerial mycelia would be advantageous. This would rule out continuously mixed fermenters, as aerial mycelia formation was completely suppressed during cultivation of A. oryzae in such a system
51

Chapter 4
(F.J.I. Nagel, personal communication). For wheat grain fermentation in non-mixed packed beds, we estimated the presence of aerial mycelia by comparing respiration rates to the rates found with the model substrate. Respiration rates of A. oryzae cultivated on wheat grain in non-mixed packed beds indicate that aerial mycelia formation is much less abundant, compared to our model substrate. Hoogschagen et al. (in prep.) found a maximum oxygen flux of only 0.024 mmol.m-2.s-1, which is approximately equal to the rate we found when aerial mycelia were suppressed in the model system. Probably two factors prohibit the formation of abundant aerial mycelia in non-mixed grain beds: 1. The seed coat of the grain, which was absent in our wheat-flour model system. With
whole wheat, Nagel et al. (2001a) observed that the fungus invades the grain at a weak spot and forms an expanding colony under the seed coat; the seed coat might act as a physical barrier to aerial mycelium formation, similar to the membrane applied in our model system.
2. A lack of void space. There was ample room for aerial mycelia formation above the wheat flour discs, but grains in a packed bed tend to leave only small spaces with a typical length scale <2 mm. This is incompatible with the thickness of the aerial mycelia layer of at least 4.5 mm observed on wheat flour discs (Rahardjo et al. 2002).
In order to promote aerial mycelia formation, substrate pre-treatment such as popping might be required and the void space would need to be increased. Mixing the grain with inert inorganic or poorly degradable organic spacers might provide extra space for aerial mycelia. Commercial solid-state fermentation plants usually have ample headspace available to allow the vertical bed expansion that would be required to maintain a constant amount of substrate on the available aeration area. It is also important to know whether we would be able to control the SSF process at the high oxygen consumption rate found in cultures with aerial hyphae. The respiration rate at 65 hours in our cultures with aerial mycelia was used to estimate the airflow rate required to maintain constant temperature, with the model of Weber et al. (1999). Assuming that the respiration rate is 1.1×10⁻⁴ mol O2.m-2.s-1, the specific surface area of a packed bed of wheat grain is 680 m2.m-3, the inlet temperature of the air is 33oC, the outlet temperature 35oC, and the bed height is 0.4 m, the required superficial air velocity is estimated at
52
Aerial mycelia accelerate α-amylase production
0.74 m.s-1. Note that this velocity remains the same if we increase the bed voidage and the bed height proportionally. This velocity is much higher than velocities used in commercial koji plants, which are around 0.1 m.s-1 (Nagel et al. 2002). The higher air velocity would increase the pressure drop significantly, unless we increase the void space. Process control also depends on the final water activity and volume loss. Based on the cumulative oxygen uptake of 0.0028 mol.g-1 IDM and biomass dry weight of 0.123 g.g-1 IDM found in the culture with aerial hyphae at 65 hours, we estimate the final water activity of the wheat after 65 hours at 0.99, using the model and parameter values of Nagel et al. (2001b; 2002). Based on the measured dry matter and water losses of 0.06 and 0.50 g.g-1 IDM, respectively, and data of Oostra et al. (2001), we expect 37% decrease in particle volume after 65 hours. At aw = 0.99 the growth rate of A. oryzae is still about 96% of the maximum growth rate (Gibson et al. 1994). Shrinkage of the substrate is therefore a more serious problem; it would lead to severe channeling and inadequate heat removal (Weber et al. 2002). If we want to avoid the detrimental effects of shrinkage, we should revert either to fermenter types that allow more conductive cooling and thereby reduce the evaporation, such as the Zymotis (Roussos et al. 1993) or the Plafractor (Suryanarayan and Mazumdar 2000), or to stabilization of the bed by using a stack of sieve plates with thin layers of substrate as proposed by Prophyta (Lüth and Eiben 1999) or by mixing the grain with relatively inert materials as is done in biofilters for off-gas cleaning and in organic waste composting. The latter solution comes close to that proposed for increasing the void space, and should therefore be studied first. Evidently, further research is needed to elucidate the factors limiting aerial mycelia development in packed beds of realistic substrates, and to adapt fermenters to promote formation of aerial mycelia and to cope with consequences caused by the high respiration rate of aerial mycelia. Based on our results, A. oryzae and its α-amylase activity could be used as the first example to test the contribution of aerial mycelia to respiration and production of enzymes in a real SSF system using wheat grain. It would also be interesting to test a broader range of products, such as proteases. As there are many more aerial mycelia-producing fungi used extensively in industry, such as A. niger and R. oligosporus, our observation can also be tested for those fungi with their specific products.
53
Chapter 4
Acknowledgment
The authors would like to thank Joseph Geerligs for his help with the experiments.
References
Aidoo KE, Hendry R, Wood BJB. 1982. Solid substrate fermentation. Adv Appl Microbiol 28:201-237.
Barrios-Gonzalez J, Tomasini A, Viniegra-Gonzalez G, Lopez J. 1988. Penicillin production by solid-state fermentation. Biotechnol Lett 10:793-798.
Gibson AM, Baranyi J, Pitt JI, Eyles MJ, Roberts TA. 1994. Predicting fungal growth: the effect of water activity on Aspergillus flavus and related species. Int J Food Microbiol 23:419-431.
Ishida H, Hata Y, Kawato A, Abe Y, Suginami K, Imayasu S. 2000. Identification of functional elements that regulate the glucoamylase-encoding gene (glaB) expressed in solid-state culture of Aspergillus oryzae. Curr Gen 37:373-379.
Lekha PK, Lonsane BK. 1994. Comparative titers, location and properties of tannin-acyl-hydrolase produced by Aspergillus niger PKL 104 in solid-state, liquid surface and submerged fermentations. Proc Biochem 29:497-503.
Lüth P, Eiben U. 1999. Solid-state fermenter and method for solid-state fermentation. World Patent no. WO 99/57239.
Nagel FJI, Tramper J, Bakker MSN, Rinzema A. 2001a. Temperature control in a continuously mixed bioreactor for solid-state fermentation. Biotechnol Bioeng 72:219-230.
Nagel FJI, Tramper J, Bakker MSN, Rinzema A. 2001b. Model for on-line moisture-content control during solid-state fermentation. Biotechnol Bioeng 72 :231-243.
54

Aerial mycelia accelerate α-amylase production
Nagel FJI. 2002. Process control of solid-state fermentation. Simultaneous control of temperature and moisture content. PhD thesis. Ch. 7. Wageningen University, Wageningen, The Netherlands.
Oostra J, le Comte EP, van den Heuvel JC, Tramper J, Rinzema A. 2001. Intra-particle oxygen diffusion limitation in solid-state fermentation. Biotechnol Bioeng 75:13-24.
Pandey A, Soccol CR, Mitchell DA. 2000. New developments in solid-state fermentation: I-bioprocesses and products. Proc Biochem 35:1153-1169.
Rahardjo YSP, Weber FJ, le Comte EP, Tramper J, Rinzema A. 2002. Contribution of aerial hyphae of Aspergillus oryzae to respiration in a model solid-state fermentation system. Biotechnol Bioeng 78:539-544.
Raimbault M. General and microbiological aspects of solid substrate fermentation. 1998. El J Biotechnol 1:1-15.
Rauscher E, Neumann U, Schaich E, von Bülow S, Wahlefeld AW. 1985. Optimized conditions for determining activity concentration of α-amylase in serum, with 1,4-α-D-4-nitrophenylmaltoheptaoside as substrate. Clin Chem 31:14-19.
Roussos S, Raimbaulat M, Prebois JP, Lonsane BK. 1993. Zymotis, a large-scale solid-state fermenter: design and evaluation. Appl Biochem Biotechnol 42:37-52.
Suryanarayan S, Mazumdar K. 2000. Solid-state fermentation. World Patent no. WO 00/29544.
de Vrije T, Antoine N, Buitelaar RM, Bruckner S, Dissevelt M, Durand A, Gerlagh M, Jones EE, Luth P, Oostra J. 2001. The fungal biocontrol agent Coniothyrium minitans: production by solid-state fermentation, application and marketing. Appl Microbiol Biotechnol 56:58-68.
Weber FJ, Tramper J, Rinzema A. 1999. A simplified material and energy balance approach for process development and scale-up of Coniothyrium minitans conidia
55
Chapter 4
56
production by solid-state cultivation in a packed-bed reactor. Biotechnol Bioeng 65:447-458.
Weber FJ, Oostra J, Tramper J, Rinzema A. 2002. Validation of a model for process development and scale-up of packed-bed solid-state bioreactors. Biotechnol Bioeng 77:381-393.
Chapter 5
Significance of bed porosity, bran and specific surface area in solid-state cultivation of Aspergillus oryzae
Yovita SP Rahardjo, Fenna Jolink, Sebastiaan Haemers, Johannes Tramper, Arjen Rinzema
Abstract
In this paper, we report the effects of bed porosity, bran and specific surface area on the oxygen uptake rate and α-amylase production during growth of Aspergillus oryzae on wheat grain and wheat-flour substrates. The high oxygen uptake rate found during cultivation of A. oryzae on wheat-flour model substrate was not reached on wheat grain. This is mainly due to the presence of the bran of the wheat grains. Using wheat-flour substrates, we showed that extra open space around the substrate increased the α-amylase production rate and oxygen uptake rate. Furthermore, the peak oxygen uptake rate decreased with the surface-area/volume ratio of the substrate particles, while the α-amylase production and the cumulative oxygen uptake per gram of initial substrate dry matter increased. The present work does not support a direct correlation between aerial mycelia and enzyme production. There is, however, a correlation between the α-amylase yield and the cumulative oxygen uptake (not the uptake rate) measured at the time when the α-amylase activity reached its maximum value. This implies that aerial mycelia could accelerate α-amylase production even if they do not increase the yield. Submitted for publication (Under review).
57
Chapter 5
Introduction
Oxygen supply into the layer of microbial cells covering the substrate particles is a major bottleneck in solid-state fermentation (SSF) (Thibault et al. 2000; Oostra et al. 2001). In previous work, we have shown that Aspergillus oryzae can apparently overcome this limitation by forming abundant aerial mycelia. During cultivation on model substrate (wheat-flour discs), the formation of aerial mycelia of this fungus increased the oxygen uptake rate by a factor 7 (Rahardjo et al. 2002) and the α-amylase production by a factor 2-3 (Rahardjo et al. In press). However, it appears that A. oryzae does not form abundant aerial mycelia during cultivation on wheat grain, as oxygen uptake rates in continuously mixed (Nagel et al. 2001a) and unmixed packed-bed fermenters (Hoogschagen, pers. comm.) were comparable to those in wheat-flour disc cultures in which aerial mycelia formation was prevented (Rahardjo et al. 2002). In continuously mixed fermenters, no aerial mycelia were observed at all (Nagel et al. 2001a), probably due to the shear. In packed-bed fermenters, there is no shear, but nevertheless oxygen uptake rates as well as the appearance of the fermented mass indicated that aerial mycelia were by far not as abundant as observed on wheat-flour disc model substrate. This study aims at elucidating the reasons for the limited aerial mycelia formation on grain, and at finding ways to promote their formation, and thereby perhaps speed up the fermentation process and increase enzyme yields. There are three significant differences between wheat-flour disc model substrate and wheat grain: (1) There is abundant open space available for the formation of aerial mycelia above the
wheat-flour disc. Open spaces in a packed bed of wheat grain have a typical length scale of ≤2 mm, which is smaller than the thickness of at least 4.5 mm of the aerial mycelial layer observed on wheat-flour discs (Rahardjo et al. 2002).
(2) Wheat-flour discs are not covered by a bran layer but grains are. Nagel (pers. comm.) observed that the fungus invades the grain at weak spots in the bran and forms an expanding colony under the bran. The bran might prevent the growth of aerial mycelia.
58
Significance of bed porosity, bran and specific surface area
(3) The surface area-volume ratio of wheat discs is much smaller than that of wheat grain. This ratio is very important in SSF (Mitchell et al. 1991; Nandakumar et al. 1996) because it determines the amount of substrate available per unit surface area and thus the maximum amount of microbial cells that can be formed per unit surface area.
In this study, the significance of these three factors for the oxygen uptake rate and α-amylase production of A. oryzae in SSF is reported and discussed.
Materials and Methods
Micro-organism
Aspergillus oryzae CBS570.64 was obtained from the Centraalbureau voor Schimmelcultures (CBS), Baarn, NL. Spores were produced by cultivation of the fungus on malt extract agar (Oxoid, Oxoid Limited, Hampshire, UK) at 30oC for 7 days, as described by Nagel et al. (2001b). Spore suspensions in 20% glycerol-80% water were stored at –80oC in 1-mL aliquots.
Substrate preparation and inoculation
Wheat grain substrate (WG substrate) One batch of commercial wheat grain was stored at room temperature and used for all experiments. The initial moisture content of the wheat grain was 0.12 + 0.1 kg kg-1 dry matter (DM). The wheat grain was soaked for 2.5 hours in an excess of demineralised water at 60oC. After sieving, the soaked grain was autoclaved for 1.5 hours at 121oC and allowed to cool down to room temperature. The final moisture content was 0.82 + 0.03 kg.kg-1 DM. The wheat grain was mixed with a spore suspension (1.1 x 10⁶ spores.ml-1) in an Erlenmeyer, to reach the spore concentration of 1.85 x 10⁴ spores.g-1 wheat DM. The
59

Chapter 5
Erlenmeyer was shaken thoroughly to ensure good distribution of the spores on the surface of the wheat grains. Wheat-flour substrates (WF substrates) Wheat-flour with granules of +0.08 mm diameter was produced with a Retsch mill (Retsch GmbH, Haan, Germany). The initial moisture content of the wheat-flour was 0.07 kg.kg-1 DM. Equal masses of wheat-flour (in DM) and demineralised water were homogeneously mixed. Sterile discs (∅ 45 mm, 1.5 and 5 mm thick) were prepared from this mixture as described by Nagel et al. (2001b). Different A/V ratios of wheat-flour substrates were obtained by varying the diameter and the height. From 5 mm-thick wheat-flour discs, wheat-flour discs with smaller diameters were made with the help of a sterilized funnel (∅ 10 and 25 mm). Table I shows different A/V ratios of inoculated wheat-flour substrates. The initial wet weight of all wheat-flour substrates used in the experiments was measured. The initial wet and dry weights of a few wheat-flour substrate slices/pellets (from the same batch used in the experiments) was also determined. These dry weights were used to calculate the dry matter of other wheat-flour substrates used in the experiments. The wheat-flour substrates were inoculated with spore suspension to reach an approximate spore concentration of 1.85 x 10⁴ spores.g-1 wheat DM. For wheat-flour substrates with diameter 45 mm, the inoculation was done as described by Rahardjo et al. (2002) using a sterile bent glass rod. For wheat-flour substrates with smaller diameters, inoculation was done as for the wheat grain substrate.
60
Significance of bed porosity, bran and specific surface area
Fermentation experiments
Fermenters types 1. Packed-bed fermenter (for wheat grain and wheat-flour substrates) A glass column (∅ 40 mm and 290-mm high) was used. A wire end (∅ 2mm, 275 mm height) with a single mesh tray (∅ 38 cm) at the desired height was placed inside the column to support the bed. During the experiments, there was at most 0.5oC temperature difference between the wall of the column and the middle of the bed and therefore possible effects due to temperature gradients in the bed were minimized. 2. Stacked-tray fermenter (for wheat grain substrate) A similar set-up as described above for the packed-bed fermenter was used, with more mesh trays attached to the wire end. The distance between the trays could be adjusted. During the experiment, distances of 10, 15 and 30 mm were used, which corresponded to 20, 15 and 8 trays, respectively. 3. Jar fermenter (for wheat grain and wheat-flour substrates with diameter smaller than 45 mm) A glass jar (∅ 120 mm and 180-mm high) and similar set-up of a wire end with trays (∅ 115 mm) was used. The distance used between the trays was 25 mm. 4. Small jar fermenter (for wheat-flour substrates with diameter 45 mm) A glass jar (∅ 120 mm, 70-mm high) as described in Rahardjo et al. 2002 was used. Oxygen uptake rate measurement For each culture, wheat grain and wheat-flour substrates were placed in closed and sterilized glass fermenters to measure oxygen uptake rates. The closed systems were aerated (range 3 - 12 dm3.h-1, depending on the amount of the substrate used) with humidified air and kept in a temperature-controlled cabinet at 35oC (Rahardjo et al. 2002). The packed-bed and the tray fermenters were placed in a water bath at 35oC. The outlet air was continuously analysed for oxygen (Xentra 4100 paramagnetic oxygen analyser, Servomex, Zoetermeer, The Netherlands).
61

Chapter 5
α-amylase activity determination For several cultures, at the end of the fermentation, fermented solids (a mixture of unconsumed substrate and fungal biomass) was taken from the fermenters, weighed and stored at –80oC. For some cultures, samples were taken during the fermentation. Since the bran of the wheat grains was very rigid, the wheat grain samples were mixed with liquid nitrogen in a mortar before they were ground in a coffee grinder. About 0.6 gram of the ground wheat or wheat-flour samples was suspended in 30 ml phosphate buffer (pH 7, 19% 0.1M citric acid monohydrate and 81% 0.2M di-sodium phosphate) by grinding with an ultraturrax (Silverson L4R, Silverson Machine Ltd. Chesham Bucks, UK), while keeping it on ice. From this mixture, 1.5 ml homogenate was centrifuged at 15300 rpm for 15 minutes and the supernatant was used for α-amylase determination. α-amylase activity was determined as described in Rahardjo et al. (2004).
Results
In this study, the effect of bed porosity, bran and specific surface area on oxygen uptake rate and α-amylase production during the cultivation of A. oryzae on wheat-flour disc model substrate and wheat grain was tested. The effect of the open space (porosity) in a wheat grain bed was studied using packed-bed fermenters, stacked-tray fermenters and jar fermenters. The effect of the bran on wheat grain was studied by comparing wheat grain (WG) to wheat-flour substrates (WF), using packed-bed and jar fermenters. The effect of the inoculated surface area-volume ratio was studied using different wheat-flour substrates in jar fermenters; the inoculated surface area-volume (A/V) ratio of the wheat-flour substrates (WF) was varied by changing the diameter and thickness of the substrates. Table I shows the dimensions and the A/V ratios of the different wheat-flour substrates; the number codes used for different substrates correspond to the A/V ratio (for example WF200 and WF800 is for wheat-flour substrates with inoculated A/V ratios of 200 and 800 m-1 respectively; WF200 is the wheat-flour disc model substrate used in a previous study (Rahardjo et al. 2002)). During all cultivations, the oxygen uptake rate and the activity of α-amylase in the fermented mass were measured. Some experiments were done
62

Significance of bed porosity, bran and specific surface area
max
imum
α-a
myl
ase
activ
ity
valu
e (U
.g-1
IDM
)
43.8
+ 2
.932
n.d
Figu
re 2
A 65
.7 +
5.0
73
n.d
22.2
8 +
1.75
2
n.d.
29
.47
45.2
7 +
4.96
3 45
.50
+ 3.
265
71.4
6
time
(h)
90
90
90
90
78
73-8
5d 52
46
60-7
0e
44
47
max
imum
flux
O2
valu
e (x
10-5
mol
.m-2
.s-1
)
2.5
2.5
2.5
2.9
19
16-2
0d
9.0
8.5
6.4
8.2
7.0
ferm
ente
r sy
stem
pack
ed-b
eda
mix
edb
tray
(1-3
cm
) ja
r
jar
jar
jar
jar
pack
ed-b
ed
jar
jar
A in
ocul
ated
/V
m-1
1090
100
200
490
560
800
1290
A in
ocul
ated
x
10-4
m2
15.9
15
.9
38.9
13
.7
3.14
34.1
6
thic
knes
s x
10-3
m
- 10
5 5 5 5
1.67
diam
eter
x
10-3
m
5.5
45
45
45
45
10
45
Tabl
e I.
Max
imum
flu
x O
2 an
d α
-am
ylas
e ac
tivity
of
subs
trate
s w
ith d
iffer
ent
inoc
ulat
ed s
urfa
ce a
rea-
volu
me
(A/V
) ra
tio (
+ st
anda
rdde
viat
ions
)
subs
trate
WG
WF1
00
WF2
00c
WF4
90
WF5
60
WF8
00
WF1
290
WG
: whe
at g
rain
sub
stra
te, W
F: w
heat
flou
r sub
stra
tes
a als
o ob
serv
ed b
y H
oogs
chag
en, p
ers.
com
m.
b obs
erve
d by
Nag
el e
t al.,
unp
ublis
hed
resu
lts
c from
Rah
ardj
o et
al.
2002
and
Rah
ardj
o et
al.
In p
ress
d v
aria
tion
from
diff
eren
t bat
ch o
f whe
at s
ubst
rate
s an
d sp
ore
susp
ensi
ons
e a ra
nge
whe
n th
e m
axim
um fl
ux O
2 sta
yed
cons
tant
2 a
vera
ge fr
om tw
o in
depe
nden
t exp
erim
ents
3 a
vera
ge fr
om th
ree
inde
pend
ent e
xper
imen
ts
5 ave
rage
from
five
inde
pend
ent e
xper
imen
ts
63

Chapter 5
in several replicates with good reproducibility for both oxygen uptake rate and α-amylase activity. For this reason, some other experiments were done in less replicates; the number of experiments done is indicated in the figure captions and Table I. Some results from replicate experiments are presented in the graphs (indicated in the figure captions), and some are not to avoid cluttering of graphs.
Wheat grain (WG) – Open space
During cultivation of A. oryzae on wheat-flour discs (WF200), the oxygen uptake rate reached a maximum value of 1.6 x 10⁻⁴ mol.m-2.s-1 when the fungus was allowed to form aerial mycelia; this was 7 times higher than the maximum rate in cultures without aerial mycelia (Rahardjo et al. 2002). This high oxygen uptake rate was not reached during the cultivation of A. oryzae on wheat grain in both continuously mixed and non-mixed packed-bed fermenters (Nagel et al. 2001b; Hoogschagen, pers. comm.). This might be due to a lack of open space in a packed grain bed. This hypothesis is supported by an observation reported by Schutyser et al. (2003): When A. oryzae was cultivated between two WF200s, the respiration rate decreased with a decreasing distance between the discs. We tested this hypothesis by varying the amount of open space surrounding the wheat grain. A stacked-tray fermenter with several one-grain-thick layers separated by air provided space in vertical direction only, while a jar fermenter ensured the maximum possible open space surrounding each individual wheat grain. Figure 1A shows the maximum oxygen uptake rates during cultivation of A. oryzae on wheat grain in different fermenter systems. More open space around the wheat grain did not significantly increase the maximum oxygen uptake rate. With increasing open space, maximum oxygen uptake rates remained comparable to the maximum oxygen uptake rate found in packed-bed fermenters, which in turn was equal to the maximum oxygen uptake rate observed on WF200 when the aerial mycelia were suppressed by applying a gas-permeable membrane on top of the culture (Rahardjo et al. 2002). Figure 1B shows the oxygen uptake rate during cultivation of A. oryzae on wheat grain in a jar, a stacked-tray fermenter with 30 mm distance between trays, and a packed-bed fermenter; stacked-tray fermenters with other tray arrangements had similar oxygen uptake rate profiles. More
64
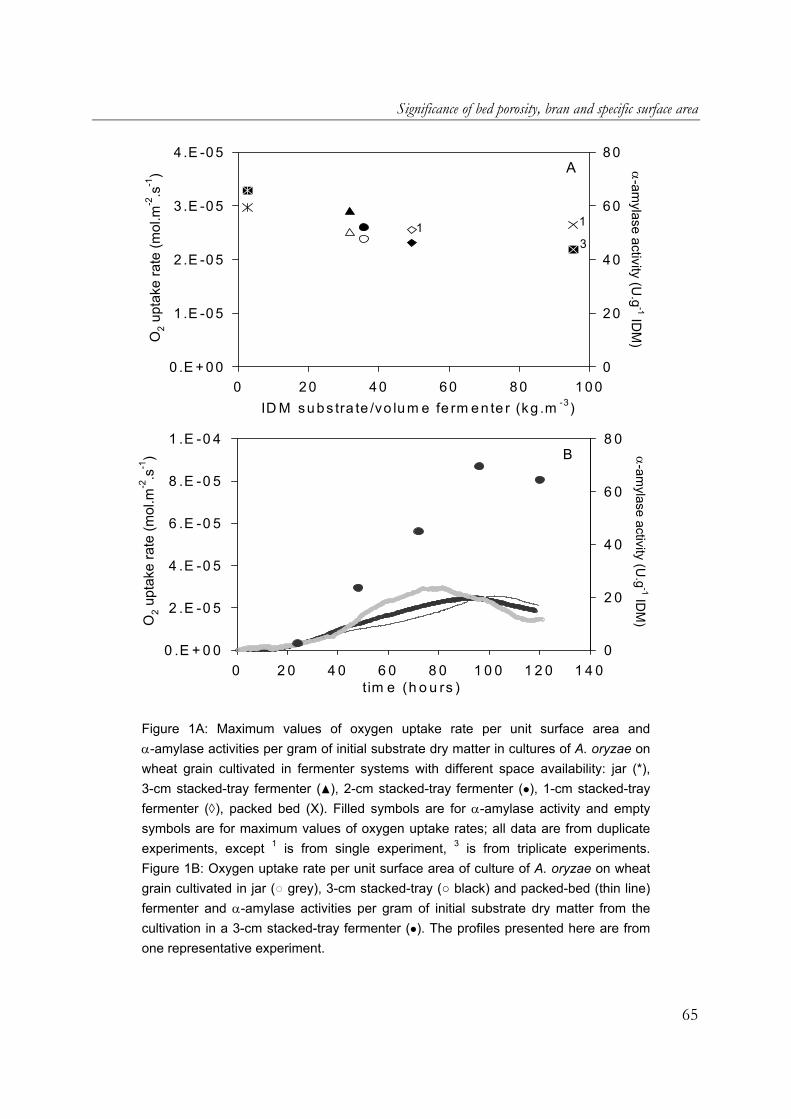
Significance of bed porosity, bran and specific surface area
113
0 .E + 0 0
1 .E -0 5
2 .E -0 5
3 .E -0 5
4 .E -0 5
0 2 0 4 0 6 0 8 0 1 00ID M su bs tra te /vo lu m e fe rm e n te r (kg .m -3)
O2 u
ptak
e ra
te (m
ol.m
-2.s
-1)
0
2 0
4 0
6 0
8 0α-am
ylase activity (U.g
-1 IDM
)A
0 .E + 0 0
2 .E -0 5
4 .E -0 5
6 .E -0 5
8 .E -0 5
1 .E -0 4
0 2 0 4 0 6 0 8 0 1 0 0 1 2 0 1 4 0tim e (h o u rs )
O2 u
ptak
e ra
te (m
ol.m
-2.s
-1)
0
2 0
4 0
6 0
8 0
α-amylase activity (U
.g-1 ID
M)
B
Figure 1A: Maximum values of oxygen uptake rate per unit surface area and α-amylase activities per gram of initial substrate dry matter in cultures of A. oryzae on wheat grain cultivated in fermenter systems with different space availability: jar (*), 3-cm stacked-tray fermenter (▲), 2-cm stacked-tray fermenter (•), 1-cm stacked-tray fermenter (◊), packed bed (X). Filled symbols are for α-amylase activity and empty symbols are for maximum values of oxygen uptake rates; all data are from duplicate experiments, except 1 is from single experiment, 3 is from triplicate experiments. Figure 1B: Oxygen uptake rate per unit surface area of culture of A. oryzae on wheat grain cultivated in jar (○ grey), 3-cm stacked-tray (○ black) and packed-bed (thin line) fermenter and α-amylase activities per gram of initial substrate dry matter from the cultivation in a 3-cm stacked-tray fermenter (•). The profiles presented here are from one representative experiment.
65
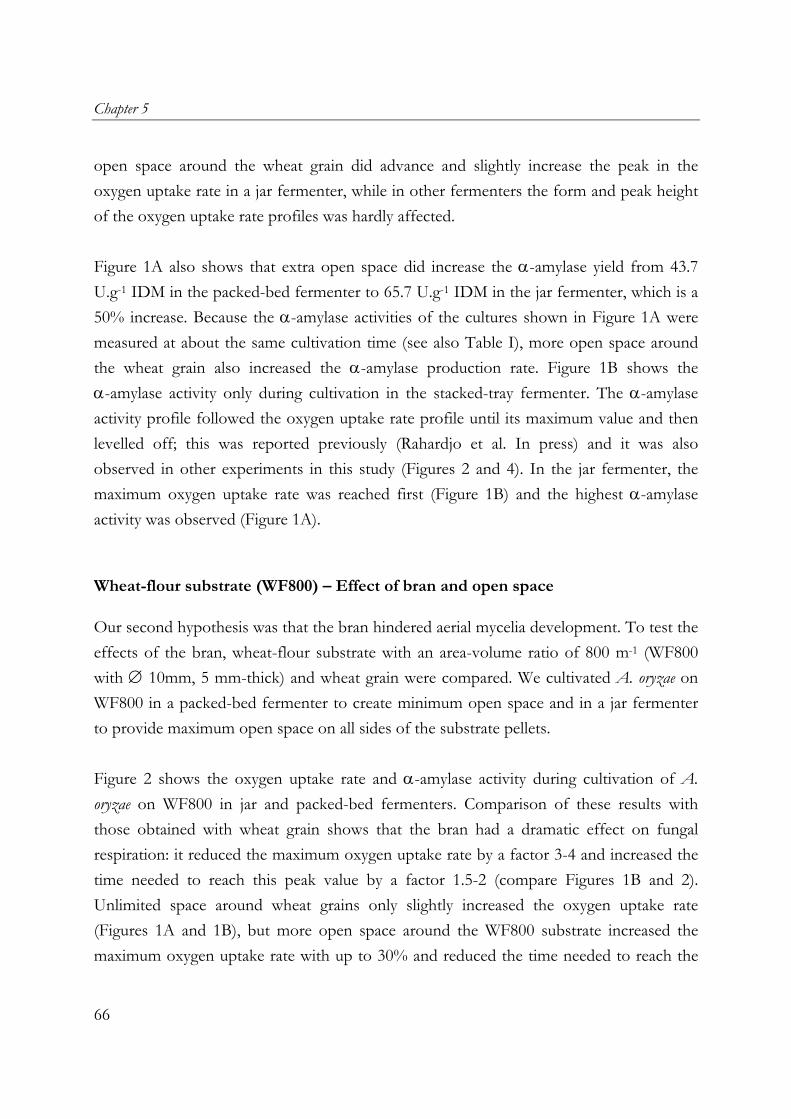
Chapter 5
open space around the wheat grain did advance and slightly increase the peak in the oxygen uptake rate in a jar fermenter, while in other fermenters the form and peak height of the oxygen uptake rate profiles was hardly affected. Figure 1A also shows that extra open space did increase the α-amylase yield from 43.7 U.g-1 IDM in the packed-bed fermenter to 65.7 U.g-1 IDM in the jar fermenter, which is a 50% increase. Because the α-amylase activities of the cultures shown in Figure 1A were measured at about the same cultivation time (see also Table I), more open space around the wheat grain also increased the α-amylase production rate. Figure 1B shows the α-amylase activity only during cultivation in the stacked-tray fermenter. The α-amylase activity profile followed the oxygen uptake rate profile until its maximum value and then levelled off; this was reported previously (Rahardjo et al. In press) and it was also observed in other experiments in this study (Figures 2 and 4). In the jar fermenter, the maximum oxygen uptake rate was reached first (Figure 1B) and the highest α-amylase activity was observed (Figure 1A).
Wheat-flour substrate (WF800) – Effect of bran and open space
Our second hypothesis was that the bran hindered aerial mycelia development. To test the effects of the bran, wheat-flour substrate with an area-volume ratio of 800 m-1 (WF800 with ∅ 10mm, 5 mm-thick) and wheat grain were compared. We cultivated A. oryzae on WF800 in a packed-bed fermenter to create minimum open space and in a jar fermenter to provide maximum open space on all sides of the substrate pellets. Figure 2 shows the oxygen uptake rate and α-amylase activity during cultivation of A. oryzae on WF800 in jar and packed-bed fermenters. Comparison of these results with those obtained with wheat grain shows that the bran had a dramatic effect on fungal respiration: it reduced the maximum oxygen uptake rate by a factor 3-4 and increased the time needed to reach this peak value by a factor 1.5-2 (compare Figures 1B and 2). Unlimited space around wheat grains only slightly increased the oxygen uptake rate (Figures 1A and 1B), but more open space around the WF800 substrate increased the maximum oxygen uptake rate with up to 30% and reduced the time needed to reach the
66
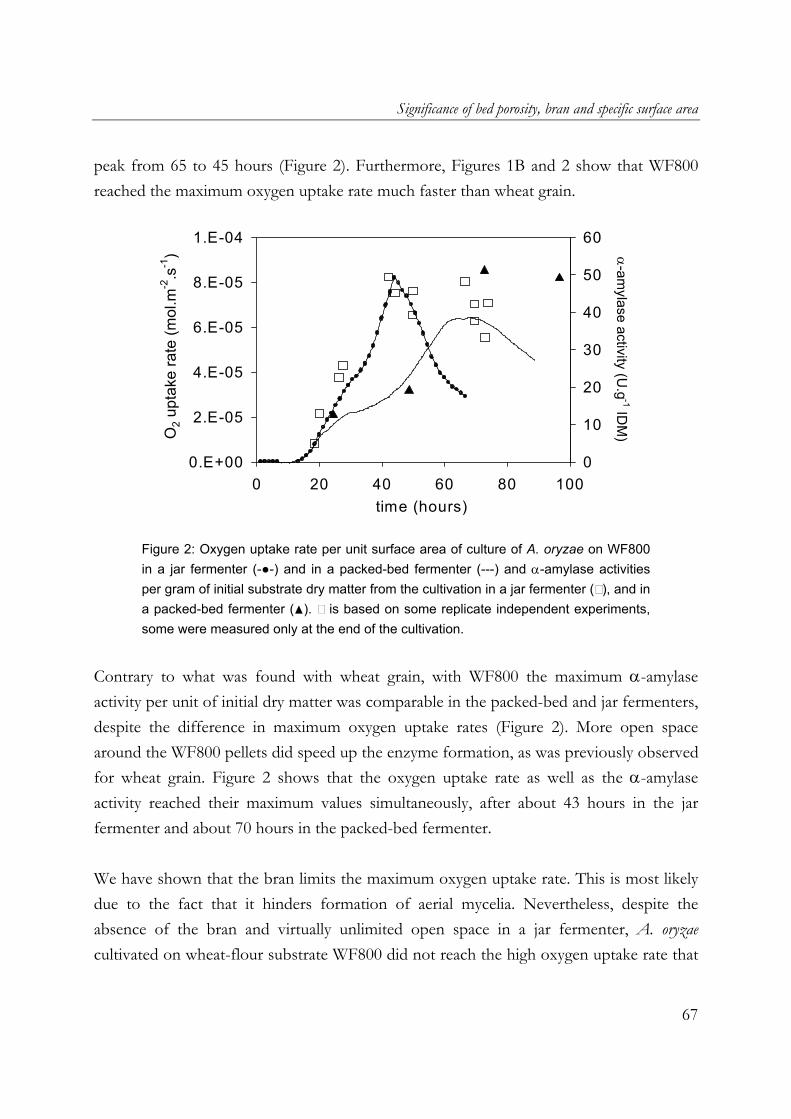
Significance of bed porosity, bran and specific surface area
peak from 65 to 45 hours (Figure 2). Furthermore, Figures 1B and 2 show that WF800 reached the maximum oxygen uptake rate much faster than wheat grain.
0.E+00
2.E-05
4.E-05
6.E-05
8.E-05
1.E-04
0 20 40 60 80 100time (hours)
O2 u
ptak
e ra
te (m
ol.m
-2.s
-1)
0
10
20
30
40
50
60
α-amylase activity (U
.g-1 ID
M)
Figure 2: Oxygen uptake rate per unit surface area of culture of A. oryzae on WF800 in a jar fermenter (-●-) and in a packed-bed fermenter (---) and α-amylase activities per gram of initial substrate dry matter from the cultivation in a jar fermenter ( ), and in a packed-bed fermenter (▲). is based on some replicate independent experiments, some were measured only at the end of the cultivation.
Contrary to what was found with wheat grain, with WF800 the maximum α-amylase activity per unit of initial dry matter was comparable in the packed-bed and jar fermenters, despite the difference in maximum oxygen uptake rates (Figure 2). More open space around the WF800 pellets did speed up the enzyme formation, as was previously observed for wheat grain. Figure 2 shows that the oxygen uptake rate as well as the α-amylase activity reached their maximum values simultaneously, after about 43 hours in the jar fermenter and about 70 hours in the packed-bed fermenter. We have shown that the bran limits the maximum oxygen uptake rate. This is most likely due to the fact that it hinders formation of aerial mycelia. Nevertheless, despite the absence of the bran and virtually unlimited open space in a jar fermenter, A. oryzae cultivated on wheat-flour substrate WF800 did not reach the high oxygen uptake rate that
67

Chapter 5
it reached on WF200 (Rahardjo et al. 2002; Table I). Table I also shows that the maximum α-amylase activity per unit of initial dry matter of the culture on wheat-flour substrates WF800 was higher than that of the culture on wheat-flour discs WF200. Furthermore, the cultivation on wheat grain had a higher total α-amylase yield per gram initial substrate dry matter than the cultures on WF800 (compare Figures 1B and 2) and WF200 (Table I).
Surface area of wheat-flour substrates
Our third hypothesis was that the geometry, i.e. the inoculated surface area-volume (A/V) ratio of the wheat-flour substrates determines the amount of substrate available per unit surface area and thus the maximum amount of microbial biomass and enzymes that can be formed per unit surface area. In order to examine the effect of the inoculated A/V ratio of the substrate on oxygen uptake and α-amylase production, jar fermenters and wheat-flour substrates with different A/V ratios were used. Figures 3A and 3B show the oxygen uptake rate and the cumulative oxygen uptake per unit surface area of WF substrates with different A/V ratios. Some results of the cultivation on WF substrates are not presented, because the profiles of the oxygen uptake rate as well as the cumulative oxygen uptake of these experiments were quite similar to those of WF800. The maximum values of the oxygen uptake rate and the time when these maximum values were reached are presented in Table I. Figures 3A and 3B and Table I show that the oxygen uptake rate and thus the cumulative oxygen uptake per unit substrate surface area were comparable during cultivation of A. oryzae on wheat-flour substrates with different A/V ratios, except for WF100 and WF200. The maximum oxygen uptake rate of the culture on WF200 was far higher than observed with the other substrates with different A/V ratios, and after 60 hours, the cumulative oxygen uptake per unit surface area of WF200 continued to increase rapidly while it levelled off in the other cultures. Table I shows that WF100 was similar to WF200; the oxygen uptake rate profile of WF100 was virtually identical to that of WF200 and is therefore not presented in Figures 3A and 3B to avoid cluttering of the graph.
68
Significance of bed porosity, bran and specific surface area
0.0E+00
4.0E -05
8.0E -05
1.2E -04
1.6E -04
2.0E -04
0 20 40 60 80 100 120
O2 u
ptak
e ra
te (m
ol.m
-2.s
-1) A
0
10
20
30
40
0 20 40 60 80 100 1
cum
ulat
ive
O2 (
mol
.m-2
)
B
2
0.E+00
2.E+04
4.E+04
6.E+04
8.E+04
0 20 40 60 80 100 120time (hours)
α-a
myl
ase
activ
ity (U
.m-2
) C 0
Figure 3A: Oxygen uptake rate per unit surface area, 3B: Total oxygen uptake per unit surface area of culture of A. oryzae on wheat grain WG (thick line) and on WF200 (thin line), WF490 (--), and WF800 (◊) (legends correspond to Table I), 3C: Total α-amylase activities per unit surface area of culture of A. oryzae on wheat grain WG (•), on WF200 (*), WF560 (X), WF800 (◊) and WF1290 (▲) (legends correspond to Table I).
69
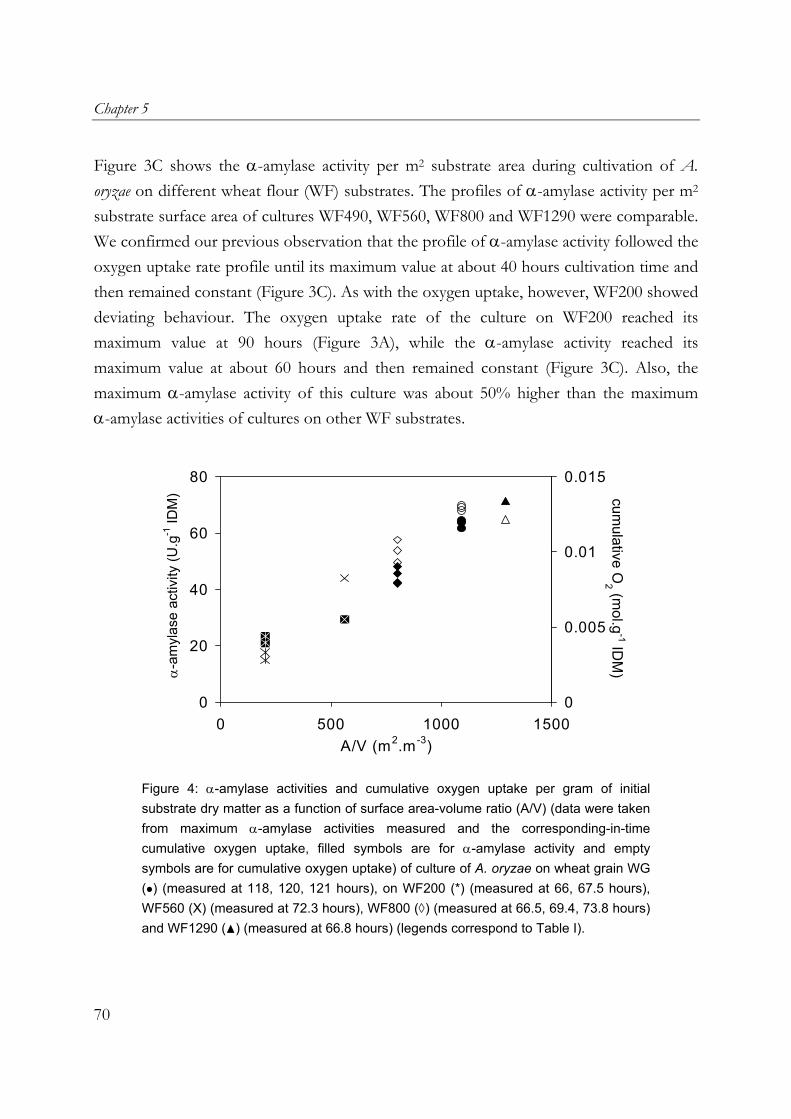
Chapter 5
Figure 3C shows the α-amylase activity per m2 substrate area during cultivation of A. oryzae on different wheat flour (WF) substrates. The profiles of α-amylase activity per m2 substrate surface area of cultures WF490, WF560, WF800 and WF1290 were comparable. We confirmed our previous observation that the profile of α-amylase activity followed the oxygen uptake rate profile until its maximum value at about 40 hours cultivation time and then remained constant (Figure 3C). As with the oxygen uptake, however, WF200 showed deviating behaviour. The oxygen uptake rate of the culture on WF200 reached its maximum value at 90 hours (Figure 3A), while the α-amylase activity reached its maximum value at about 60 hours and then remained constant (Figure 3C). Also, the maximum α-amylase activity of this culture was about 50% higher than the maximum α-amylase activities of cultures on other WF substrates.
0
20
40
60
80
0 500 1000 1500A/V (m2.m-3)
α-a
myl
ase
activ
ity (U
.g-1
IDM
)
0
0.005
0.01
0.015
cumulative O
2 (mol.g
-1 IDM
)
Figure 4: α-amylase activities and cumulative oxygen uptake per gram of initial substrate dry matter as a function of surface area-volume ratio (A/V) (data were taken from maximum α-amylase activities measured and the corresponding-in-time cumulative oxygen uptake, filled symbols are for α-amylase activity and empty symbols are for cumulative oxygen uptake) of culture of A. oryzae on wheat grain WG (•) (measured at 118, 120, 121 hours), on WF200 (*) (measured at 66, 67.5 hours), WF560 (X) (measured at 72.3 hours), WF800 (◊) (measured at 66.5, 69.4, 73.8 hours) and WF1290 (▲) (measured at 66.8 hours) (legends correspond to Table I).
70
Significance of bed porosity, bran and specific surface area
Figure 4 shows α-amylase activities and cumulative oxygen uptake per gram of initial substrate dry matter as a function of inoculated surface area-volume (A/V) ratio. Table I suggests and Figure 4 confirms that the α-amylase activity and the cumulative oxygen uptake per gram of initial substrate dry matter were roughly proportional to the A/V ratio. The values for the α-amylase activity and cumulative oxygen uptake were taken at the same time in the cultivation. This also means that the yield of α-amylase on oxygen for wheat substrates with different A/V ratios is about constant. The constant yield of α-amylase on oxygen for wheat substrates with different A/V ratios was also valid for wheat grain, but the cultivation on wheat grain took much longer to reach the maximum α-amylase activity and oxygen uptake rate, due to the bran (Figures 3A and 3C).
Discussion
The reason for this study was the observed discrepancy in maximum oxygen uptake rate per m2 substrate surface area, between wheat-flour discs and wheat grain beds. By comparing wheat grain and wheat-flour substrates of similar size, we have now shown that an important reason for this discrepancy is the bran covering the wheat grain. The bran clearly impeded the growth of the fungus, resulting in lower respiration rates, smaller quantities of aerial mycelia and slower enzyme production. This is in agreement with results of Blandino et al. (2002) who compared cultivation of Aspergillus awamori on whole-wheat grain and milled wheat grain. The bran contains cellulose and is meant to be a physical barrier protecting the grain against (fungal) parasites. Due to the pre-treatment, however, the grains swelled and the bran started to burst, leaving some open spots. The fungus penetrated the bran at those spots and colonised the endosperm by growing under the bran. The bran then prevented protrusion of aerial mycelia all over the grain surface; this situation is very likely comparable to that of a fungal culture growing on a wheat-flour disc while being covered with a polycarbonate membrane which prevents formation of aerial mycelia (Rahardjo et al. 2002). This implies that the bran of grain or beans should be removed or opened up, as it is in some soy sauce factories where grain is puffed before it is used in SSF and in tempe
71
Chapter 5
factories where beans are dehulled. Removal of the bran can however cause undesirable loss of substrate firmness, which may limit the bed height and give problems with mixing, as is evident in the processes mentioned above. Further studies are needed to derive guidelines for optimisation of reaction rate versus fermenter design and process control. This study also shows that another factor contributed to the observed discrepancy between wheat-flour discs and wheat grain: Smaller particles, with a larger surface area-volume (A/V) ratio, were shown to give lower maximum oxygen uptake rates, even in the absence of a bran layer. Cultivation of A. oryzae on wheat-flour substrates with A/V ≥ 490 m-1 gave a much lower maximum oxygen uptake rate than cultivation on wheat-flour discs with A/V ≤ 200 m-1. This is probably related to the decrease in nutrient reservoir with increasing A/V ratio, which limits the amount of aerial mycelia formed and thus the oxygen uptake rate. The relationship between A/V ratio and (maximum) oxygen uptake rate needs further study, however, because the maximum oxygen uptake rate was not truly proportional to the A/V ratio, but rather showed an abrupt shift between 200 and 490 m-1. A strong correlation between α-amylase yield and cumulative oxygen uptake on one side and A/V ratio on the other has been found in this study. Smaller particles consistently gave more α-amylase and the ratio between α-amylase produced and oxygen consumed was virtually constant. This finding implies that small or porous substrate particles should be used to maximize enzyme yield, as is current practice in some soy sauce factories. The underlying mechanisms and potential drawbacks of small particles (i.e. small pores easily become water logged, poor oxygen supply and high pressure drop in aerated beds) require further study. The third factor studied, i.e. open space (bed porosity), contributed little to the previously observed discrepancy between maximum respiration rates on wheat-flour discs and wheat grain, but it did increase the yield of α-amylase production on wheat grain and it allowed the maximum oxygen uptake rate to be reached sooner and α-amylase to be produced faster in all cultures. More open space hardly increased the maximum oxygen uptake rate of A. oryzae cultivated on wheat grain. Visual observation indicated that aerial mycelia
72

Significance of bed porosity, bran and specific surface area
formation on wheat grain could be promoted, although not as abundant as was previously observed on wheat-flour discs (Rahardjo et al. 2002), by creating more open space in a packed-bed. However, the observed aerial mycelia formation did not result in significantly higher oxygen uptake rates, probably due to the other two factors discussed above. On the other hand, more open space did accelerate the fermentation and increase the yield of α-amylase on wheat grain. This suggests that more porous beds should be used for packed-bed SSF. Most industrial packed-bed fermenters have ample empty headspace available to allow for an increase in bed porosity while maintaining the same substrate load per square meter aeration area. In our previous studies (Rahardjo et al. 2002 and In press), aerial mycelia formation was found to be significant for the peak oxygen uptake (rate) and α-amylase production of A. oryzae on wheat-flour discs. The present work, however, does not support a direct correlation between aerial mycelia and enzyme production. We did find a correlation, however, between the α-amylase yield and the cumulative oxygen uptake (not the uptake rate) measured at the time when the α-amylase activity reached its maximum value. This implies that aerial mycelia, which were shown to accelerate fungal growth and cumulative oxygen uptake (Rahardjo et al. 2002 and In press), could accelerate α-amylase production even if they do not increase the yield. Interesting topics for further research are i.e. the topology of enzyme production in SSF, and the carbon sources used by the tips of long aerial mycelia. The role of aerial mycelia in general requires further study; we are convinced that their role is not only to produce spores.
Conclusion
We have studied the effect of three significant differences between wheat-flour disc model substrates and wheat grain on the oxygen uptake rate and α-amylase production of A. oryzae in SSF: (1) Open space around the substrate particles increases the oxygen uptake and α-amylase production rates, (2) The cumulative oxygen uptake and α-amylase production per gram of initial substrate dry matter is positively correlated to the A/V ratio of the substrate particles, and (3) A bran layer at the outside of the wheat grain
73
Chapter 5
delays the fermentation. The results suggest that it might be worthwhile to increase the porosity of packed-bed fermenters, use smaller or more porous substrate particles, and remove the bran. Further research should address practical means of achieving this, while avoiding drawbacks such as water-logging of pores, high pressure drops, and compression of substrate layers. To improve the performance of SSF in general, the above factors should be adequately adjusted according to the specific fungi and substrates used. Finally, the study shows that the previously (Rahardjo et al. In press) suggested relationship between aerial mycelia and enzyme yield is not so straightforward. Further studies are needed to elucidate the role of aerial mycelia in SSF, as well as the physiology and topology of enzyme formation.
References
Blandino A, Iqbalsyah T, Pandiella SS, Cantero D, Webb C. 2002. Polygalacturonase production by Aspergillus awamori on wheat in solid-state fermentation. App Microbiol Biotechnol 58:164-169.
Mitchell DA, Do DD, Greenfield PF. 1991. A semi mechanistic mathematical model for growth of Rhizopus oligosporus in a model solid-state fermentation system. Biotechnol Bioeng 38:353-362.
Nagel FJI, Tramper J, Bakker MSN, Rinzema A. 2001a. Temperature control in a continuously mixed bioreactor for solid-state fermentation. Biotechnol Bioeng 72:219-230.
Nagel FJI, Tramper J, Bakker MSN, Rinzema A. 2001b. Model for on-line moisture-content control during solid-state fermentation. Biotechnol Bioeng 72:231-243.
Nandakumar MP, Thakur MS, Raghavarao KSMS, Ghildyal NP. 1996. Substrate particle size reduction by Bacillus coagulans in solid-state fermentation. Enz Microbiol Technol 18:121-125.
74
Significance of bed porosity, bran and specific surface area
75
Oostra J, le Comte EP, van den Heuvel JC, Tramper J, Rinzema A. 2001. Intra-particle oxygen diffusion limitation in solid-state fermentation. Biotechnol Bioeng 75:13-24.
Rahardjo YSP, Weber FJ, le Comte EP, Tramper J, Rinzema A. 2002. Contribution of aerial hyphae of Aspergillus oryzae to respiration in a model solid-state fermentation system. Biotechnol Bioeng 78:539-544.
Rahardjo YSP, Korona D, Haemers S, Weber FJ, Tramper J, Rinzema A. 2004. Limitations of membrane cultures as a model solid-state fermentation system. Lett Appl Microbiol 39:504-508.
Rahardjo YSP, Weber FJ, Haemers S, Tramper J, Rinzema A. Aerial mycelia of Aspergillus oryzae accelerate α-amylase production in a model solid-state fermentation system. Enzyme Microb Technol In press.
Schutyser MAI, de Pagter P, Weber FJ, Briels WJ, Boom RM, Rinzema A. 2003. Substrate aggregation due to aerial hyphae during discontinuously mixed solid-state fermentation with A. oryzae: Experiments and Modelling. Biotechnol Bioeng 83:503-513.
Thibault J, Pouliot K, Agosin E, Perez-Correa R. 2000. Reassessment of the estimation of dissolved oxygen concentration profile and KLa in solid-state fermentation. Proc Biochem 36:9-18.

Chapter 6
Effect of low oxygen concentrations on growth and α-amylase production of Aspergillus oryzae in model solid-state fermentation systems
Yovita SP Rahardjo, Susana Sie, Frans J Weber, Johannes Tramper, Arjen Rinzema
Abstract
Oxygen transfer in the fungal mat is a major concern in solid-state fermentation (SSF). Oxygen supply into the mycelial layers is hampered by diffusion limitation. For aerobic fungi, like Aspergillus oryzae, this oxygen depletion can be a severely limiting factor for growth and metabolite production. This paper describes the effects of a low oxygen concentration on growth at the levels of individual hyphae, colonies and overcultures, and on α-amylase production in overcultures. PDA medium was used to study the effect of a low oxygen concentration on hyphal elongation rate and branching frequency of hyphae, and radial extension rate of colonies of A. oryzae. We found similar saturation constants (KO2) of 0.1% (v/v in the gas phase) for oxygen concentration described with Monod kinetics, for branching frequency of hyphae and colony extension rate. When A. oryzae was grown as an over-culture on wheat-flour model substrate at 0.25% (v/v) oxygen concentration, the reduction in growth was more pronounced than as individual hyphae and a colony on PDA medium. Experimental results also showed that the specific α-amylase production rate under the condition of 0.25% (v/v) oxygen was reduced. Because the value of KO2 is relatively low, it is reasonable to simplify the kinetics of growth of A. oryzae to zero-order kinetics in coupled diffusion/reaction models. Biomol Eng 2005;21:163-172.
77
Chapter 6
Introduction
Solid-state fermentation (SSF) has been used for decades to convert moist agricultural polymeric substrates like wheat, rice, soy, cassava, etc. into fermented food products. Recently, it has been claimed that certain products, such as glucoamylase B (Ishida et al. 2000) and spores of biocontrol fungi (de Vrije et al. 2001), can only be produced under SSF conditions. SSF can also give higher yields of certain enzymes, such as amylases and proteases (Lambert 1983; Lekha and Lonsane 1994), compared to submerged fermentation (SmF). However, scaling-up and control of SSF are still difficult because biochemical engineering aspects are poorly understood. Oxygen transfer in the fungal mat, for example, is a major concern in SSF (Thibault et al. 2000; Oostra et al. 2001). Oxygen supply into the mycelia on the surface of or inside the substrate is hampered by diffusion limitation (Oostra et al. 2001; Rahardjo et al. 2002), which is caused by the presence of liquid-filled pores in a densely packed mycelium layer that is formed close to the substrate surface (Figure 1). We have previously shown that oxygen is depleted below 80 - 100 µm in the wet mycelium layer when fast-growing fungi are cultivated on SSF model-substrates (Oostra et al. 2001; Rahardjo et al. 2002). For aerobic fungi, like Aspergillus oryzae, this oxygen depletion would be a severe limiting factor for growth and metabolite production. Since the whole SSF process is very complex, it would be helpful to use models to understand SSF and eventually design better substrate properties and fermenters. As has been proposed by Mitchell et al. (1991); Rajagopalan and Modak (1995); Nandakumar et al. (1996); Rajagopalan et al. (1997); Nopharatana et al. (1998); and Oostra et al. (2001), coupled diffusion/reaction models can be used to describe events in the fungal mat. However, little is known about the sensitivity of A. oryzae to the oxygen concentration. For coupled diffusion/reaction models, it is important to use suitable reaction kinetics. The models would become much simpler and can be solved analytically, if zero-order kinetics can be used because the Monod constant for oxygen is relatively low.
78

Effect of low oxygen concentrations
A. oryzae is an example of filamentous fungi, which are broadly used in SSF. At the microscopic level, the growth of filamentous fungi is basically a continuous elongation process at the tips of hyphae while at the same time along the hyphae new branches are formed (Figure 1). Fungal growth is thus expressed in hyphal elongation rate together with a hyphal growth unit, which describes the branching frequency. At a later stage or at
hypha
substrate
biofilm
hyphae
colonies
pores, filled with liquid
branches
tips
spore
colony
Figure 1: Mode of growth of filamentous fungi, development of a spore to fungal biomass. Hyphal growth unit is the ratio of total hyphal length to the number of tips.
79
Chapter 6
the macroscopic level, nets of hyphae form a colony and fungal growth can be expressed in the radial extension rate (Trinci 1971). When more colonies come together, like in fungal cultivation in fermenters, this radial growth rate cannot be used anymore and growth is generally expressed as the increase in biomass dry weight. In this type of SSF, a polymeric substrate, like wheat, is commonly used. The starch in the substrate has to be converted to glucose before the fungus can utilise it. For this purpose, the fungus secretes hydrolytic enzymes, such as amylases and therefore the growth is also dependent on the production of these enzymes. In this paper, we show the effects of a low oxygen concentration on the growth and α-amylase production of A. oryzae. We studied the effect on the hyphal elongation rate and branching frequency of young mycelia, on the radial growth rate of fungal colonies, and on the biomass and enzyme production rates of over-cultures.
Materials and Methods
Micro-organism
Aspergillus oryzae CBS570.64 was obtained from the Centraal Bureau voor Schimmelcultures (CBS), Baarn, NL. Spores were produced by cultivation of the fungus on malt extract agar (Oxoid, Oxoid Limited, Hampshire, UK) at 30oC for 7 days, as described by Nagel et al. (2001). Spore suspensions in 20% glycerol were stored at –80oC in 1-mL aliquots.
Measurement of radial extension rate of colonies of A. oryzae on PDA medium
The substrate medium used was potato-dextrose agar (PDA) (Oxoid, Oxoid Limited, Hampshire, UK). Petri dishes (∅ = 86 mm) with 25 ml medium were inoculated at one point with + 50 µl diluted spore suspension (4.5 x 10⁵ spores/ml). A transparent millimetre scale (∅ = 86 mm) was attached to the bottom of each Petri dish with tape. The inoculated Petri dishes were placed in a closed and sterilised glass jar (∅ 120 mm, 70-
80

Effect of low oxygen concentrations
mm high). The jar was kept in a temperature-controlled cabinet at 35oC and aerated with humidified air (Rahardjo et al., 2002) with different oxygen concentrations. Oxygen concentrations of 21%, 5%, 3%, 1% (all at 12 dm3.h-1), and 0.25% (24 dm3.h-1) were supplied with a mixture of atmospheric air and pure nitrogen. The high aeration rates were needed to maintain the required oxygen concentration in the jar during the cultivation. The oxygen content of the outlet air was checked (Xentra 4100 paramagnetic oxygen analyzer, Servomex, Zoetermeer, The Netherlands). The diameter of the colonies was measured at certain time intervals with the help of the millimetre scale.
Measurement of hyphal extension rate and hyphal growth unit of hyphae of A. oryzae in PDA medium
To follow the growth of a single spore, 1 µl spore suspension with 3.2 x 10⁵ spores/ml was added to 10 ml sterilised (warm) PDA to obtain a final spore concentration of 32 spores/ml in the medium. One ml of this inoculated PDA solution was placed in a Petri dish (∅ = 50 mm). The Petri dish was shaken softly to spread the medium over the bottom and obtain a thin layer of inoculated PDA. A modified Petri lid with a layer of silicon rubber glued along the inside and two metal flanges (∅ = 1 mm) for gas supply and withdrawal on opposite sides, was used to provide a closed system. After closing the Petri dish with the modified lid, parafilm was used to seal it on the outside. Humidified air (1.2 dm3.h-1) with the required oxygen concentration (21%, 3%, 1%, and 0.25%) was introduced into the Petri via silicon tubes attached to the flanges (Figure 2). In the beginning of all experiments, the Petri dishes were subjected to 21% oxygen for about 6 hours to allow spore germination. The air was moistened using a bubble column filled with water at 35oC, and filter-sterilized using a 0.2-µm hydrophobic membrane (Sartorius, Nieuwegein, The Netherlands) before it entered the Petri dish. The outlet air was analysed for oxygen (Xentra 4100 paramagnetic oxygen analyser, Servomex, Zoetermeer, The Netherlands). Quantification of morphology The Petri dish was placed under a microscope (Olympus CK40, Olympus Corporation, Tokyo, Japan) with a digital camera (Olympus Camedia, C-3030zoom, Japan) (Figure 2),
81
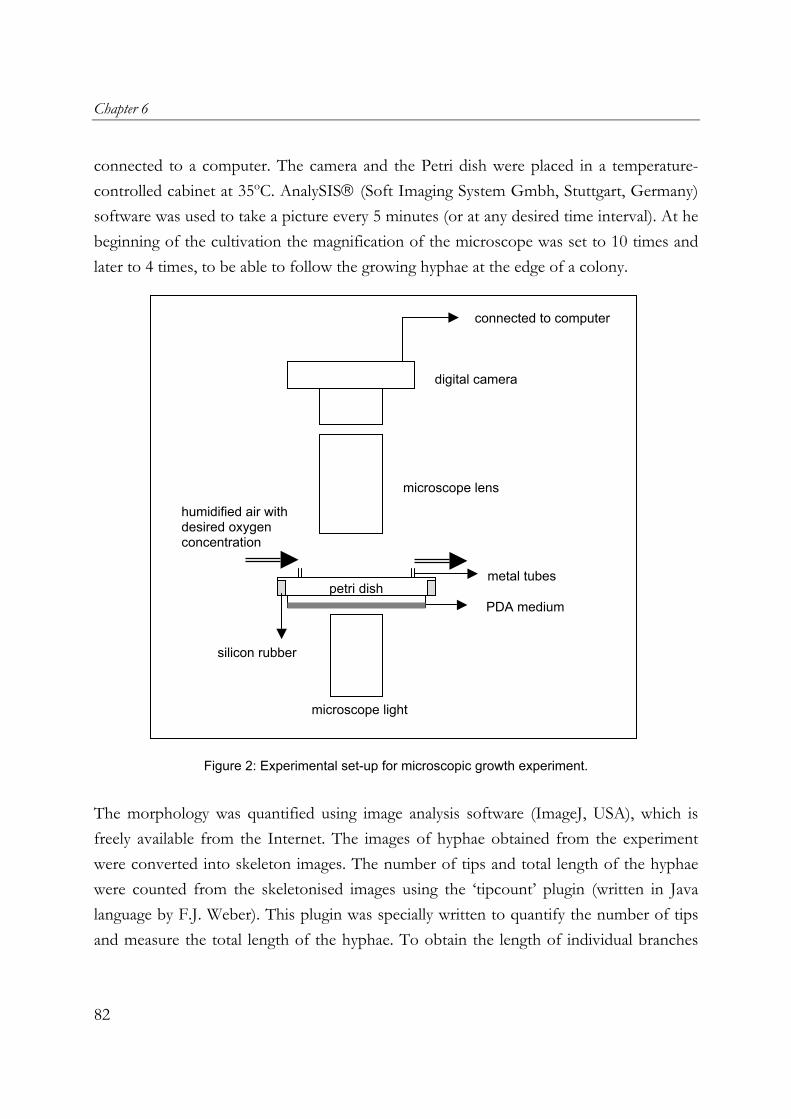
Chapter 6
connected to a computer. The camera and the Petri dish were placed in a temperature-controlled cabinet at 35oC. AnalySIS (Soft Imaging System Gmbh, Stuttgart, Germany) software was used to take a picture every 5 minutes (or at any desired time interval). At he beginning of the cultivation the magnification of the microscope was set to 10 times and later to 4 times, to be able to follow the growing hyphae at the edge of a colony.
microscope light
PDA medium
silicon rubber
petri dish metal tubes
humidified air with desired oxygen concentration
connected to computer
digital camera
microscope lens
Figure 2: Experimental set-up for microscopic growth experiment.
The morphology was quantified using image analysis software (ImageJ, USA), which is freely available from the Internet. The images of hyphae obtained from the experiment were converted into skeleton images. The number of tips and total length of the hyphae were counted from the skeletonised images using the ‘tipcount’ plugin (written in Java language by F.J. Weber). This plugin was specially written to quantify the number of tips and measure the total length of the hyphae. To obtain the length of individual branches
82

Effect of low oxygen concentrations
(for example parent hyphae/branch 1 until branch 5), the hyphae/branches that were not of interest (branch 6 and higher), were deleted from the original images. The modified images were processed with the same procedure (conversion into skeleton images and application of ‘tipcount’ plugin). In the case of crossed-over hyphae, the same procedure was applied. Fitting procedure of microscopic morphological data Parameters in Equation 2 were determined with STEM (Resource Analysis, Delft, Netherlands), using a second-order Runge-Kutta method to solve Equation 1 (see Results and Discussion section) and the least sum of squares criterion.
Overculture of A. oryzae on wheat-flour model substrate
The preparation of sterile wheat-flour discs from wheat grain was described in Rahardjo et al. (2002). The initial wet weight of each wheat-flour disc was measured. The initial dry weight (IDM) of three wheat-flour discs was determined and this value was used to calculate the IDM of each wheat-flour disc used in the experiments. The wheat-flour discs were evenly inoculated as overcultures (5.5 x 10⁴ spores/Petri) as described by Rahardjo et al. (2002). Biomass and α-amylase activity determination Petri dishes without lids, containing inoculated wheat-flour discs, were put on a tray in a closed Perspex chamber. The chamber was placed in a 35oC incubator and aerated with the required oxygen concentration (21%, 1% and 0.25%) at 24 dm3.h-1 (Brooks flow meter, Brooks Instrument, Hatfield, PA, USA). In the beginning of all experiments, the Petri dishes were subjected to 21% oxygen for about 6 hours to allow spore germination. The air was moistened using a bubble column filled with water at 35oC, and filter-sterilized using a 0.2-µm hydrophobic membrane (Midisart 2000, Sartorius, Nieuwegein, The Netherlands) before it entered the chamber at the bottom. Two times per day, two Petri dishes were taken out of the chamber. One dish was used to determine biomass dry weight and the other was used for α-amylase determination.
83
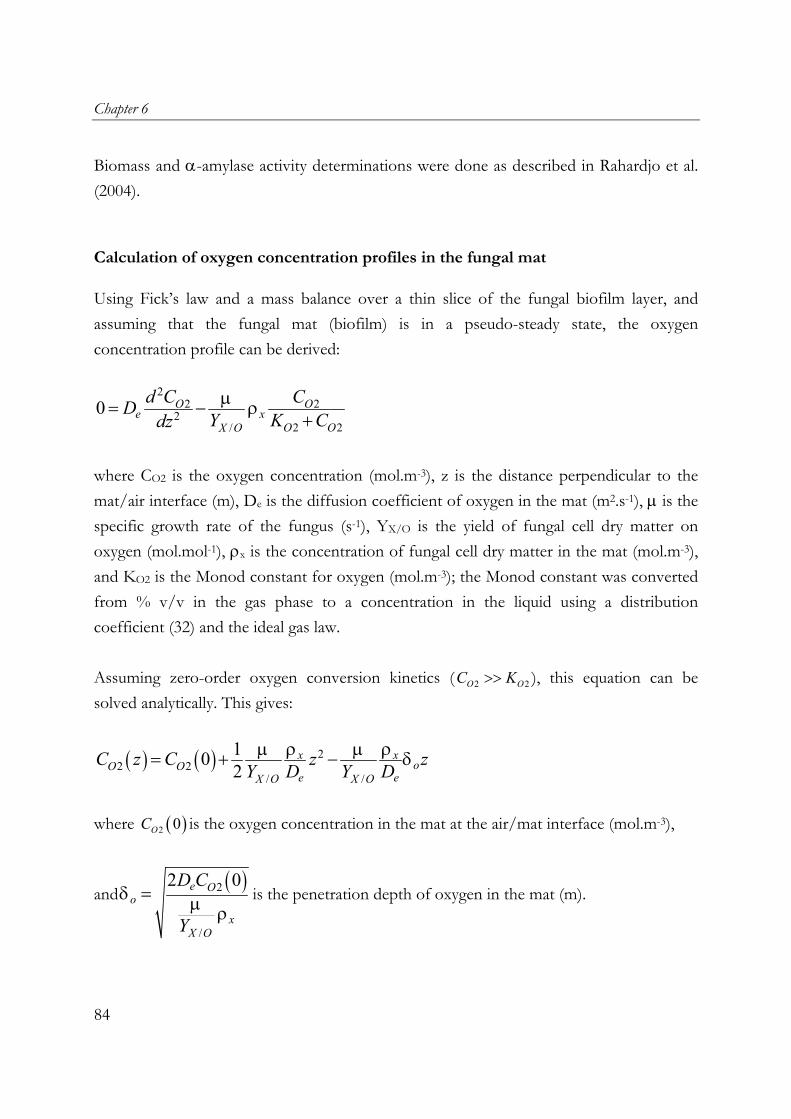
Chapter 6
Biomass and α-amylase activity determinations were done as described in Rahardjo et al. (2004).
Calculation of oxygen concentration profiles in the fungal mat
Using Fick’s law and a mass balance over a thin slice of the fungal biofilm layer, and assuming that the fungal mat (biofilm) is in a pseudo-steady state, the oxygen concentration profile can be derived:
22 2
22 2/
0 O Oe x
O OX O
d C CDY K Cdz
µ ρ= −+
where CO2 is the oxygen concentration (mol.m-3), z is the distance perpendicular to the mat/air interface (m), De is the diffusion coefficient of oxygen in the mat (m2.s-1), µ is the specific growth rate of the fungus (s-1), YX/O is the yield of fungal cell dry matter on oxygen (mol.mol-1), ρx is the concentration of fungal cell dry matter in the mat (mol.m-3), and KO2 is the Monod constant for oxygen (mol.m-3); the Monod constant was converted from % v/v in the gas phase to a concentration in the liquid using a distribution coefficient (32) and the ideal gas law. Assuming zero-order oxygen conversion kinetics ( ), this equation can be solved analytically. This gives:
2OC K>> 2O
( ) ( ) 22 2
/ /
102
xoO O
e eX O X OC z C z
Y D Y Dρ ρµ µ δ= + − x z
where C is the oxygen concentration in the mat at the air/mat interface (mol.m( )2 0O
-3),
and( )2
/
2 0e Oo
xX O
D C
Yµ ρ
=δ is the penetration depth of oxygen in the mat (m).
84

Effect of low oxygen concentrations
Results and Discussion
In this study, we did three types of experiments to determine the effect of the oxygen concentration on growth and α-amylase production of A. oryzae. First, fungal colonies were cultivated on PDA medium at different oxygen concentrations in the gas phase, in order to determine the range of oxygen concentrations that has a significant effect on fungal growth. Second, the growth of the mycelium originating from a single spore was studied in PDA medium at oxygen concentrations that were found to have a significant effect in the colony growth experiment. Finally, we examined the apparent effect of the oxygen concentration on growth and α-amylase production rates of A. oryzae cultivated on wheat-flour discs.
Radial extension rate on PDA medium
The growth of a fungal colony is commonly quantified using its radial extension rate (Trinci 1971). The measurement of the radial extension rate is relatively easy, fast and reliable. The radial extension rate of colonies of A. oryzae on PDA medium was examined in triplicate at different oxygen concentrations in the gas phase. Each radius was an average of two measurements at random angles. Figure 3 shows that the increase in radius of A. oryzae colonies was linear; the radial extension rates could be calculated from the slope of the colony radius increase versus time. Figure 3 and Table I show that the radial extension rate of a colony slightly decreased with a decrease in oxygen concentration. Figure 3 also shows that at oxygen concentrations higher than 3%, the radial extension rate was hardly affected. The measured rates can be described with Monod kinetics, using a saturation constant of 0.1% (v/v) and a maximum radial growth rate of 0.3 mm.h-1. Based on this result, we concluded that there is an effect on growth of A. oryzae at <3% oxygen and a pronounced effect at <1% oxygen. Therefore, we studied the effect of the oxygen concentration on the elongation and branching of hyphae at oxygen concentrations below 3%.
85
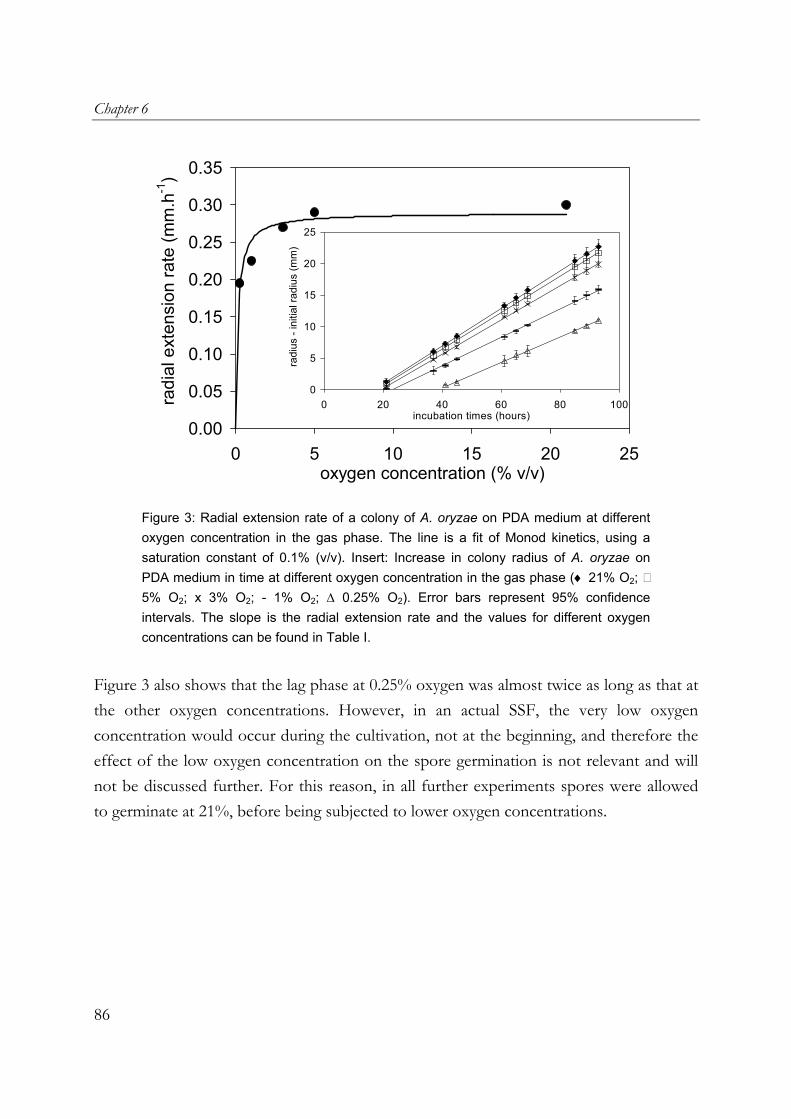
Chapter 6
0.00
0.05
0.10
0.15
0.20
0.25
0.30
0.35
0 5 10 15 20 25oxygen concentration (% v/v)
radi
al e
xten
sion
rate
(mm
.h-1
)
0
5
10
15
20
25
0 20 40 60 80 100incubation times (hours)
radi
us -
initi
al ra
dius
(mm
)
Figure 3: Radial extension rate of a colony of A. oryzae on PDA medium at different oxygen concentration in the gas phase. The line is a fit of Monod kinetics, using a saturation constant of 0.1% (v/v). Insert: Increase in colony radius of A. oryzae on PDA medium in time at different oxygen concentration in the gas phase (♦ 21% O2; 5% O2; x 3% O2; - 1% O2; ∆ 0.25% O2). Error bars represent 95% confidence intervals. The slope is the radial extension rate and the values for different oxygen concentrations can be found in Table I.
Figure 3 also shows that the lag phase at 0.25% oxygen was almost twice as long as that at the other oxygen concentrations. However, in an actual SSF, the very low oxygen concentration would occur during the cultivation, not at the beginning, and therefore the effect of the low oxygen concentration on the spore germination is not relevant and will not be discussed further. For this reason, in all further experiments spores were allowed to germinate at 21%, before being subjected to lower oxygen concentrations.
86
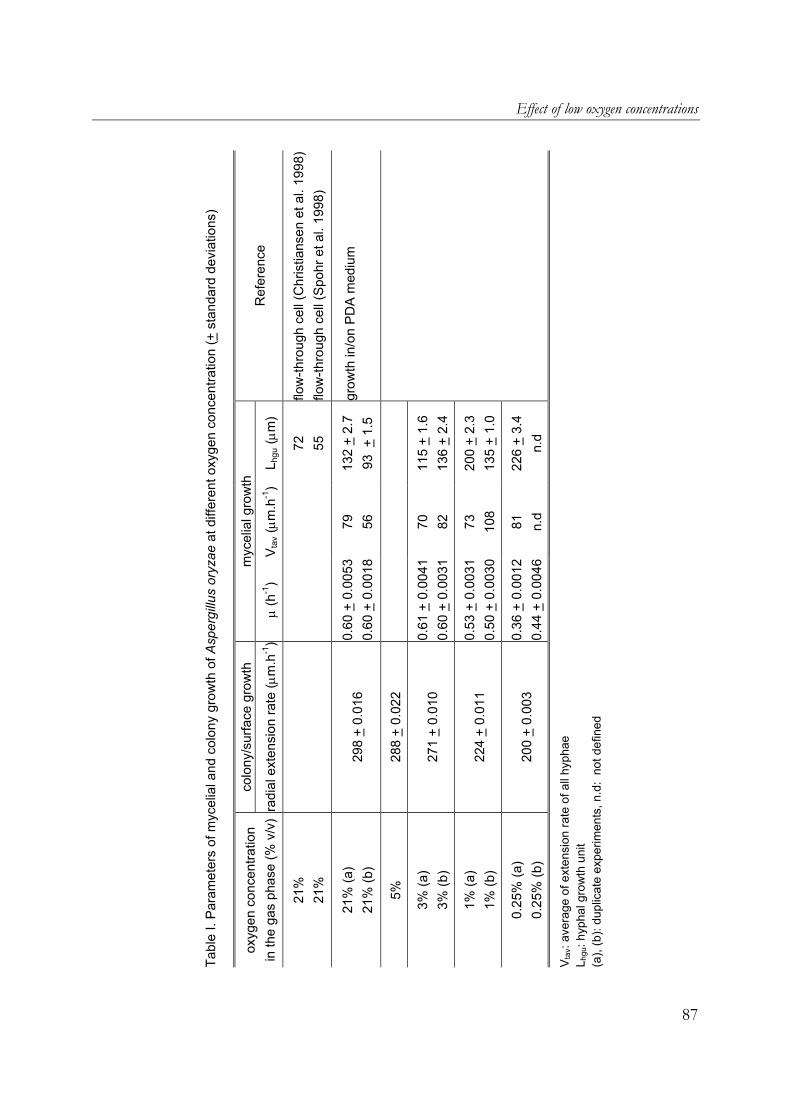
Effect of low oxygen concentrations
Ref
eren
ce
flow
-thro
ugh
cell
(Chr
istia
nsen
et a
l. 19
98)
flow
-thro
ugh
cell
(Spo
hr e
t al.
1998
)
grow
th in
/on
PDA
med
ium
L hgu
( µm
)
72
55
132
+ 2.
7 93
+ 1
.5
115
+ 1.
6 13
6 +
2.4
200
+ 2.
3 13
5 +
1.0
226
+ 3.
4 n.
d
V tav
( µm
.h-1
)
79
56 70
82
73
108
81
n.d
myc
elia
l gro
wth
µ (h
-1)
0.60
+ 0
.005
3 0.
60 +
0.0
018
0.61
+ 0
.004
1 0.
60 +
0.0
031
0.53
+ 0
.003
1 0.
50 +
0.0
030
0.36
+ 0
.001
2 0.
44 +
0.0
046
colo
ny/s
urfa
ce g
row
th
radi
al e
xten
sion
rate
( µm
.h-1
)
298
+ 0.
016
288
+ 0.
022
271
+ 0.
010
224
+ 0.
011
200
+ 0.
003
Tabl
e I.
Para
met
ers
of m
ycel
ial a
nd c
olon
y gr
owth
of A
sper
gillu
s or
yzae
at d
iffer
ent o
xyge
n co
ncen
tratio
n (+
sta
ndar
d de
viat
ions
)
oxyg
en c
once
ntra
tion
in th
e ga
s ph
ase
(% v
/v)
21%
21
%
21%
(a)
21%
(b)
5%
3% (a
) 3%
(b)
1% (a
) 1%
(b)
0.25
% (a
) 0.
25%
(b)
V tav
: ave
rage
of e
xten
sion
rate
of a
ll hy
phae
L h
gu: h
ypha
l gro
wth
uni
t (a
), (b
): du
plic
ate
expe
rimen
ts, n
.d:
not d
efin
ed
87

Chapter 6
Growth of hyphae in PDA medium
To observe the growth of a single spore in solid medium, we mixed the diluted spore suspension with fluid PDA medium to obtain a spore concentration of 32 spores/ml. For each oxygen concentration, duplicate experiments (experiment a and b) were done using a new batch of medium and inoculum. The results of each duplicate are shown in Figure 4 and Table I and II. With a spore concentration of 32 spores/ml, the mycelium developing from a spore could be adequately observed under the microscope, without interference of mycelia from other spores. One spore was chosen arbitrarily, and we followed the length of the mycelium growing from this spore and the number of tips formed, under the microscope. For each oxygen concentration, measurements of the length and number of tips from one spore were used to calculate all hyphal growth parameters, as will be discussed below. Hyphal extension rate (Vt) of the first hyphae emerged from a spore (parent hyphae) Filamentous fungi grow by apical extension of the individual hyphae and the generation of new hyphal tips through branching. Trinci (1974); Prosser (1994); and Christiansen et al. (1999) showed experimentally that the length of hyphae initially increases exponentially. This exponential increase occurs only at the very beginning of hyphal growth; the growth rate of the hypha soon slows down until a constant rate is reached. Then for most of their growth, hyphae extend at a constant linear rate. To describe this behaviour, Christiansen et al. (1999) described the hyphal extension rate (Vt (µm.h-1)) using saturation kinetics with respect to hyphal length (L (µm)):
[1]
max( )tt
s
V LdLV Ldt K L
= =+
Integration gives: [2] K L max0
0lns t
L L VL
+ − = t where L is the length of a hypha, Vtmax (µm.h-1) is the maximum tip extension rate, Ks (µm) is the saturation constant and L0 (µm) is the ‘typical’ length of germinated spores.
88
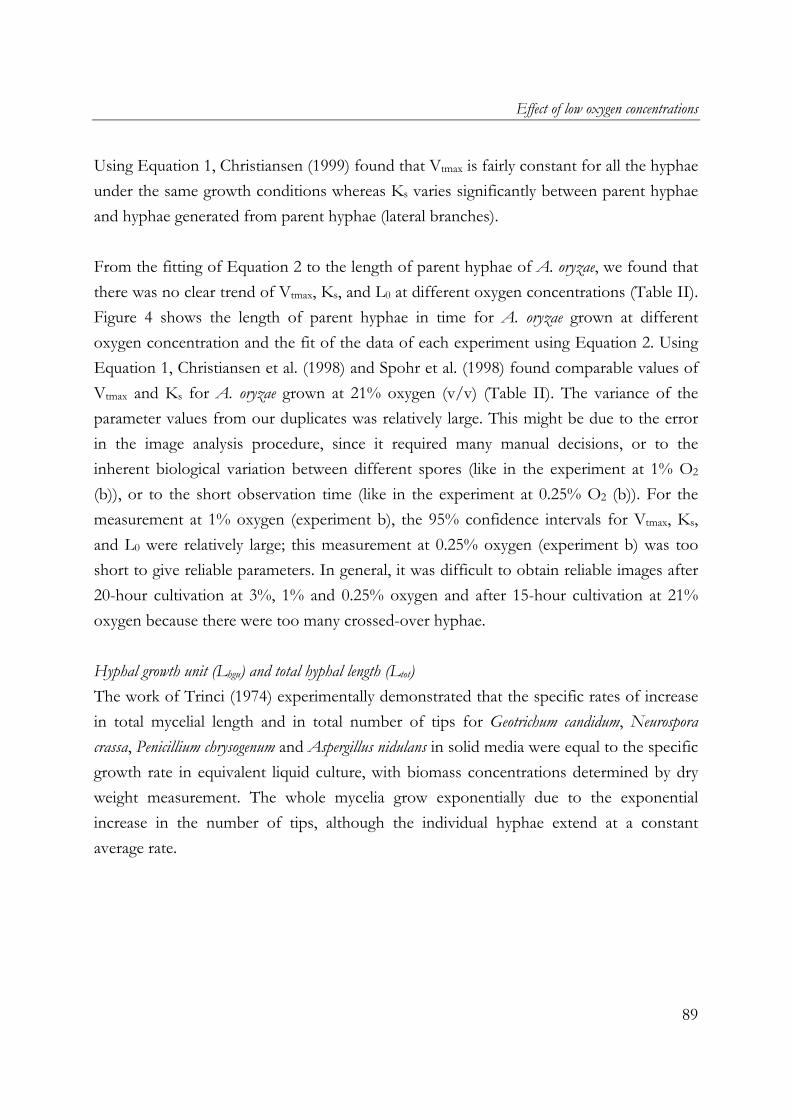
Effect of low oxygen concentrations
Using Equation 1, Christiansen (1999) found that Vtmax is fairly constant for all the hyphae under the same growth conditions whereas Ks varies significantly between parent hyphae and hyphae generated from parent hyphae (lateral branches). From the fitting of Equation 2 to the length of parent hyphae of A. oryzae, we found that there was no clear trend of Vtmax, Ks, and L0 at different oxygen concentrations (Table II). Figure 4 shows the length of parent hyphae in time for A. oryzae grown at different oxygen concentration and the fit of the data of each experiment using Equation 2. Using Equation 1, Christiansen et al. (1998) and Spohr et al. (1998) found comparable values of Vtmax and Ks for A. oryzae grown at 21% oxygen (v/v) (Table II). The variance of the parameter values from our duplicates was relatively large. This might be due to the error in the image analysis procedure, since it required many manual decisions, or to the inherent biological variation between different spores (like in the experiment at 1% O2 (b)), or to the short observation time (like in the experiment at 0.25% O2 (b)). For the measurement at 1% oxygen (experiment b), the 95% confidence intervals for Vtmax, Ks, and L0 were relatively large; this measurement at 0.25% oxygen (experiment b) was too short to give reliable parameters. In general, it was difficult to obtain reliable images after 20-hour cultivation at 3%, 1% and 0.25% oxygen and after 15-hour cultivation at 21% oxygen because there were too many crossed-over hyphae. Hyphal growth unit (Lhgu) and total hyphal length (Ltot) The work of Trinci (1974) experimentally demonstrated that the specific rates of increase in total mycelial length and in total number of tips for Geotrichum candidum, Neurospora crassa, Penicillium chrysogenum and Aspergillus nidulans in solid media were equal to the specific growth rate in equivalent liquid culture, with biomass concentrations determined by dry weight measurement. The whole mycelia grow exponentially due to the exponential increase in the number of tips, although the individual hyphae extend at a constant average rate.
89

Chapter 6
K s ( µ
m)
1271
2002
othe
r ref
eren
ces,
Equ
atio
n 1
V tm
ax ( µ
m.h
-1)
1831
1852
L 0 ( µ
m)
0.27
+ 0
.27
0.78
+ 0
.40
0.05
+ 0
.04
0.37
+ 0
.15
0.25
+ 0
.12
0.01
+ 0
.01
0.05
+ 0
.06
0.36
+ 0
.22
K s ( µ
m)
133
+ 2
9 2
19 +
42
144
+ 1
8 2
07 +
22
309
+ 3
8
68 +
14
137
+ 2
5 3
58 +
134
this
stu
dy, E
quat
ion
2
V tm
ax ( µ
m.h
-1)
134
+
8 1
52 +
13
146
+
4 1
42 +
6
200
+ 1
0
91 +
3
123
+
5 1
97 +
50
Tabl
e II.
Mic
rosc
opic
par
amet
ers
(Vtm
ax, K
s, an
d L 0
) of
par
ent h
ypha
e of
Asp
ergi
llus
oryz
ae a
t diff
eren
t oxy
gen
conc
entra
tion
(+ 9
5% c
onfid
ence
inte
rval
)
oxyg
en c
once
ntra
tion
in th
e ga
s ph
ase
(% v
/v)
21%
(a)
21%
(b)
3% (a
) 3%
(b)
1% (a
) 1%
(b)
0.25
% (a
) 0.
25%
(b)
V tm
ax: m
axim
um h
ypha
l ext
ensi
on ra
te
K s:
sa
tura
tion
cons
tant
for h
ypha
l len
gth
L 0:
‘ty
pica
l’ le
ngth
of g
erm
inat
ed s
pore
(a
), (b
): du
plic
ate
expe
rimen
ts
1 sub
mer
ged
(flow
-thro
ugh
cell)
Chr
istia
nsen
et a
l., 1
998
2 sub
mer
ged
(flow
-thro
ugh
cell)
Spo
hr e
t al.,
1998
90
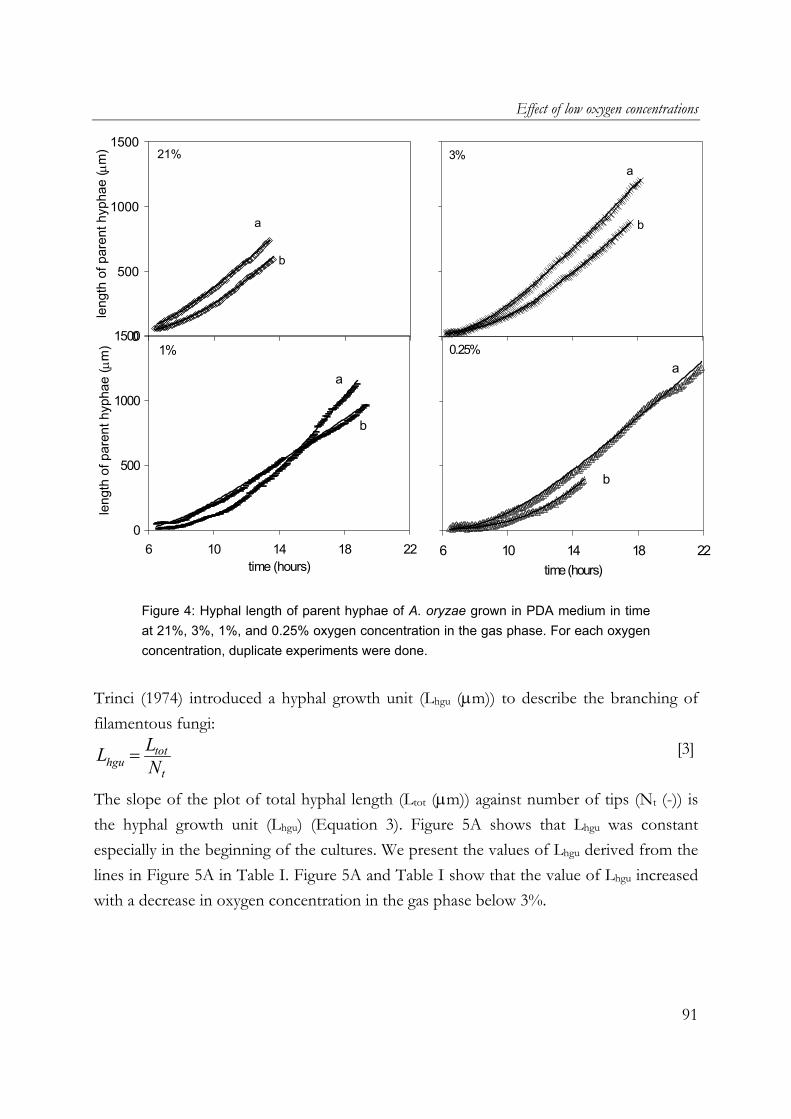
Effect of low oxygen concentrations
0
500
1000
1500
6 10 14 18
leng
th o
f par
ent h
ypha
e ( µ
m) 21%
a
b
220
500
1000
1500
6 10 14 18
3%a
b
22
0
500
1000
1500
6 10 14 18time (hours)
leng
th o
f par
ent h
ypha
e ( µ
m) 1%
a
b
220
500
1000
1500
6 10 14 18 2time (hours)
0.25%a
b
2
Figure 4: Hyphal length of parent hyphae of A. oryzae grown in PDA medium in time at 21%, 3%, 1%, and 0.25% oxygen concentration in the gas phase. For each oxygen concentration, duplicate experiments were done.
Trinci (1974) introduced a hyphal growth unit (Lhgu (µm)) to describe the branching of filamentous fungi: [3] LL = tothgu
tN The slope of the plot of total hyphal length (Ltot (µm)) against number of tips (Nt (-)) is the hyphal growth unit (Lhgu) (Equation 3). Figure 5A shows that Lhgu was constant especially in the beginning of the cultures. We present the values of Lhgu derived from the lines in Figure 5A in Table I. Figure 5A and Table I show that the value of Lhgu increased with a decrease in oxygen concentration in the gas phase below 3%.
91
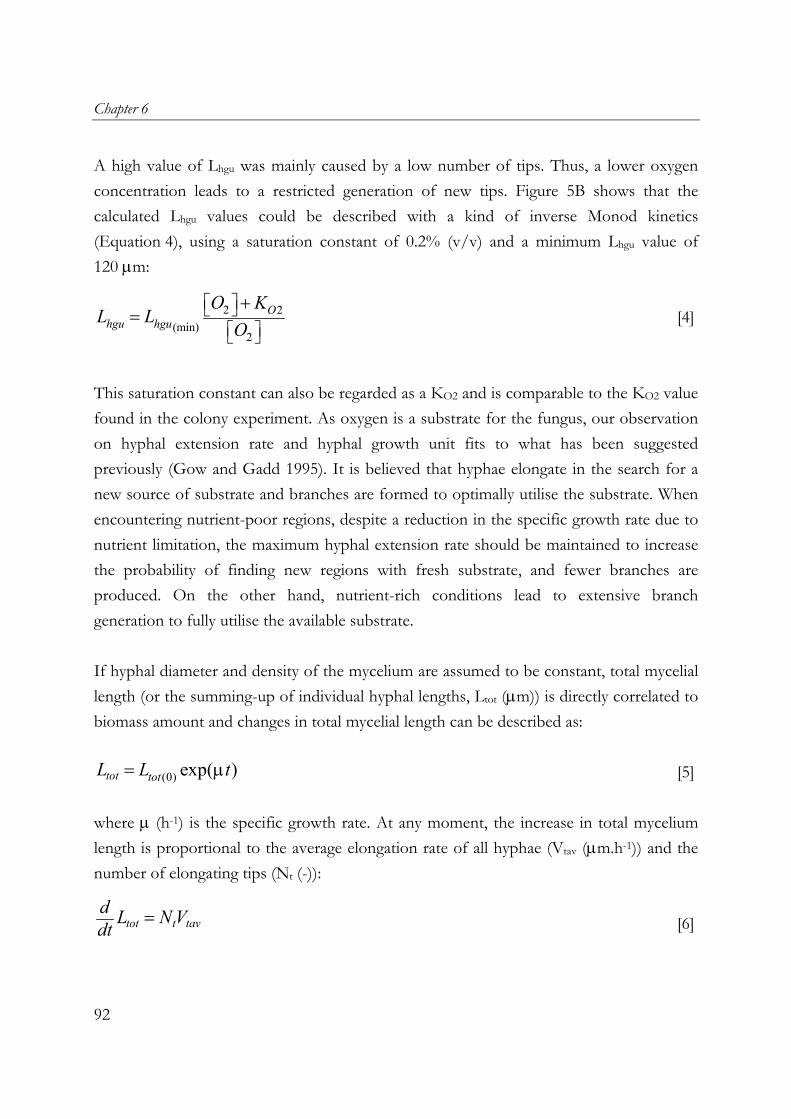
Chapter 6
A high value of Lhgu was mainly caused by a low number of tips. Thus, a lower oxygen concentration leads to a restricted generation of new tips. Figure 5B shows that the calculated Lhgu values could be described with a kind of inverse Monod kinetics (Equation 4), using a saturation constant of 0.2% (v/v) and a minimum Lhgu value of 120 µm:
[4]
2 2(min)
2
Ohgu hgu
O KL L
O
+=
This saturation constant can also be regarded as a KO2 and is comparable to the KO2 value found in the colony experiment. As oxygen is a substrate for the fungus, our observation on hyphal extension rate and hyphal growth unit fits to what has been suggested previously (Gow and Gadd 1995). It is believed that hyphae elongate in the search for a new source of substrate and branches are formed to optimally utilise the substrate. When encountering nutrient-poor regions, despite a reduction in the specific growth rate due to nutrient limitation, the maximum hyphal extension rate should be maintained to increase the probability of finding new regions with fresh substrate, and fewer branches are produced. On the other hand, nutrient-rich conditions lead to extensive branch generation to fully utilise the available substrate. If hyphal diameter and density of the mycelium are assumed to be constant, total mycelial length (or the summing-up of individual hyphal lengths, Ltot (µm)) is directly correlated to biomass amount and changes in total mycelial length can be described as: [5] L L (0) exp( )tot tot tµ= where µ (h-1) is the specific growth rate. At any moment, the increase in total mycelium length is proportional to the average elongation rate of all hyphae (Vtav (µm.h-1)) and the number of elongating tips (Nt (-)): d [6] L Ndt tot t tavV=
92
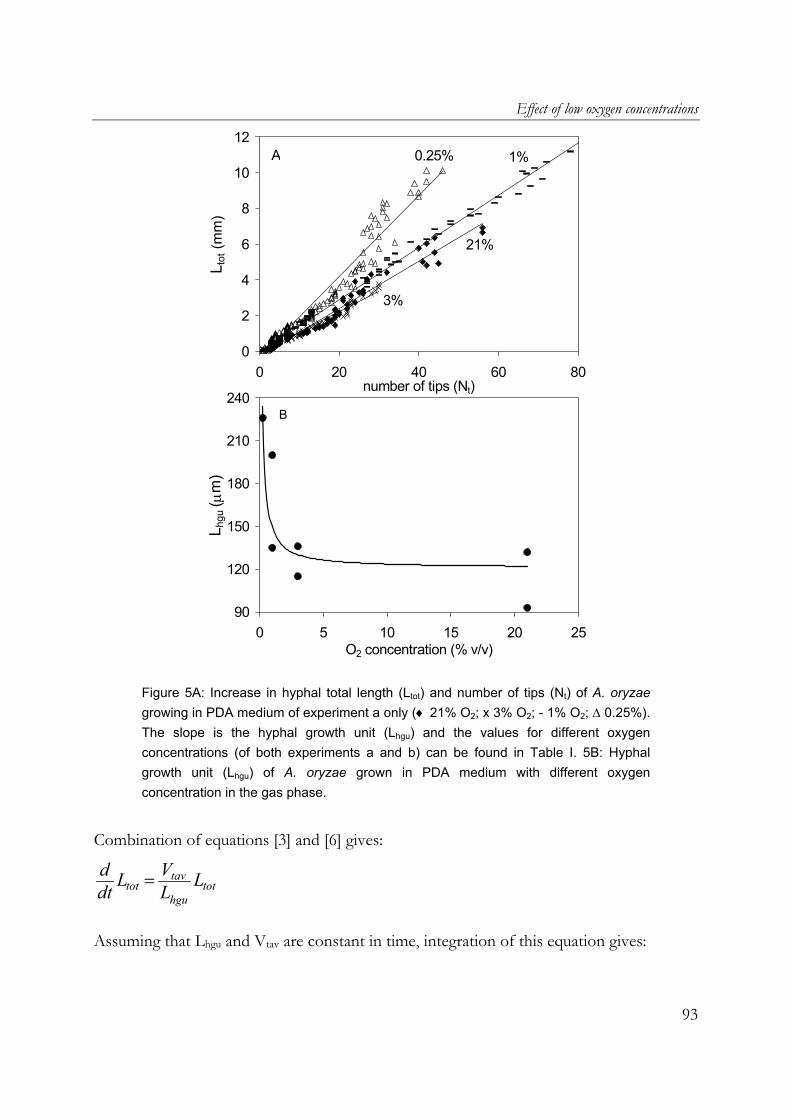
Effect of low oxygen concentrations
90
120
150
180
210
240
0 5 10 15 20 25O2 concentration (% v/v)
L hgu
( µm
)
B
0.25% 1%
3%
21%
0
2
4
6
8
10
12
0 20 40 60number of tips (Nt)
L tot (m
m)
A
80
Figure 5A: Increase in hyphal total length (Ltot) and number of tips (Nt) of A. oryzae growing in PDA medium of experiment a only (♦ 21% O2; x 3% O2; - 1% O2; ∆ 0.25%). The slope is the hyphal growth unit (Lhgu) and the values for different oxygen concentrations (of both experiments a and b) can be found in Table I. 5B: Hyphal growth unit (Lhgu) of A. oryzae grown in PDA medium with different oxygen concentration in the gas phase.
Combination of equations [3] and [6] gives: d dt
tavtot tot
hgu
VL LL
=
Assuming that Lhgu and Vtav are constant in time, integration of this equation gives:
93

Chapter 6
[7] L L (0) exptav
tot tothgu
V tL
= Comparing equations [5] and [7], as also proposed by Steele and Trinci (1975), we can write [8] V Ltav hguµ= Figure 6 shows an exponential increase of Ltot in time at different oxygen concentrations. Using Equation 7, the slopes of the plots in Figure 6 gave Vtav/Lhgu or the specific growth rate µ. The values of µ for each oxygen concentration are given in Table I. It is clear that the specific growth rate at 3% was comparable to that at 21% oxygen and that µ was only slightly reduced at 1% oxygen. As can be expected from the KO2 value found, the specific growth rate was clearly reduced at 0.25% oxygen.
21% 3%
1%
0.25%
0
2
4
6
8
10
12
0 5 10 15 20 25incubation times (hours)
ln L
tot (
mm
)
Figure 6: The increase in hyphal total length (Ltot) of A. oryzae in PDA medium in time for different oxygen concentration in the gas phase of one experiment.
From the slopes in Figure 5A (Lhgu) and the slopes in Figure 6 (µ), Vtav could be calculated and the values are presented in Table I. As also observed for Vtmax and Ks values, there was no clear trend of Vtav values versus oxygen concentration. From the values of Vtmax, Ks (Table II) and Vtav (TableI), it seemed that the oxygen concentration in the gas phase
94
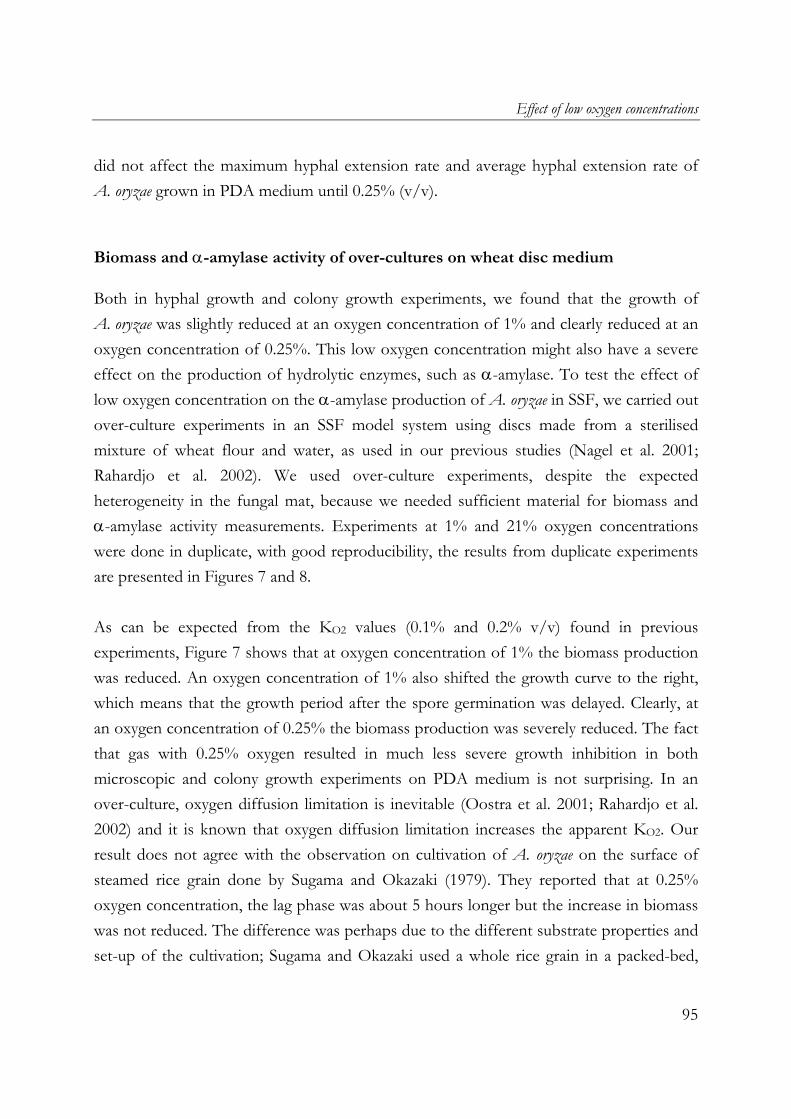
Effect of low oxygen concentrations
did not affect the maximum hyphal extension rate and average hyphal extension rate of A. oryzae grown in PDA medium until 0.25% (v/v).
Biomass and α-amylase activity of over-cultures on wheat disc medium
Both in hyphal growth and colony growth experiments, we found that the growth of A. oryzae was slightly reduced at an oxygen concentration of 1% and clearly reduced at an oxygen concentration of 0.25%. This low oxygen concentration might also have a severe effect on the production of hydrolytic enzymes, such as α-amylase. To test the effect of low oxygen concentration on the α-amylase production of A. oryzae in SSF, we carried out over-culture experiments in an SSF model system using discs made from a sterilised mixture of wheat flour and water, as used in our previous studies (Nagel et al. 2001; Rahardjo et al. 2002). We used over-culture experiments, despite the expected heterogeneity in the fungal mat, because we needed sufficient material for biomass and α-amylase activity measurements. Experiments at 1% and 21% oxygen concentrations were done in duplicate, with good reproducibility, the results from duplicate experiments are presented in Figures 7 and 8. As can be expected from the KO2 values (0.1% and 0.2% v/v) found in previous experiments, Figure 7 shows that at oxygen concentration of 1% the biomass production was reduced. An oxygen concentration of 1% also shifted the growth curve to the right, which means that the growth period after the spore germination was delayed. Clearly, at an oxygen concentration of 0.25% the biomass production was severely reduced. The fact that gas with 0.25% oxygen resulted in much less severe growth inhibition in both microscopic and colony growth experiments on PDA medium is not surprising. In an over-culture, oxygen diffusion limitation is inevitable (Oostra et al. 2001; Rahardjo et al. 2002) and it is known that oxygen diffusion limitation increases the apparent KO2. Our result does not agree with the observation on cultivation of A. oryzae on the surface of steamed rice grain done by Sugama and Okazaki (1979). They reported that at 0.25% oxygen concentration, the lag phase was about 5 hours longer but the increase in biomass was not reduced. The difference was perhaps due to the different substrate properties and set-up of the cultivation; Sugama and Okazaki used a whole rice grain in a packed-bed,
95
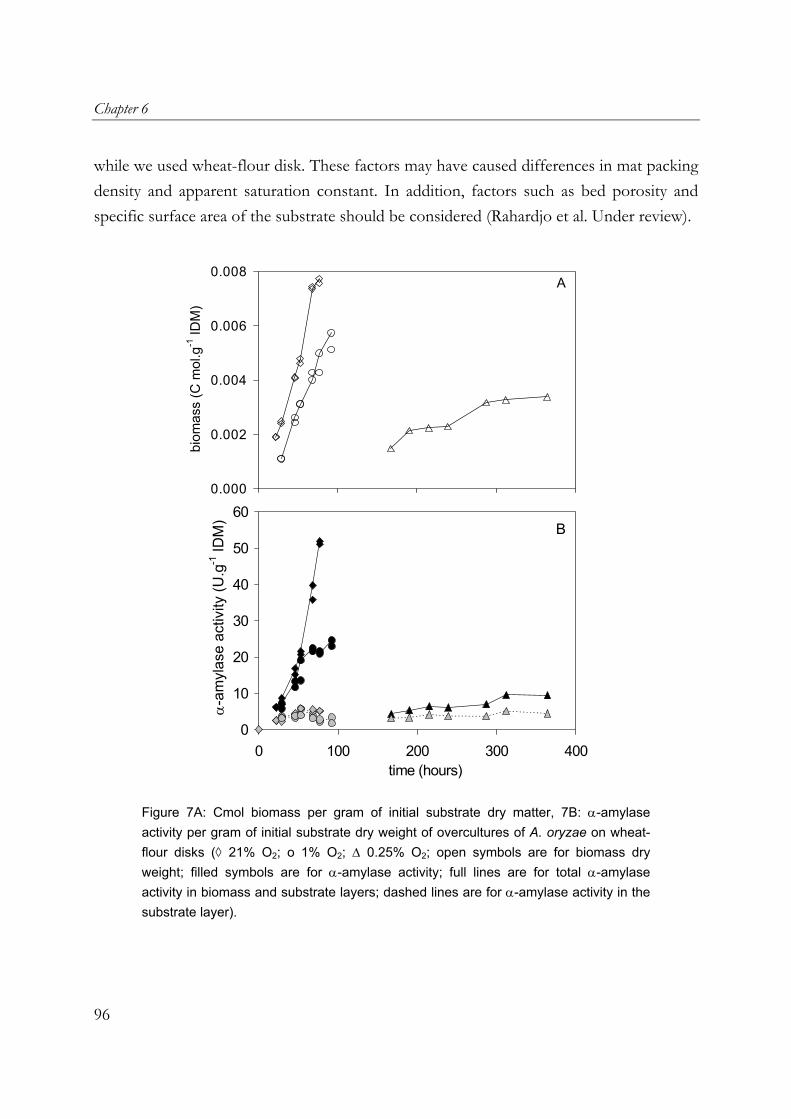
Chapter 6
while we used wheat-flour disk. These factors may have caused differences in mat packing density and apparent saturation constant. In addition, factors such as bed porosity and specific surface area of the substrate should be considered (Rahardjo et al. Under review).
0.000
0.002
0.004
0.006
0.008
0 100 200 300 400
biom
ass
(C m
ol.g
-1 ID
M)
A
0
10
20
30
40
50
60
0 100 200 300 400time (hours)
α-a
myl
ase
activ
ity (U
.g-1
IDM
) B
Figure 7A: Cmol biomass per gram of initial substrate dry matter, 7B: α-amylase activity per gram of initial substrate dry weight of overcultures of A. oryzae on wheat-flour disks (◊ 21% O2; o 1% O2; ∆ 0.25% O2; open symbols are for biomass dry weight; filled symbols are for α-amylase activity; full lines are for total α-amylase activity in biomass and substrate layers; dashed lines are for α-amylase activity in the substrate layer).
96
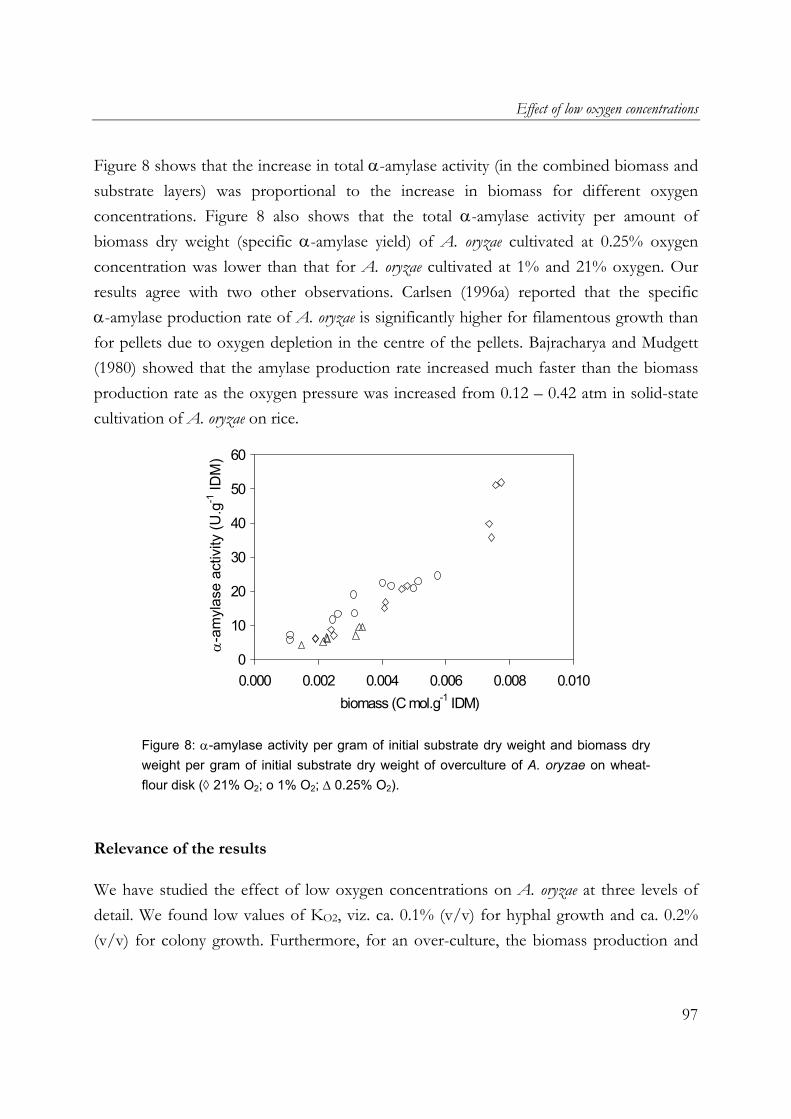
Effect of low oxygen concentrations
Figure 8 shows that the increase in total α-amylase activity (in the combined biomass and substrate layers) was proportional to the increase in biomass for different oxygen concentrations. Figure 8 also shows that the total α-amylase activity per amount of biomass dry weight (specific α-amylase yield) of A. oryzae cultivated at 0.25% oxygen concentration was lower than that for A. oryzae cultivated at 1% and 21% oxygen. Our results agree with two other observations. Carlsen (1996a) reported that the specific α-amylase production rate of A. oryzae is significantly higher for filamentous growth than for pellets due to oxygen depletion in the centre of the pellets. Bajracharya and Mudgett (1980) showed that the amylase production rate increased much faster than the biomass production rate as the oxygen pressure was increased from 0.12 – 0.42 atm in solid-state cultivation of A. oryzae on rice.
0
10
20
30
40
50
60
0.000 0.002 0.004 0.006 0.008 0.010biomass (C mol.g-1 IDM)
α-a
myl
ase
activ
ity (U
.g-1
IDM
)
Figure 8: α-amylase activity per gram of initial substrate dry weight and biomass dry weight per gram of initial substrate dry weight of overculture of A. oryzae on wheat-flour disk (◊ 21% O2; o 1% O2; ∆ 0.25% O2).
Relevance of the results
We have studied the effect of low oxygen concentrations on A. oryzae at three levels of detail. We found low values of KO2, viz. ca. 0.1% (v/v) for hyphal growth and ca. 0.2% (v/v) for colony growth. Furthermore, for an over-culture, the biomass production and
97

Chapter 6
the α-amylase production were significantly reduced only at an oxygen concentration lower than 1%. Figure 9 shows a comparison of the oxygen concentration profiles in a fungal biofilm calculated using zero-order kinetics and Monod kinetics (see Materials and Methods). To calculate these profiles, we used the same parameters as in our previous study (Rahardjo et al. 2002) and KO2 = 0.2% v/v (see the caption of Figure 9). Clearly, these profiles hardly differ. The oxygen fluxes at the air-biofilm interface were calculated to be 3.8×10⁻⁵ mol.m-2.s-1 and 3.6×10⁻⁵ mol.m-2.s-1 for zero-orde and Monod kinetics respectively. Our conclusion is that the KO2 value for A. oryzae is so small that Monod kinetics can be simplified to zero-order kinetics in coupled diffusion/reaction models for biofilms of this fungus in SSF.
0.00
0.05
0.10
0.15
0.20
0.25
0.E+00 4.E-05 8.E-05biofilm depth (m)
oxyg
en c
once
ntra
tion
(mol
.m-3
)
δ0
Figure 9. Oxygen concentration profiles in the depth of the fungal biofilm calculated with zero-orde kinetics (grey line) and Monod kinetics (black line), with Monod constant for oxygen (KO2) 0.2% (v/v) or 4.4 x 10⁻³ mol.m-3 of dissolved oxygen in water. δ0 = 4.3 x 10⁻⁵ m is the penetration depth of oxygen calculated with zero-order kinetics. The diffusion coefficient for oxygen in water De = 3.7×10⁻⁹ m2·s-1 (at 35
oC), a
saturated oxygen concentration in water of CO2(0) = 0.22 mol.m-3
(at 35oC), the
specific growth rate µ = 0.3 h-1, a biomass dry-weight concentration in the wet hyphal layer of ρX = 300 kg·m-3, a biomass molecular weight of 0.024 kg·Cmol-1, and a biomass/oxygen yield coefficient of YX/O = 1.16 Cmol.mol-1.
98
Effect of low oxygen concentrations
Measurements for single hyphae, young mycelia and mature colonies all show a low saturation constant for oxygen, but there are also differences. At the level of single hyphae, low oxygen concentrations did not lower the tip extension rate but they reduced the specific growth rate (µ) by reducing the number of tips formed, i.e. by increasing the hyphal growth unit Lhgu. At the colony level, on the other hand, low oxygen concentrations reduced the radial extension rate. Furthermore, the extension rates of single hyphae (Vtmax) and young mycelia (Vtav) were significantly lower than the radial extension rate of mature colonies (Table I and II). Hyphae at the periphery of a colony are not hampered by diffusion limitation because the local biomass density is still very low. Therefore, one would expect to find extension rates similar to those for young mycelia or single (parent) hyphae. It may be that we underestimated the extension rate for parent hyphae and young mycelia, because we were unable to obtain reliable measurements after ca. 20 hours. This should be kept in mind, when extrapolating fungal growth kinetics observed for young mycelia to fermentations with more mature mycelia. Another factor that may have caused errors in the length measurements is that we used two-dimensional images to measure the length of hyphae; while in reality there was some room for growth above or below the horizontal plane. This may also have contributed to the relatively large scatter between duplicates for the parent hyphae. Confocal scanning laser microscopy (CSLM), which allows three-dimensional visualisation of mycelia, might be a good alternative to study the growth of hyphae in more detail.
Conclusion
We conclude that it is reasonable to use zero-order growth kinetics, instead of Monod growth kinetics, in coupled diffusion/reaction models for biofilms of A. oryzae in SSF. This is due to the low value of KO2 found; KO2 was 0.1% (v/v) for young mycelia hyphal and 0.2% (v/v) for colony growth. Furthermore, for an over-culture, the biomass production and the α-amylase production were reduced already at 1% oxygen. Some results warrant further attention: At the level of single hyphae, low oxygen concentrations did not lower the tip extension rate but did reduce the specific growth rate (µ) by
99
Chapter 6
reducing the number of tips formed, i.e. by increasing the hyphal growth unit Lhgu. At the colony level, on the other hand, low oxygen concentrations reduced the radial extension rate. Also, there was a significant difference in the tip extension rates of young mycelia and mature colonies, which must be borne in mind in extrapolating results of microscopic studies to fermenters.
Nomenclature
KO2 saturation constant for oxygen concentration (%, v/v in the gas phase) Ks saturation constant for hyphal length (µm) L hyphal length (µm) L0 ‘typical’ length of germinated spore (µm) Lhgu hyphal growth unit (µm) Ltot total hyphal length (µm) µ specific growth rate (h-1) Nt number of tips (-) t time (h) Vt hyphal extension rate (µm.h-1) Vtav average of extension rate of all hyphae (µm.h-1) Vtmax maximum hyphal extension rate (µm.h-1)
References
Bajracharya R, Mudgett RE. 1980. Effects of controlled gas environments in solid-substrate fermentations of rice. Biotechnol Bioeng 22:2219-2235.
Carlsen M, Spohr AB, Nielsen J, Villadsen J. 1996. Morphology and physiology of an α-amylase producing strain of Aspergillus oryzae during batch cultivations. Biotechnol Bioeng 49:266-276.
Christiansen T, Spohr AB, Nielsen J. 1999. On-line study of growth kinetics of single hyphae of Aspergillus oryzae in a flow-through cell. Biotechnol Bioeng 63:147-153.
100
Effect of low oxygen concentrations
de Vrije T, Antoine N, Buitelaar RM, Bruckner S, Dissevelt M, Durand A, Gerlagh M, Jones EE, Luth P, Oostra J. 2001. The fungal biocontrol agent Coniothyrium minitans: production by solid-state fermentation, application and marketing. Appl Microbiol Biotechnol 56:58-68.
Gow NAR, Gadd GM. 1995. The growing fungus. London:Chapman & Hall.
Ishida H, Hata Y, Kawato A, Abe Y, Suginami K, Imayasu S. 2000. Identification of functional elements that regulate the glucoamylase-encoding gene (glaB) expressed in solid-state culture of Aspergillus oryzae. Curr Gen 37:373-379.
Lambert PW. 1983. Industrial enzyme production and recovery from filamentous fungi. Filamentous fungi IV. London:Edward Arnold Publisher Ltd.
Lekha PK, Lonsane BK. 1994. Comparative titres, location and properties of tannin-acyl-hydrolase produced by Aspergillus niger PKL 104 in solid-state, liquid surface and submerged fermentations. Proc Biochem 29:497-503.
Mitchell DA, Do DD, Greenfield PF. 1991. A semimechanistic mathematical model for growth of Rhizopus oligosporus in a model solid-state fermentation System. Biotechnol Bioeng 38:353-362.
Nagel FJI, Tramper J, Bakker MSN, Rinzema A. 2001. Model for on-line moisture-content control during solid-state fermentation. Biotechnol Bioeng 72 :231-243.
Nandakumar MP, Thakur MS, Raghavarao KSMS, Ghildyal NP. 1996. Substrate particle size reduction by Bacillus coagulans in solid-state fermentation. Enz Microbiol Technol 18:121-125.
Nopharatana M, Howes T, Mitchell DA. 1998. Modelling fungal growth on surfaces. Biotechnol Techn 12:313-318.
Oostra J, le Comte EP, van den Heuvel JC, Tramper J, Rinzema A. 2001. Intra-particle oxygen diffusion limitation in solid-state fermentation. Biotechnol Bioeng 75:13-24.
101

Chapter 6
Prosser JI. 1994. Kinetics of filamentous growth and branching. In: Gow NAR, Gadd GM (ed.) The growing fungus. London:Chapman & Hall.
Rahardjo YSP, Weber FJ, le Comte EP, Tramper J, Rinzema A. 2002. Contribution of aerial hyphae of Aspergillus oryzae to respiration in a model solid-state fermentation system. Biotechnol Bioeng 78:539-544.
Rahardjo YSP, Korona D, Haemers S, Weber FJ, Tramper J, Rinzema A. 2004. Limitations of membrane cultures as a model solid-state fermentation system. Lett Appl Microbiol 39:504-508.
Rahardjo YSP, Jolink F, Haemers S, Tramper J, Rinzema A. Significance of bed porosity, bran and specific surface area in solid-state cultivation of Aspergillus oryzae. Under review.
Rajagopalan S, Modak JM. 1995. Evaluation of relative growth limitation due to depletion of glucose and oxygen during fungal growth on a spherical solid particle. Chem Eng Sci 50:803-811.
Rajagopalan S, Rockstraw DA, Munson-McGee SH. 1997. Modeling substrate particle degradation by Bacillus coagulans biofilm. Biotech Resource 61:175-183.
Spohr A, Dam-Mikkelsen C, Carlsen M, Nielsen J. 1998. On-line study of fungal morphology during submerged growth in a small flow-through cell. Biotehnol Bioeng 58:541-553.
Steele GC, Trinci APJ. 1975. Morphology and growth kinetics of hyphae of differentiated and undifferentiated mycelia of Neurospora crassa. J Gen Microbiol 91:362-368.
Sugama S, Okazaki N. 1979. A new apparatus for automatic growth estimation of mould cultured on solid media. J Ferment Technol 57:413-417.
Thibault J, Pouliot K, Agosin E, Perez-Correa R. 2000. Reassessment of the estimation of dissolved oxygen concentration profile and KLa in solid-state fermentation. Proc Biochem 36:9-18.
102

Effect of low oxygen concentrations
103
Trinci APJ. 1971. Influence of the width of the peripheral growth zone on the radial growth rate of fungal colonies on solid media. J Gen Microb 67:325-344.
Trinci APJ. 1974. A study of the kinetics of hyphal extension and branch initiation of fungal mycelia. J Gen Microb 81:225-236.


Chapter 7
Modelling conversion and transport phenomena in solid-state fermentation: A review and perspectives
Yovita SP Rahardjo, Johannes Tramper, Arjen Rinzema
Abstract
In Solid-State Fermentation (SSF), as to Submerged Fermentation (SmF), inevitable concentration gradients inside substrate particles and microbial biofilms exist. These gradients are needed for the transport of substrates and products. They have been suggested to be crucial for the product characteristics obtained in SSF, but have also been proven to result in inactivity or undesired side-activities of part of the microbes. Things are further complicated by the fact that SSF is generally a batch process. Mathematical models are therefore needed to understand SSF, design better substrate properties and fermenters, and eventually manipulate SSF processes. Up to now, several models have been proposed to describe coupled substrate conversion and diffusion and the resulting microbial growth in SSF, but there is no model that comprises all essential phenomena in SSF, let alone a model that can explain production of SSF-specific products. In this article, we critically evaluate the proposed models and their experimental validation. Additionally, based on recent findings in the field, we discuss important issues that need to be addressed in further modelling work. Submitted for publication.
105

Chapter 7
Introduction
Solid-State Fermentation or Solid-Substrate Fermentation (SSF) has been used for centuries all over the world. Traditionally, SSF was mainly applied in the production of fermented foods, such as dairy products in Europe and the Middle East, enzymes for soy sauce, tempe and beverages in Asia, and fermented sorghum in Africa (Campbell-Platt 1994). In scientific terms, SSF is defined as the growth of micro-organisms on moistened solid substrate, in which enough moisture is present to maintain the growth and metabolism of the micro-organism, but with no free-moving water present and air as the continuous phase. Recently, an extensive review has been published on the types of micro-organisms that can be used in SSF, together with their specific products, which can be bulk bioactive compounds or high-value compounds (Pandey et al. 2000). Fungi, yeast, some bacteria, and some combinations of those can be used in SSF. Certain products, like glucoamylase B (Ishida et al. 2000) or spores of biocontrol fungi (de Vrije et al. 2001) have to be produced by SSF as they are only expressed under SSF conditions. SSF technology opens many new prospects, because for example: agricultural waste products can be used as substrates with relatively little pre-treatment, and downstream processing can be more efficient due to the very low water content in SSF. In the last 20 years, there has been increased interest in many aspects of SSF (Pandey 2003) like biochemistry, physical chemistry, process engineering (Raghavarao et al. 2003), and the design of SSF bioreactors (Durand 2003; Mitchell et al. 2003). However, because of the difficulties in process control and scaling-up of SSF, the development of SSF has been slow compared to submerged fermentation (SmF). Nagel (2002) showed that better designs and eventually better control in SSF at fermenter level give possibilities to scale up SSF to industrial scale. On the other hand, several authors have recognised the importance of micro-scale phenomena in SSF (Ito et al. 1989, Varzakas 1998, Mitchell et al. 2000, Oostra et al. 2001, Rahardjo et al. 2002). Little is known about the micro-scale phenomena and their influence on the fermentation characteristics and metabolic
106
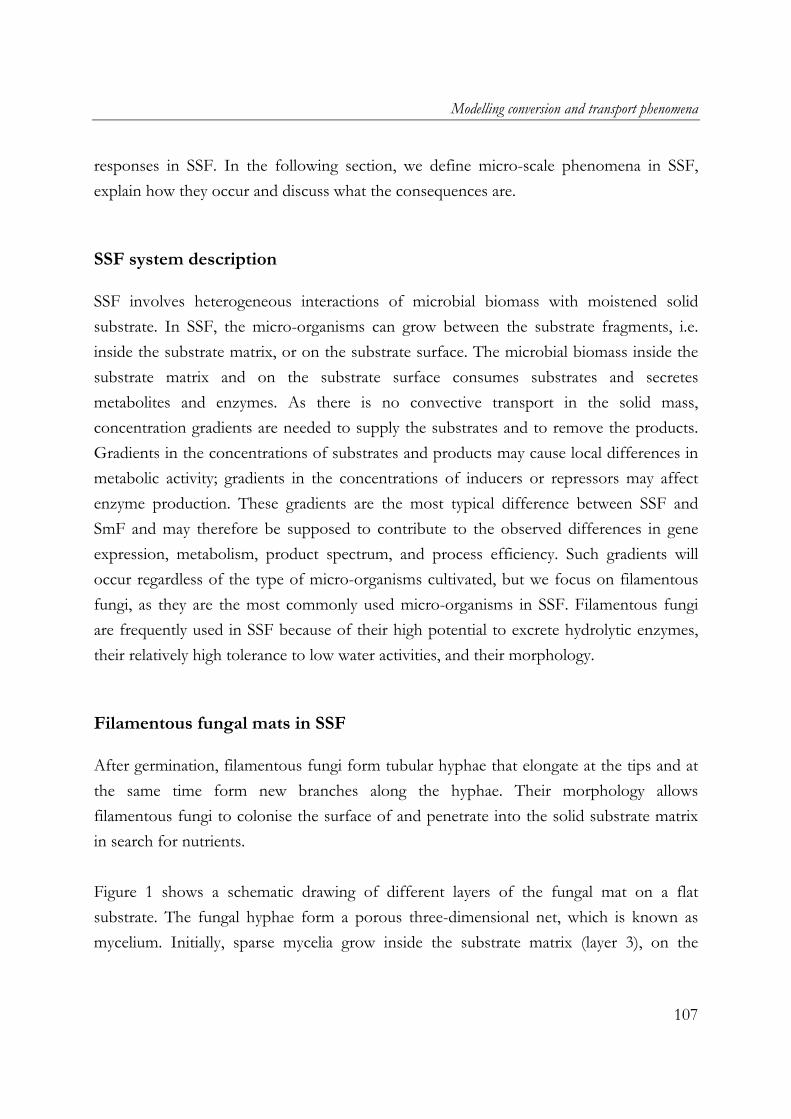
Modelling conversion and transport phenomena
responses in SSF. In the following section, we define micro-scale phenomena in SSF, explain how they occur and discuss what the consequences are.
SSF system description
SSF involves heterogeneous interactions of microbial biomass with moistened solid substrate. In SSF, the micro-organisms can grow between the substrate fragments, i.e. inside the substrate matrix, or on the substrate surface. The microbial biomass inside the substrate matrix and on the substrate surface consumes substrates and secretes metabolites and enzymes. As there is no convective transport in the solid mass, concentration gradients are needed to supply the substrates and to remove the products. Gradients in the concentrations of substrates and products may cause local differences in metabolic activity; gradients in the concentrations of inducers or repressors may affect enzyme production. These gradients are the most typical difference between SSF and SmF and may therefore be supposed to contribute to the observed differences in gene expression, metabolism, product spectrum, and process efficiency. Such gradients will occur regardless of the type of micro-organisms cultivated, but we focus on filamentous fungi, as they are the most commonly used micro-organisms in SSF. Filamentous fungi are frequently used in SSF because of their high potential to excrete hydrolytic enzymes, their relatively high tolerance to low water activities, and their morphology.
Filamentous fungal mats in SSF
After germination, filamentous fungi form tubular hyphae that elongate at the tips and at the same time form new branches along the hyphae. Their morphology allows filamentous fungi to colonise the surface of and penetrate into the solid substrate matrix in search for nutrients. Figure 1 shows a schematic drawing of different layers of the fungal mat on a flat substrate. The fungal hyphae form a porous three-dimensional net, which is known as mycelium. Initially, sparse mycelia grow inside the substrate matrix (layer 3), on the
107
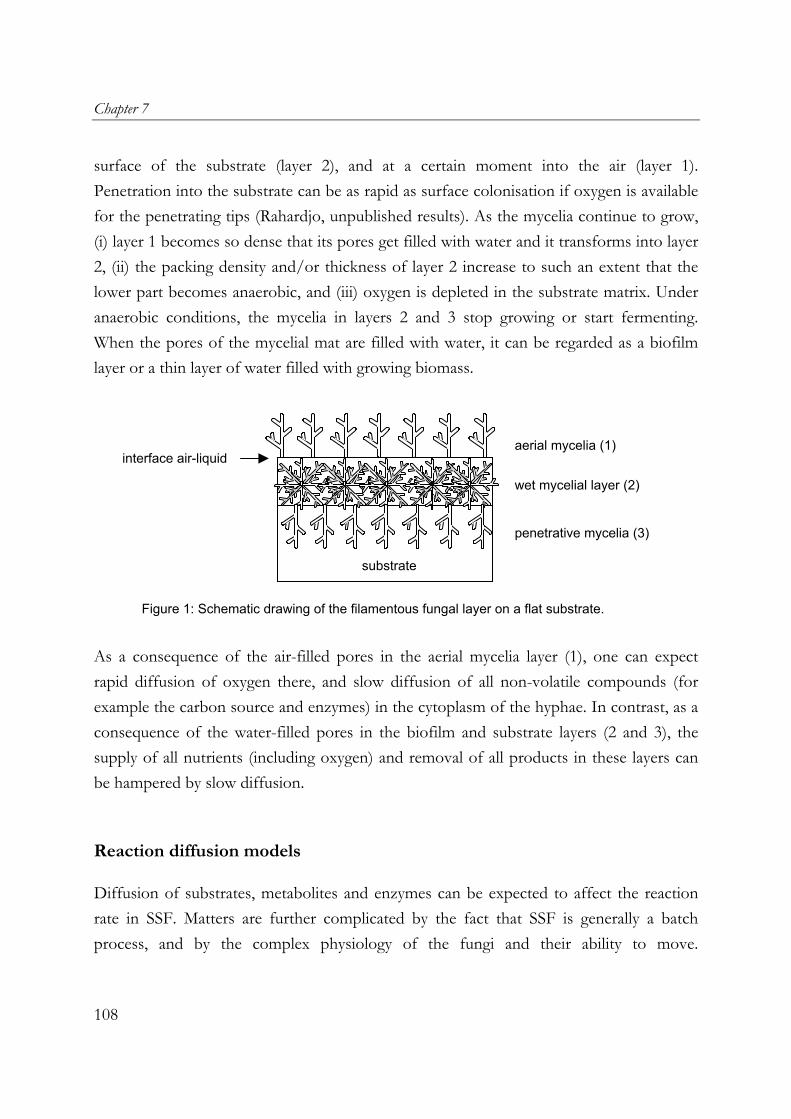
Chapter 7
surface of the substrate (layer 2), and at a certain moment into the air (layer 1). Penetration into the substrate can be as rapid as surface colonisation if oxygen is available for the penetrating tips (Rahardjo, unpublished results). As the mycelia continue to grow, (i) layer 1 becomes so dense that its pores get filled with water and it transforms into layer 2, (ii) the packing density and/or thickness of layer 2 increase to such an extent that the lower part becomes anaerobic, and (iii) oxygen is depleted in the substrate matrix. Under anaerobic conditions, the mycelia in layers 2 and 3 stop growing or start fermenting. When the pores of the mycelial mat are filled with water, it can be regarded as a biofilm layer or a thin layer of water filled with growing biomass.
substrate
penetrative mycelia (3)
wet mycelial layer (2)
aerial mycelia (1) interface air-liquid
Figure 1: Schematic drawing of the filamentous fungal layer on a flat substrate.
As a consequence of the air-filled pores in the aerial mycelia layer (1), one can expect rapid diffusion of oxygen there, and slow diffusion of all non-volatile compounds (for example the carbon source and enzymes) in the cytoplasm of the hyphae. In contrast, as a consequence of the water-filled pores in the biofilm and substrate layers (2 and 3), the supply of all nutrients (including oxygen) and removal of all products in these layers can be hampered by slow diffusion.
Reaction diffusion models
Diffusion of substrates, metabolites and enzymes can be expected to affect the reaction rate in SSF. Matters are further complicated by the fact that SSF is generally a batch process, and by the complex physiology of the fungi and their ability to move.
108

Modelling conversion and transport phenomena
Mathematical models would therefore be helpful to understand SSF, design better substrate properties and fermenters, and eventually manipulate SSF processes. Thiele (1939) was the first to model coupled reaction and diffusion phenomena in a catalyst particle. All models for coupled reaction and diffusion in bioreactors are based on the approach used by Thiele. However, considering the fact that each particle in SSF behaves as a small batch reactor – even if the reactor as a whole is operated as a continuous system in steady state – Thiele’s model needs to be extended to allow for the dynamic behaviour. Using Fick’s law and a mass balance over a thin slice of the layer that is to be modelled, the basic equation of all reaction diffusion models can be derived:
[1]
2
2C CD rt x
∂ ∂= +∂ ∂
Reaction diffusion models have been used to describe the transport by diffusion coupled to consumption or production of substances in many bio-systems, such as microbial biofilms for off-gas treatment (Ottengraf and van den Oever 1983), immobilised cells in bioreactors (De Gooijer et al. 1991; Wijffels et al. 1991; Hunik et al. 1994; Beuling et al. 1998), cultivation of cartilage (Malda et al. 2004), and many others. In this paper, we summarize reaction diffusion models that have been proposed to describe SSF and evaluate these models and their experimental validation. The models are classified according to the layers in the system as indicated in Figure 1, i.e. the fungal biofilm (layer 2), the substrate layer (with penetrative mycelia) (layer 3), and the aerial mycelia (layer 1). In addition, we discuss the models based on criteria shown in Table I. Furthermore, recent findings that are significant for improvement of the models are discussed at the end of the paper.
Models for fungal biofilms
Recently, a simple reaction diffusion model that was originally developed for microbial biofilms in off-gas purification systems (Ottengraf and van den Oever 1983) was applied
109

Chapter 7
Nag
el
(200
2)
+
subs
trate
+ + + +
Oos
tra
(200
1)
+
aero
bic
biof
ilm
+ + + +
Nop
hara
tana
(1
998)
+
aeria
l myc
elia
+ + + +
Raj
agop
alan
(1
995
and
1997
)
+
biof
ilm +
su
bstra
te
+ + + + + + +
Nan
daku
mar
(1
994
and
1996
)
+
aero
bic
biof
ilm
+ + + +
Mol
in
(199
3)
+
subs
trate
+ + + +
Mitc
hell
(199
1)
+
subs
trate
+ + + + +
Geo
rgio
u &
Shul
er
(198
5)
+
subs
trate
+ + + +
Tabl
e I.
Cla
ssifi
catio
n of
reac
tion
diffu
sion
mod
els
for f
unga
l gro
wth
in s
olid
-sta
te fe
rmen
tatio
n by
diff
eren
t aut
hors
crite
ria/a
utho
rs
dyna
mic
st
eady
-sta
te
syst
em b
ound
ary
diffu
sion
of o
xyge
n
gl
ucos
e
en
zym
e
w
ater
unic
ellu
lar
elon
gatin
g hy
phae
(ti
p di
ffusi
on)
kine
tics
on o
xyge
n
glu
cose
wat
er
colo
ny
over
-cul
ture
110

Modelling conversion and transport phenomena
to a fungal biofilm on a solid-substrate surface (Oostra et al. 2001). It was assumed that the diffusion of oxygen only occurred in one direction (Figure 2), that transport and reaction properties were constant throughout the fungal biofilm, that oxygen consumption obeyed zero-order kinetics, and that the biofilm was in a pseudo-steady state. Oxygen concentration profiles in the fungal biofilm were derived from Equation 1
with 2 0OCt
∂ =∂
:
[2]
22
22,
2. 1O
O s
C z zC δδ
= − +
which is only valid for , with z δ≤
[3]
0.52 2,
'''2
2 O O s
O
D Cr
δ
=−
and [4] − ='''
2/ 2
XO
X Or
Yµρ
CO2 is the measured oxygen concentration in the liquid phase at a certain depth z, CO2,s is the saturated oxygen concentration in water at the corresponding temperature, δ is the penetration depth of oxygen or the depth where CO2 = 0, rO2’’’ is the volumetric oxygen production rate, DO2 is the diffusion coefficient for oxygen in the biofilm, µ is the specific growth rate of the fungus, ρX is the packing density of the biomass in the fungal biofilm, and YX/O2 is the yield coefficient of fungal biomass on oxygen. Oostra et al. 2001 measured the oxygen concentration gradient during the cultivation of Rhizopus oligosporus on defined media using microelectrodes, and found that oxygen was absent at depths over 100 µm after 36 hours. All concentration profiles were in agreement with the model. Applying the same model, Rahardjo et al. (2002) reported a similar observation in a fungal biofilm of Aspergillus oryzae. Their measurements also demonstrated the absence of a concentration gradient in the aerial mycelia layer. Furthermore, they validated the predicted value of the overall oxygen uptake rate of the biofilm in a culture of A. oryzae without aerial mycelia. This was obtained by suppressing
111
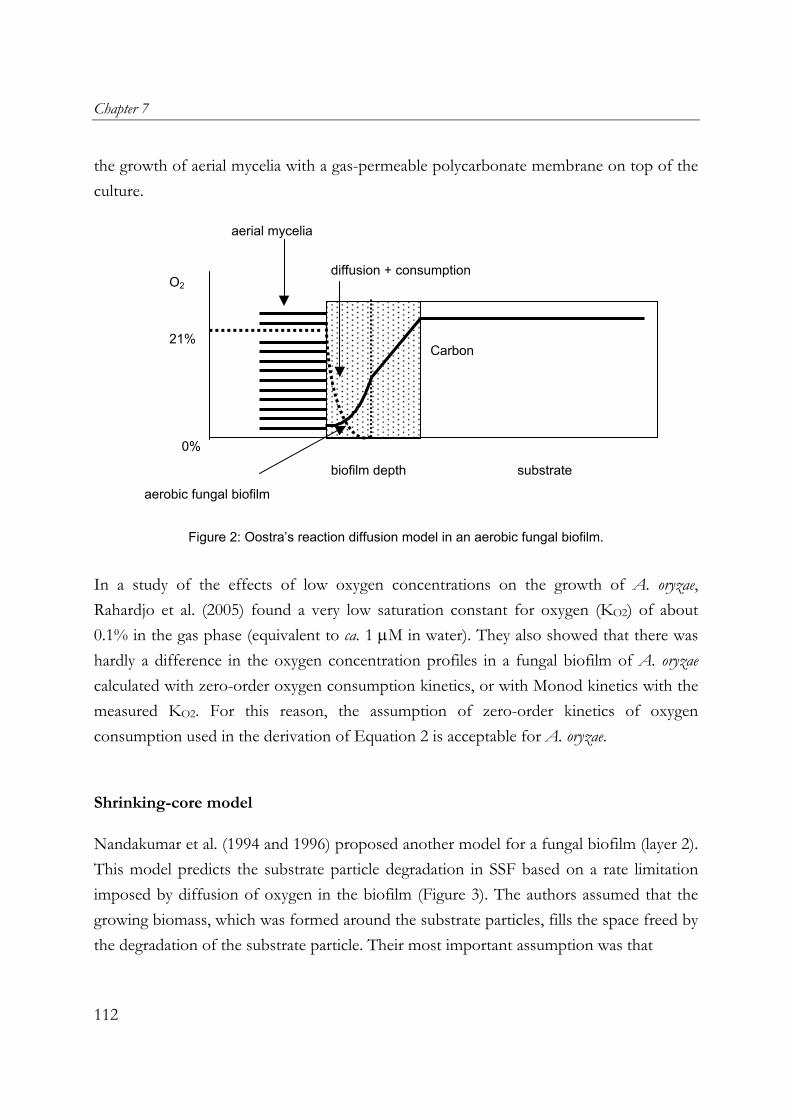
Chapter 7
the growth of aerial mycelia with a gas-permeable polycarbonate membrane on top of the culture.
diffusion + consumption
aerial mycelia
biofilm depth
Carbon
substrate
O2
21%
0%
aerobic fungal biofilm
Figure 2: Oostra’s reaction diffusion model in an aerobic fungal biofilm.
In a study of the effects of low oxygen concentrations on the growth of A. oryzae, Rahardjo et al. (2005) found a very low saturation constant for oxygen (KO2) of about 0.1% in the gas phase (equivalent to ca. 1 µM in water). They also showed that there was hardly a difference in the oxygen concentration profiles in a fungal biofilm of A. oryzae calculated with zero-order oxygen consumption kinetics, or with Monod kinetics with the measured KO2. For this reason, the assumption of zero-order kinetics of oxygen consumption used in the derivation of Equation 2 is acceptable for A. oryzae.
Shrinking-core model
Nandakumar et al. (1994 and 1996) proposed another model for a fungal biofilm (layer 2). This model predicts the substrate particle degradation in SSF based on a rate limitation imposed by diffusion of oxygen in the biofilm (Figure 3). The authors assumed that the growing biomass, which was formed around the substrate particles, fills the space freed by the degradation of the substrate particle. Their most important assumption was that
112
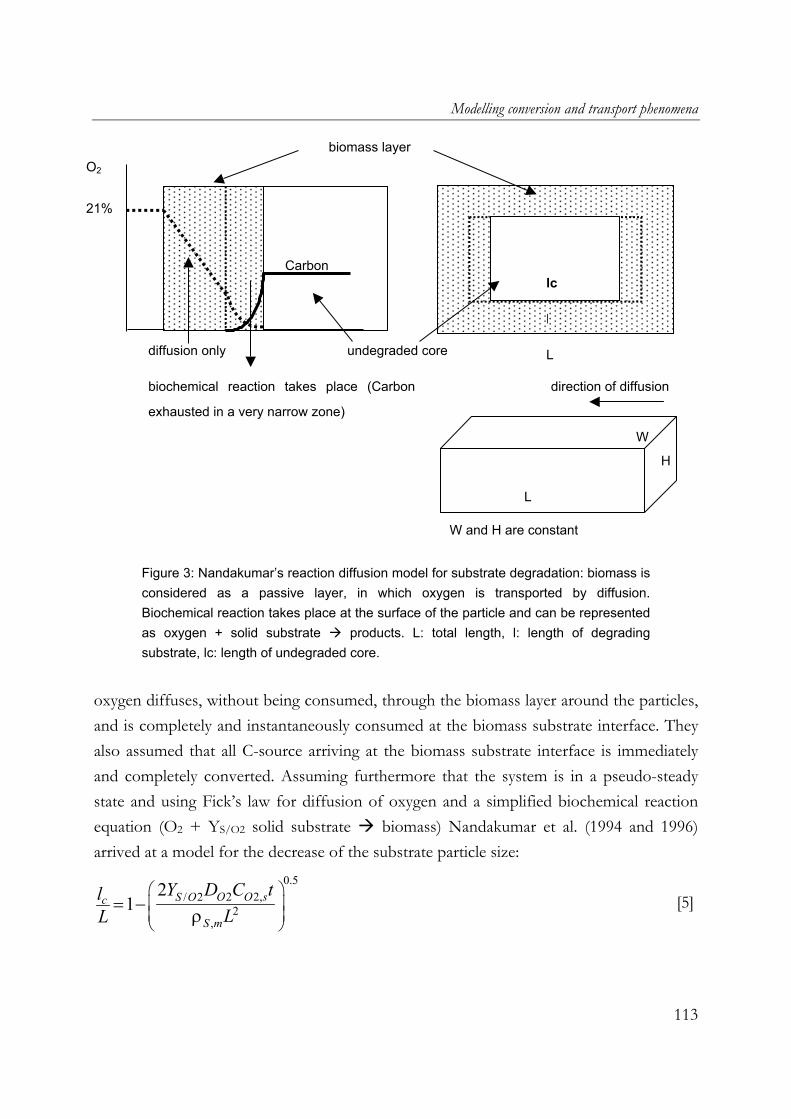
Modelling conversion and transport phenomena
biomass layer
undegraded core diffusion only
Carbon lc
l
L
direction of diffusion
O2
21%
biochemical reaction takes place (Carbon
exhausted in a very narrow zone)
W
H
L
W and H are constant
Figure 3: Nandakumar’s reaction diffusion model for substrate degradation: biomass is considered as a passive layer, in which oxygen is transported by diffusion. Biochemical reaction takes place at the surface of the particle and can be represented as oxygen + solid substrate products. L: total length, l: length of degrading substrate, lc: length of undegraded core.
oxygen diffuses, without being consumed, through the biomass layer around the particles, and is completely and instantaneously consumed at the biomass substrate interface. They also assumed that all C-source arriving at the biomass substrate interface is immediately and completely converted. Assuming furthermore that the system is in a pseudo-steady state and using Fick’s law for diffusion of oxygen and a simplified biochemical reaction equation (O2 + YS/O2 solid substrate biomass) Nandakumar et al. (1994 and 1996) arrived at a model for the decrease of the substrate particle size:
[5]
0.52 2,/ 2
2,
21 O O sS Oc
S m
Y D C tlLL ρ
= −
113
Chapter 7
where ρS,m is the molar density of the substrate, lc is the length of the undegraded core of the substrate particle, L is the constant total length of the colonised substrate particle, and CO2,s is the saturated oxygen concentration in water. The time (T) required for complete degradation of the particle (lc=0) will be:
[6]
2,
2 2,/ 22S m
O O sS O
LT
Y D Cρ
=
Despite the simplicity of the model and the ‘one-dimensional’ approach, particle diameters predicted with Equation 5 were close to measured values for cultures of A. niger on wheat bran (Nandakumar et al. 1994), except towards the end of the fermentation. For cultivation of Bacillus coagulans on wheat bran (Nandakumar et al. 1996), the theoretical curve of Equation 6 showed a good agreement with the experimental results only in the case of small particles. According to Nandakumar et al. (1994 and 1996), the deviation of the model in both cases was perhaps due to the fact that smaller particles contain mainly starch and larger particles contain more hemicellulose and cellulose. Because the microorganisms prefer free sugars and starch to hemicellulose and cellulose, a faster size reduction was expected in smaller particles compared to the larger particles. This motivation is in contradiction with the central assumption of the model, which is that oxygen uptake (and therefore all biochemical reactions) is localised at the biomass-substrate interface. This means that the carbon source must be depleted in a very narrow zone at the biomass-substrate interface (Figure 3). This can only be valid in case of very slow polymer hydrolysis, which can be due to very slow enzyme production or diffusion, or to very slow hydrolysis of hemicellulose and cellulose, and thus the model should be valid for larger particles. The models used by Oostra et al. and Nandakumar et al. are based on the assumption that the fungal biofilm is in steady state (Table I). Oostra et al. (2001) showed that their model can also be used to predict the initial development of the biofilm in time, until the onset of diffusion limitation, but these predictions were not validated. Nandakumar et al. (1994 and 1996) calculated the biofilm thickness at different moments in time, assuming that the oxygen profile in the biofilm instantaneously changes to the steady-state profile that
114
Modelling conversion and transport phenomena
would be found for the increased thickness. Their model also predicts how the oxygen uptake rate of the biofilm declines in time as the biofilm gets thicker, but this prediction was not validated. So these two simple steady-state models can predict some aspects of process dynamics, but none of them can predict both the initial increase in oxygen uptake rate, the plateau in the rate, and the final decline in the rate, that are commonly observed in SSF cultures. The following models do allow such predictions because they include the dynamics of many more phenomena in SSF.
Models for the substrate layer
Diffusion of glucose in the substrate
Georgiou and Shuler (1985) proposed a reaction diffusion model for glucose and other nutrients in a solid-substrate layer during SSF. They used these models to describe the growth of a mould colony on the surface of a flat agar substrate. These authors included the cellular differentiation, i.e. they distinguished vegetative cells, competent cells, conidiophores, and conidia. They applied Monod kinetics for the growth of each type of biomass with either glucose or nitrate or both as the limiting substrate. The colony expansion was calculated from the biomass production using a parameter for the number of hyphae per unit length, together with parameters for hyphal diameter and hyphal density. The results of the simulation suggested that mass-transfer limitations in the substrate matrix determine the proliferation of differentiated structures during cultivation on solid substrates. Georgiou and Shuler did not experimentally determine the model parameters; they used values from literature, which were derived from different types of micro-organisms and experiments. In addition, the study lacked an experimental validation to test the model. Molin et al. (1993) proposed a similar model, but did not include differentiated biomass. Colony expansion was described as a diffusion process, and glucose was the only limiting substrate. The significance of Molin’s model is the description of the contact area between the fungus and the substrate. They took into account that when the mycelia grow into the
115
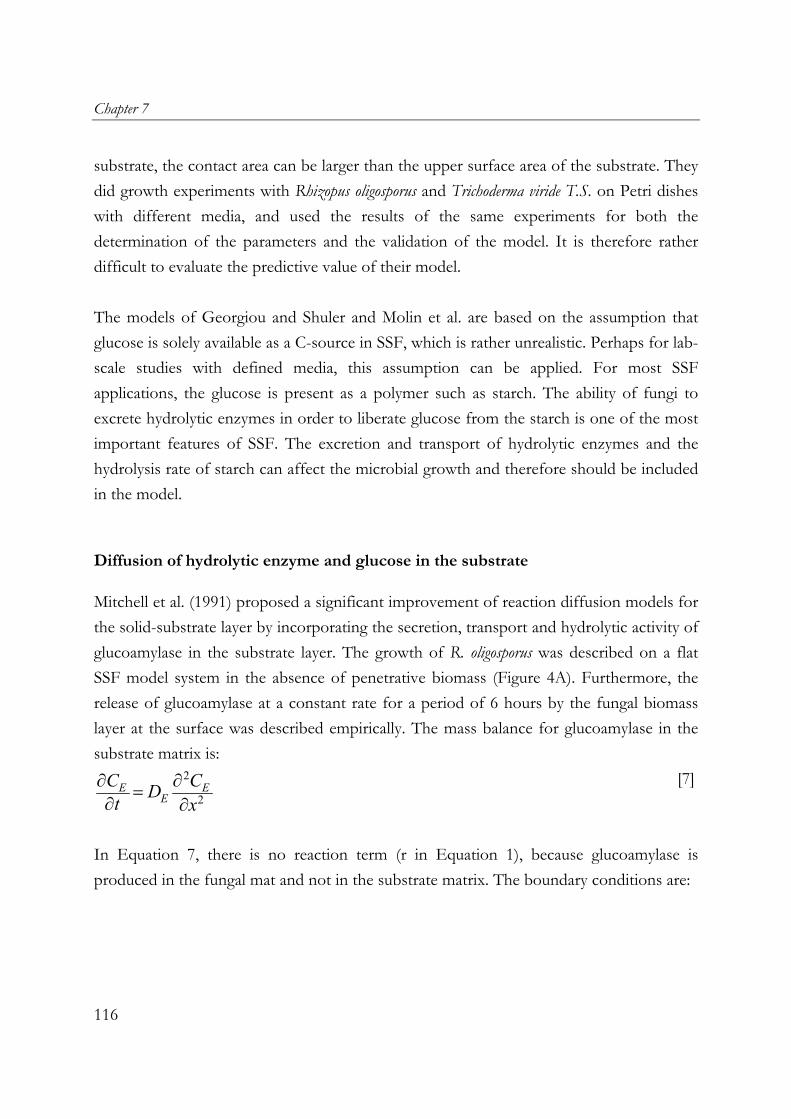
Chapter 7
substrate, the contact area can be larger than the upper surface area of the substrate. They did growth experiments with Rhizopus oligosporus and Trichoderma viride T.S. on Petri dishes with different media, and used the results of the same experiments for both the determination of the parameters and the validation of the model. It is therefore rather difficult to evaluate the predictive value of their model. The models of Georgiou and Shuler and Molin et al. are based on the assumption that glucose is solely available as a C-source in SSF, which is rather unrealistic. Perhaps for lab-scale studies with defined media, this assumption can be applied. For most SSF applications, the glucose is present as a polymer such as starch. The ability of fungi to excrete hydrolytic enzymes in order to liberate glucose from the starch is one of the most important features of SSF. The excretion and transport of hydrolytic enzymes and the hydrolysis rate of starch can affect the microbial growth and therefore should be included in the model.
Diffusion of hydrolytic enzyme and glucose in the substrate
Mitchell et al. (1991) proposed a significant improvement of reaction diffusion models for the solid-substrate layer by incorporating the secretion, transport and hydrolytic activity of glucoamylase in the substrate layer. The growth of R. oligosporus was described on a flat SSF model system in the absence of penetrative biomass (Figure 4A). Furthermore, the release of glucoamylase at a constant rate for a period of 6 hours by the fungal biomass layer at the surface was described empirically. The mass balance for glucoamylase in the substrate matrix is:
[7]
2
2E E
EC CDt x
∂ ∂=∂ ∂
In Equation 7, there is no reaction term (r in Equation 1), because glucoamylase is produced in the fungal mat and not in the substrate matrix. The boundary conditions are:
116
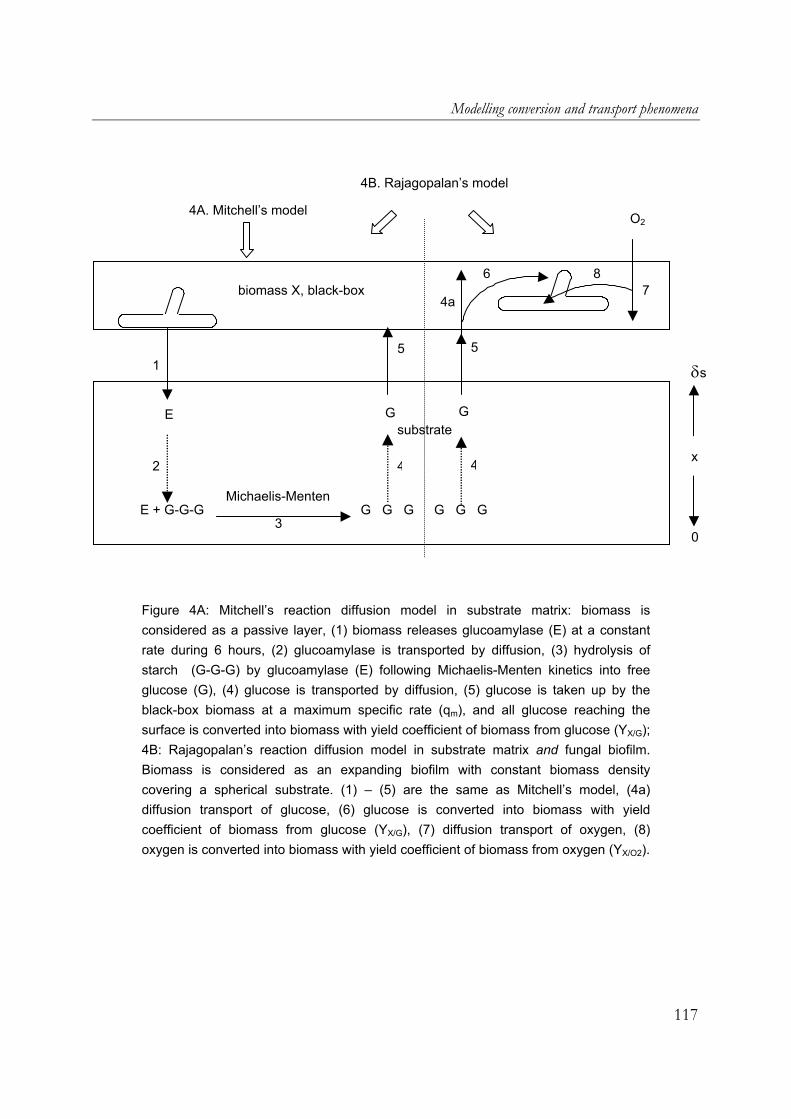
Modelling conversion and transport phenomena
4B. Rajagopalan’s model 4A. Mitchell’s model
5 1
5
G G G
4
G
3 G G G E + G-G-G
E
2
Michaelis-Menten
G substrate
4
δs
x
0
O2
8 7
4a
6 biomass X, black-box
Figure 4A: Mitchell’s reaction diffusion model in substrate matrix: biomass is considered as a passive layer, (1) biomass releases glucoamylase (E) at a constant rate during 6 hours, (2) glucoamylase is transported by diffusion, (3) hydrolysis of starch (G-G-G) by glucoamylase (E) following Michaelis-Menten kinetics into free glucose (G), (4) glucose is transported by diffusion, (5) glucose is taken up by the black-box biomass at a maximum specific rate (qm), and all glucose reaching the surface is converted into biomass with yield coefficient of biomass from glucose (YX/G); 4B: Rajagopalan’s reaction diffusion model in substrate matrix and fungal biofilm. Biomass is considered as an expanding biofilm with constant biomass density covering a spherical substrate. (1) – (5) are the same as Mitchell’s model, (4a) diffusion transport of glucose, (6) glucose is converted into biomass with yield coefficient of biomass from glucose (YX/G), (7) diffusion transport of oxygen, (8) oxygen is converted into biomass with yield coefficient of biomass from oxygen (YX/O2).
117
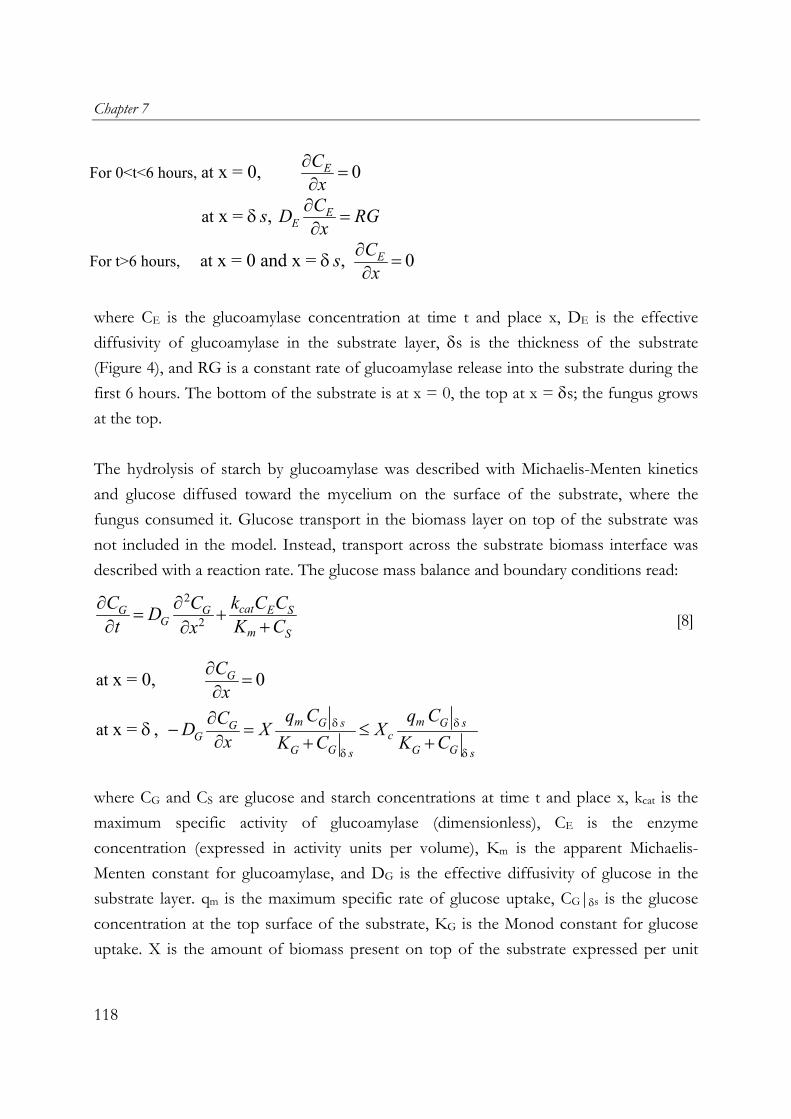
Chapter 7
For 0<t<6 hours,
For t>6 hours,
at
at
at
x = 0, 0
x = ,
x = 0 and x = , 0
E
EE
E
CxCs D RGx
Csx
δ
δ
∂ =∂
∂ =∂
∂ =∂
where CE is the glucoamylase concentration at time t and place x, DE is the effective diffusivity of glucoamylase in the substrate layer, δs is the thickness of the substrate (Figure 4), and RG is a constant rate of glucoamylase release into the substrate during the first 6 hours. The bottom of the substrate is at x = 0, the top at x = δs; the fungus grows at the top. The hydrolysis of starch by glucoamylase was described with Michaelis-Menten kinetics and glucose diffused toward the mycelium on the surface of the substrate, where the fungus consumed it. Glucose transport in the biomass layer on top of the substrate was not included in the model. Instead, transport across the substrate biomass interface was described with a reaction rate. The glucose mass balance and boundary conditions read:
[8]
2
2cat EG G
Gm S
C C k CDt Kx
∂ ∂= +∂ +∂
SCC
at
at
x = 0, 0
x = ,
G
m mG Gs sGcG
G GG Gs s
Cx
C Cq qCD X Xx C CK K
δ δ
δ δ
δ
∂ =∂
∂− = ≤∂ + +
where CG and CS are glucose and starch concentrations at time t and place x, kcat is the maximum specific activity of glucoamylase (dimensionless), CE is the enzyme concentration (expressed in activity units per volume), Km is the apparent Michaelis-Menten constant for glucoamylase, and DG is the effective diffusivity of glucose in the substrate layer. qm is the maximum specific rate of glucose uptake, CG|δs is the glucose concentration at the top surface of the substrate, KG is the Monod constant for glucose uptake. X is the amount of biomass present on top of the substrate expressed per unit
118

Modelling conversion and transport phenomena
surface area, and Xc is the maximum amount of biomass that actively takes up glucose; the plateau in the glucose uptake rate is based on experimental results. Growth was modelled with Monod kinetics and the biomass balance read:
[9]
/ /m mG Gs s
cX G X GG GG Gs s
C Cq qdX XY X Ydt C CK K
δ δ
δ δ
= ≤+ +
where YX/G is the yield coefficient of biomass from glucose, and YX/G.qm is equal to µ. As Mitchell et al. (1991) assumed that all the biomass above the substrate surface is aerial mycelia, or that the pores are filled with air, there was no oxygen limitation in the biomass layer and biomass growth was only limited by glucose. The plateau in the growth rate caused by Xc could be interpreted as a result of oxygen supply limitation, but there could also be another explanation (see the section about aerial mycelia below). For the validation of the model and determination of the parameters, Mitchell et al. (1991) did growth experiments with R. oligosporus on a kappa-carrageenan matrix containing cassava starch. To prevent the complexity of the fungal penetration into the substrate matrix, they applied a polycarbonate membrane between the medium and the inoculum. Several model parameters were determined from independent experiments, but they had to adjust the diffusion coefficient of glucoamylase and the glucose uptake kinetics of the fungus to fit the simulation of biomass growth and starch hydrolysis rate (in time) to the experimental results. With the adjusted parameters, the predicted biomass production and glucoamylase concentration profiles were in agreement with the experimental results. Mitchell et al. (1991) concluded that the diffusion of glucoamylase, which determines the glucose generation rate and which in turn determines the glucose transport rate to the substrate surface (read the fungal biomass), is the rate-limiting step during the cultivation. However, up to now there is neither a reliable measurement of glucoamylase diffusivity nor of glucoamylase concentration profiles in moistened solid substrate. The only measurements that can be related to the study of Mitchell were published by Nagel et al. (2002). Using nuclear magnetic resonance (NMR), Nagel et al. (2002)
119

Chapter 7
managed to measure the glucose concentration gradient in the substrate matrix during cultivation of A. oryzae. Their observation on the absence of glucose deep in the substrate matrix is in agreement with the slow diffusion of glucoamylase suggested by Mitchell et al. (1991). Observations done by Rahardjo et al. (2004 and In press) indicate that Mitchell’s assumption that glucoamylase is released only within the first 6 hours can be correct as far as the prediction of starch hydrolysis is concerned. The assumption implies that the total amount of glucoamylase in the substrate matrix remains constant during the rest of the cultivation; only the enzyme distribution changes with time. Rahardjo et al. (2004 and In press) observed that the activity (directly correlated to the amount) of α-amylase in the substrate layer remained constant in cultures of A. oryzae on sterilised wheat-flour disks. They also observed, however, that much larger amounts of enzyme accumulated in the fungal biofilm on top of the substrate and that enzyme production continued for a very long period. Perhaps the assumption of Mitchell et al. (1991) would be accurate enough for the description of the starch hydrolysis in the substrate layer, but it would be useful if we could also predict the total amount of enzyme produced by the fungus, as enzymes are important products from SSF.
Diffusion of water in the substrate
The fungal biomass layer on the substrate surface contains quite a significant amount of water (up to 2 kg.kg-1 DM, Nagel et al. 2001a). This water originates mainly from the solid substrate layer (Nagel et al. 2001a). Therefore, diffusion of water in the substrate layer should also be considered. Nagel et al. (2002) proposed a model to describe the moisture content gradient in the substrate due to water uptake by the fungus, and validated it for growth of A. oryzae on a model substrate that consisted of wheat flour and water. The model also predicted the shrinkage of a substrate matrix caused by the removal of water. Applying Equation 1, neglecting water production or utilization in the substrate, and using the mass fraction of water instead of the concentration of water, they arrived at:
[10]
2
2(1 )W W
Wx xDt x
ρρ
∂ − ∂=∂ ∂
Wx
120

Modelling conversion and transport phenomena
x = r
,
at x = 0, 0
s,
W
WW X X
d xdxd xD Xdx
ρ
ρδ
=
=
with x is the depth of the substrate matrix, ρ is the density of the substrate matrix, xW is the mass fraction of water, DW is the water diffusion coefficient in the substrate matrix, XW,X is the moisture content of the fungal biomass, rX is the biomass production rate. Note that there is no reaction term (r in Equation 1) in this model because it is assumed that there is no water production in the substrate matrix and only very little water is consumed for hydrolysis of starch. They assumed that water was the only moving compound in the substrate. Using mass balances for the water and the dry matter, they incorporated the shrinkage of the matrix in the model. When evaporation was minimised, the simulation results of the model of Nagel et al. (2002) were in good agreement with the moisture profiles measured using NMR. For a situation with evaporative cooling, the model of Nagel et al. (2002) predicted a decrease in fungal growth rate up to 50% after 50 hours based on the local aw at the substrate surface (Nagel et al. 2002). This clearly shows that the diffusion of water has to be included in a model for SSF. In addition, as indicated by Nagel et al. (2002), in a more realistic SSF system, the accumulation of solutes such as glucose and amino acids in the substrate matrix could affect the water transport and vice versa. Therefore, transport of solutes and hydrolytic enzymes, hydrolysis kinetics, and uptake of solutes should be taken into account to improve the model of Nagel et al.
Penetration of mycelia in the substrate
In the reaction diffusion models discussed above, penetration of mycelia into the substrate was neglected. In the associated experiments, penetration was suppressed by covering the substrate with a membrane before inoculation. However, the presence of penetrative hyphae is a typical feature of SSF. Chang and Trevithick (1974) suggested that the growing apical wall is more porous than the rigid mature wall and therefore allows the
121
Chapter 7
rapid diffusion of proteins, such as hydrolytic enzyme. Thus, the growing tips of penetrative mycelia could act as a moving source of enzymes (Varzakas 1998) and accelerate the transport of hydrolytic enzymes into the substrate matrix. Here, we compare diffusion of glucoamylase from the surface biomass (biofilm layer) with secretion at the tips of penetrating hyphae. The characteristic time td needed for diffusion of glucoamylase across a distance x can be calculated as follows:
2
2. 1E d
dE
D t xtDx
= ⇒ = [11]
Mitchell et al. (1991) used a diffusion coefficient of 7 x 10-13 m2.s-1 to fit their experimental results. The diffusion coefficient used by Mitchell et al. (1991) is comparable to the measured diffusion coefficient of penicilline-G acylase in a κ-carrageen gel (5 x 10-13 m2.s-1, van Roon, pers. comm.). Here, we vary the diffusion coefficient of glucoamylase from 5 x 10-12 to 5 x 10-13 m2.s-1. Assuming that the growing tips of penetrative hyphae continuously secrete glucoamylase, the transport rate of glucoamylase would be equal to the elongation rate of the tips. Using the observed extension rates vmax of A. oryzae in wheat flour (0.25 mm.h-1, Rahardjo, unpublished results) and of Coniothyrium minitans in starch-rich agar (0.07 mm.h-1, Oostra, unpublished results), the characteristic time for penetration of new tips can be calculated as follows:
maxp
xtv
= [12] Figure 5 shows the diffusion time (td) and the penetration time (tp) of glucoamylase in substrate particles with a characteristic size of 10-4 –10-2 m. This is the typical size of industrial SSF substrates such as wheat bran and soy grits. For most of this size range, the penetration of growing tips is faster than transport of enzymes by diffusion. Only for very small particles, in combination with a relatively high diffusion coefficient, diffusion would be faster than the penetration of growing tips.
122

Modelling conversion and transport phenomena
DG=5x10-12
DG=5x10-13
1.E-02
1.E+00
1.E+02
1.E+04
1.0E-04 1.0E-03 1.0E-02particle thickness (m)
diffu
sion
tim
e or
pen
etra
tion
time
(hou
rs)
vmax=0.25vmax=0.07
Figure 5: Theoretical diffusion time (solid line) and penetrating time (dashed-line) of glucoamylase for different sizes of substrate particles, calculated with two different D values and two different penetration rate values.
This calculation does not take into account that most fungi used in SSF need oxygen to elongate. Also, the penetration rates used in the calculation were observed in a system where oxygen was available at the side of the substrate opposite to the inoculated surface (Rahardjo, unpublished results; Oostra, unpublished results). This could mean that the transport of enzymes by penetrating hyphae is only of academic interest because oxygen in the substrate matrix will usually be depleted after a relatively short amount of time. However, there are some reasons to expect that penetrating hyphae may be important. In industrial SSF, it is difficult to provide homogeneous inoculation, or a seed coat may cause heterogeneous fungal biofilm growth on the substrate surface, and therefore heterogeneous oxygen availability inside the substrate particles. For example, Nagel et al. (2001b) observed that A. oryzae penetrates wheat grain at weak spots in the seed coat and invades the core of the grain only from these spots while little mycelium grows on most of the substrate surface. Furthermore, Rahardjo et al. (2005) observed that A. oryzae elongates it hyphae at a high rate even at very low oxygen concentrations, while only the branching frequency is reduced. This might indicate that penetrative mycelia could play an
123
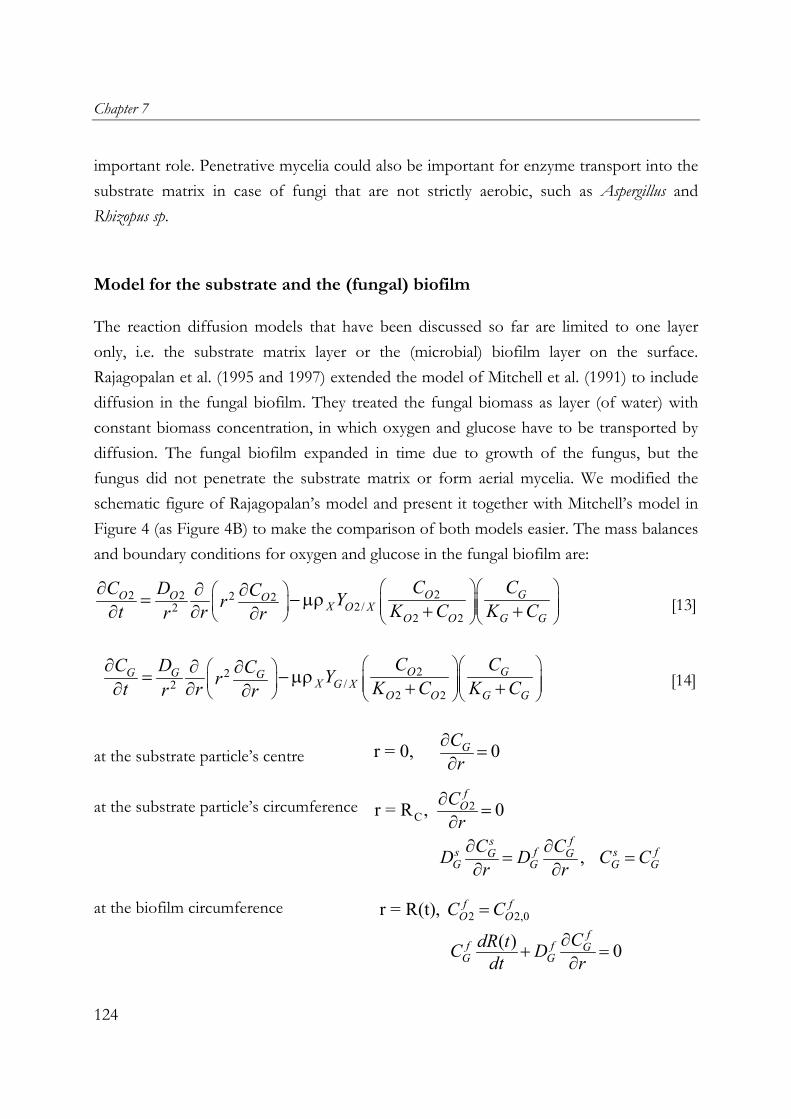
Chapter 7
important role. Penetrative mycelia could also be important for enzyme transport into the substrate matrix in case of fungi that are not strictly aerobic, such as Aspergillus and Rhizopus sp.
Model for the substrate and the (fungal) biofilm
The reaction diffusion models that have been discussed so far are limited to one layer only, i.e. the substrate matrix layer or the (microbial) biofilm layer on the surface. Rajagopalan et al. (1995 and 1997) extended the model of Mitchell et al. (1991) to include diffusion in the fungal biofilm. They treated the fungal biomass as layer (of water) with constant biomass concentration, in which oxygen and glucose have to be transported by diffusion. The fungal biofilm expanded in time due to growth of the fungus, but the fungus did not penetrate the substrate matrix or form aerial mycelia. We modified the schematic figure of Rajagopalan’s model and present it together with Mitchell’s model in Figure 4 (as Figure 4B) to make the comparison of both models easier. The mass balances and boundary conditions for oxygen and glucose in the fungal biofilm are:
[13]
22 2 2 22/2
2 2
O GO O OX O X
O O G G
C CC D C Yr K C K Ct rr rµρ
∂ ∂ ∂= −+ +∂ ∂ ∂
[14]
22/2
2 2
O GG G GX G X
O O G G
C CC D C Yr K C K Ct rr rµρ
∂ ∂ ∂= −+ +∂ ∂ ∂
r = 0, 0GC
r∂ =∂at the substrate particle’s centre
2
Cr = R , 0
,
fO
fsf fs sG G
G G G
CrC CD D Cr r
∂ =∂
∂ ∂= =∂ ∂ GC
at the substrate particle’s circumference at the biofilm circumference 2 2,0r = R(t),
( ) 0
f fO O
ff f GG G
C C
CdR tC Ddt r
=
∂+ =∂
124
Modelling conversion and transport phenomena
The first term on the right in the mass balances is the diffusion rate and the second term is the reaction rate (r in Equation 1). Diffusion of oxygen in the substrate matrix was neglected, as can also be seen from the boundary condition for r = Rc. Growth was described with double Monod kinetics; the particle was assumed to be spherical. µ is the maximum specific growth rate and KG is the saturation parameter for glucose, YO2/X is the yield coefficient of oxygen on biomass and KO2 is the saturation parameter for oxygen, r = 0 is the centre of the substrate particle, RC is the particle radius, subscript f is for biofilm layer, subscript s is for substrate layer, and CO2,0 is the oxygen concentration in the biofilm at the biofilm-air interface; the other symbols are the same as in the model of Mitchell et al. (1991). Equation 8 describes the diffusion of glucose in the substrate matrix, with an adjustment for spherical dimensions; diffusion of oxygen in the substrate matrix was neglected. The accumulation of biomass and the amount of biomass were described by:
[15]
( )22
2 2
d 4 dd
C
R tG O
XG G O OR
C CX r rK C K Ctµρ π
=+ +∫
[16]
3343 ( )X CX R t Rπρ
= −
Rajagopalan et al. (1995 and 1997) followed Mitchell et al. (1991) in their description of enzyme release into the substrate. They assumed that glucoamylase was released by the biofilm during the first 6 hours, only. The release rate was constant and the enzyme was released at the biofilm-substrate interface (r = RC). The simulation model predicted that oxygen limitation was more severe than glucose limitation. Rajagopalan et al. (1997) used experimental data on substrate particle size reduction collected by Nandakumar et al. (1996) to validate their model. They assumed that the decrease in particle volume was proportional to the amounts of glucose consumed by the biomass and accumulated in the microbial biofilm. The particle radius was calculated with the glucose balance:
125
Chapter 7
[17]
( )2 2
/0
4 ( ) 4C
R tt sfs G
G C GX GR
CD R dt X Y Cr
π π
∂ = +∂∫ ∫ r dr
This gives the following equation for the size of the particle:
[18]
1/3
2
0343( )
4
t ss GG C
CC
G
CD R dR t rR
π
πρ
∂= ∂
−∫ t
Using Equation 18, Rajagopalan et al. (1997) showed that their model was able to predict the general trend in particle size reduction from experiments done by Nandakumar et al. (1996). This is remarkable because the particle radius RC was assumed to be constant during the simulations and recalculated afterwards. This means that the effect of particle shrinkage on glucose and enzyme transport was neglected in the model. Rajagopalan’s approach to calculate the particle size reduction is different from Nagel’s (Nagel et al. 2002, see previous section). Rajagopalan et al. (1997) calculated the shrinkage of the substrate from the glucose loss, while Nagel et al. (2002) calculated the shrinkage from the water loss. In a more realistic SSF model, both approaches should be combined to calculate the shrinkage of the substrate matrix. Rajagopalan’s simulation of glucoamylase concentration profiles in the substrate particle showed that most of the glucoamylase remained in the exterior part of the particle. Rajagopalan et al. (1997) concluded that glucoamylase took more time to diffuse to the core of larger particles, and therefore the degradation time for larger particles was also expected to be longer. This suggests that for larger substrate particles, enzyme diffusion is more growth limiting than oxygen diffusion.
Model for aerial mycelia
The reaction diffusion models discussed so far apply to the fungal biofilm and moist substrate matrix. Both layers contain a large amount of water and it is therefore acceptable
126
Modelling conversion and transport phenomena
to assume that the diffusion process takes place in water. However, the pores of the aerial mycelia layer (Figure 1) are filled with air. Consequently, diffusion of oxygen in this layer is very rapid and the transport of all other substrates and non-volatile products must take place within the hyphal body. Olsson and Jennings (1991) experimentally showed that diffusion was indeed the mechanism of substrate transport in the hyphae. Nopharatana et al. (1998) proposed a model, based on reaction and diffusion within the aerial hyphae, to describe the growth of an aerial mycelium layer above the substrate surface. As the space between the aerial hyphae is filled with air, oxygen was assumed to be not limiting anywhere and glucose was assumed to diffuse via the hyphae from the substrate to the tips and it was assumed to be the only limiting nutrient. Thus, glucose accumulation in the hyphae depends on the glucose diffusion within hyphae and the consumption due to growth and maintenance. The mass balance and boundary conditions read:
[19]
/
1( / )G GGhyp
X G
C XC XD mXt x Y tx
∂ ∂ ∂∂= −∂ ∂ ∂∂
X−
p
s
at x = 0, / x = L , 0
G b hy
G
C CC
ρ=
=
where CG is glucose mass fraction in the hypha, Cb is the glucose concentration in the substrate (assumed to be constant), DGhyp is the glucose diffusion coefficient within the hypha, X is the concentration of hyphae in the air, m is the maintenance coefficient, and Ls is the arbitrary available space above surface (assumed Ls = 0.2 cm). Other symbols were explained earlier. This mass balance differs from that for the wet biofilm, because the area available for diffusion depends on the local concentration of hyphae in the air, as evident from the diffusion term in the mass balance. Nopharatana’s model also differs from the previous models because the fungal hypha is treated as an elongating entity (by incorporating the tip extension rate vmax), instead of a unicellular entity (with specific growth rate µ). The biomass production rate was calculated from the number of tips n at a particular position and time and the tip
127

Chapter 7
elongation rate, which was assumed to depend on the concentration of glucose at some distance (δz) behind the tip (this is a concept introduced for unknown reasons). The biomass dry weight balance reads:
[20]
max 1 G x zhyp
m GG x z
CXX nv a Xt CKδ
δ
ρ −
−
∂ −=∂ +
Note that no boundary conditions are needed, because there is no transport. vmax is the tip extension rate, a is the cross-sectional area of a single hypha, ρhyp is the density of hyphae, and the last two terms at the right-hand side are the logistic law with a maximum amount of biomass Xm and Monod kinetics with a saturation constant KG for glucose concentration (note that the grid spacing is set equal to δz). The hyphae form new tips and the tips move in space; tip movement is described as a diffusion process. Nopharatana et al. (1998) use the following balance and boundary conditions for the tips:
[21]
1 1G Gx z x zt t
m mG GG Gx z x z
C CX Xn nn DX Xt xC CK Kδ δ
δ δ
µ − −
− −
∂ ∂− −= +∂ ∂+ + x
∂∂
sat x = L , 0, 0n X= =
n is the number of tips at that particular location, µt is the specific generation rate of new tips and Dt is the tip diffusion coefficient in air. Note that the authors did not provide a boundary condition at , which is certainly required for the calculation. x = 0 We believe that the ideas underlying the model are valuable, but the model has some drawbacks: • The rate of tip movement should be proportional to the hyphal elongation rate, but
the diffusion model does not take this into account. • Elongation of aerial hyphae must involve flow of cytoplasm with concomitant glucose
transport; this is not taken into account. The dominant role of diffusion in hyphae was established in colony-growth experiments, where the glucose has to be transported against the cytoplasm flow from the periphery of the colony towards the centre of the
128
Modelling conversion and transport phenomena
colony. The diffusion of glucose in aerial hyphae might be insignificant compared to the transport of glucose by the flow of cytoplasm.
• The Monod terms should be calculated with the glucose concentration in the hyphae, instead of with the concentration over hyphae plus air, to avoid a dependence of the Monod constant KG on the volume fraction of hyphae in air.
• The tip balance requires a boundary condition at the substrate surface. The model of Nopharatana et al. predicted the increase of biomass density and biomass height from the substrate surface in time. When the biomass reached the maximum density Xm, the biomass concentration profile started to move upwards with a constant density wave front until it reached a height where glucose was depleted at the top. The assumption that the space between (aerial) mycelia is filled with air and that oxygen is not limiting there, was shown to be true until a depth of at least 4.5 mm from the top of aerial mycelia of A. oryzae (Rahardjo et al. 2002). Nopharatana et al. (2003) recently reported the first experimental data on the aerial hyphae concentration and compared the results to their previous modelling work (Nopharatana et al. 1998). They used confocal scanning laser microscopy to measure the spatial biomass distribution of aerial and penetrative hyphae in SSF. Because of a difference between the model system of Nopharatana et al. (1998) and the experimental system of Nopharatana et al. (2003), the comparison was only limited to the overall shape of the biomass concentration profile. However, this pioneering experimental work was enough to invalidate the assumption made previously (Nopharatana et al. 1998) of a maximum possible biomass density that is independent of height. This maximum possible biomass density may depend on substrate properties, such as a very low glucose concentration.
Perspectives for modelling of fungi in SSF
We have reviewed the reaction diffusion models that have been proposed to describe microbial growth and substrate transport in SSF. The models were categorised according to the different layers of the SSF system: the substrate matrix, the fungal biofilm on the substrate surface, and the aerial mycelia layer. Figure 6 shows a (more detailed than Figure
129
Chapter 7
1) conceptual illustration of filamentous fungal growth on solid substrate, which is a summary of the models reviewed in this paper. Because reaction diffusion models include substrate transport phenomena and at the same time conversion kinetics, the models reported here seem promising to provide more understanding of SSF. The validation of the oxygen concentration gradient in a fungal biofilm layer growing on a flat substrate surface by Oostra et al. (2001) and Rahardjo et al. (2002) confirms that reaction diffusion models are relevant for the fungal biofilm layer in SSF. However, the real situation in SSF is more complex, involving aerial mycelia, biofilm layers, and also penetrative mycelia. Up to now, there is no model that comprises all the different layers of the SSF system or includes all phenomena presented in Figure 6. There are clearly many phenomena, such as enzyme production, release and transport, glucose uptake in the absence of oxygen, and yield of biomass on oxygen, which need further study. We propose seven important issues that need to be addressed to provide more understanding of the SSF system and a firm basis for further modelling work. Note that these points are dependent on the organism of interest. We present here an example for aerobic filamentous fungi.
Physiology
More attention should be paid to the primary metabolism of the fungus. In the models of Mitchell et al. (1991) and Rajagopalan et al. (1994 and 1997), it was assumed that all glucose is converted aerobically. However, many fungi are capable of anaerobic fermentation. Carlsen et al. (1996), found ethanol and glycerol during batch cultivation of pellets of A. oryzae, and suggested that anaerobic conditions prevailed in the middle of the pellets. Oostra et al. (2001) found ethanol and RQ values higher than 1 (which indicates anaerobic fermentation) in a culture of R. oligosporus grown on defined media. Rahardjo et al. (2004) reported that the RQ value of cultures of A. oryzae on wheat-flour model substrate remained higher than 1 for a long time during the cultivation. The high RQ value coincided with a deficit in the carbon balance when only starch, glucose, fungal biomass and carbon dioxide were taken into account. This deficit was 40% at the beginning of the cultivation and decreased to 0% at the end of the cultivation. In a further study using a similar model system, Rahardjo et al. (unpublished results) also found ethanol, which indicates that anaerobic fermentation occurred in the fungal biofilm.
130
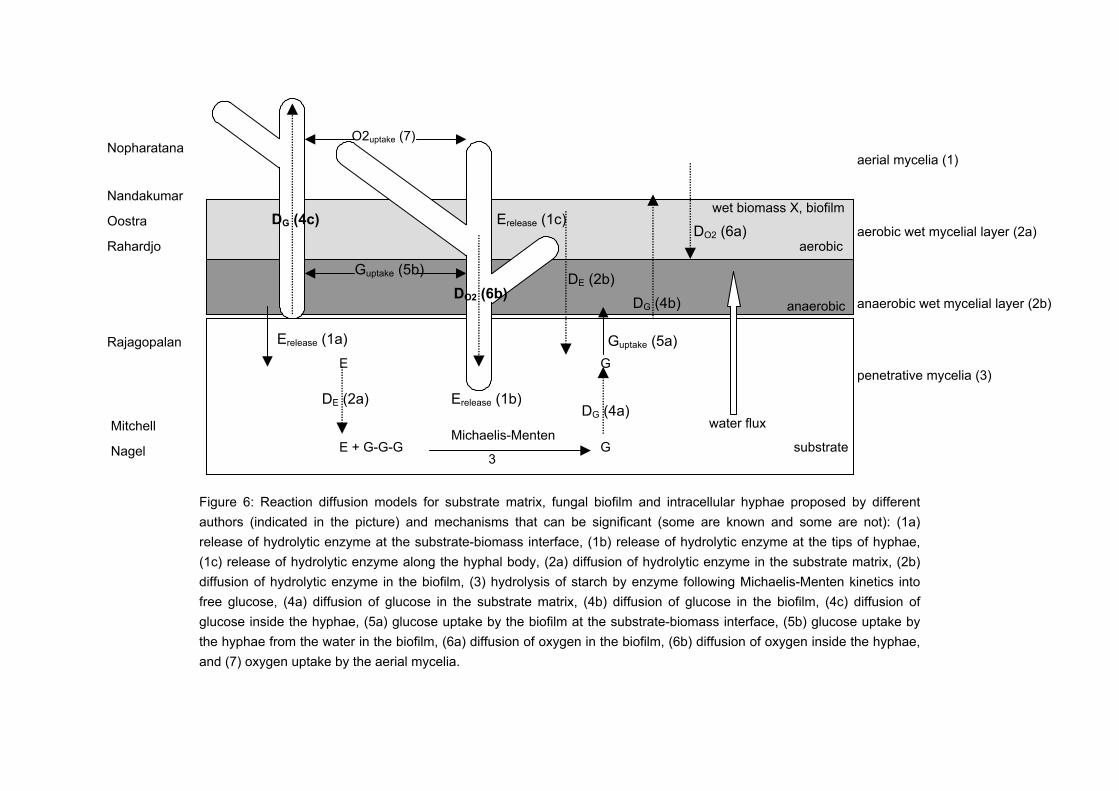
O2uptake (7)
Nopharatana aerial mycelia (1)
Nandakumar
Oostra
Rahardjo
wet biomass X, biofilm DG (4c) Erelease (1c)
DO2 (6a) aerobic wet mycelial layer (2a) aerobic
Guptake (5b) DE (2b) DO2 (6b) DG (4b) anaerobic wet mycelial layer (2b) anaerobic
Erelease (1a) Guptake (5a) Rajagopalan E G
penetrative mycelia (3)
DE (2a) Erelease (1b) DG (4a)
water flux Mitchell
Nagel Michaelis-Menten
substrate E + G-G-G G 3
Figure 6: Reaction diffusion models for substrate matrix, fungal biofilm and intracellular hyphae proposed by different authors (indicated in the picture) and mechanisms that can be significant (some are known and some are not): (1a) release of hydrolytic enzyme at the substrate-biomass interface, (1b) release of hydrolytic enzyme at the tips of hyphae, (1c) release of hydrolytic enzyme along the hyphal body, (2a) diffusion of hydrolytic enzyme in the substrate matrix, (2b) diffusion of hydrolytic enzyme in the biofilm, (3) hydrolysis of starch by enzyme following Michaelis-Menten kinetics into free glucose, (4a) diffusion of glucose in the substrate matrix, (4b) diffusion of glucose in the biofilm, (4c) diffusion of glucose inside the hyphae, (5a) glucose uptake by the biofilm at the substrate-biomass interface, (5b) glucose uptake by the hyphae from the water in the biofilm, (6a) diffusion of oxygen in the biofilm, (6b) diffusion of oxygen inside the hyphae, and (7) oxygen uptake by the aerial mycelia.

Chapter 7
When the oxygen uptake rate of such a culture was limited by suppressing the formation of aerial mycelia, more ethanol was found. Ruijter et al. (2004) found high concentrations of polyols, which are also reduced products compared to glucose, in a similar cultivation as done by Rahardjo et al. (2002 and 2004). The examples above show that anaerobic fermentation can be quite significant during cultivation of aerobic fungi. This is important because it will affect the carbon source concentration profile and may cause accumulation of inhibitory products or affect the water activity. This will in turn influence the biomass and enzyme production rates or perhaps also enzyme transport into the substrate. Clearly, more detailed studies on metabolism and physiology of the fungi of interest are necessary. Hydrolytic enzyme production is clearly a key element in SSF. Mitchell et al. (1991) were the first to include glucoamylase release in a mathematical model. They assumed that only a limited amount of glucoamylase is released into the substrate in the beginning of the fermentation. The results of Rahardjo et al. (2004 and In press) show that this may be a reasonable assumption if the goal is to predict starch hydrolysis, but they also show that this does not at all describe enzyme production properly. As many SSF processes aim at enzyme production, a better description of enzyme production kinetics is necessary. This should include the effects of the concentrations of inducers (e.g. oligosaccharides), repressors (e.g. glucose), and oxygen. Furthermore, as some fungi also produce proteases, the degradation of the enzyme of interest by proteases may have to be included.
Enzyme transport
Rahardjo et al. (2004 and In press) have shown that most of those hydrolytic enzymes produced in SSF remain in the fungal biomass layer and do not move into the substrate. This is very important, as it may imply that there is room for improvement of the supply of glucose to the fungus. The apparent immobility of the enzymes may be due to binding to an extracellular polysaccharide matrix, to the movement of water towards the biofilm-air interface that is induced by the uptake of water in new fungal cells and by evaporative cooling, or to the fact that extracellular enzymes produced by aerial mycelia simply have
132

Modelling conversion and transport phenomena
no water to move in. Clearly, more work is needed to elucidate these aspects. In order to apply and eventually extend the model of Mitchell et al. (1991), also reliable measurements of the diffusion coefficients of enzymes in the fungal mat and the substrate matrix are necessary.
Aerial mycelia
Recently, aerial mycelia were shown to be very significant for the oxygen uptake, biomass production and α-amylase production of A. oryzae cultivated on wheat-flour disks (Rahardjo et al. 2002 and In press). A large part of the oxygen uptake occurred in the aerial mycelia layer and the reaction diffusion model for fungal biofilms cannot describe this. It might be possible to predict this with an extended version of the model of Nopharatana et al. (1998). However, the physiological role of aerial mycelia is unclear and there are still fundamental questions about their function: Do the aerial mycelia produce extracellular hydrolytic enzymes? Rahardjo et al. (In press and submitted) found that the amount of α-amylase produced by A. oryzae is proportional to the amount of oxygen consumed, and the aerial hyphae can speed up the oxygen uptake enormously (Rahardjo et al. 2002). This suggests that aerial hyphae can accelerate enzyme production, but there is no proof that they produce these enzymes themselves. It might be worthwhile to stimulate aerial mycelia formation, but we do not know what triggers fungi to form them. Recent work of Rahardjo et al. (submitted) indicates that the presence of a seed coat on the substrate, the bed porosity and the particle size are important factors, but gives no guidelines for promoting aerial mycelia formation. Another important question is when and how the air-filled pores of the aerial mycelia layer are filled with water. Is this is a kind of wicking process? The logistic law in the model of Nopharatana et al. (1998) might be a simple way to account for the transition of aerial mycelia to a water-logged biofilm, which would soon suffer from oxygen limitation, although it is not a mechanistic description. It should be noted that many mechanisms behind the development of the fungal mat are still unknown, especially with regard to the onset of aerial mycelia formation and the
133

Chapter 7
transition of the aerial mycelia layer (1) to the wet fungal mat (2). The classical idea based on taxonomical studies is that fungi form aerial mycelia at the onset of sporulation. Another possible function of the aerial mycelia is to search for nutrients. However, this does not explain what induces aerial mycelia formation. The transition of the aerial mycelia layer into a wet fungal biofilm could be due to a gradual increase in the packing density of the aerial mycelia, which at some point allows capillary forces to elevate water from the biofilm or the substrate into the very small pores. How this can be reconciled with the observation that aerial mycelia are covered with hydrophobins (surface-tension-lowering proteins, which allow the hyphae to penetrate the water-air interface (Wessels 1999; Wösten and de Vocht 2000)) is unknown.
Physics
As has been reviewed in this manuscript, physical transport phenomena (for substrates, enzymes, other products, and water) are very important in SSF. Nagel et al. (2002) were the first who took water movement from the substrate matrix to the fungal mats, into account in an SSF study. If water evaporation at the gas-solid interface (meant for cooling of the system) is also considered in addition to water uptake by the fungal biomass, there will be a significant amount of water flowing upward. Because of its direction, this water flux can be advantageous for carbon transport to the fungal biomass, but it would be disadvantageous for oxygen and enzyme transport into the biofilm and substrate (Figure 6). Mitchell et al. (1991) and Rajagopalan et al. (1997) concluded that glucoamylase remained at the periphery of the substrate particle because of the slow diffusion. Perhaps the water flux towards the fungal biofilm is the main cause for the slow movement of glucoamylase and it is therefore important to incorporate the (counter-current) flow of water in models for enzyme transport.
Fungal mobility
Most models that have been presented in this review treat the fungus as a unicellular organism and do not account for its mobility (Oostra et al. 2001; Nandakumar et al. 1994,
134
Modelling conversion and transport phenomena
1996; Mitchell et al. 1991; Rajagopalan et al. 1995, 1997). It is generally accepted that the growth of filamentous fungi is basically a continuous elongation of the tips of hyphae and generation of new tips along the hyphal body. Many modelling studies based on this mode of growth have been done for cultivation of fungi in submerged culture (SmF), for growth and fragmentation of loose filaments (Nielsen and Krabben, 1995), as well as pellet formation (Yang et al. 1991; Lejeune and Baron 1996; Meyerhoff et al. 1995; Meyerhoff and Bellgardt 1995). More information on this topic can be found in a recent review (Papagianni 2004). Several modelling studies for colony growth on solid substrate have also taken the mobility of the fungus into account (Prosser and Trinci 1978; Edelstein and Segel 1983; Georgiou and Shuler 1985; Viniegra-Gonzales et al. 1992; Molin et al., 1993), but only two of these take the transport of substrates into account (Georgiou and Shuler 1985; Noparathana et al. 1998). In addition, there is the model for aerial mycelia of Noparathana et al. (1998), which also includes transport of solutes. To date, no model for penetration of mycelia into the substrate has been published, although this might be important for enzyme transport. Based on published work, it is clear that models simulating in detail the location and direction of growth of each single hypha can predict realistic behaviour of fungal biofilms (Lejeune and Baron 1996; Meyerhoff et al. 1995). It is also clear, however, that they are extremely computer intensive and hard to validate in detail, and need assumptions about the mechanisms directing elongation of hyphae and branch formation that have not been validated yet. We see more future for models based on the average rate of movement and branch formation of the assembled hyphae at a certain location (Molin et al. 1994; Meyerhoff and Bellgardt 1995; Noparathana et al. 1998). Maybe it is no wonder that these models all describe elongation of hyphae as a diffusion process instead of a convection process, because this will further speed up the calculations and avoids many complications with instability of numerical integration. Finally, models describing the fungus as a unicellular organism may be sufficient for simulating the fungal biofilm (layer 2), while allowing significant savings in computer time.
135

Chapter 7
Model validation
Only a few models for SSF at particle scale have been rigorously validated. Microelectrodes and NMR have been demonstrated to be valuable tools. It might also be worthwhile to do microelectrode measurements of the glucose concentration in a fungal biofilm. Beuling et al. 1998 measured glucose diffusion coefficients in nitrifying biofilms using microelectrodes. A similar experimental set-up could be applied to validate the model of Rajagopalan et al. (1995 and 1997). The microelectrode used to measure the glucose concentration was applicable for very low glucose concentrations up to 2 mM (Beuling et al. 1998). This concentration is higher than the glucose concentration measured in the substrate matrix just below the top surface in a culture of A. oryzae after 64 hours (Nagel et al. 2002). Thus, the glucose concentrations in the fungal biofilm are expected to be within the measurable range of the microelectrodes. Methods used for model validation have to balance between the desire to measure many variables easily and the desire to stay as close to the real situation in SSF as possible. A good example of this labile balance is the work of Rahardjo et al. (2004) on the use of membrane filters to facilitate the separation of the biomass and the substrate. They showed that membrane filters, which are used in many studies to prevent the penetration of fungal biomass into the substrate layer, reduced the activity of α-amylase measured in the substrate matrix, and affected several other aspects of physiology.
The next generation of particle-scale models for SSF
Even simple reaction diffusion models based on a (pseudo-) steady state can provide more understanding of the complex system of fungal growth in SSF, and have the potential to predict part of the dynamics of SSF. The potential of such simple models to predict dynamics should get more attention, because they are far more easily integrated in a bioreactor model than the models that predict the dynamics of gradient development more extensively, but have to revert to numerical solution methods.
136

Modelling conversion and transport phenomena
Most models available today predict the dynamic state of fungal growth and the most common substrates and products, such as glucose, oxygen, water and enzymes (see also Table I for a summary), using numerical solution methods. We have discussed many modifications needed in such models; the most critical ones are (Figure 6): • a more realistic prediction of enzyme production and movement, • prediction of penetrative mycelia, biofilm layer and aerial mycelia, including the
transition of biofilm mycelia to aerial mycelia and vice versa; for this, the description of fungal mobility should be considered
• a description of (an)aerobic conversions, • incorporation of convective water movement in the mass transport calculation, • in addition, more experimental work (for examples: confocal scanning laser
microscopy (CSLM), and microelectrode and NMR measurements) is needed to validate the models.
Nomenclature
a cross-sectional area of a hypha [L2] C concentration of a substance [L-3M] or [L-3N] CE glucoamylase concentration [L-3M] or [L-3N] CG glucose concentration [L-3M] or [L-3N] CO2 oxygen concentration [L-3M] or [L-3N] CO2,s saturated oxygen concentration in water [L-3M] or [L-3N] CS starch concentration [L-3M] or [L-3N] DG diffusion coefficient of glucose [L2T-1] DGhyp diffusion coefficient of glucose within hyphae [L2T-1] DE diffusion coefficient of glucoamylase [L2T-1] DO2 diffusion coefficient of oxygen [L2T-1] Dt diffusion coefficient of tip [L2T-1] DW diffusion coefficient of water [L2T-1] dx change in thickness [L] δ penetration depth of oxygen [L]
137

Chapter 7
δs substrate thickness [L] δz length of tip extension zone [L] f for biofilm layer KG saturation constant for glucose uptake [L-3M] Km Michaelis-Menten constant for glucoamylase [L-3M] KO2 saturation parameter for oxygen [L-3M] kcat catalytic rate constant of glucoamylase L total length [L] Ls available space above surface [L] l length of degrading substrate [L] lc length of undegraded core [L] m maintenance coefficient [MM-1T-1] µ specific growth rate [T-1] µt specific generation of tips [T-1] n number of tips qm maximum specific glucose uptake [MM-1T-1] RG a constant rate of glucoamylase release into the substrate [unitL-2T-1] Rc substrate particle diameter [L] r reaction term [L-3NT-1] rO2’’’ volumetric oxygen production rate [L-3NT-1] rX biomass production rate [ML-2T-1] ρ density of substrate matrix [L-3M] ρhyp density of hyphae [L-3M] ρX biomass density [L-3M] ρW density of water [L-3M] ρS density of solute [L-3M] ρS,m molar density of substrate [L-3N] s for substrate layer T time required for complete degradation of the substrate particle [T] t time [T] td theoretical diffusion time [T] tp theoretical penetration time [T]
138

Modelling conversion and transport phenomena
vmax tip extension rate [LT-1] X biomass concentration [L-3M] Xc critical biomass concentration [L-3M] Xm maximum amount of biomass [L-3M] XW,X moisture content of biomass [MM-1] x location [L] xW mass fraction of water [MM-1] YS/O2 yield coefficient of substrate on oxygen [MM-1] or [NN-1] YX/G yield coefficient of biomass on glucose [MM-1] or [NN-1] YX/O2 yield coefficient of biomass on oxygen [MM-1] or [NN-1] z distance of a system in vertical direction [L]
Acknowledgement
The authors would like to thank Joseph Geerligs for his help with the ethanol measurements.
References
Auria R, Revah S. 1994. Pressure drop as a method to evaluate mould growth in solid-state fermenters. In: Advances in Bioprocess Engineering, E. Galindo, Ramirez OT, eds pp 289-294. The Netherlands:Kluwer Academic Publishers.
Beuling EE, van Dusschoten D, Lens P, van den Heuvel JC, van As H, Ottengraf PP. 1998. Characterization of the diffusive properties of biofilms using pulsed field gradient-nuclear magnetic resonance. Biotechnol Bioeng 60:283-291.
Campbell-Platt G. 1994. Fermented foods – a world perspective. Food Research Int 27:253-257.
139

Chapter 7
Carlsen M, Spohr AD, Nielsen J, Villadsen J. 1996. Morphology and physiology of an α-amylase producing strain of Aspergillus oryzae during batch cultivations. Biotechnol Bioeng 49:266-276.
Chang PLY, Trevithick JR. 1974. How important is secretion of exoenzymes through apical cell walls of fungi. Arch Microbiol 101:281-293.
De Gooijer CD, Wijffels RH, Tramper J. 1991. Growth and substrate consumption of Nitrobacter agilis cells immobilized in carrageenan: Part 1. Dynamic modelling. Biotechnol Bioeng 38:224-231.
Durand A. 2003. Bioreactor designs for solid-state fermentation. Biochem Eng Journal 13:113-125.
Edelstein L, Segel LA. 1983. Growth and metabolism in mycelial fungi. J Theor Biol 104:187-210.
Georgiou G, Shuler ML. 1985. A computer model for the growth and differentiation of a fungal colony on solid substrate. Biotechnol Bioeng 28:405-416.
Hunik JH, Bos CG, van den Hoogen MP, De Gooijer CD, Tramper J. 1994. Co-immobilized Nitrosomonas europaea and Nitrobacter agilis cells: validation of a dynamic model for simultaneous substrate conversion and growth in kappa-carrageenan gel beads. Biotechnol Bioeng 43:1153-1163.
Ishida H, Hata Y, Kawato A, Abe Y, Suginami K, Imayasu S. 2000. Identification of functional elements that regulate the glucoamylase-encoding gene (glaB) expressed in solid-state culture of Aspergillus oryzae. Curr Gen 37:373-379.
Ito K, Kimizuka A, Okazaki N, Kobayashi S. 1989. Mycelial distribution in rice koji. J Ferm Bioeng 68:7-13.
Lejeune R, Baron GV. 1996. Simulation of growth of a filamentous fungus in three dimensions. Biotechnol Bioeng 53:139-150.
140
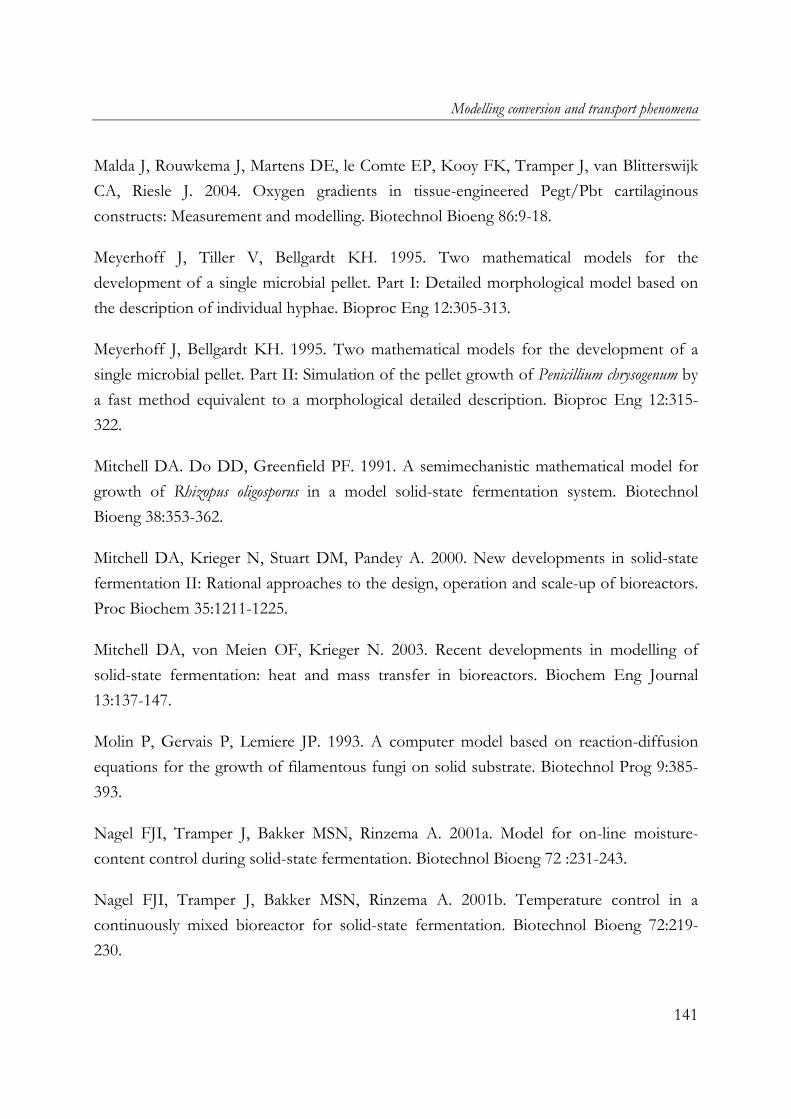
Modelling conversion and transport phenomena
Malda J, Rouwkema J, Martens DE, le Comte EP, Kooy FK, Tramper J, van Blitterswijk CA, Riesle J. 2004. Oxygen gradients in tissue-engineered Pegt/Pbt cartilaginous constructs: Measurement and modelling. Biotechnol Bioeng 86:9-18.
Meyerhoff J, Tiller V, Bellgardt KH. 1995. Two mathematical models for the development of a single microbial pellet. Part I: Detailed morphological model based on the description of individual hyphae. Bioproc Eng 12:305-313.
Meyerhoff J, Bellgardt KH. 1995. Two mathematical models for the development of a single microbial pellet. Part II: Simulation of the pellet growth of Penicillium chrysogenum by a fast method equivalent to a morphological detailed description. Bioproc Eng 12:315-322.
Mitchell DA. Do DD, Greenfield PF. 1991. A semimechanistic mathematical model for growth of Rhizopus oligosporus in a model solid-state fermentation system. Biotechnol Bioeng 38:353-362.
Mitchell DA, Krieger N, Stuart DM, Pandey A. 2000. New developments in solid-state fermentation II: Rational approaches to the design, operation and scale-up of bioreactors. Proc Biochem 35:1211-1225.
Mitchell DA, von Meien OF, Krieger N. 2003. Recent developments in modelling of solid-state fermentation: heat and mass transfer in bioreactors. Biochem Eng Journal 13:137-147.
Molin P, Gervais P, Lemiere JP. 1993. A computer model based on reaction-diffusion equations for the growth of filamentous fungi on solid substrate. Biotechnol Prog 9:385-393.
Nagel FJI, Tramper J, Bakker MSN, Rinzema A. 2001a. Model for on-line moisture-content control during solid-state fermentation. Biotechnol Bioeng 72 :231-243.
Nagel FJI, Tramper J, Bakker MSN, Rinzema A. 2001b. Temperature control in a continuously mixed bioreactor for solid-state fermentation. Biotechnol Bioeng 72:219-230.
141
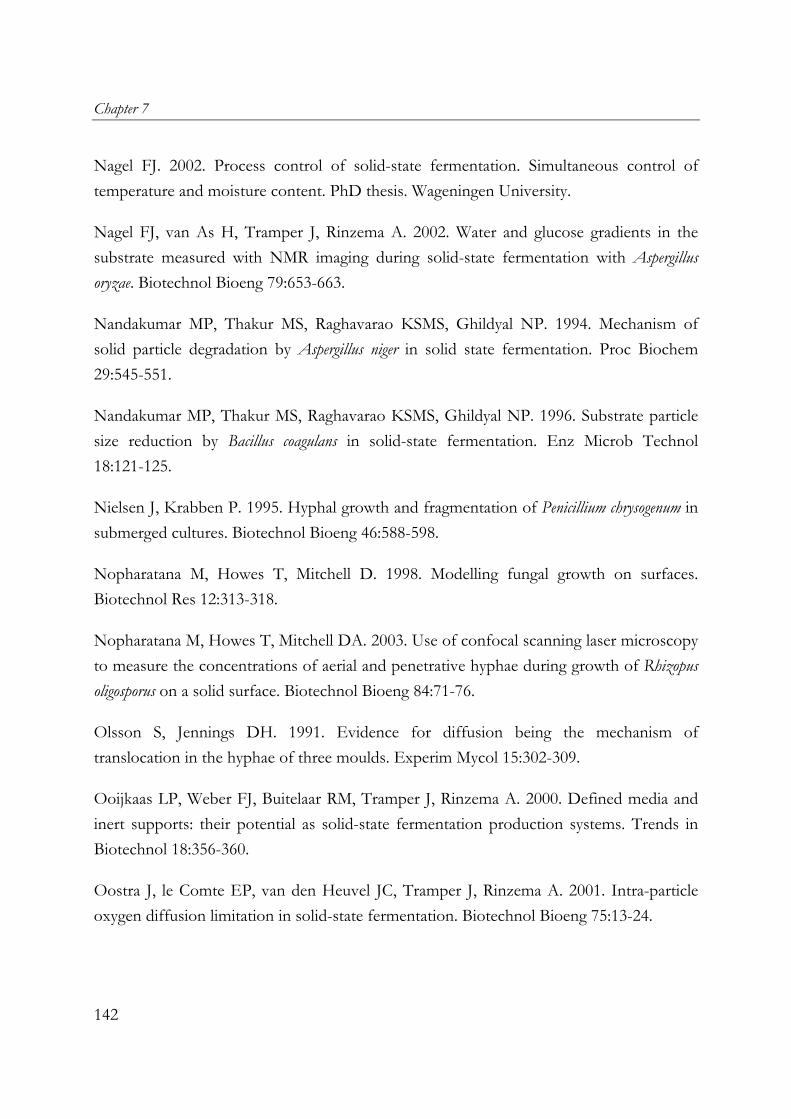
Chapter 7
Nagel FJ. 2002. Process control of solid-state fermentation. Simultaneous control of temperature and moisture content. PhD thesis. Wageningen University.
Nagel FJ, van As H, Tramper J, Rinzema A. 2002. Water and glucose gradients in the substrate measured with NMR imaging during solid-state fermentation with Aspergillus oryzae. Biotechnol Bioeng 79:653-663.
Nandakumar MP, Thakur MS, Raghavarao KSMS, Ghildyal NP. 1994. Mechanism of solid particle degradation by Aspergillus niger in solid state fermentation. Proc Biochem 29:545-551.
Nandakumar MP, Thakur MS, Raghavarao KSMS, Ghildyal NP. 1996. Substrate particle size reduction by Bacillus coagulans in solid-state fermentation. Enz Microb Technol 18:121-125.
Nielsen J, Krabben P. 1995. Hyphal growth and fragmentation of Penicillium chrysogenum in submerged cultures. Biotechnol Bioeng 46:588-598.
Nopharatana M, Howes T, Mitchell D. 1998. Modelling fungal growth on surfaces. Biotechnol Res 12:313-318.
Nopharatana M, Howes T, Mitchell DA. 2003. Use of confocal scanning laser microscopy to measure the concentrations of aerial and penetrative hyphae during growth of Rhizopus oligosporus on a solid surface. Biotechnol Bioeng 84:71-76.
Olsson S, Jennings DH. 1991. Evidence for diffusion being the mechanism of translocation in the hyphae of three moulds. Experim Mycol 15:302-309.
Ooijkaas LP, Weber FJ, Buitelaar RM, Tramper J, Rinzema A. 2000. Defined media and inert supports: their potential as solid-state fermentation production systems. Trends in Biotechnol 18:356-360.
Oostra J, le Comte EP, van den Heuvel JC, Tramper J, Rinzema A. 2001. Intra-particle oxygen diffusion limitation in solid-state fermentation. Biotechnol Bioeng 75:13-24.
142
Modelling conversion and transport phenomena
Ottengraf SPP, van den Oever. 1983. Kinetics of organic-compound removal from waste gases with a biological filter. Biotechnol Bioeng 25:3089-3102.
Ottengraf SPP, van den Heuvel JC. 1996. Microelectrodes. Willaert RG, Baron GV, De Backer L, editors. Immobilised living cell systems: Modelling and experimental methods. New York:John Wiley & Sons. pp.147-176.
Pandey A, Soccol CR, Mitchell D. 2000. New developments in solid-state fermentation: I-bioprocesses and products. Proc Biochem 35:1153-1169.
Pandey A. 2003. Solid-state fermentation. Biochem Eng Journal 13:81-84.
Papagianni M. 2004. Fungal morphology and metabolite production in submerged mycelial processes. Biotechnol Adv 22:189-259.
Prosser JI, Trinci APJ. 1978. A model for hyphal growth and branching. J Gen Microbiol 111:153-164.
Raghavarao KSMS, Ranganathan TV, Karanth NG. 2003. Some engineering aspects of solid-state fermentation. Biochem Eng Journal 13:127-135.
Rahardjo YSP, Weber FJ, le Comte EP, Tramper J, Rinzema A. 2002. Contribution of aerial hyphae of Aspergillus oryzae to respiration in a model solid-state fermentation system. Biotechnol Bioeng 78:539-544.
Rahardjo YSP, Korona D, Haemers S, Weber FJ, Tramper J, Rinzema A. 2004. Limitations of membrane cultures as a model solid-state fermentation system. Lett Appl Microbiol 39:504-508.
Rahardjo YSP, Weber FJ, Haemers S, Tramper J, Rinzema A. Aerial mycelia of Aspergillus oryzae accelerate α-amylase production in a model solid-state fermentation system. Enzyme Microb Technol. In press.
Rahardjo YSP, Susana Sie, Weber FJ, Tramper J, Rinzema A. 2005. Effect of low oxygen concentrations on growth and α-amylase production of Aspergillus oryzae in model solid-state fermentation systems. Biomol Eng 21:163-172.
143
Chapter 7
Rahardjo YSP, Jolink F, Haemers S, Tramper J, Rinzema A. Significance of bed porosity, bran and specific surface area in solid-state cultivation of Aspergillus oryzae. Submitted.
Rajagopalan S, Modak JM. 1995. Evaluation of relative growth limitation due to depletion of glucose and oxygen during fungal growth on a spherical solid particle. Chem Eng Sci 50:803-811.
Rajagopalan S, Rockstraw DA, Munson-McGee SH. 1997. Modeling substrate particle degradation by Bacillus coagulans biofilm. Biores Technol 61:175-183.
Ruijter GJG, Visser J, Rinzema A. 2004. Polyol accumulation by Aspergillus oryzae at low water activity in solid-state fermentation. Microbiology 150:1095-1101.
Thiele EW. 1939. Relation between catalytic activity and size of particle. Ind Eng Chem 31:916-920.
Varzakas T. 1998. Rhizopus oligosporus mycelial penetration and enzyme diffusion in soya bean tempe. Proc Biochem 33:741-747.
Viniegra-Gonzales G, Saucedo-Castaneda G, López-Isunza F, Favela-Torres E. 1992. Symmetric branching model for the kinetics of mycelial growth. Biotechnol Bioeng 42:1-10.
de Vrije T, Antoine N, Buitelaar RM, Bruckner S, Dissevelt M, Durand A, Gerlagh M, Jones EE, Luth P, Oostra J. 2001. The fungal biocontrol agent Coniothyrium minitans: production by solid-state fermentation, application and marketing. Appl Microbiol Biotechnol 56:58-68.
Wessels JGH. 1999. Fungi in their own right. Fungal Gen Biol 27:134-145.
Wijffels RH, De Gooijer CD, Kortekaas S, Tramper J. 1991. Growth and substrate consumption of Nitrobacter agilis cells immobilized in carrageenan: Part 2. Model evaluation. Biotechnol Bioeng 38:232-240.
Wösten HAB, de Vocht ML. 2000. Hydrophobins, the fungal coat unraveled. Biochim Biophys Acta 1469:79-86.
144

Modelling conversion and transport phenomena
145
Yang H, Reichl U, King R, Gilles ED. 1991. Measurement and simulation of the morphological development of filamentous microorganisms. Biotechnol Bioeng 39:44-48.


Summary
Solid-State Fermentation or Solid-Substrate Fermentation (SSF) is defined as the growth of a microorganism in a layer of moist solid substrate with air as the continuous phase. No free-moving water is present, but there is enough moisture present for the growth and metabolism of the microorganism. In the last 20 years, a growing interest in SSF has been shown by a significant increase in numbers of publications on this topic. The difficulties in process control and scaling-up of SSF cause a relatively slow development of SSF compared to submerged fermentation (SmF). In comparison to SmF, in which the microbial biomass and the substrates are homogeneously distributed in a liquid phase, SSF involves heterogeneous interactions of microbial biomass with moist solid substrate. The near absence of water in SSF promises a more efficient downstream process. However, it also implies there is no possibility to use movement of water for rapid heat transport, as is common in SmF. The lack of water in SSF causes a serious problem in heat removal, which is one of the major concerns in process control in SSF. Therefore, it is important to know what causes heat production in SSF. It is well known that metabolic heat production is proportional to oxygen uptake. Oxygen uptake in SSF can be limited by diffusion in the microbial mat or the substrate. The research project that is presented in this thesis aimed at providing information on oxygen uptake and growth and enzyme production in SSF at the substrate particle level. Filamentous fungi have unique morphological characteristics, which allow these microorganisms to colonise and penetrate the solid substrate in search for nutrients, and therefore they are excellently suitable for SSF. The tubular hyphae that emerge from the spore elongate at the tip and at the same time along the hyphae, new branches are formed. The branches continue branching to form a porous three-dimensional network of hyphae, which is known as mycelium. Mycelial mats can be present inside the substrate matrix between the solid substrate fragments (penetrative mycelia), and on the surface of the substrate. The pores of the latter can be filled with moisture or air (aerial mycelia). In this thesis, study on the growth and productivity of the different layers of filamentous fungal
147
Summary
mats in SSF at the substrate particle level is presented. Oxygen uptake, which is commonly used as a growth indicator, and biomass and α-amylase production by the different layers of the fungal mats of Aspergillus oryzae grown on SSF model systems are described. The ability of filamentous fungi to penetrate the substrate matrix is typical in SSF. However, the tight interaction between the mycelia and the solid substrate does not allow a complete recovery of the biomass, which hinders estimates of growth rates and yields. Cultivation on membrane filters is commonly used to prevent the penetration of hyphae into the substrate matrix and therefore this method allows a complete recovery of the biomass. Membrane filters are placed between the substrate and the biomass layer and have a limited open surface area. Consequently, they do not only prevent the penetration of the hyphae into the substrate, but they may also introduce some limitations by hindering enzyme or nutrient transport between the substrate and the biomass layer. In overcultures of A. oryzae on sterilized wheat-flour discs overlaid with a polycarbonate membrane, the presence of membrane filters reduces the maximum respiration rate (up to 50%), as well as biomass and α-amylase production. The advantage of membrane cultures, i.e. total recovery of biomass, is not very evident for the system used, while the changes in metabolism and kinetics are serious drawbacks. In overcultures of A. oryzae on a wheat-flour disc, aerial hyphae contributed up to 75% of the oxygen uptake rate by the fungus. This is due to the fact that A. oryzae forms very abundant aerial mycelia and diffusion of oxygen in the gas-filled pores of the aerial hyphae layer is rapid. This shows that diffusion in the densely packed mycelial layer that is formed closer to the substrate surface and that has liquid-filled pores is not limiting for A. oryzae. It also means that the overall oxygen uptake rate for A. oryzae is much higher than the oxygen uptake rate that can be predicted only for the densely packed mycelial layer. As can be expected from the high oxygen uptake rate in such a cultivation, the presence of aerial mycelia of A. oryzae results in a strong increase in fungal biomass and α-amylase production. Cultures of A. oryzae on wheat-flour model substrate produce twice the amounts of fungal biomass and α-amylase when aerial mycelia are formed. Heat
148
Summary
production was estimated from the amount of oxygen uptake and it was shown that heat removal using evaporative cooling is theoretically feasible in cultures of A. oryzae with aerial mycelia, but shrinkage will require non-conventional fermenter types. Utilization of these findings in commercial solid-state fermenters needs further research; results from packed beds of grain indicate that aerial mycelia are of limited importance there. Probably substrate pre-treatment and an increase in bed voidage are required. There are other factors that also play an important role in the oxygen uptake rate and α-amylase production during the growth of A. oryzae on wheat grain and wheat flour pellets. The high oxygen uptake rate found during cultivation of A. oryzae on wheat-flour model substrate is not reached on wheat grain. This is mainly due to the presence of the bran of the wheat grains. In cultivation of A. oryzae on wheat-flour pellets, it was shown that extra open space around the substrate increases oxygen uptake and α-amylase production. Furthermore, the peak oxygen uptake rate decreases with the surface-area/volume ratio of the substrate particles, while the cumulative oxygen uptake and α-amylase production per gram of initial substrate dry matter increase. It is known that oxygen supply into the mycelial mats can be hampered by diffusion limitation. For aerobic fungi, like A. oryzae, this oxygen depletion can be a severely limiting factor for growth and metabolite production. Coupled diffusion/reaction models can be used to describe the complex process in the fungal mat. However, little is known about the sensitivity of the growth and enzyme production of A. oryzae to the oxygen concentration. Potato dextrose agar medium is used to study the effect of a low oxygen concentration on hyphal elongation rate and branching frequency, and radial extension rate of colonies of A. oryzae. For both the branching frequency of individual hyphae and the colony extension rate, similar Monod constants (KO2) of 0.1% oxygen (v/v in the gas phase) are found. The reduction in growth rate is slightly more pronounced when A. oryzae is grown as an overculture on wheat-flour model substrate, which may be due to diffusion limitation in the fungal mat. Experimental results also show that the specific α-amylase production rate in overcultures is already reduced at 0.25% (v/v) oxygen. Although the effect of a low oxygen concentration on growth of A. oryzae seems more severe when grown as an overculture on polymeric substrate, oxygen concentrations
149
Summary
150
higher than 1% (v/v) do not significantly reduce the growth. Because the value of KO2 is relatively low compared to the oxygen concentration in the air, the growth kinetics of A. oryzae can be simplified to zero-order kinetics in coupled diffusion/reaction models. Little is known about the micro-scale phenomena and their influence on the fermentation characteristics and metabolic responses in SSF. In the final chapter, the occurrence of micro-scale phenomena in SSF is explained and the consequences are discussed. The inevitable concentration gradients inside substrate particles and microbial biofilms in SSF are needed for the transport of substrates and products. These gradients have been suggested to be crucial for the product characteristics obtained in SSF, but have also been proven to result in inactivity or undesired side-activities of part of the microbes. Because of the complexity of an SSF system, mathematical models are needed to understand it and to design better substrate properties and fermenters, and eventually manipulate SSF processes. The proposed coupled conversion and diffusion models for SSF from literature are critically evaluated. There is however no model that comprises all essential phenomena in SSF, let alone a model that can explain production of SSF-specific products. Based on recent findings in the field and from this research, important issues that need to be addressed in further modelling work are discussed.
Samenvatting
Vaste-stoffermentatie of vast-substraatfermentatie wordt gedefinieerd als het kweken van micro-organismen in een laag vochtig vast substraat met lucht als de continue fase. Er is geen vrij stromend water, maar wel voldoende vocht voor groei en metabolisme. In de afgelopen 20 jaar is de belangstelling voor vaste-stoffermentatie gegroeid, zoals onder andere blijkt uit de significante toename van het aantal publicaties op dit gebied. De moeilijkheden bij procesbeheersing en opschaling van vaste-stoffermentaties hebben tot gevolg dat de ontwikkeling ervan relatief langzaam gaat ten opzichte van vloeistoffermentatie. In vergelijking met vloeistoffermentatie, waarin de microbiële biomassa en het substraat homogeen zijn verdeeld in een vloeibare fase, is er bij vaste-stoffermentatie sprake van heterogene interacties tussen microbiële biomassa en vochtig vast substraat. Het feit dat water nagenoeg afwezig is in vaste-stoffermentaties belooft een efficiëntere opwerking, maar het heeft ook tot gevolg dat er geen mogelijkheden zijn om de stroming van water te gebruiken voor een snelle afvoer van warmte, zoals gebruikelijk is in vloeistoffermentaties. Het gebrek aan water in vaste-stoffermentatie veroorzaakt serieuze problemen bij de warmteverwijdering, wat daardoor één van de belangrijkste problemen is bij de beheersing van vaste-stoffermentatie. Daarom is het interessant om te weten waardoor warmteproductie in vaste-stoffermentatie wordt veroorzaakt. Het is bekend dat de metabole warmteproductie evenredig is met de opname van zuurstof. Zuurstofopname in vaste-stoffermentatie kan beperkt zijn door diffusie in de microbiële mat of het substraat. Het onderzoeksproject dat beschreven staat in dit proefschrift is gericht op het verkrijgen van informatie over zuurstofopname, groei en enzymproductie in vaste-stoffermentatie op deeltjesniveau. Filamenteuze schimmels hebben een unieke morfologie, die deze micro-organismen in staat stelt om vast substraat te koloniseren en te penetreren op zoek naar voedingstoffen, en ze daardoor bij uitstek geschikt maakt voor vaste-stoffermentaties. De schimmel groeit door zijn draden (hyphen) aan het uiteinde te verlengen en tegelijkertijd te vertakken. De vertakkingen gaan door met vertakken zodat een driedimensionaal netwerk van hyphen
151
Samenvatting
wordt gevormd, dat bekend staat als mycelium. Matten hiervan kunnen aanwezig zijn binnenin de substraatmatrix tussen brokjes vast substraat (penetrerende schimmel) en op het oppervlak van het substraat. Van de laatstgenoemde kunnen de poriën gevuld zijn met vocht of lucht (luchtmycelium). Dit proefschrift beschrijft een studie naar de groei en productiviteit van de verschillende lagen van de schimmelmat van de schimmel Aspergillus oryzae in vaste–stoffermentatie. De zuurstofopname, die een goede indicator is voor groei en warmteproductie, en de schimmelbiomassa- en α-amylaseproductie worden beschreven. Het vermogen van filamenteuze schimmels om de substraatmatrix binnen te dringen is kenmerkend voor vaste-stoffermentatie. De nauwe interactie tussen het mycelium en het vaste substraat maakt echter een volledige terugwinning van mycelium onmogelijk, wat de schatting van groeisnelheden en opbrengsten belemmert. Membraanfilters worden vaak gebruikt om het binnendringen van hyphen in de substraatmatrix te voorkomen en een volledige terugwinning van de schimmelbiomassa mogelijk te maken. De membraanfilters worden geplaatst tussen het substraat en de biomassalaag en hebben een beperkt open oppervlak. Hierdoor voorkomen ze niet alleen binnendringen van de hyphen in het substraat, maar kunnen ze ook het transport van enzymen en nutriënten tussen het substraat en de schimmelmat belemmeren. In oppervlaktecultures van A. oryzae op schijfjes van gesteriliseerd tarwemeel bedekt met een polycarbonaatmembraan wordt de maximale ademhalingsnelheid verlaagd (tot 50%) door de aanwezigheid van het membraan, evenals de schimmelbiomassa- en α-amylaseproductie. Het voordeel van het kweken met membranen, namelijk volledige terugwinning van schimmelbiomassa, is niet erg duidelijk voor het gebruikte systeem, terwijl de veranderingen in metabolisme en kinetiek serieuze nadelen zijn. In oppervlaktecultures van A. oryzae op schijfjes van tarwemeel dragen de luchtmycelium voor 75% bij aan de zuurstofopnamesnelheid van de schimmel. Dit komt doordat A. oryzae enorm veel luchtmycelium vormt en diffusie van zuurstof in de gas-gevulde poriën van de lucht-myceliumlaag snel is. Dit toont aan dat de diffusie in de dichtgepakte myceliumlaag, die wordt gevormd dichtbij het substraatoppervlak en waarin de poriën gevuld zijn met vocht, niet limiterend is voor A. oryzae. Dit betekent ook dat de
152

Samenvatting
zuurstofopnamesnelheid van A. oryzae veel hoger is dan de snelheid die voorspeld wordt voor alleen de dichtgepakte, met vocht-gevulde myceliumlaag. Zoals verwacht kan worden op basis van de hoge zuurstofopnamesnelheid leidt de aanwezigheid van luchtmycelium tot een sterke toename in schimmelbiomassa- en α-amylaseproductie. Culturen van A. oryzae op een tarwemeel-modelsubstraat produceren twee keer zoveel schimmelbiomassa en α-amylase wanneer luchtmycelium gevormd wordt. De warmteproductie is geschat op basis van de hoeveelheid opgenomen zuurstof en er is aangetoond dat warmteverwijdering door middel van verdampingskoeling theoretisch uitvoerbaar is in culturen van A. oryzae met luchtmycelium. Krimp van het uitdrogende substraat zal echter een niet-conventioneel bioreactortype vereisen. Voor toepassing van deze resultaten in commerciële vaste-stofbioreactoren is meer onderzoek nodig; resultaten met gepakte bedden van graankorrels tonen aan dat luchtmycelium daarin minder van belang is. Waarschijnlijk is hiervoor een substraatvoorbehandeling en een toename in de ruimte tussen de korrels in het bed vereist. Er zijn andere factoren die ook een belangrijke rol spelen in de zuurstofopnamesnelheid en α-amylaseproductie tijdens de groei van A. oryzae op tarwekorrels. De hoge zuurstof-opnamesnelheid die is gevonden tijdens het kweken van A. oryzae op een tarwemeel-modelsubstraat wordt niet bereikt op een tarwekorrel. Dit wordt vooral veroorzaakt door de aanwezigheid van de zemelen rondom de tarwekorrels. In cultivatie van A. oryzae op tarwemeelpellets is het aangetoond dat extra open ruimte om het substraat heen leidt tot een verhoogde zuurstofopname en α-amylaseproductie. De piek in de zuurstofopname-snelheid neemt echter af met de oppervlakte/volume-verhouding van het substraatdeeltje, terwijl de cumulatieve zuurstofopname en α-amylaseproductie per gram initieel substraat-drooggewicht toeneemt. Het is bekend dat de zuurstoftoevoer in de myceliummat beperkt kan worden door diffusielimitatie. Voor aërobe schimmels, zoals A. oryzae, kan het tekort aan zuurstof een sterk beperkende factor zijn voor groei en metabolietproductie. Gekoppelde diffusie/reactie modellen kunnen worden gebruikt om de complexe processen in de schimmelmatten te beschrijven. Er is echter weinig bekend over de gevoeligheid van de
153
Samenvatting
groei en enzymproductie van A. oryzae voor de zuurstofconcentratie. Aardappeldextrose-agarmedium is gebruikt om het effect van een lage zuurstofconcentratie op de ver-lengingsnelheid en vertakkingsfrequentie van de hyphen en de radiale groeisnelheid van kolonies van A. oryzae te bestuderen. Voor zowel de vertakkingsfrequentie van individuele hyphen als de uitbreidingsnelheid van de kolonies is een vergelijkbare Monod-constante (KO2) van 0.1% zuurstof (v/v in de gasfase) gevonden. De afname in groeisnelheid is sterker wanneer A. oryzae wordt gekweekt als een oppervlaktecultuur op een modelsubstraat van tarwemeel. Dit wordt waarschijnlijk veroorzaakt door diffusielimitatie in de schimmelmat. Experimentele resultaten tonen ook aan dat de specifieke α-amylase productiesnelheid in oppervlakteculturen al verlaagd is bij 0.25% (v/v) zuurstof. Hoewel het effect van een lage zuurstofconcentratie op de groei van A. oryzae dus sterker blijkt te zijn in een oppervlaktecultuur op een polymeer substraat, hebben zuurstofconcentraties hoger dan 1% (v/v) geen significant vertragend effect op de groei. Omdat de waarde van KO2 relatief laag is ten opzichte van de zuurstofconcentratie in de lucht, kan de groeikinetiek van A. oryzae vereenvoudigd worden tot nulde-orde kinetiek in gekoppelde diffusie/reactie modellen. Er is weinig bekend over de verschijnselen op microschaal en hun invloed op de fermentatiekarakteristieken en het metabolisme van schimmels in vaste-stoffermentaties. In het laatste hoofdstuk wordt het optreden van de verschijnselen op microschaal in vaste-stoffermentatie uitgelegd en de consequenties besproken. Concentratiegradiënten binnen substraatdeeltjes en microbiële biofilms zijn nodig voor het transport van substraten en producten in vaste-stoffermentatie. Van deze gradiënten wordt enerzijds gezegd dat ze cruciaal zijn voor het verkrijgen van de kenmerkende productkarakteristieken van vaste-stoffermentaties, maar anderzijds dat ze leiden tot inactiviteit of ongewenste nevenactiviteiten van een gedeelte van de micro-organismen. Vanwege de complexiteit van vaste-stoffermentaties zijn wiskundige modellen nodig voor een beter begrip, om betere substraateigenschappen en bioreactoren te kunnen ontwerpen, en om eventueel het vaste-stoffermentatieproces te kunnen manipuleren. In de literatuur voorgestelde gekoppelde conversie en diffusie modellen voor vaste-stoffermentaties zijn kritisch geëvalueerd. Er is echter geen model dat alle essentiële verschijnselen in vaste-stoffermentatie beschrijft, laat staan een model dat de productie
154

Samenvatting
155
van specifieke producten kan verklaren. Gebaseerd op recente vondsten in dit vakgebied en dit onderzoek, worden belangrijke punten voor toekomstig modelleerwerk besproken.

Acknowledgements
I have been exceptionally lucky to come so far, given a chance to pursue a PhD while millions of my fellow countrymen are still struggling to get even the basic education. I am very grateful for the academic achievement, as well as all other things I learned during my PhD time. For this, I am especially indebted to many people. In these most-widely read pages of the thesis, I would like to acknowledge these people. Arjen, thank you for many things! Your confidence to employ me as your PhD student while I was still staying in Indonesia is the first thing. Your perfectionism and analytical aptitude are impressive. I learned a lot from working with you. The quality and readability of my manuscripts improved significantly thanks to your critical and never-ending corrections. Thank you also for being patient with me while I kept putting ‘a’ and ‘the’ wrongly in sentences. Hans, I wish we had more discussions about this thesis but I am glad that you could pick it up towards the end of my PhD. Frans, I greatly appreciate your supervision, help with the microscope and critical corrections of some manuscripts. Paul, your help with the microelectrode was very essential for my first publication. My WCFS colleagues, it was a good learning process to have discussion with people from different disciplines. In particular, I would like to thank George Ruijter for teaching me how to destroy my fungal cell wall using the microdismembrator, and Jan Dijksterhuis for making nice images of aerial mycelia as shown on the cover of this thesis. There would not be so many nice results presented in this thesis without my students, Dagmara, Susana, Sybrand, Fenneke and Joep. Thank you also for all the chats and discussions. All of you have done a great job and I wish you all good luck in your further careers. The experimental work would not be as smooth as they were without you, Sebastiaan. Your help with everything in the lab and in the technical hall was very important for this thesis. I hope I was not too slow to understand your jokes and did not eat too much of your ‘snoepjes’. At the very beginning of my research, Marjolein, you
157

Acknowledgements
helped me a lot with the wheat-flour discs. Jan, Eric, Hans en Evert van de werkplaats en de glasblazers, bedankt voor jullie snelle hulp en werk voor mijn opstelling. All ‘gezellige’ activities, AIO trips, borrels, Christmas dinners, labuitjes, movie nights, six camps and my bridal shower would have not been so much fun without the people of Proceskunde. I could always count on Joyce and Hedy for getting help and being updated with the latest gossips. Gerrit and Jos, I hope you were not bored with me sitting in your room since the moment I did not have a desk in the department anymore. Although I had nothing to do with marine stuff, I enjoyed many occasions with René and his disciples. Thanks to Maarten, Leonie, Mohammad, and later on Eduard for the daily good time in Biotechnion k. 618. Maarten, we had a lot of discussions about SSF and many other things. Leonie, I missed our daily tea ceremony when you left our room. Mohammad, it was good to have ‘cultural’ discussion with you. I wish you good luck with your new post in Iran. Eduard, I gladly delegate the task to water the plants in k. 618 to you. It was the second day after my arrival in Wageningen in 1997 when I met you, Eira, during the bike tour. Since then, we have shared many things: the fate that we are married to Dutch men, a lot of talks, laughs, foods, parties, and many evenings in South Africa. I am thankful for the space in your house every time I am in Wageningen and the space in your heart for a warm friendship. Special thanks for helping me with these acknowledgments. Sylvia, you missed seeing me in the wedding dress that you helped to choose because you were on your one-year world tour. I am glad that you are my paranymph so that you will not have any excuse to miss another party. Thank you for everything and I am sure you will be successful in your research. Maria, it was great to organise the PhD trip to South Africa with you and Marian. It was also a lot of fun to have you as the master of ceremony of my wedding party. We laughed a lot, together with Hans. Thank you for the warm welcome anywhere you live. I look forward to having other reunions somewhere else. All my friends and acquaintances in Indonesia: Bu Nancy, Elvina, Bebby, Susana, Erny, Shianny, Ariani, Melly and many more: although we do not see each other so often, I know that you will always be welcoming me home every time I visit Indonesia. Tjibbe
158
Acknowledgements
159
Chris, thanks a lot for helping me with part of the layout of this book. Both you and Hans are always very helpful to me and Catrinus. Oom Rob, you are responsible for my coming to the Netherlands. Without you, I could have never had the opportunity to continue my study in this country. Tante Siok, your love and care fulfil the longing for my hometown. Both of you are like my parents in this country. Ondanks al hun wantrouwigheid over mijn Indonesisch eten, wil ik mijn Friese schoonfamilie ook hartelijk bedanken. Mem die mij als een eigen dochter behandelt. Jappie, het is lief dat je precies weet dat ik graag verse warme melk met een velletje drink. Luut, het is ongelofelijk dat je mij vertrouwt om jouw persoonlijke kapper te worden. Albert en Elly, het is altijd leuk om met jullie kinderen te spelen. Hille, Nynke, en kinderen, het was leuk om oud en nieuw te vieren bij jullie in het koude Denemarken. Mama, it was as if you came back from the hereafter and stayed for me during my PhD. Unfortunately you could not make it until the end and you will miss my promotion. Your unconditional love will always live in our hearts. Papa, you cultivated my curiosity, ambition and love of reading. I am very sorry that you cannot attend my promotion because of your illness. I hope that you will get well very soon. My big sister Mona, my best friend, no words will be enough to write about you. You are just so special to me. My brother Aji, and his family, thank you for all the good time we have had together. To save the best for last, Catrinus, you are everything! You, after me and Arjen, know the most of what this thesis is about. Your critical reading, endless discussions, encouragement and sport training helped me to get this far. You, like my Mother, know me better than I know myself. I found my home by your side.
Veendam, April 2005 Yovita


Curriculum Vitae
Yovita Siti Padmasari Rahardjo was born on 6 February 1975 in Semarang, Indonesia. She attended secondary school at YSKI Christian High School (physics class) in Semarang and graduated in 1992. In January 1997, she received her Bachelor of Science degree in Chemical Engineering with distinction from Diponegoro State University, Semarang. In the same year, she was awarded a full scholarship from The Confederation of Netherlands Industry and Employers (VNO-NCW) and PT. Van Melle Indonesia to continue her study in the Netherlands. In January 1999, she completed the international MSc program in Biotechnology, with a specialisation in Agrofood and Bioprocess Technology at Wageningen University. Her MSc thesis project was about the production of flavours by yeast during soy sauce fermentation and done in the Food and Bioprocess Engineering Group at Wageningen University. In June 1999, she started her PhD project in the same group, and the result of that is described in this thesis.
161

Curriculum Vitae
Overview of completed training activities
Discipline specific activities Courses • MATLAB Fundamentals and Programming Techniques (SSB) 1999 • System Analysis in Food and Process Engineering (VLAG) 1999 • Food Fermentation (VLAG) 1999 • A Unified Approach to Mass Transfer (OSPT – VLAG) 2000 • Numerical Methods in Chemical Engineering (OSPT) 2001 • Reaction Kinetics in Food Science (VLAG) 2001
Meetings • Annual meeting of Nederlandse Vereniging voor Theoretische Biologie (NVTB),
Texel 2000 • 8th, 9th, 10th Netherlands Biotechnology Congress (NBC), Ede 2000, 2002, 2004 • Graduate school on process technology (OSPT), Lunteren 2000, 2001 • 3rd European symposium on biochemical engineering science (ESBES-3),
Kopenhagen, Denmark 2000 • Frontiers in microbial fermentation and preservation. Joint meeting of the Society for
Applied Microbiology and The Netherlands Society for Microbiology, Wageningen 2002
• International congress on bioreactor technology in cell, tissue culture and biomedical applications, Tampere, Finland 2003
General courses Scientific English for Trainee Research Assistants (WCFS – WUR) 2001 Critical Reflection on Science/Technology, Values and Sustainability (WUR) 2001 PhD Introduction week (VLAG) 1999 Project Management: Successful functioning in organisations (VLAG) 2003 Optional courses and activities PhD study tour Process Engineering Poland 2000 PhD study tour Process Engineering South Africa 2002
162

163
This work was carried out at Wageningen University, Department of Agrotechnology and Food Sciences, Food and Bioprocess Engineering Group, P.O. Box 8129, 6700 EV Wageningen, The Netherlands. The research described in this thesis was part of the research program of ‘Microbial Functionality and Safety’ of the Wageningen Centre for Food Sciences (WCFS) and the Graduate School VLAG (Food Technology, Agrobiotechnology, Nutritional and Health Sciences). The printing and representation costs of this thesis were financially supported by: Food and Bioprocess Engineering Group, Wageningen University, The Netherlands Wageningen Centre for Food Sciences (WCFS), The Netherlands J.E. Jurriaanse Stichting, Rotterdam, The Netherlands Printed by Ponsen & Looijen BV, Wageningen, The Netherlands. Cover: aerial mycelia of Aspergillus oryzae (cryo-SEM images by Jan Dijksterhuis, Kenneth GA van Driel, Yovita SP Rahardjo)
