icici bank uk · pdf fileicici bank uk plc offers retail ... expansion of non lending revenue...
TRANSCRIPT

1
Strategic report, Directors’ report and financial statements
March 31, 2017Registered number 4663024
ICICI BANK UK PLC

ICICI Bank UK PLCStrategic Report, Directors’ Report and Financial Statements
March 31, 2017United Kingdom
1
Contents
ICICI Bank UK PLCStrategic Report, Directors’ Report and Financial Statements
March 31, 2017United Kingdom
Strategic report 3
Directors’ report 14
Statement of Directors’ responsibilities 17
Report of the independent auditor to the members of ICICI Bank UK Plc 18
Profit and loss account 19
Statement of other comprehensive income 20
Balance sheet 21
Statement of changes in equity 22
Notes 24
2
Contents

ICICI Bank UK PLCStrategic Report, Directors’ Report and Financial Statements
March 31, 2017United Kingdom
3
Strategic report
The Directors present their strategic report1 for the year ended March 31, 2017 (FY2017) for ICICI Bank UK PLC (“the Bank”).
Nature of Business
ICICI Bank UK PLC offers retail, corporate banking, commercial banking and treasury services. The Bank is authorised by the Prudential Regulation Authority (PRA) and regulated by the PRA and the Financial Conduct Authority (FCA). The Bank is a wholly owned subsidiary of ICICI Bank Limited (“the Parent Bank”) which is India’s largest private sector bank.
The Bank was incorporated in England and Wales as a private company with limited liability on February 11, 2003 and was converted to a public limited company, assuming the name ICICI Bank UK PLC, on October 30, 2006. As a public limited company, the Bank is able to access the capital markets.
The Bank has a senior debt rating of A3 from Moody’s Investors Service Limited (Moody’s).
Business Review
The Bank delivers its corporate, commercial and retail banking products and services through eight branches located in the UK and two branches in mainland Europe, located in Antwerp (Belgium) and Eschborn (Germany) as well as through online banking.
The Bank’s overall strategy in the past few years has centred on a “diversification” theme. During FY2017, the Bank remained focused on its key strategic objectives of diversification of the business profile, continuing proactive risk management, effective liquidity and capital management and meeting the requirements of the changing regulatory environment. The Bank’s focus is on maintaining a sustainable business model within a strong corporate governance and a strong control environment.
The Bank’s corporate business includes banking services for select companies in the UK, EU and North American regions, for Europe based multinational corporations which have active trade and investment flows with India, for large businesses owned by persons of Indian origin and for Indian corporations seeking to develop their business overseas.
The Bank provides retail banking services to UK consumers with a varied product suite including retail and business current and savings accounts, online banking, debit cards, money transfers, travel solutions and property backed lending. Additionally, the Bank offers interest based savings accounts and fixed rate term accounts to UK and German consumers which are supported over internet and phone enabled channels.
The Bank is managed as a single business. For the purposes of the business review, however, management has described activity by individual business areas. The financial information in the following sections have been presented in US Dollars with additional disclosure in Indian Rupee (INR) currency for convenience using the year end exchange rate of USD/INR 64.85 which has been applied across both FY2017 and FY20162
Key strategic highlights: FY2017
During FY2017, the Bank has continued executing its four pillar strategy being: diversification of asset profile, diversification of liability profile, expansion of non lending revenue streams and enhancement of operating efficiencies. The focus on a well established strategy effectively positioned the Bank to address the challenges arising from an uncertain and volatile economic environment with evolving regulatory and political developments across the globe.
1The strategic report is part of the Bank’s annual report and accounts.2The numbers in INR are proforma only and should not be regarded as being in compliance with UK GAAP.
ICICI Bank UK PLCStrategic Report, Directors’ Report and Financial Statements
March 31, 2017United Kingdom
4
The Bank has established a new risk appetite in recent years for all critical risks, including credit, market, operational and conduct risks. The business continued to operate within the defined risk appetite, with close monitoring by management and the Board Committees. The Bank is well capitalized and is in compliance with the regulatory capital requirements. Further, the Bank continued to focus on effective liquidity and capital management within a strong control environment and a strong corporate governance.
During the year, the UK’s vote to leave the EU had a significant impact on the financial markets and UK banking system. Before and following the Brexit referendum, the Bank saw a slowdown in EU and UK corporate lending although there was some pick up in the latter part of FY2017. During the year, the Bank further strengthened its risk appetite as a cautious approach to the uncertain market environment through tightening its lending norms on local lending and increased monitoring of its exposures which could be impacted by Brexit.
Total assets decreased by 24% in FY2017 to USD 3,480 million (INR 225,663 million) compared to the previous year, primarily due to a reduction in the loan portfolio and cash balances. As at March 2017, the Bank had surplus liquidity compared with regulatory requirements.
During the year, the loans and advances portfolio reduced by 25% primarily due to the Bank’s cautious approach to disbursements and selective sell downs of loans in the corporate portfolio. The Bank achieved positive momentum on growing its local and overseas client base by extending loans to UK, EU and North America based corporates and leveraged its relationships by expanding its portfolio of supply chain financing. The focus was maintained on balancing geographical and sectoral concentration as well as further diversification of the loan portfolio. The efforts to balance the geographical concentration led to a strategic shift of corporate loan profile with India as the country of risk reduced from 35% in FY2016 to 31% in FY2017 of the total loan portfolio. The Bank has been focused on increasing granularity in its corporate loan portfolio which has led to a reduction in average disbursement and exposure size. The Bank’s single borrower concentration risk improved through reduction of limits on exposures to the Bank’s top 20 borrower groups.
On funding side, the Bank continued to focus on rebalancing its funding sources and successfully diversified and broadened its funding profile and reduced the cost of funds by leveraging the retail and wholesale funding channels. During the year, the Bank accessed funding opportunities available in the wholesale markets at competitive pricing which helped in an overall reduction in the cost of funds. During the year, the Bank successfully enrolled into the Term Funding Scheme (TFS) of the Bank of England which will enable the Bank to access low cost central bank funding in the UK.
The corporate and commercial banking fee income and retail remittance income streams continued to be the main sources of the non interest income. The non interest income decreased during the year mainly due to lower corporate banking and remittance fees. The Bank remained focused on enhancing operating efficiencies without compromising the control environment. The operating expenses base decreased compared to the previous year mainly due to rationalization initiatives and benefit on account of depreciation of pound to US Dollar exchange rate. The Bank remained committed to maintaining a strong control framework to meet increasing regulatory and reporting obligations and continued to invest in people and technology to further strengthen the control framework.
The Bank made an annual Loss After Tax of USD 16.1 million (INR 1,042 million) in FY2017 compared with the Profit After Tax of USD 0.5 million (INR 35 million) in the previous year. While the operating margins remained reasonably strong, higher impairment provisions resulted in a loss for the year. The Net Interest Margin (NIM) for FY2017 of 1.75% improved compared to 1.66% in FY2016 driven by a reduction in the cost of funds. The Bank made majority of the additional provisions on existing impaired assets mainly due to delays in the recovery process. (Detailed financial highlights are provided in the section “Key financial highlights”).
The Bank reviews its Risk Appetite Framework regularly to take into account inter alia changes to the operating environment, portfolio composition, experience with stressed assets and regulatory changes. The Bank’s risk management group monitors adherence to the risk appetite and reports to the Board Risk Committee (BRC) on a quarterly basis. The Bank’s Credit Forum, which meets monthly, also tracks risk concentrations, developments
Strategic report
ICICI Bank UK PLCStrategic Report, Directors’ Report and Financial Statements
March 31, 2017United Kingdom
5
in the portfolio and industry trends, through a range of early warning indicators, to identify vulnerabilities and take timely actions including, where appropriate, making revisions to the Risk Appetite and Risk Management Framework.
The Bank continued to place considerable attention on the management of conduct risk, with conduct risk related matters reported regularly to the Board Conduct Risk Committee (“BCRC”) and the Compliance, Conduct and Operational Risk management Committee (“CORMAC”). The Bank maintained its focus on sustaining its customer-centric culture and invested in various technology initiatives to enhance customer experience. These included launch of a mobile app for remittances and enhancing the business banking product suite including an on-line foreign exchange platform. Close management of complaints ensured that all complaints were closed well within the regulatory stipulated timeframes.
The capital and liquidity position remained healthy throughout FY2017. The Bank’s approach to managing capital and liquidity is designed to ensure that regulatory capital and liquidity requirements are met. During the year, the Bank complied with and maintained the High Quality Liquid Assets (HQLA) in line with the liquidity guidelines at all times. The Bank also maintained adequate capital as required under Capital Requirements Directive (CRD IV).
Corporate and Commercial Banking
The Corporate Banking division continued to focus on diversification of its portfolio within the risk appetite of the Bank. The Bank extended loans to UK, EU, North America and India based corporates. The focus remained on offering the products which are core to the Bank’s competencies and strategy, its clients’ needs and in line with the risk appetite. Total loans and advances reduced by 25% to USD 2,439 million (INR 158,155 million) compared with USD 3,246 million (INR 210,482 million) in the previous year mainly due to the Bank’s cautious approach to disbursements and selective sell downs of loans mainly in the international corporate portfolio. During the year, the Bank selectively expanded its clientele to include lending to local companies and participation in syndication deals. As a strategic component of the Bank’s commitment towards its business in the UK market, the Bank expanded its corporate lending secured against property within the established risk framework.
During 2017, the Indian economy showed strong signs of stable growth and remained a bright spot in the global landscape. The government has made significant progress on important economic reforms to support strong and sustainable growth. However, the growth slowed down temporarily as a result of disruptions to consumption and business activity from the withdrawal of high-denomination bank notes from circulation in the latter part of FY2017. Also, challenges remain with regard to heightened corporate vulnerabilities in several key sectors of the economy due to which the Bank maintained a cautious approach to corporate lending to Indian corporations which resulted in a decrease in the new disbursements for this segment.
In line with the Bank’s strategy of selective disbursements due to a soft market environment, prepayments and sell down of loans in the corporate portfolio, the Bank’s Germany branch also registered a reduction in the balance sheet size. The Bank continued to do corporate lending through the Germany branch within the risk framework funded by low cost institutional deposits. The Bank availed its Targeted Longer Term Refinancing Operations (TLTRO) facility extended by the European Central Bank (ECB) which helped the Bank in raising low cost central bank funding.
Retail Banking
In continuation of the strategy of diversification of funding sources, the Bank remained focused on rebalancing the retail and wholesale funding mix. The Bank enhanced the business banking product suite for its customers including account and payment services, trade services and secured loans. During the year, the Bank also launched a savings and term deposit variant to be offered through intermediaries. The Retail banking team focused on expansion of business banking secured loans against property within the risk appetite of the Bank and made reasonable progress. During the year, the Bank also established a risk framework with a view to entering the asset finance lending. The Retail Banking team remained focused on enhancing the remittance income in line with the strategic pillar of
Strategic report
ICICI Bank UK PLCStrategic Report, Directors’ Report and Financial Statements
March 31, 2017United Kingdom
Strategic report
6
expansion of non lending revenue streams through upgrading its technology to enhance the customer experience. During FY2017, the Bank launched a mobile app for its Money2India (M2I) Europe platform. The app offers users a fully integrated registration, Video KYC and Payment gateway option to conduct transactions. The Bank also expanded its remittance services into Nordic regions covering Denmark, Norway and Sweden. In order to expand its customer base, the Bank launched a remittance platform called Money To Home to offer INR Remittances (non-INR remittances to be launched in near future) which demonstrates the Bank’s focus on enhancing customer delivery and services. During the year, the Bank was awarded the ”Channel innovation award’’ by Infosys on its M2I Europe mobile app and “Overseas business of the year award” by The English Asian Business Awards.
The Bank remained focused on strengthening its service delivery platform to ensure an enhanced customer experience and improved customer outcomes therefore managing the overall conduct risk for the Bank.
Treasury
The Treasury Group manages the structure of the balance sheet of the Bank, supports the capital needs and manages the market and liquidity risk of the Bank. Throughout the year, the Bank complied with and maintained the HQLA in line with the guidelines for Liquidity Coverage Ratio (LCR) requirements. The Bank reviews the asset/liability maturity mismatches and interest rate positions, and maintains liquidity gaps and interest rate positions within prescribed limits, which are monitored by the Asset and Liability Management Committee (ALCO) of the Bank. In line with the strategy of diversification of funding sources and to minimize the cost of funds, the Bank continued to focus on exploring alternative funding sources. During the year, the Bank was able to raise funding through bonds and bilateral loans under its Medium Term Note (MTN) Programme at competitive pricing driven by conducive wholesale markets. In addition, the Bank became a member of, and availed funding through, the central bank facilities of TFS offered by the Bank of England and TLTRO facility offered by the ECB.
The investment portfolio of the Bank is also managed by the Treasury Group. The treasury activities are carried out through the Balance Sheet Management Group, Investment desk and Global Markets Group. During the year, the investment desk invested in Indian bank and corporate bonds and further diversified the portfolio through investments in EU and US corporate bonds within the established risk appetite of the Bank.

ICICI Bank UK PLCStrategic Report, Directors’ Report and Financial Statements
March 31, 2017United Kingdom
7
Financial Highlights
The financial performance for the financial year 2017 is summarised in the following table
Summarised Profit and loss accountFinancial
2017Financial
2016% Change
Financial 2017
Financial 2016
USD 000s USD 000s INR million INR million
Net interest income 65,526 71,488 -8% 4,249 4,636
Non interest income 13,364 16,149 -17% 867 1,047
Total operating income 78,890 87,637 -10% 5,116 5,683
Operating expenses (33,917) (34,168) -1% (2,199) (2,216)
Profit before provisions, charges and taxes
44,973 53,469 -16% 2,917 3,467
Impairment provision and charges (68,181) (59,442) 15% (4,422) (3,855)
Profit/(Loss) on sale of financial assets 4,619 11,984 -61% 300 778
(Loss)/Profit before tax (18,589) 6,011 (1,205) 390
Tax 2,507 (5,468) 163 (355)
(Loss)/Profit after tax (16,082) 543 (1,042) 35
Summarised Balance SheetFinancial
2017Financial
2016% Change
Financial 2017
Financial 2016
USD 000s USD 000s INR million INR million
Balances at central banks 281,910 500,136 -44% 18,282 32,434
Loans and advances to banks 106,641 283,149 -62% 6,916 18,362
Loans and advances to customers 2,332,132 2,962,535 -21% 151,239 192,120
Investments 683,306 743,413 -8% 44,312 48,210
Total assets 3,479,766 4,603,257 -24% 225,663 298,521
Customer accounts 1,648,588 2,466,866 -33% 106,911 159,976
Shareholders’ funds 533,230 545,527 -2% 34,581 35,377
Capital3
Capital Ratios March 31, 2017 March 31, 2016 Movement
Core Tier 1 ratio 15.5% 13.1% 2.4%
Tier 1 ratio 15.5% 13.1% 2.4%
Total ratio 18.4% 16.7% 1.7%
Risk weighted assetsMarch 31,
2017March 31,
2016% Change
March 31, 2017
March 31, 2016
USD 000s USD 000s INR million INR million
Risk weighted assets 3,355,950 4,093,797 -18% 217,633 265,483
3 Pillar 3 disclosures are available online on the Bank’s website: http://icicibank.co.uk/personal/basel_disclosures.html
Strategic report

ICICI Bank UK PLCStrategic Report, Directors’ Report and Financial Statements
March 31, 2017United Kingdom
8
Key Financial highlights: FY2017
As at March 31, 2017, the Bank had total assets of USD 3,480 million (INR 225,663 million) compared with USD 4,603 million (INR 298,521 million) as at March 31, 2016. The balance sheet decreased by 24% primarily due to a reduction in central bank balances and loan and advances. During the course of the year, the Bank had optimised its liquidity and maintained adequate liquidity surplus versus the regulatory requirements. The balances with central bank decreased compared with the previous year as the Bank met the HQLA requirements through investments in eligible securities. The loans and advances to banks decreased by 62% mainly due to maturity of its trade facilities which were repaid during the year. The loans and advances to customers decreased by 21% following the Bank’s cautious strategy of selective disbursements driven by a volatile and uncertain global market environment. The uncertainity in global economic outlook was primarily caused by events such as Brexit and the US elections. The Bank continued to focus on its credit and concentration risk management strategy through selectively selling down loans in its international corporate portfolio. During the year, USD 289 million of loans against Foreign Currency Non resident (FCNR) deposits matured and were fully repaid. The Bank remained within the portfolio limits as prescribed in the risk appetite.
The Bank made a Loss Before Tax in FY2017 of USD 18.6 million (INR 1,205 million) compared with Profit Before Tax (PBT) of USD 6.0 million (INR 390 million) in the previous year mainly due to lower operating income and higher impairment provisions, partially offset by a reduction in operating expenses. A Loss After Tax of USD 16.1 million (INR 1,042 million) was made against the Profit After Tax of USD 0.5 million (INR 35 million) in the previous year.
The net interest income (NII) reduced by 8% compared with the previous year despite the balance sheet reduction of 24%. The Net Interest Margin (NIM) for FY2017 of 1.75% registered a healthy growth versus NIM of 1.66% in the previous year. The NIM improvement was primarily driven by lower cost of funds. The cost of funds reduced due to rebalancing of the retail and wholesale deposits mix and diversification of funding sources. The cost of funds for FY2017 of 1.67% reduced by 17 bps compared with the previous year. The Bank accessed the available opportunities in the wholesale markets and raised funding at a competitive cost through bilateral loans, bonds, repurchase agreement and banker’s acceptance.
The non interest income registered a decline of 17% versus previous year due to lower corporate and remittance fees. The reduction in the corporate fees was mainly caused by limited opportunities for providing structuring and arrangement services to clients on the new corporate assets. Remittance fees dropped due to increased competition in the remittance market and Euro and Pound depreciation against the Indian rupee during the year.
Operating expenses at USD 33.9 million (INR 2,199 million) reduced by 1% compared to the previous year. The reduction in operating expenses was mainly due to rationalisation initiatives, vendor negotiations and depreciation of pound to US dollar rate partially offset by higher bonus accruals and retail marketing expenses.
The provisions made during the year were USD 68.2 million (INR 4,422 million) compared with USD 59.4 million (INR 3,855 million) in the previous year. The Bank made majority of the additional specific provisions on existing impaired assets due to slow recovery in the business performance of the borrowers and of the investment cycle in India, deterioration in the value of collateral and delays in reaching expected milestones such as the award of contracts and sale of business. Currently, the Bank operates within the risk appetite, it has introduced in recent years.
As at March 31, 2017, all exposures with overdues of more than 90 days have been classified as impaired to align with the revised credit risk management policy on impairment classification. FY2017 includes USD 121.5 million (INR 7,879 million) of loans newly classified as impaired to align with the revised credit policy on impairment classification of loans past due for more than 90 days. While the Bank is expecting to recover its dues in full for these facilities, they have been classified as impaired due to the policy change. As the Bank has reasonable visibility of repayment, no specific provision is made on these particular loans. The increase in the impaired assets with nil provision resulted in lower provision coverage ratio of 37% as compared to 48% in the previous year. The provision coverage ratio for FY2017 excluding the impact of the policy change is 56%. The comparative figure for FY2016 of the past due impaired loans based on the revised policy has been reclassified. (Refer note 19)
Strategic report
ICICI Bank UK PLCStrategic Report, Directors’ Report and Financial Statements
March 31, 2017United Kingdom
9
The profit/(loss) on sale of financial assets of USD 4.6 million includes USD 3.0 million gain in respect of the disposal of the Bank’s share in Visa Europe Limited which was acquired by Visa Inc. in June 2016.
The Bank recognised an overall tax credit of USD 2.5 million which included a credit of USD 3.3 million on the consolidated loss, a credit of USD 1.5 million on account of AFS reserves partially offset by a tax provision of USD 2.2 million on the profit booked in its Germany branch profit as explained in the paragraph below.
A tax credit of USD 3.3 million was booked in the profit and loss account on the consolidated loss of USD 18.6 million. As per UK Finance Act 2015, the Bank implemented the tax rule change to the timing of Available For Sale (AFS) gains and losses being taxed to follow the timing of recognition in the profit and loss account. As a consequence, the Bank reassessed the tax balance in AFS reserves and reversed the excess tax of USD 1.5 million from AFS reserves to the Profit and Loss account. In addition, the Bank made a tax provision of USD 2.2 million on the profit booked in its Germany branch. Due to the loss position at a consolidated level, the Bank could not claim a Double tax relief under Sections 36 and 42 TIOPA 2010. (Refer note 12 on Taxation)
The total capital adequacy continues to be strong at 18.4% with Tier 1 ratio of 15.5%. The Bank is in compliance with the CRD IV regulatory requirements. The Bank continues to comply with and maintains balances in HQLA in line with the Liquidity Coverage Ratio (LCR) regime. The Bank manages the capital and liquidity to ensure that current regulatory capital and liquidity requirements are met at all times.
4Key economic and business outlook
As per the Interim Economic Outlook March 2017 published by the OECD, global GDP growth is projected to increase, rising from just under 3% in 2016, the slowest pace since 2009, to 3.3% in 2017 and around 3.5% in 2018. The global GDP projection is broadly unchanged since the OECD Economic Outlook of November 2016. There have been some positive signs of accelerating activity and rising consumer and business confidence in recent months in advanced economies and a number of emerging market economies, including improved momentum around the turn of the year. However, interest rates and oil prices have risen which will offset this somewhat, although higher commodity prices will benefit some emerging market economies.
The modest pick-up in global growth in 2017-18 reflects the effect of ongoing and projected fiscal initiatives, notably in China and the United States, together with an easier stance in the euro area. These are expected to catalyze private economic activity and push up global demand. While the overall confidence has improved, but consumption, investment, trade and productivity are far from strong, with growth slow by past norms and higher inequality. Disconnect between financial markets and fundamentals, potential market volatility, financial vulnerabilities and policy uncertainties could, however, derail the modest recovery. A stronger growth environment would enhance resilience, but may not suffice to tackle all financial vulnerabilities.
Headline inflation is rising in most countries as the result of higher energy prices, following the OPEC agreement in November to cut oil production. However, underlying inflation in advanced economies is still subdued and will pick up only slowly as the expansion gains traction, including to support more robust wage growth across the income distribution. Inflation is easing in a number of emerging market economies as the effect of past exchange rate depreciations fades and the effect of monetary policy actions works through, but commodity importers are exposed to rising commodity prices.
In the United Kingdom, the pace of expansion in 2016 was lower than in previous years, despite support from resilient household spending, actions by the Bank of England and adjustment to the fiscal stance following the Brexit vote. The economy advanced 0.7% on the last quarter in 2016 due to upward revisions within the manufacturing industries. On the expenditure side, exports rebounded sharply while household expenditure rose at a slower pace and business investment contracted. The inflation rate experienced a 3.5 year high of a 2.3% increase year-on-year in February 2017. Growth is expected to ease as inflation weighs on real incomes and consumption, and business investment weakens amidst uncertainty about the United Kingdom’s future trading relations with its partners.
4 Interim Economic Outlook March 2017 published by the OECD
Strategic report

ICICI Bank UK PLCStrategic Report, Directors’ Report and Financial Statements
March 31, 2017United Kingdom
10
In the euro area, GDP growth is projected to continue at the current moderate pace, supported by accommodative monetary policy and a modest fiscal easing over the coming years. There is fiscal space for more ambitious and effective fiscal initiatives in Europe. There are encouraging signs that business investment may be strengthening, but high non-performing loans and labour market slack in some euro area countries continue to hold back growth prospects. Growth is set to remain solid in Germany, but will continue at a slower pace in France and Italy. Although euro area-wide unemployment is falling steadily, the rate remains above 9%. Not only does unemployment overall remain high in some countries, youth unemployment is a particular drag on current demand and future potential growth. Headline inflation has been pushed up by higher energy prices, but the recovery is not yet sufficiently advanced to durably raise core inflation.
Domestic demand in the United States is set to strengthen over the next two years and expand at a solid pace, helped by gains in household wealth and a gradual upturn in energy production. Employment is rising steadily, although the pace is expected to ease somewhat, and wages should continue to pick up as the labour market tightens. GDP growth is projected to pick up to 2.4% in 2017 and 2.8% in 2018, supported by an anticipated fiscal expansion, especially in 2018, despite higher long-term interest rates and continued headwinds from the stronger US dollar.
Growth in China is expected to edge down further to 6.25 per cent by 2018 as the economy manages a number of necessary transitions. Strong growth should continue in India over the next two years, helped by the implementation of key structural reforms and strong public sector wage growth.
As the global economic environment remained soft and subdued during FY2017, the Bank took a cautious approach towards new lending. In consideration of the UK referendum to exit EU, the Bank took proactive steps and strengthened its risk appetite through tightening the lending norms on local lending and increased monitoring of its exposures which could be impacted by Brexit.
In consideration of the economic environment and future outlook, the Bank will continue on its journey of diversification of its asset portfolio and of building a diversified and stable funding profile. The efforts to enhance the non-interest revenue streams will continue along with improving operating efficiencies and efficient capital and liquidity management. The Bank will continue to monitor the global economic environment as well as the economic situation and developments in India and Europe and strive to tap the market opportunities in line with its risk management framework and risk appetite.
Key risks
The Bank’s business is subject to inherent risks relating to borrower credit quality as well as general global economic and India conditions. The Bank’s funding is composed of medium to long term deposits, term borrowings and a proportion of short term savings balances. If depositors and/or lenders do not roll over invested funds upon maturity, the Bank’s business could be adversely affected. Unfavourable wholesale market conditions could have an adverse impact on meeting the funding requirements of the Bank. The security of the Bank’s information and technology infrastructure is a key focus area for maintaining banking applications and processes. Cyber-attacks disrupt the availability of customer facing websites and could compromise the Bank’s customer data and information.
The UK Prime Minister invoked Article 50 of the Treaty of European Union on March 29, 2017, thereby triggering a two year process of UK withdrawal from the European Union (EU). This could have wide ranging effects for UK businesses and in particular financial services firms who currently benefit from arrangements allowing them to passport their services into any EU country. The current uncertainty ahead of talks between the UK and rest of the EU over what form Brexit will take remains a common issue for all firms in the UK.
Strong controls around the measurement of risks through effective risk management helps the Bank in mitigating such risks. The Bank will continue to work within the risk framework as set out by the Board. The increased supervisory and compliance environment in the financial sector leads to increased risks of regulatory action. The Bank’s continued focus on ensuring compliance with all regulatory requirements mitigates the risk of regulatory action. The Bank makes sufficient investments in addressing the risks through infrastructure development, regular
Strategic report

ICICI Bank UK PLCStrategic Report, Directors’ Report and Financial Statements
March 31, 2017United Kingdom
11
training to enhance awareness of employees, and increased monitoring and management of these risks. The Bank’s Directors and Management review the risk appetite on a regular basis and continue to make any relevant changes to ensure regulatory compliance. The detail around the Bank’s risks and management is given in Note 39.
Corporate Governance and Risk Management
Corporate Governance
The Bank’s corporate governance framework is based on an effective independent Board, the separation of the Board’s supervisory role from the executive management of the Bank and the constitution of Board Committees to oversee critical areas and functions of executive management. The Board is committed to maintaining high standards of corporate governance. During the year, Mrs. Chanda Kochhar resigned from the position of Non Executive Director and Chairperson of the Board. The Board appointed Mr. N.S. Kannan as the Chairperson of the Board effective January 17, 2017. Mr. N.S. Kannan has been the Non Executive Director of the Bank since April 13, 2010 and an Executive Director of ICICI Bank Limited. Following this change, the Bank has a total number of six Non Executive Directors on the Board, two of whom are representatives of the Bank’s Parent, ICICI Bank Limited, and four are independent.
The Bank operates three lines of defence model including independent control groups such as Compliance, Risk, Internal Audit, Finance and Legal to facilitate independent evaluation, monitoring and reporting of various risks. These support groups function independently of the business groups and are represented at the various Committees.
Effective corporate governance and compliance is a prerequisite to achieving the Bank’s strategic objectives. The Bank has maintained its focus on controls, governance, compliance and risk management to provide a sound foundation for the business and it continues to ensure embedding of a controls and compliance culture throughout the organization. This is achieved through appropriate training, maintaining adequate resources within the control groups commensurate with the Bank’s operations, continuous strengthening of internal systems and processes and effective deployment of technology. Information technology is used as a strategic tool for the Bank’s business operations, to gain a competitive advantage and to improve its overall productivity and efficiency.
Brexit
Following the referendum, the Bank formed a Brexit Committee chaired by the Head of Risk and attended by the executive management with regular meetings to monitor and discuss the developments related to Brexit. The Brexit Committee is working to finalise its strategic planning on the Bank’s operations including its branches in Belgium and Germany which currently rely on passported permissions from the UK. The Committee reports to the Board Risk Committee on a quarterly basis. The Bank is exploring various options with the help of external consultants and is expecting to complete the analysis and present its recommendation at the Board meeting during FY2018.
Senior Managers Regime
The Bank implemented the requirements of the new regime effective March 7, 2016 and made the required notifications to the regulator. Specifically, the regime requires firms to:
1. Allocate a range of responsibilities to Senior Managers (including Non-Executive Directors) and to regularly vet their fitness and propriety. This will focus accountability on a narrower number of senior individuals in banks than the previous Approved Persons Regime.
2. Assess the fitness and propriety of certain employees (certification employees) who could pose a risk of significant harm to the bank or any of its customers and issue them with certificates on an annual basis.
3. Apply a new set of conduct rules to a broad range of staff, including the Senior Managers and the certification staff.
The Bank presents regular updates on compliance with the regime to the Board Governance Committee.
Strategic report

ICICI Bank UK PLCStrategic Report, Directors’ Report and Financial Statements
March 31, 2017United Kingdom
12
Risk Management
The Bank has a centralised Risk Management Group with a mandate to identify, assess and monitor all its principal risks in accordance with defined policies and procedures. The Risk Management Group is independent of the business units and the Head of Risk reports directly to the Managing Director and Chief Executive Officer, and also has reporting lines to the Risk Management Group of the Parent Bank and the Chairperson of the Board Risk Committee.
The Bank has developed a risk appetite framework articulated within the broader context of the nature, scope, scale and complexity of the Bank’s activities. The anchors on which the framework has been based include quantitative parameters such as capital, liquidity and earnings volatility as well as qualitative parameters such as conduct and reputational risk. The risk appetite statement has been further drilled down into portfolio-level limits, which include limits on country of risk and credit ratings of loans. The risk appetite framework and related limits are approved by the Board of Directors. The Risk Management Group of the Bank monitors adherence to the risk appetite framework and reports on it to the Board Risk Committee on a quarterly basis. The Bank’s business strategy takes cognizance of the risk appetite framework, so that the Bank will continue to operate within its risk appetite limits.
The Bank operates within a comprehensive risk management framework, covering all relevant risks in order to ensure that the key risks facing the Bank are clearly identified, understood, measured and monitored and that the policies and procedures established to address and control these risks are strictly adhered to. The outcomes of each of these risk management processes have been used to identify the material risks that the Bank is exposed to. The Bank is primarily exposed to credit risk, market risk (predominantly interest and exchange rate risk), liquidity risk and operational risk (including compliance, conduct and reputational risk). The Bank’s largest regulatory capital requirements arise from credit risk in its lending operations.
The Bank maintains detailed Recovery and Resolution Plans (RRP). It also maintains a Liquidity Contingency Plan (LCP), which forms an integral part of the RRP. The plans include a range of recovery and liquidity indicators which allow the Bank to take preventative measures to forestall a severe stress. They also include a communication plan, which would be followed in the event of a crisis and a contingency funding plan, which sets out the corrective measures to be invoked when there is a potential or actual risk to the Bank’s liquidity position.
The Bank’s conduct risk philosophy is to develop and maintain long term relationships with its customers, based on openness, trust and fairness. It expects that the behaviour and motivation of every employee must be about good conduct and adherence to established controls to deliver fair and appropriate outcomes to our customers. The Bank evaluates the impact of the changing regulatory requirements on an ongoing basis and is fully committed to establishing controls to deliver fair and appropriate outcomes for its customers.
The Bank has continued to operate within its defined conduct risk appetite. Performance against the appetite and other conduct risk related matters are reviewed and monitored by the Bank’s Board Conduct Risk Committee (“BCRC”) and the Compliance, Conduct and Operational Risk Management Committee (“CORMAC”). Both Committees meet on a periodic basis and receive regular updates from both business and Compliance.
The Bank is committed to invest in Information Security which is essential to ensure the long term viability of the organisation and its data. The Bank has implemented an integrated approach to security and made significant progress in enhancing its Information Security governance through monitoring at the Information Security Committee. Additionally, periodic presentations are given to the Board Risk Committee on cyber threats and various measures taken by the Bank mitigating cyber security risks and threats. The various measures include periodic vulnerability and penetration testing, Application security life cycle assessment, information security awareness programs and cyber incident management. During FY2016, the Bank was awarded the “Cyber Essentials” certificate and badge which demonstrated that the Bank’s Information Security processes and procedures meet the UK market baseline standards.
Internal Audit is an integral part of the ongoing monitoring of the Bank’s system of internal controls. The Internal Audit Group is an independent function and the Head of Internal Audit reports directly to the Managing Director and
Strategic report
ICICI Bank UK PLCStrategic Report, Directors’ Report and Financial Statements
March 31, 2017United Kingdom
13
Chief Executive Officer, and also has reporting lines to the Chairperson of the Board Audit Committee and General Manager, International Audit, ICICI Bank Limited. The Bank has put in place a risk based internal audit coverage to verify that operating policies and procedures are implemented as intended and are functioning effectively. Internal Audit also evaluates whether the framework including the associated governance processes meets the Bank’s needs and regulatory expectations/requirements.
Liquidity Regulation
The LCR is intended to ensure that a bank maintains an adequate level of unencumbered, HQLA which can be used to offset the net stressed outflows the bank could encounter under a combined stress scenario lasting 30 days. The minimum requirement under the CRD IV transitional arrangements is 90%. The Bank holds a prudent level of liquidity in excess of internal and regulatory requirements. The LCR ratio of the Bank at March 31, 2017 was higher than the regulatory requirements under CRD IV which came into force on 1 October 2015.
In October 2014, the Basel Committee published its final standard for the Net Stable Funding Ratio (NSFR) which will take effect on 1 January 2018. The NSFR is defined as the amount of available stable funding relative to the amount of required stable funding. Banks are expected to hold a NSFR of at least 100% on an on-going basis and report its NSFR at least quarterly. During FY2017, the Bank contributed to the Basel quantitative impact study through quarterly submissions and maintained its NSFR above the expected ratio.
Details of the Bank’s governance arrangements, financial risk management objectives and policies, including those in respect of financial instruments, and details of the Bank’s indicative exposure to risks are given in Note 39.
By order of the Board
Sudhir Dole Aarti SharmaManaging Director & Chief Executive Officer Chief Financial Officer & Company Secretary
April 27, 2017Registered address:
One Thomas More SquareLondon E1W 1YN
Strategic report

ICICI Bank UK PLCStrategic Report, Directors’ Report and Financial Statements
March 31, 2017United Kingdom
14
The Directors have pleasure in presenting the Fourteenth annual report of ICICI Bank UK PLC, together with the audited financial statements for the year ended March 31, 2017.
Financial Results
The financial statements for the reporting year ended March 31, 2017 are shown on pages 19 to 84.
Directors
Mrs. Chanda Kochhar* Chairperson of the Board until January 17, 2017
Mr. N.S. Kannan** Non Executive Director, Chairperson of the Board
Mr. Vijay Chandok Non Executive Director
Mr. Robert Huw Morgan Independent Non Executive Director
Mr. Jonathan Britton Independent Non Executive Director
Mr. John Burbidge Independent Non Executive Director
Sir Alan Collins Independent Non Executive Director
Mr. Sudhir Dole Managing Director & CEO
* Mrs. Chanda Kochhar resigned from the position of the Non Executive Director and Chairperson of the Board of the Bank on January 17, 2017.
** N.S. Kannan, existing Non Executive Director of the Bank was appointed as the Chairperson of the Board of the Bank in the board meeting on October 17, 2016 which was approved by the PRA on January 17, 2017.
Company Secretary
The name of the Company Secretary at the date of the report and who served during the year is as follows: Ms Aarti Sharma
Going concern
The Bank’s business activities and financial position; the factors likely to affect its future development and performance; and its objectives and policies in managing the financial risks to which it is exposed and its capital are discussed in the Business Review and Risk Management section.
The Directors have assessed, in the context of the Bank’s current results and operating environment, capital and liquidity position and projections, the Bank’s ability to continue as a going concern. The Directors confirm they are satisfied that the Bank has adequate resources to continue in business for the foreseeable future. For this reason, they continue to adopt the ‘going concern’ basis for preparing accounts.
Share Capital
As at March 31, 2017, the issued and fully paid share capital amounted to USD 420 million (INR 27,243 million).
Director’s report

ICICI Bank UK PLCStrategic Report, Directors’ Report and Financial Statements
March 31, 2017United Kingdom
15
Employees
As at March 31, 2017 the Bank had 192 employees. The Bank encourages the involvement of all employees in the Bank’s overall performance and profitability. The Bank has a pension scheme operating in the UK in which the employees are entitled to a maximum of five percent contribution of their basic salary by the Bank. Generally, all permanent employees have life insurance cover to the extent of four times their base salary. The Bank also has a private medical insurance plan, which covers permanent employees and their dependents in UK.
The Bank is committed to employment practices and policies which recognise the diversity of its workforce and ensure equality for employees regardless of sex, race, disability, age, sexual orientation or religious belief. Employees are kept closely involved in major changes affecting them through such measures as team meetings, briefings, internal communications and opinion surveys. The Bank has adopted a Code of Conduct, which sets out the core values and behaviours expected of senior management and other employees. The requirements of the Code are for all employees to act with integrity and maintain the right culture at all times. It also reinforces the Bank’s commitment to maintaining high standards in management of our relationship with customers, employees and suppliers.
The Bank recognises its social and statutory duty and follows a policy of providing same employment opportunities for disabled persons as for others.
The Bank follows a conservative and comprehensive approach towards remuneration. The Bank has adopted and implemented a Remuneration Policy which has been approved by the Board Governance Committee. The Bank ensures that it adheres to the Remuneration Code guidelines published by the PRA and FCA. The Bank’s remuneration policy disclosures are made available on the Bank’s website: http://www.icicibank.co.uk/personal/basel_disclosures.html. Effective July 2016, these disclosures will be available as part of Pillar 3 disclosures.
Political contributions
The Bank made no political donations or incurred any political expenditure during the year.
Dividends
No dividends on the share capital of the Bank is proposed during the year.
Post balance sheet events
There have been no material events after the balance sheet date which would require disclosure or adjustments to the March 31, 2017 financial statements.
Disclosure of information to the Auditor
The Directors who held office at the date of approval of this Directors’ report confirm that, so far as they are each aware, there is no relevant audit information of which the Bank’s auditor is unaware; and each Director has taken all the steps that he or she ought to have taken as a Director to make himself or herself aware of any relevant audit information and to establish that the Bank’s auditor is aware of that information.
Director’s report

ICICI Bank UK PLCStrategic Report, Directors’ Report and Financial Statements
March 31, 2017United Kingdom
16
Auditor
KPMG LLP was appointed as the auditor of the Bank at its Annual General Meeting on July 18, 2016 for a year. In accordance with Section 489 of the Companies Act of 2006, a resolution for the re-appointment of KPMG LLP as auditor of the Bank is to be proposed at the forthcoming Annual General Meeting.
By order of the Board
Sudhir Dole Aarti SharmaManaging Director & Chief Executive Officer Chief Financial Officer & Company Secretary
April 27, 2017Registered number: 4663024
Registered address: One Thomas More Square
London E1W 1YN
Director’s report
ICICI Bank UK PLCStrategic Report, Directors’ Report and Financial Statements
March 31, 2017United Kingdom
17
Statement of Directors’ responsibilities in respect of the Strategic Report, Directors’ Report and the financial statements
The Directors are responsible for preparing the Strategic Report, Directors’ Report and the financial statements in accordance with applicable law and regulations. Company law requires the Directors to prepare financial statements for each financial year. Under that law they have elected to prepare the financial statements in accordance with UK Accounting Standards and applicable law (UK Generally Accepted Accounting Practice), including FRS102, the Financial Reporting Standard applicable in the UK and Republic of Ireland.
Under company law the directors must not approve the financial statements unless they are satisfied that they give a true and fair view of the state of affairs of the company and of the profit or loss of the company for that period. In preparing these financial statements, the Directors are required to:
• select suitable accounting policies and then apply them consistently; • make judgements and estimates that are reasonable and prudent;
• state whether applicable UK Accounting Standards have been followed, subject to any material departures being disclosed and explained in the financial statements; and
• prepare the financial statements on the going concern basis unless it is inappropriate to presume that the company will continue in business.
The Directors are responsible for keeping adequate accounting records that are sufficient to show and explain the company’s transactions and disclose with reasonable accuracy at any time the financial position of the company and enable them to ensure that the financial statements comply with the Companies Act 2006. They are responsible to report a fair review of the development and performance of the business and the position of the company together with a description of the principal risks and uncertainties faced by the company. They have general responsibility for taking such steps as are reasonably open to them to safeguard the assets of the company and to prevent and detect fraud and other irregularities.
The Directors are responsible for the maintenance and integrity of the corporate and financial information included on the Bank’s website. Legislation in the UK governing the preparation and dissemination of financial statements may differ from legislation in other jurisdictions.
The Directors are responsible for the preparation of the schedule in accordance with the Capital Requirements (Country-by-Country Reporting) Regulations 2013, for the appropriateness of the basis of preparation and the interpretation of the Regulations as they affect the preparation of the schedule, The Capital Requirements (Country-by-Country Reporting) Regulations 2013 came into effect on 1 January 2014 and place certain reporting obligations on financial institutions that are within the scope of the EU’s CRD IV which are outlined in Note 37.
By order of the Board
Sudhir Dole Aarti SharmaManaging Director & Chief Executive Officer Chief Financial Officer & Company Secretary
April 27, 2017
ICICI Bank UK PLCStrategic Report, Directors’ Report and Financial Statements
March 31, 2017United Kingdom
18
Report of the independent auditor to the members of ICICI Bank UK PLC
We have audited the financial statements of ICICI Bank UK PLC (“the Bank”) for the year ended March 31, 2017, set out on pages 19 to 84. The financial reporting framework that has been applied in their preparation is applicable law and UK Accounting Standards (UK Generally Accepted Accounting Practice), including FRS 102 The Financial Reporting Standard applicable in the UK and Republic of Ireland.
This report is made solely to the Bank’s members, as a body, in accordance with Chapter 3 of Part 16 of the Companies Act 2006. Our audit work has been undertaken so that we might state to the Bank’s members those matters we are required to state to them in an auditor’s report and for no other purpose. To the fullest extent permitted by law, we do not accept or assume responsibility to anyone other than the Bank and the Bank’s members, as a body, for our audit work, for this report, or for the opinions we have formed.
Respective responsibilities of directors and auditor
As explained more fully in the Directors’ Responsibilities Statement on page 17, the directors are responsible for the preparation of the financial statements and for being satisfied that they give a true and fair view. Our responsibility is to audit, and express an opinion on, the financial statements in accordance with applicable law and International Standards on Auditing (UK and Ireland). Those standards require us to comply with the Auditing Practices Board’s Ethical Standards for Auditors.
Scope of the audit of the financial statements
A description of the scope of an audit of financial statements is provided on the Financial Reporting Council’s website at www.frc.org.uk/auditscopeukprivate.
Opinion on financial statements
In our opinion the financial statements: • give a true and fair view of the state of the Bank’s affairs as at March 31, 2017 and of its loss for the year
then ended; • have been properly prepared in accordance with UK Generally Accepted Accounting Practice; and • have been prepared in accordance with the requirements of the Companies Act 2006.
Opinion on other matter prescribed by the Companies Act 2006
In our opinion the information given in the Strategic Report and the Directors’ Report for the financial year for which the financial statements are prepared is consistent with the financial statements. Based solely on the work required to be undertaken in the course of the audit of the financial statements and from reading the Strategic report and the Directors’ report:• we have not identified material misstatements in those reports; and • in our opinion, those reports have been prepared in accordance with the Companies Act 2006.
Matters on which we are required to report by exception
We have nothing to report in respect of the following matters where the Companies Act 2006 requires us to report to you if, in our opinion: • adequate accounting records have not been kept, or returns adequate for our audit have not been received
from branches not visited by us; or • the financial statements are not in agreement with the accounting records and returns; or • certain disclosures of directors’ remuneration specified by law are not made; or • we have not received all the information and explanations we require for our audit.
Jonathan BinghamSenior Statutory Auditor for and on behalf of KPMG LLP, Statutory Auditor Chartered Accountants 15 Canada SquareLondon E14 5GL.
ICICI Bank UK PLCStrategic Report, Directors’ Report and Financial Statements
March 31, 2017United Kingdom
19
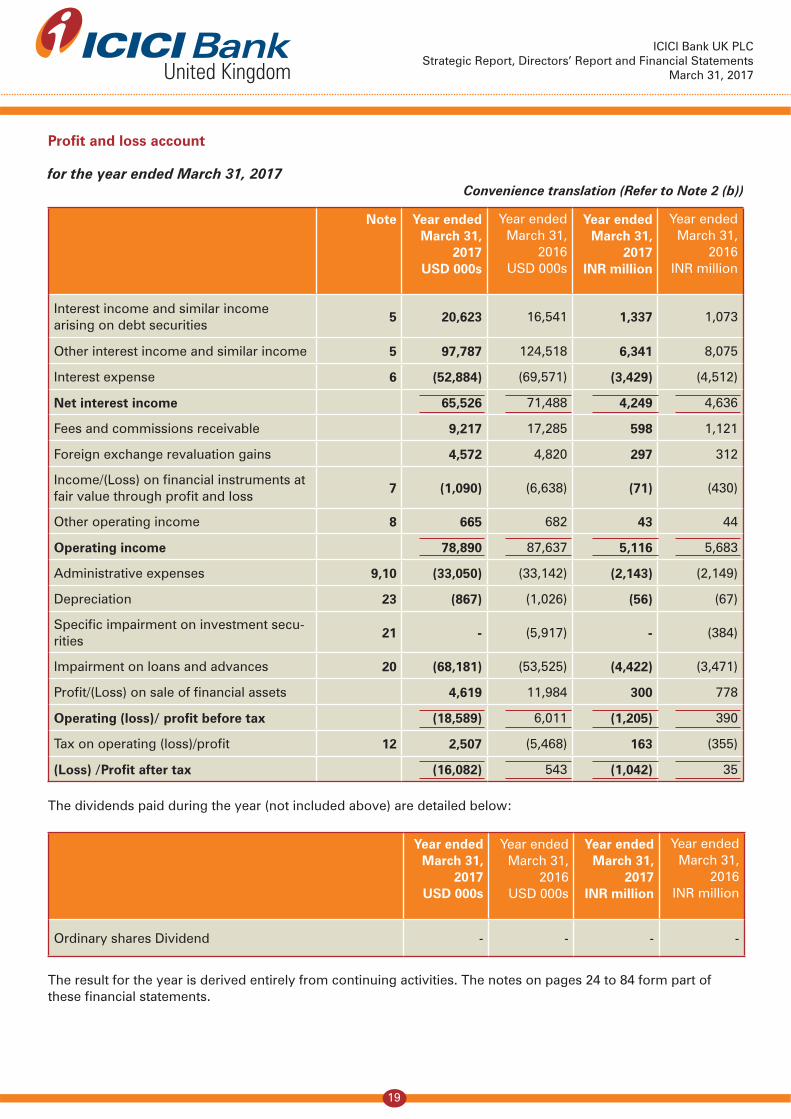
Profit and loss account
for the year ended March 31, 2017 Convenience translation (Refer to Note 2 (b))
Note Year endedMarch 31,
2017USD 000s
Year ended March 31,
2016USD 000s
Year endedMarch 31,
2017INR million
Year endedMarch 31,
2016INR million
Interest income and similar incomearising on debt securities
5 20,623 16,541 1,337 1,073
Other interest income and similar income 5 97,787 124,518 6,341 8,075
Interest expense 6 (52,884) (69,571) (3,429) (4,512)
Net interest income 65,526 71,488 4,249 4,636
Fees and commissions receivable 9,217 17,285 598 1,121
Foreign exchange revaluation gains 4,572 4,820 297 312
Income/(Loss) on financial instruments at fair value through profit and loss
7 (1,090) (6,638) (71) (430)
Other operating income 8 665 682 43 44
Operating income 78,890 87,637 5,116 5,683
Administrative expenses 9,10 (33,050) (33,142) (2,143) (2,149)
Depreciation 23 (867) (1,026) (56) (67)
Specific impairment on investment secu-rities
21 - (5,917) - (384)
Impairment on loans and advances 20 (68,181) (53,525) (4,422) (3,471)
Profit/(Loss) on sale of financial assets 4,619 11,984 300 778
Operating (loss)/ profit before tax (18,589) 6,011 (1,205) 390
Tax on operating (loss)/profit 12 2,507 (5,468) 163 (355)
(Loss) /Profit after tax (16,082) 543 (1,042) 35
The dividends paid during the year (not included above) are detailed below:
Year endedMarch 31,
2017USD 000s
Year ended March 31,
2016USD 000s
Year endedMarch 31,
2017INR million
Year endedMarch 31,
2016INR million
Ordinary shares Dividend - - - -
The result for the year is derived entirely from continuing activities. The notes on pages 24 to 84 form part of these financial statements.

ICICI Bank UK PLCStrategic Report, Directors’ Report and Financial Statements
March 31, 2017United Kingdom
20
Statement of other comprehensive Income
for the year ended March 31, 2017 Convenience translation (Refer to Note 2 (b))
Note March 31, 2017
USD 000s
March 31, 2016
USD 000s
March 31, 2017
INR million
March 31, 2016
INR million
(Loss)/ Profit on ordinary activities after tax (16,082) 543 (1,042) 35
Other comprehensive Income
Movement in available for sale reserve
Movement in fair value during the year 4,933 (1,733) 319 (113)
Taxation relating to available for sale reserve (2,937) (131) (190) (8)
Net movement in available for sale reserve 1,996 (1,864) 129 (121)
Other comprehensive income for the period, net of tax
1,996 (1,864) 129 (121)
Total comprehensive income for the year (14,086) (1,321) (913) (86)
The notes on pages 24 to 84 form part of these financial statements.
ICICI Bank UK PLCStrategic Report, Directors’ Report and Financial Statements
March 31, 2017United Kingdom
21
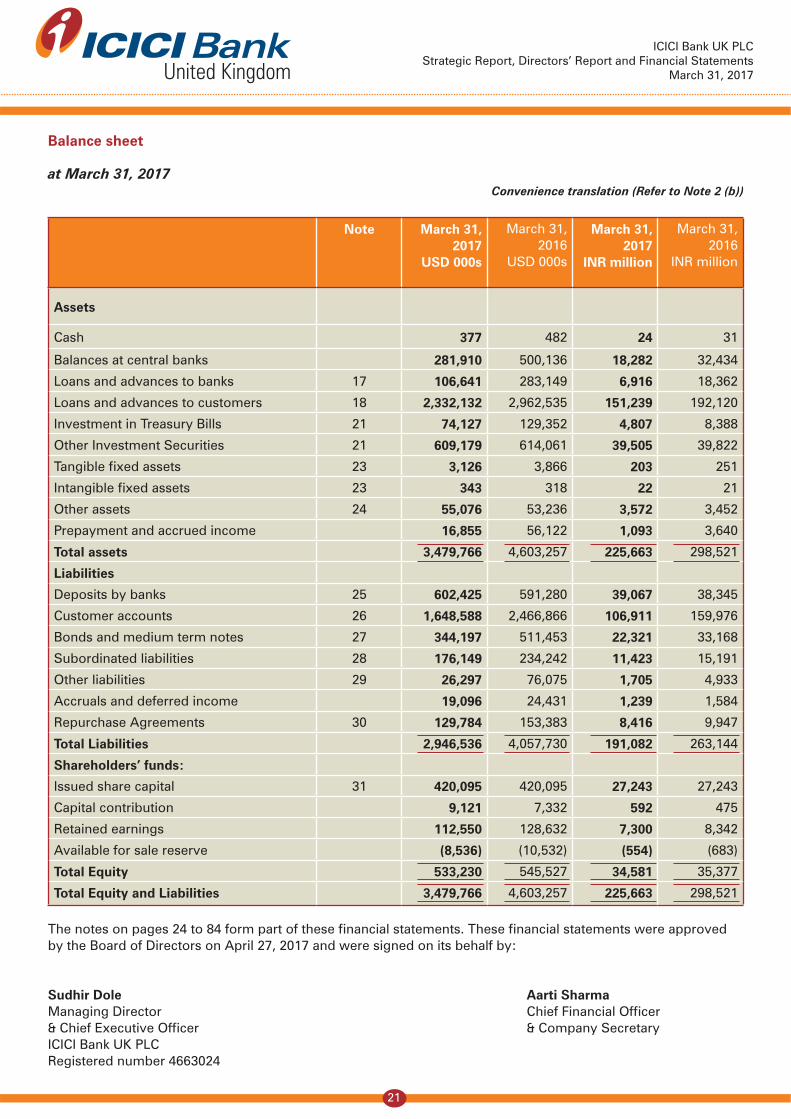
Balance sheet
at March 31, 2017 Convenience translation (Refer to Note 2 (b))
Note March 31, 2017
USD 000s
March 31, 2016
USD 000s
March 31, 2017
INR million
March 31, 2016
INR million
Assets
Cash 377 482 24 31
Balances at central banks 281,910 500,136 18,282 32,434
Loans and advances to banks 17 106,641 283,149 6,916 18,362
Loans and advances to customers 18 2,332,132 2,962,535 151,239 192,120
Investment in Treasury Bills 21 74,127 129,352 4,807 8,388
Other Investment Securities 21 609,179 614,061 39,505 39,822
Tangible fixed assets 23 3,126 3,866 203 251
Intangible fixed assets 23 343 318 22 21
Other assets 24 55,076 53,236 3,572 3,452
Prepayment and accrued income 16,855 56,122 1,093 3,640
Total assets 3,479,766 4,603,257 225,663 298,521
Liabilities
Deposits by banks 25 602,425 591,280 39,067 38,345
Customer accounts 26 1,648,588 2,466,866 106,911 159,976
Bonds and medium term notes 27 344,197 511,453 22,321 33,168
Subordinated liabilities 28 176,149 234,242 11,423 15,191
Other liabilities 29 26,297 76,075 1,705 4,933
Accruals and deferred income 19,096 24,431 1,239 1,584
Repurchase Agreements 30 129,784 153,383 8,416 9,947
Total Liabilities 2,946,536 4,057,730 191,082 263,144
Shareholders’ funds:
Issued share capital 31 420,095 420,095 27,243 27,243
Capital contribution 9,121 7,332 592 475
Retained earnings 112,550 128,632 7,300 8,342
Available for sale reserve (8,536) (10,532) (554) (683)
Total Equity 533,230 545,527 34,581 35,377
Total Equity and Liabilities 3,479,766 4,603,257 225,663 298,521
The notes on pages 24 to 84 form part of these financial statements. These financial statements were approved by the Board of Directors on April 27, 2017 and were signed on its behalf by:
Sudhir Dole Aarti SharmaManaging Director Chief Financial Officer& Chief Executive Officer & Company SecretaryICICI Bank UK PLCRegistered number 4663024

ICICI Bank UK PLCStrategic Report, Directors’ Report and Financial Statements
March 31, 2017United Kingdom
22
Statement of change in equity
for the year ended March 31, 2017
Issued Share Capital
USD 000s
Retained earnings
USD 000s
Other Com-prehensive
Income USD 000s
Other
USD 000s
Total
USD 000s
As at April 1, 2015420,095 128,089 (8,668) 5,912 545,428
Capital contribution (share based payments)
- - - 1,420 1,420
Other comprehensive income - - (1,864) - (1,864)
(Loss)/Profit on ordinary activities after tax
- 543 - - 543
As at April 1, 2016 420,095 128,632 (10,532) 7,332 545,527
Capital contribution (share based payments)
- - - 1,789 1,789
Other comprehensive income - - 1,996 - 1,996
(Loss)/Profit on ordinary activities after tax
- (16,082) - - (16,082)
Closing shareholders’ funds as at March 31, 2017
420,095 112,550 (8,536) 9,121 533,230
The notes on pages 24 to 84 form part of these financial statements.

ICICI Bank UK PLCStrategic Report, Directors’ Report and Financial Statements
March 31, 2017United Kingdom
23
Convenience translation (Refer to Note 2 (b))
Issued Share Capital
INR million
Retained earnings
INR million
Other Com-prehensive
Income INR million
Other
INR million
Total
INR million
As at April 1, 2015 27,243 8,307 (562) 383 35,371
Capital contribution (share based payments)
- - - 92 92
Other comprehensive income - - (121) - (121)
Profit on ordinary activities after tax
- 35 - - 35
As at April 1, 2016 27,243 8,342 (683) 475 35,377
Capital contribution (share based payments)
- - - 117 117
Other comprehensive income - - 129 - 129
(Loss)/Profit on ordinary activities after tax
- (1,042) - - (1,042)
Closing shareholders’ funds as at March 31, 2017
27,243 7,300 (554) 592 34,581
The notes on pages 24 to 84 form part of these financial statements.
ICICI Bank UK PLCStrategic Report, Directors’ Report and Financial Statements
March 31, 2017United Kingdom
24
Notes
(Forming part of the financial statements)
1 Reporting entity
ICICI Bank UK PLC (“ICICI Bank” or “the Bank”), is a Company incorporated in the United Kingdom. The Bank’s registered address is - One Thomas More Square, London E1W 1YN. The Bank is primarily involved in providing a wide range of banking and financial services including retail banking, corporate and commercial banking, trade finance and treasury services.
2 Basis of preparation
The Bank has prepared its annual accounts in accordance to Financial Reporting Standard 102 (FRS 102), The Financial Reporting Standard applicable in the UK and Republic of Ireland (‘FRS 102’) as issued in September 2015 with reduced disclosures. The Bank has also chosen to apply the recognition and measurement provision of IAS 39 Financial Instruments: Recognition and Measurement (as adopted for use in the EU), in accordance with FRS 102.
In these financial statements, the Bank is considered to be a qualifying entity and has applied the exemptions available under FRS 102 in respect of the following disclosures:
• Cash Flow Statement and related notes;
• Key Management Personnel compensation; and
• Certain disclosures required by FRS 102.26 Share Based Payments.
The financial statements have been prepared under the historical cost convention in accordance with the special provisions of Part XV of the Companies Act 2006 relating to banking companies and applicable accounting standards except for derivative financial instruments, financial instruments at fair value through profit or loss and available for sale financial assets which are valued at fair value.
The preparation of the financial statements requires management to make judgements, estimates and assumptions that affect the amounts reported for assets and liabilities as at the balance sheet date and the amounts reported for revenues and expenses during the year. However, the nature of estimation means that actual outcomes could differ from those estimates. The significant judgements and estimates have been in note 4.
(a) Statement of Compliance
The financial statements of the Bank have been prepared in accordance with Financial Reporting Standard 102 the Financial Reporting Standard applicable in the UK and Republic of Ireland (“FRS 102”).
(b) Functional and presentation currency and convenience translation
The financial statements are prepared and presented in US Dollars, which is the functional currency of the Bank as it represents the currency of the primary economic environment in which the Bank operates. A significant proportion of the Bank’s assets and revenues are transacted in US Dollars. All amounts in the financial statements have been rounded to the nearest $1,000. The financials are also presented in Indian Rupee (INR) currency for convenience using the year end exchange rate. These numbers are proforma only and should not be regarded as being in compliance with FRS102.
(c) Cash flow exemptions
Under section 1 of FRS 102, the Bank is exempted from the requirement to prepare a cash flow statement on the grounds that a parent undertaking includes the Bank in its own published consolidated financial statements. (See Note 45).
ICICI Bank UK PLCStrategic Report, Directors’ Report and Financial Statements
March 31, 2017United Kingdom
25
(d) Related party transactions
As the Bank is a wholly owned subsidiary of ICICI Bank Limited, the Bank has taken advantage of the exemption contained in section 33 of FRS 102 and has therefore not disclosed transactions or balances with wholly owned subsidiaries which form part of ICICI Bank Limited and disclosure requirement of any transactions with key management personnel of the entity or its parent. (See Note 45).
The company discloses transactions with related parties which are not wholly owned with the same group. It does not disclose transactions with members of the same group that are wholly owned.
(e) Going concern
The financial statements are prepared on a going concern basis as the Bank is satisfied that it has the resources to continue in business for the foreseeable future. The Bank meets its liquidity requirements through managing both retail and wholesale funding sources and meets the regulatory liquidity requirements through maintaining liquid assets. With regard to Capital, the Bank maintains adequate surplus over regulatory capital requirements. The Bank’s risk management policies and procedures are outlined in Note 39.
The Bank is a wholly owned subsidiary of ICICI Bank Limited. The parent bank has issued a letter of comfort to the Bank’s regulators, the Financial Services Authority (FSA), now the PRA, stating that the parent bank intends to financially support the Bank in ensuring that it meets all of its financial obligations as they fall due. In addition, the Bank’s forecasts and projections, taking account of possible changes in its business model in subsequent years, including stress testing and scenario analysis, show that the Bank will be able to operate at adequate levels of both liquidity and capital for the foreseeable future. In making their assessment, the Directors have also considered future projections of profitability, cash flows and capital resources as well as the strategic review of the business model which is conducted on a periodic basis. The Bank has been maintaining adequate capital and Tier 1 capital ratio. During FY2017, despite the losses, the capital and liquidity position of the Bank remained strong. The Directors are satisfied that the Bank has adequate resources to continue in business for the foreseeable future and therefore it is appropriate to prepare the Annual Accounts on a going concern basis.
3 Significant accounting policies
The following accounting policies have been applied consistently in dealing with items which are considered material in relation to the financial statements.
(a) Interest income and expense
Interest income and expense are recognised in profit and loss account using the effective interest rate method. The effective interest rate is the rate that exactly discounts the estimated future cash payments and receipts through the expected life of the financial asset or liability (or where appropriate, a shorter period) to the carrying amount of the financial asset or liability. When calculating the effective interest rate, the Bank estimates the future cash flows considering all cash flows considering all contractual terms of the financial instruments but not the credit losses. The effective interest rate is established on initial recognition (or upon reclassification) of the financial asset and liability and is not revised subsequently.
(b) Fees and commissions income and expense
Fees and commission are recognised in the profit and loss account when the service has been rendered, except when those fees are an adjustment to the yield on the related asset, in which case they are amortised over the expected maturity of the asset using the effective interest rate method. Fees and commissions payable on borrowings raised are expensed to the profit and loss account over the life of the borrowing raised using the effective interest rate method and are included in interest expense.
(c) Foreign Currencies
Monetary assets and liabilities denominated in foreign currencies are translated into US Dollars at the exchange
ICICI Bank UK PLCStrategic Report, Directors’ Report and Financial Statements
March 31, 2017United Kingdom
26
rates ruling at the balance sheet date and the gains or losses on translation are included in the profit and loss account. Income and expenses denominated in foreign currencies are converted into US Dollars at the rate of exchange ruling at the date of the transaction. The Germany and Belgium branches are treated as an extension of the UK bank’s activities and accordingly the translation approach is in compliance with FRS 102.30.5.
Non-monetary items measured at historical cost are translated using the exchange rate at the date of the transaction and non-monetary items measured at fair value are measured using the exchange rate when fair value was determined. foreign exchange gains and losses resulting from the settlement of transactions and from the translation at period-end exchange rates of monetary assets and liabilities denominated in foreign currencies are recognised in the profit and loss account.
(d) Financial assets and financial liabilities
The Bank initially recognises loans and advances, deposits, debt securities issued and subordinated liabilities on the date of origination.
The Bank classifies its financial assets in the following categories: financial instruments at fair value through profit and loss; loans and receivables; available for sale financial assets and held to maturity investments. The management determines the classification of financial assets at initial recognition. The financial assets are de-recognised when the rights to receive cash flows have expired or the Bank has transferred substantially all the risks and rewards of ownership. Financial instruments are recognised at trade date, being the date on which the Bank commits to purchase or sell the instruments.
Financial liabilities (other than derivatives) are measured at amortised cost and are recognised at value date (or settlement date). They are de-recognised when liabilities are extinguished.
(e) Investment securities
Investment securities are initially measured at fair value plus incremental direct transaction costs except when the investments are classified at fair value through profit and loss as described in Note 3(h). The investments are subsequently accounted for, depending on their classification, as either held to maturity, loans and receivable, fair value through profit or loss, or available for sale.
(f) Loans and receivables
Loans and receivables, which include loans and advances and other receivables, are non-derivative financial assets with fixed or determinable payments that are not quoted in an active market and which are not classified as held for trading, designated at fair value through profit and loss, available for sale or held to maturity. Loans and receivables are initially recognised at fair value including direct and incremental transaction costs. They are subsequently valued at amortised cost using effective interest rate method. Loans and receivables are stated at amortised cost after deduction of amounts which are required as impairment provisions. Where loans have been acquired at a premium or discount, these premiums and discounts are amortised through the profit and loss account from the date of acquisition to the expected date of maturity using the effective interest rate method.
Policy in relation to impairment: The Policy on impairment of loans and receivables is described in Note 4.
Policy in relation to write-offs: The Bank considers exposure for write off when the prospect of recovery over the next 12 months is remote and interest has not been serviced for the past 12 months. Any amount written off is in the first instance applied against specific provision for the exposure. In the normal course of business the loss to be written off will already have been fully provided. Any decision for a write-off is approved by the Board Credit Committee of the Bank.
Policy in relation to write back: If, in a subsequent period, the amount of the impairment loss decreases and the decrease can be related objectively to an event occurring after the impairment was recognised (such as an improvement in the debtor’s credit rating), the previously recognised impairment loss is reversed either directly or by adjusting an allowance account. The reversal shall not result in a carrying amount of the financial
ICICI Bank UK PLCStrategic Report, Directors’ Report and Financial Statements
March 31, 2017United Kingdom
27
asset that exceeds what the amortised cost would have been had the impairment not been recognised at the date the impairment is reversed. The amount of the reversal of impairment allowance and any recovery related to a written off asset shall be recognised in profit or loss.
(g) Fair value measurement
Fair value is the amount for which an asset could be exchanged, or a liability settled, between knowledgeable, willing parties in an arm’s length transaction, on the measurement date. This is determined by reference to the quoted bid price or asking price (as appropriate) in an active market wherever possible.
When independent prices are not available or if the market for a financial instrument is not active, fair values are determined by using valuation techniques which refer to observable market data. These include comparison with similar instruments where market observable prices exist, discounted cash flow analysis, option pricing models and other valuation techniques commonly used by market participants. Fair values of financial instruments may be determined in whole or in part using valuation techniques based on assumptions that are not supported by prices from current market transactions or observable market data.
In case of unobservable inputs or in case of unlisted entities, the inputs into valuations based on unobservable data are inherently uncertain because there is little or no current market data available from which the level at which an arm’s length transaction would occur under normal business conditions could be determined. In such cases, estimates are made in the valuation technique to reflect uncertainties in fair values resulting from a lack of market data inputs. These include most recent arm’s length transaction between knowledgeable, willing parties; reference to fair value of a similar instrument; discounted cash flow; or option pricing models.
However, the valuation techniques incorporate all factors that market participants have considered in setting a price; and have been consistent with accepted economic methodologies for pricing financial instruments.
Note 21 provide a detailed disclosure regarding classification and Fair value of instruments held by the Bank.
(h) Financial instruments at fair value through profit and loss
Financial instruments are classified in this category if they are held for trading. Instruments are classified as held for trading if they are:
i) Acquired/incurred principally for the purposes of selling or repurchasing in the near term; ii) Part of a portfolio of identified financial instruments that are managed together and for which there is
evidence of a recent actual pattern of short-term profit-taking; or iii) It is a derivative (except for derivative that is a financial guarantee contract or a designated as effective
hedging instrument).
Financial instruments cannot be transferred into or out of this category after inception except certain assets on reclassification. Financial instruments included in this category are recognised initially at fair value and transaction costs are taken directly to the profit and loss account. Financial instruments at fair value through profit and loss include debt securities which are held for trading and valued at fair value.
Derivatives are carried at fair value in the balance sheet within ‘Other assets’ and ‘Other liabilities’. Valuation adjustments to cover credit and market liquidity risks are made with gains and losses taken directly to the profit and loss account and reported within income/(loss) on financial instruments at fair value through profit and loss. The credit valuation adjustment is an adjustment to the valuation of Over the Counter (OTC) derivative contracts to reflect within fair value the possibility that the counterparty may default and that the Bank may not receive the full market value of the transactions. The debit valuation adjustment is an adjustment to the valuation of OTC derivative contracts to reflect within fair value the possibility that the Bank may default, and that the Bank may not pay full market value of the transactions.
Positive and negative fair values of derivatives are offset where the contracts have been entered into under

ICICI Bank UK PLCStrategic Report, Directors’ Report and Financial Statements
March 31, 2017United Kingdom
28
netting agreements or other arrangements that represent a legally enforceable right of set-off, which will survive the liquidation of either party, and there is the intention to settle net.
The Bank uses a Central Clearing Counterparty (CCP) for clearing its certain classes of OTC derivatives to reduce counterparty credit risk.
(i) Held to maturity financial assets
Held-to-maturity investments are non-derivative assets with fixed or determinable payments and fixed maturity that the Bank has the positive intent and ability to hold to maturity, and which are not designated at fair value through profit or loss or as available for sale. Held-to-maturity investments are carried at amortised cost using the effective interest method.
(j) Available for sale financial assets
Available for sale financial assets are those non-derivative financial assets that are designated as available for sale and are not categorised into any of the other categories described above. They are initially recognised at fair value including direct and incremental transaction costs. They are subsequently held at fair value. Gains and losses arising from changes in fair value are included in the available for sale securities reserve until sale/derecognition, when the cumulative gain or loss is transferred to the profit and loss account.
Impairment losses on available for sale investment securities are recognised by transferring the cumulative loss that has been recognised directly in equity to profit and loss account. The cumulative loss that is removed from equity and recognised in profit and loss is the difference between the acquisition cost, net of any principal repayment and amortisation, and the current fair value, less any impairment loss previously recognised in profit or loss account.
If, in a subsequent period, the fair value of an impaired available for sale debt security increases and the increase can be objectively related to an event occurring after the impairment loss was recognised in profit or loss account, the impairment loss is reversed, with the amount of the reversal recognised in profit or loss account. However, any subsequent recovery in the fair value of an impaired available for sale equity investment is recognised directly in reserves since it cannot be reversed through the profit and loss account.
(k) Reclassification of financial assets
The amendment to FRS 26 (FRS 26 has now been superseded by FRS 102) issued on October 10, 2008 permitted an entity to reclassify non-derivative financial assets (other than those designated at fair value through profit or loss by the Bank upon initial recognition) out of the fair value through profit and loss category in rare circumstances. The amendment also permitted an entity to transfer from the available for sale category to the loans and receivables category a financial asset that would have met the definition of loans and receivables and if the entity has the intention and ability to hold that financial asset for the foreseeable future.
When a financial asset is reclassified, it is reclassified at its fair value on the date of reclassification. Any gain or loss already recognized in the profit and loss account or shareholder equity, as appropriate, is not reversed. The fair value of the financial asset on the date of reclassification becomes its fair value or amortised cost, as applicable. Under FRS 102, the Bank chose to continue following IAS 39 for financials assets classification and measurement and disclosure as per Section 11 and 12 and 34 of FRS 102.
(l) Derivatives held for risk management purposes and hedge accounting instruments and hedging activities
Transactions are undertaken in derivative financial instruments (derivatives), which include interest rate swaps, futures, forward rate agreements, currency swaps, options and similar instruments, for trading and non-trading purposes. The Bank may designate a derivative as either a hedge of the fair value of a recognised fixed rate asset or liability or an unrecognised firm commitment (fair value hedge), a hedge of a forecasted transaction or the variability of future cash flows of a floating rate asset or liability (cash flow hedge) or a foreign-currency fair

ICICI Bank UK PLCStrategic Report, Directors’ Report and Financial Statements
March 31, 2017United Kingdom
29
value or cash flow hedge (foreign currency hedge). All derivatives are recorded as assets or liabilities on the balance sheet at their respective fair values with unrealised gains and losses recorded either in reserves or in the profit and loss account, depending on the purpose for which the derivative is held. Derivatives that do not meet the criteria for designation as a hedge under FRS 102 at inception, or fail to meet the criteria thereafter, are accounted for in other assets with changes in fair value recorded in the profit and loss account.
Changes in the fair value of a derivative that is designated and qualifies as a fair value hedge, along with the
gain or loss on the hedged asset or liability that is attributable to the hedged risk are recorded in the profit and loss account as other non-interest income. To the extent of the effectiveness of a hedge, changes in the fair value of a derivative that is designated and qualifies as a cash flow hedge, are recorded in reserves. For all hedging relationships, ineffectiveness resulting from differences between the changes in fair value or cash flows of the hedged item and changes in the fair value of the derivative are recognised in the profit and loss account as other non-interest income.
At the inception of a hedge transaction, the Bank formally documents the hedging relationship and the risk management objective and strategy for undertaking the hedge. This process includes identification of the hedging instrument, hedged item, risk being hedged and the methodology for measuring effectiveness. In addition, the Bank assesses both at the inception of the hedge and on an ongoing quarterly basis, whether the derivative used in the hedging transaction has been highly effective in offsetting changes in fair value or cash flows of the hedged item, and whether the derivative is expected to continue to be highly effective.
The Bank discontinues hedge accounting prospectively when it is either determined that the derivative is no longer highly effective in offsetting changes in the fair value or cash flows of a hedged item; the derivative expires or is sold, terminated or exercised; the derivative is de-designated because it is unlikely that a forecasted transaction will occur; or management determines that designation of the derivative as a hedging instrument is no longer appropriate.
When a fair value hedge is discontinued, the hedged asset or liability is no longer adjusted for changes in fair value and the existing basis adjustment is amortised or accreted over the remaining life of the asset or liability. When a cash flow hedge is discontinued but the hedged cash flow or forecasted transaction is still expected to occur, gains and losses that were accumulated in reserves are amortised or accreted into the profit and loss account. Gains and losses are recognised in the profit and loss account immediately if the cash flow hedge was discontinued because a forecasted transaction did not occur.
(m) Other derivatives
The Bank may occasionally enter into a contract (host contract) that contains a derivative that is embedded in the financial instrument. If applicable, an embedded derivative is separated from the host contract and can be designated as a hedge; otherwise, the derivative is recorded as a freestanding derivative. Such financial instruments stand extinguished at the time of conversion (debt into equity), sale and maturity.
(n) Sale and repurchase agreements
When securities are sold subject to a commitment to repurchase them at a predetermined price (‘repos’), they remain on the balance sheet as, in substance, these transactions are in the nature of secured borrowings. As a result of these transactions, the Bank is unable to use, sell or pledge the transferred assets for the duration of the transaction. Similarly, securities purchased under commitments to sell (‘reverse repos’) are not recognised on the balance sheet.
(o) Identification and measurement of impairment
Impairment provisions/charges are made where there is objective evidence of impairment as a result of one or more events that occurred after the initial recognition of the asset and that loss event (or events) has an impact on the estimated future cash flows from the asset that can be reliably estimated. Losses expected as a result of future events are not recognised. Evidence of impairment is considered on both individual and portfolio basis.
Refer Note 4 (a) and Note 4 (b) for the detailed policy guidance.
ICICI Bank UK PLCStrategic Report, Directors’ Report and Financial Statements
March 31, 2017United Kingdom
30
(p) Fixed assets
Fixed assets are stated at cost less accumulated depreciation and impairment. Cost includes expenditures that are directly attributable to the acquisition of the asset
Depreciation is provided to write off the cost less the estimated residual value of tangible fixed assets. Depreciation on intangible assets is provided on a straight-line basis over their estimated useful economic life. The useful economic life of the fixed assets is expected as follows:
Leasehold improvements Over the lease period Office equipment 6 – 7 years Furniture, fixtures and fittings 6 – 7 years Computer hardware 3 – 4 years Software Over the estimated useful life1
1The useful life is on an average is currently between 1-5 years
Depreciation methods, useful life and residual values are reviewed at each balance sheet date. Depreciation is charged to the profit and loss account for all the fixed assets.
(q) Provisions
Provisions are recognised when it is probable that an outflow of economic benefits will be required to settle a present, legal or constructive obligation, which has arisen as a result of a past event and for which a reliable estimate can be made of the amount of the obligation. All significant provisions have been discounted for current market assessments and the time value of money.
(r) Deposits, debt securities issued and subordinated liabilities
Deposits, debt securities issued and subordinated liabilities are the sources of debt funding. These are initially measured at fair value plus directly attributable transaction costs, and subsequently measured at their amortised cost using the effective interest method.
(s) Income tax expense
Income tax expense comprises current and deferred tax. Income tax and deferred tax expense is recognised in the profit and loss statement except to the extent that it relates to items recognised directly in equity, in which case it is recognised in equity.
Current tax is the expected tax payable or receivable on the taxable income or loss for the year, using tax rates enacted or substantially enacted at the reporting date and includes any adjustment to tax payable in respect of previous years.
Deferred tax is recognised, in respect of all timing differences between the carrying amounts of assets and liabilities for financial reporting purposes and the amounts used for taxation purposes including carry forward losses. As required by section 29 of FRS 102 “Deferred Tax”, deferred tax is measured at the tax rates expected to be applied to the temporary difference when they reverse, based on the tax laws that have been enacted or substantially enacted by the reporting date. Deferred tax assets are recognised to the extent that, on the basis of all available evidence, it can be regarded as more likely than not that there will be sufficient future taxable profits from which the future reversal of the underlying timing differences can be deducted.
A deferred tax asset is recognised only to the extent that it is probable that future taxable profits will be available against which the asset can be utilised. Deferred tax assets are reviewed at each reporting date and are reduced to the extent that it is no longer probable that the related tax benefit will be realised.

ICICI Bank UK PLCStrategic Report, Directors’ Report and Financial Statements
March 31, 2017United Kingdom
31
(t) Employee benefits
The Bank operates a stakeholder defined contribution pension scheme. Contributions to the scheme are charged to the profit and loss account as incurred.
(u) Leases
Operating lease rentals are charged to the profit and loss account on a straight line basis over the non-cancellable lease term provided the same is ascertainable unless another basis is more appropriate.
Income from sub lease: Income from sub lease is booked in other operating income line of the profit and loss account on a straight line basis over the remaining term of the sub lease.
(v) Share based payments
The Parent Bank (ICICI Bank Limited) has issued share options to the employees of ICICI Bank UK PLC. These transactions are recognised as equity-settled share based payments. The expense is recognised over the vesting period based on the market value of shares as on the date of grant of shares, adjusted for the number of the employees leaving the Bank. A capital contribution from the Parent Bank is recognised in the books over the vesting period in the shareholders’ funds. Under FRS 102 Section 26, a subsidiary should recognise an expense in its profit and loss account to reflect the effective remuneration paid to employees in respect of share awards granted by the Parent Bank. The corresponding entry is to equity as the amounts are considered to be capital contributions by the Parent Bank.
As the Bank is a wholly owned subsidiary of ICICI Bank Limited, the Bank has taken advantage of the exemption contained in section 26 of FRS 102 and has therefore not disclosed certain information under section 26.18(b), 26.19 to 26.23 of FRS 102.
(w) Cash and cash equivalents
Cash and cash equivalents include notes and coins on hand, unrestricted balances held with central banks and highly liquid financial assets with original maturities of less than three months, which are subject to insignificant risk of changes in their fair value, and are used by the Bank in the management of its short-term commitments.
(x) Other liabilities
The other liabilities consist of liabilities for the creditors, settlement balances, derivatives financial instruments, Corporation tax payable and other creditors. The derivative financial instruments are measured at fair value through profit and loss; other creditors are measured at amortised cost. These liabilities are de-recognised when liabilities are extinguished.
(y) Share Capital
Shares are classified as equity when there is no contractual obligation to transfer cash or other financial assets. Incremental costs directly attributable to the issue of equity instruments are shown in equity as a deduction from proceeds, net of tax.
4 Significant judgements and estimates
The preparation of financial statements requires management to make judgements, estimates and assumptions that affect the reported amounts of assets, liabilities, income and expenses. Estimates, judgements and assumptions are continually evaluated and are based on historical experience and other factors, including expectations of future events that are believed to be reasonable under the circumstances. Considering the inherent uncertainty and subjectivity in making judgements and estimates, outcomes in future periods may be different from those on which the management’s estimates are based. Revisions to accounting estimates are recognised in the period in which the estimate is revised and in any future periods affected. The accounting policies deemed critical to the Bank’s results and financial position, based upon significant judgements and estimates, are discussed below.

ICICI Bank UK PLCStrategic Report, Directors’ Report and Financial Statements
March 31, 2017United Kingdom
32
(a) Allowances for credit losses
The Bank regularly reviews its loan portfolio to assess for impairment. Provisions are established to recognise incurred losses in the loan portfolio carried at amortised cost. In determining whether an impairment has occurred at the balance sheet date, the Bank assesses if there is objective evidence of impairment as a result of one or more events that occurred after the initial recognition of the asset (a ‘loss event’) and that loss event (or events) has an impact on the estimated future cash flows of the financial asset or group of financial assets that can be reliably estimated. It may not be possible to identify a single, discrete event that caused the impairment rather the combined effect of several events may have caused the impairment.
The Credit Risk Management Policy (CRMP) outlines the provisioning policy of the Bank which includes the approach to holding collective and specific provisions. During the year, the policy was amended for enhancing the objectivity in the impairment classification process and to enhance the alignment with regulatory benchmarks for exposures in default.
i) As at March 31, 2017, the Bank amended its impairment classification policy to include all exposures past due for 90 days or more to be classified as impaired unless restructuring terms have been substantially agreed and are due to be implemented over next 60 days. The comparative figure for FY2016 of the past due impaired loans based on the revised policy has been reclassified. (Refer note 19).
The Bank’s policies governing specific impairment, restructuring/renegotiation and collective provision are detailed below:
ii) Specific impairment: In accordance with the Bank’s Credit Risk Management Policy (CRMP), the Bank identifies on a monthly basis, cases that are internally rated ‘B’ or below and/or significantly in breach of any covenants, including delays in debt servicing and/or where there is an expectation of significant credit deterioration.
Borrower’s financial difficulty/credit deterioration/trigger event: The Bank assesses an asset for specific impairment if it becomes probable that the borrower is facing significant financial difficulty. The Bank also assesses for specific impairment and makes specific provision if necessary, if there is evidence of any significant credit deterioration or any event which indicates a reduced ability for the borrower to repay its interest and principal. The indicators of impairment can include, among other things:
a) Net worth of the risk counterparty/borrower turning negative b) Delay in interest and or principal repayments c) Breach in financial covenants d) Likelihood of borrower entering bankruptcy/ financial reorganization. e) Rating downgrade by external credit rating agencies. f) National or local economic conditions that correlate with defaults on the assets in the borrower
group (e.g. an increase in the unemployment rate in the geographical area of the borrowers, a decrease in oil prices for loan assets to oil producers, or adverse changes in industry conditions that affect the borrowers in the group).
g) Substantial decline in value of security provided to the Bank, especially when security is prime
consideration for the lending. The unsecured portion of the exposure may be subjected to impairment testing.
h) Invocation of contractual comfort by the Bank such as corporate guarantee/put option which is not
honoured by the counterparty.
Identification of specific impairment in an account: The Bank’s policy is to identify and recognize

ICICI Bank UK PLCStrategic Report, Directors’ Report and Financial Statements
March 31, 2017United Kingdom
33
impairment in a loan when it is probable that the Bank will not be able to collect, or there is no longer a reasonable certainty that the Bank will collect all amounts due according to the contractual terms of the loan agreement. The Bank’s policy is to identify and recognize impairment in a loan when it is probable that the Bank will not be able to collect, or there is no longer a reasonable certainty that the Bank will collect all amounts due according to the contractual terms of the loan agreement.
The following disclosure practices have been adopted in Note 19 for FY2017 and FY2016:
• Loans are disclosed as impaired where an individual allowance has been raised against the loan. • All exposures past due for 90 days or more are classified as impaired unless restructuring terms
have been substantially agreed and are due to be implemented over next 60 days. • Exposures past due for less than 90 days not classified as impaired include (i) loans with overdue
principal, interest or other amounts at the balance sheet date but no loss is expected; and (ii) past due loans with adequate collateral cover.
The objective of the policy is to maintain an appropriate level of provision reflective of the risk profile of the loan portfolio. It is not the Bank’s policy to systematically over-provide or under-provide for its Credit Risk. The provision weightings included in the policy document are continually monitored against the lending experience of the Bank and are periodically adjusted to reflect such experience.
The Bank’s policy is predicated on the premise that regardless of the quality of a lending institution and of its systems and procedures and of its client base the business of extending credit carries the intrinsic risk of such credit not being repaid and monies advanced proving to be irrecoverable. In accordance with the guidelines of FRS 102, an impairment loss for financial assets measured at amortized cost is the difference between the asset’s carrying amount and the present value of the estimated future cash flows discounted at the asset’s original effective interest rate. The estimated future cash flows take into account only the credit losses that have been incurred at the time of the impairment loss calculation. In case the expected cash flows are not available, the breakup value of security/collateral for respective facilities under watch is calculated in accordance with the Bank’s collateral valuation policy. In line with accounting guidelines, the Bank recognises an impairment loss equal to the best estimate within the range of reasonably possibly outcomes, taking into account all relevant information available about conditions existing at the end of the reporting period. For determining the specific provisions on individual impaired cases, the management exercises judgment involving matters such as realisable value of the security, estimation of the future cash flows and their timing. Consequently these allowances can be subject to variation as time progresses and the circumstances of the borrower become clearer.
iii) Restructured/renegotiated cases: A restructured account is one where the Bank, for economic or legal reasons relating to the borrower’s difficulty, grants to the borrower concessions that the Bank would not otherwise consider. Restructuring would normally involve modification of the terms of advances/securities which could include alteration of repayment period/repayable amount/the amount of instalments/rate of interest (due to reasons other than competition). The restructuring of an asset is only granted in situations where the customer has showed a willingness to repay the borrowing and is expected to be able to meet the revised terms of the restructuring. The Bank measures a restructured troubled loan by reducing its recorded value to its net realisable value, taking into account the cost of all concessions at the date of the restructuring. The reduction in the carrying value is recorded as a charge to the profit and loss statement in the period in which the loan is restructured.
In relation to loans and advances, the modifications of terms and conditions related to security and collateral arrangements or the waiver of certain covenants which do not affect payment arrangements, are not regarded as sufficient indicators of impairment or restructuring, as such changes do not necessarily indicate credit issues affecting the borrower’s payment ability.
The Bank charges penal interest to the borrower for any delay in interest/principal payment unless a waiver has been approved by the Bank’s relevant authority. As per the Bank’s practice, such waivers are given in exceptional circumstances which could be mainly related to procedural delays in receiving the interest/principal payment by the due date.
ICICI Bank UK PLCStrategic Report, Directors’ Report and Financial Statements
March 31, 2017United Kingdom
34
The Bank derecognises a loan when there are substantial modifications to the terms of the loan on restructuring.
iv) Collective provision: Collectively assessed impairment allowances cover credit losses inherent in portfolios with similar economic characteristics, when there is objective evidence to suggest that they contain impaired claims, but, the individual impaired items cannot yet be identified. In assessing the need for collective impairment allowances, management considers factors such as historical loss trends, credit quality of the portfolio, portfolio size, concentrations, and economic factors. The aggregate amount of specific and collective provisions is intended to be sufficient to absorb estimated credit losses generated in the loan portfolio.
The collective impairment policy as defined in the CRMP stipulates that collective provision, based on the credit rating of the exposures, needs to be provided in respect of the entire performing loan and receivables portfolio. The Bank has followed FRS 102 guidelines for defining its collective impairment policy wherein the provisioning is determined by the extent of the underlying credit risk in the portfolio of the Bank. This is also the direction provided by the Basel Accord. The exposures that are individually assessed for impairment and for which an impairment loss is or continues to be recognised, are not included in the collective assessment of impairment. In line with market practice, the Bank has been using a representative set of Probability of Default (PD)/Loss Given Default (LGD) data to determine the extent of provisioning required to be made by the Bank in respect of its performing loan portfolio on a collective basis. The aggregate provisioning requirement is arrived at by multiplying the outstanding amounts under each portfolio type (internally rated and externally rated exposures) on the relevant date with the corresponding PD and LGD.
In the absence of adequate internal default history and on account of a similar internal credit rating scale, the Bank has used Probability of Default (PD) data of its Parent (ICICI Bank Limited) for estimating the collective provisioning on its internally rated India country of exposure portfolio. For the internally rated non-India country of exposure portfolio, the Bank has used PD data from Moody’s, corresponding to the geographies which make up the majority of its non-India exposures. The Bank considers a time horizon of one year to be appropriate for estimating collective provisions, as it believes that this is reflective of the emergence period for losses in its portfolio. The Bank has used historical PDs over a ten year look back period for the India-linked, non-India linked and externally rated portfolios to calculate the collective provision. The Bank has a framework for applying economic scalars for each portfolio which are applied while estimating the collective provision and are reviewed periodically. The LGD for the externally rated ABS portfolio has been assumed at 50.0% based on S&P’s experience of recovery rates. For the internally rated portfolio, the LGD has been calculated based on the collateral available with the Bank. LGD and haircuts applicable for each collateral as prescribed in Basel II guidelines have been considered. The historical average PD data being used covers a full economic cycle and captures periods of low economic activity when relatively higher default rates were observed. During the year, the Bank refined its collective impairment methodology from a “through the cycle” assessment to a “point in time” evaluation by introducing economic scalars which takes into account macroeconomic factors as well as variables relevant to the Bank’s customer base, for which the impact is not material.
(b) Impairment of available for sale financial assets
The Bank regularly reviews its available for sale securities portfolio to assess for impairment. The Bank considers all available evidence, including observable market data or information about events specifically relating to the securities which may result in a shortfall in recovery of future cash flows. These events may include a significant financial difficulty of the issuer, a breach of contract such as a default, bankruptcy or other financial reorganisation, or the disappearance of an active market for the debt security because of financial difficulties relating to the issuer, information about the issuer’s liquidity, business and financial risk exposures, level of and trends in default for similar financial assets and national and local economic conditions. While assessing ABS for objective evidence of impairment, the Bank considers the performance of the underlying collateral, changes in credit rating, credit enhancements, default events etc. Once impairment has been identified, the amount of impairment is measured based on the difference between the acquisition cost (net of any principal repayment and amortisation) and current fair value, less any impairment loss previously recognised in profit or loss. In determining whether an impairment event has occurred at the balance sheet date, the Bank considers whether

ICICI Bank UK PLCStrategic Report, Directors’ Report and Financial Statements
March 31, 2017United Kingdom
35
there is any observable data which comprises evidence of the occurrence of a loss event, and evidence that the loss event results in a decrease in estimated future cash flows or their timings. Such observable data includes any adverse change in the payment status of borrowers or changes in economic conditions that correlate with defaults on loan repayment obligations.
Available-for-sale equity investments: A significant or prolonged decline in the fair value of the equity below its cost is an objective evidence of impairment. In assessing whether it is significant, the decline in fair value is evaluated against the original cost of the asset at initial recognition. In assessing whether it is prolonged, the decline is evaluated against the continuous period in which the fair value of the asset has been below its original cost at initial recognition.
The negative mark to market (MTM) on the AFS portfolio is monitored by the Bank on a regular basis. The Bank follows its valuation policy for valuing its AFS portfolio (refer point (c) relating to ‘Valuation of financial instruments’ below).
(c) Valuation of financial instruments
The Bank values its available for sale and held for trading investment securities at fair market value. The best evidence of fair value is a quoted price in an actively traded market. If the market for a financial instrument is not active, or the financial instruments are traded infrequently and have little price transparency or the fair value is less objective, and requires varying degrees of judgment, the Bank uses valuation techniques to arrive at the fair value. The valuation techniques employ observable market data to calculate fair values, including comparisons with similar financial instruments for which market observable prices exist. When valuing instruments by reference to comparable instruments, management takes into account the maturity, structure and rating of the instrument with which the position held is being compared. The Bank values the equity option embedded in the financial instruments such as FCCBs based on valuation techniques with observable market inputs.
(d) Deferred Tax Asset
A Deferred Tax Asset (DTA) is recognised after being assessed as recoverable on the basis of available evidence including projected profits, capital and liquidity position. The management makes an assessment of a deferred tax asset which is recognised only to the extent that it is probable that future taxable profits will be available against which the asset can be utilised. Deferred tax assets are reviewed at each reporting date and are reduced to the extent that it is no longer probable that the related tax benefit will be realised.
5 Interest income and similar income on arising on debt securities and others
Interest income is recognised in profit and loss using the effective interest rate method. The effective interest rate is the rate that exactly discounts the estimated future cash payments through the expected life of the financial instrument (or where appropriate, a shorter period) to the carrying amount of the financial asset.
Year ended March 31,
2017USD 000s
Year ended March 31,
2016 USD 000s
Year ended March 31,
2017INR million
Year ended March 31,
2016INR million
Interest income on financial assets under AFS category 10,602 10,232 687 664
Interest income on financial assets under HTM category 10,021 6,309 650 409
Total 20,623 16,541 1,337 1,073
Other interest income and similar income
Interest income on financial assets under Loans and receivable category
95,693 119,854 6,205 7,773
Interest income on financial assets measured at FVTPL 2,094 4,664 136 302
Total 97,787 124,518 6,341 8,075

ICICI Bank UK PLCStrategic Report, Directors’ Report and Financial Statements
March 31, 2017United Kingdom
36
6 Interest expenses
Interest expense is recognised in profit and loss using the effective interest rate method. The effective interest rate is the rate that exactly discounts the estimated future cash payments through the expected life of the financial liability (or where appropriate, a shorter period) to the carrying amount of the financial liability.
Year ended March 31,
2017USD 000s
Year ended March 31,
2016 USD 000s
Year ended March 31,
2017INR million
Year ended March 31,
2016INR million
Interest expense on financial liabilities measured at amortised cost
52,884 69,571 3,429 4,512
Total 52,884 69,571 3,429 4,512
7 Income/(Loss) on financial instruments at fair value through profit and loss
(Loss)/Income on financial instruments at fair value through profit and loss consists of unrealised and realised gains or losses on transactions in securities and derivatives.
Year ended March 31,
2017USD 000s
Year ended March 31,
2016 USD 000s
Year ended March 31,
2017INR million
Year ended March 31,
2016INR million
Realised gains/(losses) on derivative instruments (in-cluding equity option of FCCBs)
3,071 (5,647) 199 (366)
Unrealised gains/(losses) on derivative instruments * (4,161) (991) (270) (64)
Total (1,090) (6,638) (71) (430)
* FY2017 includes MTM on terminated hedge deals having an offset in NII on account of amortisation of MTM on the underlying deals.
8 Other operating income
Other operating income primarily consists of retail branch related fees, other corporate banking related income and income from sub-leasing of a portion of the corporate office premises.

ICICI Bank UK PLCStrategic Report, Directors’ Report and Financial Statements
March 31, 2017United Kingdom
37
Profit on ordinary activities before tax is stated after charging
9 Administrative expenses
Year ended March 31,
2017USD 000s
Year ended March 31,
2016 USD 000s
Year ended March 31,
2017INR million
Year ended March 31,
2016INR million
Staff costs (including Directors' emoluments):
- Wages and salaries 18,277 17,958 1,185 1,165
- Social security costs 1,276 1,505 83 98
- Other pension costs 457 515 30 33
Operating lease expenses 2,555 2,548 166 165
Other administrative expenses 10,485 10,616 679 688
Total 33,050 33,142 2,143 2,149
The number of persons employed by the Bank (including Directors) during the year was as follows:
Year ended March 31, 2017
No. of Employees
Year ended March 31, 2016
No. of Employees
Management 51 41
Non Management 141 143
Total 192 184
10 Auditor’s remuneration
Year ended March 31,
2017USD 000s
Year ended March 31,
2016 USD 000s
Year ended March 31,
2017INR million
Year ended March 31,
2016INR million
Fees payable to the Bank's statutory auditors and their associates for the audit of Bank’s annual accounts
436 486 28 31
Fees payable to the Bank’s statutory auditors and their associates for other services:
Audit related assurance services 417 430 27 28
Tax compliance services* 7 27 - 2
Total 860 943 55 61
* During the year, the Bank engaged another firm to provide tax compliance services following EU audit reform based on which the statutory auditors are not permitted to provide tax compliance services.
11 Segmental reportingThe Board reviews the Bank’s performance as a single business and does not seek to allocate major resources such as capital, liquidity and funding into the different customer groups (Corporate and Commercial, Retail and Treasury).

ICICI Bank UK PLCStrategic Report, Directors’ Report and Financial Statements
March 31, 2017United Kingdom
38
12 Taxation
(a) Analysis of charge/(credit) in the year
Year ended March 31,
2017USD 000s
Year ended March 31,
2016 USD 000s
Year ended March 31,
2017INR million
Year ended March 31,
2016INR million
UK Corporation tax at 20% (2016: 20%) - 1,209 - 78
Overseas corporation charge 2,159 5,142 140 333
Double Tax Relief - (1,209) - (78)
Adjustments for prior years* (1,381) (4) (90) -
778 5,138 50 333
Deferred tax charge/(credit)
- Origination/timing and rate difference (3,285) 330 (213) 22
Total Tax for the year ended March 31 (2,507) 5,468 (163) 355
*As prescribed by UK Finance Act 2015, the Bank implemented the change to the timing of Available For Sale (AFS) gains and losses being taxed to follow the timing of recognition in the profit and loss account. As a consequence, the Bank reassessed the tax balance on AFS reserves and reversed the excess tax of USD 1.5 million from AFS reserve to the Profit and Loss account which is included in the prior year adjustments as shown above.
(b) Analysis of total taxation in the year
Year ended March 31, 2017USD 000s
Year ended March 31, 2016 USD 000s
Current tax
Deferred tax
Total taxCurrent
taxDeferred
taxTotal tax
Recognised in Profit and loss account 778 (3,285) (2,507) 5,138 330 5,468
Recognised in other comprehensive income
1,456 1,481 2,937 - - -
Total tax 2,234 (1,804) 430 5,138 330 5,468
Year ended March 31, 2017INR million
Year ended March 31, 2016 INR million
Current tax
Deferred tax
Total taxCurrent
taxDeferred
taxTotal tax
Recognised in Profit and loss account 50 (213) (163) 333 22 355
Recognised in other comprehensive income*
95 96 191 - - -
Total tax 145 (117) 28 333 22 355
*The USD 1.5 million current tax charge to OCI is a prior year adjustment relating to the change in the tax rules and includes amounts relating to 2016.
ICICI Bank UK PLCStrategic Report, Directors’ Report and Financial Statements
March 31, 2017United Kingdom
39
(c) Total tax reconciliation
Year ended March 31,
2017USD 000s
Year ended March 31,
2016 USD 000s
Year ended March 31,
2017INR million
Year ended March 31,
2016INR million
(Loss)/Profit before tax (18,589) 6,010 (1,205) 390
Tax using the UK CT rate of 20% (2016: 20%) (3,718) 1,202 (241) 78
Add effects of:
- Overseas corporate taxes 2,159 3,934 140 255
- Expenses not tax deductible 336 99 22 7
- On timing differences (15) 235 (1) 15
- Adjustment for prior years (1,381) (4) (90) -
- Rate differential/reversal of DTA 112 2 7 -
Total tax for year ended March 31 (2,507) 5,468 (163) 355
(d) Movement in Deferred tax
Year ended March 31,
2017 USD 000s
Year ended March 31,
2016USD 000s
Year ended March 31,
2017INR million
Year ended March 31,
2016INR million
Deferred Tax Asset
Balance as at April 1 44 373 3 24
Origination and timing differences;
- on consolidated taxable losses 1,773 - 115 -
- on timing difference on fixed assets 142 (329) 9 (21)
- on AFS losses 2,307 - 150 -
4,266 44 277 3
Deferred Tax Liability
Balance as at April 1 - - - -
Origination and timing differences;
- on AFS transitional adjustment (2,275 ) - (148) -
- on equity gains (144 ) - (9) -
(2,419) - (157) -
Net Deferred Tax as at March 31 1,847 44 120 3
(e) Deferred tax is composed of the tax impact of the following items:
Year ended March 31,
2017 USD 000s
Year ended March 31,
2016USD 000s
Year ended March 31,
2017INR million
Year ended March 31,
2016INR million
Effect of:
- On consolidated losses 1,773 - 115 -
- On timing difference on fixed assets 185 44 12 3
- On equity gains (144) - (9) -
- On AFS 33 - 2
Total 1,847 44 120 3

ICICI Bank UK PLCStrategic Report, Directors’ Report and Financial Statements
March 31, 2017United Kingdom
40
(f) Factors that may affect future tax charges
Reductions in the UK corporation tax rate from 21% to 20% (effective from April 1, 2015) were substantively enacted on July 2, 2013. Further reductions to 19% (effective from April 1, 2017) and to 17% (effective from April 1, 2020) were substantively enacted on October 26, 2015 and September 6, 2016 respectively. These reductions will reduce the company’s future current tax charge accordingly. The deferred tax asset of USD 1.8 million is expected to be recovered from the taxable profits in the foreseeable future. As per UK tax law, the unused trading losses could be carried forward indefinitely. As per the spring budget 2017, the carry forward of losses arising pre April 1, 2017 may be subject to the loss restriction rules and would therefore only be available for offset against 50% of profits (subject to an amount of £5m which can be relieved in full). Tax rate for the Germany branch was 27.4% for FY2017.
13 Emoluments of Directors
Year ended March 31,
2017 USD 000s
Year ended March 31,
2016USD 000s
Year ended March 31,
2017INR million
Year ended March 31,
2016INR million
Directors’ fees and gross emoluments 823 970 53 63
The gross emoluments1 of the highest paid director were USD 462,787 (INR 30,011,737) (2016: USD 611,999; INR 39,688,135) excluding share based payments. Post-employment benefits accruing for one director (2016: One) under a money purchase pension scheme amounted to USD 23,139 (INR 1,500,564) in the current year (2016: USD 25,658; INR 1,663,921). Stock options2 were granted to one director (2016: One). The number of stock options granted to the director during the year was 100,700 (2016: 460,000).
1 Gross emoluments include base salary and performance bonus2 Refer note 14 for the details of the stock option scheme.
14 Share-based payments
During the year, USD 1.8 million (INR 116.7 million) was charged to the profit and loss account in respect of equity-settled share-based payment transactions (2016: USD 1.4 million; INR 90.8 million). This expense, which was computed from the fair values of the share-based payment transactions when granted, arose under employee share awards made in accordance with the ICICI Bank Limited group’s reward structures.
Stock Option Scheme
In terms of an Employee Stock Option Scheme (ESOS), of the Parent Bank, options are granted to eligible employees and Directors of the Bank and its subsidiaries. As per the ESOS as amended from time to time, the maximum number of options granted to any employee/Director in a year is limited to 0.05% of the Parent Bank’s issued equity shares at the time of the grant, and the aggregate of all such options is limited to 10% of Parent Bank’s issued equity shares on the date of the grant. Until April 2013, options granted vest in a graded manner over a four year period, with 20%, 20%, 30% and 30% of the grants vesting in each year, commencing from the end of 12 months from the date of grant. Options granted from April 2014 onwards vest in a graded manner over a three-year period, with 30%, 30%, and 40% of the grants vesting in each year, commencing from the end of 12 months from the date of grant. During the year, the Parent Bank modified the terms of the scheme by amending the exercise period from ‘ten years from the date of grant or five years from the date of vesting whichever is later’ to ‘ten years from the date of vesting’. The option expires after the exercisable period is over as above.

ICICI Bank UK PLCStrategic Report, Directors’ Report and Financial Statements
March 31, 2017United Kingdom
41
15 Related party transaction
The Bank enters into transactions with other related parties in the ordinary course of business. During the year, the Bank has not entered into any transactions with other related parties. The Bank is exempt from disclosing other related party transactions as they are with the companies that are wholly owned within the Group. (see note 2 (d))
ICICI Lombard General Insurance Company Limited: 63.7% owned by parent company (FY2016-63.8%).
FY2017USD 000s
FY2016USD 000s
FY2017INR million
FY2016INR million
Purchase of Insurance policies 60 4
Outstanding balances - - - -
16 Financial Services Compensation Scheme
The Financial Services Compensation Scheme (‘FSCS’) has provided compensation to consumers following the collapse during 2008 of a number of deposit takers such as Bradford & Bingley plc, Heritable Bank plc, Kaupthing Singer & Friedlander Limited, Landsbanki ‘Icesave’, Dunfermline Building Society and London Scottish Bank plc. The protection of consumer deposits is currently funded through loans from the Bank of England and HM Treasury. The Bank could be liable to pay a proportion of the outstanding borrowings that the FSCS has borrowed from HM Treasury which is currently at GBP 202 million as per the FSCS Plan and Budget for 2017/2018. The Bank is also obligated to pay its share of forecast management expenses based on the Bank’s market share of deposits protected under the FSCS. This levy is called the specified deposit defaults (SDD) levy. As per the FSCS Plan and Budget for 2017/2018, FSCS expects to levy the deposit taking sector a total of GBP 378 million of indicative annual levy compared to a final levy of GBP 337 million for 2016/17. The Bank is obligated to pay its share of interest cost based on the Bank’s market share of deposits protected under the FSCS. The actual amount of levy will be billed to the Bank based on its share of deposits protected under the FSCS.
The Bank has recognized an expense of USD 1.1 million (INR 71 million) during FY2017 (FY2016: USD 1.6 million; INR 104 million), in respect of all statutory levies. This mainly includes the Bank’s share of the SDD levy management expense, including interest costs and principal and regular deposit protection charges. The Bank has accrued the SDD levy based on its estimated share of total market protected deposits. The Bank has adopted IFRIC 21 ‘Levies’, effective FY2014 for accounting of the FSCS liability as there is no equivalent guidance within FRS 102 and section 10 of FRS 102 (Accounting Policies) that allows for the use of alternative accounting framework, where this is the case.
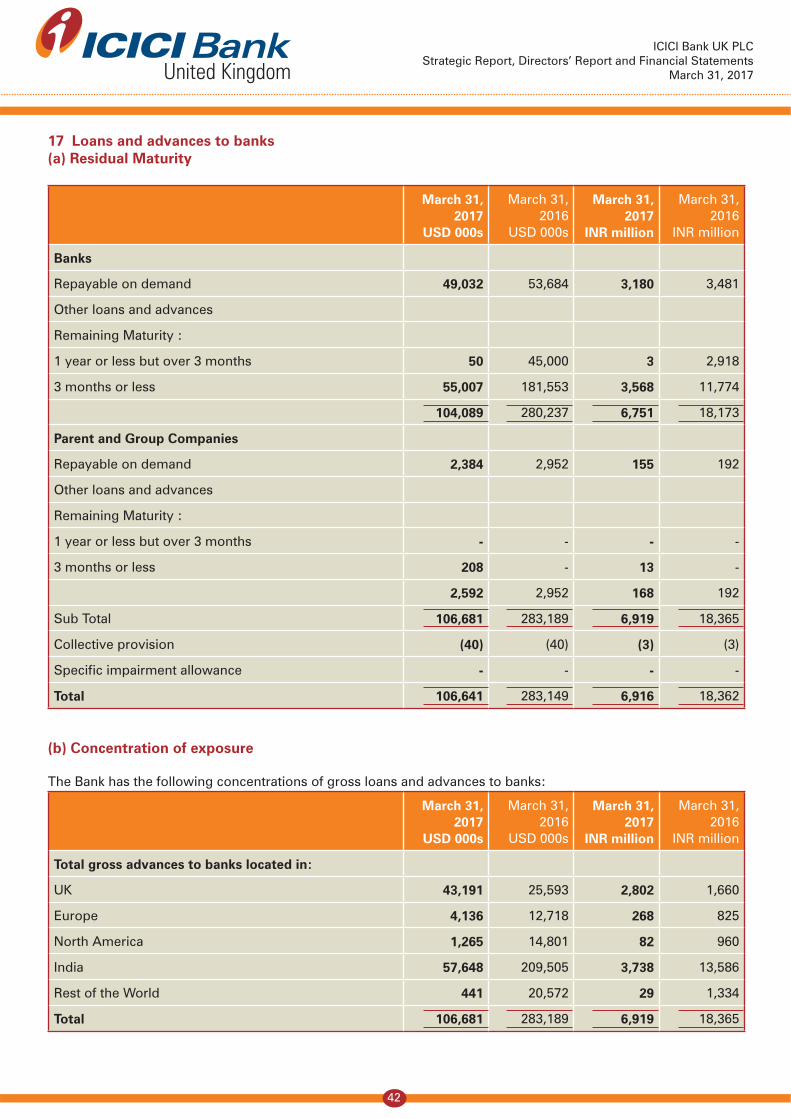
ICICI Bank UK PLCStrategic Report, Directors’ Report and Financial Statements
March 31, 2017United Kingdom
42
17 Loans and advances to banks(a) Residual Maturity
March 31, 2017
USD 000s
March 31, 2016
USD 000s
March 31, 2017
INR million
March 31, 2016
INR million
Banks
Repayable on demand 49,032 53,684 3,180 3,481
Other loans and advances
Remaining Maturity :
1 year or less but over 3 months 50 45,000 3 2,918
3 months or less 55,007 181,553 3,568 11,774
104,089 280,237 6,751 18,173
Parent and Group Companies
Repayable on demand 2,384 2,952 155 192
Other loans and advances
Remaining Maturity :
1 year or less but over 3 months - - - -
3 months or less 208 - 13 -
2,592 2,952 168 192
Sub Total 106,681 283,189 6,919 18,365
Collective provision (40) (40) (3) (3)
Specific impairment allowance - - - -
Total 106,641 283,149 6,916 18,362
(b) Concentration of exposure
The Bank has the following concentrations of gross loans and advances to banks:
March 31, 2017
USD 000s
March 31, 2016
USD 000s
March 31, 2017
INR million
March 31, 2016
INR million
Total gross advances to banks located in:
UK 43,191 25,593 2,802 1,660
Europe 4,136 12,718 268 825
North America 1,265 14,801 82 960
India 57,648 209,505 3,738 13,586
Rest of the World 441 20,572 29 1,334
Total 106,681 283,189 6,919 18,365

ICICI Bank UK PLCStrategic Report, Directors’ Report and Financial Statements
March 31, 2017United Kingdom
43
As at March 31, 2017, the Bank had no direct exposure to banks in Portugal, Italy, Ireland, Greece, Spain, Cyprus, Ukraine and Russia (2016: Nil).
Geographical concentration represents the country of risk exposure. Generally, the risk domicile of an exposure is identified as the country of residence of the borrower provided that the cash flows of the borrower and/or the value of the security adequately covers the loan exposure of the Bank.
18 Loans and advances to customers
(a) Residual Maturity
March 31, 2017
USD 000s
March 31, 2016
USD 000s
March 31, 2017
INR million
March 31, 2016
INR million
Repayable on demand or at short notice 1,216 10,653 78 691
Other loans and advances
Remaining Maturity :
Over 5 years 403,405 497,542 26,161 32,266
5 years or less but over 1 year 1,035,862 1,373,284 67,176 89,057
1 year or less but over 3 months 391,506 604,654 25,389 39,212
3 months or less 597,572 559,028 38,753 36,252
Sub total 2,429,561 3,045,161 157,557 197,478
Collective provision (10,993) (11,518) (713) (747)
Specific impairment allowance (86,436) (71,108) (5,605) (4,611)
Total 2,332,132 2,962,535 151,239 192,120
(b) Concentration of exposure
Geographical concentrations of loans and advances to customers
March 31, 2017
USD 000s
March 31, 2016
USD 000s
March 31, 2017
INR million
March 31, 2016
INR million
UK 733,286 766,863 47,554 49,731
Europe 451,370 475,893 29,271 30,862
North America 359,244 478,001 23,297 30,998
India 707,582 848,497 45,887 55,025
Rest of the World 178,079 475,907 11,548 30,862
Total 2,429,561 3,045,161 157,557 197,478
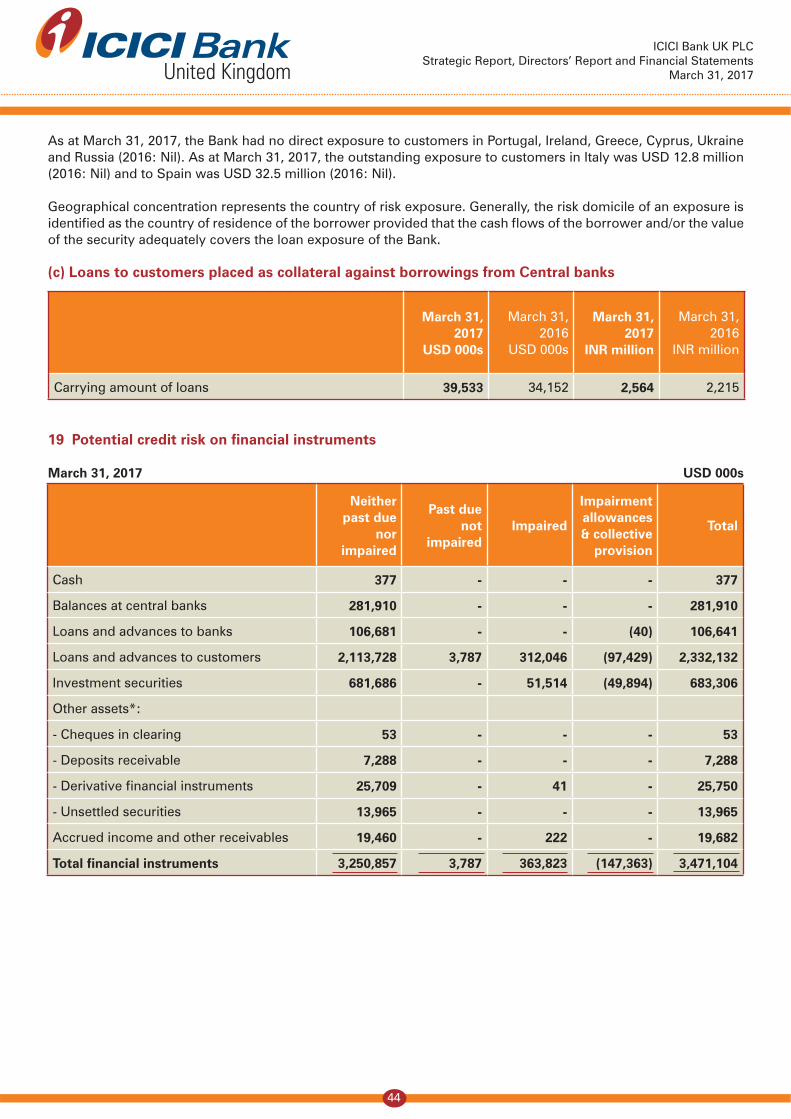
ICICI Bank UK PLCStrategic Report, Directors’ Report and Financial Statements
March 31, 2017United Kingdom
44
As at March 31, 2017, the Bank had no direct exposure to customers in Portugal, Ireland, Greece, Cyprus, Ukraine and Russia (2016: Nil). As at March 31, 2017, the outstanding exposure to customers in Italy was USD 12.8 million (2016: Nil) and to Spain was USD 32.5 million (2016: Nil).
Geographical concentration represents the country of risk exposure. Generally, the risk domicile of an exposure is identified as the country of residence of the borrower provided that the cash flows of the borrower and/or the value of the security adequately covers the loan exposure of the Bank.
(c) Loans to customers placed as collateral against borrowings from Central banks
March 31, 2017
USD 000s
March 31, 2016
USD 000s
March 31, 2017
INR million
March 31, 2016
INR million
Carrying amount of loans 39,533 34,152 2,564 2,215
19 Potential credit risk on financial instruments
March 31, 2017 USD 000s
Neither past due
nor impaired
Past due not
impairedImpaired
Impairment allowances & collective
provision
Total
Cash 377 - - - 377
Balances at central banks 281,910 - - - 281,910
Loans and advances to banks 106,681 - - (40) 106,641
Loans and advances to customers 2,113,728 3,787 312,046 (97,429) 2,332,132
Investment securities 681,686 - 51,514 (49,894) 683,306
Other assets*:
- Cheques in clearing 53 - - - 53
- Deposits receivable 7,288 - - - 7,288
- Derivative financial instruments 25,709 - 41 - 25,750
- Unsettled securities 13,965 - - - 13,965
Accrued income and other receivables 19,460 - 222 - 19,682
Total financial instruments 3,250,857 3,787 363,823 (147,363) 3,471,104
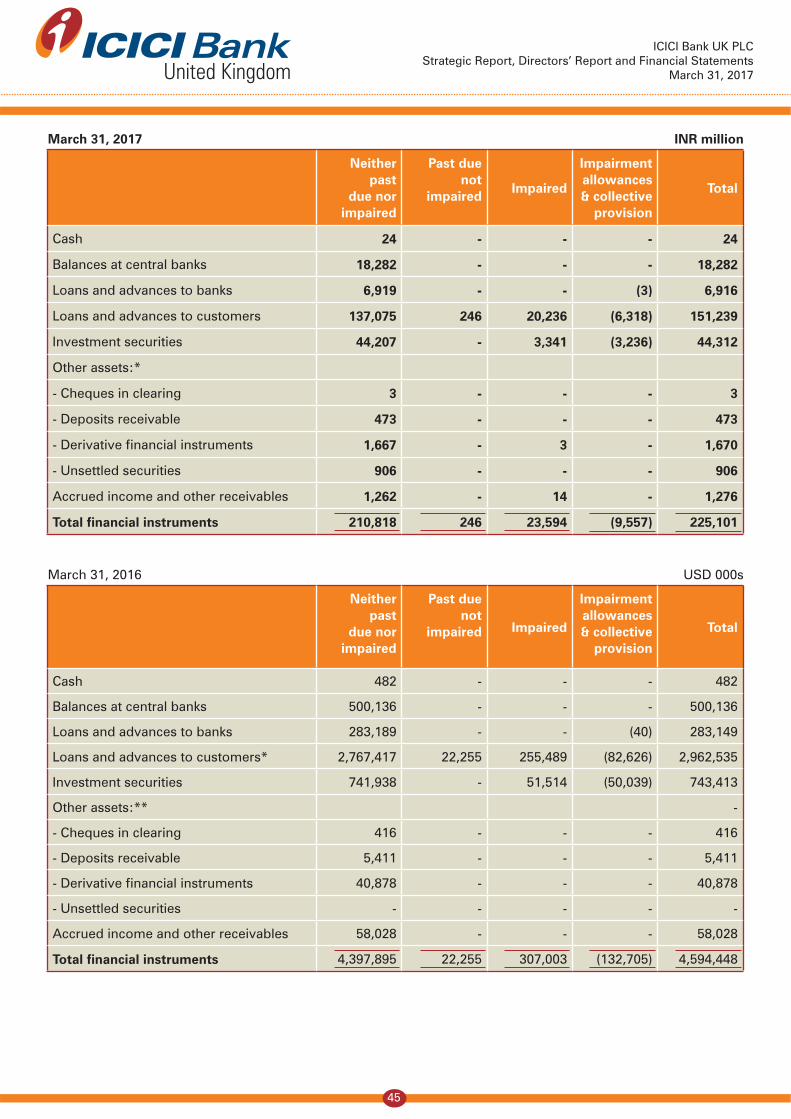
ICICI Bank UK PLCStrategic Report, Directors’ Report and Financial Statements
March 31, 2017United Kingdom
45
March 31, 2017 INR million
Neither past
due nor impaired
Past due not
impairedImpaired
Impairment allowances & collective
provision
Total
Cash 24 - - - 24
Balances at central banks 18,282 - - - 18,282
Loans and advances to banks 6,919 - - (3) 6,916
Loans and advances to customers 137,075 246 20,236 (6,318) 151,239
Investment securities 44,207 - 3,341 (3,236) 44,312
Other assets:*
- Cheques in clearing 3 - - - 3
- Deposits receivable 473 - - - 473
- Derivative financial instruments 1,667 - 3 - 1,670
- Unsettled securities 906 - - - 906
Accrued income and other receivables 1,262 - 14 - 1,276
Total financial instruments 210,818 246 23,594 (9,557) 225,101
March 31, 2016 USD 000s
Neither past
due nor impaired
Past due not
impaired Impaired
Impairment allowances & collective
provision
Total
Cash 482 - - - 482
Balances at central banks 500,136 - - - 500,136
Loans and advances to banks 283,189 - - (40) 283,149
Loans and advances to customers* 2,767,417 22,255 255,489 (82,626) 2,962,535
Investment securities 741,938 - 51,514 (50,039) 743,413
Other assets:** -
- Cheques in clearing 416 - - - 416
- Deposits receivable 5,411 - - - 5,411
- Derivative financial instruments 40,878 - - - 40,878
- Unsettled securities - - - - -
Accrued income and other receivables 58,028 - - - 58,028
Total financial instruments 4,397,895 22,255 307,003 (132,705) 4,594,448
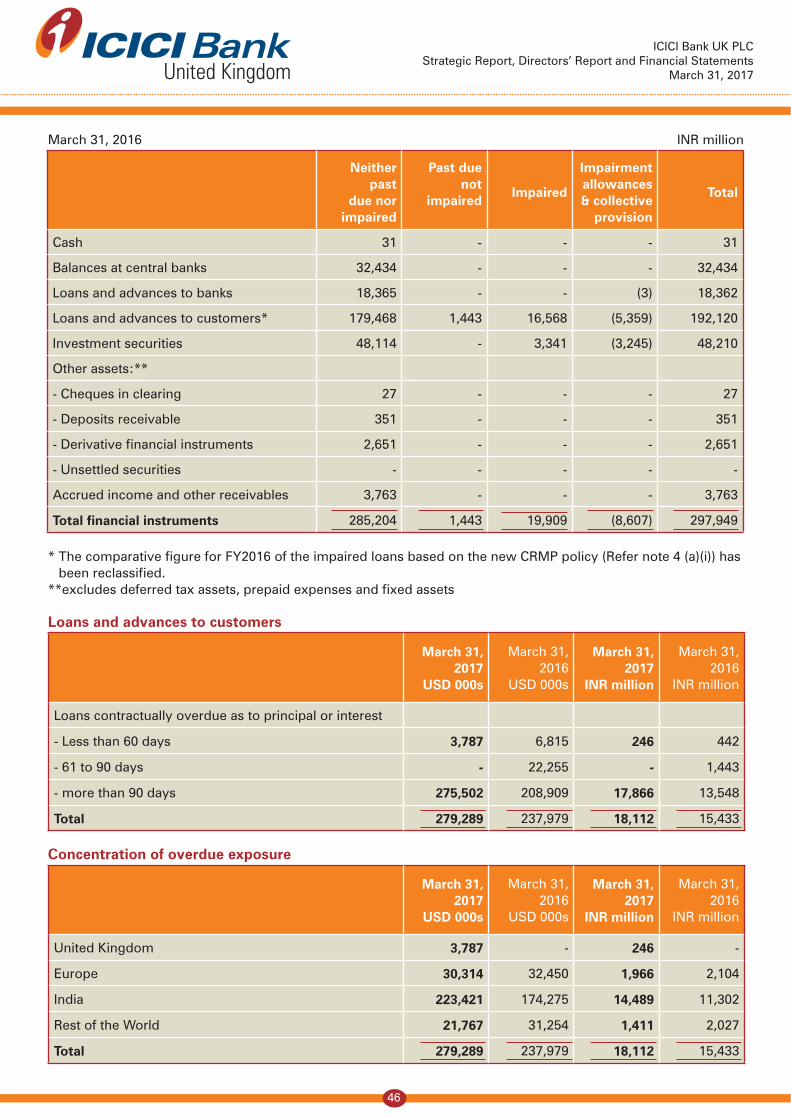
ICICI Bank UK PLCStrategic Report, Directors’ Report and Financial Statements
March 31, 2017United Kingdom
46
March 31, 2016 INR million
Neither past
due nor impaired
Past due not
impairedImpaired
Impairment allowances & collective
provision
Total
Cash 31 - - - 31
Balances at central banks 32,434 - - - 32,434
Loans and advances to banks 18,365 - - (3) 18,362
Loans and advances to customers* 179,468 1,443 16,568 (5,359) 192,120
Investment securities 48,114 - 3,341 (3,245) 48,210
Other assets:**
- Cheques in clearing 27 - - - 27
- Deposits receivable 351 - - - 351
- Derivative financial instruments 2,651 - - - 2,651
- Unsettled securities - - - - -
Accrued income and other receivables 3,763 - - - 3,763
Total financial instruments 285,204 1,443 19,909 (8,607) 297,949
* The comparative figure for FY2016 of the impaired loans based on the new CRMP policy (Refer note 4 (a)(i)) has been reclassified.
**excludes deferred tax assets, prepaid expenses and fixed assets
Loans and advances to customers
March 31, 2017
USD 000s
March 31, 2016
USD 000s
March 31, 2017
INR million
March 31, 2016
INR million
Loans contractually overdue as to principal or interest
- Less than 60 days 3,787 6,815 246 442
- 61 to 90 days - 22,255 - 1,443
- more than 90 days 275,502 208,909 17,866 13,548
Total 279,289 237,979 18,112 15,433
Concentration of overdue exposure
March 31, 2017
USD 000s
March 31, 2016
USD 000s
March 31, 2017
INR million
March 31, 2016
INR million
United Kingdom 3,787 - 246 -
Europe 30,314 32,450 1,966 2,104
India 223,421 174,275 14,489 11,302
Rest of the World 21,767 31,254 1,411 2,027
Total 279,289 237,979 18,112 15,433
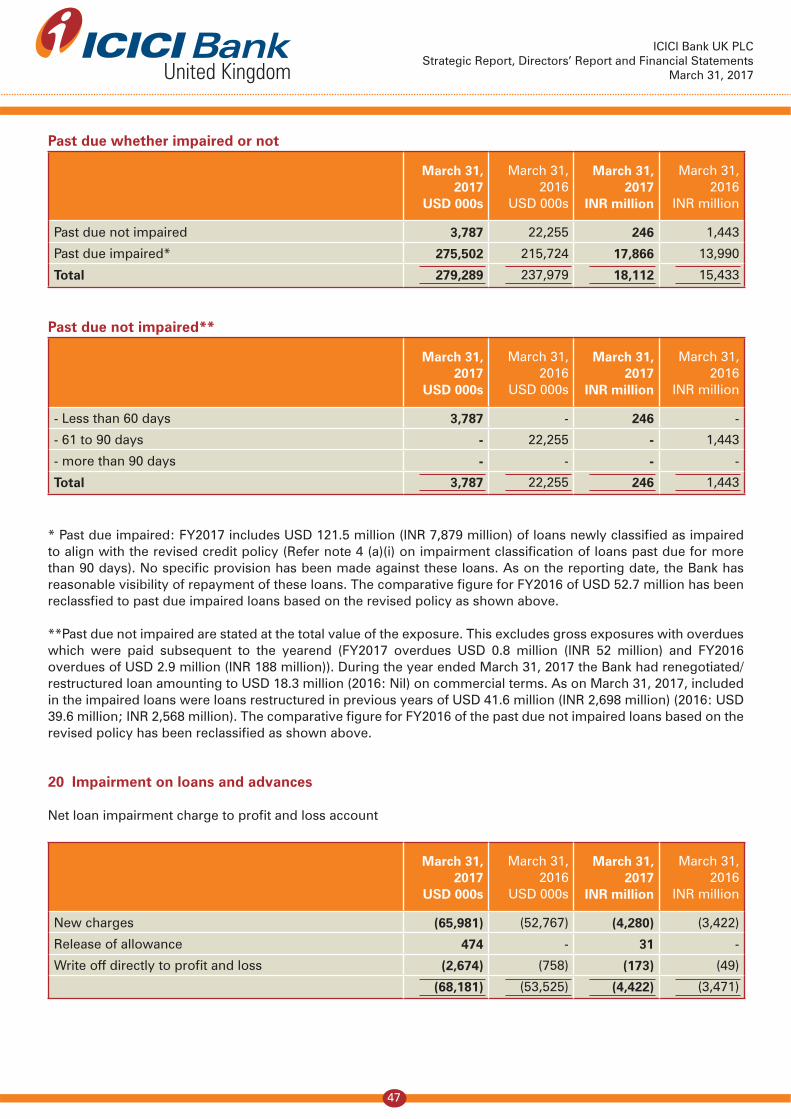
ICICI Bank UK PLCStrategic Report, Directors’ Report and Financial Statements
March 31, 2017United Kingdom
47
Past due whether impaired or not
March 31, 2017
USD 000s
March 31, 2016
USD 000s
March 31, 2017
INR million
March 31, 2016
INR million
Past due not impaired 3,787 22,255 246 1,443
Past due impaired* 275,502 215,724 17,866 13,990
Total 279,289 237,979 18,112 15,433
Past due not impaired**
March 31, 2017
USD 000s
March 31, 2016
USD 000s
March 31, 2017
INR million
March 31, 2016
INR million
- Less than 60 days 3,787 - 246 -
- 61 to 90 days - 22,255 - 1,443
- more than 90 days - - - -
Total 3,787 22,255 246 1,443
* Past due impaired: FY2017 includes USD 121.5 million (INR 7,879 million) of loans newly classified as impaired to align with the revised credit policy (Refer note 4 (a)(i) on impairment classification of loans past due for more than 90 days). No specific provision has been made against these loans. As on the reporting date, the Bank has reasonable visibility of repayment of these loans. The comparative figure for FY2016 of USD 52.7 million has been reclassfied to past due impaired loans based on the revised policy as shown above.
**Past due not impaired are stated at the total value of the exposure. This excludes gross exposures with overdues which were paid subsequent to the yearend (FY2017 overdues USD 0.8 million (INR 52 million) and FY2016 overdues of USD 2.9 million (INR 188 million)). During the year ended March 31, 2017 the Bank had renegotiated/restructured loan amounting to USD 18.3 million (2016: Nil) on commercial terms. As on March 31, 2017, included in the impaired loans were loans restructured in previous years of USD 41.6 million (INR 2,698 million) (2016: USD 39.6 million; INR 2,568 million). The comparative figure for FY2016 of the past due not impaired loans based on the revised policy has been reclassified as shown above.
20 Impairment on loans and advances
Net loan impairment charge to profit and loss account
March 31, 2017
USD 000s
March 31, 2016
USD 000s
March 31, 2017
INR million
March 31, 2016
INR million
New charges (65,981) (52,767) (4,280) (3,422)
Release of allowance 474 - 31 -
Write off directly to profit and loss (2,674) (758) (173) (49)
(68,181) (53,525) (4,422) (3,471)
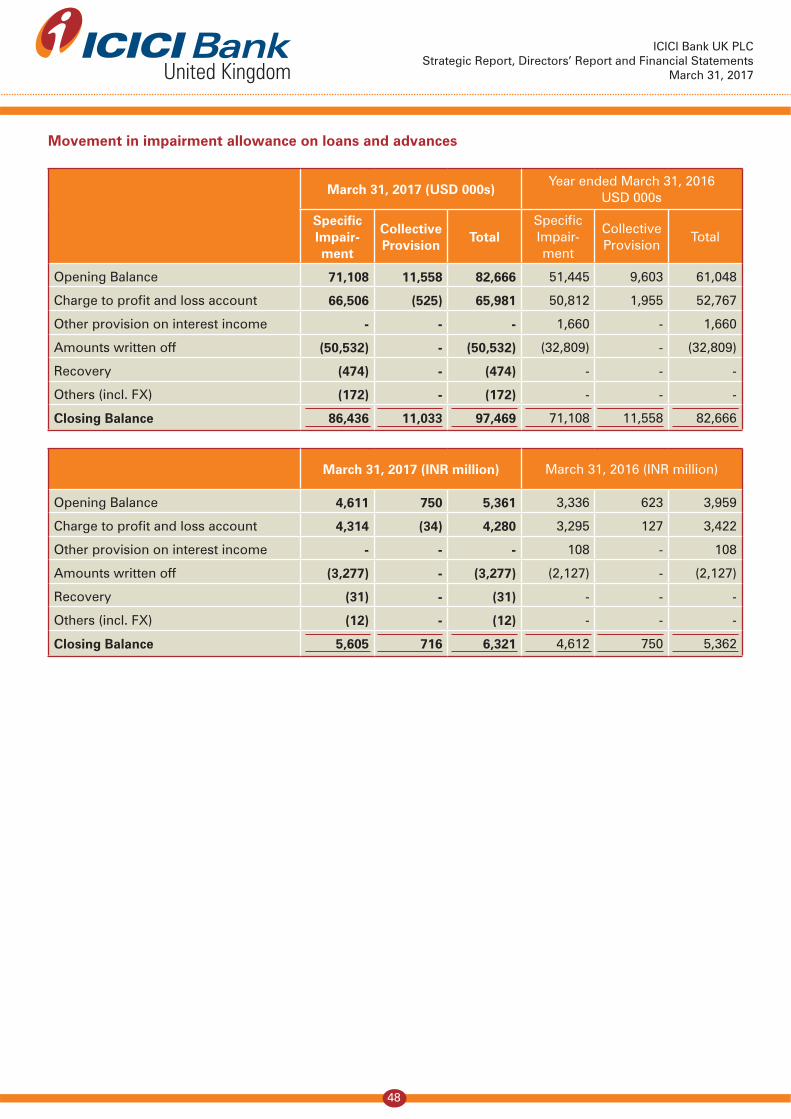
ICICI Bank UK PLCStrategic Report, Directors’ Report and Financial Statements
March 31, 2017United Kingdom
48
Movement in impairment allowance on loans and advances
March 31, 2017 (USD 000s)Year ended March 31, 2016
USD 000s
Specific Impair-ment
Collective Provision
TotalSpecific Impair-ment
Collective Provision
Total
Opening Balance 71,108 11,558 82,666 51,445 9,603 61,048
Charge to profit and loss account 66,506 (525) 65,981 50,812 1,955 52,767
Other provision on interest income - - - 1,660 - 1,660
Amounts written off (50,532) - (50,532) (32,809) - (32,809)
Recovery (474) - (474) - - -
Others (incl. FX) (172) - (172) - - -
Closing Balance 86,436 11,033 97,469 71,108 11,558 82,666
March 31, 2017 (INR million) March 31, 2016 (INR million)
Opening Balance 4,611 750 5,361 3,336 623 3,959
Charge to profit and loss account 4,314 (34) 4,280 3,295 127 3,422
Other provision on interest income - - - 108 - 108
Amounts written off (3,277) - (3,277) (2,127) - (2,127)
Recovery (31) - (31) - - -
Others (incl. FX) (12) - (12) - - -
Closing Balance 5,605 716 6,321 4,612 750 5,362

ICICI Bank UK PLCStrategic Report, Directors’ Report and Financial Statements
March 31, 2017United Kingdom
49
21 Investment securities
Classification of Investment securities
March 31, 2017
Market Value
USD 000s
March 31, 2016
Market Value
USD 000s
March 31, 2017
Market Value
INR million
March 31, 2016
Market Value
INR million
Analyzed by class:
Government Securities 74,127 129,352 4,807 8,388
Other securities
- Bonds 585,631 588,313 37,978 38,152
- Asset Backed Securities 17,990 18,530 1,167 1,202
- Equity 5,558 7,218 360 468
Total other securities 609,179 614,061 39,505 39,822
Total 683,306 743,413 44,312 48,210
March 31, 2017
Market Value
USD 000s
March 31, 2016
Market Value
USD 000s
March 31, 2017
Market Value
INR million
March 31, 2016
Market Value
INR million
Analysed by issuer:
Available for sale
Issued by public bodies:
Government Issued 56,663 110,618 3,674 7,173
Other Public sector securities 216,721 227,896 14,054 14,779
Issued by other issuers 146,743 130,084 9,516 8,436
Held to Maturity
Government Issued 17,464 18,734 1,133 1,215
Issued by other issuers 245,715 256,081 15,935 16,607
Financial instruments at fair value through profit and loss
Issued by other issuers - - - -
Total 683,306 743,413 44,312 48,210

ICICI Bank UK PLCStrategic Report, Directors’ Report and Financial Statements
March 31, 2017United Kingdom
50
March 31, 2017
Market Value
USD 000s
March 31, 2016
Market Value
USD 000s
March 31, 2017
Market Value
INR million
March 31, 2016
Market Value
INR million
Analysed by listing status:
Available for sale
Unlisted 10,376 116,360 673 7,546
Listed 409,751 352,238 26,572 22,842
Held to Maturity
Listed 263,179 274,815 17,067 17,822
Financial instruments at fair value through profit and loss
Unlisted - - - -
Total 683,306 743,413 44,312 48,210
Analyzed by maturity*:
Due within 1 year 82,185 276,260 5,330 17,915
Due 1 year and above 595,563 459,935 38,622 29,827
Total 677,748 736,195 43,952 47,742
*does not include USD 5.6 million (INR 363 million) of investment in equity (FY2016: USD 5.7 million, INR 370 million)
Investments placed as collateral against borrowings from Central banks
March 31, 2017
USD 000s
March 31, 2016
USD 000s
March 31, 2017
INR million
March 31, 2016
INR million
Carrying value of investments 12,523 - 812 -
Impairment on investment securities
During the year the Bank has not made impairment provisions on the investments. The Bank made impairment provision of USD 5.9 million (INR 391.0 million) in FY2016 through the profit and loss in respect of equity investments held as available for sale.
Investments held at fair value at March 31, 2017, by valuation method: USD 000s
Level 1 Level 2 Level 3 Total
Treasury Bills & Government securities 56,663 - - 56,663
Bonds 339,916 - - 339,916
Asset Backed Securities 17,990 - - 17,990
Equity 1,622 828 3,108 5,558
Total 416,191 828 3,108 420,127

ICICI Bank UK PLCStrategic Report, Directors’ Report and Financial Statements
March 31, 2017United Kingdom
51
INR million
Level 1 Level 2 Level 3 Total
Treasury Bills & Government securities 3,674 - - 3,674
Bonds 22,044 - - 22,044
Asset Backed Securities 1,167 - - 1,167
Equity 104 54 202 360
Total 26,989 54 202 27,245
Investments held at fair value at March 31, 2016, by valuation method:USD 000s
Level 1 Level 2 Level 3 Total
Treasury Bills & Government securities 110,617 - - 110,617
Bonds 332,232 - - 332,232
Asset Backed Securities 18,530 - - 18,530
Equity 1,476 - 5,743 7,219
Total 462,855 - 5,743 468,598
INR million
Level 1 Level 2 Level 3 Total
Treasury Bills & Government securities 7,173 - - 7,173
Bonds 21,545 - - 21,545
Asset Backed Securities 1,202 - - 1,202
Equity 96 - 372 468
Total 30,016 - 372 30,388
Valuation Hierarchy
The valuation hierarchy is set out below:
Level 1: Investments valued using unadjusted quoted prices in active markets.
Level 2: Investments valued using valuation techniques based on observable market data for instruments where markets are considered less than active. Instruments in this category are valued using:
(a) Quoted prices for similar assets, or identical assets in markets which are considered to be less than active; or
(b) Valuation techniques where all the inputs that have a significant effect on the valuation are directly or indirectly based on observable market data.
Level 3: Investments valued using valuation model based on significant non market observable inputs.
Investments placed as collateral against liabilities/borrowings
Under Repurchase agreements the Bank has placed certain Bonds, ABSs & FCCBs issued by financial institutions & corporates as collateral against liabilities/ borrowings (refer Note 30).

ICICI Bank UK PLCStrategic Report, Directors’ Report and Financial Statements
March 31, 2017United Kingdom
52
22 Reclassification of Financial Assets
In October 2008, the Accounting Standard Board’s issued amendments to FRS 26 ‘Financial Instruments: Recognition and Measurement’ and FRS 29 ‘Financial Instruments: Disclosures’ (FRS 26 and FRS 29 has now been superseded by FRS 102) issued which permitted an entity to reclassify certain financial assets out of the held for trading category. The amendment also permitted an entity to transfer from the available for sale category to the loans and receivable category in certain circumstances. Under FRS 102, the Bank chose to continue following IAS 39 for financials assets classification and measurement and disclosure as per Section 11 and 12 and 34 of FRS 102. During the year the Bank did not re-classify any asset, FY2016 included transfer of certain asset backed securities of USD 32.4 million (INR 2,101 million) from the available for sale category to the loans and receivable category.
23 Fixed assets
LeaseholdImprovements
USD 000s
Tangible Fixed Assets
USD 000s
IntangibleFixed Assets
USD 000s
Total
USD 000s
Cost:
At April 1, 2016 11,289 4,770 3,734 19,793
Additions 77 145 184 406
Disposal (2,084) (265) (99) (2,448)
At March 31, 2017 9,282 4,650 3,819 17,751
Accumulated depreciation:
At April 1, 2016 7,608 4,585 3,416 15,609
Charge for the year 636 89 142 867
Disposal (1,854) (258) (82) (2,194)
At March 31, 2017 6,390 4,416 3,476 14,282
Net book value:
At March 31, 2017 2,892 234 343 3,469
At April 1, 2016 3,681 185 318 4,184
LeaseholdImprovements
INR million
Tangible Fixed Assets
INR million
IntangibleFixed Assets
INR million
Total
INR million
Cost:
At April 1, 2016 732 309 242 1,284
Additions 5 9 12 26
Disposal (135) (17) (6) (159)
At March 31, 2017 602 301 248 1,151
Accumulated depreciation:
At April 1, 2016 493 297 222 1,012
Charge for the year 41 6 9 56
Disposal (120) (17) (5) (142)
At March 31, 2017 414 286 226 926
Net book value:
At March 31, 2017 188 15 22 225
At April 1, 2016 239 12 21 272
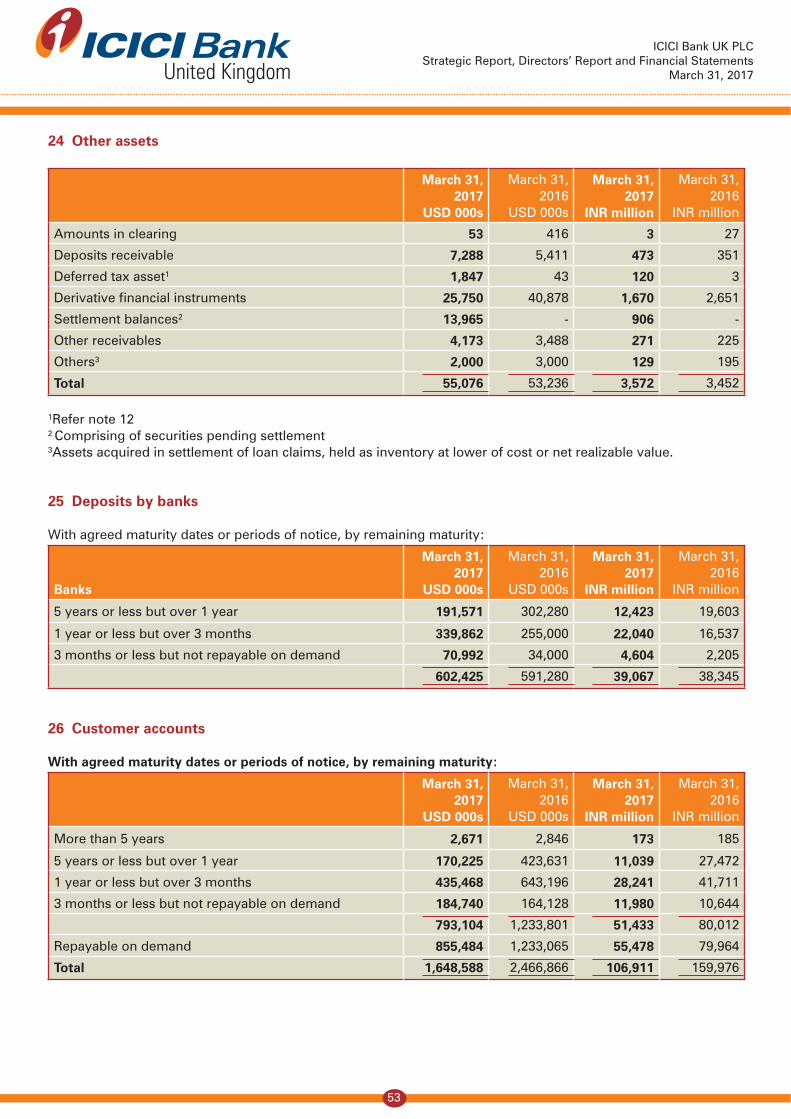
ICICI Bank UK PLCStrategic Report, Directors’ Report and Financial Statements
March 31, 2017United Kingdom
53
24 Other assets
March 31, 2017
USD 000s
March 31, 2016
USD 000s
March 31, 2017
INR million
March 31, 2016
INR million
Amounts in clearing 53 416 3 27
Deposits receivable 7,288 5,411 473 351
Deferred tax asset1 1,847 43 120 3
Derivative financial instruments 25,750 40,878 1,670 2,651
Settlement balances2 13,965 - 906 -
Other receivables 4,173 3,488 271 225
Others3 2,000 3,000 129 195
Total 55,076 53,236 3,572 3,452
1Refer note 122 Comprising of securities pending settlement3Assets acquired in settlement of loan claims, held as inventory at lower of cost or net realizable value.
25 Deposits by banks
With agreed maturity dates or periods of notice, by remaining maturity:
Banks
March 31, 2017
USD 000s
March 31, 2016
USD 000s
March 31, 2017
INR million
March 31, 2016
INR million
5 years or less but over 1 year 191,571 302,280 12,423 19,603
1 year or less but over 3 months 339,862 255,000 22,040 16,537
3 months or less but not repayable on demand 70,992 34,000 4,604 2,205
602,425 591,280 39,067 38,345 26 Customer accounts
With agreed maturity dates or periods of notice, by remaining maturity:
March 31, 2017
USD 000s
March 31, 2016
USD 000s
March 31, 2017
INR million
March 31, 2016
INR million
More than 5 years 2,671 2,846 173 185
5 years or less but over 1 year 170,225 423,631 11,039 27,472
1 year or less but over 3 months 435,468 643,196 28,241 41,711
3 months or less but not repayable on demand 184,740 164,128 11,980 10,644
793,104 1,233,801 51,433 80,012
Repayable on demand 855,484 1,233,065 55,478 79,964
Total 1,648,588 2,466,866 106,911 159,976

ICICI Bank UK PLCStrategic Report, Directors’ Report and Financial Statements
March 31, 2017United Kingdom
54
27 Bonds and medium term notes
Bonds issued
March 31, 2017
USD 000s
March 31, 2016
USD 000s
March 31, 2017
INR million
March 31, 2016
INR million
Residual Maturity
5 year or less but over 1 year 170,000 112,787 11,024 7,314
1 year or less but over 3 months 174,364 291,929 11,308 18,932
3 months or less - 106,909 - 6,933
344,364 511,625 22,332 33,179
Less: Bond issue expenses (167) (172) (11) (11)
Total bonds and medium term notes 344,197 511,453 22,321 33,168
Details of various bonds and notes under the medium term notes programmes issued by the Bank at March 31, 2017 are as follows:
Nature of Issue: Senior unsecured bonds
Date of IssueInterest
frequencyInterest
RateMaturity
USD 000s
INR million
21-Oct-14 Semi-annual 1.03% Bullet repayment in October 2017 8,973 582
07-May-15 Quarterly 2.23% Bullet repayment in May 2018 10,000 649
10-Jun-15 Quarterly 2.31% Bullet repayment in June 2018 10,000 649
14-Aug-15 Quarterly 1.84% Bullet repayment in August 2017 39,888 2,587
29-Sep-15 Quarterly 2.32% Bullet repayment in September 2018 5,000 324
29-Sep-15 Quarterly 2.32% Bullet repayment in September 2018 5,000 324
29-Sep-15 Semi-annual 2.50% Bullet repayment in September 2017 14,310 929
19-Nov-15 Quarterly 2.10% Bullet repayment in November 2018 5,000 324
22-Jan-16 Semi-annual 2.35% Bullet repayment in January 2018 13,593 882
09-Sep-16 Semi-annual 1.70% Bullet repayment in March 2018 9,000 584
19-Sep-16 Quarterly 1.83% Bullet repayment in March 2018 40,000 2,594
19-Sep-16 Quarterly 2.00% Bullet repayment in September 2018 20,000 1,296
07-Feb-17 Annual 2.00% Bullet repayment in February 2018 36,000 2,335
17-Feb-17 Quarterly 1.99% Bullet repayment in February 2019 40,000 2,594
15-Mar-17 Annual 2.05% Bullet repayment in March 2018 12,600 817
22-Mar-17 Quarterly 2.21% Bullet repayment in March 2020 50,000 3,242
30-Mar-17 Quarterly 2.05% Bullet repayment in March 2019 25,000 1,620
Total 344,364 22,332
Less: Bond issue expenses (167) (11)
Total bonds and medium term notes 344,197 22,321

ICICI Bank UK PLCStrategic Report, Directors’ Report and Financial Statements
March 31, 2017United Kingdom
55
28 Subordinated debt liabilities
Sub-ordinated debt*
March 31, 2017
USD 000s
March 31, 2016
USD 000s
March 31, 2017
INR million
March 31, 2016
INR million
Residual Maturity
Over 5 years - - - -
5 year or less but over 1 year* 150,000 150,000 9,728 9,728
1 year or less but over 3 months* - 85,000 - 5,512
3 months or less* 26,349 1,709
176,349 235,000 11,437 15,240
Less: Bond issue expenses (165) (335) (11) (22)
Less: Adjustments to carrying amount for change in the value of hedge which is ineffective
(35) (423) (3) (27)
176,149 234,242 11,423 15,191
* Listed with Singapore stock exchange. Details of the medium term notes programmes issued by the Bank at March 31, 2017 are as follows:
Date of Issue
Nature of IssueInterest
RateInterest
frequencyMaturity
USD 000s
INR million
12-Dec-06Senior unsecured me-dium term notes
6.38% Semi-annualCallable by issuer at par in 2017; no maturity
26,349 1,709
23-Nov-10Senior unsecured me-dium term notes
7.00% Semi-annualBullet payment in Novem-ber 2020
150,000 9,728
Total 176,349 11,437
Less: Bond issue expenses (165) (11)
Less: Adjustments to carrying amount for change in the value of hedge which is ineffective (35) (3)
176,149 11,423
For all the subordinated notes, the notes and coupons are direct, unsecured and subordinated obligations of the Bank, and rank pari passu without any preference among themselves.During FY2017, the Bank bought back and extinguished subordinated notes for USD 58.7 million out of total outstanding of USD 85.0 million.
29 Other liabilities
March 31, 2017
USD 000s
March 31, 2016
USD 000s
March 31, 2017
INR million
March 31, 2016
INR million
Amounts in clearing 4,833 1,158 313 75
Corporation tax payable - 2,279 - 148
Other creditors 5,745 4,571 373 296
Derivative financial instruments 15,719 57,355 1,019 3,719
Settlement balances - 10,712 - 695
Total 26,297 76,075 1,705 4,933

ICICI Bank UK PLCStrategic Report, Directors’ Report and Financial Statements
March 31, 2017United Kingdom
56
30 Repurchase agreements
March 31, 2017USD 000s
March 31, 2016USD 000s
Carrying amount of liabilities
Carrying amount of collateral assets
Carrying amount of liabilities
Carrying amount ofcollateral assets
Repurchase agreements 129,784 165,042 153,383 185,248
March 31, 2017INR million
March 31, 2016INR million
Carrying amount of liabilities
Carrying amount of collateral assets
Carrying amount of liabilities
Carrying amount ofcollateral assets
Repurchase agreements 8,416 10,703 9,947 12,013 The repurchase transactions enable the Bank to raise funds using its portfolio of government bonds or corporate/financial institution bonds and Asset Backed Securities (ABS) as collateral. These bonds and ABS are issued by corporates & financial institutions with carrying value of USD 165 million (INR 10,703 million) (2016: USD 185 million; INR 12,013 million). These have been pledged as collateral under repurchase agreements entered by the Bank. These form part of the AFS book & Loans and Receivable book (refer Note 21 and Note 41). As per the contract, the Bank agrees to repay the principal along with the interest at maturity and receive the collateral from the counter party.
With agreed maturity dates or periods of notice, by remaining maturity:
March 31, 2017
USD 000s
March 31, 2016
USD 000s
March 31, 2017
INR million
March 31, 2016
INR million
5 years or less but over 1 year 90,018 52,980 5,838 3,436
1 year or less but over 3 months - 56,189 - 3,644
3 months or less 39,766 44,214 2,578 2,867
Total 129,784 153,383 8,416 9,947
31 Called up share capital
At March 31, 2017 the Issued share capital of ICICI Bank UK PLC was:
March 31, 2017
USD 000s
March 31, 2016
USD 000s
March 31, 2017
INR million
March 31, 2016
INR million
420 million ordinary shares of USD 1 each 420,000 420,000 27,237 27,237
50,002 ordinary shares of £1 each 95 95 6 6
Total Share Capital 420,095 420,095 27,243 27,243

ICICI Bank UK PLCStrategic Report, Directors’ Report and Financial Statements
March 31, 2017United Kingdom
57
There is no movement in number of shares during the year. All the shares are allotted and fully paid and the holders of ordinary shares are entitled to receive dividends as declared from time to time and are entitled to one vote per share at meetings of the Bank. There are no restrictions on the distribution of dividends and the repayment of capital.
32 Employee benefits
During the year, the Bank made a contribution of USD 456,597 (INR 29,610,315) (2016: USD 515,360; INR 33,421,096) to the pension scheme. Out of this amount, USD 36,830 (INR 2,388,426) was accrued at the yearend (2016: USD 38,771; INR 2,514,299).
33 Contingent liabilities and commitments (Off Balance Sheet)
As a part of banking activities, the Bank issued bank guarantees to support business requirements of customers. Guarantees represent irrevocable assurances that the Bank will pay in the event a customer fails to fulfil its financial or performance obligations. The credit risks associated with these guarantees are similar to those relating to other types of unfunded facilities. The Bank enters into guarantee arrangements after conducting appropriate due diligence on the customers. Upon default by a customer under the terms of the guarantee, the beneficiary may exercise its rights under the guarantees, and the Bank is obligated to honour payments to the beneficiaries.
The Bank extends financing to its customers by loan facilities, credit lines and other commitments to lend. Depending upon customer’s requirement and subject to its ability to maintain specific credit standards, the unexpired undrawn commitment can be withdrawn by customers. The interest rate on a significant portion of these commitments is dependent on the lending rates prevailing on the date of the loan disbursement. Further, the commitments have fixed expiration dates and are contingent upon the customer’s ability to maintain specific credit standards.
(a) Guarantees and other commitments:
March 31, 2017
USD 000s
March 31, 2016
USD 000s
March 31, 2017
INR million
March 31, 2016
INR million
Guarantees 277,280 325,614 17,982 21,116
Other commitments
Undrawn formal standby facilities, credit lines and other commitments to lend maturing in:
Less than one year 2,781 20,322 180 1,318
More than one year - - - -
Total guarantees and commitments 280,061 345,936 18,162 22,434
(b) Significant concentrations of contingent liabilities and commitmentsApproximately 67% (2016: 67%) of the total contingent liabilities and commitments relate to counterparties in India and the majority of the remaining balance relates to Europe.
(c) Foreign exchange contractsIn addition to the commitments disclosed above, there are outstanding foreign exchange contracts of USD 890 million (INR 57,717 million) (2016: USD 1,187 million; INR 76,977 million).
34 Litigation
In the ordinary course of business, the Bank pursues litigation in order to recover any overdue exposures. There are no material litigations against the Bank.

ICICI Bank UK PLCStrategic Report, Directors’ Report and Financial Statements
March 31, 2017United Kingdom
58
35 Operating lease commitments
As at March 31, 2017, the Bank has the following non cancellable operating lease commitments:
Land and Buildings
March 31, 2017
USD 000s
March 31, 2016
USD 000s
March 31, 2017
INR million
March 31, 2016
INR million
Within 1 year 1,743 2,601 113 169
Between 1 and 5 years 5,857 7,516 380 487
More than 5 years 895 2,522 58 164
8,495 12,639 551 820
The Bank had sub-let a portion of its premises in corporate office , the sub-lease agreement provides for fixed lease rentals for the entire period. The lease will expire after more than 5 years. Following is the future minimum lease payments receivable under non cancellable operating lease:
Land and Buildings
March 31, 2017
USD 000s
March 31, 2016
USD 000s
March 31, 2017
INR million
March 31, 2016
INR million
Within 1 year 299 164 19 11
Between 1 and 5 years 949 1089 62 71
More than 5 years 131 350 8 22
1,379 1,603 89 104
36 Categories and classes of Financial Instruments
The carrying amounts of the financial assets and liabilities include:
March 31, 2017
USD 000s
March 31, 2016
USD 000s
March 31, 2017
INR million
March 31, 2016
INR million
Financial assets measured at fair value through profit or loss
25,750 40,878 1,670 2,651
Financial assets under Available for Sale category 420,127 468,598 27,245 30,389
Financial assets under Loans and receivable category 2,762,048 3,810,157 179,119 247,087
Financial assets under Held to maturity category 263,179 274,815 17,067 17,821
Total financial assets 3,471,104 4,594,448 225,101 297,948
Liabilities measured at fair value through profit or loss 15,719 57,355 1,019 3,719
Liabilities measured at amortised cost 2,930,817 4,000,375 190,063 259,424
Total financial liabilities 2,946,536 4,057,730 191,082 263,143
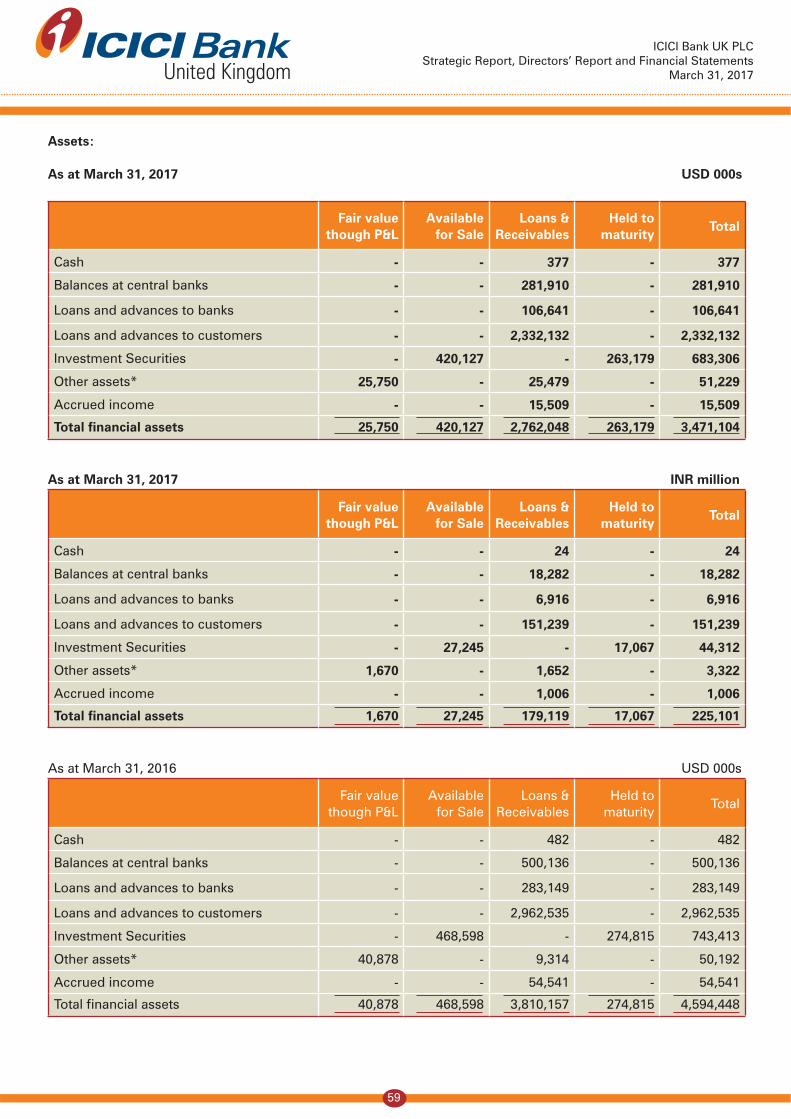
ICICI Bank UK PLCStrategic Report, Directors’ Report and Financial Statements
March 31, 2017United Kingdom
59
Assets: As at March 31, 2017 USD 000s
Fair value though P&L
Available for Sale
Loans & Receivables
Held to maturity
Total
Cash - - 377 - 377
Balances at central banks - - 281,910 - 281,910
Loans and advances to banks - - 106,641 - 106,641
Loans and advances to customers - - 2,332,132 - 2,332,132
Investment Securities - 420,127 - 263,179 683,306
Other assets* 25,750 - 25,479 - 51,229
Accrued income - - 15,509 - 15,509
Total financial assets 25,750 420,127 2,762,048 263,179 3,471,104
As at March 31, 2017 INR million
Fair value though P&L
Available for Sale
Loans & Receivables
Held to maturity
Total
Cash - - 24 - 24
Balances at central banks - - 18,282 - 18,282
Loans and advances to banks - - 6,916 - 6,916
Loans and advances to customers - - 151,239 - 151,239
Investment Securities - 27,245 - 17,067 44,312
Other assets* 1,670 - 1,652 - 3,322
Accrued income - - 1,006 - 1,006
Total financial assets 1,670 27,245 179,119 17,067 225,101
As at March 31, 2016 USD 000s
Fair value though P&L
Available for Sale
Loans & Receivables
Held to maturity
Total
Cash - - 482 - 482
Balances at central banks - - 500,136 - 500,136
Loans and advances to banks - - 283,149 - 283,149
Loans and advances to customers - - 2,962,535 - 2,962,535
Investment Securities - 468,598 - 274,815 743,413
Other assets* 40,878 - 9,314 - 50,192
Accrued income - - 54,541 - 54,541
Total financial assets 40,878 468,598 3,810,157 274,815 4,594,448

ICICI Bank UK PLCStrategic Report, Directors’ Report and Financial Statements
March 31, 2017United Kingdom
60
As at March 31, 2016 INR million
Fair value though P&L
Available for Sale
Loans & Receivables
Held to maturity
Total
Cash - - 31 - 31
Balances at central banks - - 32,434 - 32,434
Loans and advances to banks - - 18,362 - 18,362
Loans and advances to customers - - 192,120 - 192,120
Investment Securities - 30,389 - 17,821 48,210
Other assets* 2,651 - 603 - 3,254
Accrued income - - 3,537 - 3,537
Total financial assets 2,651 30,389 247,087 17,821 297,948
* excludes deferred tax assets, prepaid expenses, fixed assets and assets acquired in settlement of loan claims, held as inventory at lower of cost or net realizable value
Liabilities:
As at March 31, 2017 USD 000s
Fair value though P&L
Non trading liability Total
Deposits by banks - 602,425 602,425
Customer accounts - 1,648,588 1,648,588
Bonds and Medium term notes - 344,197 344,197
Subordinated debts 176,149 176,149
Other liabilities 15,719 10,578 26,297
Accruals and deferred income - 19,096 19,096
Repurchase agreements - 129,784 129,784
Total financial liabilities 15,719 2,930,817 2,946,536
As at March 31, 2017 INR million
Fair value though P&L
Non trading liability Total
Deposits by banks - 39,067 39,067
Customer accounts - 106,911 106,911
Bonds and Medium term notes - 22,321 22,321
Subordinated debts - 11,423 11,423
Other liabilities 1,019 686 1,705
Accruals and deferred income - 1,239 1,239
Repurchase agreements - 8,416 8,416
Total financial liabilities 1,019 190,063 191,082

ICICI Bank UK PLCStrategic Report, Directors’ Report and Financial Statements
March 31, 2017United Kingdom
61
As at March 31, 2016 USD 000s
Fair value though P&L
Non trading liability Total
Deposits by banks - 591,280 591,280
Customer accounts - 2,466,866 2,466,866
Bonds and Medium term notes - 511,453 511,453
Subordinated debts 234,242 234,242
Other liabilities 57,355 18,720 76,075
Accruals and deferred income - 24,431 24,431
Repurchase agreements - 153,383 153,383
Total financial liabilities 57,355 4,000,375 4,057,730
As at March 31, 2016 INR million
Fair value though P&L
Non trading liability Total
Deposits by banks - 38,345 38,345
Customer accounts - 159,976 159,976
Bonds and Medium term notes - 33,168 33,168
Subordinated debts 15,191 15,191
Other liabilities 3,719 1,213 4,932
Accruals and deferred income - 1,584 1,584
Repurchase agreements - 9,947 9,947
Total financial liabilities 3,719 259,424 263,143
Refer to Note 3 for descriptions of categories of assets and liabilities
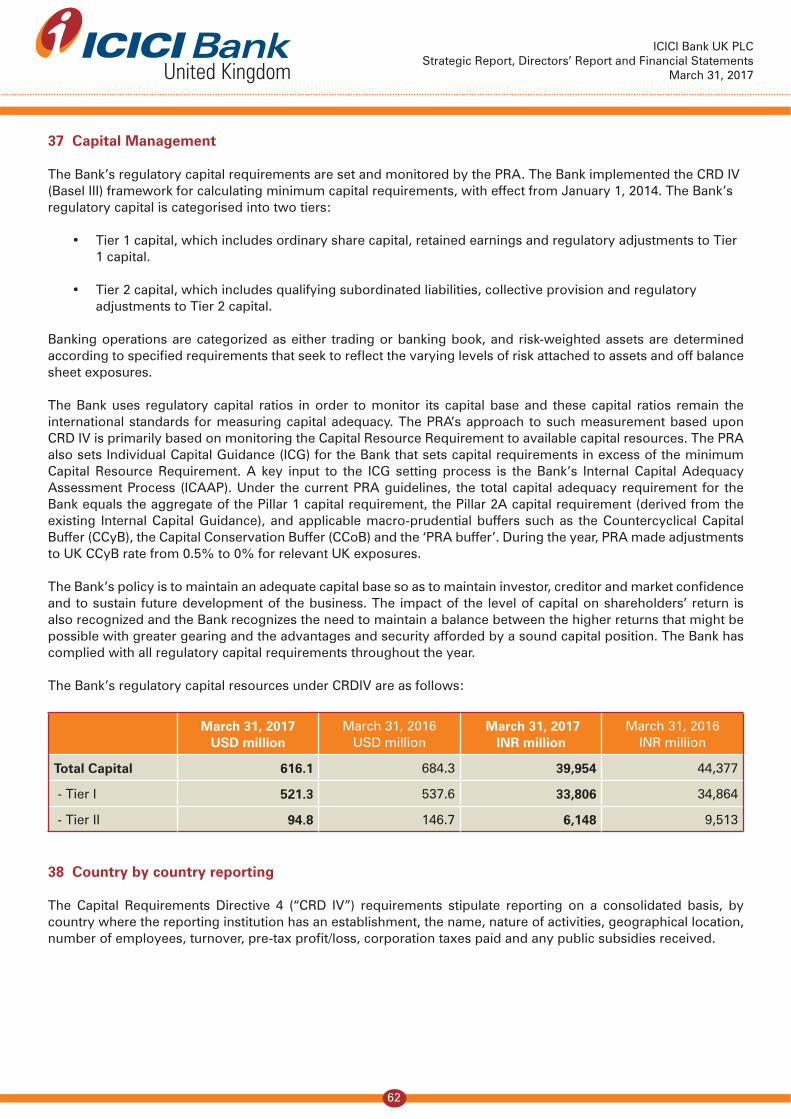
ICICI Bank UK PLCStrategic Report, Directors’ Report and Financial Statements
March 31, 2017United Kingdom
62
37 Capital Management
The Bank’s regulatory capital requirements are set and monitored by the PRA. The Bank implemented the CRD IV (Basel III) framework for calculating minimum capital requirements, with effect from January 1, 2014. The Bank’s regulatory capital is categorised into two tiers:
• Tier 1 capital, which includes ordinary share capital, retained earnings and regulatory adjustments to Tier 1 capital.
• Tier 2 capital, which includes qualifying subordinated liabilities, collective provision and regulatory adjustments to Tier 2 capital.
Banking operations are categorized as either trading or banking book, and risk-weighted assets are determined according to specified requirements that seek to reflect the varying levels of risk attached to assets and off balance sheet exposures.
The Bank uses regulatory capital ratios in order to monitor its capital base and these capital ratios remain the international standards for measuring capital adequacy. The PRA’s approach to such measurement based upon CRD IV is primarily based on monitoring the Capital Resource Requirement to available capital resources. The PRA also sets Individual Capital Guidance (ICG) for the Bank that sets capital requirements in excess of the minimum Capital Resource Requirement. A key input to the ICG setting process is the Bank’s Internal Capital Adequacy Assessment Process (ICAAP). Under the current PRA guidelines, the total capital adequacy requirement for the Bank equals the aggregate of the Pillar 1 capital requirement, the Pillar 2A capital requirement (derived from the existing Internal Capital Guidance), and applicable macro-prudential buffers such as the Countercyclical Capital Buffer (CCyB), the Capital Conservation Buffer (CCoB) and the ‘PRA buffer’. During the year, PRA made adjustments to UK CCyB rate from 0.5% to 0% for relevant UK exposures.
The Bank’s policy is to maintain an adequate capital base so as to maintain investor, creditor and market confidence and to sustain future development of the business. The impact of the level of capital on shareholders’ return is also recognized and the Bank recognizes the need to maintain a balance between the higher returns that might be possible with greater gearing and the advantages and security afforded by a sound capital position. The Bank has complied with all regulatory capital requirements throughout the year.
The Bank’s regulatory capital resources under CRDIV are as follows:
March 31, 2017USD million
March 31, 2016USD million
March 31, 2017INR million
March 31, 2016INR million
Total Capital 616.1 684.3 39,954 44,377
- Tier I 521.3 537.6 33,806 34,864
- Tier II 94.8 146.7 6,148 9,513
38 Country by country reporting
The Capital Requirements Directive 4 (“CRD IV”) requirements stipulate reporting on a consolidated basis, by country where the reporting institution has an establishment, the name, nature of activities, geographical location, number of employees, turnover, pre-tax profit/loss, corporation taxes paid and any public subsidies received.

ICICI Bank UK PLCStrategic Report, Directors’ Report and Financial Statements
March 31, 2017United Kingdom
63
The Bank has two branches in the EU which are outside UK, in Antwerp (Belgium) and Eschborn (Germany). The details of the business activities are provided in the Business Review section of the Strategic Report. Details as on March 31, 2017 are provided below:
UK Belgium Germany
Number of employees 175 3 14
USD million INR million USD million INR million USD million INR million
Turnover1,2 66.2 4,291 3.2 210 14.1 915
Pre-tax profit (12.3) (795) (14.3) (930) 8.0 519
Corporation tax paid 0.5 31 - - 4.7 302
1Income before operating expenses and provisions2Includes P&L on sale of financial assets
There were no public subsidies received during the year. It may be noted that the Corporation tax paid are the cash taxes paid. Refer Note 12 for information on the current year taxation (which includes taxes accrued not yet paid).
39 Risk Management Framework
ICICI Bank UK PLC has adopted the governance framework in line with the corporate governance practices adopted by other UK financial institutions. The Board is assisted by its sub-committees, the Audit Committee, the Board Governance Committee (BGC), the Board Risk Committee (BRC), the Board Credit Committee (BCC), and the Board Conduct Risk Committee (BCRC), and follows ICICI Group’s overall risk management framework. The Board has delegated responsibility for the day-to-day management of the Bank to the Managing Director and Chief Executive Officer. In this role, the Managing Director and Chief Executive Officer is supported by the Management Committee, which he chairs. The Management Committee is supported by various other committees, which include the Executive Credit and Risk Committee (ECRC), the Asset Liability Management Committee (ALCO), the Compliance Conduct and Operational Risk Committee (CORMAC), and the Product and Process Approval Committee (PAC).
As a financial institution, the Bank is exposed to various types of risks. The objective of the risk management framework of the Bank is to ensure that the key risks facing the Bank are identified, understood, measured and monitored; and that the policies and procedures established to address these risks are strictly adhered to.
The key principles underlying the risk management framework of the Bank are as follows:
1. The Board of Directors has oversight over the risks assumed by the Bank. Specific Board committees have been constituted to facilitate focused oversight of various risks.
2. Policies approved from time to time by the Board of Directors or Committees of the Board form the governing framework for each type of risk. The business activities are undertaken within this policy framework.
3. Independent groups and sub-groups have been constituted across the Bank to facilitate independent evaluation, monitoring and reporting of risks. These groups function independently of the business groups/sub-groups.
As part of implementation of an Enterprise Risk Management framework, the Bank has developed a risk appetite framework based on its strategy, an examination of best practices and the risk appetite statement of the Parent. The risk appetite statement has been further drilled down into portfolio-level limits.
The Bank has a risk register which documents the material risks faced by the Bank and categorises them as High, Medium or Low risk based on likelihood and severity of impact. The key material risks to which the Bank is exposed include credit risk (including concentration risk and political risk), market risk (including interest rate and credit spread risks), liquidity risk and operational risk (including compliance and legal risk and conduct risks).
The approach adopted by management to manage the key risks facing the Bank is outlined below.

ICICI Bank UK PLCStrategic Report, Directors’ Report and Financial Statements
March 31, 2017United Kingdom
64
Credit Risk
Credit risk is the risk that losses may arise as a result of the Bank’s borrowers or market counterparties failing to meet obligations under a contract. All credit risk related aspects are governed by the Credit Risk Management Policy (CRMP), which is approved and reviewed annually by the Board Credit Committee. The CRMP describes the principles which underpin and drive the Bank’s approach to credit risk management together with the systems and processes through which they are implemented and administered.
The Bank ensures that there is independent challenge of credit proposals by adopting a two stage process whereby a commercial officer assesses and proposes a transaction or limit and this proposal is then reviewed independently and assessed by a credit officer within the risk team. The CRMP lays down a structured credit approval process, which includes the procedure for independent credit risk assessment and the assignment of an internal risk rating (IRR) to the borrower. The risk rating is a critical input in the credit approval process and is used as an input in arriving at the risk premium for the proposal.
The Bank uses credit rating software through which it assesses a variety of risks relating to the borrower and the relevant industry while assigning an internal rating. Borrower risk is evaluated by considering, inter alia:
• The financial position of the borrower, by analysing the quality of its financial statements, its past financial performance, its financial flexibility in terms of ability to raise capital and its cash flow adequacy;
• The borrower’s relative market position and operating efficiency; and • The quality of management by analysing its track record, payment record and financial conservatism.
Industry risk is evaluated by considering, inter alia: • Certain industry characteristics, such as the importance of the industry to the economy, its growth outlook,
cyclicality and government policies relating to the industry; • The competitiveness of the industry; and • Certain industry financials, including return on capital employed, operating margins, and earnings stability.
After conducting an analysis of a specific borrower’s risk, the Bank assigns an internal risk rating to the borrower. The Bank has a rating scale ranging from ‘AAA’ to ‘D’ (AAA signifying the highest level of credit worthiness and D signifying default). AAA to BBB are considered as ‘Investment Grade’ while BB and below are considered as ‘Non-Investment Grade’.
Credit approval
The delegation structure for approval of credit limits is approved by the Board Credit Committee. Credit proposals are approved by the Executive Credit and Risk Committee (ECRC) or the Board Credit Committee (BCC) based on, inter alia, the amount and internal risk rating of the facility. All credit proposals put up to the BCC are passed through the ECRC.
The Credit Risk team is also responsible for the following with respect to managing the Bank’s credit risk: • Developing credit policies in consultation with the Corporate Banking Group and Retail Banking Group
which cover collateral management, the credit rating framework, provisioning, etc.
• Establishing the delegation of sanctioning powers available to individuals, singly or jointly, and the credit committees which are documented in the Credit Approval Authorisation Manual.
• Limiting and monitoring concentrations of exposure to counterparties, geographies, industrial sectors, internal rating categories, etc.
• Performing periodic credit stress tests on the Bank’s portfolio and communicating the results to the BCC.
ICICI Bank UK PLCStrategic Report, Directors’ Report and Financial Statements
March 31, 2017United Kingdom
65
The credit middle office function is responsible for credit administration which includes monitoring compliance with the terms and conditions prior to disbursement. It also reviews the completeness of documentation and creation of security.
Concentration risk
Concentration risk arises from significant exposures to groups of counterparties whose likelihood of default is driven by common underlying factors, e.g. sector, economy, geographical location, instrument type. The concentration risk in the Bank’s portfolio is governed by the risk appetite framework which stipulates various limits to manage exposure concentrations within the Bank. The key parameters of risk concentrations measured in the Bank include sectoral, country, rating category based, product specific exposures, counterparty and large exposures.
Credit Monitoring
Credit quality is monitored on an ongoing basis but can also be triggered by any material credit event coming to the Bank’s notice through either primary or secondary sources. The Bank has established a credit forum, which is comprised of Heads of Businesses and the Head of Risk. The credit forum focuses on management & monitoring of impaired and watchlist assets/investments and also monitors developments in the Bank’s portfolio through the Early Warning Indicators (EWI) framework to identify potential vulnerabilities. It is the Bank’s policy to review borrower accounts at least on an annual basis or in a shorter interval if recommended by the credit officer or the relevant sanctioning committee. A risk based asset review framework has been put in place wherein the frequency of asset review would be higher for cases with higher exposure and/or lower credit rating. The Bank has established a list of assets under watch as an additional tool for monitoring exposures which show or are expected to show signs of weakness. The assets under watch are reviewed on a quarterly basis by the BCC, in addition to review and monitoring by the credit forum. The Bank documents the ‘lessons learned’ from its experiences of exposures against which specific provisions have been booked. These are presented to the BCC and circulated to the commercial officers.
Credit risk is also managed at the portfolio level by monitoring and reporting risk dashboards to the BCC. The credit risk dashboard is constructed using key risk indicators for underlying portfolio rating, counterparty concentration, geographical concentration, stressed assets, breaches in risk appetite, sectoral concentration, recovery risk and documentation risk.
The segregation of responsibilities and oversight by groups external to the business groups ensure adequate checks and balances.

ICICI Bank UK PLCStrategic Report, Directors’ Report and Financial Statements
March 31, 2017United Kingdom
66
An analysis of the Bank’s investment portfolio based on credit ratings provided by external rating agencies is as follows:
March 31, 2017USD 000s
March 31, 2016USD 000s
March 31, 2017INR million
March 31, 2016INR million
AAA 66,909 102,726 4,339 6,662
AA+ - 39,657 - 2,572
AA 11,223 3,441 728 223
AA- 2,201 24,011 143 1,557
A+ 11,783 - 764 -
BBB- 483,774 557,208 31,373 36,135
BB+ and below 101,857 9,152 6,605 594
Unrated 5,559 7,218 360 467
Total 683,306 743,413 44,312 48,210
Credit quality of loan portfolio
The definition of internal risk rating for the loans and advances are given below:
AAA to AA- : Highest safety/High Safety
A+ to A- : Adequate safety
BBB+ to BBB- : Moderate safety
BB and below : Inadequate safety/High risk
The Bank’s internal risk rating scale is a measure of relative credit worthiness and does not map exactly with that of external rating agencies.
The exposure detailed below for loans and advances to Banks and Customers are gross of collective and specific impairment.
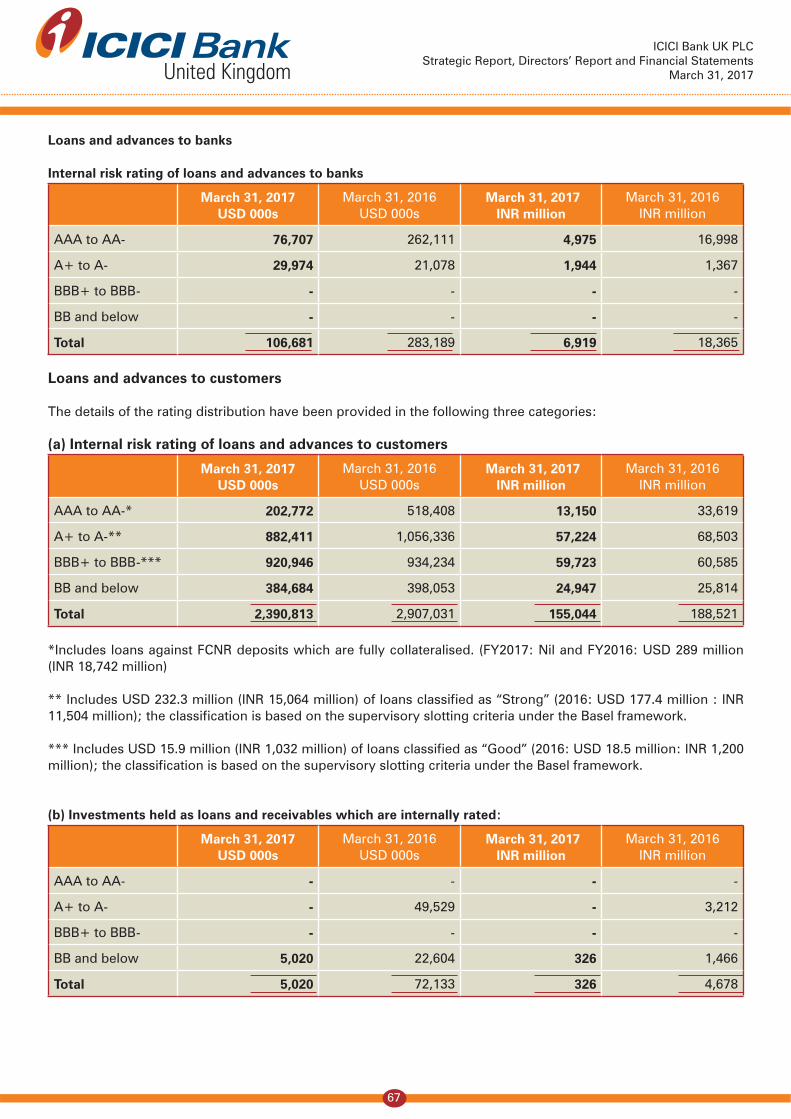
ICICI Bank UK PLCStrategic Report, Directors’ Report and Financial Statements
March 31, 2017United Kingdom
67
Loans and advances to banks
Internal risk rating of loans and advances to banks
March 31, 2017USD 000s
March 31, 2016USD 000s
March 31, 2017INR million
March 31, 2016INR million
AAA to AA- 76,707 262,111 4,975 16,998
A+ to A- 29,974 21,078 1,944 1,367
BBB+ to BBB- - - - -
BB and below - - - -
Total 106,681 283,189 6,919 18,365
Loans and advances to customers
The details of the rating distribution have been provided in the following three categories:
(a) Internal risk rating of loans and advances to customers
March 31, 2017USD 000s
March 31, 2016USD 000s
March 31, 2017INR million
March 31, 2016INR million
AAA to AA-* 202,772 518,408 13,150 33,619
A+ to A-** 882,411 1,056,336 57,224 68,503
BBB+ to BBB-*** 920,946 934,234 59,723 60,585
BB and below 384,684 398,053 24,947 25,814
Total 2,390,813 2,907,031 155,044 188,521
*Includes loans against FCNR deposits which are fully collateralised. (FY2017: Nil and FY2016: USD 289 million (INR 18,742 million)
** Includes USD 232.3 million (INR 15,064 million) of loans classified as “Strong” (2016: USD 177.4 million : INR 11,504 million); the classification is based on the supervisory slotting criteria under the Basel framework.
*** Includes USD 15.9 million (INR 1,032 million) of loans classified as “Good” (2016: USD 18.5 million: INR 1,200 million); the classification is based on the supervisory slotting criteria under the Basel framework.
(b) Investments held as loans and receivables which are internally rated:
March 31, 2017USD 000s
March 31, 2016USD 000s
March 31, 2017INR million
March 31, 2016INR million
AAA to AA- - - - -
A+ to A- - 49,529 - 3,212
BBB+ to BBB- - - - -
BB and below 5,020 22,604 326 1,466
Total 5,020 72,133 326 4,678

ICICI Bank UK PLCStrategic Report, Directors’ Report and Financial Statements
March 31, 2017United Kingdom
68
(c) Investments held as loans and receivables which are externally rated:
March 31, 2017USD 000s
March 31, 2016USD 000s
March 31, 2017INR million
March 31, 2016INR million
AAA to AA- - 31,321 - 2,031
A+ to A- 5,425 5,609 352 364
BBB+ to BBB- 28,303 29,067 1,835 1,885
BB and below - - - -
Total 33,728 65,997 2,187 4,280
The Bank has adopted the standardised approach to Credit Risk Management under the Basel II framework.
Industry exposureThe following is an analysis of loans and advances to customers by industry:
March 31, 2017USD 000s
March 31, 2016USD 000s
March 31, 2017INR million
March 31, 2016INR million
Industrials 264,888 246,202 17,179 15,966
Consumer Discretionary
223,320 345,311 14,482 22,393
Consumer Staples 207,680 207,122 13,468 13,432
Energy 158,868 220,147 10,303 14,277
Financials 225,280 185,473 14,609 12,028
Gems and Jewellery
152,147 172,904 9,867 11,213
Healthcare 81,922 95,147 5,313 6,170
Information Technology
136,243 88,860 8,835 5,763
Materials 518,696 737,878 33,637 47,851
Real Estate* 359,411 331,779 23,308 21,516
Telecom Services 56,450 108,426 3,661 7,031
Utilities 15,705 16,404 1,018 1,064
Others 451 510 29 33
Retail loans** 28,500 288,998 1,848 18,742
Total 2,429,561 3,045,161 157,557 197,479
*Includes ABS/MBS portfolio held as loans and receivables which have been classified here for both FY2016 and FY2017** Includes Loans secured against FCNR deposits for both FY2016 and FY2017 and Retail loans backed by SBLC for FY2017

ICICI Bank UK PLCStrategic Report, Directors’ Report and Financial Statements
March 31, 2017United Kingdom
69
Collateral Management
The Bank has a policy on collateral management and credit risk mitigation which provides guidance for identifying eligible collateral as per the relevant articles of the Capital Requirements Regulation (CRR).
Apart from obtaining eligible collateral for capital relief, the Bank endeavours to reduce or mitigate, to the extent possible, the credit risk on credit facilities by way of securing the facilities with appropriate collateral. The Bank determines the appropriate collateral for each facility based on the type of product, the counterparty and the appropriateness of the collateral typically offered in the jurisdiction of the borrower.
The security accepted by the Bank includes cash deposits, pledge/contractual comfort over equity shares (both listed and unlisted), charges over fixed assets (including plant and machinery and land and building) for term loans, charges over current assets for working capital finance, charges on specific receivables with escrow arrangements, mortgages on residential/commercial property, assignment of underlying project contracts for project finance loans. The Bank also accepts corporate guarantees and related support undertakings from borrower group entities for mitigating credit risk. The Bank has a collateral management policy which details the types of collaterals, frequency of valuation and valuation adjustments. The Bank also has a collateral valuation policy for cases assessed for specific provisions. The Bank applies Basel II guidelines on the collateral available with the Bank for its internally rated portfolio to determine the Loss Given Default (LGD) and haircuts applicable against each collateral for computing the collective provisioning requirements.
The Bank’s risk appetite framework prescribes limits on the quantum of unsecured exposures.
The CRMP provides guidance on identifying and defining secured facilities and valuing the underlying security. The Bank monitors and reports the proportion of unsecured exposures in the loan portfolio to the ECRC on a monthly basis and to the BCC on a quarterly basis.
As per the policy, the basis of valuation depends on the type of security. The CRMP details the general basis of valuation of various collateral and the expected frequency of valuation. Management may apply haircuts (in the range of 10%-20%) to the valuations if required (for example, when the valuation available is not recent and may not reliably reflect the recoverable value of the security). The table below provides the value of collateral/collaterals held by the Bank:
Loans and advances to customersMarch 31, 2017
USD 000sMarch 31, 2016
USD 000s March 31, 2017
INR millionMarch 31, 2016
INR million
Collateral value 695,646 1,147,608 45,113 74,422
Gross loans and advances 2,429,561 3,045,161 157,557 197,479
Less: Investments held as loans and receivables
(38,748) (138,130) (2,513) (8,958)
Outstanding balance against which collateral held
2,390,813 2,907,031 155,044 188,521
No collateral is held against loans and advances to banks.
The collateral valuations in the table above are based on the valuation available from the latest available audited financial statements of the organisation, valuation reports for tangible assets wherever applicable, and reports from security trustee/market value of listed shares for loans against the shares. The valuations exclude any charges which might be incurred for selling the collateral.
The maximum amount of on balance sheet credit risk, without taking account of any collateral or netting arrangements, as at March 31, 2017 is approximately USD 3.5 billion (INR 226 billion) (2016: USD 4.6 billion; INR 298 billion). The maximum amount of off balance sheet credit risk on guarantees and letters of credit is approximately USD 280 million (INR 18,162 million) (2016: USD 346 million; INR 22,434 million). Potential credit risk on financial instruments is detailed in Note 19.
ICICI Bank UK PLCStrategic Report, Directors’ Report and Financial Statements
March 31, 2017United Kingdom
70
The collateral value in the above table excludes the value of such collateral which the Bank may accept to manage its risks more effectively such as a second charge on assets, other liens and corporate guarantees and related support undertakings from borrower group entities. The Bank has applied appropriate haircuts when calculating the collateral value detailed above.
Market Risk
Market risk is the possibility of loss arising from changes in the value of a financial instrument as a result of changes in market variables such as interest rates, exchange rates, credit spreads and other asset prices. The Bank’s key policies for managing market risk as approved by the Board Risk Committee (BRC) are:
• Treasury policy manual and mandate (TPMM) which also includes the trading book policy statement (TBPS)
• Valuation, model validation policy and independent price verification policy
These policies are designed to ensure that transactions in securities, foreign exchange and derivatives are conducted in accordance with sound and acceptable business practices as well as regulatory guidelines and laws governing such transactions. The policies are reviewed periodically to take into account changed business requirements, the economic environment and revised policy guidelines.
The key market risks to which the Bank is exposed relate to:
• Interest rate risk – Interest rate risk is defined as the risk of loss which the Bank will incur as a result of an increase or decrease in interest rates. Interest income and expense from interest sensitive assets and liabilities are impacted by changes in interest rates. The overall value of the investment portfolio, the underlying value of the Bank’s other assets, its liabilities, and off balance sheet (OBS) instruments are also impacted due to changes in interest rates because the present value of future cash flows changes when interest rates change.
Interest rate risk on the balance sheet is measured by the use of re-pricing gap reports and estimating the sensitivity of the Bank’s net interest income (defined as Earnings at Risk) to changes in interest rates. The sensitivity is calculated for various interest rate scenarios across different currencies that the Bank’s balance sheet is exposed to including a standard scenario of a 200 basis points adverse change in the level of interest rates. The various limits set for interest rate risk are monitored and the utilisations reported to the ALCO and BRC on a periodic basis.
The Bank uses Duration of Equity (DoE) as an all-encompassing measure, which takes into consideration the duration and value of both assets and liabilities. DoE is a measure of interest rate sensitivity, which indicates how much the market value of equity, would change if interest rates change by 1%. Currently a limit band of -2.0 to +2.0 has been prescribed for the overall net DoE of the Bank.
Further, to manage the interest rate risk in the investment portfolio and ineffective derivatives, the bank uses various risk metrics such as value-at-risk (VaR), price value of basis point (PV01) and credit spread per basis point (CS01).
• Forex risk – This risk arises due to positions in non-dollar denominated currencies, which in turn arise from assets and liabilities in those currencies. Foreign exchange risk is managed within the Treasury function in accordance with approved position limits. The Net overnight open position (NOOP) of the Bank as at March 31, 2017 was USD 1.4 million (INR 91 million) (2016: USD 5.0 million; INR 324 million). Further, to manage the forex risk, the Bank uses value-at-risk measure.
• Equity Risk – Equity price risk arises due to the volatility of price movements on the Bank’s investment in equity shares and convertibles. Threshold triggers are defined for falls in the values of equity investments and an escalation framework is in place. The value of the Bank’s equity investments as at March 31, 2017 was USD 5.6 million (INR 360 million) (2016: USD 4.6 million, INR 298 million. The option value of convertibles was Nil at March 31, 2017 (2016: USD 0.4 million, INR 26 million).

ICICI Bank UK PLCStrategic Report, Directors’ Report and Financial Statements
March 31, 2017United Kingdom
71
The Bank has devised various risk metrics for different products and investments. These risk metrics are measured and reported to senior management by the Bank’s independent Treasury Control & Services Group (TCSG). Some of the risk metrics adopted by the Bank for monitoring its risks are value-at-risk (VaR), duration of equity (DoE), price value of basis point (PV01) and stop loss amongst others. The risk appetite of the Bank includes limits for these risk metrics.
VaR is calculated using a parametric approach at a 99% confidence level over a one day holding period. The total VaR for the Bank’s AFS book portfolio, including investment portfolio, as at March 31, 2017 was USD 2.97 million (INR 193 million) (2016: USD 1.29 million; INR 84 million). The maximum, average and minimum VaR during the year for the AFS book portfolio, including investment portfolio, was USD 3.47 million (INR 225 million) (2016: USD 1.98 million; INR 128 million), USD 2.55 million (INR 165 million) (2016: USD 1.45 million; INR 94 million) and USD 1.19 million (INR 77 million) (2016: USD 1.15 million; INR 75 million) respectively.
The impact of an increase in interest rates on investment securities held in the AFS category (bonds, asset backed securities, treasury bills & government securities), assuming a parallel shift in yield curve, has been set out in the following table:
ParticularsMarch 31, 2017
USD 000sMarch 31, 2016
USD 000s March 31, 2017
INR millionMarch 31, 2016
INR million
Portfolio size (Market value) 414,569 461,380 26,885 29,921
Change in value due to 100 bps movement in interest rate
(10,235) (5,535) (664) (359)
Change in value due to 200 bps movement in interest rate
(20,470) (11,071) (1,328) (718)
The impact of a decrease in interest rates on investment securities held in the AFS category (bonds, asset backed securities, treasury bills & government securities), assuming a parallel shift in yield curve, has been set out in the following table:
ParticularsMarch 31, 2017
USD 000sMarch 31, 2016
USD 000s March 31, 2017
INR millionMarch 31, 2016
INR million
Portfolio size (Market value) 414,569 461,380 26,885 29,921
Change in value due to 100 bps movement in interest rate
10,219 5,483 663 356
Change in value due to 200 bps movement in interest rate
20,417 10,966 1,324 711

ICICI Bank UK PLCStrategic Report, Directors’ Report and Financial Statements
March 31, 2017United Kingdom
72
Volatility in interest rates has an impact on an entity’s interest earnings. The impact of an increase/decrease in interest rates on the Bank’s net interest income as at March 31, 2017, assuming a parallel shift in the yield curve, has been set out in the following table:
Equivalent in USD million Equivalent in INR million
CurrencyImpact on Net Interest Income over a
one year horizonImpact on Net Interest Income over a one
year horizon
Increase in interest rates by
100 bps
Increase in interest rates by
200 bps
Increase in interest rates by 100 bps
Increase in interest rates by 200 bps
USD 3.4 6.9 223 445
GBP 3.3 6.6 211 425
EUR 0.0 0.6 2 41
Other currencies (0.0) (0.0) (1) (1)
Total 6.7 14.1 435 910
Equivalent in USD million Equivalent in INR million
CurrencyImpact on Net Interest Income over a
one year horizonImpact on Net Interest Income over a one
year horizon
Decrease in interest rates by
100 bps
Decrease in interest rates by
200 bps
Decrease in interest rates by 100 bps
Decrease in interest rates by 200 bps
USD (2.6) (2.0) (165) (129)
GBP (3.5) (9.3) (227) (606)
EUR 1.1 2.2 70 142
Other currencies 0.0 0.0 1 1
Total (5.0) (9.1) (321) (592)
The impact of an increase in interest rates on the Bank’s net interest income as at March 31, 2016, assuming a parallel shift in the yield curve, has been set out in the following table:
Equivalent in USD million Equivalent in INR million
CurrencyImpact on Net Interest Income over a
one year horizonImpact on Net Interest Income over a one
year horizon
Increase in interest rates by
100 bps
Increase in interest rates by
200 bps
Increase in interest rates by 100 bps
Increase in interest rates by 200 bps
USD 2.3 5.1 149.2 330.7
GBP 3.0 6.1 194.6 395.6
EUR 1.4 3.2 90.8 207.5
Other currencies 0.1 0.1 6.5 6.5
Total 6.8 14.5 441.1 940.3
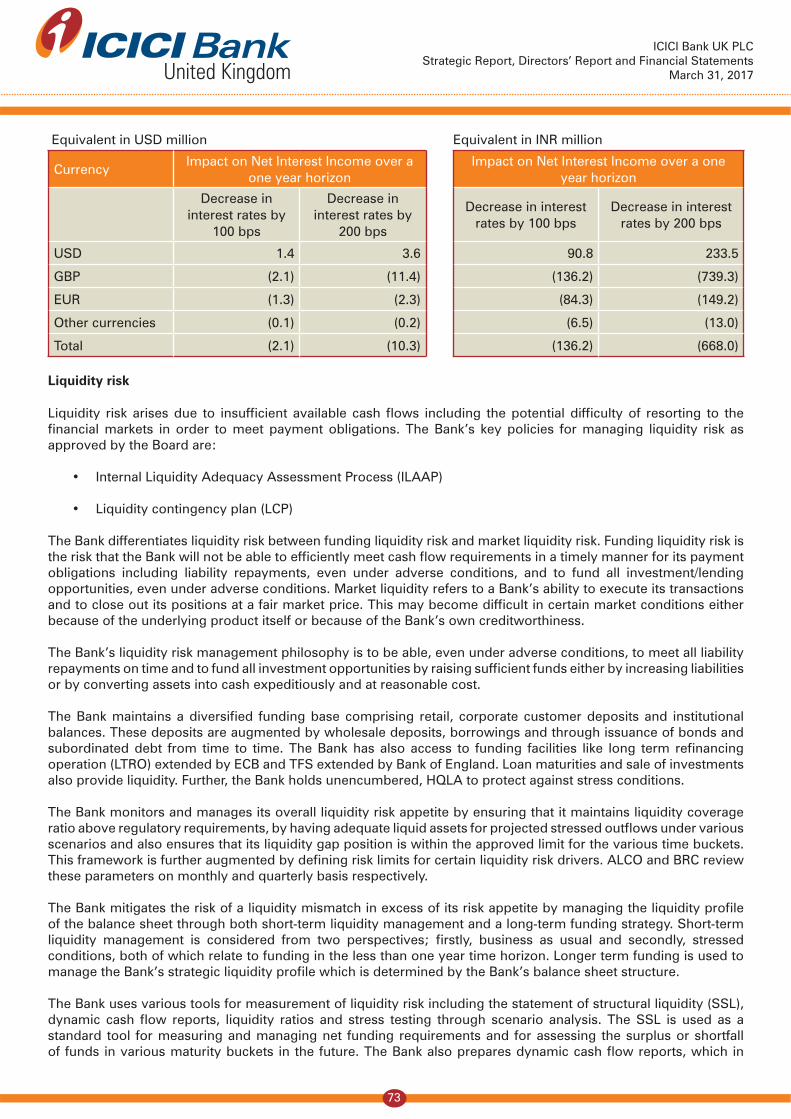
ICICI Bank UK PLCStrategic Report, Directors’ Report and Financial Statements
March 31, 2017United Kingdom
73
Equivalent in USD million Equivalent in INR million
CurrencyImpact on Net Interest Income over a
one year horizonImpact on Net Interest Income over a one
year horizon
Decrease in interest rates by
100 bps
Decrease in interest rates by
200 bps
Decrease in interest rates by 100 bps
Decrease in interest rates by 200 bps
USD 1.4 3.6 90.8 233.5
GBP (2.1) (11.4) (136.2) (739.3)
EUR (1.3) (2.3) (84.3) (149.2)
Other currencies (0.1) (0.2) (6.5) (13.0)
Total (2.1) (10.3) (136.2) (668.0)
Liquidity risk
Liquidity risk arises due to insufficient available cash flows including the potential difficulty of resorting to the financial markets in order to meet payment obligations. The Bank’s key policies for managing liquidity risk as approved by the Board are:
• Internal Liquidity Adequacy Assessment Process (ILAAP)
• Liquidity contingency plan (LCP)
The Bank differentiates liquidity risk between funding liquidity risk and market liquidity risk. Funding liquidity risk is the risk that the Bank will not be able to efficiently meet cash flow requirements in a timely manner for its payment obligations including liability repayments, even under adverse conditions, and to fund all investment/lending opportunities, even under adverse conditions. Market liquidity refers to a Bank’s ability to execute its transactions and to close out its positions at a fair market price. This may become difficult in certain market conditions either because of the underlying product itself or because of the Bank’s own creditworthiness.
The Bank’s liquidity risk management philosophy is to be able, even under adverse conditions, to meet all liability repayments on time and to fund all investment opportunities by raising sufficient funds either by increasing liabilities or by converting assets into cash expeditiously and at reasonable cost.
The Bank maintains a diversified funding base comprising retail, corporate customer deposits and institutional balances. These deposits are augmented by wholesale deposits, borrowings and through issuance of bonds and subordinated debt from time to time. The Bank has also access to funding facilities like long term refinancing operation (LTRO) extended by ECB and TFS extended by Bank of England. Loan maturities and sale of investments also provide liquidity. Further, the Bank holds unencumbered, HQLA to protect against stress conditions.
The Bank monitors and manages its overall liquidity risk appetite by ensuring that it maintains liquidity coverage ratio above regulatory requirements, by having adequate liquid assets for projected stressed outflows under various scenarios and also ensures that its liquidity gap position is within the approved limit for the various time buckets. This framework is further augmented by defining risk limits for certain liquidity risk drivers. ALCO and BRC review these parameters on monthly and quarterly basis respectively.
The Bank mitigates the risk of a liquidity mismatch in excess of its risk appetite by managing the liquidity profile of the balance sheet through both short-term liquidity management and a long-term funding strategy. Short-term liquidity management is considered from two perspectives; firstly, business as usual and secondly, stressed conditions, both of which relate to funding in the less than one year time horizon. Longer term funding is used to manage the Bank’s strategic liquidity profile which is determined by the Bank’s balance sheet structure.
The Bank uses various tools for measurement of liquidity risk including the statement of structural liquidity (SSL), dynamic cash flow reports, liquidity ratios and stress testing through scenario analysis. The SSL is used as a standard tool for measuring and managing net funding requirements and for assessing the surplus or shortfall of funds in various maturity buckets in the future. The Bank also prepares dynamic cash flow reports, which in
ICICI Bank UK PLCStrategic Report, Directors’ Report and Financial Statements
March 31, 2017United Kingdom
74
addition to scheduled cash flows, also consider the liquidity requirements pertaining to incremental business and the funding thereof.
As part of the stock and flow approach of monitoring liquidity, the Bank monitors certain liquidity ratios covering various liquidity risk drivers inter-alia short-term liquidity risk, structural mismatch risk, wholesale funding risk, off balance sheet risk and non-marketable assets risk as detailed in the Bank’s ILAAP. The Bank places particular emphasis on the withdrawable funding ratio and the customer advances to total assets ratio. The withdrawable funding ratio indicates the proportion of deposits that can be withdrawn by customers without providing notice to total funding resources. The ratio as at March 31, 2017 was 0.26 (0.27 as at March 31, 2016). The customer advances to total assets ratio provides a measure of the structural liquidity of the Bank’s asset portfolio. The ratio as at March 31, 2017 was 0.69 (0.63 as at March 31, 2016).
The Bank has implemented the CRD IV liquidity guidelines as specified by PRA. As per the guidelines, the Bank has prepared an ILAAP document outlining the liquidity risk appetite of the Bank. The ILAAP document sets out the framework used to ensure that the Bank maintains sufficient liquidity at all times, including periods of stress. This has been done through the robust liquidity stress testing under various identified scenarios. Under each scenario, the Bank assesses the behavior of each liquidity risk drivers and estimates the amount of liquidity required to mitigate net stress outflows. The stress testing is carried out daily. The results of the stress test are reported to the ALCO and BRC & Board on a monthly and quarterly basis respectively. Further, from October 1, 2015 the Bank maintains LCR as stipulated by the PRA. The Bank also tracks its Net Stable Funding ratio (NSFR), though it is yet to be introduced as a regulatory requirement.
The Bank also has a LCP which details the overall approach and actions the Bank would undertake in order to manage the Bank’s liquidity position during stressed conditions. The LCP addresses both the funding and operational requirements of the Bank and sets-out a funding, operational and communication plan to enable the Bank to deal with a liquidity crisis. In summary, the Bank seeks to follow a conservative approach in its management of liquidity and has in place, a robust governance structure, policy framework and review mechanism to ensure availability of adequate liquidity even under stressed market conditions.
Refer Note 40 for details on the cash flow payable under contractual maturity.
Operational Risk
Operational risk is the risk of loss resulting from inadequate or failed internal processes, people, and systems or from external events. ‘Compliance and legal’ risk which is defined as the risk that arises from a failure or inability to comply with the laws, regulations or voluntary codes applicable to the financial services industry and ‘conduct’ risk, which includes risks arising from unfair treatment and delivering inappropriate outcomes to its customers, are also considered within the ambit of operational risk.
The management of operational risk within the Bank is governed by the Operational Risk Management Policy (ORMP) which is reviewed and approved by the Board Risk Committee (BRC) on an annual basis. It covers the aspects pertaining to minimizing losses due to process failures including inadequate training to staff, flaws in product designs that can expose the Bank to losses due to fraud, impact of failures in technology/systems and continuity in the Bank’s operations. Operational risk elements covered in the ORMP include operational risk incident management including reporting, techniques for risk identification, assessment and measurement, monitoring through key risk indicators and risk mitigation techniques.
The Compliance, Conduct and Operational Risk Management Committee (CORMAC) comprising of the senior management is responsible for the mitigation of operational risk including fraud and conduct risk within the Bank by the creation and maintenance of an explicit operational risk management process. The CORMAC meets at least on a monthly basis to track and monitor the progress of the implementation of various elements of the ORMP. The CORMAC is additionally responsible for reviewing and monitoring the financial crime prevention performance of the Bank. It approves the Bank’s fraud governance framework and fraud compensation proposals and monitors the progress of reported fraudulent transactions. A report on fraud loss incidences is separately presented to the Board on a quarterly basis by the Fraud Crime Prevention Team.
The Bank has determined and articulated Operational Risk Appetite (ORA) which has been defined as the acceptable maximum level of Operational Risk (OR) that the Bank is willing to accept in pursuit of its strategic objectives,

ICICI Bank UK PLCStrategic Report, Directors’ Report and Financial Statements
March 31, 2017United Kingdom
75
taking into account the interest of its stakeholder as well as regulatory requirements. It has been expressed both in quantitative and qualitative terms. The Bank has expressed its ORA as a percentage of a financial parameter of the Bank i.e. operating income and operating expenses based on the average level of losses for the previous years and has also taken into account the existing controls and expected future developments/ initiatives. In addition to quantitative measure, the Bank has also established qualitative measures of ORA both at strategic and business levels. At strategic level, the Bank has set thresholds as acceptable, tolerable and unacceptable in various categories, including financial, regulatory, client, reputation and employment practices and personnel safety. The qualitative measures set at business level are based around Risk and Control Self-Assessment (RCSA) results, Key Risk Indictors (KRIs) and Internal Audit and Compliance assessments.
In order to further strengthen and proactively monitor its compliance to the ‘Conduct Risk (CR)’, the Bank has also defined its ‘Conduct Risk Appetite (CRA)’ as per the guidelines issued by the regulator and has established both quantitative and qualitative measures of the Conduct Risk. The Bank has defined CRA as the maximum level of conduct risk that the Bank is willing to accept in pursuit of its business objectives. A conduct risk appetite framework balances the need of all stakeholders by acting as both a governor of risk and driver of current and future business strategy.
The objective of a Conduct Risk Appetite framework of the Bank is to identify key conduct risks faced by the Bank and the steps to be taken to mitigate these risks; articulate the governance mechanisms, systems and controls which are in place to mitigate these risks; and review the exposure of the Bank to conduct risks and assist the Board in ensuring that the risk appetite is not breached.
The Bank has established a Conduct Risk Policy which aims to deliver fair and appropriate outcomes as per the Bank’s Conduct Risk philosophy. It also articulates the responsibilities of various stakeholders, i.e. the Board, Senior Management and employees towards conduct risks. The Conduct Risk Appetite framework is reviewed at least on an annual basis, in line with the review of strategy of the Bank. The framework will be updated as per changes in the business strategy of the Bank and/or the changing external regulatory developments/expectations.
The Operational Risk Management Group (ORMG) is responsible for coordinating all the operational risk related activities of the Bank including implementing tools for managing operational risk and maintenance of the ORMP.
The Bank has implemented its RCSA approach to identify and ensure effective control of its operational risks. The RCSAs are reviewed periodically as per the CORMAC approved plan in consultation with the business groups and the results of the RCSA exercise are presented to the BRC semi-annually. The Bank manages and monitors level of operational risks for the Bank as a whole and within the various business group by establishing Key Risk Indicators (KRIs) at Bank level and RCSA entity level respectively. Both the KRIs are monitored on a monthly basis. The results of Bank level KRIs are presented to the CORMAC and the BRC on a quarterly basis. In case of entity level KRIs, parameters registering red for three consecutive months along with the action plan are presented to the CORMAC on a quarterly basis. In order to further strengthen and enhance RCSA tool, the entities/groups also self-test the effectiveness of the controls emanating from the RCSAs at least once in a year. The test is sample based and the results are shared with the BRC on a semi-annual basis.
The Bank has implemented a loss data collection, analysis and reporting process for all operational risk loss data (including internal and external fraud) and near miss events. The data is collected from all business and support units in the UK as well as those outsourced to India. Analysis of such data is reported to the CORMAC and the BRC on a quarterly basis.
The Bank has adopted the Basic Indicator Approach for the purposes of calculating its operational risk capital charge as per Basel II. The Bank carries out an operational risk scenario analysis and stress testing exercise for assessing the adequacy of the operational risk capital charge. Various operational risk events/scenarios based on existing and external loss data, risks identified in RCSAs and internal audit reports, have been assessed which are further used to create seven operational risk scenarios. Each of these scenarios are assessed for probability and financial impact. The output of the scenario analysis exercise carried out as per the documented framework is compared with the operational risk capital charge. The framework is reviewed and the results shared with the CORMAC and BRC on an annual basis.
To identify operational risks in new products/processes, all such proposals are required to be approved by the Product and Process Approval Committee (PAC), comprising of senior management after obtaining inputs from
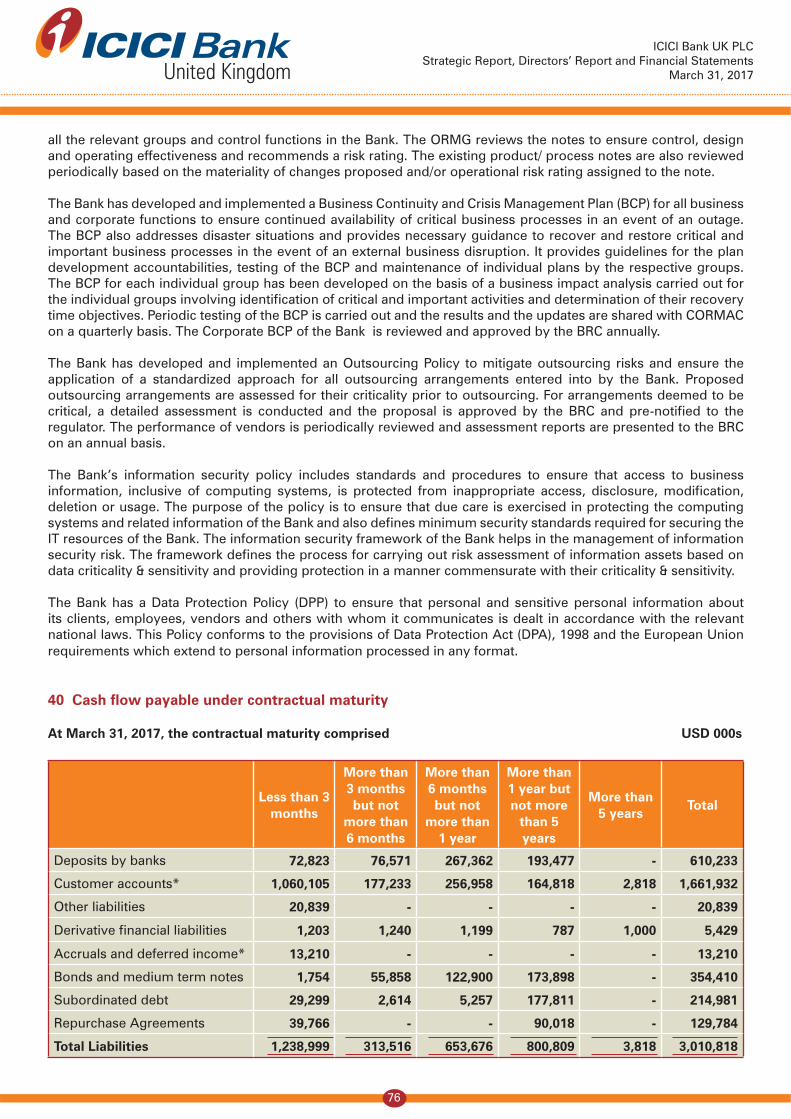
ICICI Bank UK PLCStrategic Report, Directors’ Report and Financial Statements
March 31, 2017United Kingdom
76
all the relevant groups and control functions in the Bank. The ORMG reviews the notes to ensure control, design and operating effectiveness and recommends a risk rating. The existing product/ process notes are also reviewed periodically based on the materiality of changes proposed and/or operational risk rating assigned to the note.
The Bank has developed and implemented a Business Continuity and Crisis Management Plan (BCP) for all business and corporate functions to ensure continued availability of critical business processes in an event of an outage. The BCP also addresses disaster situations and provides necessary guidance to recover and restore critical and important business processes in the event of an external business disruption. It provides guidelines for the plan development accountabilities, testing of the BCP and maintenance of individual plans by the respective groups. The BCP for each individual group has been developed on the basis of a business impact analysis carried out for the individual groups involving identification of critical and important activities and determination of their recovery time objectives. Periodic testing of the BCP is carried out and the results and the updates are shared with CORMAC on a quarterly basis. The Corporate BCP of the Bank is reviewed and approved by the BRC annually.
The Bank has developed and implemented an Outsourcing Policy to mitigate outsourcing risks and ensure the application of a standardized approach for all outsourcing arrangements entered into by the Bank. Proposed outsourcing arrangements are assessed for their criticality prior to outsourcing. For arrangements deemed to be critical, a detailed assessment is conducted and the proposal is approved by the BRC and pre-notified to the regulator. The performance of vendors is periodically reviewed and assessment reports are presented to the BRC on an annual basis.
The Bank’s information security policy includes standards and procedures to ensure that access to business information, inclusive of computing systems, is protected from inappropriate access, disclosure, modification, deletion or usage. The purpose of the policy is to ensure that due care is exercised in protecting the computing systems and related information of the Bank and also defines minimum security standards required for securing the IT resources of the Bank. The information security framework of the Bank helps in the management of information security risk. The framework defines the process for carrying out risk assessment of information assets based on data criticality & sensitivity and providing protection in a manner commensurate with their criticality & sensitivity.
The Bank has a Data Protection Policy (DPP) to ensure that personal and sensitive personal information about its clients, employees, vendors and others with whom it communicates is dealt in accordance with the relevant national laws. This Policy conforms to the provisions of Data Protection Act (DPA), 1998 and the European Union requirements which extend to personal information processed in any format.
40 Cash flow payable under contractual maturity
At March 31, 2017, the contractual maturity comprised USD 000s
Less than 3 months
More than 3 months but not
more than 6 months
More than 6 months but not
more than 1 year
More than 1 year but not more
than 5 years
More than 5 years
Total
Deposits by banks 72,823 76,571 267,362 193,477 - 610,233
Customer accounts* 1,060,105 177,233 256,958 164,818 2,818 1,661,932
Other liabilities 20,839 - - - - 20,839
Derivative financial liabilities 1,203 1,240 1,199 787 1,000 5,429
Accruals and deferred income* 13,210 - - - - 13,210
Bonds and medium term notes 1,754 55,858 122,900 173,898 - 354,410
Subordinated debt 29,299 2,614 5,257 177,811 - 214,981
Repurchase Agreements 39,766 - - 90,018 - 129,784
Total Liabilities 1,238,999 313,516 653,676 800,809 3,818 3,010,818

ICICI Bank UK PLCStrategic Report, Directors’ Report and Financial Statements
March 31, 2017United Kingdom
78
At March 31, 2017, the contractual maturity comprised INR million
Less than 3 months
More than 3 months but not
more than 6 months
More than 6 months but not
more than 1 year
More than 1 year but not more
than 5 years
More than 5 years
Total
Deposits by banks 4,723 4,966 17,338 12,546 - 39,573
Customer accounts* 68,748 11,494 16,664 10,688 183 107,777
Other liabilities 1,352 - - - - 1,352
Derivative financial liabilities 78 80 78 51 65 352
Accruals and deferred income* 858 - - - - 858
Bonds and medium term notes 114 3,622 7,970 11,277 - 22,983
Subordinated debt 1,900 170 341 11,530 - 13,941
Repurchase Agreements 2,579 - - 5,837 - 8,416
Total Liabilities 80,352 20,332 42,391 51,929 248 195,252
* Interest accrued on customer deposits is reclassified into customer accounts.
At March 31, 2016, the contractual maturity comprised USD 000s
Less than 3 months
More than 3 months but not
more than 6 months
More than 6 months but not
more than 1 year
More than 1 year but not more
than 5 years
More than 5 years
Total
Deposits by banks 35,592 96,472 162,599 308,394 - 603,057
Customer accounts 1,397,193 307,822 335,374 423,631 2,846 2,466,866
Other liabilities 31,892 - - - 397 32,289
Derivative financial liabilities 10,993 12,811 13,592 6,262 106 43,764
Accruals and deferred income 24,431 - - - - 24,431
Bonds and medium term notes 108,758 143,425 151,633 114,417 - 518,233
Subordinated debt 4,024 4,024 91,451 188,879 - 288,378
Repurchase Agreements 44,214 - 56,189 52,980 - 153,383
Total Liabilities 1,657,097 564,554 810,838 1,094,563 3,349 4,130,401

ICICI Bank UK PLCStrategic Report, Directors’ Report and Financial Statements
March 31, 2017United Kingdom
78
At March 31, 2016, the contractual maturity comprised INR million
Less than 3 months
More than 3 months but not
more than 6 months
More than 6 months but not
more than 1 year
More than 1 year but not more
than 5 years
More than 5 years
Total
Deposits by banks 2,309 6,256 10,545 19,999 - 39,109
Customer accounts 90,608 19,962 21,749 27,472 185 159,976
Other liabilities 2,069 - - - 26 2,095
Derivative financial liabilities 713 831 881 406 7 2,838
Accruals and deferred income 1,583 - - - - 1,583
Bonds and medium term notes 7,053 9,301 9,833 7,420 - 33,607
Subordinated debt 261 261 5,931 12,249 - 18,702
Repurchase Agreements 2,867 - 3,644 3,436 - 9,947
Total Liabilities 107,463 36,611 52,583 70,982 218 267,857
The balances as noted above incorporate all cash flows on an undiscounted basis which relates to the principal and future coupon payments (except for trading liabilities and trading derivatives).
The Bank does not have any convertible debt securities as on March 31, 2017 (Nil for March 2016)

ICICI Bank UK PLCStrategic Report, Directors’ Report and Financial Statements
March 31, 2017United Kingdom
79
41 Fair values of financial assets and financial liabilities
Set out below is a comparison by category of book values and fair values of the Bank’s trading and non trading financial assets and financial liabilities as at the year end. USD 000s
March 31, 2017 March 31, 2017 March 31, 2016 March 31, 2016
Fair value Book value Fair value Book value
Non trading book financial assets and liabilities
Assets:
Cash 377 377 482 482
Balances at central banks 281,910 281,910 500,136 500,136
Loans and advances to banks 106,641 106,641 283,149 283,149
Loans and advances to customers 2,333,604 2,332,132 2,958,994 2,962,535
Investment securities 689,214 683,306 749,941 743,413
Liabilities:
Deposits by banks and customer ac-counts
2,252,594 2,251,013 3,059,726 3,058,146
Bonds and medium term notes 344,823 344,197 512,138 511,453
Subordinated debts 194,000 176,149 253,409 234,242
Repurchase agreements 129,784 129,784 153,383 153,383
Financial assets and liabilities at fair value through profit and loss
Assets:
Derivative financial instruments 25,750 25,750 40,878 40,878
Liabilities:
Derivative financial instruments 15,719 15,719 57,355 57,355
INR million
March 31, 2017 March 31, 2017 March 31, 2016 March 31, 2016
Fair value Book value Fair value Book value
Non trading book financial assets and liabilities
Assets:
Cash 24 24 31 31
Balances at central banks 18,282 18,282 32,434 32,434
Loans and advances to banks 6,916 6,916 18,362 18,362
Loans and advances to customers 151,334 151,239 191,891 192,120
Investment securities 44,696 44,312 48,634 48,210

ICICI Bank UK PLCStrategic Report, Directors’ Report and Financial Statements
March 31, 2017United Kingdom
80
March 31, 2017 March 31, 2017 March 31, 2016 March 31, 2016
Fair value Book value Fair value Book value
Deposits by banks and customer ac-counts
146,081 145,978 198,423 198,321
Bonds and medium term notes 22,362 22,321 33,212 33,168
Subordinated debts 12,581 11,423 16,434 15,191
Repurchase agreements 8,416 8,416 9,947 9,947
Financial assets and liabilities at fair value through profit and loss
Assets:
Derivative financial instruments 1,670 1,670 2,651 2,651
Liabilities:
Derivative financial instruments 1,019 1,019 3,719 3,719
Notes:
1. Fair value of loans and advances to banks and customers is determined using weighted average margins on market transactions done by the
Bank during the year for loans with similar maturity and rating profile. The fair valuation is carried out post segmenting the disbursements
done during the year by internal rating and tenor and comparing the pricing on the new disbursements with the existing portfolio. The
difference is considered as the fair value adjustment.
2. The fair value of deposits by banks and customers has been estimated using current interest rates offered for deposits of similar maturities.
3. The fair value of debt securities is derived based on prevalent market quotes as at balance sheet date. In case market quotes are not available
the Bank has used the internal valuation technique to calculate the fair value. Internal valuation discounts the estimated future cash flows,
computed based on the prevailing interest rates and credit spreads in the market.
4. Financial instruments such as other assets and other liabilities are expected to have the similar fair value as the carrying value as these are
short term in nature.
42 Derivative financial instruments
The Bank enters into various financial instruments as principal to manage balance sheet interest rate and foreign exchange rate risk. These mainly include interest rate swaps and exchange rate related contracts.
Exchange rate related contracts include spot, currency swaps and forward transactions. The Bank’s currency swap transactions generally involve an exchange of currencies and an agreement to re-exchange the currency at a future date where the swaps relate to assets and liabilities denominated in different currencies.
The Bank uses derivatives to mitigate interest rate risk. Hedge accounting is applied to derivatives and hedged items when the criteria under section 11 and 12 of FRS 102 have been met. The swaps exchange fixed rate for floating rate on assets/liabilities to match the floating rates paid/received on funding or exchanges fixed rates on funding to match the floating rates received/paid on assets/liabilities. For qualifying hedges, the fair value changes of the derivative are substantially matched by corresponding fair value changes of the hedged item, both of which are recognised in profit and loss.
Change in fair value under hedge accounting:
As at March 31, 2017, the notional amounts of interest rate swaps and foreign exchange contract designated as fair value hedges were USD 360 million (INR 23,346 million) (2016: USD 873 million; INR 56,614 million) and these contracts had a net positive fair value of USD 1.12 million (INR 72 million) (2016: net negative fair value of USD 24.4 million; INR 1,582 million).The notional principal amounts of these instruments are not indicative of the amounts at risk which are smaller amounts payable under the terms of these instruments and upon the basis of the contract or notional principal amount. Derivatives contracts in the non-trading book are used for hedging purposes only and are accounted for on this basis and are executed with bank counterparties for whom volume and settlement limits have been approved. Counterparty group limits are approved for connected exposures.

ICICI Bank UK PLCStrategic Report, Directors’ Report and Financial Statements
March 31, 2017United Kingdom
81
The methodologies for the valuation of derivative products are defined in the Valuation Policy of the Bank, which has been approved by the Board Risk Committee (BRC) of the Bank. The Bank uses swap rates, cross currency basis spreads and spot rates as inputs for the valuation of currency swaps and foreign exchange forward transactions. Further, the Bank uses swap rates and interest rate basis spreads as inputs for the valuation of interest rate swaps. Inputs are drawn from Reuters on a real time basis. While the currency wise cash flows for currency swaps and forward transactions are discounted with the appropriate swap rate for the respective currency and the applicable cross currency basis spread, cash flows for interest rate swaps are discounted with the appropriate zero rate for the currency. Further, the floating rate cash flows for currency swaps and forward transactions are calculated from the zero rates derived from the swap curve and the appropriate basis spread applicable for the currency. The floating rate cash flows for interest rate swaps are calculated from the zero rates derived from the swap curve and the appropriate interest rate basis applicable for the currency.
March 31, 2017USD 000s
March 31, 2016USD 000s
March 31, 2017INR million
March 31, 2016INR million
Change in fair value of hedged items recognised in profit and loss account
(22,155) (22,001) (1,437) (1,427)
Investments (3,536) 671 (230) 44
Borrowings, including repurchase 1,324 (9,910) 86 (643)
Loans and receivable (33) (434) (2) (28)
Deposits (19,910) (12,328) (1,291) (800)
Change in fair value of hedged instruments recognised in profit and loss account
21,964 21,838 1,424 1,416
The Bank has computed the Credit Value Adjustment (CVA) and Debit Value Adjustment (DVA) for the derivative portfolio which amounted to USD 46 thousand (INR 3 million) and USD 17 thousand (INR 1 million) respectively. The CVA and DVA have been computed similar to Basel II collective provisioning using the MTM exposures; rating wise probability of defaults as published by S&P; and 45% loss given default as used in the Basel’s foundation IRB approach.
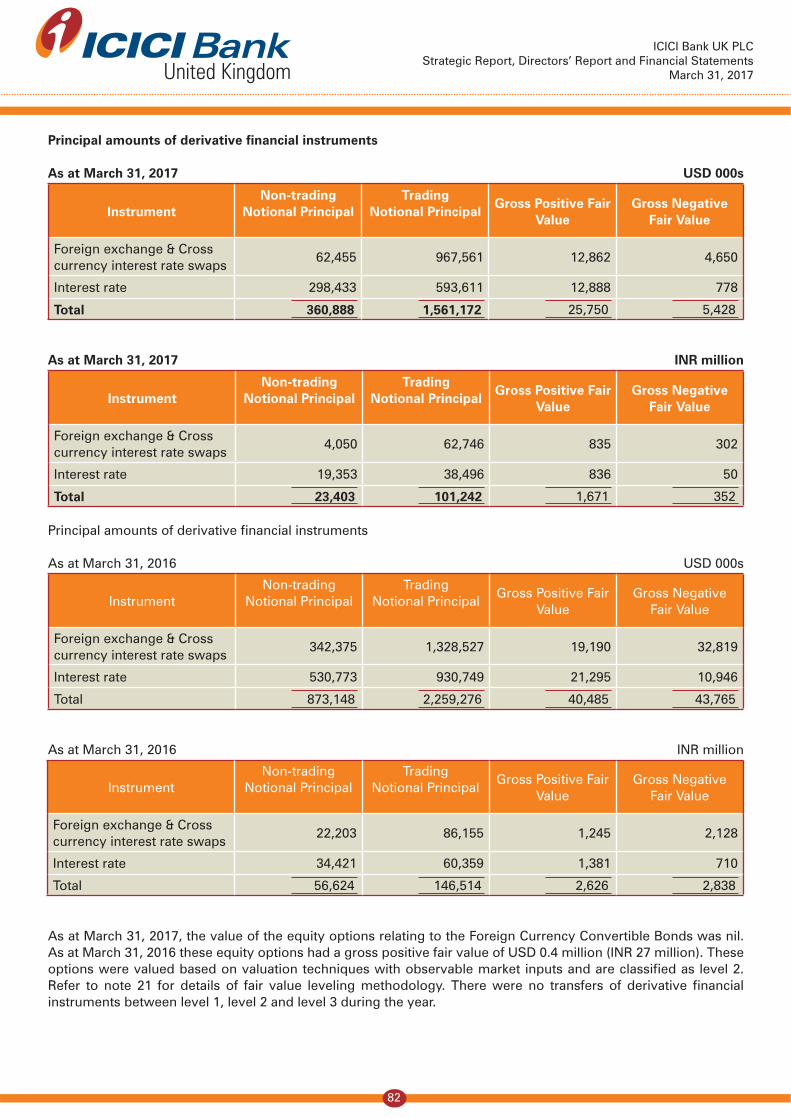
ICICI Bank UK PLCStrategic Report, Directors’ Report and Financial Statements
March 31, 2017United Kingdom
82
Principal amounts of derivative financial instruments
As at March 31, 2017 USD 000s
InstrumentNon-trading
Notional PrincipalTrading
Notional PrincipalGross Positive Fair
ValueGross Negative
Fair Value
Foreign exchange & Cross currency interest rate swaps
62,455 967,561 12,862 4,650
Interest rate 298,433 593,611 12,888 778
Total 360,888 1,561,172 25,750 5,428
As at March 31, 2017 INR million
InstrumentNon-trading
Notional PrincipalTrading
Notional PrincipalGross Positive Fair
ValueGross Negative
Fair Value
Foreign exchange & Cross currency interest rate swaps
4,050 62,746 835 302
Interest rate 19,353 38,496 836 50
Total 23,403 101,242 1,671 352
Principal amounts of derivative financial instruments
As at March 31, 2016 USD 000s
InstrumentNon-trading
Notional PrincipalTrading
Notional PrincipalGross Positive Fair
ValueGross Negative
Fair Value
Foreign exchange & Cross currency interest rate swaps
342,375 1,328,527 19,190 32,819
Interest rate 530,773 930,749 21,295 10,946
Total 873,148 2,259,276 40,485 43,765
As at March 31, 2016 INR million
InstrumentNon-trading
Notional PrincipalTrading
Notional PrincipalGross Positive Fair
ValueGross Negative
Fair Value
Foreign exchange & Cross currency interest rate swaps
22,203 86,155 1,245 2,128
Interest rate 34,421 60,359 1,381 710
Total 56,624 146,514 2,626 2,838
As at March 31, 2017, the value of the equity options relating to the Foreign Currency Convertible Bonds was nil. As at March 31, 2016 these equity options had a gross positive fair value of USD 0.4 million (INR 27 million). These options were valued based on valuation techniques with observable market inputs and are classified as level 2. Refer to note 21 for details of fair value leveling methodology. There were no transfers of derivative financial instruments between level 1, level 2 and level 3 during the year.

ICICI Bank UK PLCStrategic Report, Directors’ Report and Financial Statements
March 31, 2017United Kingdom
83
Derivative financial instruments by valuation method
As at March 31, 2017 USD 000s
Foreign exchange contracts Interest rate
Gross Positive Fair Value
Gross Negative Fair Value
Gross Positive Fair Value
Gross Negative Fair Value
Level 1 187 206
Level 2 12,675 4,444 12,888 778
Level 3 - - - -
Total 12,862 4,650 12,888 778
As at March 31, 2017 INR million
Foreign exchange contracts Interest rate
Gross Positive Fair Value
Gross Negative Fair Value
Gross Positive Fair Value
Gross Negative Fair Value
Level 1 12 13 - -
Level 2 822 289 836 50
Level 3 - - - -
Total 834 302 836 50
As at March 31, 2016 USD 000s
Foreign exchange contracts Interest rate
Gross Positive Fair Value
Gross Negative Fair Value
Gross Positive Fair Value
Gross Negative Fair Value
Level 1 8 1 - -
Level 2 19,182 32,818 21,295 10,946
Level 3 - - - -
Total 19,190 32,819 21,295 10,946
As at March 31, 2016 INR million
Foreign exchange contracts Interest rate
Gross Positive Fair Value
Gross Negative Fair Value
Gross Positive Fair Value
Gross Negative Fair Value
Level 1 1 0 - -
Level 2 1,244 2,128 1,381 710
Level 3 - - - -
Total 1,245 2,128 1,381 710

ICICI Bank UK PLCStrategic Report, Directors’ Report and Financial Statements
March 31, 2017United Kingdom
84
43 Assets and liabilities denominated in foreign currency
March 31, 2017USD 000s
March 31, 2016USD 000s
March 31, 2017INR million
March 31, 2016INR million
Denominated in US Dollars 2,155,216 2,982,475 139,766 193,414
Denominated in Sterling 779,495 910,967 50,550 59,076
Denominated in other currencies 545,055 709,815 35,347 46,031
Total assets 3,479,766 4,603,257 225,663 298,521
Denominated in US Dollars 1,793,042 1,968,877 116,279 127,682
Denominated in Sterling 1,275,665 1,851,100 82,727 120,044
Denominated in other currencies 411,059 783,280 26,657 50,795
Total liabilities 3,479,766 4,603,257 225,663 298,521
The above should not be considered to demonstrate the Bank’s exposure to foreign exchange risk due to the existence of compensating exchange rate contracts as discussed in Note 42 which are held for hedging purposes.The Bank follows a conservative policy with regard to its Foreign exchange risk which is managed within the Treasury function in accordance with the position limits approved by the Board Risk Committee and by using value-at- risk measure. The Net overnight open position (NOOP) of the Bank as at March 31, 2017 was USD 1.4 million (INR 91 million) (2016: USD 5.0 million; INR 324 million).
44 Post balance sheet events
There have been no material events after the balance sheet date which would require disclosure or adjustments to the March 31, 2017 financial statements.
45 Ultimate parent company and parent undertaking of larger group of which the Bank is a member
The Bank is a wholly owned subsidiary of ICICI Bank Limited. The parent company is incorporated in India, having registered address at ICICI Bank Tower, Near Chakli Circle, Old Padra Road, Vadodara 390007, Gujarat, India. Copies of the group accounts for ICICI Bank Limited can be obtained from the Secretarial Department, ICICI Bank Limited, ICICI Bank Towers, Bandra-Kurla Complex, Mumbai 400051, India.