kobe university repository : thesisto crt.8-10 however, the impact of regional myocardial systolic...
TRANSCRIPT

Kobe University Repository : Thesis
学位論文題目Tit le
Myocardial Contract ile Funct ion in the Region of the Left VentricularPacing Lead Predicts the Response to Cardiac Resynchronizat ionTherapy Assessed by Two-Dimensional Speckle TrackingEchocardiography(左室ペーシリングリード留置部位の心筋収縮能は心臓再同期療法への反応性を予測する─2Dスペックルトラッキング心エコー図法を用いた検討─)
氏名Author 則定, 加津子
専攻分野Degree 博士(医学)
学位授与の日付Date of Degree 2010-03-25
資源タイプResource Type Thesis or Dissertat ion / 学位論文
報告番号Report Number 甲4809
権利Rights
JaLCDOI
URL http://www.lib.kobe-u.ac.jp/handle_kernel/D1004809※当コンテンツは神戸大学の学術成果です。無断複製・不正使用等を禁じます。著作権法で認められている範囲内で、適切にご利用ください。
PDF issue: 2021-04-29
Myocardial Contractile Function in the Region of the Left Ventricular Pacing Lead Predicts the Response to
Cardiac Resynchronization Therapy Assessed by Two-Dimensional Speckle Tracking Echocardiography
tr. ~ ~- ~ /' ~ !J - ~'ii 1R$ti (J) JL' & J&m~ f'j: JL,.:pJ IRJ WJ.~ ",,(J)&R;~~TlI!JTQ
-20 A ~ "Y ~ JJ..- ~ 7 "Y ~ /' ~ JL'.:x:. ::r - ~ ~ ~ ffl v\ tr. ~J;t-
alj 11: 11D $ -=f, ) II ~ xW 1§"ff:, m~
~?*~*~~~~*~~~~~~.~ •• ft~~~
(m~~jl : lIlEB.-~~)
Key words: Cardiac resynchronization therapy, Heart failure, Dyssynchrony,
2-dimensional speckle-tracking echocardiography

ABSTRACT
Objective: The aim of this study was to test the impact of the posterolateral
myocardial systolic function on response to cardiac resynchronization therapy (CRT).
Methods: Forty patients were studied before and 4 ± 2 months after CRT.
Oyssynchrony was defined as anteroseptal wall-to-posterior wall delay (2: 130 ms)
caused by speckle-tracking radial strain. The average longitudinal strain in 4
posterior and lateral segments (E-pl) in which the left ventricular pacing lead was
positioned was calculated by automated functional imaging. Response to CRT was
defined as a 2: 15% decrease in end-systolic volume.
Results: The negative value of E-pl in responders was significantly higher than that
in non-responders at baseline (-7.8 ± 6.9% vs -2.1 ± 4.9%, P < 0.01). Combining
dyssynchrony with E-pl < -7.8% was more effective for predicting response to CRT
than dyssynchrony parameters alone (92% vs 75%).
Conclusion: The addition of posterolateral myocardial systolic function to the
measurement of dyssynchrony appears to be of value for predicting response to CRT.
1

Cardiac resynchronization therapy (CRT) is an established therapeutic option
for patients with advanced heart failure (HF). Previous studies have demonstrated
that CRT reduces HF symptoms and improves acute and chronic hemodynamics,
exercise capacity, the quality oflife, survival, and left ventricular (LV) systolic
function. I-7 Randomized clinical trials have demonstrated, however, that up to one
third of patients with HF do not favorably respond to CRT with standard clinical
selection criteria, including electrocardiographic QRS width. I, 3, 4, 7 Accordingly, the
quantification of LV mechanical dyssynchrony by echocardiography has emerged as
an important option for predicting response to CRT. Although LV mechanical
dyssynchrony has been associated with response to CRT, some patients with LV
mechanical dyssynchrony assessed by echocardiography do not respond to CRT.
Other factors, such as LV lead position or scar burden, may also influence response
to CRT, regardless of the presence of dyssynchrony. Previous investigators have
reported that myocardial viability or scar tissue is an important marker for response
to CRT.8-10 However, the impact of regional myocardial systolic function assessed by
echocardiography in the posterolateral wall, where the LV pacing lead is positioned
for response to CRT, is not known. Automated function imaging (AFI), based on 2-
dimensional speckle tracking imaging, can be used for the assessment of regional
longitudinal strain of the 17 -segment loft ventricle as a bull's-eye map. II , 12
Our objective was thus to test the impact of posterolateral myocardial systolic
function assessed by AFI on the response to CRT. Furthermore, we evaluated the
hypothesis that the addition of posterolateral myocardial systolic function to LV
dyssynchrony assessed by echocardiography would further improve the ability to
2

predict response to CRT.
METHODS
Study Population
We studied 47 consecutive patients with HF who underwent CRT. The
selection criteria for CRT included chronic severe HF (New York Heart Association
functional class III or IV), LV ejection fraction (EF) ~ 35%, and QRS duration 2:
120ms. Seven patients were excluded from subsequent analysis because their
echocardiographic images were technically unsatisfactory. Accordingly, the patient
study group consisted of 40 patients with HF, 28 (70%) in New York Heart
Association functional class III and 12 (30%) in class IV at the initial evaluation. The
group's mean age was 67 ± 12 years, 10 (25 %) were women, the mean EF was 25 ±
8%, the mean QRS duration was 163 ± 25 ms, and 9 patients (23%) had ischemic
cardiomyopathy (Table 1). Twenty-four patients were diagnosed with sinus rhythm
and 6 with atrial fibrillation, while 10 had previously undergone the implantation of
permanent right ventricular pacemakers 2: 1 year before enrollment, and they were
predominantly right ventricular paced, which was defined as 2: 90% paced when the
device was interrogated at the time of enrollment. All patients were on optimal
pharmacological therapy, if tolerated. Written informed consent to participate in the
study was obtained from all patients.
Echocardiography
All echocardiographic studies were performed with a commercially available
echocardiography system (Vivid 7; GE Vingmed Ultrasound AS, Horton, Norway).
3
Patients were studied before and 4 ± 2 months after CRT. Echocardiographic images
were obtained in the left lateral decubitus position with a 3.5-MHz transducer. The
mean frame rate was 65 ± 15 frames/s for grayscale imaging used for speckle
tracking analysis. Sector width was optimized for complete myocardial visualization
while maximizing the frame rate. Gain settings were adjusted for routine grayscale 2-
dimensional imaging to optimize endocardial definition. Pulsed-wave Doppler of the
LV outflow tract was obtained to determine LV ejection phase. The end-diastolic wall
thickness ofthe posterior wall was measured using routine grayscale 2-dimensional
imaging. LV end-diastolic volume, LV end-systolic volume (ESV), and EF were
calculated from the apical 2-chamber and 4-chamber images using the biplane
Simpson's technique. 13 For patients with atrial fibrillation, measurements of
standard echocardiographic and speckle-tracking parameters were obtained as the
averages of~ 3 consecutive cardiac cycles. Response to CRT was defined as reverse
remodeling detected by a relative decrease in end-systolic volume ~ 15% from
baseline. 14, 15 Patients were defined as nonresponders if they did not show the above
prespecified echocardiographic changes. Mitral regurgitation was visually assessed
on the basis of the ratio of regurgitant jet area to left atrial area as none (grade 0),
mild (grade I), moderate (grade 2), severe (grade 3).
LV Dyssynchrony Analysis
Speckle tracking of routine grayscale mid-LV short-axis images was
performed as previously described to assess LV dyssynchrony.16-18 The
measurements were performed offline using dedicated software (EchoPAC version
BT06; GE-Vingmed Ultrasound AS). Briefly, an end-systolic circular region of
4
interest was traced on the endocardial cavity using a point-and-click approach, with
special care taken to adjust tracking of all endocardial segments. A second and larger
concentric circle was then automatically generated and manually adjusted near the
epicardium. Speckle tracking automatically analyzed frame-by-frame movement of
the stable patterns of natural acoustic markers, or speckles, over the cardiac cycle.
Significant LV dyssynchrony was defined as a time difference> 130 ms between the
anteroseptal and posterior wall peak strain 16-18 (Figure I).
Regional Myocardial Functional Analysis
Regional myocardial function was quantified using AFI. The measurements
were performed offline using dedicated software (EchoPAC version BT06). This
technique was based on 2-dimensional speckle-tracking imaging that can be used for
the assessment of regional longitudinal strain of the left ventricle and was performed
as previously described in detail. ll , 12, 19 Briefly, the mitral annulus and LV apex with
3 index points in the standard 3 apical views were defined at end-systole. The LV
end-systolic frame was defined in the apical long-axis view, and the closure of the
aortic valve was marked. The time interval between the R wave and aortic valve
closure was used as a reference for the 4-chamber and 2-chamber view 100pS.19 The
software then automatically detected the endocardium and tracked myocardial
motion during the entire cardiac cycle. The left ventricle was automatically divided
into 6 segments for each apical view and the peak systolic longitudinal strain was
displayed for each plane, after which the results for all 3 images were combined into
a single bull's-eye summary using a 17-segment model (Figure 2), which was
automatically translated from the I8-segment model (Figure 3A). Myocardial
5
lengthening (positive value) is color-coded red and shortening (negative value) blue
(Figure 2). Inadequately tracked segments determined by a tracking score obtained
with the speckle-tracking algorithm were automatically excluded from analysis. If
the tracking by AFI was poor, the region of interest was manually fine-tuned using
visual assessment during the cine loop play to ensure that all segmental wall motions
were included throughout the cardiac cycle. In this study, two different types of
regional myocardial functional indices were determined by AFI: E-global was
calculated as the average of all 17 segments and E-pl as the average of 4 posterior and
lateral segments in which the LV pacing lead was positioned (Figure 3B). In normal
subjects, longitudinal strain values are generally negative, with a larger negative
value indicating greater longitudinal strain. The peak longitudinal strain was used for
regional myocardial functional analysis by AFI. In cases of segments with positive or
biphasic strain curves, a peak-positive or a larger peak strain was used, respectively.
Pacemaker Implantation and LV Pacing Lead Position
The LV pacing lead was inserted transvenously via the subclavian route in 38
patients, and the epicardial surgical approach was used for remaining 2 patients. The
LV pacing lead was positioned in the lateral or posterolateral vein, corresponding to
segments I to 4 in the 17-segment LV model (Figure 3B). Device implantation was
successful in all patients, without major complications. After implantation, the atrio
ventricular interval was optimized for maximal diastolic filling using Doppler
echocardiography.2o
Statistical Analysis
All parametric data are expressed as mean ± SD. Group comparisons
6

between before and after CRT were performed using the paired t test and group
comparisons between responders and nonresponders using the unpaired t test.
Proportional differences were evaluated using Fisher's exact test or the X2 test as
appropriate. Correlation analysis was performed using linear regression, and results
are expressed as Pearson's correlation coefficient. Analysis of the receiver operating
characteristic curve was used to assess the optimal cutoff values to predict response
to CRT. For all tests, P values < 0.05 were considered statistically significant.
RESULTS
Patient Characteristics
Thirty patients (75%) were considered responders 4 ± 2 months after CRT
according to the predefined criteria, and the remaining 10 patients (25%) were
classified as nonresponders. Baseline echocardiographic characteristics of responders
and nonresponders were similar (Table 1). Compared with nonresponders, responders
tended to have smaller LV volumes and larger dyssynchrony, although the difference
was not statistically significant (Table 1). Of the 6 patients with atrial fibrillation, 2
underwent atrioventricular junction ablation at the same time as CRT, and 2 were
defibrillated first, and their atrial fibrillation disappeared after CRT. All 6 patients
with atrial fibrillation received digoxin, f3-blockers, and amiodarone for rate control
before CRT. The LV lead position was assessed from a chest x-ray using the frontal
and lateral views.21 The LV pacing lead was positioned mid lateral (n=21), basal
lateral (n=2), mid posterior (n=13), and basal posterior (n=4). These lead positions
corresponded to segments 1, 2, 3, and 4, respectively, in Figure 3B. Overall, speckle-
7

tracking analysis by AFI was possible for 97% of the 1,360 segments from 40
subjects (baseline and follow-up), with technically adequate images subjected to the
analysis, so that only 3% had to be excluded. Interobserver and intraobserver
variability were 8.4% and 4.9% for E-global, 5.4% and 6.9% for E-pl, and 4.2% and
1.8% for LV dyssynchrony, respectively.
Impact of Regional Myocardial Function on Response to CRT
Values of E-global in both responders and non-responders were similar (-6.7 ±
3.0% vs. -5.1 ± 2.4%, P=NS), but the negative value of E-pl in responders was
significantly higher than that in nonresponders at baseline (-7.8 ± 6.9% vs -2.1 ±
4.9%, P < 0.01; Figure 4). After CRT, the negative value of E-global increased
significantly in responders from -6.7 ± 3.0% to -11.4 ± 3.8% (P < 0.01 vs baseline)
but remained virtually unchanged in nonresponders from -5.1 ± 2.4% to -6.6 ± 1.6%
(Figure 5). Figure 6 shows representative images of the bull's-eye map produced by
AFI for responders and nonresponders before and after CRT. Receiver operating
characteristic curve analysis was performed to obtain the optimal cutoff value of E-pl
for predicting response to CRT. A E-pl of -7.8% had 90% sensitivity and 60%
specificity for the prediction of response to CRT. Twenty-eight patients (70%)
showed evidence of LV dyssynchrony at baseline, defined as a time difference> 130
ms between the anteroseptal and posterior wall peak strain. The response rate after
CRT for patients with dyssynchrony was 75%. Furthermore, patients with both
significant dyssynchrony and E-pl < -7.8% determined by receiver operating
characteristic curve analysis were associated with a high incidence of LV functional
improvement, with a response rate of92%.
8

Relationship Between LV EF and LV Longitudinal Strain
At baseline, E-global correlated significantly with EF (r = -0.34, P < 0.05;
Figure 7A). Furthennore, an even closer correlation was found between E-global and
EF after CRT (r = -0.84, P < 0.0001; Figure 7B).
Changes in LV Dyssynchrony After CRT
After CRT, LV dyssynchrony improved in responders from 272 ± 154 to 53
± 39 ms (P < 0.001) but remained virtually unchanged in nonresponders, from 216 ±
151 to 168 ± 66 ms (Table 1). The improvement in LV dyssynchrony correlated with
a relative increase in EF after CRT (Figure 8).
DISCUSSION
This study demonstrates that regional myocardial systolic function in the
posterolateral wall, where the LV pacing lead was positioned, was associated with
response to CRT. Importantly, combining LV mechanical dyssynchrony with
posterolateral myocardial systolic function assessed by AFI was more useful for
predicting response to CRT than dyssynchrony parameters alone.
CRT is an established therapeutic option for patients with advanced HF.
Previous studies have demonstrated that CRT reduces HR symptoms and improves
acute and chronic hemodynamics, exercise capacity, the quality of life, survival, and
LV systolic function. I-7,22 Randomized clinical trials have shown that up to one third
of patients with HF do not favorably respond to CRT when standard clinical selection
criteria are used, including the electrocardiographic QRS width. l, 3,4,7 Accordingly,
the quantification of LV mechanical dyssynchrony by echocardiography has emerged
9

as an important options for predicting response to CRT.
Assessment of LV Dyssynchrony
This study focused on radial thickening resulting from speckle tracking of
radial strain to assess LV dyssynchrony. The largest body of published studies on LV
dyssynchrony and prediction of response to CRT report their results in terms of LV
longitudinal shortening velocities using tissue Doppler imaging from the apical
views 14,23-25. However, the recent Predictors of Responders to CRT (PROSPECT)
study used several echocardiographic dyssynchrony indices, including tissue Doppler
imaging and suggested that dyssynchrony indices based on tissue Doppler velocity
could not replace routine selection criteria for CRT.26 Speckle-tracking
echocardiography, on the other hand, may be applied to routine grayscale images and
is not limited by the Doppler angle of incidence. As a result, speckle-tracking radial
strain analysis allows for an accurate quantification of regional wall thickening.
Suffoletto et ails demonstrated that baseline speckle-tracking radial dyssynchrony,
defined as a time difference ~ 130 ms between the anteroseptal and posterior wall
peak strain, predicted chronic EF response to CRT (8 ± 5 months after CRT) with
89% sensitivity and 83% specificity. Furthermore, several investigators have also
demonstrated the utility of speckle-tracking radial strain for predicting response to
CRT.16,17,27
Impact of Myocardial Function on Response to CRT
Although LV mechanical dyssynchrony has been associated with response to
CRT, some patients with LV mechanical dyssynchrony identified by
echocardiography do not respond to CRT. Other factors, such as LV lead position or
10
scar burden, may influence response to CRT, regardless of LV dyssynchrony.
Previous investigators have reported that myocardial viability or scar tissue is an
important marker for the response to CRT.s-IO In this study, we showed that the
posterolateral systolic function where the LV pacing lead was positioned in
responders was significantly higher than that in nonresponders (-7.8 ± 6.9% vs -2.1 ±
4.9%). This was recently corroborated by Bleeker et aI,s who demonstrated that
patients with transmural scar in the posterolateral region assessed by contrast
enhanced magnetic resonance imaging did not respond to CRT, whereas 81 % of the
patients without posterolateral scar responded well to CRT. In addition, Hummel et
al,9 using contrast echocardiography to identify myocardial viability, reported similar
findings for 21 patients with ischemic cardiomyopathy; viability in the posterior and
lateral regions correlated with improvement in LV EF after 6 months of CRT.
Furthermore, Ypenburg et al,10 using single photon-emission computed tomography
with 99mTc tetrofosmin to identify posterolateral myocardial viability, reported
similar findings for 51 patients with ischemic cardiomyopathy. In addition, we
observed that combining speckle-tracking radial dyssynchrony ~ 130ms with
posterolateral myocardial systolic function assessed by AFI < -7.8% was more useful
for predicting response to CRT than speckle-tracking radial dyssynchrony parameters
alone (92% vs 75%). With this method, we observed significant differences between
responders and nonresponders in myocardial systolic function assessed by API in the
LV pacing target region. These data provide further support for the need for
assessment of myocardial systolic function in the region of the LV pacing lead in
addition to LV dyssynchrony only when selecting patients for CRT.
11

Impact of LV Lead Location
Although the LV lead is routinely positioned in a posterior or lateral
epicardial vein through the coronary sinus, previous investigators have inferred that
LV lead position affects patient response to CRT. Ansalone et al2s demonstrated that
LV lead placement at the most delayed segment resulted in the greatest immediate
improvements after CRT. They also showed that the LV segment with the greatest
delay in activation was most commonly the posterior or lateral wall. Becker et ai,
using 2-dimensional speckle-tracking circumferential strain29 or real-time 3-
dimentional echocardiography,30 found that patients who had the LV lead tip position
concordant with the site of the latest mechanical activation had greater degrees ofEF
increase after CRT than patients with discordant LV lead positioning.
AFI
AFI is based on 2-dimensional speckle-tracking imaging, which is applied to
. I . d . 1" db h D 1 If"d II 12 19 routme graysca e Images an IS not ImIte y t e opp er ang e 0 mCI ence. ' ,
Therefore, speckle-tracking strain analysis allows for accurate quantification of
regional myocardial function. Because AFI can assess regional longitudinal strain
from 17 LV segments as a bull's-eye map, this technique facilitates a rapid visual
assessment of regional myocardial systolic function.
Relationship Between Two Indices of Global LV Systolic Function
Several authors have demonstrated the relationship between regional and
global systolic function. 19, 27, 31 Delgado et al19 reported that regional systolic
function assessed by AFI was linearly related to biplane EF. We previously reported
regional myocardial systolic function assessed by tissue Doppler strain rate imaging
12

was closely correlated with biplane EF in patients with coronary artery disease.27 In
this study, E-global was found to correlate with EF at baseline, and an even closer
correlation was observed after CRT. Time to peak systolic strain of each of the
segments was dispersed at baseline in the presence of LV dyssynchrony, so that
correlation of EF and E-global may not be so close before CRT. Our results suggest
that E-global correlated closely with EF ifno substantial LV dyssynchrony was
present.
Study Limitations
This study included a small number of patients, and future larger studies are
needed to further elucidate the role of regional myocardial systolic function for
predicting response to CRT. Another limitation is that only 23% of the study
population consisted of patients with ischemic cardiomyopathy, so that the beneficial
response to CRT is somewhat higher than in previous studies. Although the exact
reason remains unknown, one possible reason might be the difference of the etiology
between patients with chronic severe HF in Japan and other areas, especially the
United States and Europe. Osada et ae2 reported 80% of patients with chronic severe
HF among 284 applicants for heart transplantation in Japan were diagnosed with
idiopathic dilated cardiomyopathy.
This study population was not homogeneous, because patients in sinus
rhythm (n = 24), atrial fibrillation (n = 6), and previous implantations of permanent
right ventricular pacemakers (n=1 0) were included. This heterogeneity may have
affected the baseline data or response to CRT. Although current criteria for
consideration of CRT do not include patients with HF with previous implantations of
13

permanent right ventricular pacemakers, upgrading of right ventricular pacing
systems to CRT devices has become routine in many centers. Moreover, several
investigators have reported that such upgrading was associated with long-term effects
on mortality and morbidity similar to those for HF patients undergoing de novo
CRT?3-35
Because this was a 2-dimensional study, it was not possible to simultaneously
acquire 3 different apical views for the assessment of regional myocardial function
by AFI. However, the R-R interval was similar (variation < 10%), and the frame rate
was the same for each of the 3 different apical views in all patients. A newly
developed 3-dimensional speckle-tracking system appears to be a possible solution
for this problem.
Although several authors have suggested that scar burden or scar location
might affect the response to CRT,8-1O, 36 in this study we could not quantify
myocardial scar burden or scar location by means of magnetic resonance imaging or
myocardial perfusion imaging.
CONCLUSIONS
The reduced myocardial systolic function assessed by AFI in the region of the
LV pacing lead was associated with inadequate LV resynchronization and resulted in
nonresponse to CRT. The addition of posterolateral myocardial systolic function to
measurement of dyssynchrony appears to be of value for predicting response to CRT
and has potential clinical applications.
14

ACKNOWLEDGMENT
We wish to thank Dr Marie Stugaard for her critical proofreading of this
manuscript.
15

REFERENCES
1. Abraham WT, Fisher WG, Smith AL, Delurgio DB, Leon AR, Loh E, et al.
Cardiac resynchronization in chronic heart failure. N Engl 1 Med
2002;346: 1845-53.
2. Abraham WT, Hayes DL. Cardiac resynchronization therapy for heart failure.
Circulation 2003; 1 08:2596-603.
3. Cleland lG, Daubert lC, Erdmann E, Freemantle N, Gras D, Kappenberger L,
et al. The effect of cardiac resynchronization on morbidity and mortality in
heart failure. N Engl 1 Med 2005;352:1539-49.
4. Bristow MR, Saxon LA, Boehmer 1, Krueger S, Kass DA, De Marco T, et al.
Cardiac-resynchronization therapy with or without an implantable
defibrillator in advanced chronic heart failure. N Engl 1 Med 2004;350:2140-
50.
5. Leclercq C, Faris 0, Tunin R, 10hnson 1, Kato R, Evans F, et al. Systolic
improvement and mechanical resynchronization does not require electrical
synchrony in the dilated failing heart with left bundle-branch block.
Circulation 2002;106:1760-3.
6. Leclercq C, Hare 1M. Ventricular resynchronization: current state of the art.
Circulation 2004; 1 09:296-9.
7. Linde C, Leclercq C, Rex S, Garrigue S, Lavergne T, Cazeau S, et al. Long
term benefits ofbiventricular pacing in congestive heart failure: results from
the MUltisite STimulation in cardiomyopathy (MUS TIC) study. 1 Am Coli
Cardiol 2002;40: 111-8.
16
8. Bleeker GB, Kaandorp TA, Lamb HJ, Boersma E, Steendijk P, de Roos A, et
al. Effect of posterolateral scar tissue on clinical and echocardiographic
improvement after cardiac resynchronization therapy. Circulation
2006;113:969-76.
9. Hummel JP, Lindner JR, BeIcik JT, Ferguson JD, Mangrum JM, Bergin JD, et
al. Extent of myocardial viability predicts response to biventricular pacing in
ischemic cardiomyopathy. Heart Rhythm 2005;2:1211-7.
10. Ypenburg C, Schalij MJ, Bleeker GB, Steendijk P, Boersma E, Dibbets
Schneider P, et al. Impact of viability and scar tissue on response to cardiac
resynchronization therapy in ischaemic heart failure patients. Eur Heart J
2007;28:33-41.
11. Belghitia H, Brette S, Lafitte S, Reant P, Picard F, Serri K, et al. Automated
function imaging: a new operator-independent strain method for assessing left
ventricular function. Arch Cardiovasc Dis 2008;101 :163-9.
12. Bansal M, Cho GY, Chan J, Leano R, Haluska BA, Marwick TH. Feasibility
and accuracy of different techniques oftwo-dimensional speckle based strain
and validation with harmonic phase magnetic resonance imaging. J Am Soc
Echocardiogr 2008;21: 1318-25.
13. Lang RM, Bierig M, Devereux RB, FlachskampfFA, Foster E, Pellikka PA,
et al. Recommendations for chamber quantification: a report from the
American Society of Echocardiography's Guidelines and Standards
Committee and the Chamber Quantification Writing Group, developed in
conjunction with the European Association of Echo cardiography, a branch of
17
the European Society of Cardiology. J Am Soc Echocardiogr 2005;18:1440-
63.
14. Yu CM, Fung JW, Zhang Q, Chan CK, Chan YS, Lin H, et al. Tissue Doppler
imaging is superior to strain rate imaging and postsystolic shortening on the
prediction of reverse remodeling in both ischemic and nonischemic heart
failure after cardiac resynchronization therapy. Circulation 2004; 11 0:66-73.
15. Yu CM, Wing-Hong Fung J, Zhang Q, Sanderson JE. Understanding
nonresponders of cardiac resynchronization therapy--current and future
perspectives. J Cardiovasc Electrophysiol 2005; 16: 1117-24.
16. Gorcsan J, 3rd, Abraham T, Agler DA, Bax JJ, Derumeaux G, Grimm RA, et
al. Echocardiography for cardiac resynchronization therapy:
recommendations for performance and reporting--a report from the American
Society of Echocardiography Dyssynchrony Writing Group endorsed by the
Heart Rhythm Society. J Am Soc Echocardiogr 2008;21 :191-213.
17. Gorcsan J, 3rd, Tanabe M, Bleeker GB, Suffoletto MS, Thomas NC, Saba S,
et al. Combined longitudinal and radial dyssynchrony predicts ventricular
response after resynchronization therapy. J Am CoIl CardioI2007;50:1476-83.
18. Suffoletto MS, Dohi K, Cannesson M, Saba S, Gorcsan J, 3rd. Novel speckle
tracking radial strain from routine black-and-white echocardiographic images
to quantify dyssynchrony and predict response to cardiac resynchronization
therapy. Circulation 2006; 113 :960-8.
19. Delgado Y, Mollema SA, Ypenburg C, Tops LF, van der Wall EE, Schalij MJ,
et al. Relation between global left ventricular longitudinal strain assessed
18

with novel automated function imaging and biplane left ventricular ejection
fraction in patients with coronary artery disease. J Am Soc Echocardiogr
2008;21: 1244-50.
20. Ishikawa T, Sumita S, Kimura K, Kikuchi M, Kosuge M, Kuji N, et al.
Prediction of optimal atrioventricular delay in patients with implanted DDD
pacemakers. Pacing Clin Electrophysiol 1999;22: I 365-71.
21. Molhoek SO, Bax JJ, van Erven L, Bootsma M, Boersma E, Steendijk P, et al.
Effectiveness of resynchronization therapy in patients with end-stage heart
failure. Am J CardioI2002;90:379-83.
22. Cazeau S, Leclercq C, Lavergne T, Walker S, Varma C, Linde C, et al. Effects
of multisite biventricular pacing in patients with heart failure and
intraventricular conduction delay. N Engl J Med 2001;344:873-80.
23. Bax JJ, Bleeker OB, Marwick TH, Molhoek SO, Boersma E, Steendijk P, et
al. Left ventricular dyssynchrony predicts response and prognosis after
cardiac resynchronization therapy. J Am ColI Cardiol 2004;44: 1834-40.
24. Oorcsan J, 3rd, Kanzaki H, Bazaz R, Dohi K, Schwartzman D. Usefulness of
echocardiographic tissue synchronization imaging to predict acute response
to cardiac resynchronization therapy. Am J Cardiol 2004;93: 1178-81.
25. Yu CM, Chau E, Sanderson JE, Fan K, Tang MO, Fung WH, et al. Tissue
Doppler echocardiographic evidence of reverse remodeling and improved
synchronicity by simultaneously delaying regional contraction after
biventricular pacing therapy in heart failure. Circulation 2002; 1 05 :438-45.
26. Chung ES, Leon AR, Tavazzi L, Sun JP, Nihoyannopoulos P, Merlino J, et al.
19

Results of the Predictors of Response to CRT (PROSPECT) trial. Circulation
2008; 117 :2608-16.
27. Tanaka H, Kawai H, Tatsumi K, Kataoka T, Onishi T, Nose T, et al. Improved
regional myocardial diastolic function assessed by strain rate imaging in
patients with coronary artery disease undergoing percutaneous coronary
intervention. J Am Soc Echocardiogr 2006; 19:756-62.
28. Ansa10ne G, Giannantoni P, Ricci R, Trambaio10 P, Fedele F, Santini M.
Doppler myocardial imaging to evaluate the effectiveness of pacing sites in
patients receiving biventricular pacing. J Am ColI CardioI2002;39:489-99.
29. Becker M, Kramann R, Franke A, Breithardt OA, Heussen N, Knackstedt C,
et al. Impact of left ventricular lead position in cardiac resynchronization
therapy on left ventricular remodelling. A circumferential strain analysis
based on 20 echocardiography. Eur Heart J 2007;28:1211-20.
30. Becker M, Hoffmann R, Schmitz F, Hundemer A, Kuhl H, Schauerte P, et al.
Relation of optimal lead positioning as defined by three-dimensional
echocardiography to long-term benefit of cardiac resynchronization. Am J
CardioI2007;100:1671-6.
31. Moller JE, Hillis GS, Oh JK, Reeder GS, Gersh BJ, Pellikka PA. Wall motion
score index and ejection fraction for risk stratification after acute myocardial
infarction. Am Heart J 2006; 151 :419-25.
32. Osada K, Imaizumi T. Special report from the heart transplant candidate
registry committee in Japan. J Heart Lung Transplant 2005;24:810-4.
33. Leon AR, Greenberg JM, Kanuru N, Baker CM, Mera FV, Smith AL, et al.
20

Cardiac resynchronization in patients with congestive heart failure and
chronic atrial fibrillation: effect of upgrading to biventricular pacing after
chronic right ventricular pacing. J Am ColI Cardiol 2002;39: 1258-63.
34. Tops LF, Suffoletto MS, Bleeker GB, Boersma E, van der Wall EE, Gorcsan J,
3rd, et al. Speckle-tracking radial strain reveals left ventricular dyssynchrony
in patients with permanent right ventricular pacing. J Am ColI Cardiol
2007;50: 1180-8.
35. Vatankulu MA, Goktekin 0, Kaya MG, Ayhan S, Kucukdurmaz Z, Sutton R,
et al. Effect of long-term resynchronization therapy on left ventricular
remodeling in pacemaker patients upgraded to biventricular devices. Am J
Cardiol 2009; 1 03: 1280-4.
36. Adelstein EC, Saba S. Scar burden by myocardial perfusion imaging predicts
echocardiographic response to cardiac resynchronization therapy in ischemic
cardiomyopathy. Am Heart J 2007;153:105-12.
21

FIGURE LEGENDS
Figure 1 An example of a 2-dimensional midventricular short-axis image
demonstrating radial time strain curves in a patients with heart failure with left
bundle branch block. Dyssynchrony is shown as the time difference (arrow) between
the peak strain in the anterior septum (yellow curve) and in the posterior wall (purple
curve).
Figure 2 An example of a bull's-eye map generated by AFI from 3 standard apical
views. Myocardial lengthening is color-coded red and shortening blue.
Figure 3 A) Method for translation from the IS-segment model to the I7-segment
model showing apical LV short-axis images. (GE Healthcare) B) The LV pacing lead
was positioned in the lateral or posterolateral vein, corresponding to segments 1 to 4
in the LV 17-segment model.
Figure 4 Bar graphs of mean E-global and E-pl values for responders and
nonresponders at baseline. Values of E-global for both responders and nonresponders
were similar, but the negative value of E-pl was significantly higher for responders
than that for nonresponders.
Figure 5 Bar graphs of mean E-global values for responders and nonresponders at
baseline and after CRT. The negative value of E-global increased significantly in
responders but did not increase in nonresponders.
Figure 6 LV 17-segment bull's-eye map presentation of regional strain before and
after CRT in representative cases of a responder (A) and a nonresponder (B). ANT,
Anterior; ANT_SEPT, anteroseptal; INF, inferior; LAT, lateral; POST, posterior;
SEPT, septal.
22

Figure 7 (A) Scatterplot showing the correlations between E-global and EF before
CRT, demonstrating significant correlation. (B) Scatterplot showing the correlations
between E-global and EF after CRT, demonstrating closer correlation than before
CRT.
Figure 8 Scatterplot showing the correlation between change in LV dyssynchrony
and relative increase LV EF, demonstrating a significant correlation.
23

TABLE
Table 1. Baseline characteristics of patients and their responses to CRT
All patients Responders N onresponders (n=40) (n=30) (n=lO)
Age (y) 67±12 68±12 66±10 Men/women 30110 22/8 8/2 NYHA class (III/IV) 28112 22/8 6/4 QRS duration (ms) 163±25 164±25 161±26 Left bundle branch block 22 (55%) 19 (63%) 3 (30%) Rhythm (SRlAFlPaced) 24/6/10 19/3/8 5/3/2 HR ( beats/min) 73±13 73±13 74±11 PR duration (ms) 188±29 187±28 191±35 Posterior wall thickness (mm) 10±2 10±2 10±2 Mitral regurgitation grade (011/2/3) 27112/1/0 21/9/0/0 6/311/0 Etiology (ischemic/non ischemic ) 9/31 6/24 317 Medication
Diuretics 34 (85%) 24 (80%) 10 (100%) ACE inhibitors/ARBs 37 (93%) 28 (93%) 9 (90%) P-blockers 33 (83%) 25 (83%) 8 (80%)
Ejection fraction (%) Baseline 25±8 25±9 26±6 Follow-up 35±14 39±14* 24±5
End-diastolic volume (mL) Baseline 170±77 154±56 217±109 Follow-up 139±80 113±51 * 216±104
End-systolic volume (mL) Baseline 13l±67 119±53 I 66±95 Follow-up 95±69 72±44 * 165±82
LV dyssynchrony (ms) Baseline 258±154 272±154 216±151 Follow-u2 81±68 53±39* 168±66
ACE, Angiotensin-converting enzyme; AF, atrial fibrillation; ARB, angiotensin type 1 receptor blocker; NYHA, New York Heart Association; SR, sinus rhythm. Data are presented as means ± SD or as number. * P < 0.05 vs baseline.
24

Figure 1
25

Figure 2
26

Figure 3
A) 17-segment model
Value (A) = 2/3*[Value (0) + 0.5*Value (1)] Value (B) = 2/3* [Value (2) + 0.5*Value (1)] Value (C) = 2/3* (Value (3) + O.S*Value (4)] Value (D) = 2/3* (Value (5) + 0.5*Value (4)]
18-segment model
Value (E) = l/6*[Value (0) + Value (1) + Value (2) + Value (3) + Value (4) + Value (5)
B) Anterior Septum
Inferior
Posterior
27
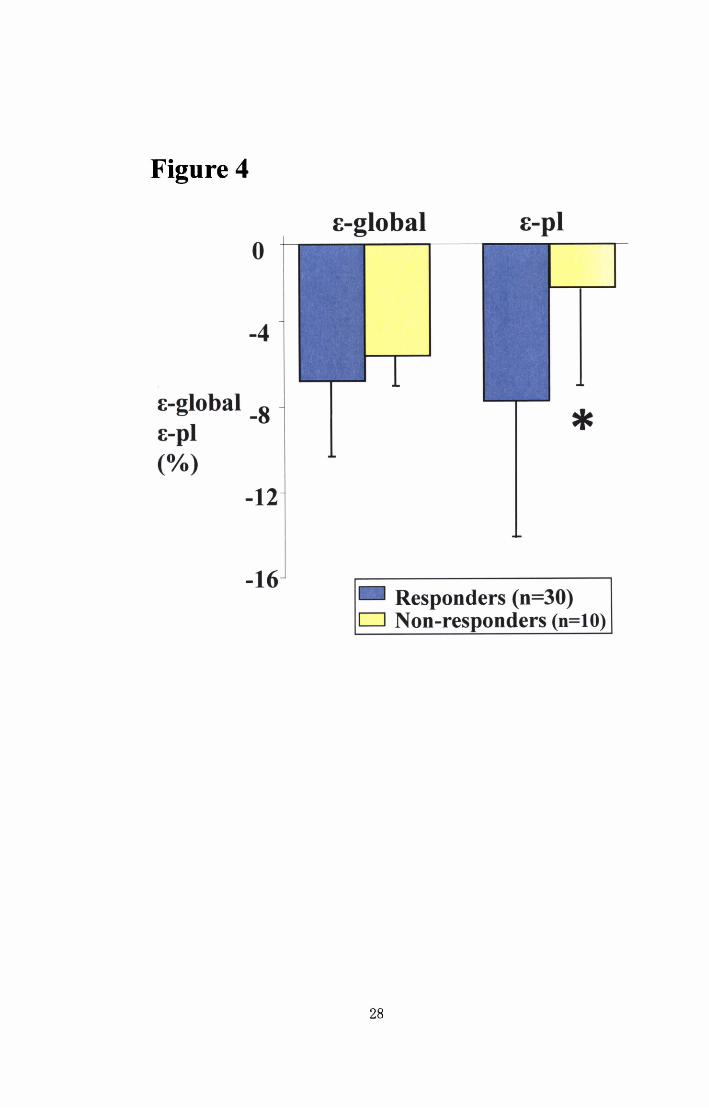
Figure 4
o
-4
E-global -8 E-pl (0/0)
-12
-16
E-global E-pl
*
Responders (n=30) CJ Non-responders (0=10)
28

Figure 5
o
-2
-4
[-global (%) -6
-8
-1
-1
-1
Responders (n=30)
Non-responders (n=10)
* Baseline CJ After CRT
29

Figure 6
A) Responder
Before CRT
B) Non-responder
Before CRT
After CRT
After CRT
30

Figure 7
A) Before CRT
Ejection Fraction (%)
60 r=-0.34
40 p<0.05
20 • •
•
B) After CRT
Ejection Fraction (Of.,)
60 r=-0.84 •
40 • •
• 20
o -20 -15 -10 -5 00 -20 -15 -10 -5 0
E-global (%) E-global (Of.,)
Figure 8
Relative Increase in Ejection Fraction (Of.,)
20 r=0.56 p<O.OOI •
• •
50
o • • •
~O~----~----~-----'----~----~ -200 0 200 400 600 800
Change in Left Ventricular Dyssynchrony (ms)
31