lata report 2015 - kylie pepplerkpeppler.com/docs/2015_peppler_lata_report.pdf ·...
TRANSCRIPT

LEARNING AND ACHIEVING THROUGH THE ARTS
A Collaborative Project of Inner-‐City Arts, Los Angeles Unified School District (LAUSD), the Center for Research
on Creativity (CRoC), and Indiana University
Funded by the U.S. Department of Education, Arts in Education Model Development and Dissemination Program
Executive Summary and Evaluation Report Principal Investigators: Kylie A. Peppler, Indiana University and James S. Catterall,
Center for Research on Creativity (CRoC), and Guest Writer: Sophia Bender, Indiana University
1
Executive Summary The Learning and Achieving Through the Arts (LATA) Project is a partnership project between Los Angeles Unified School District (LAUSD) and Inner-‐City Arts (ICA). The project implemented a collective and systemic model for bringing arts integration to the core of learning in elementary schools, and comprised three interconnected strands: (1) Providing students high quality, standards-‐based, sequential instruction in the arts to cultivate arts skills while fostering language development; (2) Providing gateway experiences, extended professional development, and supportive coaching for non-‐arts classroom teachers to grow their potential as art educators; and (3) Augmenting these activities with additional experiences that encourage whole schools to embrace arts strategies and build creative learning classrooms. The LATA evaluation summarized herein was implemented in six elementary schools (a total of 3 treatment and 3 control schools) in the Los Angeles Unified School District (LAUSD) from 2010-‐2013.
The first strand involved moderate enhancement to the 7-‐week arts instructional sessions already in place at ICA, by extending some of them to 14 weeks. For purposes of achieving intended outcomes, instruction was extended from the original model to include two sessions over the course of one year, augmented by sequential learning as students proceeded through grade levels made possible by the inclusion of all grade 2–6 classrooms. Students bussed to the Inner-‐City Arts campus, where sessions were conducted during the regular school day in state-‐of-‐the-‐art studio environments. Instruction in multiple art forms (for example, Visual Arts, Ceramics, Theater, Dance, Music, Animation) was provided through the delivery of multi-‐week arts instructional sessions centered on California Visual and Performing Arts (VAPA) Content Standards. Seven-‐ and fourteen-‐week, twice-‐weekly sessions served as an integral component of the regular school curriculum. Students attended two sessions over the course of 12 months for a total of between 35 and 70 hours of instruction.
The second strand, professional development, involved a multi-‐tiered training process occurring over the course of more than one year, enabling elementary teachers to develop strategies for arts integration and establish creative learning communities in their classrooms. Art instructors and educators facilitated the integration process through coaching and the sharing of information concerning research-‐based integration practices.
The third strand, building arts-‐enriched school communities, was set in motion through the arts instructional and professional development activities, and further augmented through school-‐wide training and family events, fostering enthusiasm for arts infusion throughout the school environment.
The goal of this evaluation was to gauge the effectiveness of the LATA model design, strategies, and curricula in order to establish the program’s validity to foster effective dissemination of a productive model. Within this goal the following objectives are addressed in this report:
• Evaluate the effectiveness of the LATA model, measuring high achievement among students, attaining high-‐level standards across content areas. This includes:
o Improving the standardized test scores of students participating in the model, in both English language arts (ELA) and math
! We measured this by using publicly available standardized test score data. o Focusing in particular on raising the ELA test scores of English language learners (ELLs)

2
! For this, we again used public standardized test data, as well as demographic information publicly reported by the schools.
o Providing evidence of learning within the art forms for which students received instruction ! We created two scoring instruments to measure this: one for animation and one for
drama/theater. Over the course of this study, a drama instrument was created to estimate overall learning in the art form by systematically scoring student performance on the “name-‐and-‐a-‐movement” warm-‐up exercise. This exercise was scored across four sub-‐scales, reaching advanced levels of development, and able to demonstrate evidence of learning within this art form. Likewise, animation learning was assessed by systematically scoring students’ still frame animation performance in their zoetrope animations.
o Providing evidence of enhanced creativity among students participating in LATA ! We used Amabile’s (1982) Consensual Assessment Technique (CAT) to assess the
creativity of students’ drama performances before and after they participated in the program. The CAT is an external rating of the creative product most often applied by expert raters in the field. This technique was used to our knowledge for the first time to successfully evaluate creativity in drama.
• Advance sustained school-‐wide improvement in classroom instruction through professional development and related activities that bring the arts to the core of all learning school-‐wide. This includes:
o Students improving in both engagement and motivation to learn ! For this, we used a Student Sense of Community survey adapted from the
Developmental Studies Center’s (2005) Child Development Project Student Questionnaire for Elementary Students.
o Teachers improving their perception of their schools’ professional learning community ! We used the Professional Learning Communities Assessment-‐Revised (PLCA-‐R) to
evaluate this outcome. o Participating teachers improving their integration of the arts into their regular teaching
! To evaluate this measure, we used selected subscales from ICA’s arts integration survey for teachers.
o Teachers enhancing their classrooms’ creative learning communities ! This also came from subscales in ICA’s arts integration survey.
To aid in discerning the effects of the LATA model, three LAUSD control schools not receiving services from ICA were matched with the three treatment schools that participated in LATA. In order to ensure reasonable comparability, the control schools were matched with the treatment schools on more than 30 criteria, including similar multi-‐ethnic makeup, similarly high proportions of ELLs, and similarly high proportions of students in the Free and Reduced Price Lunch (FRPL) program.
Results of the evaluation strongly support the efficacy of the LATA model, favoring treatment group comparisons across nearly all measures.
When compared to the control schools, treatment school CST-‐M (mathematics) standardized test scores rose from comparability at the beginning to a statistically significant advantage throughout all three years of the program (p < 0.05). Standardized math test scores rose for treatment schools from 68% of students reaching proficiency at baseline to an average of 74.5% over the course of the three years of
3
the program (a 6.5% average gain over the baseline). During the same period, the control schools demonstrated a 3.5% average gain over the baseline. These were statistically significant differences between the treatment and control schools (p < 0.05), favoring the treatment schools.
Similar gains were observed in CST-‐ELA (English language arts) standardized test scores, except that the treatment schools started out significantly behind the control schools at baseline, but ended up significantly higher (p < 0.05) than control counterparts throughout all three years of the program. Standardized ELA test scores rose for treatment schools from 50% proficiency at baseline to an average of 61% over the course of the program (an 11% average gain over the baseline). During the same period, the control schools had a decline of a 1% average loss under the baseline. These were statistically significant differences between the treatment and control schools (p < 0.05), favoring the treatment schools.
Moreover, treatment-‐school English language learners’ (ELLs’) CST-‐ELA test score results improved to an even greater extent than the whole-‐school populations’ scores did. While also starting out with scores significantly behind those of the control schools, ELL students’ scores significantly surpassed control ELL students’ scores (p < 0.05) throughout the three years of the program. Standardized ELA test scores rose for ELLs in treatment schools from 28% proficiency at baseline to an average of 43% proficiency over the course of the program (a 15% average gain over the baseline). During the same period, the control schools had a decline of a 1% average loss under the baseline. These were statistically significant differences between the treatment and control schools (p < 0.05), favoring the treatment schools.
This evidence consistently suggests that engaging in intensive arts instruction and high-‐quality arts integration through the LATA program had significantly positive effects on students’ standardized test scores and overall academic achievement.
Additionally, we examined the extent of arts learning among a sample of LATA participants. To do so, we designed a new assessment of student learning in the arts through a drama exercise both at the beginning of their LATA session (pretest), and at the end 14 weeks later (posttest). In order to see whether their proficiency in theater performance had improved, we also compared these results to those from an identical pretest and posttest administered to control classrooms. Results demonstrated that 70% of treatment students improved their drama performance between pre and post, as compared to 46% of control students who improved on the post. This difference is statistically significant (p < 0.05) between groups, favoring the treatment schools.
Amabile’s (1982) Consensual Assessment Technique (CAT) involves raters who are experts in a field rating the creativity of a set of products according to their own subjective definition of creativity. The CAT has never been used in the field of drama before, but our results showed that such a use is viable because it leads to the high inter-‐rater reliability that is a prerequisite for using the CAT. Thus we were able to glean from our expert rater’s creativity scoring that 33% of treatment students improved the creativity of their drama performances between pre and post, to an extent that approached significance (vs. 23% of control students whose creativity scores increased on the post). The creativity of treatment students’ performances was also rated as significantly (p < 0.05) higher than that of the control students’ creativity, even in the pre. This suggests that the LATA program (and perhaps the Inner-‐City Arts environment) had an effect on students’ creativity even very early on.
4
The Student Sense of Community survey asked students questions about their view of their school as a community, of their classroom as a community, their liking for school, and enjoyment of class. The survey was administered at both pre and post time points to students from both the treatment and control schools. Results of the Student Sense of Community survey indicated an increase of overall sense of community in 50% (94/188) of the treatment student group. While not many of the treatment-‐control comparisons were statistically significant, a greater percentage of treatment students increased their scores on the post in all subscales than did control students.
We also administered two surveys to treatment school teachers at two time points (pre and post) and control school teacher survey data at the end of the evaluation study for comparison. Treatment teachers showed improvements on both of these surveys. The first survey, the Professional Learning Communities Assessment-‐Revised (PLCA-‐R), measured teachers’ perceptions of their schools as professional learning communities. Treatment teachers’ scores on the PLCA-‐R significantly improved (p < 0.05) between pre and post. Their scores were also significantly higher (p < 0.05) than the control teachers’ scores.
The second survey administered to teachers, the Inner-‐City Arts (ICA) Arts Integration survey, measured many outcomes of interest to ICA. General findings from this survey showed that treatment teachers improved their integration of many art forms into their teaching, participated in more professional development by the post, and improved their classrooms’ creative learning communities.
Collectively, these results demonstrate that the LATA model successfully achieved the vast majority of its objectives throughout the project and brought a great deal of positive change to the elementary schools that participated, including measurable impact on student academic achievement in mathematics and English language arts (particularly among English language learners), student creativity and learning in the arts, and improved overall professional learning communities among teachers, particularly increasing participating teacher use of stand-‐alone and arts-‐integrated instruction.
5
Acknowledgments We would like to thank members of the Indiana University evaluation team, including Xiaowen Liu, Christian McKay, Tony Phonethibsavads, Naomi Thompson, Janis Watson, and Christy Wessel-‐Powell for their invaluable contributions to the analyses presented in this report. Special thanks as well to Inner-‐City Arts staff, Kim Zanti, Sarah Jean Johnson, and Rebecca Catterall and other members of the Center for Research on Creativity (CRoC) for their tireless efforts with ongoing data collection throughout this project.

6
1 INTRODUCTION 7
1.1 THE LATA ARTS INTEGRATION MODEL 8 1.2 GOALS AND OBJECTIVES 9 1.3 GUIDING THEORETICAL FRAMEWORK 10
2 EVALUATION OVERVIEW 11
2.1 SCHOOL AND PARTICIPANT SELECTION 11 2.2 OVERALL EVALUATION DESIGN 12
3 STANDARDIZED MEASURES OF ACADEMIC ACHIEVEMENT 13
3.1 OVERVIEW OF STANDARDIZED GPRA MEASURES (CST-‐M & CST-‐ELA) 13 3.2 MATHEMATICS TEST SCORE RESULTS 14 3.3 ENGLISH LANGUAGE ARTS TEST SCORE RESULTS 15 3.4 ELA TEST SCORE RESULTS FOR ENGLISH LANGUAGE LEARNERS 16
4 ARTS LEARNING MEASURES 18
4.1 ANIMATION LEARNING 18 4.1.1 DEVELOPMENT OF ANIMATION PERFORMANCE INSTRUMENT 18 4.1.2 CONTEXT FOR EVALUATION 20 4.1.3 ESTABLISHING OF INTER-‐RATER RELIABILITY 21 4.1.4 ANALYSIS OF ANIMATION LEARNING SCORES 22 4.2 DRAMA LEARNING 22 4.2.1 DEVELOPMENT OF DRAMA PERFORMANCE INSTRUMENT 23 4.2.2 CONTEXT FOR EVALUATION 28 4.2.3 ESTABLISHING OF INTER-‐RATER RELIABILITY 29 4.2.4 ANALYSIS OF DRAMA LEARNING SCORES 29
5 CREATIVITY MEASURES 34
5.1 THE USE OF THE CONSENSUAL ASSESSMENT TECHNIQUE IN DRAMA 34 5.1.1 RATERS AND SURVEY DESIGN 34 5.2 ANALYSIS OF CREATIVITY SCORES 36
6 SENSE OF COMMUNITY SURVEY MEASURES 38
6.1 CLASSROOM COMMUNITY SURVEY FOR STUDENTS 38 6.1.1 CONTENTS OF STUDENT SURVEY 38 6.1.2 RESULTS OF STUDENT SURVEY 38 6.2 PROFESSIONAL LEARNING COMMUNITIES ASSESSMENT-‐REVISED SURVEY 39 6.2.1 RESULTS OF PLCA-‐R SURVEY 40
7 TEACHER SURVEY ON OVERALL IMPACT OF ARTS INTEGRATION 43
7.1 RESULTS OF ARTS INTEGRATION SURVEY 43
8 CONCLUSION 49

7
LATA Final Report
1 INTRODUCTION The Learning and Achieving Through the Arts (LATA) Project was an arts integration model implemented by the non-‐profit arts education organization Inner-‐City Arts (ICA) in elementary schools in the Los Angeles Unified School District (LAUSD) during the years 2010-‐2013. At the project’s onset, the schools chosen for the program faced many challenges, including high levels of poverty, resource constraints, and a great deal of learners still in the process of learning English. In an atmosphere of high-‐stakes testing in which arts programs are among the first to be sacrificed in schools, the LATA program sought to show how more art, not less, could be a solution leading to whole-‐school improvement, even under such challenging circumstances. Through intensive ongoing arts instruction for students, whole-‐school professional development promoting integration of the arts into all subject areas, and celebration of the arts throughout the school and the wider community, the LATA project aimed to improve student learning both in the arts and in core subjects, infused the arts into more teachers’ teaching, and improved sense of community outcomes.
The LATA Project‘s collective and systemic model for bringing the arts to the core of learning comprised three interconnected strands: (1) Providing students high quality, standards-‐based, sequential instruction in the arts to cultivate arts skills while fostering language development; (2) Providing gateway experiences, extended professional development and supportive coaching for non-‐arts classroom teachers to grow their potential as art educators; and (3) Augmenting these activities with additional experiences that encourage whole schools to embrace the arts strategy and build creative learning classrooms.
The first strand involved moderate enhancement to the 7-‐week arts instructional sessions already in place at ICA, by extending some of them to 14 weeks. For purposes of achieving intended outcomes, instruction was extended from the original model to include two sessions over the course of one year, augmented by sequential learning as students proceeded through grade levels made possible by the inclusion of all grade 2–6 classrooms.
The second strand, professional development, involved a multi-‐tiered training process occurring over the course of more than one year, enabling elementary teachers to develop strategies for arts integration and establish creative learning communities in their classrooms. Art instructors and educators facilitated the integration process through coaching and the sharing of information concerning research-‐based integration practices.
The third strand, building arts-‐enriched school communities, was set in motion through the arts instructional and professional development activities, and further augmented through school-‐wide training and family events, fostering enthusiasm for arts infusion throughout the school environment.
8
While this strand was not a focus of the current evaluation efforts, it was nevertheless important to the overall success of the LATA model.
This report shares the results of the overall evaluation of the efficacy of the LATA model. In sum, the external evaluation found that standardized test scores significantly increased in both Mathematics and English language arts (ELA). The gains in ELA were particularly marked for English language learners (ELLs). Further, LATA students showed improvement in their arts learning and creativity as demonstrated through their theater performances after engaging in the program. Additionally, around half of the students showed increases in their sense of community after engaging in LATA, according to a survey measure. Surveys were also administered to teachers, who also reported an improved professional learning community as well as increases in arts integration strategies, improved creative learning communities, and increased parent involvement. Building upon this success, ICA continues to implement and continuously expand models similar to LATA.
1.1 THE LATA ARTS INTEGRATION MODEL Ongoing LATA core arts sessions were provided to students during the regular school day. Students bussed to the Inner-‐City Arts campus, where sessions were conducted in state-‐of-‐the art studio environments. Having completed a multi-‐phased campus expansion, Inner-‐City Arts offers state-‐of-‐the-‐art studio facilities, including a visual arts complex, performing arts complex, ceramics complex, Theater and Library. The facility offers students a learning environment that is unmatched within the under-‐resourced inner-‐city schools that students attend.
Instruction in multiple art forms (for example, Visual Arts, Ceramics, Theater, Dance, Music, Animation) was provided through the delivery of multi-‐week arts instructional sessions centered on California Visual and Performing Arts (VAPA) Content Standards. Seven-‐ and fourteen-‐week, twice-‐weekly sessions served as an integral component of the regular school curriculum. Students attended two sessions over the course of 12 months for a total of between 35 and 70 hours of instruction. The goal was to place the arts on the same level as other core subjects while serving the specific purpose of meeting literacy development needs.
Each session was focused on core content areas of one art form. The teaching of the elements and principles of the form was balanced with engagement in the creative process through exploration, creation and critique. This strategy enhanced language development and accessed the multiple intelligence capacities of all students.
Teaching Artists/Art Instructors led delivery of sessions. Lesson plans incorporated pedagogical methods that have proven effective in fostering language development, including cooperative learning, collaborative interaction, and sheltered instructional approaches that build on the students' experiences and cultural perspectives. In their participation in all sessions with their classrooms, teachers experienced new instructional skills and gained understanding of the relationship of those skills to the general curriculum. Through those experiences and through professional development offerings, they were able to better integrate the arts into classroom instruction by defining connections between the arts and across the curriculum. Student learning of content was the shared responsibility of classroom teachers and teaching artists through a reciprocal approach.
9
Besides hands-‐on arts experiences, teachers also participated in professional development focused on arts integration, provided by ICA on-‐site in schools. A coaching model called Supporting Teachers for Arts-‐Infused Classrooms (STAIC) was launched in service of supporting teachers in having the tools and strategies to create classrooms where the arts are a vehicle for students to be engaged learners, with diverse learning needs being met by a diverse spectrum of arts-‐based pedagogical strategies. Classroom teachers were introduced to new methodologies that allow for the creation of creative learning environments in the classroom, and collaborated directly with teaching artists to develop arts-‐integrated lesson plans with continued use of the visual, performing, and new media arts strategies in all subject areas. In-‐session training, post-‐session support, and follow-‐up support were all included in this coaching model, as student learning of content was seen as a shared responsibility of classroom teachers and teaching artists through a reciprocal approach. The planning and training meetings were highly collaborative and addressed the needs of the educators as well as their students. This support model, in addition to family and community culmination showcase events, intentionally created a whole-‐school arts integration culture in which students and teachers learn together and from each other.
The evaluation of the LATA partnership began in the 2010–2011 school year and concluded the third year of the program in 2012–2013. Baseline measures were gathered during the 2009–2010 school year.
1.2 GOALS AND OBJECTIVES The LATA program established several specific objectives in order to guide its implementation of arts instruction, professional development, and community building. Some of its outcomes were also reported to the Federal Department of Education as part of the Government Performance and Results Act (GPRA). The rest of the measures were commissioned by the project collaborators at Inner-‐City Arts in coordination with project evaluators. The goal of this evaluation was to gauge the effectiveness of the LATA model design, strategies, and curricula to establish the program’s validity to foster effective dissemination of the model. Within this goal the following objectives are addressed in this report, and each sub-‐goal will have its own dedicated subsection within the text of the report below.
Objective 1: Evaluate the effectiveness of the LATA model, measuring high achievement among students, attaining high-‐level standards across content areas.
o 1.a. The percentage of students participating in arts model projects funded through the USDoE’s Arts Education Model Development and Dissemination (AEMDD) grant program who demonstrate proficiency in mathematics (CST-‐M scores) will significantly increase compared to those in control or comparison groups. (GPRA)
o 1.b. The percentage of students participating in arts model projects who demonstrate proficiency in reading (CST-‐ELA scores) will significantly increase compared to those in control or comparison groups. (GPRA)
o 1.c. Project Target Schools will demonstrate a positive impact in English language development as a result of Project activities (evidenced by increased numbers of ELL students scoring at or above proficient on the CST-‐ELA exam). (Project)
o 1.d. 70% of the students in the treatment group will demonstrate improved performance of California Visual and Performing Arts (VAPA) Standards that lend to learning across-‐subjects than

10
those in the comparison group by the end of the third year of the project, as measured by student proficiency level in Theater and Animation. (Project)
o 1.e. Students in the treatment group will demonstrate more improvement in the creativity of their dramatic performances than will those in the comparison group. (Evaluation)
Objective 2: Advance sustained school-‐wide improvement in classroom instruction through professional development and related activities that bring the arts to the core of all learning school-‐wide.
• 2.a. An increase in student engagement and motivation to learn will be observed among 70% of Project students (shifts determined by Classroom Community Survey assessments). (Project Measure)
• 2.b. Participating teachers will improve their perceptions of their schools’ professional learning communities (according to responses on Professional Learning Communities Assessment-‐Revised survey). (Evaluation)
• 2.c. Seventy percent (70%) of participating teachers will improve their capacity to incorporate arts strategies in their instructional practice by the end of the third year of the project, resulting from teacher training activities and coaching, and through dissemination of integration strategies (as evidenced by teacher survey and evidence of increased range of delivery of instruction in other content areas). (Project)
• 2.d. Seventy percent (70%) of participating teachers will effectively incorporate the arts strategy and successfully implement creative learning communities in their classroom (evidenced by increased use of arts reflection/assessment tools in the delivery of instruction). (Project)
1.3 GUIDING THEORETICAL FRAMEWORK This study was guided by theories of situated learning, which emphasizes the instrumental nature of social interaction in learning processes. Central to this theory is the notion of “communities of practice,” where social interactions reinforce intended values and behaviors. In arts-‐focused communities, as we would expect in many settings, there are both local and more distributed communities of practice. While the arts organization participating in this study shaped many of the values and behaviors to be learned at its local level, there are also wider theater and visual arts communities that largely agree upon sets of values and beliefs – or larger cultures in which smaller programs function. Starting at the periphery of the community, learners begin as novices and become more central participants in the community as they become more expert at these practices. In this model, we can define learning as “changing participation”. This suggests that in some respects we can observe learning as the participant’s role changes. In the case of LATA, we are interested in documenting the participants’ students’ changing roles in both the arts, academic, and classroom and English language practices, as well as teachers’ changing roles in an arts-‐integrated classroom. Situated learning theory allows us to examine relationship between youths’ drama practices and English language learning. In addition, while we examine participation at the level of the individual (and particularly examine pre-‐ to post-‐test gains), situated learning theorists would note that individual participation really amounts to changing participation within a cultural activity; no activity is purely individual. Thus pre-‐ and post-‐tests cannot be interpreted as revealing purely individual performance, instead, they can be interpreted as the sociocultural activity of a particular social and cultural construction (Rogoff et. al., 1995).

11
2 EVALUATION OVERVIEW
2.1 SCHOOL AND PARTICIPANT SELECTION LAUSD is the second largest school district in the United States, behind only New York City (National Center for Education Statistics, 2013). The district serves the entire city of Los Angeles, as well as several surrounding municipalities and unincorporated areas. Three control schools and three treatment schools from the school district participated in this project evaluation (a purposefully selected subset of all schools participating in the LATA program). The treatment schools identified shared the characteristic of enrolling large percentages of low-‐performing ELLs (with first languages ranging commonly in Korean, Spanish, Tagalog, and Bengali, among many other languages spoken by families at these schools) and were also within a feeder pattern of elementary and middle schools matriculating to a common high school. Over 30 criteria were used to ensure reasonable comparability between treatment and matched comparison control schools, including but not limited to similar baseline standardized test scores, attendance rates, reclassification rates, parent participation, school suspension, safety, student demographics (e.g., race and ethnicity, percentage of ELLs, percentage of students with disabilities, percentage eligible for free and reduced-‐lunch program), API scores and rank, API Similar Schools Rankings, ELL progress, total enrollment, quality of facilities, and other indicators of teacher quality. The selected treatment and control schools are compared briefly in the table below, with sample criteria that were matched across sites.
Select comparisons of treatment and control school demographics at the start of the LATA program
School Condition Student Demographics % ELLs % FRPL
School A Treatment 57% Latino; 31% Asian; 5% Filipino; 7% Other 64% 69%
School L Control 51% Latino; 40% Asian; 1% Filipino; 8% Other 64% 68%
School B Treatment 86% Latino; 8% Asian; 3% Filipino; 3% Other 60% 100%
School M Control 85% Latino; 4% Asian; 6% Filipino; 5% Other 49% 100%
School C Treatment 73% Latino; 7% Asian; 10% Filipino; 10% Other 54% 100%
School N Control 84% Latino; 5% Asian; 9% Filipino; 2% Other 56% 100%
All participating schools served students from kindergarten to grade 5. While all schools in this school district included arts in the elementary school curriculum, only the three treatment schools were involved in the LATA model, as opposed to the standalone arts programming that was offered at the comparison sites as well as at most schools in the district at the time of the study. This standalone arts programming was delivered by LAUSD on many of the same art forms as offered through the LATA model, although classes were conducted at the schools as opposed to on the ICA campus. Control teachers did not have access to the arts training or LATA professional development programs. Participation in the arts activities was also considered to be optional for the classroom teachers.
We collected data on the efficacy of the LATA model from both students and teachers and from both treatment and control schools over a period of three years. We analyzed student data from
12
standardized test scores, pre and posttests of their arts learning through their art performances/ artworks, and in a Student Sense of Community Survey. A sample of teachers participated in two surveys that are described in more detail below.
2.2 OVERALL EVALUATION DESIGN We evaluated the efficacy of the LATA program largely through a quasi-‐experimental design using pre-‐post and treatment-‐control comparisons. To evaluate effects on student learning, our analyses included a comparison of gains in standardized test scores between treatment and control schools with a special focus on ELL students, a comparison in gains in drama learning between treatment and control schools, and an exploratory analysis of creativity in treatment and control students’ dramatic performances. To evaluate school community and professional development-‐related objectives, we collected pre and post surveys from the treatment groups for three different instruments: the Professional Learning Communities survey (Olivier, Hipp, & Huffman, 2010) and ICA internal survey on arts integration for teachers, and the Student Sense of Community Survey (Developmental Studies Center, 2005) for students. We were only able to collect control group data at one time point for most of these surveys, so pre-‐post comparisons involving the control group cannot be made.

13
3 STANDARDIZED MEASURES OF ACADEMIC ACHIEVEMENT
3.1 OVERVIEW OF STANDARDIZED GPRA MEASURES (CST-‐M & CST-‐ELA) This evaluation analyzed standardized test score information on control and treatment schools obtained via the public portal of the LAUSD website. The percent of students proficient in ELA and Math was compared at baseline and for years one–three of the implementation of the LATA model using descriptive statistics and chi-‐square tests of significance to identify statistical differences in gains between control and treatment schools overall, and for subpopulations of interest, including gains in the number of ELL students considered proficient in ELA.
Comparisons in performance were made by looking at scores on the California State Test of English language arts (CST-‐ELA) and the California State Test of Mathematics (CST-‐M), which are standardized tests taken by second through fifth grade students. The numbers of students annually tested as well as the numbers of students performing at and above proficiency levels are provided for treatment and control schools in the table below. Additionally, we examined the number of ELLs that were considered to be proficient in ELA, which also can be found in the table.
Comparisons of percentages of students performing at or above proficiency in ELA and Math were made with respect to the baseline scores (i.e., the 2010 test scores) and for program years one–three (i.e., 2011–2013 test scores). We compared descriptive statistics and created visualizations of descriptive data through graphs of the test scores of the total population and for the ELL subgroups. After identifying comparisons with wide margins, we utilized chi-‐square tests of independence to evaluate whether the differences found between control and treatment performance for both the overall populations and the ELL students were significant. A chi-‐square test of independence is a simple cross-‐tabulation that compares expected and actual differences between groups to determine whether they are due to chance or are operating statistically independently. In this case, condition (control or treatment) was cross-‐tabulated against performance (passing or failing the ELA or Math exam) to see how expected gains compared with actual gains for students in both groups.
14
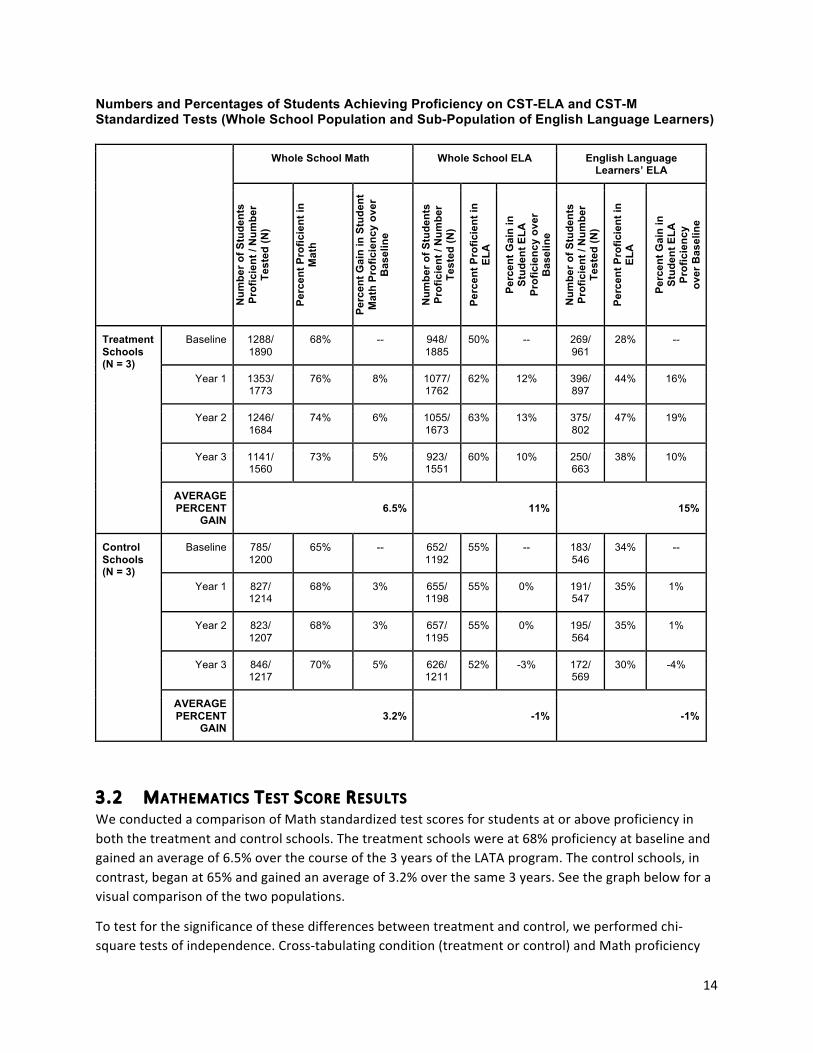
Numbers and Percentages of Students Achieving Proficiency on CST-ELA and CST-M Standardized Tests (Whole School Population and Sub-Population of English Language Learners)
Whole School Math Whole School ELA English Language Learners’ ELA
Num
ber o
f Stu
dent
s Pr
ofic
ient
/ N
umbe
r Te
sted
(N)
Perc
ent P
rofic
ient
in
Mat
h
Perc
ent G
ain
in S
tude
nt
Mat
h Pr
ofic
ienc
y ov
er
Bas
elin
e
Num
ber o
f Stu
dent
s Pr
ofic
ient
/ N
umbe
r Te
sted
(N)
Perc
ent P
rofic
ient
in
ELA
Perc
ent G
ain
in
Stud
ent E
LA
Prof
icie
ncy
over
B
asel
ine
Num
ber o
f Stu
dent
s Pr
ofic
ient
/ N
umbe
r Te
sted
(N)
Perc
ent P
rofic
ient
in
ELA
Perc
ent G
ain
in
Stud
ent E
LA
Prof
icie
ncy
over
Bas
elin
e
Treatment Schools (N = 3)
Baseline 1288/ 1890
68% -- 948/ 1885
50% -- 269/ 961
28% --
Year 1 1353/ 1773
76% 8% 1077/ 1762
62% 12% 396/ 897
44% 16%
Year 2 1246/ 1684
74% 6% 1055/ 1673
63% 13% 375/ 802
47% 19%
Year 3 1141/ 1560
73% 5% 923/ 1551
60% 10% 250/ 663
38% 10%
AVERAGE PERCENT
GAIN 6.5%
11%
15%
Control Schools (N = 3)
Baseline 785/ 1200
65% -- 652/ 1192
55% -- 183/ 546
34% --
Year 1 827/ 1214
68% 3% 655/ 1198
55% 0% 191/ 547
35% 1%
Year 2 823/ 1207
68% 3% 657/ 1195
55% 0% 195/ 564
35% 1%
Year 3 846/ 1217
70% 5% 626/ 1211
52% -3% 172/ 569
30% -4%
AVERAGE PERCENT
GAIN 3.2%
-1%
-1%
3.2 MATHEMATICS TEST SCORE RESULTS We conducted a comparison of Math standardized test scores for students at or above proficiency in both the treatment and control schools. The treatment schools were at 68% proficiency at baseline and gained an average of 6.5% over the course of the 3 years of the LATA program. The control schools, in contrast, began at 65% and gained an average of 3.2% over the same 3 years. See the graph below for a visual comparison of the two populations.
To test for the significance of these differences between treatment and control, we performed chi-‐square tests of independence. Cross-‐tabulating condition (treatment or control) and Math proficiency

15
(pass or fail) showed the difference between these variables was not significant at baseline [chi-‐squared (1, N = 3090) was 2.48; p = 0.115, with an effect size, phi, of 0.0283], indicating that the treatment and control schools began at similar levels of proficiency. However, throughout the years of the LATA program, the treatment schools’ CST-‐M scores rose, on average, to significantly higher percentages (at the p < 0.05 level) of proficiency than their peers’ scores at the control schools. In year 1 of the program, chi-‐squared (1, N = 2987) was 24.51; p < 0.00001, with a phi effect size of 0.09, close to a 0.1 small effect. Year 2’s chi-‐squared (1, N = 2891) was 11.64; p < 0.001; phi = 0.0635. Year 3’s chi-‐squared (1, N = 2777) was 4.42; p = 0.036; phi = 0.0399. Finally, we calculated a chi-‐square for the average gains across all 3 years: chi-‐squared (1, N = 2885) = 12.31; p < 0.001; phi = 0.06531. In sum, the baseline scores were not significantly different (though favored the treatment schools slightly), and consistently significant differences were found between treatment and control schools beginning in year 1 and continuing throughout the program. Overall, these results provide support for the efficacy of the LATA model to help to significantly increase students’ Math test scores. The only caution with these results, however, is that the effect size remains small, and the treatment group did in fact start off with slightly (though not significantly) higher scores than the control group.
Percent of Students Proficient in Math (Treatment vs. Control School Total Population)
3.3 ENGLISH LANGUAGE ARTS TEST SCORE RESULTS Results of our analyses of the ELA test scores provide additional strong support for the LATA model’s efficacy. To analyze standardized test scores in ELA and the numbers of students at or above proficiency, researchers compared the raw frequencies and percentages for the total population of students and for ELL students in both treatment and control groups (see Table above in Section 3.1). Column three in the table presents the total number of students performing at or above proficiency over the total number tested for the baseline year through year three of the program. Overall, these findings indicated that treatment schools had an average 11% gain in the number of students that were proficient on ELA
0%
10%
20%
30%
40%
50%
60%
70%
80%
Baseline Year 1 Year 2 Year 3
Treatment Schools
Control Schools
16
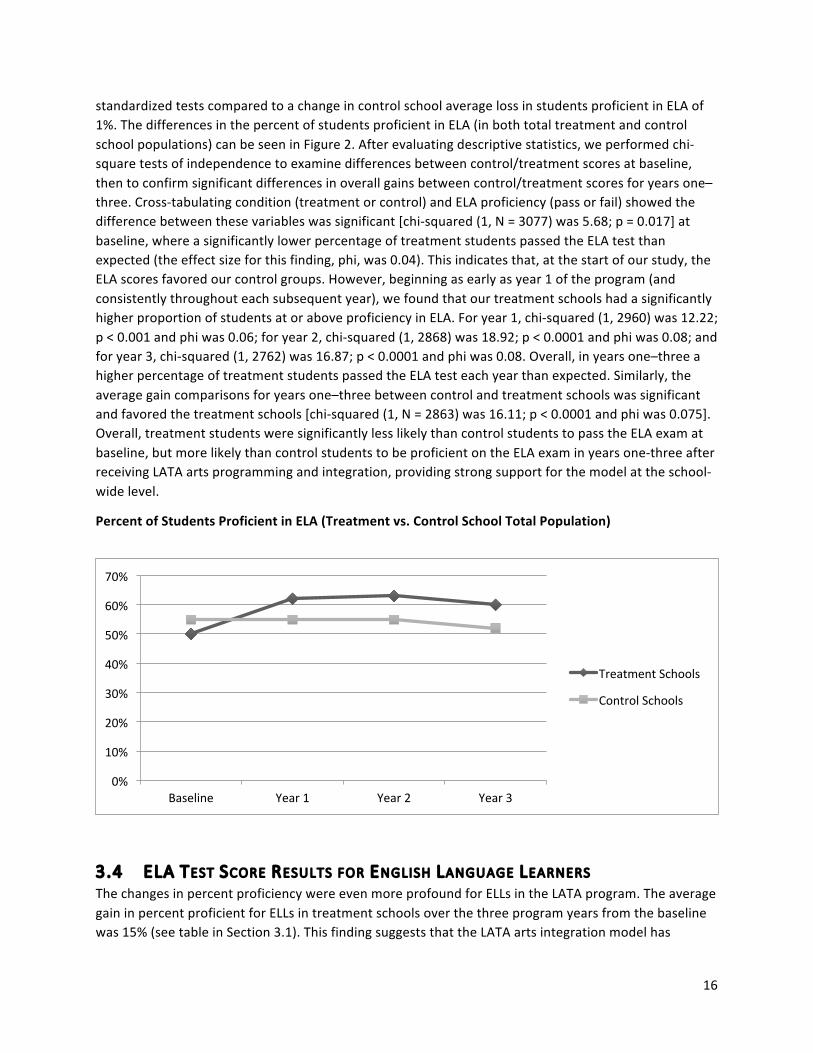
standardized tests compared to a change in control school average loss in students proficient in ELA of 1%. The differences in the percent of students proficient in ELA (in both total treatment and control school populations) can be seen in Figure 2. After evaluating descriptive statistics, we performed chi-‐square tests of independence to examine differences between control/treatment scores at baseline, then to confirm significant differences in overall gains between control/treatment scores for years one–three. Cross-‐tabulating condition (treatment or control) and ELA proficiency (pass or fail) showed the difference between these variables was significant [chi-‐squared (1, N = 3077) was 5.68; p = 0.017] at baseline, where a significantly lower percentage of treatment students passed the ELA test than expected (the effect size for this finding, phi, was 0.04). This indicates that, at the start of our study, the ELA scores favored our control groups. However, beginning as early as year 1 of the program (and consistently throughout each subsequent year), we found that our treatment schools had a significantly higher proportion of students at or above proficiency in ELA. For year 1, chi-‐squared (1, 2960) was 12.22; p < 0.001 and phi was 0.06; for year 2, chi-‐squared (1, 2868) was 18.92; p < 0.0001 and phi was 0.08; and for year 3, chi-‐squared (1, 2762) was 16.87; p < 0.0001 and phi was 0.08. Overall, in years one–three a higher percentage of treatment students passed the ELA test each year than expected. Similarly, the average gain comparisons for years one–three between control and treatment schools was significant and favored the treatment schools [chi-‐squared (1, N = 2863) was 16.11; p < 0.0001 and phi was 0.075]. Overall, treatment students were significantly less likely than control students to pass the ELA exam at baseline, but more likely than control students to be proficient on the ELA exam in years one-‐three after receiving LATA arts programming and integration, providing strong support for the model at the school-‐wide level.
Percent of Students Proficient in ELA (Treatment vs. Control School Total Population)
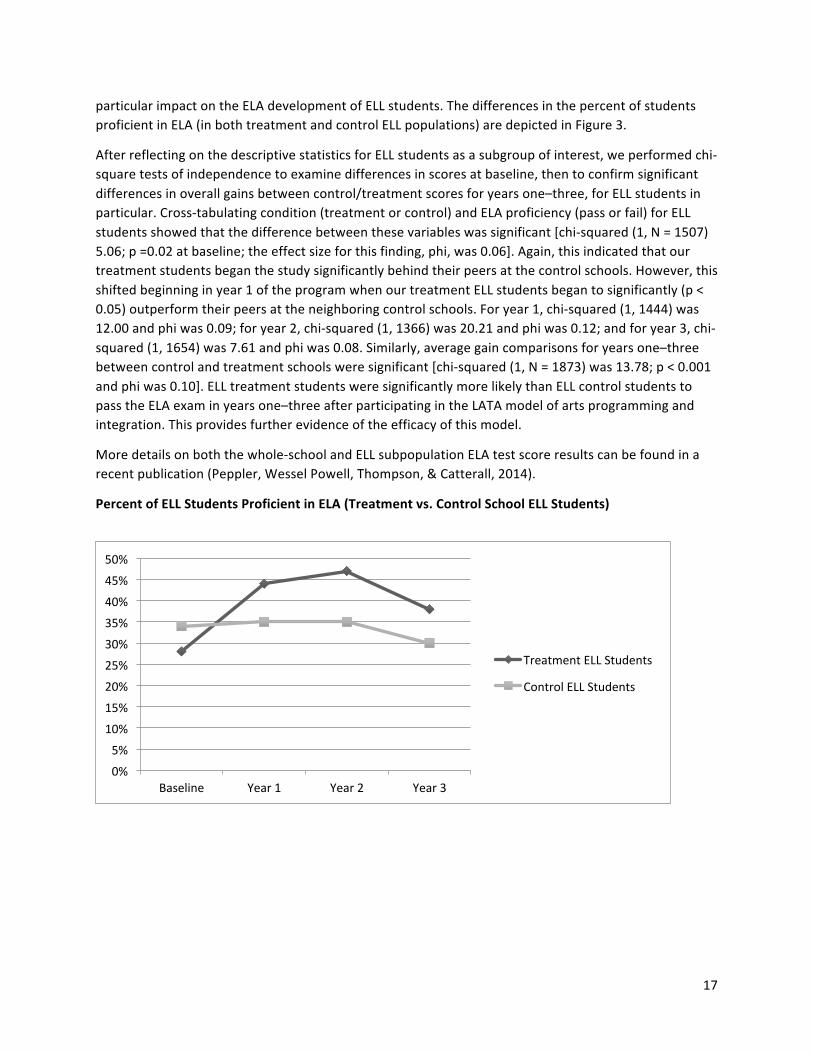
3.4 ELA TEST SCORE RESULTS FOR ENGLISH LANGUAGE LEARNERS The changes in percent proficiency were even more profound for ELLs in the LATA program. The average gain in percent proficient for ELLs in treatment schools over the three program years from the baseline was 15% (see table in Section 3.1). This finding suggests that the LATA arts integration model has
0%
10%
20%
30%
40%
50%
60%
70%
Baseline Year 1 Year 2 Year 3
Treatment Schools
Control Schools
17
particular impact on the ELA development of ELL students. The differences in the percent of students proficient in ELA (in both treatment and control ELL populations) are depicted in Figure 3.
After reflecting on the descriptive statistics for ELL students as a subgroup of interest, we performed chi-‐square tests of independence to examine differences in scores at baseline, then to confirm significant differences in overall gains between control/treatment scores for years one–three, for ELL students in particular. Cross-‐tabulating condition (treatment or control) and ELA proficiency (pass or fail) for ELL students showed that the difference between these variables was significant [chi-‐squared (1, N = 1507) 5.06; p =0.02 at baseline; the effect size for this finding, phi, was 0.06]. Again, this indicated that our treatment students began the study significantly behind their peers at the control schools. However, this shifted beginning in year 1 of the program when our treatment ELL students began to significantly (p < 0.05) outperform their peers at the neighboring control schools. For year 1, chi-‐squared (1, 1444) was 12.00 and phi was 0.09; for year 2, chi-‐squared (1, 1366) was 20.21 and phi was 0.12; and for year 3, chi-‐squared (1, 1654) was 7.61 and phi was 0.08. Similarly, average gain comparisons for years one–three between control and treatment schools were significant [chi-‐squared (1, N = 1873) was 13.78; p < 0.001 and phi was 0.10]. ELL treatment students were significantly more likely than ELL control students to pass the ELA exam in years one–three after participating in the LATA model of arts programming and integration. This provides further evidence of the efficacy of this model.
More details on both the whole-‐school and ELL subpopulation ELA test score results can be found in a recent publication (Peppler, Wessel Powell, Thompson, & Catterall, 2014).
Percent of ELL Students Proficient in ELA (Treatment vs. Control School ELL Students)
0%
5%
10%
15%
20%
25%
30%
35%
40%
45%
50%
Baseline Year 1 Year 2 Year 3
Treatment ELL Students
Control ELL Students

18
4 ARTS LEARNING MEASURES
To assess the impact of the LATA program on arts learning, we focused in on two strands of arts learning (among many in the LATA model): Animation and Drama. For the purposes of this evaluation, we created and validated two unique assessment instruments for drama and animation.
The drama instrument reached advanced stages of development, allowing us to discern differences in treatment vs. control groups as well as pre-‐ to posttest gains. While we present both instruments here, we have focused the evaluation of arts learning on the drama learning measure, for the purposes of the evaluation and informing arts learning measures in this study. This instrument is now part of a new research publication under review.
The animation instrument was also piloted extensively and the final assessment designs could be validated for use in future studies. However, we were unable to use the animation measure in the current evaluation sample to detect differences between groups and time points due to an unexpected difference in the difficulty of the prompts used through this study. While intending to add variety to repeat administrations of the instrument, ultimately we found that results only correlated with the prompt difficulty and not with the group or time point in the study. We attribute this to the relative infancy of this animation learning measure (and the amount of time that it takes to develop new measures). However, we were able to make significant strides over the course of the project in creating a new animation measure for the field that we share here.
4.1 ANIMATION LEARNING The primary contribution of our work on animation learning was the creation of a new tool for assessing performance on a zoetrope, stop-‐frame animation task. A description of the rubric’s development, the data with which we piloted it, and our process of establishing inter-‐rater reliability with a copy of the instrument and scoring rubric follow below.
4.1.1 Development of Animation Performance Instrument The animation instrument was uniquely co-‐developed for the purposes of this project with ICA staff around the instructional guidelines for the creation of zoetrope animations as developed by ICA. The instructional guideline was itself developed to also address a number of select California Visual Arts and Performing Arts Standards (VAPA), and LAUSD Media Arts Standards. The standards addressed by the curricular activities were for:
1. Creative Expression, where, for VAPA, artworks are created “based on observations of actual objects and everyday scenes,” and for LAUSD Standards students are to “organize and/or combine images, movement and/or sounds for meaning,” and to “use varied techniques and methods to capture and/or manipulate content.”
2. Aesthetic Valuing, where for VAPA students are to “select something they like about their work of art and something they would change,” and LAUSD, “analyze basic media arts technical concepts… by using simple animation projects…”
19
3. Finally for LAUSD is also Artistic Perception where students are to “identify and describe the various content components of media artworks, such as story, event, character, action, scene, sound, (and) sequence.”
A consideration in developing the assessment guide for animation is the dearth of information on the subject within the field of educational research. While it is possible to fit animation assessments into a framework guided by district, state, and federal standards, this does not necessarily speak to a student’s increased capacity toward improving their skills as animators. Many of the arts learning standards address issues of how students may come to understand such aspects of art as expression, perception, cultural and historical context, and aesthetic valuing. However, assessing animation through a standards-‐based practice does not delve as deeply into the development of the objective elements of craft, and this is often left to the individual teacher to determine on a more subjective case-‐by-‐case level. For example, the LAUSD Media Arts Standards for Grade 4 indicate that a student should be able to “develop criteria for evaluating the effective use of specific elements, principles, and processes in media art works,” but what is lacking are the benchmarks against which to measure those within animation. An assessment rubric for animation more generally then becomes a useful tool by which we may be able to derive more meaning from assessments as they relate to the standards.
For the LATA zoetrope animation assessments, a rubric was developed and was intended in part to connect to the California VAPA and LAUSD arts assessment standards listed above, which were used to guide the development of the instructional materials. However, in order to extend beyond the standards, collaborative discussions with the ICA animation instructor and LATA site teacher were conducted to help establish further criteria deemed valuable in assessing animation from a professional perspective.
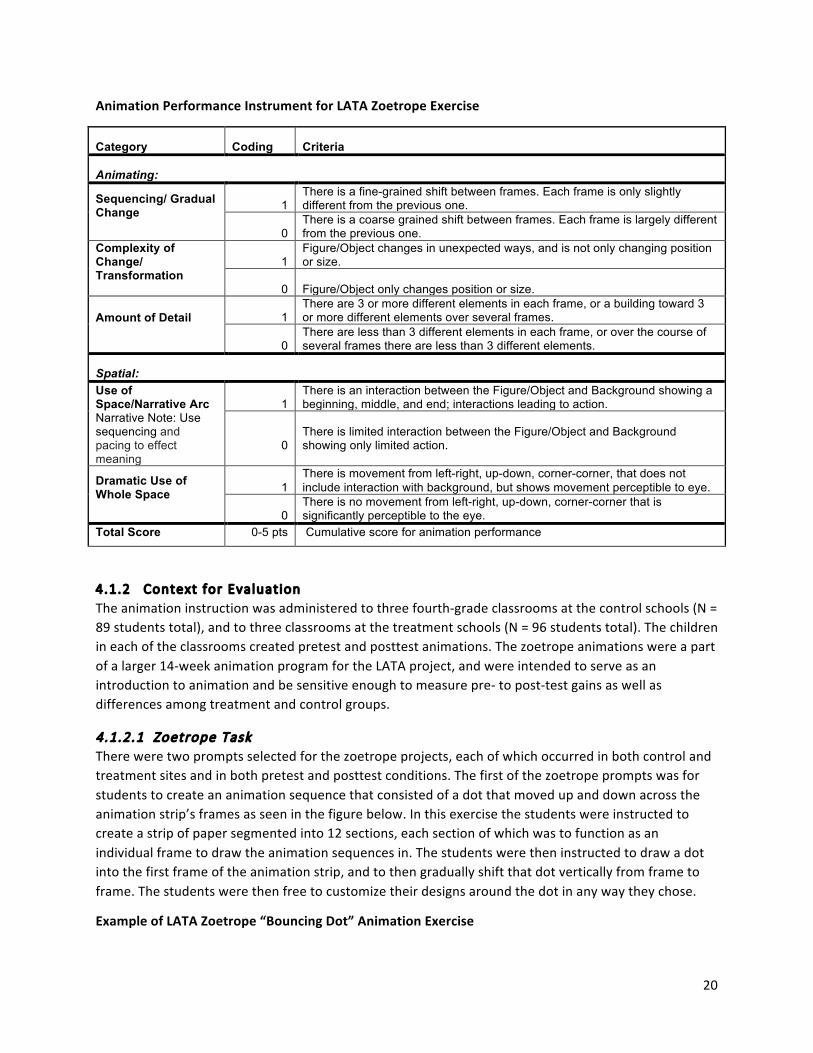
In approaching the instrument from this perspective, the initial task was to create a breakdown of how animations were constructed. The discussion settled upon two categories, Animating and Spatial, with three elements comprising Animating, and two elements in Spatial. The zoetrope animations were assessed using these five elements by scoring each on a binary 0-‐1 scale, with 0 indicating absence of the element and 1 indicating presence of the element. The full rubric can be found in the table below.
20
Animation Performance Instrument for LATA Zoetrope Exercise
Category Coding Criteria
Animating:
Sequencing/ Gradual Change
1 There is a fine-grained shift between frames. Each frame is only slightly different from the previous one.
0 There is a coarse grained shift between frames. Each frame is largely different from the previous one.
Complexity of Change/ Transformation
1 Figure/Object changes in unexpected ways, and is not only changing position or size.
0 Figure/Object only changes position or size.
Amount of Detail
1 There are 3 or more different elements in each frame, or a building toward 3 or more different elements over several frames.
0 There are less than 3 different elements in each frame, or over the course of several frames there are less than 3 different elements.
Spatial: Use of Space/Narrative Arc Narrative Note: Use sequencing and pacing to effect meaning
1 There is an interaction between the Figure/Object and Background showing a beginning, middle, and end; interactions leading to action.
0
There is limited interaction between the Figure/Object and Background showing only limited action.
Dramatic Use of Whole Space
1 There is movement from left-right, up-down, corner-corner, that does not include interaction with background, but shows movement perceptible to eye.
0 There is no movement from left-right, up-down, corner-corner that is significantly perceptible to the eye.
Total Score 0-5 pts Cumulative score for animation performance
4.1.2 Context for Evaluation The animation instruction was administered to three fourth-‐grade classrooms at the control schools (N = 89 students total), and to three classrooms at the treatment schools (N = 96 students total). The children in each of the classrooms created pretest and posttest animations. The zoetrope animations were a part of a larger 14-‐week animation program for the LATA project, and were intended to serve as an introduction to animation and be sensitive enough to measure pre-‐ to post-‐test gains as well as differences among treatment and control groups.
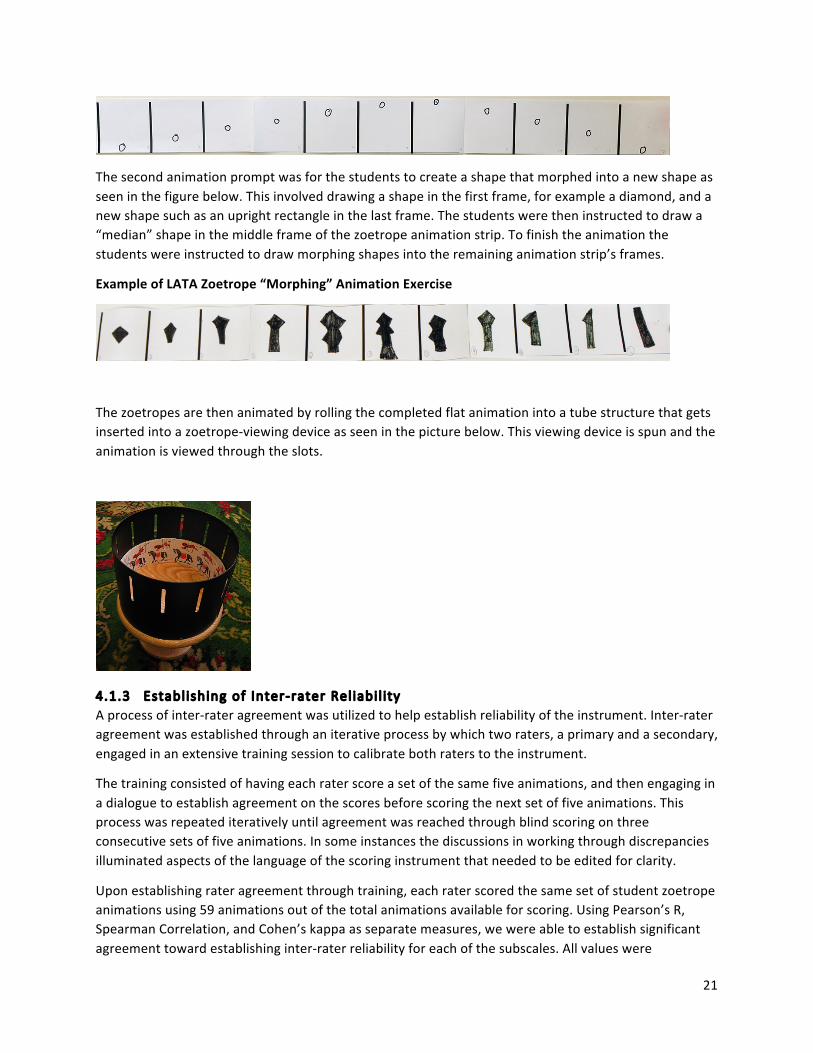
4.1.2.1 Zoetrope Task There were two prompts selected for the zoetrope projects, each of which occurred in both control and treatment sites and in both pretest and posttest conditions. The first of the zoetrope prompts was for students to create an animation sequence that consisted of a dot that moved up and down across the animation strip’s frames as seen in the figure below. In this exercise the students were instructed to create a strip of paper segmented into 12 sections, each section of which was to function as an individual frame to draw the animation sequences in. The students were then instructed to draw a dot into the first frame of the animation strip, and to then gradually shift that dot vertically from frame to frame. The students were then free to customize their designs around the dot in any way they chose.
Example of LATA Zoetrope “Bouncing Dot” Animation Exercise
21
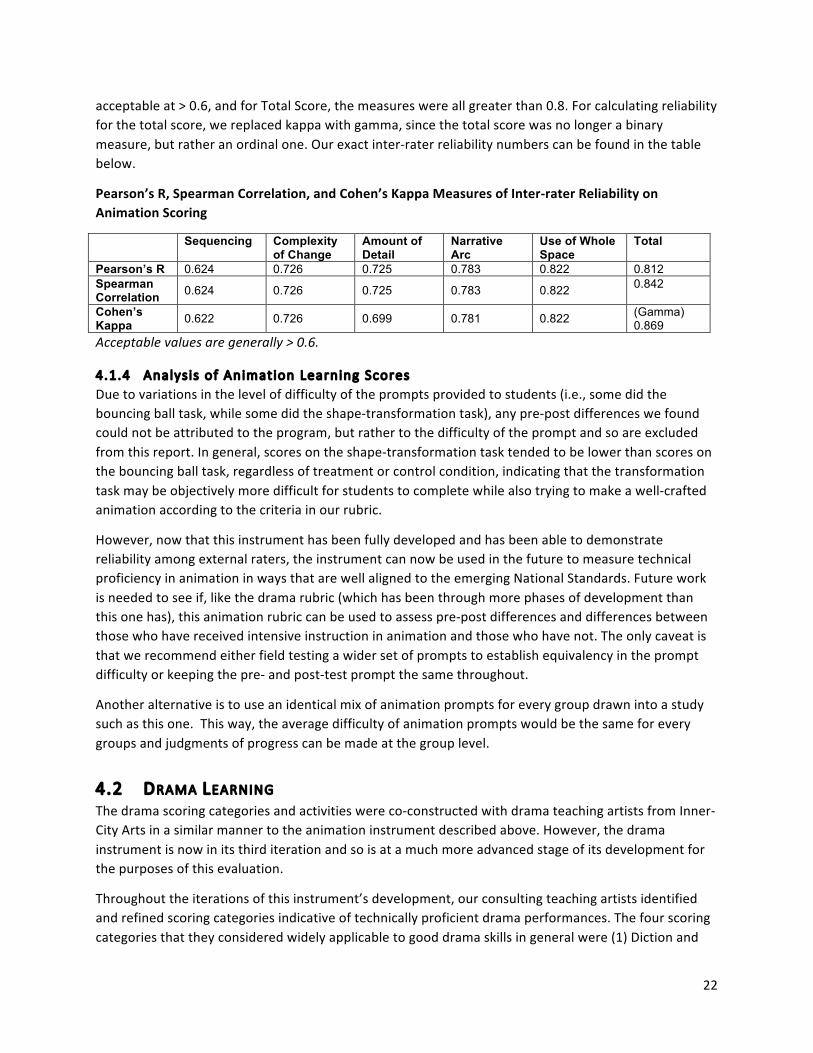
The second animation prompt was for the students to create a shape that morphed into a new shape as seen in the figure below. This involved drawing a shape in the first frame, for example a diamond, and a new shape such as an upright rectangle in the last frame. The students were then instructed to draw a “median” shape in the middle frame of the zoetrope animation strip. To finish the animation the students were instructed to draw morphing shapes into the remaining animation strip’s frames.
Example of LATA Zoetrope “Morphing” Animation Exercise
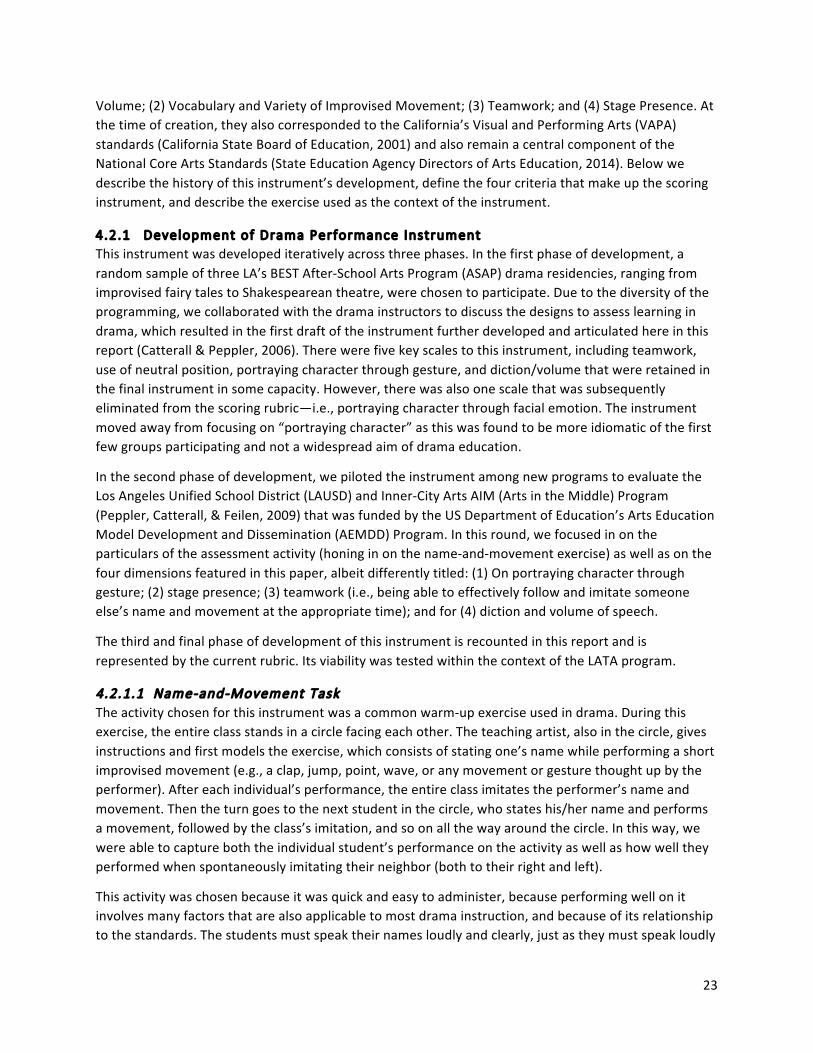
The zoetropes are then animated by rolling the completed flat animation into a tube structure that gets inserted into a zoetrope-‐viewing device as seen in the picture below. This viewing device is spun and the animation is viewed through the slots.
4.1.3 Establ ishing of Inter-‐rater Rel iabi l i ty A process of inter-‐rater agreement was utilized to help establish reliability of the instrument. Inter-‐rater agreement was established through an iterative process by which two raters, a primary and a secondary, engaged in an extensive training session to calibrate both raters to the instrument.
The training consisted of having each rater score a set of the same five animations, and then engaging in a dialogue to establish agreement on the scores before scoring the next set of five animations. This process was repeated iteratively until agreement was reached through blind scoring on three consecutive sets of five animations. In some instances the discussions in working through discrepancies illuminated aspects of the language of the scoring instrument that needed to be edited for clarity.
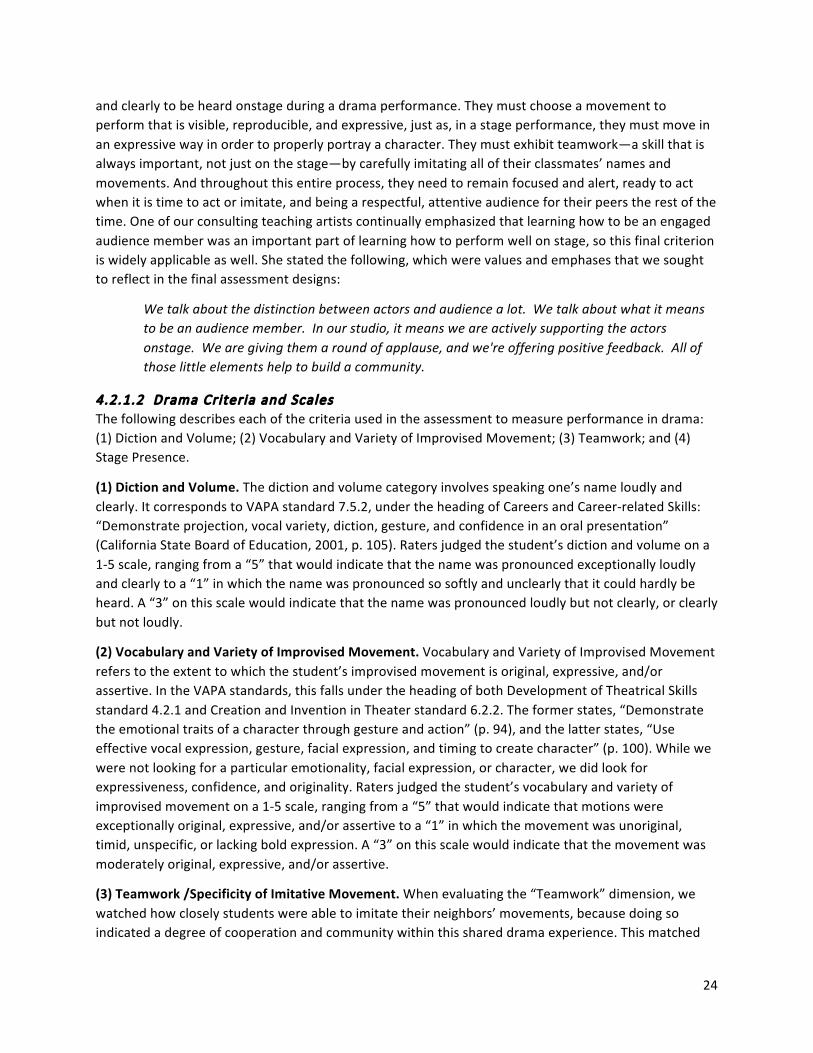
Upon establishing rater agreement through training, each rater scored the same set of student zoetrope animations using 59 animations out of the total animations available for scoring. Using Pearson’s R, Spearman Correlation, and Cohen’s kappa as separate measures, we were able to establish significant agreement toward establishing inter-‐rater reliability for each of the subscales. All values were
22
acceptable at > 0.6, and for Total Score, the measures were all greater than 0.8. For calculating reliability for the total score, we replaced kappa with gamma, since the total score was no longer a binary measure, but rather an ordinal one. Our exact inter-‐rater reliability numbers can be found in the table below.
Pearson’s R, Spearman Correlation, and Cohen’s Kappa Measures of Inter-‐rater Reliability on Animation Scoring
Sequencing Complexity of Change
Amount of Detail
Narrative Arc
Use of Whole Space
Total
Pearson’s R 0.624 0.726 0.725 0.783 0.822 0.812 Spearman Correlation 0.624 0.726 0.725 0.783 0.822 0.842
Cohen’s Kappa 0.622 0.726 0.699 0.781 0.822 (Gamma)
0.869 Acceptable values are generally > 0.6.
4.1.4 Analysis of Animation Learning Scores Due to variations in the level of difficulty of the prompts provided to students (i.e., some did the bouncing ball task, while some did the shape-‐transformation task), any pre-‐post differences we found could not be attributed to the program, but rather to the difficulty of the prompt and so are excluded from this report. In general, scores on the shape-‐transformation task tended to be lower than scores on the bouncing ball task, regardless of treatment or control condition, indicating that the transformation task may be objectively more difficult for students to complete while also trying to make a well-‐crafted animation according to the criteria in our rubric.
However, now that this instrument has been fully developed and has been able to demonstrate reliability among external raters, the instrument can now be used in the future to measure technical proficiency in animation in ways that are well aligned to the emerging National Standards. Future work is needed to see if, like the drama rubric (which has been through more phases of development than this one has), this animation rubric can be used to assess pre-‐post differences and differences between those who have received intensive instruction in animation and those who have not. The only caveat is that we recommend either field testing a wider set of prompts to establish equivalency in the prompt difficulty or keeping the pre-‐ and post-‐test prompt the same throughout.
Another alternative is to use an identical mix of animation prompts for every group drawn into a study such as this one. This way, the average difficulty of animation prompts would be the same for every groups and judgments of progress can be made at the group level.
4.2 DRAMA LEARNING The drama scoring categories and activities were co-‐constructed with drama teaching artists from Inner-‐City Arts in a similar manner to the animation instrument described above. However, the drama instrument is now in its third iteration and so is at a much more advanced stage of its development for the purposes of this evaluation.
Throughout the iterations of this instrument’s development, our consulting teaching artists identified and refined scoring categories indicative of technically proficient drama performances. The four scoring categories that they considered widely applicable to good drama skills in general were (1) Diction and
23
Volume; (2) Vocabulary and Variety of Improvised Movement; (3) Teamwork; and (4) Stage Presence. At the time of creation, they also corresponded to the California’s Visual and Performing Arts (VAPA) standards (California State Board of Education, 2001) and also remain a central component of the National Core Arts Standards (State Education Agency Directors of Arts Education, 2014). Below we describe the history of this instrument’s development, define the four criteria that make up the scoring instrument, and describe the exercise used as the context of the instrument.
4.2.1 Development of Drama Performance Instrument This instrument was developed iteratively across three phases. In the first phase of development, a random sample of three LA’s BEST After-‐School Arts Program (ASAP) drama residencies, ranging from improvised fairy tales to Shakespearean theatre, were chosen to participate. Due to the diversity of the programming, we collaborated with the drama instructors to discuss the designs to assess learning in drama, which resulted in the first draft of the instrument further developed and articulated here in this report (Catterall & Peppler, 2006). There were five key scales to this instrument, including teamwork, use of neutral position, portraying character through gesture, and diction/volume that were retained in the final instrument in some capacity. However, there was also one scale that was subsequently eliminated from the scoring rubric—i.e., portraying character through facial emotion. The instrument moved away from focusing on “portraying character” as this was found to be more idiomatic of the first few groups participating and not a widespread aim of drama education.
In the second phase of development, we piloted the instrument among new programs to evaluate the Los Angeles Unified School District (LAUSD) and Inner-‐City Arts AIM (Arts in the Middle) Program (Peppler, Catterall, & Feilen, 2009) that was funded by the US Department of Education’s Arts Education Model Development and Dissemination (AEMDD) Program. In this round, we focused in on the particulars of the assessment activity (honing in on the name-‐and-‐movement exercise) as well as on the four dimensions featured in this paper, albeit differently titled: (1) On portraying character through gesture; (2) stage presence; (3) teamwork (i.e., being able to effectively follow and imitate someone else’s name and movement at the appropriate time); and for (4) diction and volume of speech.
The third and final phase of development of this instrument is recounted in this report and is represented by the current rubric. Its viability was tested within the context of the LATA program.
4.2.1.1 Name-‐and-‐Movement Task The activity chosen for this instrument was a common warm-‐up exercise used in drama. During this exercise, the entire class stands in a circle facing each other. The teaching artist, also in the circle, gives instructions and first models the exercise, which consists of stating one’s name while performing a short improvised movement (e.g., a clap, jump, point, wave, or any movement or gesture thought up by the performer). After each individual’s performance, the entire class imitates the performer’s name and movement. Then the turn goes to the next student in the circle, who states his/her name and performs a movement, followed by the class’s imitation, and so on all the way around the circle. In this way, we were able to capture both the individual student’s performance on the activity as well as how well they performed when spontaneously imitating their neighbor (both to their right and left).
This activity was chosen because it was quick and easy to administer, because performing well on it involves many factors that are also applicable to most drama instruction, and because of its relationship to the standards. The students must speak their names loudly and clearly, just as they must speak loudly
24
and clearly to be heard onstage during a drama performance. They must choose a movement to perform that is visible, reproducible, and expressive, just as, in a stage performance, they must move in an expressive way in order to properly portray a character. They must exhibit teamwork—a skill that is always important, not just on the stage—by carefully imitating all of their classmates’ names and movements. And throughout this entire process, they need to remain focused and alert, ready to act when it is time to act or imitate, and being a respectful, attentive audience for their peers the rest of the time. One of our consulting teaching artists continually emphasized that learning how to be an engaged audience member was an important part of learning how to perform well on stage, so this final criterion is widely applicable as well. She stated the following, which were values and emphases that we sought to reflect in the final assessment designs:
We talk about the distinction between actors and audience a lot. We talk about what it means to be an audience member. In our studio, it means we are actively supporting the actors onstage. We are giving them a round of applause, and we're offering positive feedback. All of those little elements help to build a community.
4.2.1.2 Drama Criter ia and Scales The following describes each of the criteria used in the assessment to measure performance in drama: (1) Diction and Volume; (2) Vocabulary and Variety of Improvised Movement; (3) Teamwork; and (4) Stage Presence.
(1) Diction and Volume. The diction and volume category involves speaking one’s name loudly and clearly. It corresponds to VAPA standard 7.5.2, under the heading of Careers and Career-‐related Skills: “Demonstrate projection, vocal variety, diction, gesture, and confidence in an oral presentation” (California State Board of Education, 2001, p. 105). Raters judged the student’s diction and volume on a 1-‐5 scale, ranging from a “5” that would indicate that the name was pronounced exceptionally loudly and clearly to a “1” in which the name was pronounced so softly and unclearly that it could hardly be heard. A “3” on this scale would indicate that the name was pronounced loudly but not clearly, or clearly but not loudly.
(2) Vocabulary and Variety of Improvised Movement. Vocabulary and Variety of Improvised Movement refers to the extent to which the student’s improvised movement is original, expressive, and/or assertive. In the VAPA standards, this falls under the heading of both Development of Theatrical Skills standard 4.2.1 and Creation and Invention in Theater standard 6.2.2. The former states, “Demonstrate the emotional traits of a character through gesture and action” (p. 94), and the latter states, “Use effective vocal expression, gesture, facial expression, and timing to create character” (p. 100). While we were not looking for a particular emotionality, facial expression, or character, we did look for expressiveness, confidence, and originality. Raters judged the student’s vocabulary and variety of improvised movement on a 1-‐5 scale, ranging from a “5” that would indicate that motions were exceptionally original, expressive, and/or assertive to a “1” in which the movement was unoriginal, timid, unspecific, or lacking bold expression. A “3” on this scale would indicate that the movement was moderately original, expressive, and/or assertive.
(3) Teamwork /Specificity of Imitative Movement. When evaluating the “Teamwork” dimension, we watched how closely students were able to imitate their neighbors’ movements, because doing so indicated a degree of cooperation and community within this shared drama experience. This matched
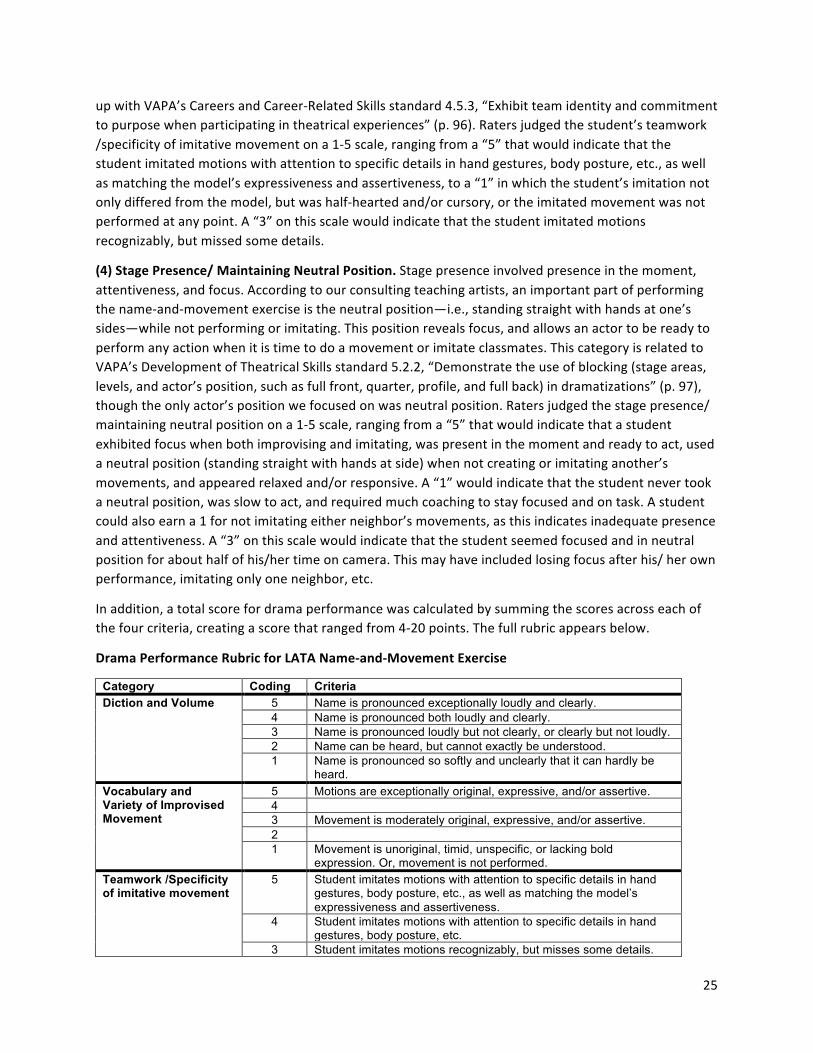
25
up with VAPA’s Careers and Career-‐Related Skills standard 4.5.3, “Exhibit team identity and commitment to purpose when participating in theatrical experiences” (p. 96). Raters judged the student’s teamwork /specificity of imitative movement on a 1-‐5 scale, ranging from a “5” that would indicate that the student imitated motions with attention to specific details in hand gestures, body posture, etc., as well as matching the model’s expressiveness and assertiveness, to a “1” in which the student’s imitation not only differed from the model, but was half-‐hearted and/or cursory, or the imitated movement was not performed at any point. A “3” on this scale would indicate that the student imitated motions recognizably, but missed some details.
(4) Stage Presence/ Maintaining Neutral Position. Stage presence involved presence in the moment, attentiveness, and focus. According to our consulting teaching artists, an important part of performing the name-‐and-‐movement exercise is the neutral position—i.e., standing straight with hands at one’s sides—while not performing or imitating. This position reveals focus, and allows an actor to be ready to perform any action when it is time to do a movement or imitate classmates. This category is related to VAPA’s Development of Theatrical Skills standard 5.2.2, “Demonstrate the use of blocking (stage areas, levels, and actor’s position, such as full front, quarter, profile, and full back) in dramatizations” (p. 97), though the only actor’s position we focused on was neutral position. Raters judged the stage presence/ maintaining neutral position on a 1-‐5 scale, ranging from a “5” that would indicate that a student exhibited focus when both improvising and imitating, was present in the moment and ready to act, used a neutral position (standing straight with hands at side) when not creating or imitating another’s movements, and appeared relaxed and/or responsive. A “1” would indicate that the student never took a neutral position, was slow to act, and required much coaching to stay focused and on task. A student could also earn a 1 for not imitating either neighbor’s movements, as this indicates inadequate presence and attentiveness. A “3” on this scale would indicate that the student seemed focused and in neutral position for about half of his/her time on camera. This may have included losing focus after his/ her own performance, imitating only one neighbor, etc.
In addition, a total score for drama performance was calculated by summing the scores across each of the four criteria, creating a score that ranged from 4-‐20 points. The full rubric appears below.
Drama Performance Rubric for LATA Name-‐and-‐Movement Exercise
Category Coding Criteria Diction and Volume 5 Name is pronounced exceptionally loudly and clearly.
4 Name is pronounced both loudly and clearly. 3 Name is pronounced loudly but not clearly, or clearly but not loudly. 2 Name can be heard, but cannot exactly be understood. 1 Name is pronounced so softly and unclearly that it can hardly be
heard. Vocabulary and Variety of Improvised Movement
5 Motions are exceptionally original, expressive, and/or assertive. 4 3 Movement is moderately original, expressive, and/or assertive. 2 1 Movement is unoriginal, timid, unspecific, or lacking bold
expression. Or, movement is not performed. Teamwork /Specificity of imitative movement
5 Student imitates motions with attention to specific details in hand gestures, body posture, etc., as well as matching the model’s expressiveness and assertiveness.
4 Student imitates motions with attention to specific details in hand gestures, body posture, etc.
3 Student imitates motions recognizably, but misses some details.

26
2 Student performs an imitation, but it is quite different from the model.
1 Student’s imitation not only differs from the model, but is half-hearted and cursory, or imitated movement is not performed at any point.
Stage Presence /Maintaining Neutral Position
5 Exhibits focus when both improvising and imitating. Is present in the moment and ready to act. Use of neutral position (standing straight with hands at side) when not creating or imitating another’s movements. Appears relaxed and responsive.
4 Student understands principles of performing (i.e. facing front, begins and returns to neutral position, exhibits focus when imitating) but occasionally deviates from neutral position or is slightly slow to act or slightly off-task (including when imitating).
3 Student seems focused and in neutral position for about half of his/her time on camera. This may include losing focus after his/ her own performance, imitating only one neighbor, etc.
2 Student lacks either focus or maintenance of the neutral position during most of his/ her time on camera.
1 Student does not understand concept of the neutral position, is slow to act, and requires much coaching. Student does not imitate either neighbor.
Total Score 0-20 pts Cumulative score for drama performance
4.2.1.3 Sample Student Scoring To illustrate the scoring process, we present a sample case here that we will call “Lucas” (a pseudonym). Lucas was a student who participated in the LATA program. His performance was scored on the name-‐and-‐movement exercise both during one of his first LATA drama lessons (pre), and during his last lesson 14 weeks later (post). His total score improved from 9 in the pre to 18 in the post. The breakdown of his scores by category can be seen in the table below. Out of all the students who participated in the LATA program, Lucas showed some of the greatest improvement in his performance on this activity, and also received one of the highest scores in his post assessment. The difference in his dynamism can even be seen from the still images included in the table. This and other evidence indicated that the rubric seemed to be able to distinguish between “poor” and “exemplary” performances.

27
Pre and Post Scores of an Example Student’s Name-‐and-‐Movement Performance, Using the LATA Drama Performance Rubric
Pre Score Post Score Diction and Volume Lucas spoke his name clearly, but not
loudly enough for the stage, so he received a score of 3 for Diction and Volume.
Lucas spoke his name clearly and loudly enough that he would definitely be able to be heard on a stage, so he received a score of 5.
Vocabulary and Variety of Improvised Movement
In the pre, Lucas simply lifted his arms away from his body and dropped them back down. This was moderately original, assertive, and expressive, but it was not exceptional, so it received a score of 3.
Lucas’s movement in the post consisted of falling to his knees and then to the ground as he said his name. He performed this movement confidently and expressively, and no one else in his class did a movement like this, so it was original as well. For that reason, he scored a 5 for this movement.
Teamwork /Specificity of imitative movement
Lucas did not imitate his neighbors in the pre, except for, at one point, moving his arms slightly, but this slight movement did not match his neighbor’s movement at all. He thus received a 1 for imitation.
Lucas’s best imitation was of the neighbor to his left whose turn came after his. Lucas imitated this neighbor’s dancing shuffle with attention to specific details in the movement. However, Lucas did not show as much enthusiasm as his neighbor did in his movement, so Lucas lost a point and received a 4.
Stage Presence /Maintaining Neutral Position
While Lucas did remain in the neutral position—facing forward, standing straight, hands at side—he neglected to imitate his neighbors, indicating a lack of presence in the moment. He was ready to perform his own movement when his turn arrived, however, so he received a score of 2 for Stage Presence.
Lucas paid attention to the activity, and was ready to act when it was time to perform his own movement and time to imitate his neighbors. He remained in the neutral position most of the time, only deviating slightly when he briefly held his hands together, and later adjusted his clothing. Thus he received a score of 4 for Stage Presence.
Total Score Lucas scored 9 points on Pre-Test Lucas scored 18 points on Post-Test

28
4.2.2 Context for Evaluation Participants for the drama program evaluation were drawn from our larger sample of treatment and control schools. Three fourth-‐grade classrooms from two schools participating in LATA drama integration were chosen as the “treatment group” in this evaluation, and three fourth-‐grade classrooms from two control schools that did not participate in the drama integration were chosen for the control group. Altogether, 97 students participated in the treatment group (N = 41 boys/56 girls), and 80 in the control group (N = 39 boys/41 girls). The difference in numbers is mostly due to the larger class sizes prevalent in the treatment schools.
The three treatment classrooms participated in the same 14-‐week intensive drama and arts integration program as did other classrooms in the LATA program, led by a teaching artist named Ms. Messer. For the control classrooms, on the other hand, Ms. Messer visited the classrooms to facilitate the name-‐and-‐movement activity, rather than the students visiting the ICA campus. She visited them just twice, once for the pre-‐assessment, and once for the post approximately 14 weeks later.
4.2.2.1 Methods of Data Col lect ion This same teaching artist, Ms. Messer, led the assessment exercises (i.e., name-‐and-‐movement) for all six participating classrooms examined in this report, including both the treatment and control students at all time points. She gave the same instructions and modeled the name-‐and-‐movement activity for all six classrooms. As each student did their movement, she would continue good modeling behavior by imitating the performing student along with the class. Upon further examination, we found that there were minimal differences in the way the instructions and exercise were conducted between treatment, control, pre, and post, so that each session could be comparable to the others and suitable for participation in this study.
For both the pre and the post-‐assessment, the students participated in a short warm-‐up activity, did the name-‐and-‐movement exercise for the camera, and then had a short drama lesson. While the treatment group received drama training in the interim, the control groups had no interaction with Ms. Messer and no particular drama instruction between the assessment time points. The post-‐assessment took place 14 weeks after the pre. Due to time constraints, not all of the drama instruction and data collection could take place concurrently. Since Ms. Messer could only teach up to two treatment classrooms per 14-‐week period (2 days a week for each classroom), the data collection for the three treatment classrooms took place in successive semesters: one in Spring 2012, and two in Fall 2012. Data collection for the control classrooms took place the following year: two classes in Spring 2013, and one in Fall 2013.
Trained professional videographers recorded the name-‐and-‐movement exercise. Students stood in a circle and the videographer filmed the circle in two halves with a momentary pause before moving positions to film the other half of the circle. High quality microphones and high-‐definition cameras were used to capture both high quality audio and video for the purposes of the assessment. For the most part, videography teams remained as unobtrusive as possible, silently moving the camera around the circle to record three students at a time: the focal, performing student and one neighboring student on each side, so that at least two classmates’ imitations of each student’s movement were recorded.
4.2.2.2 Analyt ical Techniques All performances were then scored on each of the coding categories on a 1-‐5 scale for each of the participants. When scoring with the rubric, a “case” is defined as a student’s performance, as well as

29
their imitation of both of their adjacent neighbors. For the Diction and Volume category, raters only listened to how loudly and clearly each student spoke their name. For the Vocabulary and Variety of Improvised Movement category, raters only took into account the movement students performed when it was their turn. For Teamwork/ Specificity of Imitative Movement, raters watched each student’s imitation of both of their neighbors and scored the better one. And for Stage Presence, raters watched for how focused, present, and closely adhering to the neutral position students were as they both performed and imitated their adjacent neighbors, and gave a score based on their stage presence throughout this time.
The rubric was intentionally created to be an ordinal rather than an interval scale, because it seems impossible to say that a score of 4 means the student’s performance in a category was “twice as good” as a performance that earned a score of 2. In general, raters gave scores of 3 in each category to a wide range of performances that all seemed more or less “average.” For instance, for Diction and Volume, raters gave many students a score of 3 when we could understand their name, but did not think their volume necessarily represented volume loud enough for the stage. Thus not every student with a score of 3 in Diction and Volume was exactly as loud as every other student with a score of 3 in this category, to say nothing of those students who received a score of 3 for speaking loudly but not clearly. Additionally, raters tried not to compare students to each other, except with regards to the “originality” dimension mentioned as part of the criteria for Vocabulary and Variety of Improvised Movement. Otherwise raters simply compared them as much as possible to the impartial standards described in the rubric, and scored according to those criteria. Finally, if the videography made it impossible to see any of the student’s imitations, then raters marked this as missing data.
4.2.3 Establ ishing of Inter-‐Rater Rel iabi l i ty In order to establish instrument reliability via acceptable inter-‐rater agreement, two external raters scored 29% of the data and scores were systematically compared. In order to train the external raters to score in the same way, raters watched a few students at a time on the videos, scored them independently, then compared the scores and discussed and resolved discrepancies, making notes regarding the scoring system along the way. Raters continued following this process until they were able to score five students in a row in the same way. Training required a total of 18 cases. Raters then went on to score 85 cases from both the pre and posts of two control classrooms, representing 29% of the total data (total N = 292, 148 pre and 144 post). Because the scoring scale is ordinal rather than interval, the gamma statistic was used to calculate inter-‐rater reliability. The gamma statistics were acceptable (G > 0.7) for all scoring categories. The gamma scores for each category were as follows: Diction and Volume: 0.912, Vocabulary and Variety of Improvised Movement: 0.834, Teamwork/ Specificity of Imitative Movement: 0.881, Stage Presence/ Maintaining Neutral Position: 0.819. When all categories were combined into the Total Score, the resulting gamma between the two raters was 0.725.
4.2.4 Analysis of Drama Learning Scores An initial analysis revealed that 70% (64 out of 92) of students in the treatment group improved in their drama performance between pre and post. In contrast, only 46% (30 out of 65) of students in the control group showed improvement on the post. In addition, treatment students’ score increases tended to be greater than control students’ increases.
Two-‐tailed t-‐tests were conducted between the pre of the treatment and control groups to make sure that both groups started out equivalent, between control group pre and post to ensure there was no
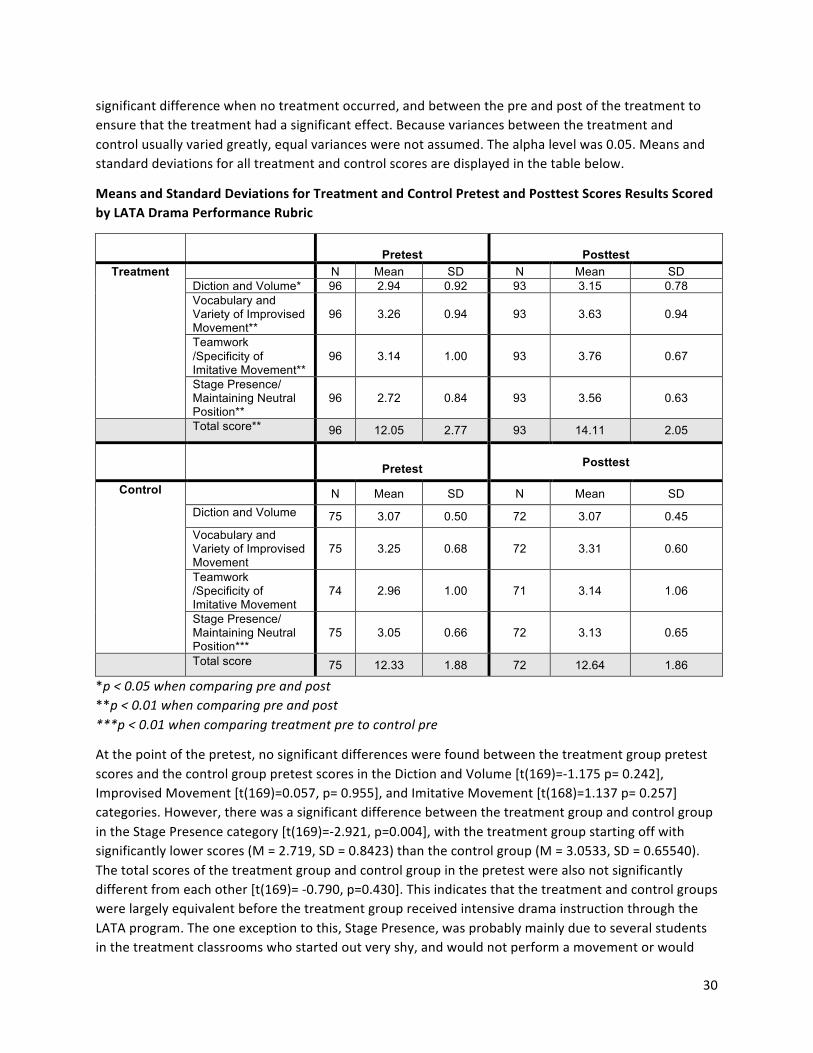
30
significant difference when no treatment occurred, and between the pre and post of the treatment to ensure that the treatment had a significant effect. Because variances between the treatment and control usually varied greatly, equal variances were not assumed. The alpha level was 0.05. Means and standard deviations for all treatment and control scores are displayed in the table below.
Means and Standard Deviations for Treatment and Control Pretest and Posttest Scores Results Scored by LATA Drama Performance Rubric
Pretest
Posttest
Treatment N Mean SD N Mean SD Diction and Volume* 96 2.94 0.92 93 3.15 0.78 Vocabulary and Variety of Improvised Movement**
96 3.26 0.94 93 3.63 0.94
Teamwork /Specificity of Imitative Movement**
96 3.14 1.00 93 3.76 0.67
Stage Presence/ Maintaining Neutral Position**
96 2.72 0.84 93 3.56 0.63
Total score** 96 12.05 2.77 93 14.11 2.05
Pretest Posttest
Control N Mean SD N Mean SD Diction and Volume 75 3.07 0.50 72 3.07 0.45 Vocabulary and Variety of Improvised Movement
75 3.25 0.68 72 3.31 0.60
Teamwork /Specificity of Imitative Movement
74 2.96 1.00 71 3.14 1.06
Stage Presence/ Maintaining Neutral Position***
75 3.05 0.66 72 3.13 0.65
Total score 75 12.33 1.88 72 12.64 1.86
*p < 0.05 when comparing pre and post **p < 0.01 when comparing pre and post ***p < 0.01 when comparing treatment pre to control pre
At the point of the pretest, no significant differences were found between the treatment group pretest scores and the control group pretest scores in the Diction and Volume [t(169)=-‐1.175 p= 0.242], Improvised Movement [t(169)=0.057, p= 0.955], and Imitative Movement [t(168)=1.137 p= 0.257] categories. However, there was a significant difference between the treatment group and control group in the Stage Presence category [t(169)=-‐2.921, p=0.004], with the treatment group starting off with significantly lower scores (M = 2.719, SD = 0.8423) than the control group (M = 3.0533, SD = 0.65540). The total scores of the treatment group and control group in the pretest were also not significantly different from each other [t(169)= -‐0.790, p=0.430]. This indicates that the treatment and control groups were largely equivalent before the treatment group received intensive drama instruction through the LATA program. The one exception to this, Stage Presence, was probably mainly due to several students in the treatment classrooms who started out very shy, and would not perform a movement or would

31
only do so after a great deal of coaxing. That kind of behavior was not seen in the control classrooms, so fewer scores of 1 for Stage Presence were given there.
As expected, in the control condition, no significant differences were found between the pretest and posttest scores for the four categories: Diction and Volume [t(66)=0.725, p= 0.471], Improvised Movement [t(66)=-‐0.683, p=0.497], Imitative Movement: [t(64)= -‐1.773, p=0.081], and Stage Presence [t(66)= -‐1.341, p=0.184]. There was also no significant difference between the pretest and posttest of the control group’s total score [t(66)= -‐1.790, p=0.078]. This indicates that scores as a group remained similar on average between pre and post, as one would expect for classrooms that received no special drama instruction.
The treatment classrooms, however, demonstrated significant gains between pre and post in all scoring categories: Diction and Volume [t(91)= -‐2.002, p=0.048], Improvised Movement [t(91)= -‐3.265, p=0.002], Imitative Movement [t(91)= -‐5.226, p<0.001], and Stage Presence [t(91)= -‐7.960, p<0.001]. The total scores for the pretest and posttest were also significantly different from each other [t(91)= -‐6.883, p<0.001], with the posttest scores higher than the pretest scores on average. Thus, the LATA drama instruction appeared to have a positive effect on students’ performances, which the instrument was able to detect, as predicted.
Several analyses were also performed to check if the instrument could distinguish between students who had received intensive drama instruction (treatment) and those who had not (control). First, a t-‐test was performed (2-‐tailed, α = 0.05) testing the difference between the treatment and control change scores (change score = post score – pre score). Means and standard deviations of these change scores can be found in Table 4. The results showed that there were significant differences in the change score between the treatment group and the control group in the Diction and Volume [t(157)=2.090, p= . 038], Improvised Movement [t(157)=2.202, p=.029], and Stage Presence [t(155)=5.208, p<.001] categories, as well as in the total change score [t(157)=4.503, p<.001]. The only sub-‐scale with no significant differences in the change scores between treatment group and control group was the Imitative Movement category [t=1.892(155), p=.061]. All change scores can be found in the table below.
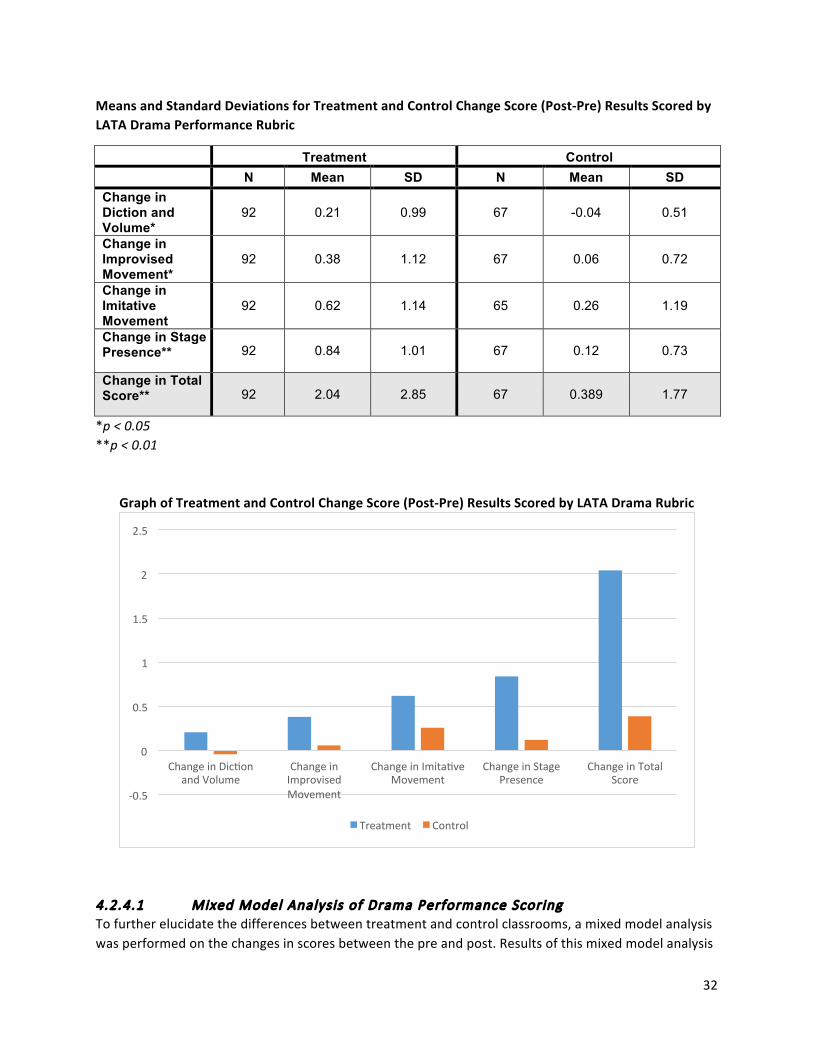
32
Means and Standard Deviations for Treatment and Control Change Score (Post-‐Pre) Results Scored by LATA Drama Performance Rubric
Treatment Control N Mean SD N Mean SD
Change in Diction and Volume*
92 0.21 0.99 67 -0.04 0.51
Change in Improvised Movement*
92 0.38 1.12 67 0.06 0.72
Change in Imitative Movement
92 0.62 1.14 65 0.26 1.19
Change in Stage Presence** 92 0.84 1.01 67 0.12 0.73
Change in Total Score** 92 2.04 2.85 67 0.389 1.77
*p < 0.05 **p < 0.01
Graph of Treatment and Control Change Score (Post-‐Pre) Results Scored by LATA Drama Rubric
4.2.4.1 Mixed Model Analysis of Drama Performance Scoring To further elucidate the differences between treatment and control classrooms, a mixed model analysis was performed on the changes in scores between the pre and post. Results of this mixed model analysis
-‐0.5
0
0.5
1
1.5
2
2.5
Change in Dicxon and Volume
Change in Improvised Movement
Change in Imitaxve Movement
Change in Stage Presence
Change in Total Score
Treatment Control

33
when controlling for the clustered structure of students nested within Teachers, and when controlling for preexisting differences based on the pre scores as a covariate, showed that changes in Total Score were statistically significantly different between treatment and control classrooms.
For Total Score, the control classrooms gained an average of 0.3881 points on the post (SD 1.77487), while the treatment classrooms gained an average of 2.0435 points (SD 2.84745). The model showed that this difference was statistically significant at α < 0.05 (p = 0.033).
For Stage Presence, control classrooms gained an average of 0.1194 (SD 0.72868) points on the post, while treatment classrooms gained an average of 0.8370 points (SD 1.0085). This difference also turned out to be statistically significant at α < 0.05 (p = 0.045). From this it appears that the Stage Presence change score contributed the most to the difference between the treatment and control groups’ change in Total Score.
The differences between treatment and control for the remaining three categories were not statistically significant, but all still favored the treatment classrooms. Taken together, then, they all contributed to the higher Total Score mean that the treatment classrooms had.
Ultimately, the rubric was able to distinguish between classrooms that had received intensive drama instruction and those that had not, by showing improvements that one would expect from students who had spent 14 weeks working on acting. The rubric also achieved acceptable inter-‐rater reliability. We feel it is ready for widespread adoption by drama teachers conducting the name-‐and-‐movement exercise.
The significant differences between pre and post and between treatment and control bode well for LATA’s model of theater instruction. The results suggest that LATA’s theater program is effective in improving students’ skills in acting.
More details on the drama performance measure will be reported in an upcoming publication.

34
5 CREATIVITY MEASURES
In order to explore the possible effects the LATA program had on students’ creativity, we used the Consensual Assessment Technique (CAT; Amabile, 1982), in which judges rated performances based on their own subjective definition of creativity. Despite the subjectivity involved in this technique, experts in a field tend to agree upon which products are creative and which are not when rating with this technique. Since fostering creativity is one of ICA’s most important goals, demonstrating a measurable effect upon creativity would help to provide even further support for the LATA model. Additionally, the CAT has never been used with drama performances before, so this work makes a novel contribution to the creativity literature.
5.1 THE USE OF THE CONSENSUAL ASSESSMENT TECHNIQUE IN DRAMA The Consensual Assessment Technique (CAT), pioneered by Amabile (1982), allows for the assessment of products’ creativity by judges who are deemed to be "experts" in a particular domain. The panel is instructed to use their own subjective definition of creativity as they rate artifacts. Important to this technique, experts typically rate creativity relative to the other projects in the sample rather than against some ultimate norm. In our everyday lives, there are gatekeepers who use their own subjective valuations to appraise the creativity of new products, and ultimately, their judgments determine whether or not these new products are preserved and emulated (Csikszentmihalyi, 1988). This is especially true in the context of drama because, by virtue of the art, actors must surrender themselves before an audience, and the collective opinion of the audience determines the creativity and quality of the performance (Hagen, 1962; Nachmanovitch, 1990; Shapiro, 2006). Similarly, consensual assessment depends on the subjective judgments by a panel of judges, and despite the lack of rubrics or deliberation, the judges can generally agree on which pieces are more versus less creative (Amabile, 1983; Hickey, 2001; Kaufman et al, 2008).
Although the consensual assessment technique has proven to be a useful tool in most domains, it has remained unexplored in drama for two primary reasons: (1) Firstly, performances are fleeting; unlike most domains, such as art or music, drama does not yield a permanent tangible artifact that can exist independently of person, place, process, or time (Nachmanovitch, 1990). Although video recording technology makes it possible to capture performances, it is difficult to control all conditions for creative performances and consistent appraisal. (2) Secondly, the consensual assessment technique focuses on creativity of products rather than persons, so to some degree, it is necessary to separate person from product. However, in the context of drama, that is not possible. When we examine the teachings of prominent drama teachers, we find that there is heavy valuation on the actor representing his or her self as a unique human being, and this is a necessary approach, given the transitory nature of performance (Hagen, 1962; Nachmanovitch, 1990; Shapiro, 2006).
5.1.1 Raters and Survey Design To help minimize biases arising from context of performance, we attempted to make conditions as consistent for the raters as possible. We had them view the same videos as used in the drama learning assessment above, of all three treatment and all three control classrooms performing the name-‐and-‐movement exercise, both pre and post, in random order to control for order effects. We then had them rate 10 performances from each classroom’s pre and post on a 1-‐5 point scale (with 1 being “low
35
creativity” and 5 being “high creativity”), for a total of 120 performances. In order to preserve the authentic context of the performance, for each of the 120 video clips, we “sandwiched” each target student between their two neighbors’ performances, so we presented three students in each clip but prompted the raters only to score the second student. By “sandwiching” the students, it allowed for the raters to see which students copied and which students were being copied, which may or may not be an important factor in assessing creativity.
Additionally, in order to ensure ecological validity during the data collection phase, we followed Amabile’s (1982) five guidelines:
(1) Firstly, all raters had some knowledge of drama, although their knowledge levels were not identical. By following this guideline, we were able to ensure that raters were all looking at drama creativity and not some other construct. This also helps ensure that there should be some consistency among perspectives.
(2) Secondly, all raters made their judgments independently. We prompted raters not to communicate with other persons when rating, and by doing so, we were able to control for external social factors that might influence judgment.
(3) Thirdly, judges were also prompted score on the basis of “creativity,” not performance quality or any other overlapping construct. Although it is generally not possible to separate the constructs completely, it helps to minimize conflation of creativity and performance technique.
(4) Fourthly, we prompted raters to score creativity relative to the performances contained in the sample alone. Naturally, all raters had some exposure to actors outside the sample, but by keeping scores closed to the sample, it was easier to establish a baseline for fair comparison.
(5) Finally, we made sure that each rater was viewing each performance in a different order. We used the randomization feature of the survey tool. By doing so, we were able to minimize potential sequencing effects.
Although Amabile (1982) recommends that the raters should be experts, it was not necessary for this evaluation. Since rater agreement is the primary way of establishing validity in the CAT, it was most important for the raters to be able to agree on more creative and less creative performances.
Our first rater (Rater 1) was a non-‐expert who does not have any formal training or education as a performer, but she has considerable knowledge about the literature of creativity. Our second rater (Rater 2) was also a non-‐expert with similar knowledge about the literature of creativity, but unlike the first rater, he had three years of formal acting training without any experience as a working professional. Our third rater (Rater 3) was a professor who had a doctorate in Dramaturgy and more than 25 years of experience as a teacher and professional actor, but no knowledge about the literature of creativity.
When the three raters’ scores were compared to each other using Cronbach’s alpha, the statistic of choice for determining inter-‐rater agreement in the CAT, we found that their inter-‐rater reliability was quite high. Although most psychological measurements require an alpha estimate of 0.8 or higher, we can relax the requirement to 0.7 in the CAT because creativity necessarily depends on some level of flexibility (Kaufman, Plucker, & Baer, 2006; Plucker & Makel, 2010). If the estimate is 0.7 or higher, then it suggests that the CAT is an appropriate instrument to measure creativity in drama. However, in this
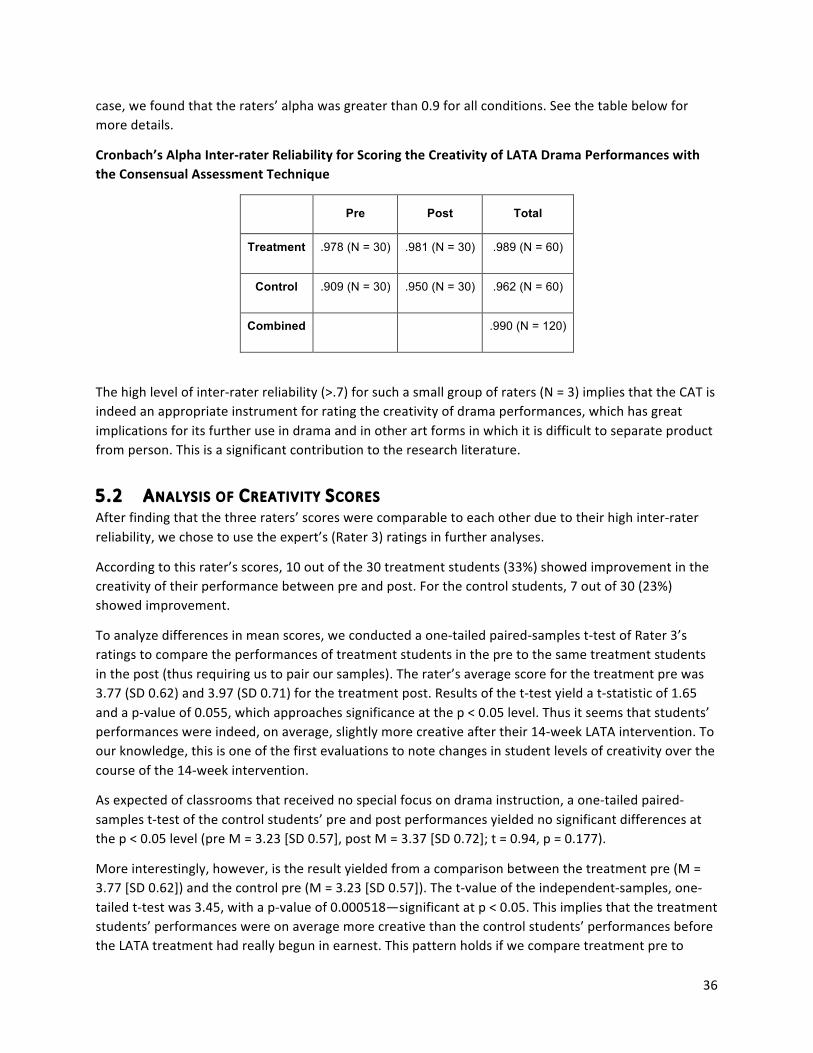
36
case, we found that the raters’ alpha was greater than 0.9 for all conditions. See the table below for more details.
Cronbach’s Alpha Inter-‐rater Reliability for Scoring the Creativity of LATA Drama Performances with the Consensual Assessment Technique
Pre Post Total
Treatment .978 (N = 30) .981 (N = 30) .989 (N = 60)
Control .909 (N = 30) .950 (N = 30) .962 (N = 60)
Combined
.990 (N = 120)
The high level of inter-‐rater reliability (>.7) for such a small group of raters (N = 3) implies that the CAT is indeed an appropriate instrument for rating the creativity of drama performances, which has great implications for its further use in drama and in other art forms in which it is difficult to separate product from person. This is a significant contribution to the research literature.
5.2 ANALYSIS OF CREATIVITY SCORES After finding that the three raters’ scores were comparable to each other due to their high inter-‐rater reliability, we chose to use the expert’s (Rater 3) ratings in further analyses.
According to this rater’s scores, 10 out of the 30 treatment students (33%) showed improvement in the creativity of their performance between pre and post. For the control students, 7 out of 30 (23%) showed improvement.
To analyze differences in mean scores, we conducted a one-‐tailed paired-‐samples t-‐test of Rater 3’s ratings to compare the performances of treatment students in the pre to the same treatment students in the post (thus requiring us to pair our samples). The rater’s average score for the treatment pre was 3.77 (SD 0.62) and 3.97 (SD 0.71) for the treatment post. Results of the t-‐test yield a t-‐statistic of 1.65 and a p-‐value of 0.055, which approaches significance at the p < 0.05 level. Thus it seems that students’ performances were indeed, on average, slightly more creative after their 14-‐week LATA intervention. To our knowledge, this is one of the first evaluations to note changes in student levels of creativity over the course of the 14-‐week intervention.
As expected of classrooms that received no special focus on drama instruction, a one-‐tailed paired-‐samples t-‐test of the control students’ pre and post performances yielded no significant differences at the p < 0.05 level (pre M = 3.23 [SD 0.57], post M = 3.37 [SD 0.72]; t = 0.94, p = 0.177).
More interestingly, however, is the result yielded from a comparison between the treatment pre (M = 3.77 [SD 0.62]) and the control pre (M = 3.23 [SD 0.57]). The t-‐value of the independent-‐samples, one-‐tailed t-‐test was 3.45, with a p-‐value of 0.000518—significant at p < 0.05. This implies that the treatment students’ performances were on average more creative than the control students’ performances before the LATA treatment had really begun in earnest. This pattern holds if we compare treatment pre to
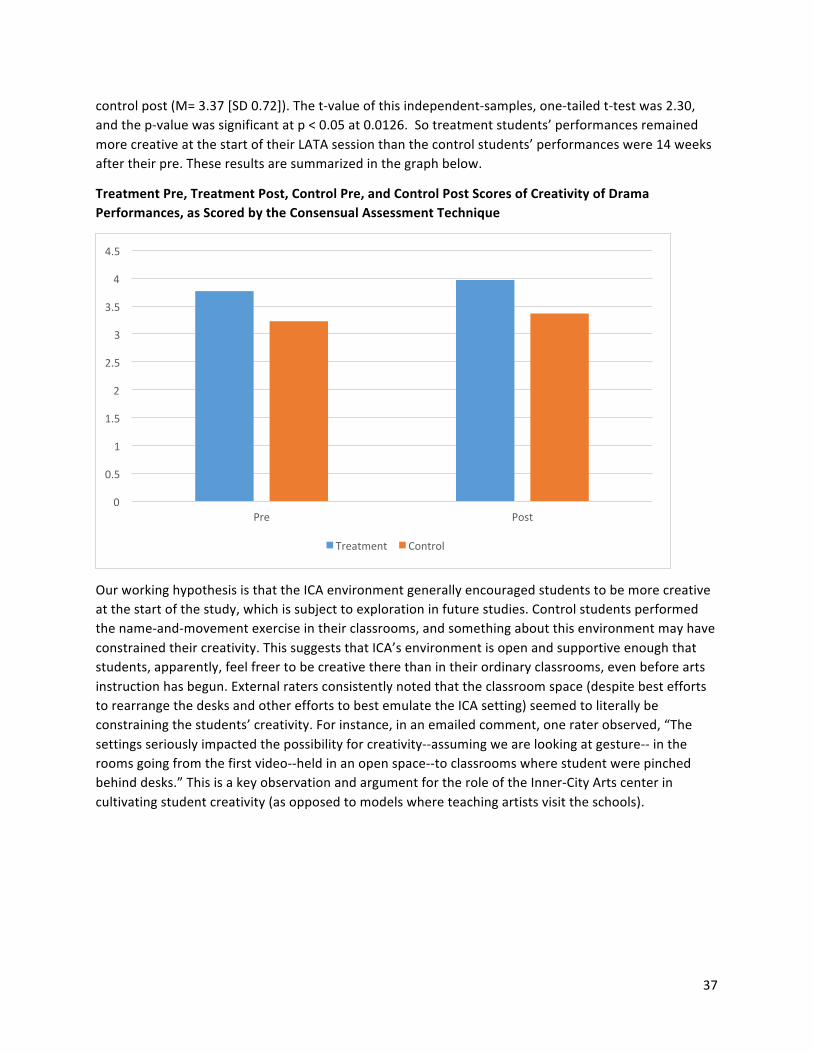
37
control post (M= 3.37 [SD 0.72]). The t-‐value of this independent-‐samples, one-‐tailed t-‐test was 2.30, and the p-‐value was significant at p < 0.05 at 0.0126. So treatment students’ performances remained more creative at the start of their LATA session than the control students’ performances were 14 weeks after their pre. These results are summarized in the graph below.
Treatment Pre, Treatment Post, Control Pre, and Control Post Scores of Creativity of Drama Performances, as Scored by the Consensual Assessment Technique
Our working hypothesis is that the ICA environment generally encouraged students to be more creative at the start of the study, which is subject to exploration in future studies. Control students performed the name-‐and-‐movement exercise in their classrooms, and something about this environment may have constrained their creativity. This suggests that ICA’s environment is open and supportive enough that students, apparently, feel freer to be creative there than in their ordinary classrooms, even before arts instruction has begun. External raters consistently noted that the classroom space (despite best efforts to rearrange the desks and other efforts to best emulate the ICA setting) seemed to literally be constraining the students’ creativity. For instance, in an emailed comment, one rater observed, “The settings seriously impacted the possibility for creativity-‐-‐assuming we are looking at gesture-‐-‐ in the rooms going from the first video-‐-‐held in an open space-‐-‐to classrooms where student were pinched behind desks.” This is a key observation and argument for the role of the Inner-‐City Arts center in cultivating student creativity (as opposed to models where teaching artists visit the schools).
0
0.5
1
1.5
2
2.5
3
3.5
4
4.5
Pre Post
Treatment Control
38
6 SENSE OF COMMUNITY SURVEY MEASURES
6.1 CLASSROOM COMMUNITY SURVEY FOR STUDENTS This strand of the evaluation is measured by the impact of the program on participants’ sense of community, tracking the participating and control groups of students and the extent to which they feel a climate of community in their classroom and school. Protocols for these instruments draw from questions on validated school climate surveys. Outcome measures are repeatedly obtained from all subjects (participants and control) before and after the start of their experience in drama and animation. The estimated time for this administration of the survey is 15-‐30 minutes. A definition established by Osterman (2000) and others in the research field has been used to create quantitative survey instruments to measure 'sense of community' or 'psychological sense of membership' scales. Several researchers have adopted these scales for use in educational contexts and we will be borrowing from this work for the purposes of this evaluation.
Due to limited time at the school sites, we proposed a slight shift in the evaluation design: Rather than administering this instrument to the whole school, we targeted 10 fourth grade classrooms in the treatment (N = 180) and control (N = 180) conditions. This change from the whole school administration to a more targeted administration of this instrument is also reflected in the targeted “Raw Number” and “Ratio” above.
In February 2012, we piloted a single administration of this instrument to 55 fourth grade students participating in the Inner-‐City Arts drama and animation programs. The pilot was seen as successful and we were able to train the new evaluation administration staff as well as answer questions at the school level pertaining to the instrument. In March 2012, we targeted an additional group of 60 fourth grade students participating in the Inner-‐City Arts drama and animation programs in Round 1 of the project evaluation. The post-‐testing for this group took place in June 2012. A second cohort was added to the treatment group and additional survey responses were collected from approximately 120 youth in the treatment condition (a total of 188 youth pre-‐ and post-‐tested) and reported on here.
6.1.1 Contents of Student Survey The survey questions were selected from the Developmental Studies Center’s (2005) Child Development Project Student Questionnaire for Elementary Students. We utilized four scales from that survey, including Sense of Classroom as a Community (24 items), Sense of School as a Community (14 items), Liking for School (7 items), and Enjoyment of Class (4 items), for a total of 49 items. All scales had been previously validated and found reliable. The complete instrument we used can be found in Appendix A.
6.1.2 Results of Student Survey Results of the student classroom community surveys indicate an increase of overall sense of community in 58% (67 out of a total of 116 valid surveys) of the treatment student group. A greater percentage of treatment students showed increases on their posttest responses to each of the subscales than did control students. In addition, all subscale scores favored the treatment in the post, except for Sense of School as a Community, though the difference between treatment and control on that subscale was minimal (53.50 in treatment vs. 53.60 in the control). A one-‐tailed t-‐test showed a statistically significant (p<0.05) increase for treatment students on the Sense of School as a Community subscale (t=2.051, p=0.021), the Enjoyment of Class subscale (t=1.775, p=0.039), and the total score (t=1.699, p=0.046). A two-‐tailed t-‐test comparison between treatment and control showed significant differences favoring the treatment group on the Enjoyment of Class subscale (t=2.130, p = 0.034). Comparisons of other
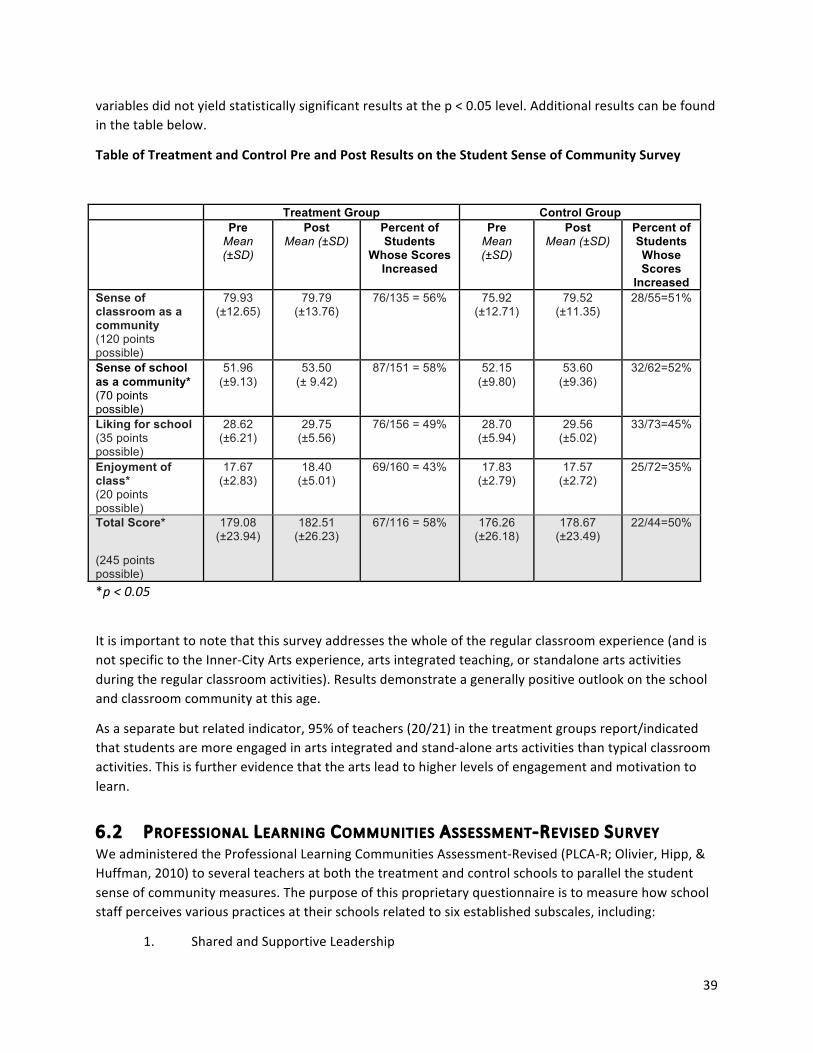
39
variables did not yield statistically significant results at the p < 0.05 level. Additional results can be found in the table below.
Table of Treatment and Control Pre and Post Results on the Student Sense of Community Survey
*p < 0.05
It is important to note that this survey addresses the whole of the regular classroom experience (and is not specific to the Inner-‐City Arts experience, arts integrated teaching, or standalone arts activities during the regular classroom activities). Results demonstrate a generally positive outlook on the school and classroom community at this age.
As a separate but related indicator, 95% of teachers (20/21) in the treatment groups report/indicated that students are more engaged in arts integrated and stand-‐alone arts activities than typical classroom activities. This is further evidence that the arts lead to higher levels of engagement and motivation to learn.
6.2 PROFESSIONAL LEARNING COMMUNITIES ASSESSMENT-‐REVISED SURVEY We administered the Professional Learning Communities Assessment-‐Revised (PLCA-‐R; Olivier, Hipp, & Huffman, 2010) to several teachers at both the treatment and control schools to parallel the student sense of community measures. The purpose of this proprietary questionnaire is to measure how school staff perceives various practices at their schools related to six established subscales, including:
1. Shared and Supportive Leadership
Treatment Group Control Group Pre
Mean (±SD)
Post Mean (±SD)
Percent of Students
Whose Scores Increased
Pre Mean (±SD)
Post Mean (±SD)
Percent of Students Whose Scores
Increased Sense of classroom as a community (120 points possible)
79.93 (±12.65)
79.79 (±13.76)
76/135 = 56% 75.92 (±12.71)
79.52 (±11.35)
28/55=51%
Sense of school as a community* (70 points possible)
51.96 (±9.13)
53.50 (± 9.42)
87/151 = 58% 52.15 (±9.80)
53.60 (±9.36)
32/62=52%
Liking for school (35 points possible)
28.62 (±6.21)
29.75 (±5.56)
76/156 = 49% 28.70 (±5.94)
29.56 (±5.02)
33/73=45%
Enjoyment of class* (20 points possible)
17.67 (±2.83)
18.40 (±5.01)
69/160 = 43% 17.83 (±2.79)
17.57 (±2.72)
25/72=35%
Total Score*
(245 points possible)
179.08 (±23.94)
182.51 (±26.23)
67/116 = 58% 176.26 (±26.18)
178.67 (±23.49)
22/44=50%

40
2. Shared Values and Vision 3. Collective Learning and Application 4. Shared Personal Practice 5. Supportive Conditions-‐Relationships 6. Supportive Conditions-‐Structures
The instrument has previously been found to be valid, reliable, and internally consistent, and has been used in many studies to help gauge teachers’ and administrators’ perceptions of how well their school works as a professional learning community, which is why it was selected for use in the current study. Each subscale has between 5 and 11 questions (52 questions total), each on a 4-‐point scale. Respondents choose a point along the scale to indicate how much they agree or disagree with each of the questions. The complete assessment can be found in Appendix B.
We administered the PLCA-‐R to teachers from all three treatment schools twice during their time of engagement with LATA programming and professional development: once to 65 teachers at the beginning of the 2012-‐2013 school year (“pretest” time point, and end of year 2 of the program), and then again, to 48 teachers at the end of the school year (end of year 3). We have both pre and post data from 31 treatment teachers. Even though we are treating the earlier survey administration as a “pretest,” it is important to note that LATA programming had already been present in these schools for 2 years before the survey administration. This delay in survey administration occurred out of consideration to the school district, which had too many other programs occupying its resources at the time LATA started to be able to carry out another survey task.
Teachers from the control schools were only able to fill out the survey at one time point at the end of the 2012-‐2013 school year (end of year 3), so no pre-‐post comparisons involving the control teachers can be made. The sample size of control teachers was 30, and they all came from one school.
We anticipated that the LATA professional development programs would help to improve the treatment teachers’ perceptions of their schools’ professional learning communities. We also predicted that treatment teachers would have higher scores in the post than the control teachers did. Since LATA is a whole-‐school model in which all the teachers participate in professional development together, we expected teachers to grow their sense of shared values and vision, build stronger supportive relationships, and engage in more collective learning, decision-‐making, and problem-‐solving with direct applications to their teaching practice.
6.2.1 Results of PLCA-‐R Survey The PLCA-‐R is typically used in conjunction with a specific process for building professional learning communities in schools. The LATA program did not exactly follow this process, but rather its own process. The PLCA-‐R was not modified in any way to better reflect the LATA program. Therefore, any improvements on the PLCA-‐R show the applicability of the LATA model to the PLC process, but any lack of improvement may not be surprising.
Treatment teachers showed statistically significant (p < 0.05) gains on the post in all subscales of the PLCA-‐R except for “shared value.” A summary of their pre and post responses can be found in the table below.

41
Paired Samples T-‐test Comparing Pretest and Posttest Responses of Treatment School Teachers on Subscales of Professional Learning Community Survey
Pretest Posttest t
Subscale N Mean SD N Mean SD
Shared Leadership** 31 31.13 7.32 31 35.00 7.93 -2.94
Shared Value 31 25.84 5.65 31 25.35 5.21 0.46
Collective Learning** 31 28.16 6.82 31 32.29 6.95 -3.01
Shared Personal Practice**
30 17.97 4.80 30 21.17 5.23 -3.22
Supportive Relationships* 31 14.55 3.08 31 16.00 3.59 -2.27
Supportive Structures** 31 29.42 4.46 31 31.74 6.02 -2.83
Total Score** 31 143.58 28.57 31 161.77 33.15 -3.23
*p < 0.05 **p < 0.01
Treatment teachers also had significantly higher responses to all subscales, on average, when compared to control teachers, in both the pre and the post. Because no survey data could be collected at the very beginning of the project, and no year 2 (“pre”) data could be collected from the control group, our interpretations of these differences must be cautious. However, it is encouraging that in year 2, the treatment teachers’ sense of community was already perceived to be higher than the control group’s at year 3, and this effect only intensified during LATA’s third year. A comparison of treatment post scores and control scores can be found in the table below. Treatment pre scores are not included in this particular comparison because we are presenting the effects of the entire duration of the program.
Single Time point T-‐test Comparisons of Treatment Post and Control School Teacher Responses on Subscales of Professional Learning Community Survey
Treatment Post Control t
Subscale N Mean SD N Mean SD
Shared Leadership** 48 34.87 8.20 29 19.467 8.42 6.50
Shared Value* 48 25.29 5.81 30 21.13 5.56 2.58
Collective Learning** 48 32.13 7.14 30 23.00 7.76 4.48
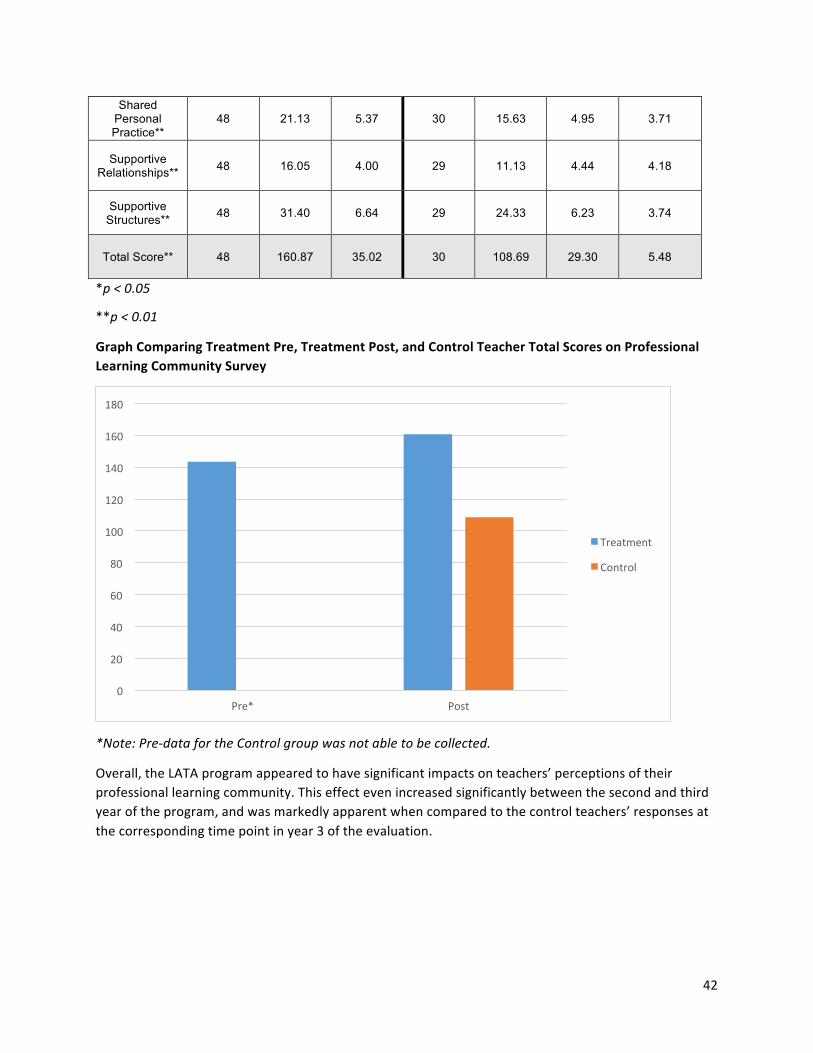
42
Shared Personal Practice**
48 21.13 5.37 30 15.63 4.95 3.71
Supportive Relationships** 48 16.05 4.00 29 11.13 4.44 4.18
Supportive Structures** 48 31.40 6.64 29 24.33 6.23 3.74
Total Score** 48 160.87 35.02 30 108.69 29.30 5.48
*p < 0.05
**p < 0.01
Graph Comparing Treatment Pre, Treatment Post, and Control Teacher Total Scores on Professional Learning Community Survey
*Note: Pre-‐data for the Control group was not able to be collected.
Overall, the LATA program appeared to have significant impacts on teachers’ perceptions of their professional learning community. This effect even increased significantly between the second and third year of the program, and was markedly apparent when compared to the control teachers’ responses at the corresponding time point in year 3 of the evaluation.
0
20
40
60
80
100
120
140
160
180
Pre* Post
Treatment
Control

43
7 TEACHER SURVEY ON OVERALL IMPACT OF ARTS
INTEGRATION
This strand of the evaluation targeted at evaluating the impact of the LATA model on teachers’ comfort, interest, and familiarity with stand-‐alone and arts-‐integrated programming was measured by a pre-‐ and post-‐ survey given to both participating and control-‐group teachers. The survey measured their knowledge of VAPA standards, current delivery of instruction both within the arts and across the curriculum, and the use of the arts as a tool for reflection and assessment in the classroom. This survey is largely based on measures developed in the past by Inner-‐City Arts and has been refined for the purposes of the current evaluation.
Just as with the PLCA-‐R, teachers from all three treatment schools took this survey both at the beginning of LATA’s third year (year 2 time point, N = 72 teachers) and at the end of that year (year 3 time point, N = 66 teachers). Of those who took the post, 31 had also taken the pre-‐survey. Due to issues outside the project’s control (e.g., tensions around budget issues, new curriculum efforts, etc.), the evaluation team was only able to enroll 17 teachers from a single control school to take this survey, and only at a single time point at the end of the program’s third year (so, again, pre-‐post comparisons involving the control group cannot be made). The complete teacher survey on arts integration can be found in Appendix C.
7.1 RESULTS OF ARTS INTEGRATION SURVEY While not every question in the survey showed differences between pre, post, and control, in general, the survey showed positive increases in treatment teachers’ integration of the arts into their classrooms and of participation in LATA professional development.
Early in the survey, teachers were asked how much experience they had had in various art forms, including visual arts, dance, music, drama/theater, and new media/ animation. Their responses were on a 4-‐point scale, with 1 representing “no experience” and 4 representing “a lot of experience.” We hypothesized that participating teachers would gain greater experience across the visual, performing, and new media arts. A summary of the results are presented below with average gain scores moving in a positive direction for the treatment group in dance, music, and new media/animation, especially.
Treatment Pre, Treatment Post, Treatment Gain Scores, and Control Teachers’ Experience with Art Forms as Reported on the ICA Arts Integration Survey
Treatment Pre N ≈ 70
Treatment Post N ≈ 63
Average Gain Scores
Control N = 17
Art Form Experience Mean (±SD) Mean (±SD) Post-Pre Mean (±SD)
Visual Arts 2.56 (±0.75) 2.35 (±0.72) -0.21 2.59 (±0.87) Dance 2.10 (±0.83) 2.24 (±0.71) +0.14 2.12 (±0.60) Music 2.37 (±0.85) 2.40 (±0.91) +0.03 2.29 (±0.69) Drama/ Theatre 2.13 (±0.73) 2.09 (±0.77) -0.04 2.06 (±0.75) New Media/ Animation 1.42 (±0.66) 1.70 (±0.78) +0.28 1.41 (±0.51)

44
In one question, teachers were asked how often they integrated certain art forms into their instruction as either a standalone arts activity (i.e., not taught as part of math, language arts, or other curriculum) or an integrated arts activity (i.e., taught as part of math, science, social studies, language arts, or other content). These art forms included visual arts, dance, music, drama/theater, and new media/animation. In our analyses, responses indicating a frequency of once per day, once weekly, or more than once weekly were all categorized as “frequent.” Any frequency less than that were categorized as “infrequent.” Finally, the third frequency category was “never.”
Treatment teachers showed moderate increases in their integration of some of these art forms between pre and post: For example, the treatment teachers reported frequently using standalone arts activities after the study in all categories more often than control teachers, especially in music (26.4% increase). Similarly, treatment teachers also that reported less frequently that they never use the art forms in either standalone or integrated activities was far less than the control group in 8 out of 10 inquiries across stand-‐alone or arts integrated art forms (see table below). It is interesting to note that most of these increases are in frequently integrated activities, rather than standalone activities, indicating that after the third year of the program, LATA teachers felt more comfortable frequently integrating arts activities into their regular curriculum, rather than just as standalone activities.
Additional striking differences exist when the treatment teachers’ responses on these questions are compared to the control teachers’ responses. Even in the pre, treatment teachers were integrating arts into their instruction more often than control teachers reported doing so in their single survey administration, but the table below reports on the treatment post in order to best show the effect of the entire duration of the program. In nearly every art form, the treatment school teachers were offering more standalone and arts integrated programming. The treatment group’s differences from the control group, however, were most pronounced in integrated arts programming. In the few cases where the control group reported greater frequency of use of arts programming, it was in infrequent standalone categories (namely, Visual Arts, Music, and Drama). It seems that instead of infrequent standalone activities in these art forms, treatment teachers reported using more frequent, integrated activities. This was in line and supported the earlier characterization of the treatment schools as offering higher quality arts integration (consistent with the LATA program) and control schools focusing on stand-‐alone arts programming (e.g., visual arts) that is traditionally offered in elementary schools, which is discussed in the standardized test score results. Additional details can be found in the table below.
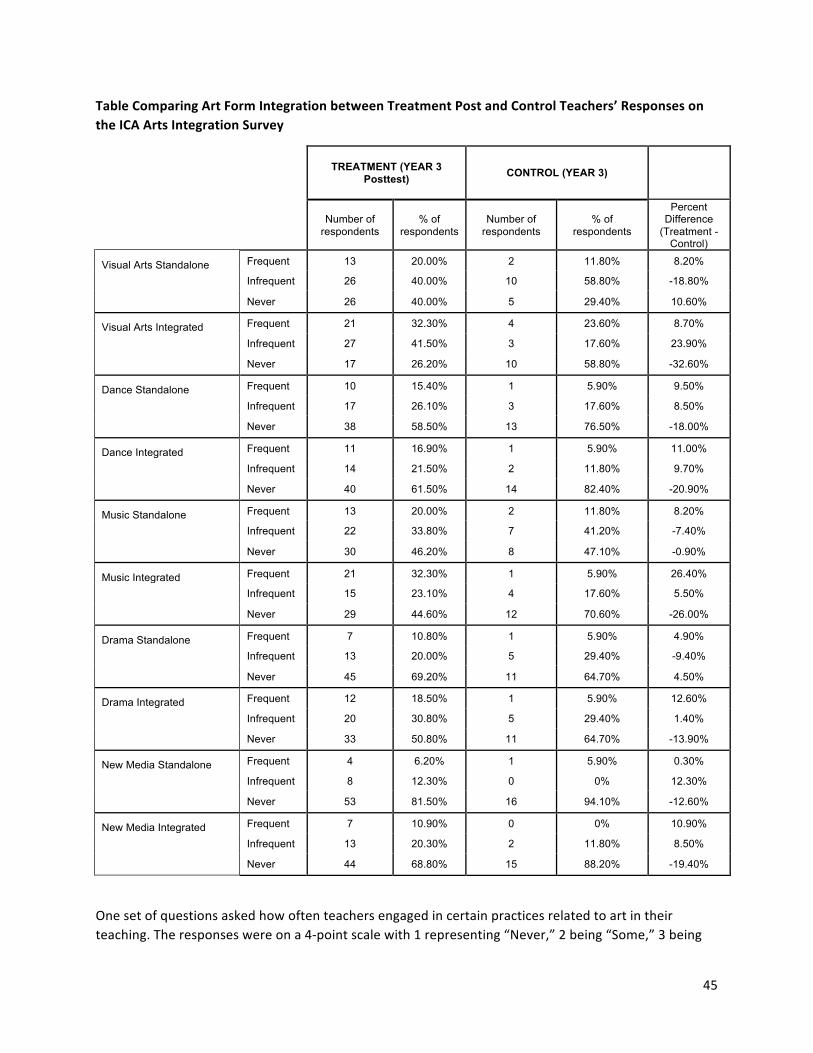
45
Table Comparing Art Form Integration between Treatment Post and Control Teachers’ Responses on the ICA Arts Integration Survey
TREATMENT (YEAR 3 Posttest) CONTROL (YEAR 3)
Number of respondents
% of respondents
Number of respondents
% of respondents
Percent Difference
(Treatment - Control)
Visual Arts Standalone Frequent 13 20.00% 2 11.80% 8.20%
Infrequent 26 40.00% 10 58.80% -18.80%
Never 26 40.00% 5 29.40% 10.60%
Visual Arts Integrated Frequent 21 32.30% 4 23.60% 8.70%
Infrequent 27 41.50% 3 17.60% 23.90%
Never 17 26.20% 10 58.80% -32.60%
Dance Standalone Frequent 10 15.40% 1 5.90% 9.50%
Infrequent 17 26.10% 3 17.60% 8.50%
Never 38 58.50% 13 76.50% -18.00%
Dance Integrated Frequent 11 16.90% 1 5.90% 11.00%
Infrequent 14 21.50% 2 11.80% 9.70%
Never 40 61.50% 14 82.40% -20.90%
Music Standalone Frequent 13 20.00% 2 11.80% 8.20%
Infrequent 22 33.80% 7 41.20% -7.40%
Never 30 46.20% 8 47.10% -0.90%
Music Integrated Frequent 21 32.30% 1 5.90% 26.40%
Infrequent 15 23.10% 4 17.60% 5.50%
Never 29 44.60% 12 70.60% -26.00%
Drama Standalone Frequent 7 10.80% 1 5.90% 4.90%
Infrequent 13 20.00% 5 29.40% -9.40%
Never 45 69.20% 11 64.70% 4.50%
Drama Integrated Frequent 12 18.50% 1 5.90% 12.60%
Infrequent 20 30.80% 5 29.40% 1.40%
Never 33 50.80% 11 64.70% -13.90%
New Media Standalone Frequent 4 6.20% 1 5.90% 0.30%
Infrequent 8 12.30% 0 0% 12.30%
Never 53 81.50% 16 94.10% -12.60%
New Media Integrated Frequent 7 10.90% 0 0% 10.90%
Infrequent 13 20.30% 2 11.80% 8.50%
Never 44 68.80% 15 88.20% -19.40%
One set of questions asked how often teachers engaged in certain practices related to art in their teaching. The responses were on a 4-‐point scale with 1 representing “Never,” 2 being “Some,” 3 being
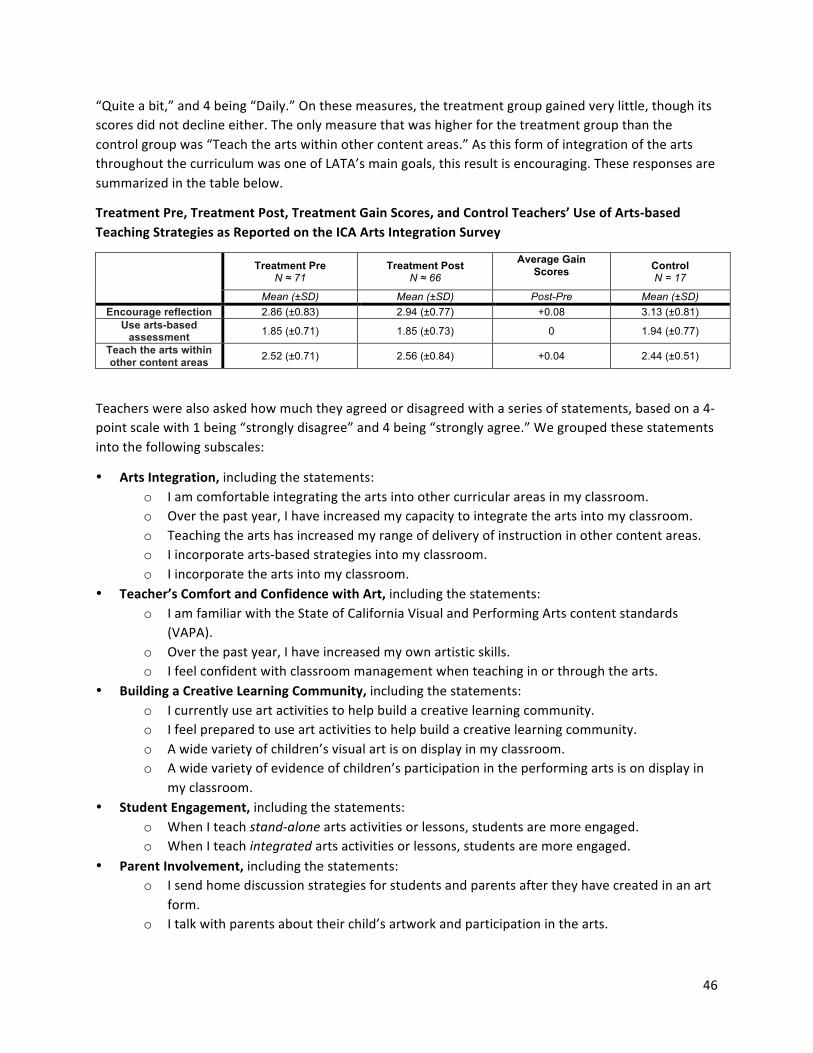
46
“Quite a bit,” and 4 being “Daily.” On these measures, the treatment group gained very little, though its scores did not decline either. The only measure that was higher for the treatment group than the control group was “Teach the arts within other content areas.” As this form of integration of the arts throughout the curriculum was one of LATA’s main goals, this result is encouraging. These responses are summarized in the table below.
Treatment Pre, Treatment Post, Treatment Gain Scores, and Control Teachers’ Use of Arts-‐based Teaching Strategies as Reported on the ICA Arts Integration Survey
Treatment Pre
N ≈ 71 Treatment Post
N ≈ 66
Average Gain Scores
Control N = 17
Mean (±SD) Mean (±SD) Post-Pre Mean (±SD) Encourage reflection 2.86 (±0.83) 2.94 (±0.77) +0.08 3.13 (±0.81)
Use arts-based assessment 1.85 (±0.71) 1.85 (±0.73) 0 1.94 (±0.77)
Teach the arts within other content areas 2.52 (±0.71) 2.56 (±0.84) +0.04 2.44 (±0.51)
Teachers were also asked how much they agreed or disagreed with a series of statements, based on a 4-‐point scale with 1 being “strongly disagree” and 4 being “strongly agree.” We grouped these statements into the following subscales:
• Arts Integration, including the statements: o I am comfortable integrating the arts into other curricular areas in my classroom. o Over the past year, I have increased my capacity to integrate the arts into my classroom. o Teaching the arts has increased my range of delivery of instruction in other content areas. o I incorporate arts-‐based strategies into my classroom. o I incorporate the arts into my classroom.
• Teacher’s Comfort and Confidence with Art, including the statements: o I am familiar with the State of California Visual and Performing Arts content standards
(VAPA). o Over the past year, I have increased my own artistic skills. o I feel confident with classroom management when teaching in or through the arts.
• Building a Creative Learning Community, including the statements: o I currently use art activities to help build a creative learning community. o I feel prepared to use art activities to help build a creative learning community. o A wide variety of children’s visual art is on display in my classroom. o A wide variety of evidence of children’s participation in the performing arts is on display in
my classroom. • Student Engagement, including the statements:
o When I teach stand-‐alone arts activities or lessons, students are more engaged. o When I teach integrated arts activities or lessons, students are more engaged.
• Parent Involvement, including the statements: o I send home discussion strategies for students and parents after they have created in an art
form. o I talk with parents about their child’s artwork and participation in the arts.
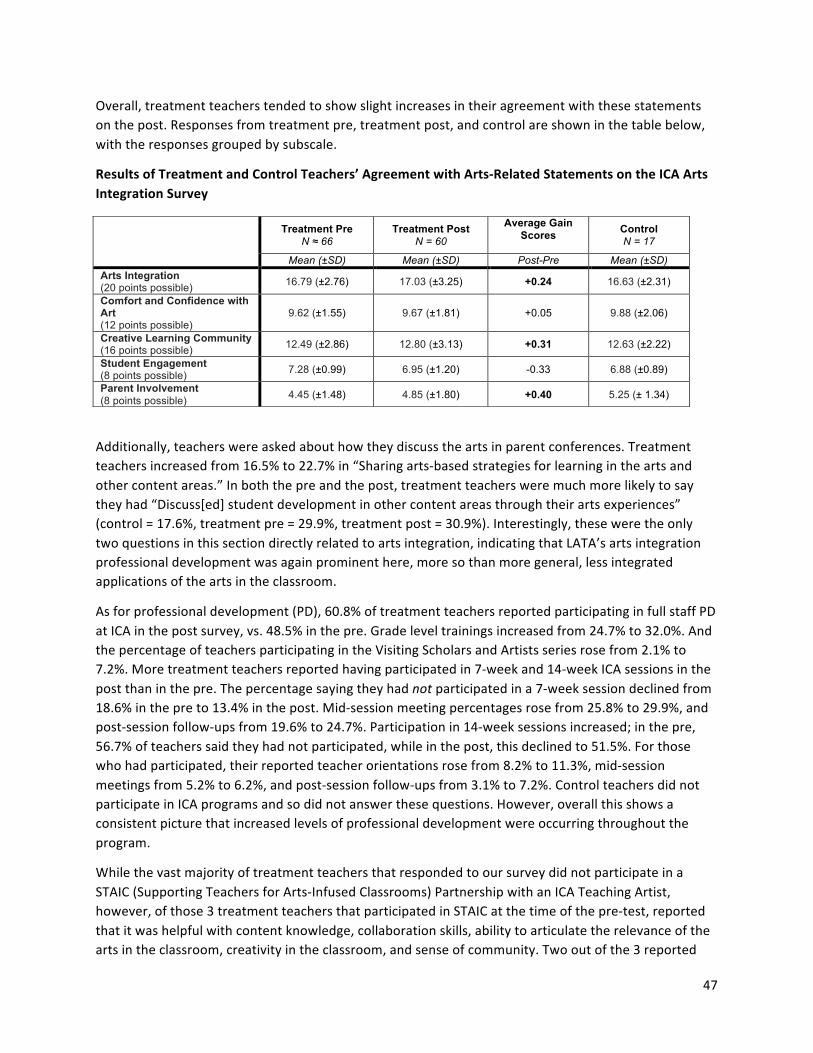
47
Overall, treatment teachers tended to show slight increases in their agreement with these statements on the post. Responses from treatment pre, treatment post, and control are shown in the table below, with the responses grouped by subscale.
Results of Treatment and Control Teachers’ Agreement with Arts-‐Related Statements on the ICA Arts Integration Survey
Additionally, teachers were asked about how they discuss the arts in parent conferences. Treatment teachers increased from 16.5% to 22.7% in “Sharing arts-‐based strategies for learning in the arts and other content areas.” In both the pre and the post, treatment teachers were much more likely to say they had “Discuss[ed] student development in other content areas through their arts experiences” (control = 17.6%, treatment pre = 29.9%, treatment post = 30.9%). Interestingly, these were the only two questions in this section directly related to arts integration, indicating that LATA’s arts integration professional development was again prominent here, more so than more general, less integrated applications of the arts in the classroom.
As for professional development (PD), 60.8% of treatment teachers reported participating in full staff PD at ICA in the post survey, vs. 48.5% in the pre. Grade level trainings increased from 24.7% to 32.0%. And the percentage of teachers participating in the Visiting Scholars and Artists series rose from 2.1% to 7.2%. More treatment teachers reported having participated in 7-‐week and 14-‐week ICA sessions in the post than in the pre. The percentage saying they had not participated in a 7-‐week session declined from 18.6% in the pre to 13.4% in the post. Mid-‐session meeting percentages rose from 25.8% to 29.9%, and post-‐session follow-‐ups from 19.6% to 24.7%. Participation in 14-‐week sessions increased; in the pre, 56.7% of teachers said they had not participated, while in the post, this declined to 51.5%. For those who had participated, their reported teacher orientations rose from 8.2% to 11.3%, mid-‐session meetings from 5.2% to 6.2%, and post-‐session follow-‐ups from 3.1% to 7.2%. Control teachers did not participate in ICA programs and so did not answer these questions. However, overall this shows a consistent picture that increased levels of professional development were occurring throughout the program.
While the vast majority of treatment teachers that responded to our survey did not participate in a STAIC (Supporting Teachers for Arts-‐Infused Classrooms) Partnership with an ICA Teaching Artist, however, of those 3 treatment teachers that participated in STAIC at the time of the pre-‐test, reported that it was helpful with content knowledge, collaboration skills, ability to articulate the relevance of the arts in the classroom, creativity in the classroom, and sense of community. Two out of the 3 reported
Treatment Pre
N ≈ 66 Treatment Post
N = 60
Average Gain Scores
Control N = 17
Mean (±SD) Mean (±SD) Post-Pre Mean (±SD) Arts Integration (20 points possible) 16.79 (±2.76) 17.03 (±3.25) +0.24 16.63 (±2.31)
Comfort and Confidence with Art (12 points possible)
9.62 (±1.55) 9.67 (±1.81) +0.05 9.88 (±2.06)
Creative Learning Community (16 points possible) 12.49 (±2.86) 12.80 (±3.13) +0.31 12.63 (±2.22)
Student Engagement (8 points possible) 7.28 (±0.99) 6.95 (±1.20) -0.33 6.88 (±0.89)
Parent Involvement (8 points possible) 4.45 (±1.48) 4.85 (±1.80) +0.40 5.25 (± 1.34)

48
that STAIC helped them with facilitating skills. At the time of the post-‐test, 4 teachers reported participating in STAIC, and all 4 found it helpful for developing creativity in the classroom. Three said it helped with collaboration skills and sense of community, 2 said it helped with facilitating skills, and 1 teacher agreed that STAIC helped with content knowledge and ability to articulate the relevance of the arts in the classroom.

49
8 CONCLUSION
Despite its sharp focus on three large elementary schools and comparison schools in Los Angeles, Learning and Achieving through the Arts was an extensive and massive undertaking. Few stones were left unturned and even fewer instruments left unconsidered as we as the evaluators framed our broad inquiry agenda.
This study performed a coordinated assessment what it takes to bring a collective and systemic model for bringing arts integration to the core of learning in elementary schools. The work stitched together three strands: (1) Providing students high quality, standards-‐based, sequential instruction in the arts to cultivate arts skills while fostering language development; (2) Providing gateway experiences, extended professional development, and supportive coaching for non-‐arts classroom teachers to grow their potential as art educators; and (3) Augmenting these activities with additional experiences that encourage whole schools to embrace arts strategies and build creative learning classrooms. The LATA evaluation summarized above was implemented in six elementary schools (a total of 3 treatment and 3 control schools) in the Los Angeles Unified School District (LAUSD) from 2010-‐2013.
For this model, regular Inner-‐City Arts instruction was extended from the original the standard seven to fourteen-‐week sessions over the course of one year, augmented by sequential learning as students proceeded through grade levels made possible by the inclusion of all grade 2–6 classrooms at participating schools. Students were bussed to the Inner-‐City Arts campus, where sessions were conducted during the regular school day in state-‐of-‐the-‐art studio environments. Instruction in multiple art forms (for example, Visual Arts, Ceramics, Theater, Dance, Music, Animation) was provided through the delivery of multi-‐week arts instructional sessions centered on California Visual and Performing Arts (VAPA) Content Standards. Seven-‐ and fourteen-‐week, twice-‐weekly sessions served as an integral component of the regular school curriculum. Students attended two sessions over the course of 12 months for a total of between 35 and 70 hours of instruction.
The second strand, professional development, involved a multi-‐tiered training process occurring over the course of more than one year, enabling elementary teachers to develop strategies for arts integration and establish creative learning communities in their classrooms. Art instructors and educators facilitated the integration process through coaching and the sharing of information concerning research-‐based integration practices.
The third strand, building arts-‐enriched school communities, was set in motion through the arts instructional and professional development activities, and further augmented through school-‐wide training and family events, fostering enthusiasm for arts infusion throughout the school environment.
This project succeeded on nearly all levels:
Academic Achievement through Arts Integration
• Overall, project students gained in language arts and mathematics performance • English Language Learners showed larger than average achievement gains

50
• The research design attributes these gains to engagement in intensive arts instruction and high-‐quality arts integration
Arts Performance Skills through Arts Integration
• Student skills in drama performance increased • Student creativity in drama gained through this program • Student engagement in arts activities in treatment classrooms was comparatively high
Sense of Community and Overall Impact of Arts Integration
• Student sense of community increased for about half of all participating students • In contrast to expectations, student's sense of community remained fairly constant over the
three year projects and was fairly even when comparing treatment and control schools. • Several views emerged indicating that treatment teachers experienced an elevated sense that
their schools were effective professional learning communities. (This quality was sampled at specific intervals and not for the project as a whole.)
• LATA model showed to impact teachers’ comfort, interest, and familiarity with stand-‐alone and arts-‐integrated programming.
• Parent involvement grew between the start and end of the program.
Overall, Learning and Achieving through the Arts showed a dozen or more productive elements when put to comparative tests against non-‐participating schools and classrooms. These elements are grist for arts integration activities and experiments of all types. At the very least, LATA has assembled a team of experts and experimenters who could serve as advisors and consultants on a wide range of school based arts integration projects -‐-‐ projects aimed toward academic and arts learning, instructional improvement, and improving school culture through arts-‐based features and activities.
And dissemination? Dissemination is an interesting and challenging prospect when it comes to what this study reports. If this is a 12-‐dimension program, there are conceivably a hundred or more ways that these dimensions COULD fit together, be ordered, and be prioritized. LATA is not a single program, but more like a set of compatible, coherent ideas that have many possible ways to work together. Between the programming designs, the philosophical underpinnings, the ways of assessing student work, and the conceptions of how these pieces can work together, LATA can make valuable contributions to the burgeoning world of arts integrated instruction.
51
REFERENCES Amabile, T. M. (1982). Social psychology of creativity: A consensual assessment technique. Journal of
Personality and Social Psychology, 43, 997–1013.
Amabile, T. M. (1983). The social psychology of creativity: A componential conceptualization. Journal of personality and social psychology, 45(2), 357.
California State Board of Education. (2001). Visual and performing arts content standards for California public schools, prekindergarten through grade twelve. Sacramento, CA: California Department of Education. Retrieved from http://www.cde.ca.gov/be/st/ss/documents/vpastandards.pdf
Csikszentmihalyi, M. (1988). Society, Culture, and Person: A Systems View of Creativity. Cambridge, UK: Cambridge University Press.
Developmental Studies Center (2005). Scales from Student Questionnaire, Child Development Project for Elementary School Students (Grades 3-‐6). Retrieved from https://www.collaborativeclassroom.org/sites/default/files/media/pdfs/cdp/DSC_ElemSch_scales.pdf
Hagen, U. (2009). Respect for Acting. Hoboken, NJ: John Wiley & Sons.
Hickey, M. (2001). An application of Amabile's consensual assessment technique for rating the creativity of children's musical compositions. Journal of Research in Music Education, 49(3), 234-‐244.
Kaufman, J. C., Plucker, J. A., & Baer, J. (2008). Essentials of Creativity Assessment (Vol. 53). Hoboken, NJ: John Wiley & Sons.
Los Angeles Unified School District, Office of Curriculum, Instruction and School Support (2011). LAUSD Media Arts Standards: Kindergarten through 12th Grade. Los Angeles, CA.
Nachmanovitch, S. (1990). Free play: Improvisation in Life and Art. London, UK: Penguin.
National Center for Education Statistics (2013). Enrollment, poverty, and federal funds for the 100 largest school districts, by enrollment size in 2010: Fall 2010, 2009-‐10, and federal fiscal year 2012. Retrieved from http://nces.ed.gov/programs/digest/d12/tables/dt12_104.asp
Olivier, D. F., Hipp, K. K., & Huffman, J. B. (2010). Assessing and analyzing schools. In K. K. Hipp & J. B. Huffman (Eds.). Demystifying professional learning communities: School leadership at its Best. Lanham, MD: Rowman & Littlefield.
Osterman, K. F. (2000). Students' need for belonging in the school community. Review of Educational Research, 70(3), 323-‐367.
Peppler, K. & Catterall, J.S. (2006). Year Two Findings on the Arts Learning of Children enrolled in the LA’s BEST After School Arts Program (Deliverable to the LA’s BEST After-‐School Arts Program). Los Angeles: University of California.
Peppler, K., Catterall, J. & Feilen, K. (2009). Arts in the Middle: A Collaborative Project of Inner-‐City Arts and Los Angeles Unified School District 4 (Deliverable to the U.S. Department of Education). Bloomington, IN: Indiana University.

52
Peppler, K. A., Wessel Powell, C., Thompson, N., & Catterall, J. (2014). Positive impact of arts integration on student academic achievement in English language arts. The Educational Forum, 78(4), 364–377. http://doi.org/10.1080/00131725.2014.941124
Plucker, J. A., & Makel, M. C. (2010). Assessment of creativity. In J.C. Kaufman & R. J. Sternberg (Eds.), The Cambridge Handbook of Creativity (pp. 48-‐73). Cambridge, UK: Cambridge University Press.
Rogoff, B., Baker-‐Sennett, J., Lacasa, P. and Goldsmith, D. (1995), Development through participation in sociocultural activity. New Directions for Child and Adolescent Development, 1995: 45–65. doi: 10.1002/cd.23219956707
Shapiro, M. (1997). An Actor Performs. San Diego, CA: Harcourt Brace.
State Education Agency Directors of Arts Education. (2014). National Core Arts Standards. Dover, DE: State Education Agency Directors of Arts Education. Retrieved from http://www.nationalartsstandards.org/
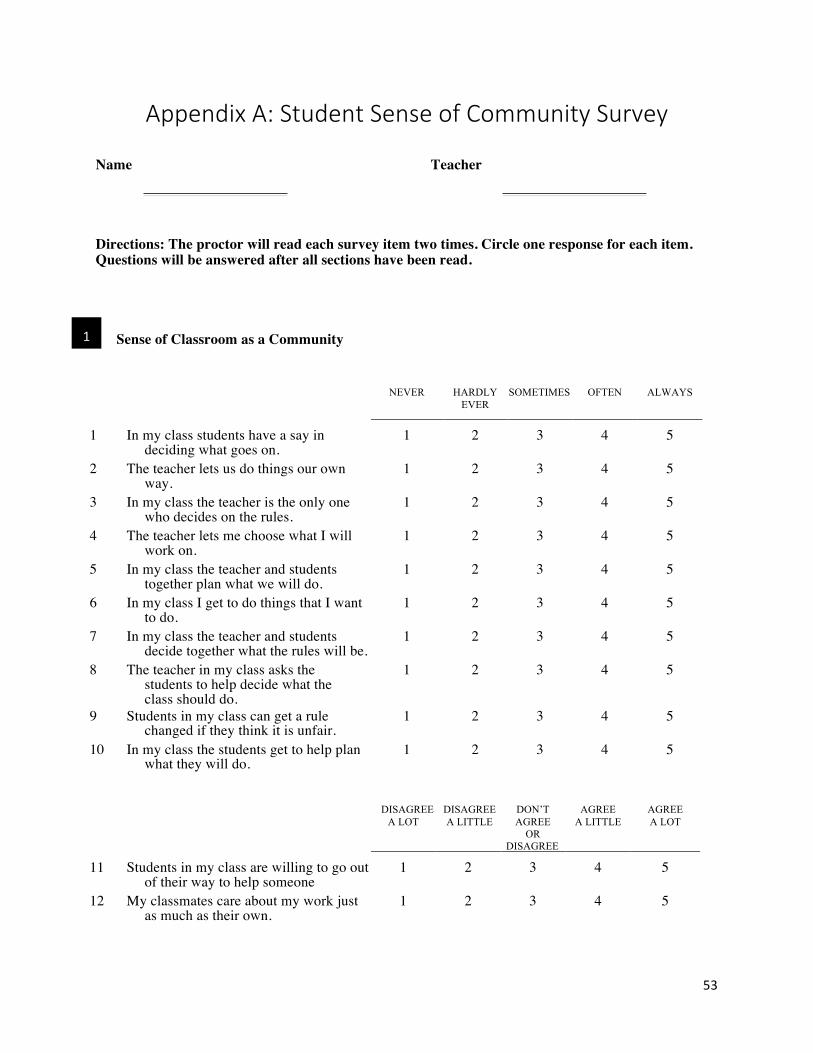
53
Appendix A: Student Sense of Community Survey
Name Teacher
Directions: The proctor will read each survey item two times. Circle one response for each item. Questions will be answered after all sections have been read.
Sense of Classroom as a Community
NEVER HARDLY EVER
SOMETIMES OFTEN ALWAYS
1 In my class students have a say in
deciding what goes on. 1 2 3 4 5
2 The teacher lets us do things our own way.
1 2 3 4 5
3 In my class the teacher is the only one who decides on the rules.
1 2 3 4 5
4 The teacher lets me choose what I will work on.
1 2 3 4 5
5 In my class the teacher and students together plan what we will do.
1 2 3 4 5
6 In my class I get to do things that I want to do.
1 2 3 4 5
7 In my class the teacher and students decide together what the rules will be.
1 2 3 4 5
8 The teacher in my class asks the students to help decide what the class should do.
1 2 3 4 5
9 Students in my class can get a rule changed if they think it is unfair.
1 2 3 4 5
10 In my class the students get to help plan what they will do.
1 2 3 4 5
DISAGREE A LOT
DISAGREE A LITTLE
DON’T AGREE
OR DISAGREE
AGREE A LITTLE
AGREE A LOT
11 Students in my class are willing to go out
of their way to help someone 1 2 3 4 5
12 My classmates care about my work just as much as their own.
1 2 3 4 5
1

54
13 My class is like a family. 1 2 3 4 5
14 The students in my class don’t really care about each other.
1 2 3 4 5
15 A lot of students in my class like to put others down.
1 2 3 4 5
DISAGREE A LOT
DISAGREE A LITTLE
DON’T AGREE
OR DISAGREE
AGREE A LITTLE
AGREE A LOT
16 Students in my class help each other
learn. 1 2 3 4 5
17 Students in my class help each other, even if they are not friends.
1 2 3 4 5
18 Students in my class don’t get along together very well.
1 2 3 4 5
19 Students in my class just look out for themselves.
1 2 3 4 5
20 Students in my class are mean to each other.
1 2 3 4 5
21 When I’m having trouble with my schoolwork, at least one of my classmates will try to help
1 2 3 4 5
22 Students in my class treat each other with respect.
1 2 3 4 5
23 Students in my class work together to solve problems.
1 2 3 4 5
24 When someone in my class does well, everyone in the class feels good.
1 2 3 4 5
Sense of School as a Community
DISAGREE A LOT
DISAGREE A LITTLE
DON’T AGREE
OR DISAGREE
AGREE A LITTLE
AGREE A LOT
25 When I’m having a problem, some other
student will help me. 1 2 3 4 5
26 Students at this school really care about each other.
1 2 3 4 5
27 Students at this school really go out of their way to help someone.
1 2 3 4 5
28 Teachers and students treat each other with respect in this school.
1 2 3 4 5
29 People care about each other in this school.
1 2 3 4 5
30 Students at this school work together to solve problems.
1 2 3 4 5
2
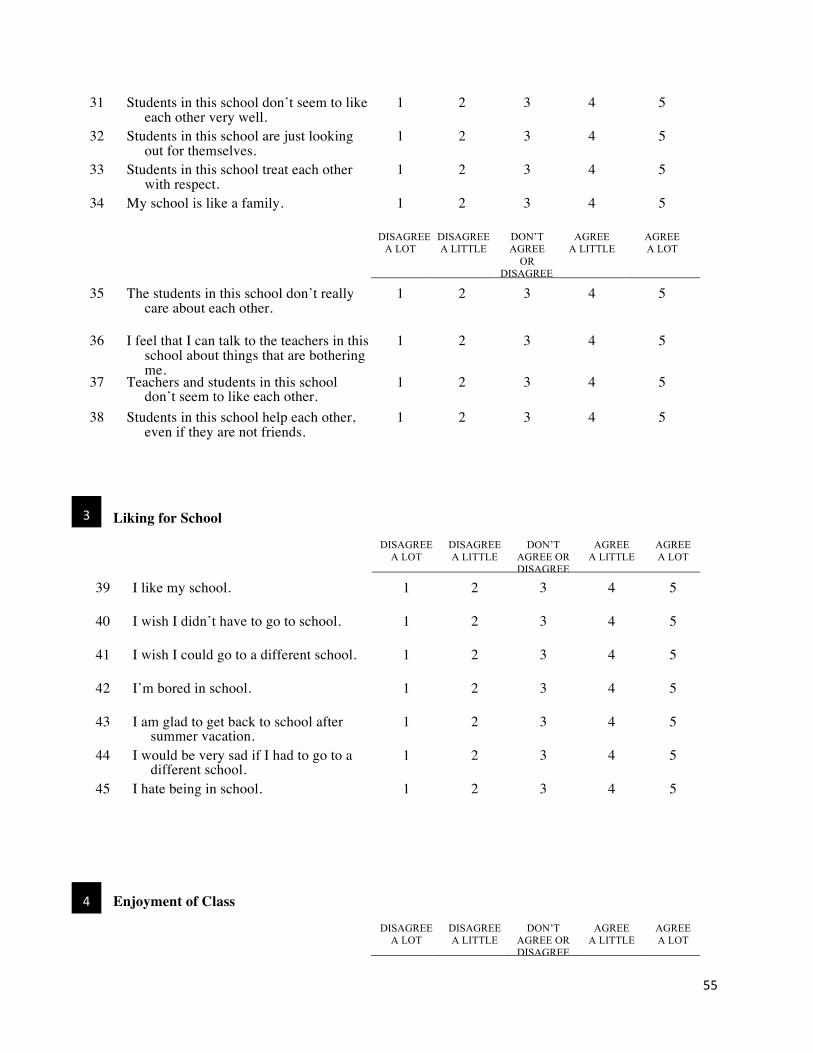
55
31 Students in this school don’t seem to like each other very well.
1 2 3 4 5
32 Students in this school are just looking out for themselves.
1 2 3 4 5
33 Students in this school treat each other with respect.
1 2 3 4 5
34 My school is like a family. 1 2 3 4 5
DISAGREE A LOT
DISAGREE A LITTLE
DON’T AGREE
OR DISAGREE
AGREE A LITTLE
AGREE A LOT
35 The students in this school don’t really
care about each other. 1 2 3 4 5
36 I feel that I can talk to the teachers in this school about things that are bothering me.
1 2 3 4 5
37 Teachers and students in this school don’t seem to like each other.
1 2 3 4 5
38 Students in this school help each other, even if they are not friends.
1 2 3 4 5
Liking for School
DISAGREE A LOT
DISAGREE A LITTLE
DON’T AGREE OR DISAGREE
AGREE A LITTLE
AGREE A LOT
39 I like my school.
1 2 3 4 5
40 I wish I didn’t have to go to school.
1 2 3 4 5
41 I wish I could go to a different school. 1 2 3 4 5
42 I’m bored in school. 1 2 3 4 5
43 I am glad to get back to school after summer vacation.
1 2 3 4 5
44 I would be very sad if I had to go to a different school.
1 2 3 4 5
45 I hate being in school. 1 2 3 4 5
Enjoyment of Class
DISAGREE A LOT
DISAGREE A LITTLE
DON’T AGREE OR DISAGREE
AGREE A LITTLE
AGREE A LOT
4
3

56
46 My classroom is a fun place to be.
1 2 3 4 5
47 What we do in class is a waste of time. 1 2 3 4 5
48 I would rather be in my class than any other one.
1 2 3 4 5
49 I enjoy what I do in class.
1 2 3 4 5
©1988-‐2005 Developmental Studies Center
2000 Embarcadero, Suite 305, Oakland, CA 94606-‐5300 www.devstu.org

57
Appendix B: Professional Learning Communities Assessment for Teachers
Name (First and Last): ____________________________________________________
School: ____________________________________
Date: ______________________________________
Professional Learning Communities Assessment
Directions:
This questionnaire assesses your perceptions about your principal, staff, and stakeholders based on the dimensions of a professional learning community (PLC) and related attributes. This questionnaire contains a number of statements about practices, which occur in some schools. Read each statement and then use the scale below to select the scale point that best reflects your personal degree of agreement with the statement. Shade the appropriate oval provided to the right of each statement. Be certain to select only one response for each statement. Comments after each dimension section are optional.
Key Terms:
! Principal = Principal, not Associate or Assistant Principal ! Staff/Staff Members = All adult staff directly associated with curriculum, instruction, and
assessment of students ! Stakeholders = Parents and community members
Scale: 1 = Strongly Disagree (SD)
2 = Disagree (D)
3 = Agree (A)
4 = Strongly Agree (SA)
STATEMENTS
SCALE

58
Shared and Supportive Leadership
SD
D
A
SA
1.
Staff members are consistently involved in discussing and making decisions about most school issues.
0
0
0
0
2.
The principal incorporates advice from staff members to make decisions.
0
0
0
0
3.
Staff members have accessibility to key information.
0
0
0
0
4.
The principal is proactive and addresses areas where support is needed.
0
0
0
0
5.
Opportunities are provided for staff members to initiate change.
0
0
0
0
6.
The principal shares responsibility and rewards for innovative actions.
0
0
0
0
7.
The principal participates democratically with staff sharing power and authority.
0
0
0
0
8.
Leadership is promoted and nurtured among staff members.
0
0
0
0

59
9.
Decision-‐making takes place through committees and communication across grade and subject areas.
0
0
0
0
10.
Stakeholders assume shared responsibility and accountability for student learning without evidence of imposed power and authority.
0
0
0
0
11.
Staff members use multiple sources of data to make decisions about teaching and learning.
0
0
0
0
COMMENTS:
STATEMENTS
SCALE
Shared Values and Vision
SD
D
A
SA
12.
A collaborative process exists for developing a shared sense of values among staff.
0
0
0
0
13.
Shared values support norms of behavior that guide decisions about teaching and learning.
0
0
0
0
14.
Staff members share visions for school improvement that have an undeviating focus on student learning.
0
0
0
0
15.
Decisions are made in alignment with the school’s values and vision.
0
0
0
0
16.
A collaborative process exists for developing a shared vision among staff.
0
0
0
0
17.
School goals focus on student learning beyond test scores and grades.
0
0
0
0
18.
Policies and programs are aligned to the school’s vision.
0
0
0
0
19.
Stakeholders are actively involved in creating high expectations that serve to increase student achievement.
0
0
0
0
20.
Data are used to prioritize actions to reach a shared vision.
0
0
0
0
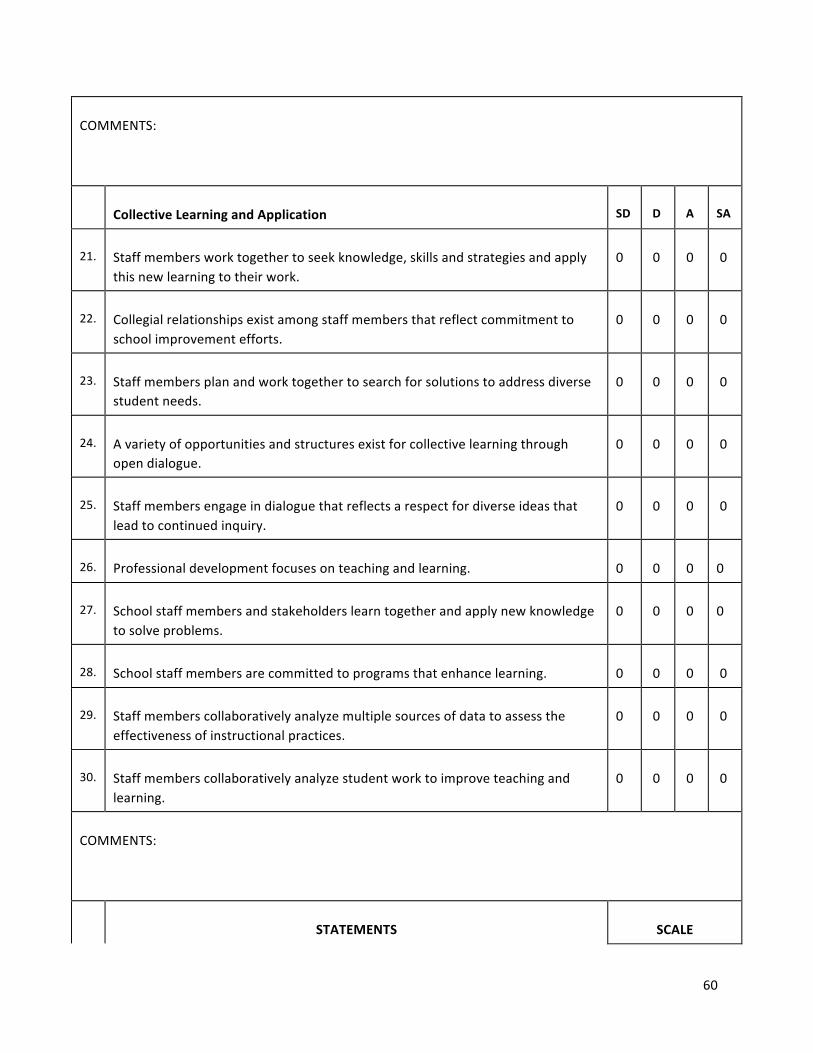
60
COMMENTS:
Collective Learning and Application
SD
D
A
SA
21.
Staff members work together to seek knowledge, skills and strategies and apply this new learning to their work.
0
0
0
0
22.
Collegial relationships exist among staff members that reflect commitment to school improvement efforts.
0
0
0
0
23.
Staff members plan and work together to search for solutions to address diverse student needs.
0
0
0
0
24.
A variety of opportunities and structures exist for collective learning through open dialogue.
0
0
0
0
25.
Staff members engage in dialogue that reflects a respect for diverse ideas that lead to continued inquiry.
0
0
0
0
26.
Professional development focuses on teaching and learning.
0
0
0
0
27.
School staff members and stakeholders learn together and apply new knowledge to solve problems.
0
0
0
0
28.
School staff members are committed to programs that enhance learning.
0
0
0
0
29.
Staff members collaboratively analyze multiple sources of data to assess the effectiveness of instructional practices.
0
0
0
0
30.
Staff members collaboratively analyze student work to improve teaching and learning.
0
0
0
0
COMMENTS:
STATEMENTS
SCALE
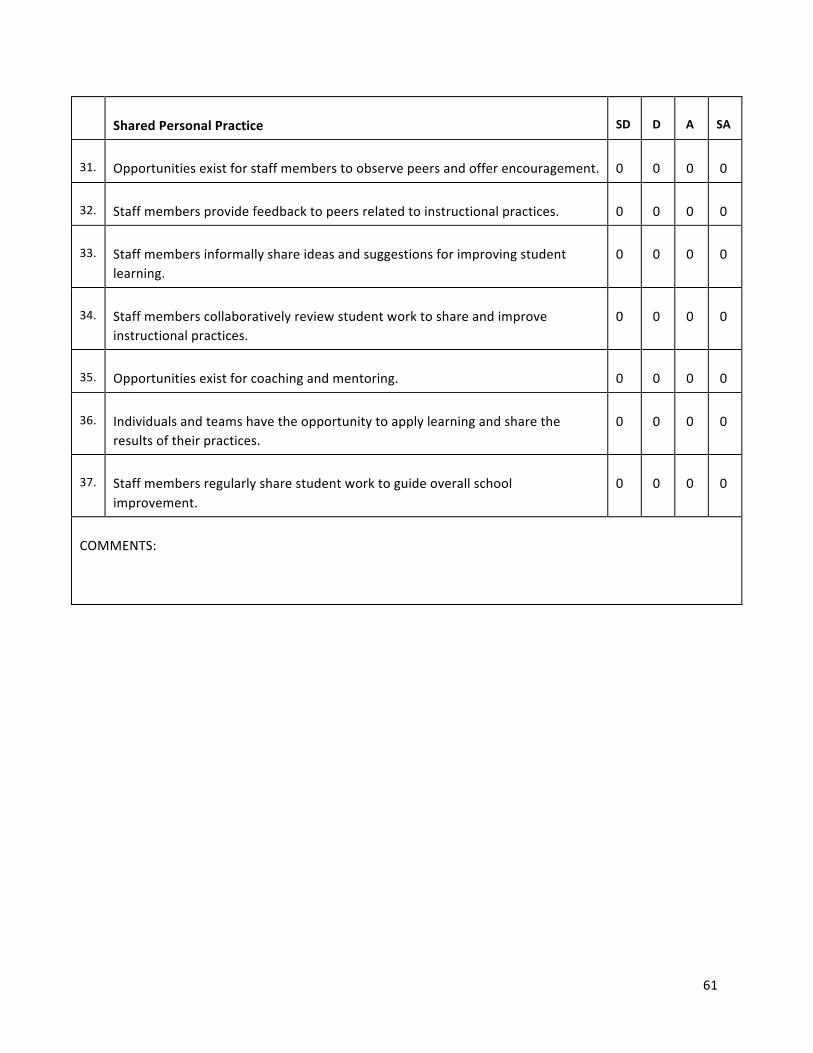
61
Shared Personal Practice
SD
D
A
SA
31.
Opportunities exist for staff members to observe peers and offer encouragement.
0
0
0
0
32.
Staff members provide feedback to peers related to instructional practices.
0
0
0
0
33.
Staff members informally share ideas and suggestions for improving student learning.
0
0
0
0
34.
Staff members collaboratively review student work to share and improve instructional practices.
0
0
0
0
35.
Opportunities exist for coaching and mentoring.
0
0
0
0
36.
Individuals and teams have the opportunity to apply learning and share the results of their practices.
0
0
0
0
37.
Staff members regularly share student work to guide overall school improvement.
0
0
0
0
COMMENTS:

62
Supportive Conditions -‐ Relationships
SD
D
A
SA
38.
Caring relationships exist among staff and students that are built on trust and respect.
0
0
0
0
39.
A culture of trust and respect exists for taking risks.
0
0
0
0
40.
Outstanding achievement is recognized and celebrated regularly in our school.
0
0
0
0
41.
School staff and stakeholders exhibit a sustained and unified effort to embed change into the culture of the school.
0
0
0
0
42.
Relationships among staff members support honest and respectful examination of data to enhance teaching and learning.
0
0
0
0
COMMENTS:
STATEMENTS
SCALE
Supportive Conditions -‐ Structures
SD
D
A
SA
43.
Time is provided to facilitate collaborative work.
0
0
0
0
44.
The school schedule promotes collective learning and shared practice.
0
0
0
0
45.
Fiscal resources are available for professional development.
0
0
0
0
46.
Appropriate technology and instructional materials are available to staff.
0
0
0
0
47.
Resource people provide expertise and support for continuous learning.
0
0
0
0
48.
The school facility is clean, attractive and inviting.
0
0
0
0
49.
The proximity of grade level and department personnel allows for ease in collaborating with colleagues.
0
0
0
0
50.
Communication systems promote a flow of information among staff members.
0
0
0
0
63
51.
Communication systems promote a flow of information across the entire school community including: central office personnel, parents, and community members.
0
0
0
0
52.
Data are organized and made available to provide easy access to staff members.
0
0
0
0
COMMENTS:
© Copyright 2010
Source: Olivier, D. F., Hipp, K. K., & Huffman, J. B. (2010). Assessing and analyzing schools. In K. K. Hipp & J. B. Huffman (Eds.). Demystifying professional learning communities: School leadership at its Best. Lanham, MD: Rowman & Littlefield.

64
Appendix C: Learning and Achieving Through the Arts (LATA) Teacher Survey
Directions: Please complete both the front and the back page of the survey. 1. Name __________________________________________________________________________
2. School _________________________________________________________________________
3. What grade(s) and subject(s) do you teach? ____________________________________________
4. How many years have you been teaching? _____________________________________________
5. Check the box that best describes your experience in the art form (i.e., how much have you either practiced and/or participated in the art activity).
No experience
Some experience
Quite a bit of experience
A lot of experience
a. Visual Arts
b. Dance
c. Music
d. Drama/Theatre
e. New Media/Animation
6. In the past 12 months, what art form(s) did you teach as either a stand-alone arts activity (i.e., not taught as part of math, language arts, or other curriculum) or an integrated arts activity (i.e., taught as part of a math, science, social studies, language arts, or other content) arts activity? Indicate how often you taught the activity below (e.g., never, daily, 1/week, 1/month, etc.).
Stand-alone arts activities Integrated arts activities
a. Visual Arts _______________________ _______________________
b. Dance _______________________ _______________________
c. Music _______________________ _______________________
d. Drama/Theatre _______________________ _______________________
e. New Media/Animation _______________________ _______________________
7. In your teaching, how often do you do the following:
Never Some Quite a bit Daily
a. Encourage reflection b. Use arts-based assessment
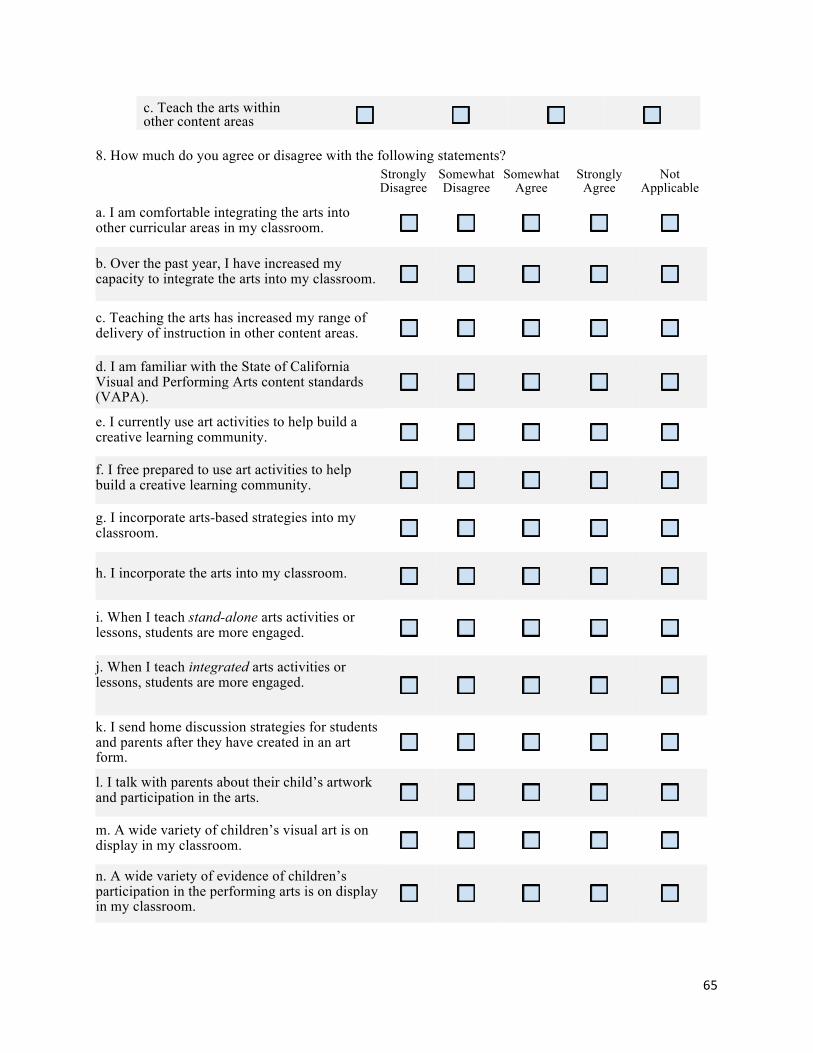
65
c. Teach the arts within other content areas
8. How much do you agree or disagree with the following statements? Strongly
Disagree Somewhat Disagree
Somewhat Agree
Strongly Agree
Not Applicable
a. I am comfortable integrating the arts into other curricular areas in my classroom.
b. Over the past year, I have increased my capacity to integrate the arts into my classroom.
c. Teaching the arts has increased my range of delivery of instruction in other content areas.
d. I am familiar with the State of California Visual and Performing Arts content standards (VAPA).
e. I currently use art activities to help build a creative learning community.
f. I free prepared to use art activities to help build a creative learning community.
g. I incorporate arts-based strategies into my classroom.
h. I incorporate the arts into my classroom.
i. When I teach stand-alone arts activities or lessons, students are more engaged.
j. When I teach integrated arts activities or lessons, students are more engaged.
k. I send home discussion strategies for students and parents after they have created in an art form.
l. I talk with parents about their child’s artwork and participation in the arts.
m. A wide variety of children’s visual art is on display in my classroom.
n. A wide variety of evidence of children’s participation in the performing arts is on display in my classroom.
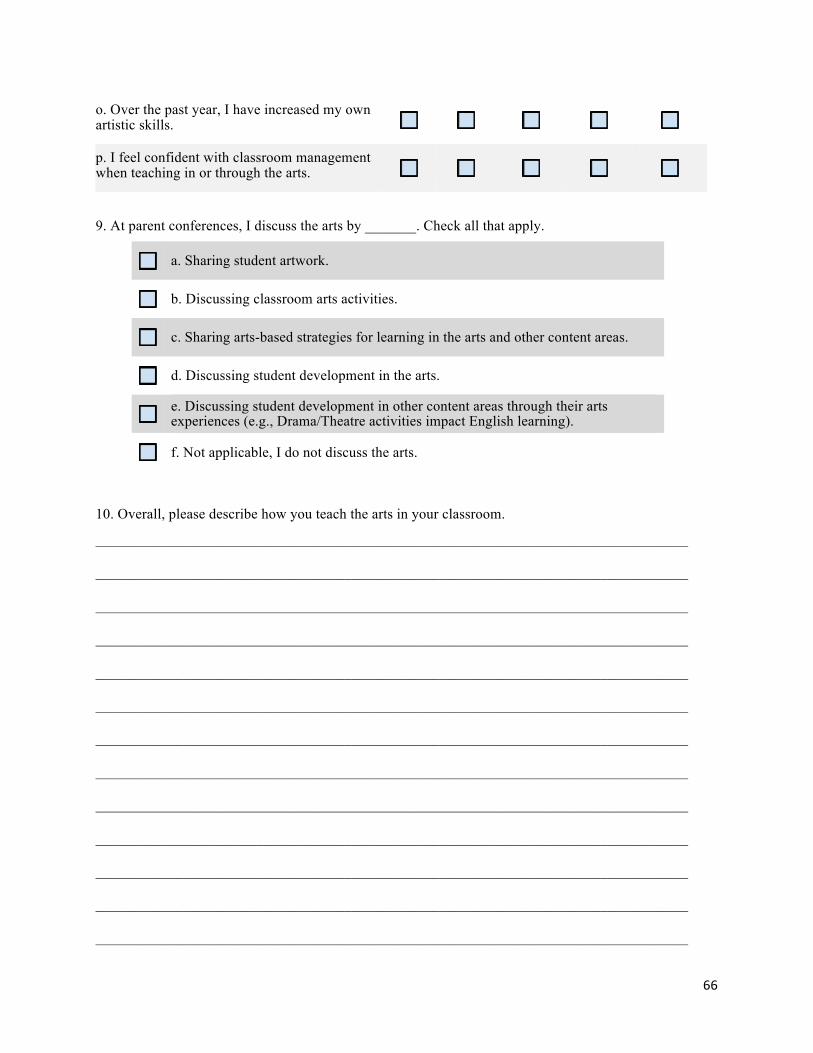
66
o. Over the past year, I have increased my own artistic skills.
p. I feel confident with classroom management when teaching in or through the arts.
9. At parent conferences, I discuss the arts by _______. Check all that apply.
a. Sharing student artwork.
b. Discussing classroom arts activities.
c. Sharing arts-based strategies for learning in the arts and other content areas.
d. Discussing student development in the arts.
e. Discussing student development in other content areas through their arts experiences (e.g., Drama/Theatre activities impact English learning).
f. Not applicable, I do not discuss the arts.
10. Overall, please describe how you teach the arts in your classroom.
_________________________________________________________________________________
_________________________________________________________________________________
_________________________________________________________________________________
_________________________________________________________________________________
_________________________________________________________________________________
_________________________________________________________________________________
_________________________________________________________________________________
_________________________________________________________________________________
_________________________________________________________________________________
_________________________________________________________________________________
_________________________________________________________________________________
_________________________________________________________________________________
_________________________________________________________________________________
67
_________________________________________________________________________________
_________________________________________________________________________________
_________________________________________________________________________________
_________________________________________________________________________________
11. Have you participated in the following at Inner-City Arts:
Yes No
a. Full Staff Professional Development?
b. Grade-Level Trainings?
c. Saturday Creativity in the Classroom Series?
d. Teachers Institute in the UCLA Teacher Education Program or Mount St. Mary’s College?
e. Summer Creativity Practicum series?
f. Visiting Scholars and Artists series?
12. Have you participated in a 7-week student session at Inner-City Arts?
Yes No
If yes, have you participated in any of the following? Please check all that apply.
a. Teacher Orientation
b. Mid-Session Meeting
c. Post-Session Follow-Up
13. Have you participated in a 14-week student session at Inner-City Arts?
Yes No
If yes, have you participated in any of the following? Please check all that apply.
a. Teacher Orientation
b. Mid-Session Meeting

68
c. Post-Session Follow-Up 14. Have you participated in a STAIC (Supporting Teachers for Arts-Infused Classrooms) Partnership with an Inner-City Arts Teaching Artist?
Yes No
If yes, how has the experience of working with a STAIC artist partner benefited your teaching? Please check all that apply.
a. Content knowledge
b. Collaboration skills
c. Ability to articulate the relevance of the arts in the classroom
d. Facilitating skills
e. Creativity in the classroom
f. Sense of community
g. Not applicable