lear 2004 detroitautoconference
TRANSCRIPT
AANY Detroit Automotive Conference
January 8, 2004
AANY Detroit Automotive Conference
January 8, 2004
fast forward
advance relentlesslyworld’s leading automotive interior supplier
R
2
““This is Lear” VideoThis is Lear” Video(5:00 minutes)(5:00 minutes)

3
Agenda
I. Strategic OverviewBob Rossiter, Chairman & CEO
II. Industry ChallengesJim Vandenberghe, Vice Chairman
III. Sales Backlog Update and2004 Financial Guidance
Dave Wajsgras, SVP & CFO
IV. Panel Q & A Session
I. Strategic OverviewBob Rossiter, Chairman & CEO
II. Industry ChallengesJim Vandenberghe, Vice Chairman
III. Sales Backlog Update and2004 Financial Guidance
Dave Wajsgras, SVP & CFO
IV. Panel Q & A Session

4
Strategic Overview

5
Customer-Focused andPerformance-Driven Culture
Strategic Focus
Highest Rated Tier I
Supplier in Quality and Customer Satisfaction
#1, #2 or #3 Market Share in Core Products /
Markets
Best Equity Value in the
Industry
6
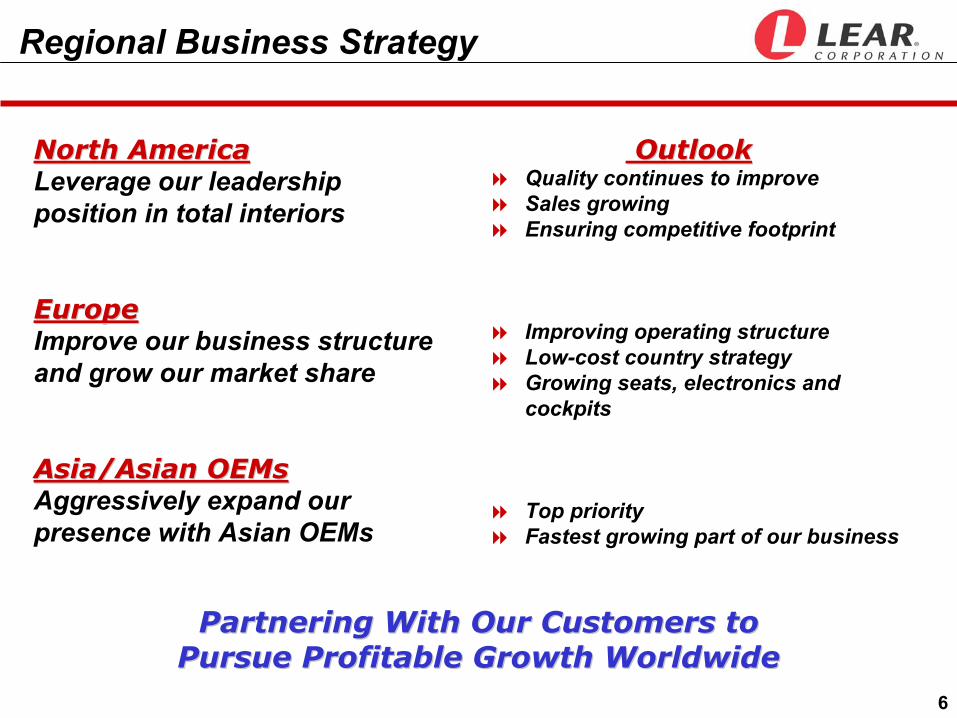
Regional Business Strategy
Partnering With Our Customers to Partnering With Our Customers to Pursue Profitable Growth WorldwidePursue Profitable Growth Worldwide
North AmericaNorth AmericaLeverage our leadership position in total interiors
EuropeEuropeImprove our business structure and grow our market share
Asia/Asian OEMsAsia/Asian OEMsAggressively expand our presence with Asian OEMs
OutlookOutlookQuality continues to improveSales growingEnsuring competitive footprint
Improving operating structureLow-cost country strategyGrowing seats, electronics and cockpits
Top priorityFastest growing part of our business
7
Lear Continues to Deliver Superior Value to Lear Continues to Deliver Superior Value to Our Customers and ShareholdersOur Customers and Shareholders
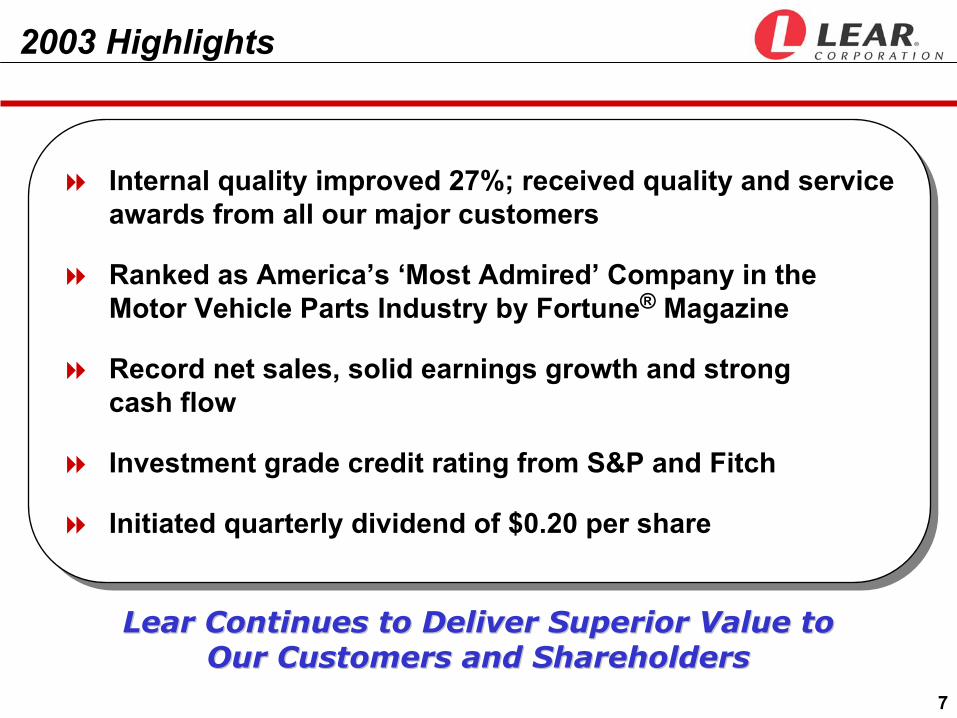
2003 Highlights
Internal quality improved 27%; received quality and service awards from all our major customers
Ranked as America’s ‘Most Admired’ Company in the Motor Vehicle Parts Industry by Fortune® Magazine
Record net sales, solid earnings growth and strong cash flow
Investment grade credit rating from S&P and Fitch
Initiated quarterly dividend of $0.20 per share
8
Maintaining our Momentum Amid a Highly Maintaining our Momentum Amid a Highly Competitive EnvironmentCompetitive Environment
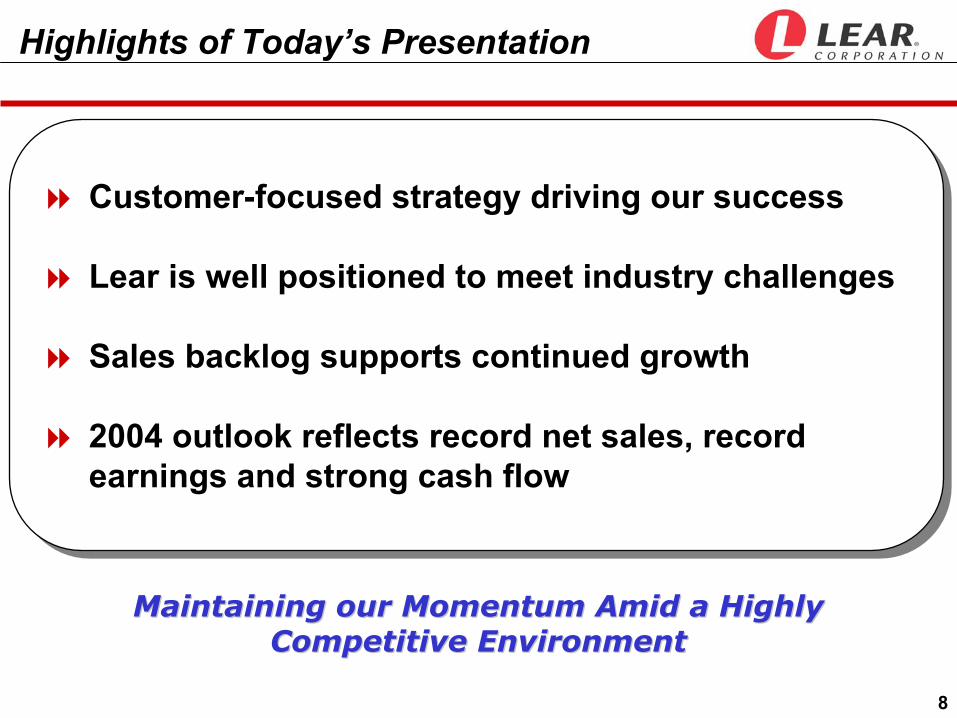
Highlights of Today’s Presentation
Customer-focused strategy driving our success
Lear is well positioned to meet industry challenges
Sales backlog supports continued growth
2004 outlook reflects record net sales, record earnings and strong cash flow
Customer-focused strategy driving our success
Lear is well positioned to meet industry challenges
Sales backlog supports continued growth
2004 outlook reflects record net sales, record earnings and strong cash flow
9
Industry Challenges
10
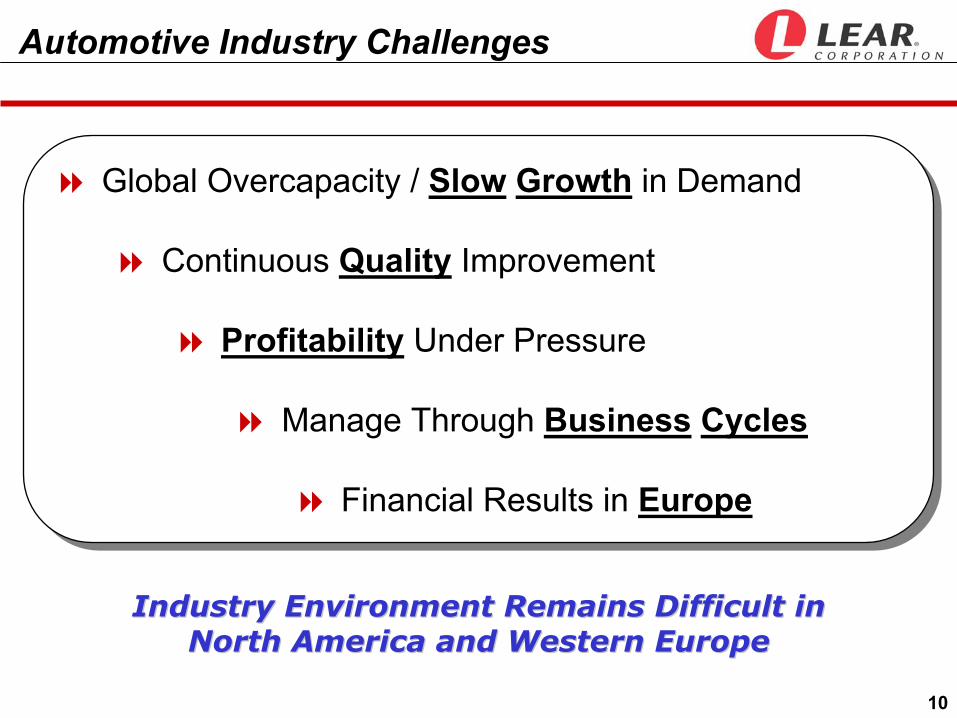
Automotive Industry Challenges
Global Overcapacity / Slow Growth in Demand
Continuous Quality Improvement
Profitability Under Pressure
Manage Through Business Cycles
Financial Results in Europe
Global Overcapacity / Slow Growth in Demand
Continuous Quality Improvement
Profitability Under Pressure
Manage Through Business Cycles
Financial Results in Europe
Industry Environment Remains Difficult in Industry Environment Remains Difficult in North America and Western EuropeNorth America and Western Europe
11
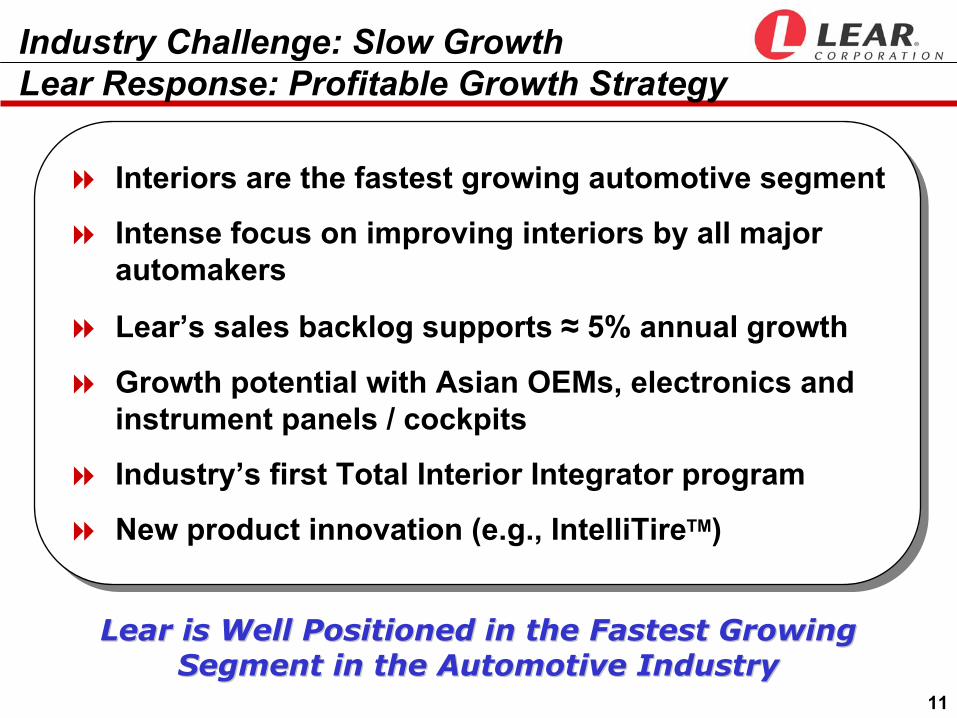
Lear is Well Positioned in the Fastest Growing Lear is Well Positioned in the Fastest Growing Segment in the Automotive IndustrySegment in the Automotive Industry
Industry Challenge: Slow GrowthLear Response: Profitable Growth Strategy
Interiors are the fastest growing automotive segment
Intense focus on improving interiors by all major automakers
Lear’s sales backlog supports ≈ 5% annual growth
Growth potential with Asian OEMs, electronics and instrument panels / cockpits
Industry’s first Total Interior Integrator program
New product innovation (e.g., IntelliTireTM)
12
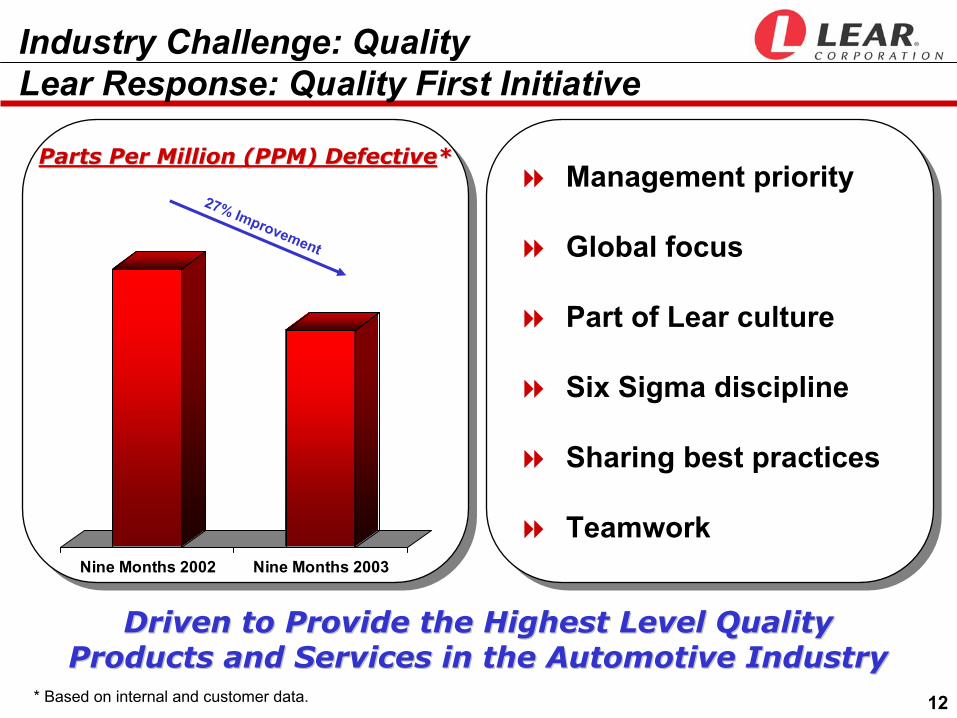
Management priority
Global focus
Part of Lear culture
Six Sigma discipline
Sharing best practices
Teamwork
Management priority
Global focus
Part of Lear culture
Six Sigma discipline
Sharing best practices
TeamworkNine Months 2002 Nine Months 2003
27% Improvement
Driven to Provide the Highest Level Quality Driven to Provide the Highest Level Quality Products and Services in the Automotive IndustryProducts and Services in the Automotive Industry
Industry Challenge: QualityLear Response: Quality First Initiative
Parts Per Million (PPM) DefectiveParts Per Million (PPM) Defective**
* Based on internal and customer data.

13
11% improvement in 2003
4th consecutive year of improvement in TGW
Highest quality seat manufacturer that supplies multiple OEMs
Independent J.D. Power Survey Shows Independent J.D. Power Survey Shows Continuous Improvement in Lear’s TGWContinuous Improvement in Lear’s TGW
Source: 2003 J.D. Power Seat Survey
Lear’s 2003 J.D. PowerLear’s 2003 J.D. PowerResultsResults
10.39.5
8.3 7.97.0
1999 2000 2001 2002 2003
Things Gone Wrong (TGW)per 100 vehicles
Industry Challenge: QualityLear Response: Continuous Improvement
Continuous Improvement
14
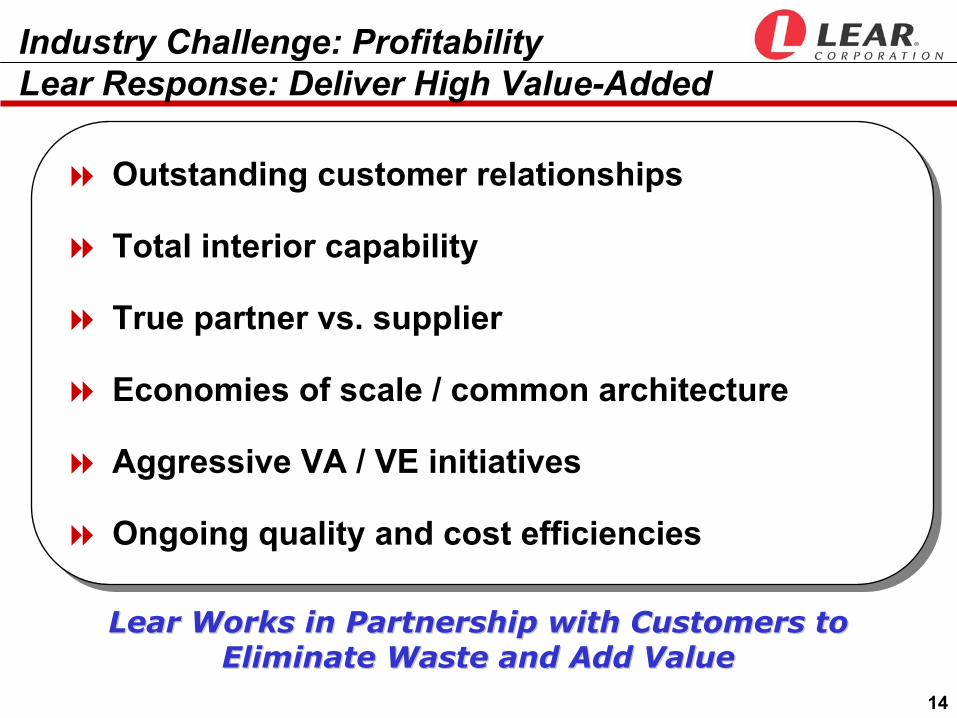
Lear Works in Partnership with Customers to Lear Works in Partnership with Customers to Eliminate Waste and Add ValueEliminate Waste and Add Value
Industry Challenge: Profitability Lear Response: Deliver High Value-Added
Outstanding customer relationships
Total interior capability
True partner vs. supplier
Economies of scale / common architecture
Aggressive VA / VE initiatives
Ongoing quality and cost efficiencies
Outstanding customer relationships
Total interior capability
True partner vs. supplier
Economies of scale / common architecture
Aggressive VA / VE initiatives
Ongoing quality and cost efficiencies
15
80%
15%
5%
Industry Challenge: Business CyclesLear Response: Flexible Cost Structure
RepresentativeCore Operating
Margin *
Variable
Fixed
Materials as a % of Sales: 65%
* Core operating margin represents income before interest, other expense and income taxes divided by net sales. Please see slides titled “Use of Non-GAAP Financial Information” at the end of this presentation.
Lear Advantage
High variable cost structure
Highest-ever sales backlog
Local labor agreements
Relatively low capital intensive business
Legacy costs / pension liabilities not significant
Lear Advantage Lear Advantage
High variable cost structure
Highest-ever sales backlog
Local labor agreements
Relatively low capital intensive business
Legacy costs / pension liabilities not significant
16
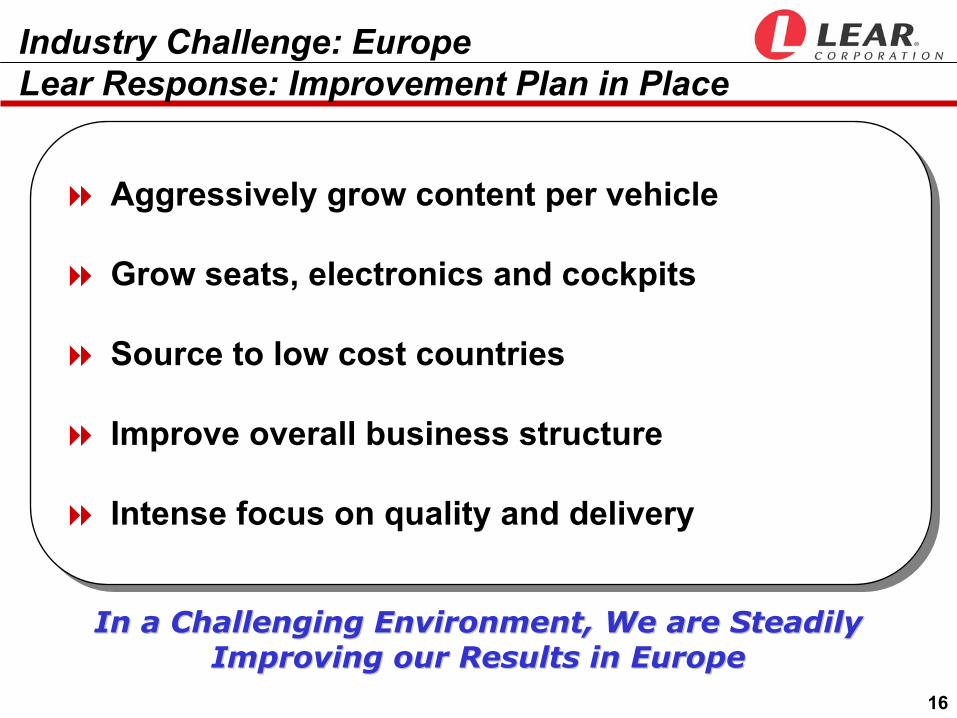
In a Challenging Environment, We are Steadily In a Challenging Environment, We are Steadily Improving our Results in EuropeImproving our Results in Europe
Industry Challenge: EuropeLear Response: Improvement Plan in Place
Aggressively grow content per vehicle
Grow seats, electronics and cockpits
Source to low cost countries
Improve overall business structure
Intense focus on quality and delivery
Aggressively grow content per vehicle
Grow seats, electronics and cockpits
Source to low cost countries
Improve overall business structure
Intense focus on quality and delivery
17
Sales Backlog Update and
2004 Financial Guidance
18
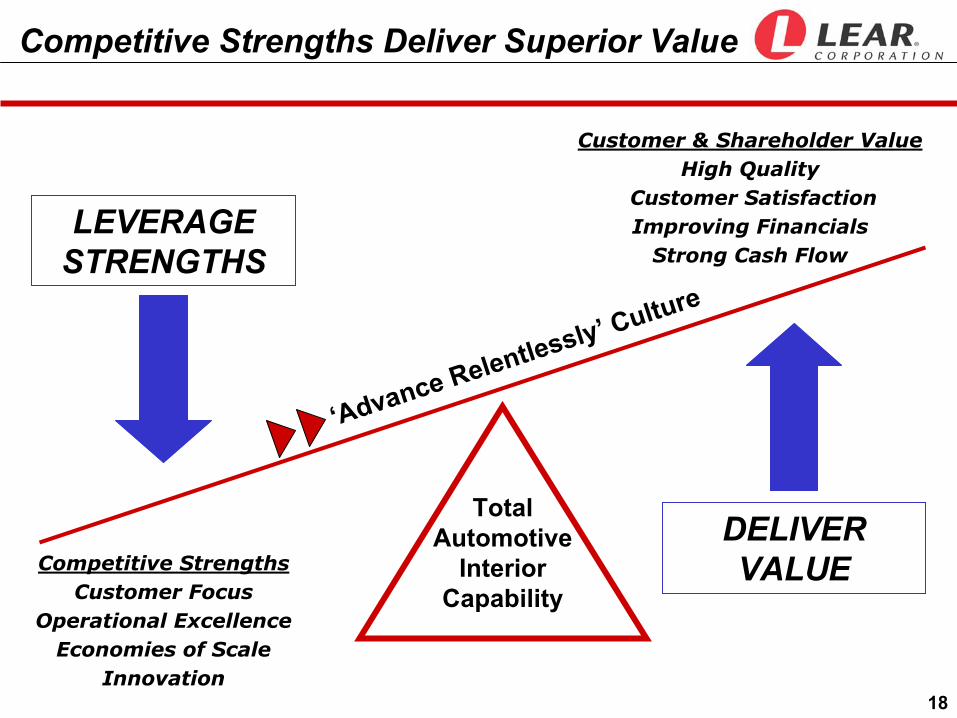
Competitive StrengthsCustomer Focus
Operational ExcellenceEconomies of Scale
Innovation
Customer & Shareholder ValueHigh Quality
Customer SatisfactionImproving Financials
Strong Cash Flow
Competitive Strengths Deliver Superior Value
Total Automotive
Interior Capability
‘Advance Relentlessly’ Culture
DELIVER VALUE
LEVERAGE STRENGTHS
19
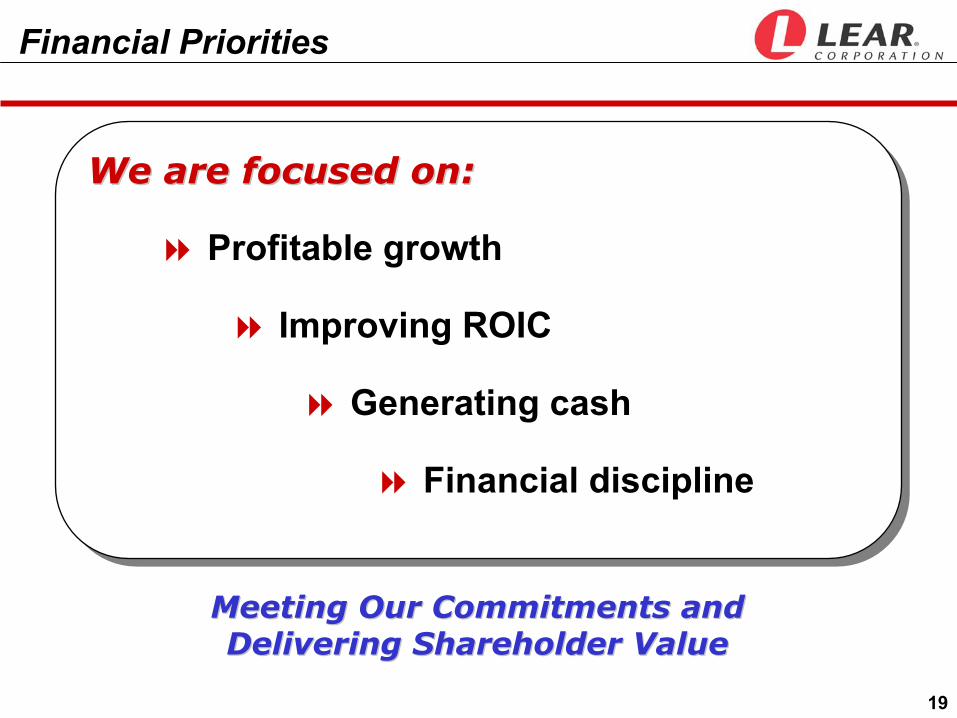
Meeting Our Commitments and Meeting Our Commitments and Delivering Shareholder ValueDelivering Shareholder Value
Financial Priorities
We are focused on:
Profitable growth
Improving ROIC
Generating cash
Financial discipline
We are focused on:We are focused on:
Profitable growth
Improving ROIC
Generating cash
Financial discipline
20
$3.1
$4.7
$6.2$7.3
$9.1
$12.4
$14.1 $13.6$14.4
$15.5
$0.0
$2.0
$4.0
$6.0
$8.0
$10.0
$12.0
$14.0
$16.0
1994 1995 1996 1997 1998 1999 2000 2001 2002 2003Guidance
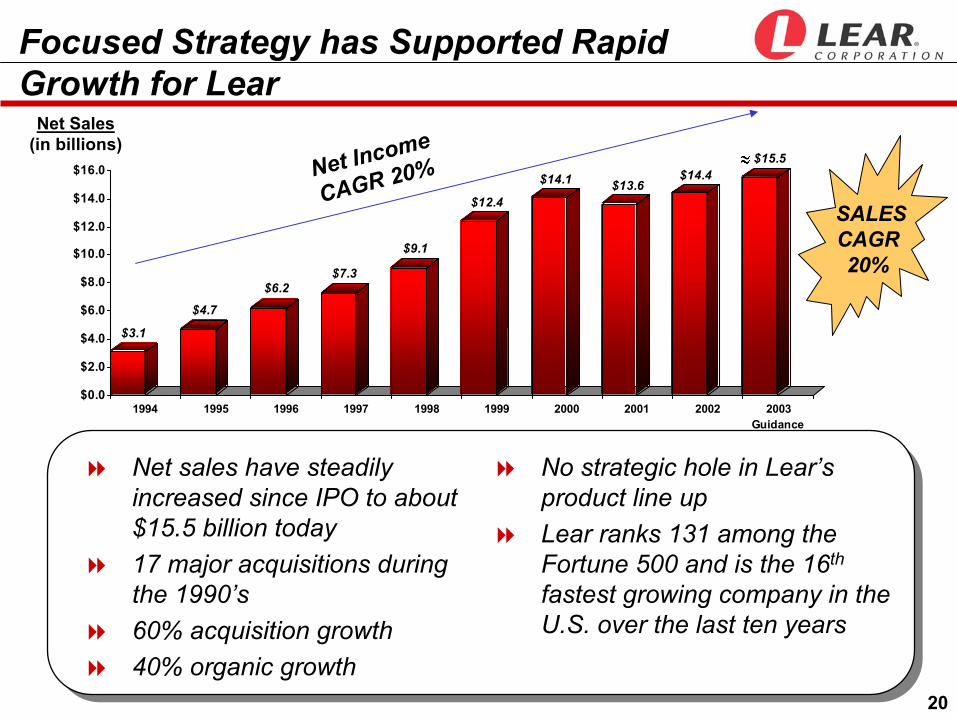
Focused Strategy has Supported RapidGrowth for Lear
Net sales have steadily increased since IPO to about $15.5 billion today17 major acquisitions during the 1990’s 60% acquisition growth40% organic growth
No strategic hole in Lear’s product line upLear ranks 131 among the Fortune 500 and is the 16th
fastest growing company in the U.S. over the last ten years
SALESCAGR20%
Net Sales(in billions)
Net Income
CAGR 20%
21
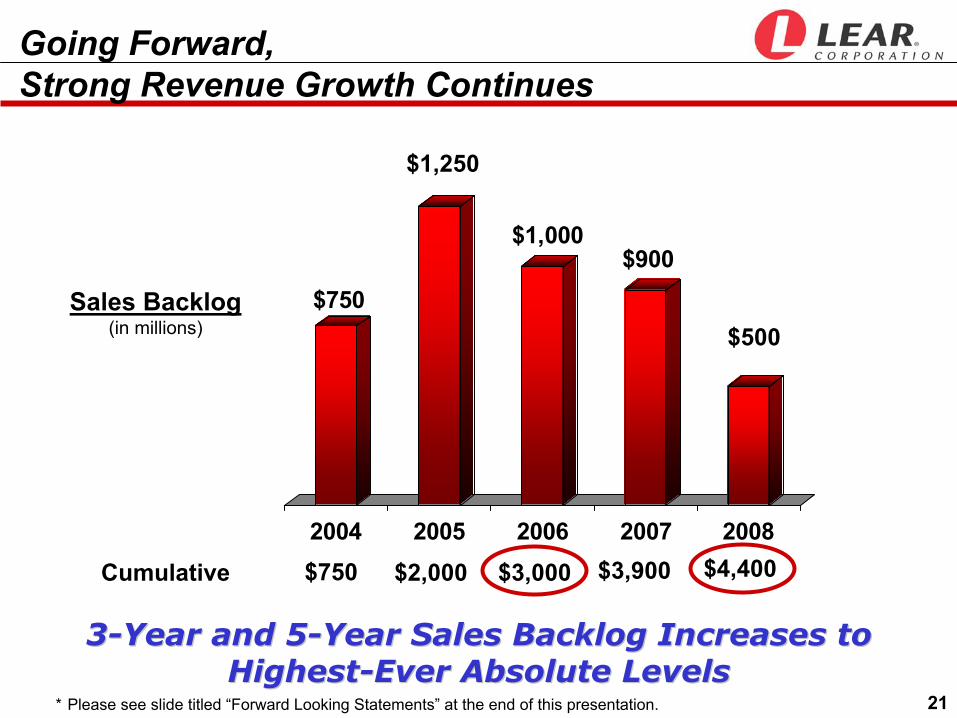
Going Forward,Strong Revenue Growth Continues
$750
$1,000$900
2004 2005 2006 2007 2008
$500
Cumulative
33--Year and 5Year and 5--Year Sales Backlog Increases to Year Sales Backlog Increases to HighestHighest--Ever Absolute LevelsEver Absolute Levels
$1,250
$750 $2,000 $4,400$3,900$3,000
Sales Backlog(in millions)
* Please see slide titled “Forward Looking Statements” at the end of this presentation.
22
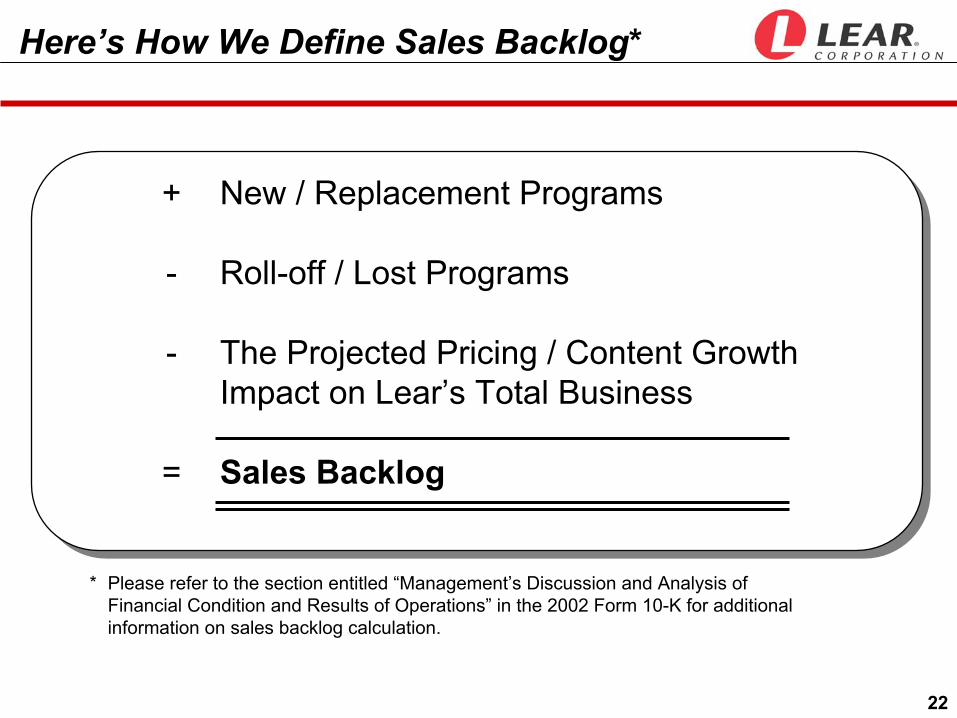
+ New / Replacement Programs
- Roll-off / Lost Programs
- The Projected Pricing / Content Growth Impact on Lear’s Total Business
= Sales Backlog
Here’s How We Define Sales Backlog*
* Please refer to the section entitled “Management’s Discussion and Analysis of Financial Condition and Results of Operations” in the 2002 Form 10-K for additional information on sales backlog calculation.
23
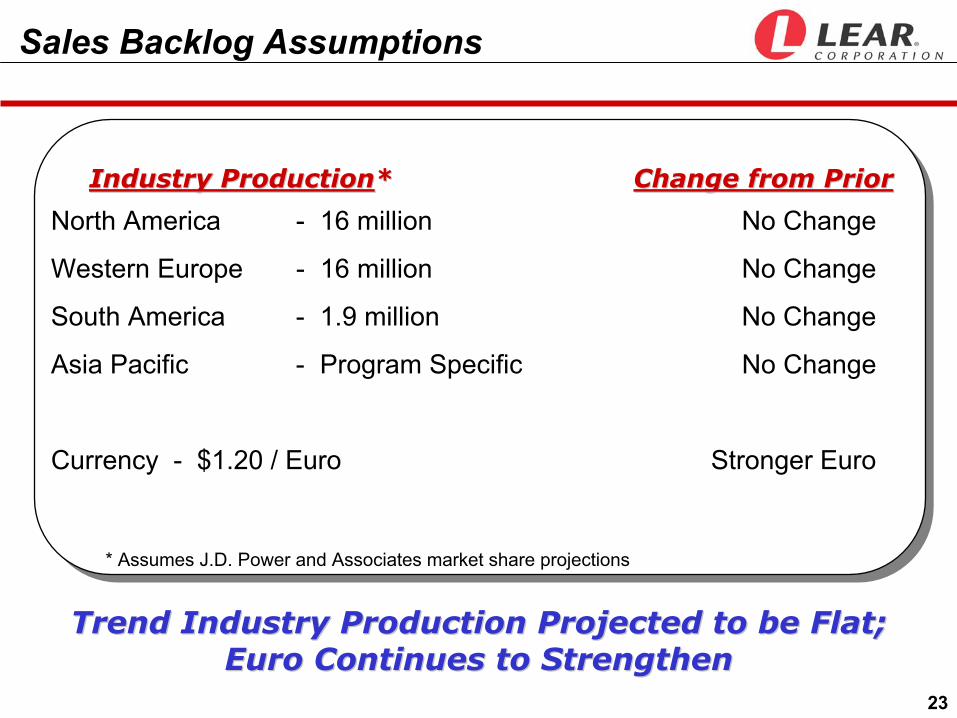
North America - 16 million No Change
Western Europe - 16 million No Change
South America - 1.9 million No Change
Asia Pacific - Program Specific No Change
Currency - $1.20 / Euro Stronger Euro
Change from PriorChange from PriorIndustry ProductionIndustry Production**
* Assumes J.D. Power and Associates market share projections
Sales Backlog Assumptions
Trend Industry Production Projected to be Flat; Trend Industry Production Projected to be Flat; Euro Continues to StrengthenEuro Continues to Strengthen
24
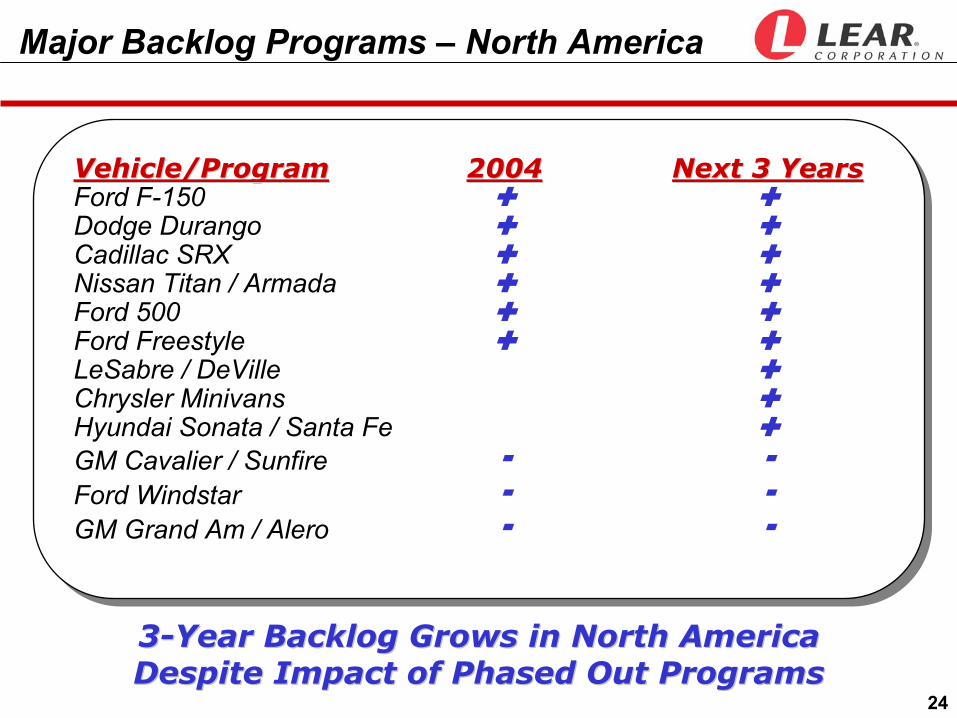
Major Backlog Programs – North America
Vehicle/ProgramVehicle/Program 20042004 Next 3 YearsNext 3 YearsFord F-150Dodge DurangoCadillac SRXNissan Titan / ArmadaFord 500Ford FreestyleLeSabre / DeVilleChrysler MinivansHyundai Sonata / Santa FeGM Cavalier / SunfireFord WindstarGM Grand Am / Alero
33--Year Backlog Grows in North America Year Backlog Grows in North America Despite Impact of Phased Out ProgramsDespite Impact of Phased Out Programs
25
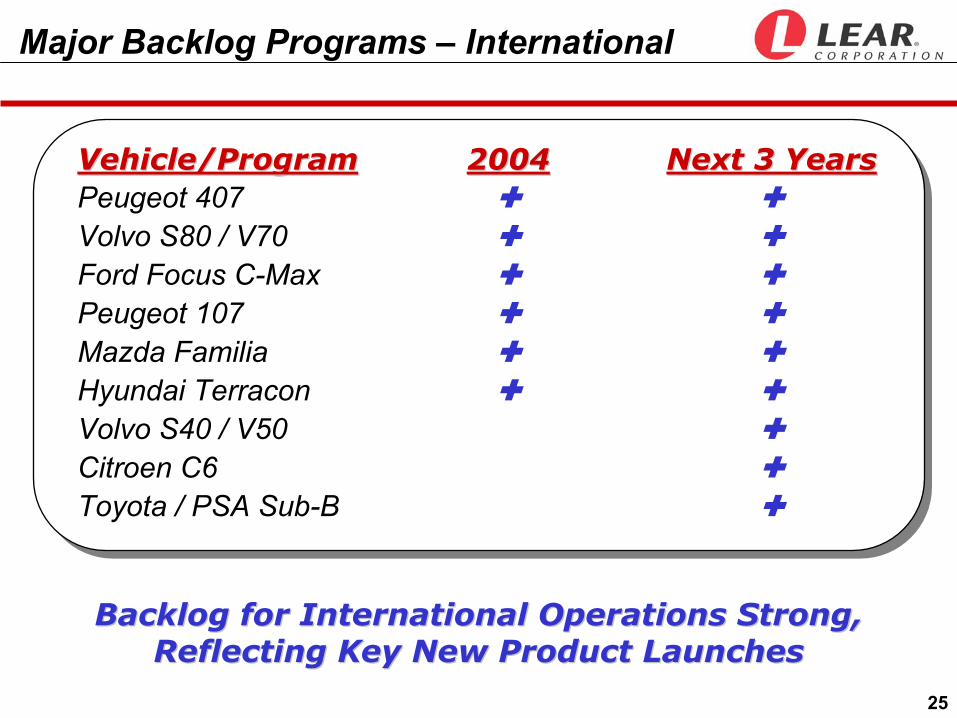
Major Backlog Programs – International
Vehicle/ProgramVehicle/Program 20042004 Next 3 YearsNext 3 YearsPeugeot 407Volvo S80 / V70Ford Focus C-MaxPeugeot 107Mazda FamiliaHyundai TerraconVolvo S40 / V50Citroen C6Toyota / PSA Sub-B
Backlog for International Operations Strong, Backlog for International Operations Strong, Reflecting Key New Product LaunchesReflecting Key New Product Launches
26
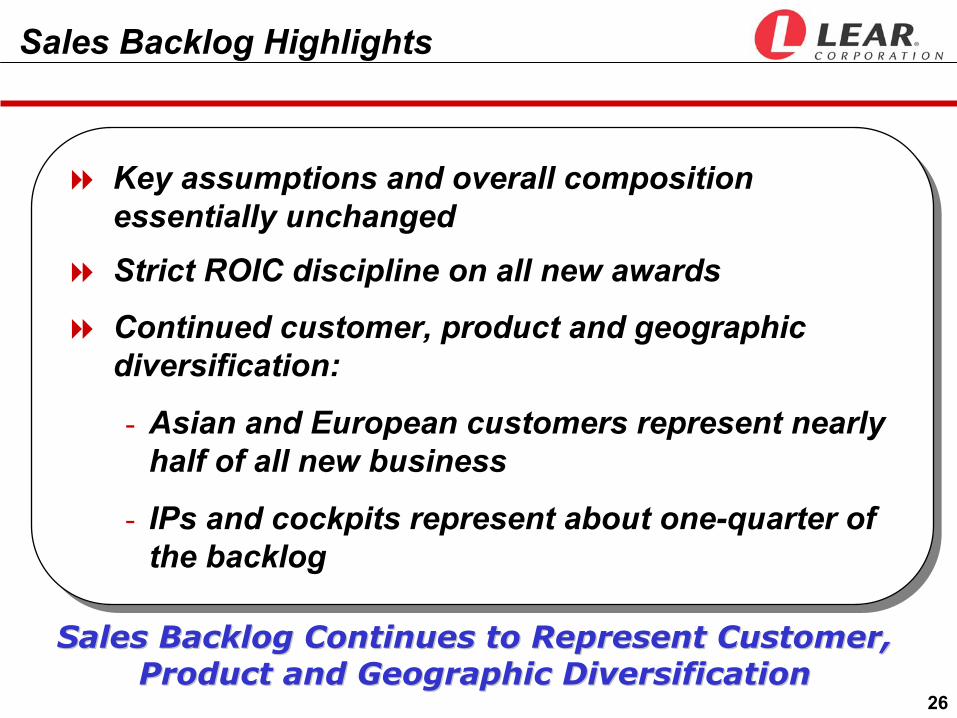
Sales Backlog Highlights
Key assumptions and overall composition essentially unchangedStrict ROIC discipline on all new awards
Continued customer, product and geographic diversification:
- Asian and European customers represent nearly half of all new business
- IPs and cockpits represent about one-quarter of the backlog
Key assumptions and overall composition essentially unchangedStrict ROIC discipline on all new awards
Continued customer, product and geographic diversification:
- Asian and European customers represent nearly half of all new business
- IPs and cockpits represent about one-quarter of the backlog
Sales Backlog Continues to Represent Customer, Sales Backlog Continues to Represent Customer, Product and Geographic DiversificationProduct and Geographic Diversification
27
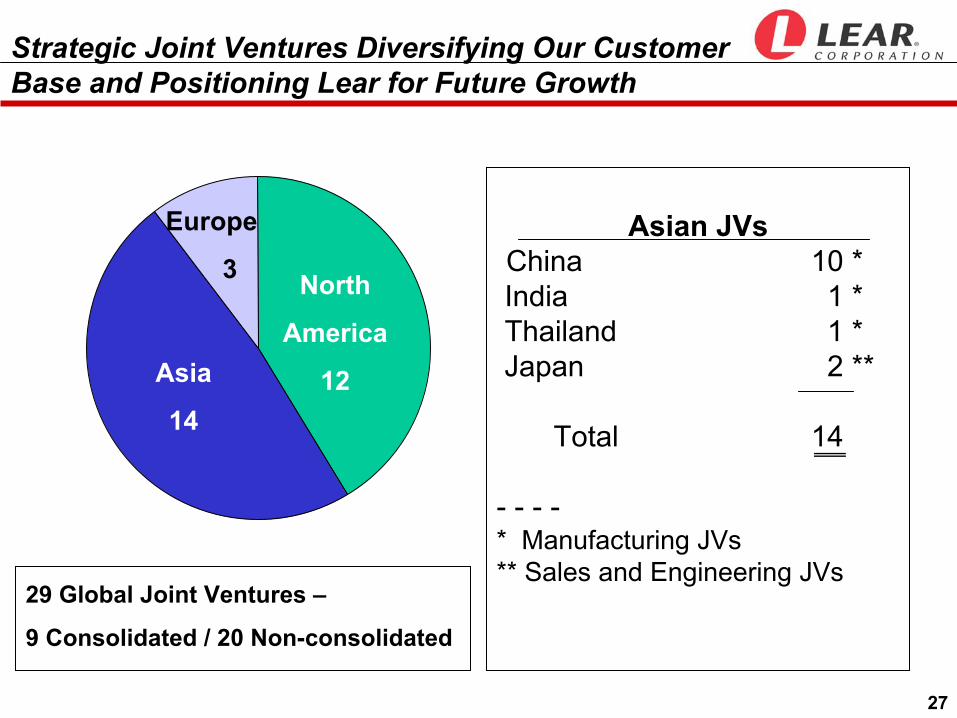
Strategic Joint Ventures Diversifying Our Customer Base and Positioning Lear for Future Growth
Asian JVsChina 10 *India 1 *Thailand 1 *Japan 2 **
Total 14
- - - -* Manufacturing JVs** Sales and Engineering JVs
Asia
14
North
America
12
Europe
3
29 Global Joint Ventures –
9 Consolidated / 20 Non-consolidated

28
Ten Joint Ventures
4,000 employees
Shenyang- CBA-BMWNanjing
- Fiat
Shanghai (3)- SGM, SVW
Nanchang- Isuzu, Suzuki, Ford
Chongqing- ChangAn, Suzuki- Ford
Lear China Overview
Wuhan (2)- Citroen- Renault/Nissan
Shiyan / Xiangfan- Nissan
Products- Seats - Door Panels - Wiring - Carpet/Acoustics
Customers- Jiangling (Ford) - ChangAn (Ford)- SAIC (GM) - FAW (Audi)- Nanjing - Iveco (Fiat) - DFM (Nissan, PSA)- China Brilliance (BMW) - Others
Key Strategic Points- Follow customers’ footprint- Potential manufacturing for export- Leverage partners’ resources for technology
• Lower technology risk- Controlled growth and investment
29
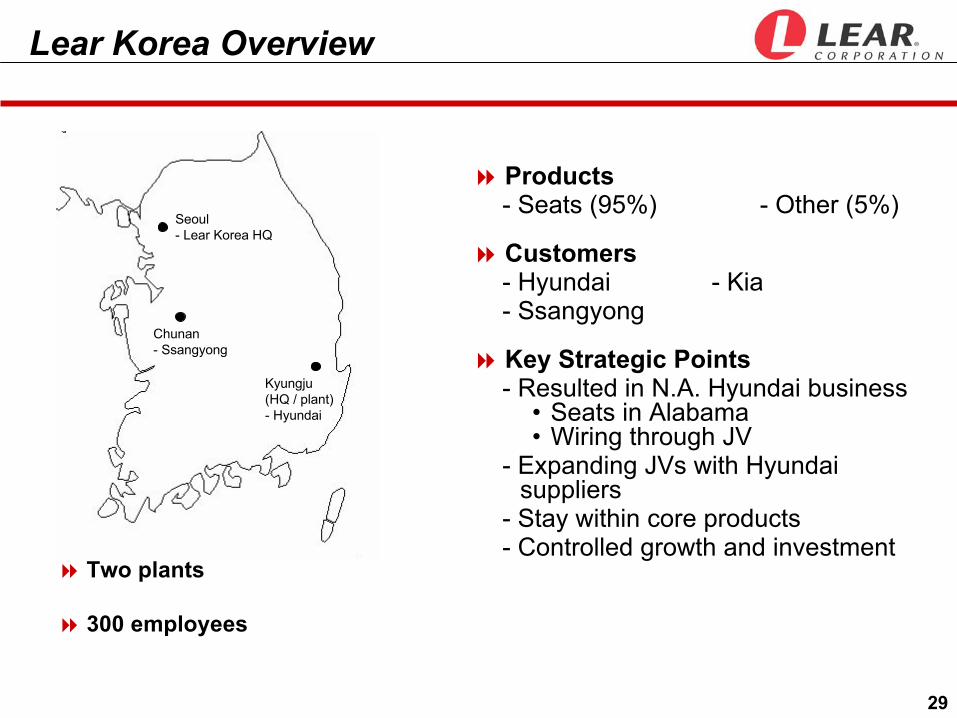
Products- Seats (95%) - Other (5%)
Customers- Hyundai - Kia- Ssangyong
Key Strategic Points- Resulted in N.A. Hyundai business
• Seats in Alabama• Wiring through JV
- Expanding JVs with Hyundai suppliers
- Stay within core products- Controlled growth and investment
Kyungju(HQ / plant)- Hyundai
Chunan- Ssangyong
Lear Korea Overview
Seoul- Lear Korea HQ
Two plants
300 employees
30
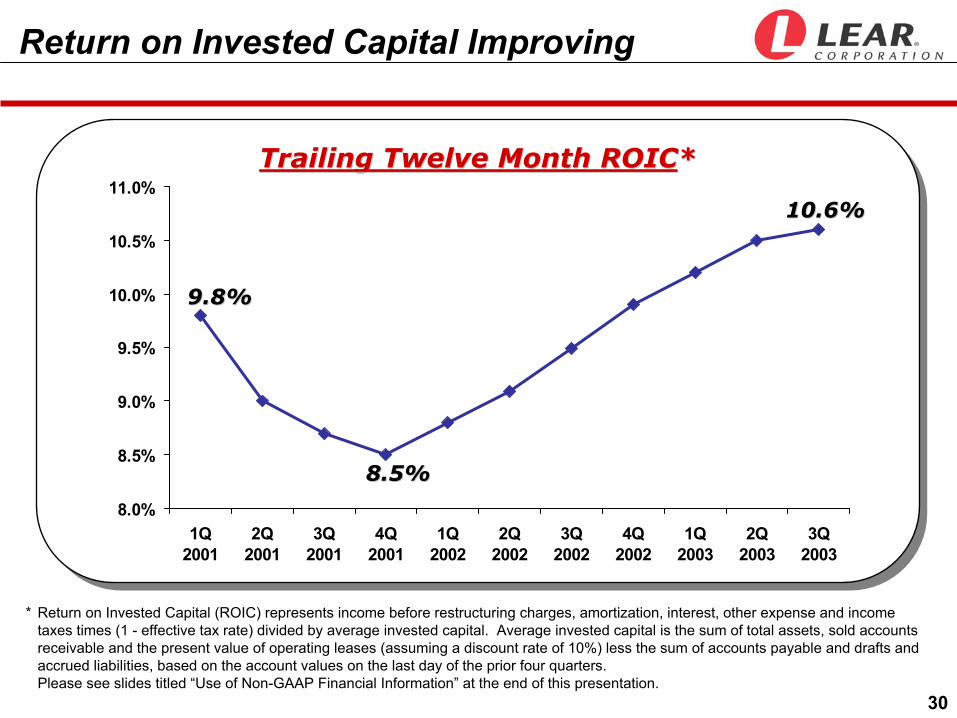
Return on Invested Capital Improving
Trailing Twelve Month ROICTrailing Twelve Month ROIC**
8.0%
8.5%
9.0%
9.5%
10.0%
10.5%
11.0%
1Q2001
2Q2001
3Q2001
4Q2001
1Q2002
2Q2002
3Q2002
4Q2002
1Q2003
2Q2003
3Q2003
8.5%8.5%
10.6%10.6%
9.8%9.8%
* Return on Invested Capital (ROIC) represents income before restructuring charges, amortization, interest, other expense and income taxes times (1 - effective tax rate) divided by average invested capital. Average invested capital is the sum of total assets, sold accounts receivable and the present value of operating leases (assuming a discount rate of 10%) less the sum of accounts payable and drafts and accrued liabilities, based on the account values on the last day of the prior four quarters.Please see slides titled “Use of Non-GAAP Financial Information” at the end of this presentation.
31
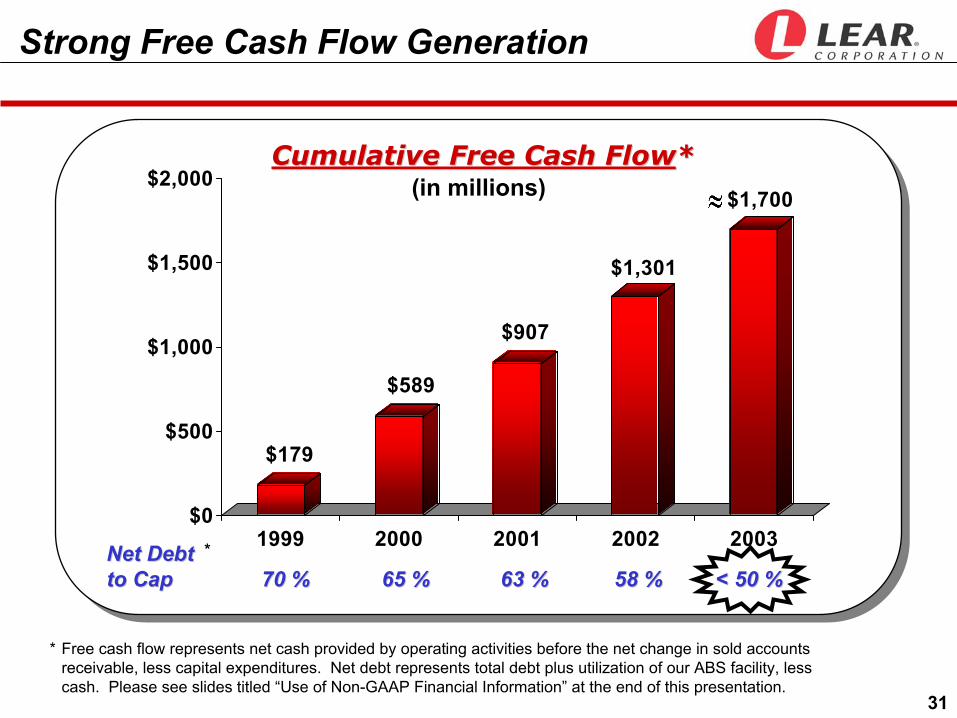
Strong Free Cash Flow Generation
Net DebtNet Debtto Capto Cap 70 %70 % 65 %65 % 63 %63 % 58 %58 % < 50 %< 50 %
Cumulative Free Cash FlowCumulative Free Cash Flow**
* Free cash flow represents net cash provided by operating activities before the net change in sold accounts receivable, less capital expenditures. Net debt represents total debt plus utilization of our ABS facility, less cash. Please see slides titled “Use of Non-GAAP Financial Information” at the end of this presentation.
$179
$589
$907
$1,301
$1,700
$0
$500
$1,000
$1,500
$2,000
1999 2000 2001 2002 2003
(in millions)
*

32
North America(in millions)
2004 Production Stable in North America 2004 Production Stable in North America and Western Europeand Western Europe
2004 OutlookVehicle Production Assumptions*
2003 Forecast 2004 Guidance 2003 Forecast 2004 Guidance
15.9 15.9≈ 16.0 ≈ 16.0
Western Europe(in millions)
* Please see slide titled “Forward Looking Statements” at the end of this presentation.
33
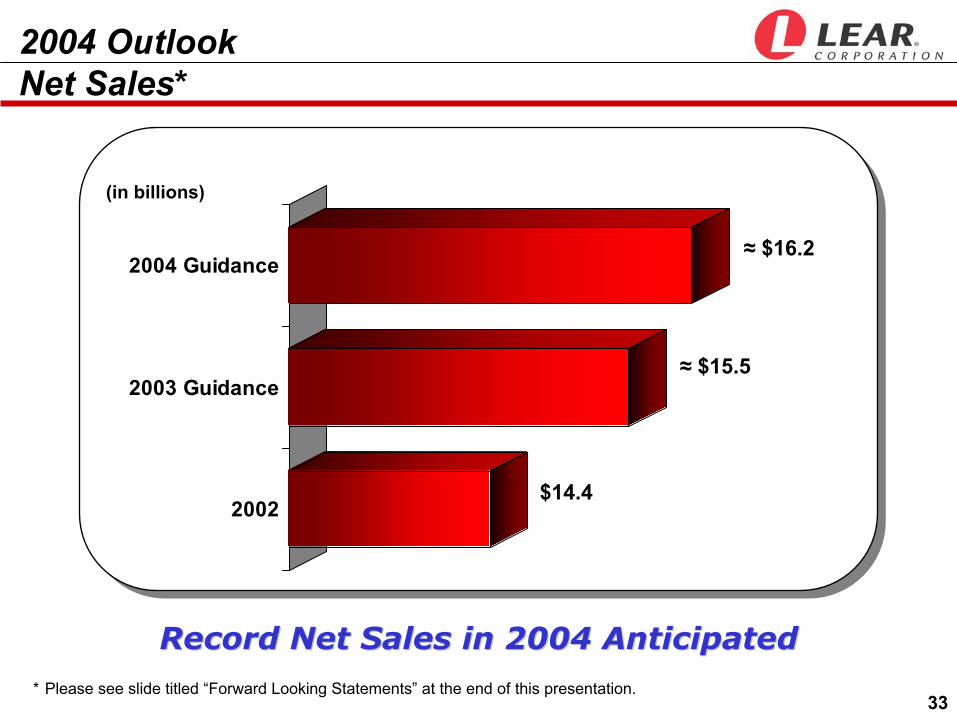
2004 OutlookNet Sales*
Record Net Sales in 2004 AnticipatedRecord Net Sales in 2004 Anticipated
2002
2003 Guidance
2004 Guidance
(in billions)
≈ $16.2
≈ $15.5
$14.4
* Please see slide titled “Forward Looking Statements” at the end of this presentation.
34
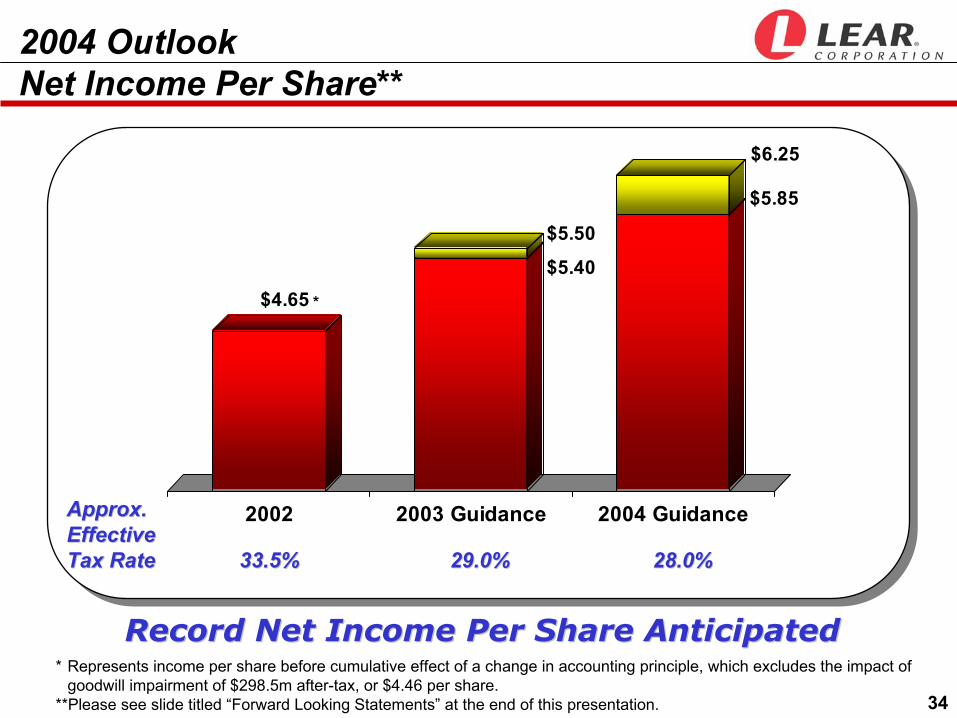
2004 OutlookNet Income Per Share**
Record Net Income Per Share AnticipatedRecord Net Income Per Share Anticipated
$4.65$5.40
$5.50
$5.85
$6.25
2002 2003 Guidance 2004 GuidanceApprox. Approx. EffectiveEffectiveTax RateTax Rate 33.5%33.5% 29.0%29.0% 28.0%28.0%
* Represents income per share before cumulative effect of a change in accounting principle, which excludes the impact of goodwill impairment of $298.5m after-tax, or $4.46 per share.
**Please see slide titled “Forward Looking Statements” at the end of this presentation.
*
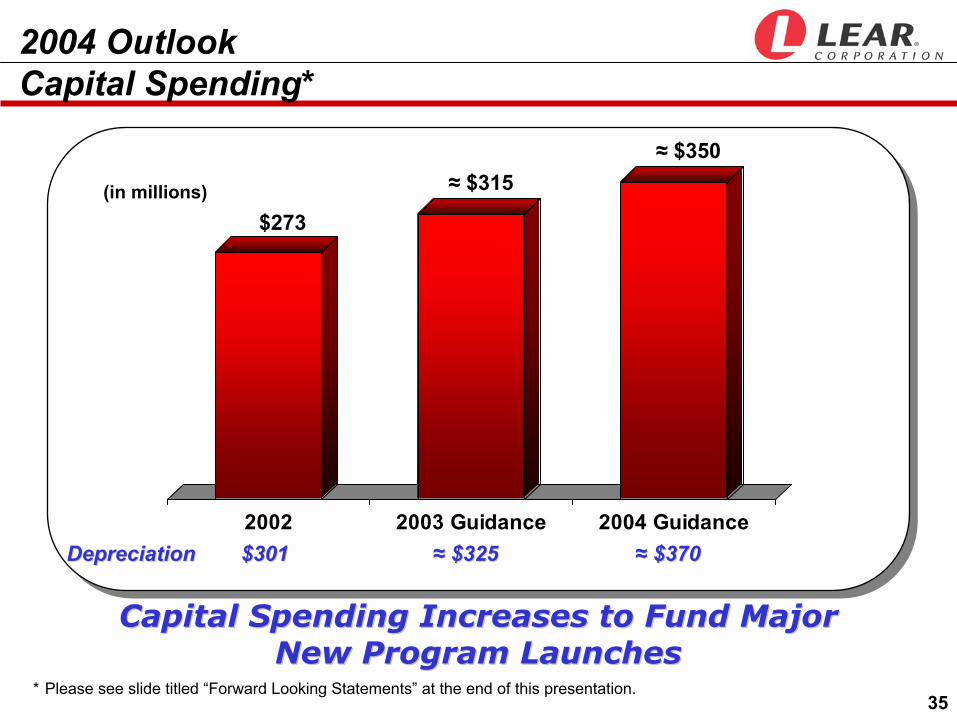
35
Capital Spending Increases to Fund Major Capital Spending Increases to Fund Major New Program LaunchesNew Program Launches
2004 OutlookCapital Spending*
2002 2003 Guidance 2004 GuidanceDepreciationDepreciation $301$301 ≈≈ $325$325 ≈≈ $370$370
(in millions)$273
≈ $315≈ $350
* Please see slide titled “Forward Looking Statements” at the end of this presentation.

36
Free Cash Flow Remains StrongFree Cash Flow Remains Strong
2004 OutlookFree Cash Flow*
2002 2003 Guidance 2004 GuidanceInterestInterestExpenseExpense $211$211 ≈≈ $190$190 ≈≈ $175$175
(in millions)
$395≈ $400
* Please see slides titled “Use of Non-GAAP Financial Information” and “Forward Looking Statements” at the end of this presentation.
≈ $400
37
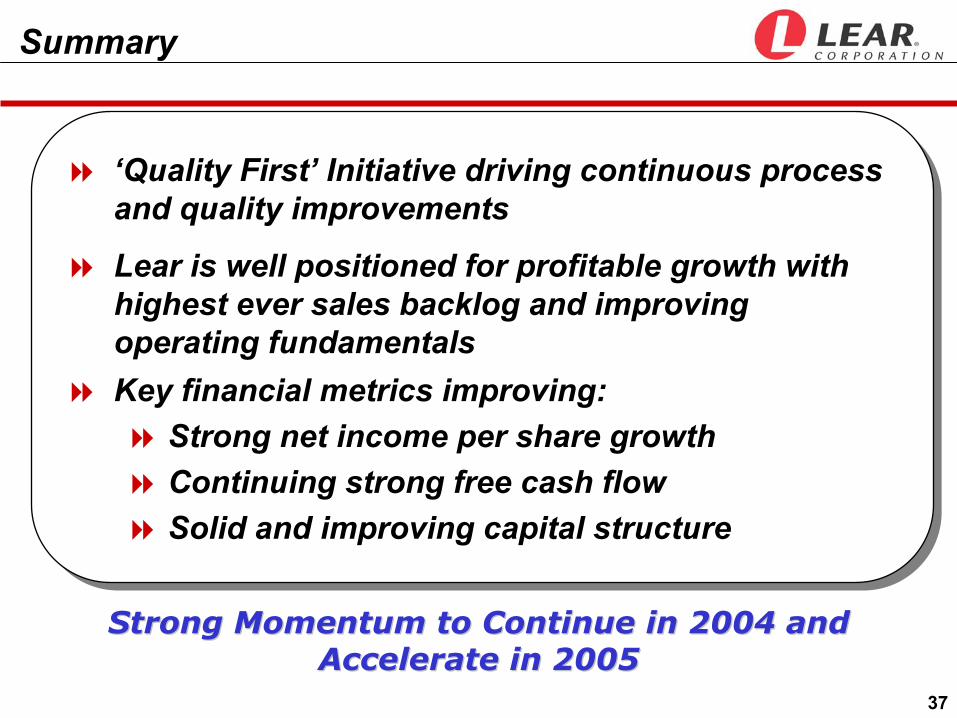
Summary
‘Quality First’ Initiative driving continuous process and quality improvements
Lear is well positioned for profitable growth with highest ever sales backlog and improving operating fundamentalsKey financial metrics improving:
Strong net income per share growthContinuing strong free cash flowSolid and improving capital structure
Strong Momentum to Continue in 2004 and Strong Momentum to Continue in 2004 and Accelerate in 2005Accelerate in 2005

ADVANCE RELENTLESSLY™
www.lear.comLEA
NYSEListed
R
39
In addition to the results reported in accordance with accounting principles generally accepted in the United States (“GAAP”) included throughout this presentation, the Company has provided information regarding certain non-GAAP financial measures. These measures include “core operating margin,” “free cash flow,” “ROIC” and “net debt.” Core operating margin represents income before interest, other expense and income taxes divided by net sales. Free cash flow represents net cash provided by operating activities before the net change in sold accounts receivable, less capital expenditures. The Company believes it is appropriate to exclude the net change in sold accounts receivable in the calculation of free cash flow since the sale of receivables may be viewed as a substitute for borrowing activity. ROIC represents income before restructuring charges, amortization, interest, other expense and income taxes times (1 - effective tax rate) divided by average invested capital. Average invested capital is the sum of total assets, sold accounts receivable and the present value of operating leases (assuming a discount rate of 10%) less the sum of accounts payable and drafts and accrued liabilities, based on the account values on the last day of the prior four quarters. Net debt represents total debt plus utilization under its ABS facility, less cash.
Management believes that the non-GAAP financial measures used in this presentation are useful to both management and investors in their analysis of the Company’s financial position and results of operations. In particular management believes that core operating margin is a useful measure in assessing the Company’s financial performance by excluding certain items that are not indicative of the Company’s continuing operating activities or that may obscure trends useful in evaluating the Company’s continuing operating activities. Management believes that free cash flow is useful in analyzing the Company’s ability to service and repay its debt. Management believes that ROIC is a commonly used measure that provides useful information regarding the efficiency with which the Company’s assets are deployed. Management believes that net debt is generally accepted as providing useful information regarding a company’s financial condition. Further, management uses these non-GAAP measures for planning and forecasting in future periods.
Neither core operating margin, free cash flow, ROIC nor net debt should be considered in isolation or as substitutes for net income, net cash provided by operating activities, total debt or other balance sheet, income statement or cash flow statement data prepared in accordance with GAAP or as measures of profitability or liquidity. In addition, the calculation of free cash flow does not reflect cash used to service debt and thus, does not reflect funds available for investment or other discretionary uses. Also, these non-GAAP financial measures, as determined and presented by the Company, may not be comparable to related or similarly titled measures reported by other companies.
Set forth on the following slides are reconciliations of these non-GAAP financial measures to the most directly comparable financial measures calculated and presented in accordance with GAAP.
Use of Non-GAAP Financial Information
40
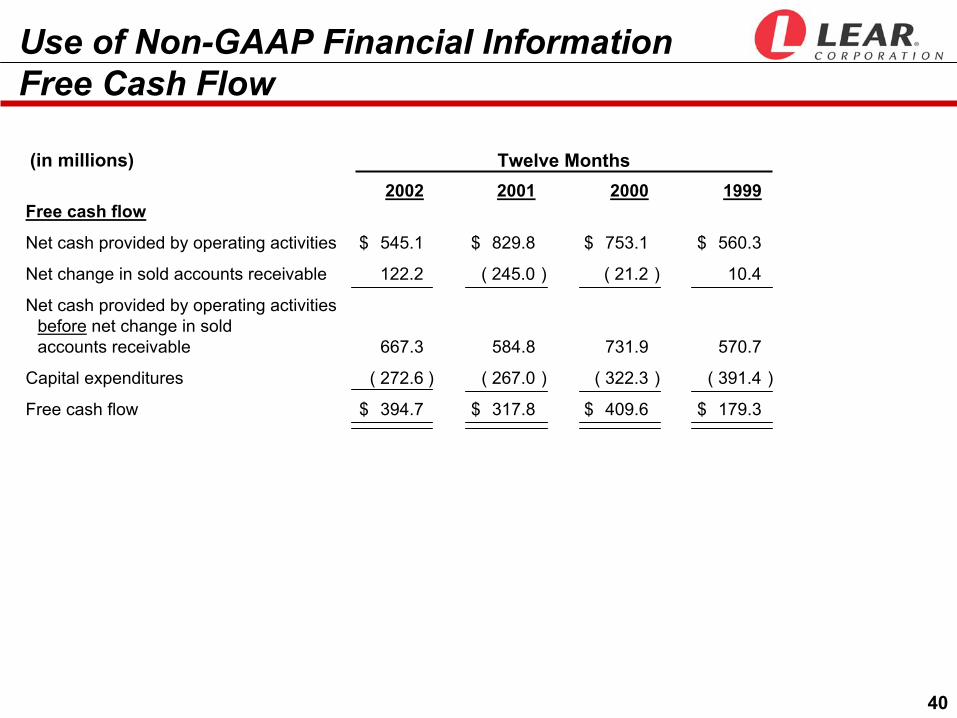
2002 2001 2000 1999Free cash flow
Net cash provided by operating activities $ 545.1 $ 829.8 $ 753.1 $ 560.3
Net change in sold accounts receivable 122.2 ( 245.0 ) ( 21.2 ) 10.4
Net cash provided by operating activitiesbefore net change in soldaccounts receivable 667.3 584.8 731.9 570.7
Capital expenditures ( 272.6 ) ( 267.0 ) ( 322.3 ) ( 391.4 )
Free cash flow $ 394.7 $ 317.8 $ 409.6 $ 179.3
(in millions)
Use of Non-GAAP Financial InformationFree Cash Flow
Twelve Months
41
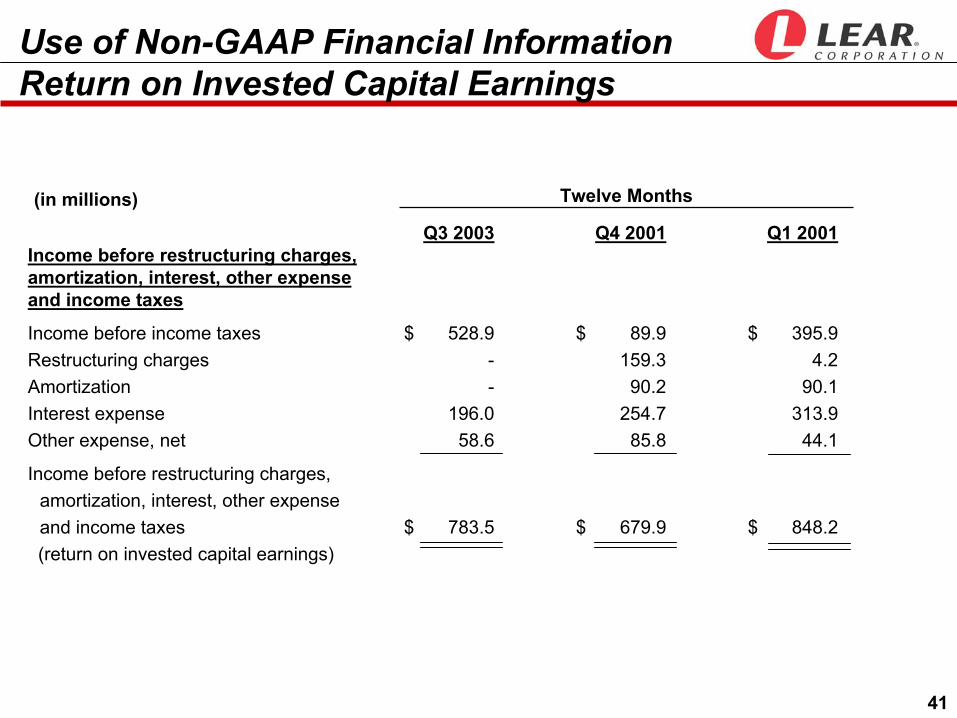
Use of Non-GAAP Financial InformationReturn on Invested Capital Earnings
Q3 2003 Q4 2001 Q1 2001Income before restructuring charges,amortization, interest, other expenseand income taxes
Income before income taxes $ 528.9 $ 89.9 $ 395.9Restructuring charges - 159.3 4.2Amortization - 90.2 90.1Interest expense 196.0 254.7 313.9Other expense, net 58.6 85.8 44.1
Income before restructuring charges,amortization, interest, other expenseand income taxes $ 783.5 $ 679.9 $ 848.2(return on invested capital earnings)
(in millions) Twelve Months
42
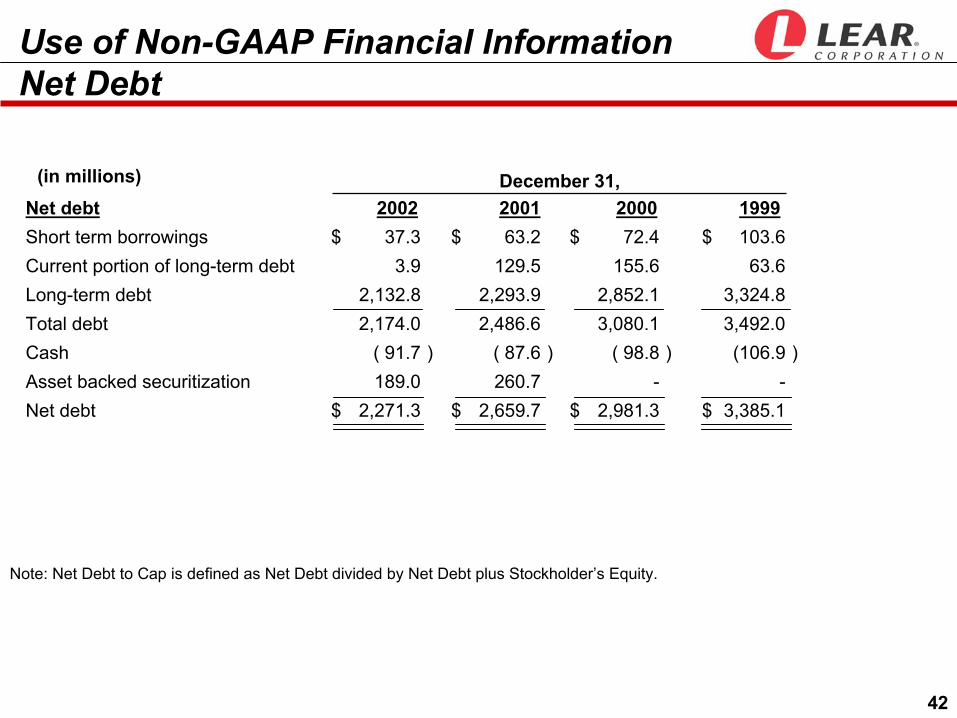
(in millions)Net debtShort term borrowings $ 37.3 $ 63.2 $ 72.4 $ 103.6Current portion of long-term debt 3.9 129.5 155.6 63.6Long-term debt 2,132.8 2,293.9 2,852.1 3,324.8Total debt 2,174.0 2,486.6 3,080.1 3,492.0Cash ( 91.7 ) ( 87.6 ) ( 98.8 ) (106.9 )Asset backed securitization 189.0 260.7 - -Net debt $ 2,271.3 $ 2,659.7 $ 2,981.3 $ 3,385.1
Use of Non-GAAP Financial InformationNet Debt
2002 2001 2000 1999December 31,
Note: Net Debt to Cap is defined as Net Debt divided by Net Debt plus Stockholder’s Equity.
43
This presentation contains forward-looking statements within the meaning of the Private Securities Litigation Reform Act of 1995, including statements regarding anticipated financial results. Actual results may differ materially from anticipated results as a result of certain risks and uncertainties, including but not limited to general economic conditions in the markets in which the Company operates, including changes in interest rates and fuel prices, fluctuations in the production of vehicles for which the Company is a supplier, labor disputes involving the Company or its significant customers or that otherwise affect the Company, the Company’s ability to achieve cost reductions that offset or exceed customer-mandated selling price reductions, the impact and timing of program launch costs, costs associated with facility closures or similar actions, increases in warranty costs, risks associated with conducting business in foreign countries, fluctuations in currency exchange rates, adverse changes in economic conditions or political instability in the jurisdictions in which the Company operates, competitive conditions impacting the Company’s key customers, raw material cost and availability, the outcome of legal proceedings, unanticipated changes in free cash flow and other risks detailed from time to time in the Company’s Securities and Exchange Commission filings. These forward-looking statements are made as of the date hereof, and the Company does not assume any obligation to update them.
Forward-Looking Statements