maximizing the alue of media - tbsホールディングス · maximizing the alue of media v ......
TRANSCRIPT
Tokyo Broadcasting System, Inc.
Annual Report 2006For the year ended March 31, 2006
VMaximizing the alue of Media
Delivering Lasting Impressions
and Reliable Information while
Transcending Generations

The fiscal year under review, ended March 31, 2006, was a year when people con-sidered the relationship between broadcasting and data communications. Indeed,the trend toward increased broadband communications continued, blurring theboundary between the two industries. Still, television is very capable of sendingboth information and movie content simultaneously to a large number of viewers.The one-segment services that the Company started in April for cellular phonesand mobile terminals is a good example in the era of digital terrestrial television,since a new form of TV service could potentially increase its presence as a powerfulportal to the world of data communications. The TBS Group intends to view thisrevolutionary change in the broadcasting industry as a business opportunity anduse it to further enhance its enterprise value.
The V!-up 2010, TBS’s new medium-term management objectives published onFebruary 15, expresses the Company’s resolution to do so. This Plan representsthe goals the Company aims to achieve by the year ending March 31, 2011:increase its all-day average viewer rating to 9%, increase TBS’s share of spot salesamong the five key broadcasters in Tokyo to more than 25%, and increase annualconsolidated sales from its non-broadcasting businesses to ¥150 billion, therebyachieving consolidated operating cash flow of ¥50 billion. The Company has set upa V!-Up Promotion Head Office led by the Company president in order to formulatea concrete action plan to achieve these goals.
Profile
Contents
2 A Message from the Management8 New Medium-Term Management
Objectives—What Is Our V!-Up 2010?
12 Corporate Governance17 TBS Group Internal Control Structure17 Board of Directors and Auditors18 TBS Group19 Network20 Financial Section20 —Fact Sheet21 —Six-Year Summary
22 —Management’s Discussion and Analysis
26 —Consolidated Balance Sheets28 —Consolidated Statements of Income29 —Consolidated Statements of
Shareholders’ Equity30 —Consolidated Statements of
Cash Flows31 —Notes to Consolidated Financial
Statements42 —Independent Auditors’ Report43 Corporate Data
First Year to Value

Annual Report 2006 1
It is common knowledge that last October Rakuten (by which it is meant Rakuten,Inc. and its subsidiaries) proposed that the two companies should integrate theirmanagement and acquired approximately 19% of TBS’s shares. At the end ofNovember, Rakuten agreed to withdraw the proposal for the time being and enterinto negotiations for a possible business alliance. Rakuten, Inc. also agreed that itwill reduce its shareholding to less than 10%, that any shares exceeding this ratiowould be placed in trust, and that, along with the alliance talks, it would discuss itsfinal shareholding ratio with TBS. The initially agreed-upon deadline for negotiationswas the end of March this year, but the two companies agreed to extend the nego-tiations for the time being.
TBS and the TBS Group intend to maximize overall shareholder value through vari-ous partnerships that will enhance enterprise value, including the core BroadcastingBusiness, as well as the movie business and other Multi Visual Ventures & CulturalEvents Business, and the Real Estate Business. In strengthening its operations, theCompany will also be more conscious of the effective use of its assets and thestate of its capital composition. TBS aims to establish itself as a leading companyin the digital content business, and so the Company will strive to achieve the goalsof the V!-up 2010 and to respond to its shareholders’ and investors’ expectations.
Up toward 2010
Forward-looking statements:
This annual report includes forward-looking statements pertaining to expectations, plans, strate-gies, management goals, future performance, expenses, revenues, income and other forecastsformulated on past experiences. Forward-looking statements necessarily entail some degree ofuncertainty, and the content conveyed in the results as well as underlying factors identified in thereport may differ materially from actual results depending on changes in those factors.
Mino Monta No Asa Zuba!
HAGANE NO RENKINJYUTSU SHI©Arakawa Hiroshi/HAGAREN THE MOVIE
Rondo TBS 50th anniversary special program

A Message from the Management
2 Tokyo Broadcasting System, Inc.
Hiroshi Inoue,President

Annual Report 2006 3
E-commerceMotion picture
contentdistribution
TBS mobile siteIndex, DNP, Imagineer, CYBIRD
Mobile andone-segment services
Audio and musicdistribution
eMobileeAccess
TM MobileMitsui & Co.
Grand MarchéMitsui & Co.
Joint venture / Joint business Business partner
MULTIPLEXTOKYO FM Broadcasting,Nippon Cultural Broadcasting,Nippon Broadcasting System, J-WAVE
i-shop
TC EntertainmentTSUTAYA, IMJ, MBS
ColorCodeColorzip
NANO MediaITOCHU
PodcastingNIFTY
IndexcastingIndex,Tanabe Agency
TRESOLAFuji Television Network,TV Asahi Net-Marketing
CYBERBRED
VODNEO Index News-i
Tomo-DigiMatsushita ElectricIndustrial, NTT Group
Boo Bo Box
Rise (Beijin) DigitalNihon Enterprise
Interactive shopping inOsama no Brunch Amazon, DENTSU
TeMoIndex, eachbroadcast station
State of alliances in the mobile and Internet industry
Multilateral businessdevelopment centering on
attractive programs
As of March 31, 2006
Maximizing theValue of Media
In the United States, so much attention
is being paid to the big advances by
Internet and other IT firms that terrestrial
broadcast TV companies have come to
be considered “non-growth” businesses.
What is the situation in Japan?
>>>The television industries in Japan and
the United States are very different. For
example, the key broadcasters in Tokyo
have in-house program production capabili-
ties, unlike the United States where TV
drama production is outsourced, and also
maintain extensive copyright authority over
their programming, Therefore, they have an
overwhelmingly powerful presence in the
movie content market.
According to Ministry of Internal Affairs and
Communications statistics, the primary dis-
tribution market for content in Japan in 2004
was worth a total of ¥8.8 trillion, of which
the terrestrial TV broadcast held the top
share at 29%.
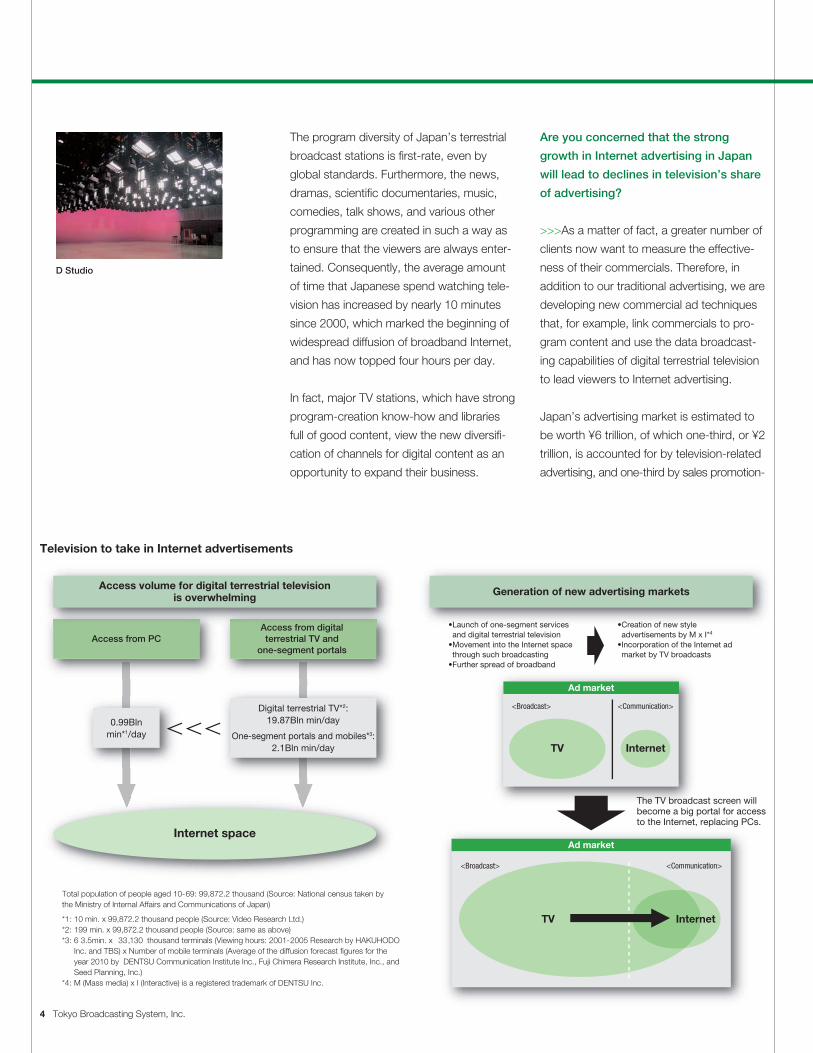
The program diversity of Japan’s terrestrial
broadcast stations is first-rate, even by
global standards. Furthermore, the news,
dramas, scientific documentaries, music,
comedies, talk shows, and various other
programming are created in such a way as
to ensure that the viewers are always enter-
tained. Consequently, the average amount
of time that Japanese spend watching tele-
vision has increased by nearly 10 minutes
since 2000, which marked the beginning of
widespread diffusion of broadband Internet,
and has now topped four hours per day.
In fact, major TV stations, which have strong
program-creation know-how and libraries
full of good content, view the new diversifi-
cation of channels for digital content as an
opportunity to expand their business.
Are you concerned that the strong
growth in Internet advertising in Japan
will lead to declines in television’s share
of advertising?
>>>As a matter of fact, a greater number of
clients now want to measure the effective-
ness of their commercials. Therefore, in
addition to our traditional advertising, we are
developing new commercial ad techniques
that, for example, link commercials to pro-
gram content and use the data broadcast-
ing capabilities of digital terrestrial television
to lead viewers to Internet advertising.
Japan’s advertising market is estimated to
be worth ¥6 trillion, of which one-third, or ¥2
trillion, is accounted for by television-related
advertising, and one-third by sales promotion-
Access volume for digital terrestrial televisionis overwhelming Generation of new advertising markets
Access from digital terrestrial TV and
one-segment portals
Digital terrestrial TV*2:19.87Bln min/day
One-segment portals and mobiles*3:2.1Bln min/day
Internet space
Access from PC
0.99Blnmin*1/day
•Launch of one-segment services•and digital terrestrial television•Movement into the Internet space•through such broadcasting•Further spread of broadband
•Creation of new style •advertisements by M x I*4
•Incorporation of the Internet ad•market by TV broadcasts
The TV broadcast screen will become a big portal for access to the Internet, replacing PCs.
Total population of people aged 10-69: 99,872.2 thousand (Source: National census taken by the Ministry of Internal Affairs and Communications of Japan)
*1: 10 min. x 99,872.2 thousand people (Source: Video Research Ltd.)*2: 199 min. x 99,872.2 thousand people (Source: same as above)*3: 6 3.5min. x 33,130 thousand terminals (Viewing hours: 2001-2005 Research by HAKUHODO Inc. and TBS) x Number of mobile terminals (Average of the diffusion forecast figures for the year 2010 by DENTSU Communication Institute Inc., Fuji Chimera Research Institute, Inc., and Seed Planning, Inc.)*4: M (Mass media) x I (Interactive) is a registered trademark of DENTSU Inc.
Ad market
<Broadcast> <Communication>
Television to take in Internet advertisements
TV Internet
Ad market
<Broadcast> <Communication>
TV Internet
4 Tokyo Broadcasting System, Inc.
D Studio

TBS Broadcasting Center
Evening Five
Arashi No Yoru Ni©2005 “Arashi No Yoru Ni” Production Committee
Timeline of TV advertising market growth
Apr. 2006Launch of
one-segment services
Jul. 2011Complete switch to digital
terrestrial television
InternetApprox.
¥180 billion
TVApprox.
¥2 trillion
Market size
Existing TV admarket
2004 Time
*M (Mass media) x I (Interactive) is a registered trademark of DENTSU Inc.Note: The figures for market size are based on our forecasts.
TV ad market to expandby the launch of
one-segment services
New style adsto spread by M x I*
Internet admarket
related advertising. We expect to gradually
capture an even greater amount of the ¥2
trillion in TV advertising by using digital
technologies in conjunction with the Internet
to create new advertising methods.
In addition, corporate sales promotion
spending on marketing events, which is on
the fringe of the advertising market, totals
some ¥4 trillion. We will try to capture a
portion of this market as well.
Please describe TBS’s brand image and
what its strengths are.
>>>We have a strong reputation for provid-
ing high-quality programming that is suit-
able for all members of a family. We have a
strong tradition of excellence in dramas and
news and have a very high level of produc-
tion capability in these areas.
Can you explain why you are currently
ranked third among key broadcasters in
Tokyo in the all-day time slot and in
consolidated net sales?
>>>Until the early 1980s, we had captured
the top spot in viewer ratings, but our
share has gradually slipped to third place
since then.
Among the reasons for this deterioration
are the declines in popularity of our news
and drama series in general and various
difficulties arising from the alternation of
generations in the fields of production of
comedy and variety shows. However, dur-
ing the previous fiscal year, we were suc-
cessful in boosting our golden time rating
to sole position of second place. This her-
alds changes for the better.
Annual Report 2006 5
Maximizing the Value of Media
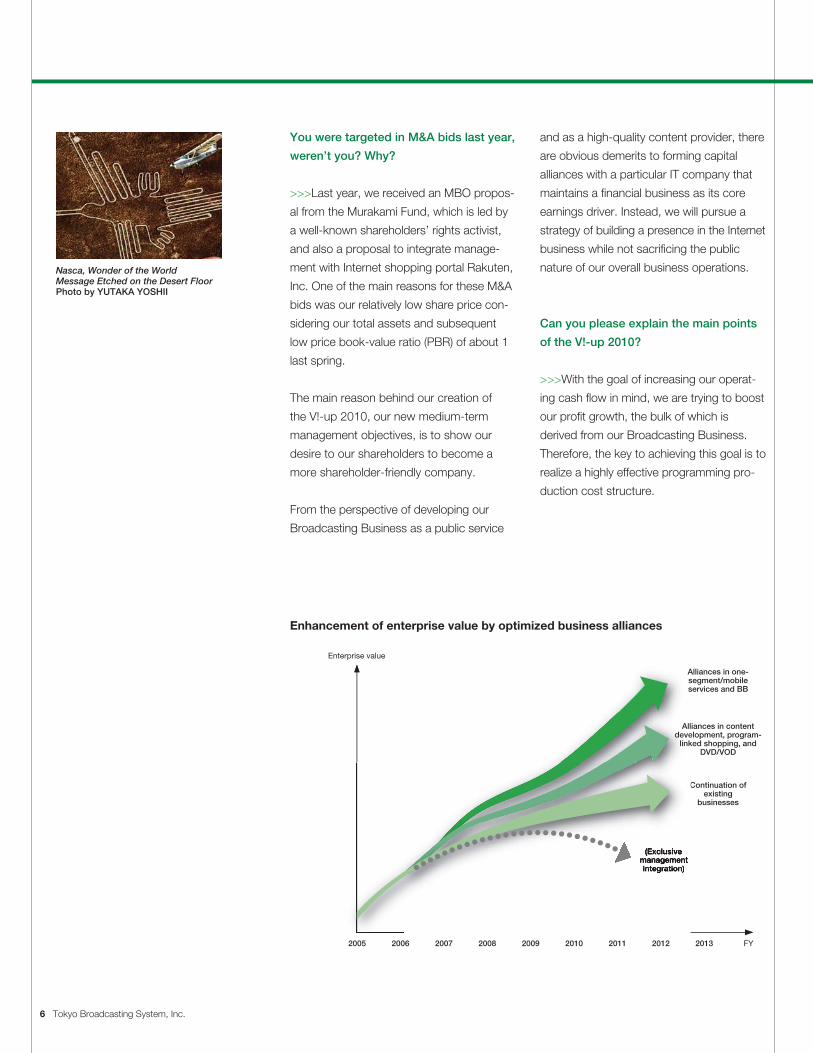
Enhancement of enterprise value by optimized business alliances
Enterprise value
2005 2006 2007 2008 2009 2010 2011 2012 2013 FY
Alliances in one-segment/mobileservices and BB
Continuation ofexisting
businesses
(Exclusivemanagementintegration)
Alliances in contentdevelopment, program-
linked shopping, andDVD/VOD
You were targeted in M&A bids last year,
weren’t you? Why?
>>>Last year, we received an MBO propos-
al from the Murakami Fund, which is led by
a well-known shareholders’ rights activist,
and also a proposal to integrate manage-
ment with Internet shopping portal Rakuten,
Inc. One of the main reasons for these M&A
bids was our relatively low share price con-
sidering our total assets and subsequent
low price book-value ratio (PBR) of about 1
last spring.
The main reason behind our creation of
the V!-up 2010, our new medium-term
management objectives, is to show our
desire to our shareholders to become a
more shareholder-friendly company.
From the perspective of developing our
Broadcasting Business as a public service
and as a high-quality content provider, there
are obvious demerits to forming capital
alliances with a particular IT company that
maintains a financial business as its core
earnings driver. Instead, we will pursue a
strategy of building a presence in the Internet
business while not sacrificing the public
nature of our overall business operations.
Can you please explain the main points
of the V!-up 2010?
>>>With the goal of increasing our operat-
ing cash flow in mind, we are trying to boost
our profit growth, the bulk of which is
derived from our Broadcasting Business.
Therefore, the key to achieving this goal is to
realize a highly effective programming pro-
duction cost structure.
6 Tokyo Broadcasting System, Inc.
Nasca, Wonder of the WorldMessage Etched on the Desert FloorPhoto by YUTAKA YOSHII

Another important factor is to increase
sales share in our non-broadcasting busi-
nesses. We plan to aggressively pursue
new revenue streams, such as the use of
our program content over multiple trans-
mission channels, and we have already
begun to expand our sales by selling DVDs
of our TV programs and by investing in
movie production.
Finally, in our Real Estate Business, we
expect the Akasaka Redevelopment Project
to become highly profitable and to yield
strong cash flow after its opening in the fiscal
year ending March 31, 2008.
Most Japanese broadcasters boast
strong balance sheets with considerable
shareholders’ equity and quality assets,
but compared to other industries, their
ROE tends to be rather low.
>>>The effective use of assets has become
a topic of serious consideration for us during
the past several years. While we cannot dis-
cuss the details of our plans, we expect to
liquidate at the best possible opportunity
any assets that are not considered neces-
sary for our current business strategy.
We estimated ROE and ROA, both impor-
tant indicators of assets and capital efficien-
cy, through fiscal 2010 when we devised
the V!-up plan. If the plan proceeds smooth-
ly, we expect our ROE and ROA to rise to
some extent. We also expect profit margins
on our invested capital to exceed our
weighted average cost of capital by the fis-
cal year ending March 31, 2009 with the
launch of the Akasaka Redevelopment
Project. Therefore, we expect to be able to
significantly raise our shareholder value.
Do you consider increasing return to
shareholders?
>>>We recognize this to be a very impor-
tant topic for the future. Currently, our goal
is a 20% dividend payout ratio based upon
our parent earnings. However, with the
effective implementation of our V!-up 2010,
we expect to be able to increase the returns
paid to our shareholders in the near future.
There are some who argue that, for a busi-
ness like ours, with its stable cash flows, it is
more appropriate to establish a level of divi-
dend payments based on a dividend on
equity ratio (DOE). We will consider this and
other benchmarks in the payment of our
dividends in the future.
Your V!-up 2010 looks promising, but
what are the biggest risk factors associ-
ated with this plan?
>>>We are working to raise the awareness
of each and every one of our employees
with regard to the balance between costs
and profits. We have a large number of staff
who produce dramas that have been
embraced and highly acclaimed by the pub-
lic, but we need to continue to produce lots
of the kind of programs that viewers really
want, or we will not be able to maintain our
high level of growth as a company. Therefore,
if the V!-up 2010 is not successfully adopted
across the board, we face the risk of not
achieving our growth projections.
Another large risk factor for us as a broad-
caster is the problem of how to develop
and retain talented, creative staff, since our
performance hinges on superior skills in
program production.
Annual Report 2006 7
Maximizing the Value of Media
SINKING OF JAPAN©2006 “SINKING OF JAPAN” ProductionCommittee
Kinuta Studio
Hachi Ji Dayo! Zenin Shugo 2005(DVD)

8 Tokyo Broadcasting System, Inc.
V!-up 2010 FY2005 Result FY2006 Plan FY2008 FY2010
Consolidated net sales 306.0 319.7 355.0 435.0 Broadcasting 259.4 263.9 271.0 285.0 Multi Visual Ventures & Cultural Events 44.1 53.3 74.0 135.0 Real Estate 2.5 2.5 10.0 15.0
Consolidated operating income 16.4 23.8 39.0 59.0 Broadcasting 10.2 15.3 23.5 32.0 Multi Visual Ventures & Cultural Events 5.6 8.0 12.5 20.0 Real Estate 0.6 0.5 3.0 7.0
Consolidated operating cash flow 23.3 25.0 35.0 50.0
All-day viewer rating 8.0% 8.1% 8.6% 9.0%
TBS’s share of spot sales among the 5 key broadcasters in Tokyo 21.2% 21.5% 23.0% 25.0%
(Segment sales figures represent sales from outside customers.)*As of FY2006, two subsidiaries were transferred from the Broadcasting segment to the Multi Visual Ventures & Cultural Events segment.
(Billions of yen)
What Is OurV!-Up 2010?
For the fiscal year ending March 31, 2011, we have estab-lished a very aggressive goal of ¥32 billion in operatingincome for our Broadcasting Business, which is approxi-mately double the amount targeted in the plan of the fiscalyear ending March 31, 2007.
In our Multi Visual Ventures & Cultural Events Business, weset a goal of ¥135 billion in sales for the fiscal year ending
March 31, 2011, or triple the ¥44.1 billion in sales we record-ed during the fiscal year under review.
The main driver of our Real Estate Business earnings will bethe Akasaka Redevelopment Project, which is scheduled forcompletion in January 2008.
New Medium-Term Management ObjectivesAs of March 31, 2006
Medium-Term Management Objectives

Annual Report 2006 9
(Billions of yen)
FY2004
FY2010
54%69%
28%34%
12%
3%
Broadcasting
Real Estate
Multi Visual Ventures& Cultural Events
FY2004 FY2010
Consolidated operating income 22.5 59.0
Broadcasting 15.7 32.0 Operating income margin 6.1% 11.4%
Multi Visual Ventures & Cultural Events 6.2 20.0 Operating income margin 15.3% 14.8%
Real Estate 0.6 7.0 Operating income margin 24.0% 46.7%
We project our Broadcasting, Multi Visual Ventures & CulturalEvents, and Real Estate businesses to comprise 54%, 34%,and 12% of operating income, respectively, in the fiscal yearending March 31, 2011.
We base our projections for higher profitability in ourBroadcasting Business on growth in spot revenue arisingfrom increases in the share of our viewer ratings and onrestrained growth in business expenses.
Because we estimated the risks associated with new digitalbusinesses and other development businesses at a ratherhigh level and profitability relatively low (in particular, we set atarget operating income margin of 0 for our “other develop-ment” business in the fiscal year ending March 31, 2011), wehave deliberately projected a slight decline in the profitabilityof our Multi Visual Ventures & Cultural Events Business.
We estimate that the Akasaka Redevelopment Project willaccount for 86%, or ¥6 billion, of the operating income in ourReal Estate Business.
Composition of Operating Income
Forecast at present time for fiscal year ending March 31, 2007 onward
(Billions of yen)Consolidated FY2006 FY2007 FY2008 FY2009 FY2010
Capital Expenditures 26.5 38.0 24.5 11.0 11.0
Depreciation 12.2 11.0 12.5 12.5 12.5
Capital Expenditures & Depreciation
K-1©FEG Inc.
NADA SOU SOU©2006 “NADA SOU SOU–Tears for You”Production Committee
Masterpieces of the Museum Island,Berlin—Visions of the Divine in theSanctuary of Art

10 Tokyo Broadcasting System, Inc.
¥40 billion30%
¥30 billion22%
¥135 billion
¥40 billion30%
¥25 billion19%
Other development businesses
New digital businesses
•TC Entertainment•Boo Bo Box•E-commerce•One-segment services•Content development fund, etc.
Head office of project development
Existing consolidated subsidiaries
Projected revenue from Multi Visual Venture & Cultural Events Business (from outside customers) in FY2010
TC Entertainment, Inc., a newly established company thatstarted its operations in December 2005, focuses on sellingDVDs of popular TBS programs, including some of ourdrama series.
Boo Bo Box, which started its operations in November 2005,is a new business to sell various motion picture content,including dramas, movies, concerts, and documentaries as“video-on-demand” over the Internet.
Revenue from Multi Visual Ventures & Cultural Events Business
We base the increases in our spot revenue on increases inour viewer ratings relative to the other four key broadcastersin Tokyo.
Based on our actual program cost levels in fiscal years endedMarch 31, 2004 and 2005 of ¥119.0 billion and ¥120.9 bil-lion, respectively, we have established a basic target for pro-gram costs of ¥120 billion.
Assumption of the plan
• Average increase of spot revenue: Between 2.5% and 3.0%• Average increase of time revenue: Approx. 1.0%• Program (production) costs: ¥120 billion as the fundamental indicator• Consolidated average depreciation: Approx. ¥12 billion
Revenue from Broadcasting
Pittanko Kan Kan NANA©2005 “NANA” Production Committee
Don QuixoteTetsuya Kumakawa K-BALLET COMPANY Photo by JIN KIMOTO
Annual Report 2006 11
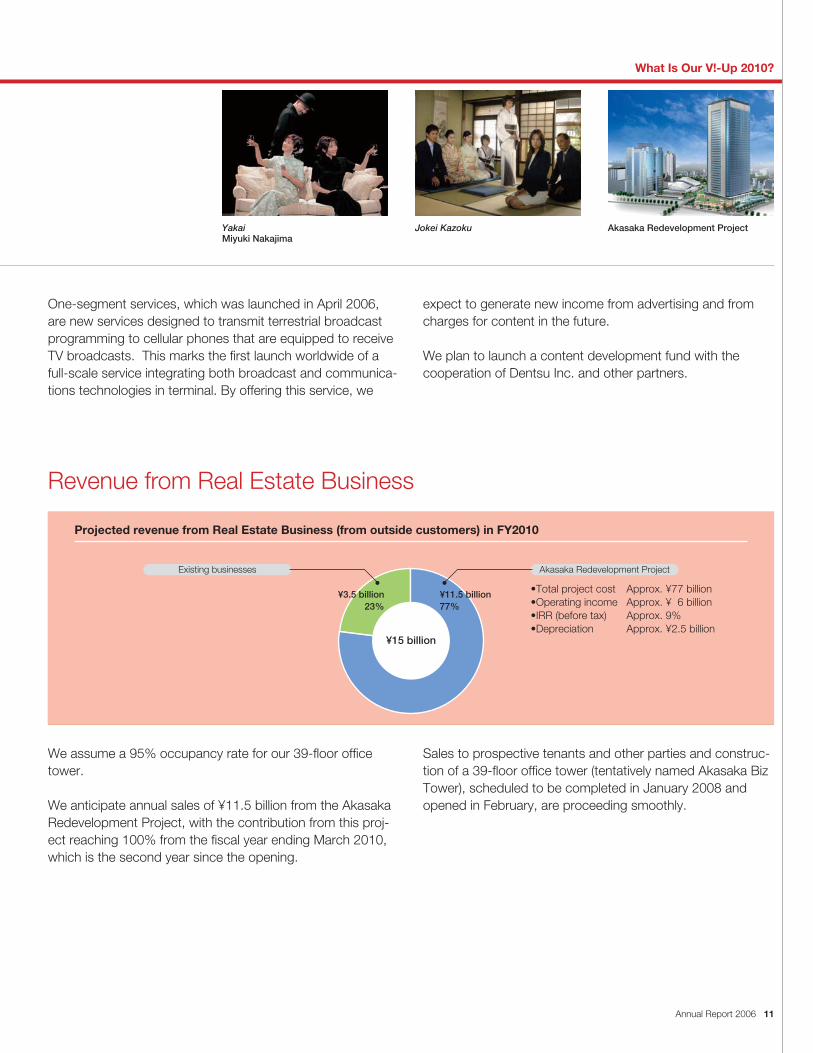
One-segment services, which was launched in April 2006, are new services designed to transmit terrestrial broadcastprogramming to cellular phones that are equipped to receiveTV broadcasts. This marks the first launch worldwide of afull-scale service integrating both broadcast and communica-tions technologies in terminal. By offering this service, we
expect to generate new income from advertising and fromcharges for content in the future.
We plan to launch a content development fund with thecooperation of Dentsu Inc. and other partners.
We assume a 95% occupancy rate for our 39-floor officetower.
We anticipate annual sales of ¥11.5 billion from the AkasakaRedevelopment Project, with the contribution from this proj-ect reaching 100% from the fiscal year ending March 2010,which is the second year since the opening.
Sales to prospective tenants and other parties and construc-tion of a 39-floor office tower (tentatively named Akasaka BizTower), scheduled to be completed in January 2008 andopened in February, are proceeding smoothly.
¥11.5 billion77%
¥15 billion
¥3.5 billion23%
Existing businesses
•Total project cost Approx. ¥77 billion•Operating income Approx. ¥ 6 billion•IRR (before tax) Approx. 9%•Depreciation Approx. ¥2.5 billion
Akasaka Redevelopment Project
Projected revenue from Real Estate Business (from outside customers) in FY2010
Revenue from Real Estate Business
What Is Our V!-Up 2010?
YakaiMiyuki Nakajima
Jokei Kazoku Akasaka Redevelopment Project
12 Tokyo Broadcasting System, Inc.
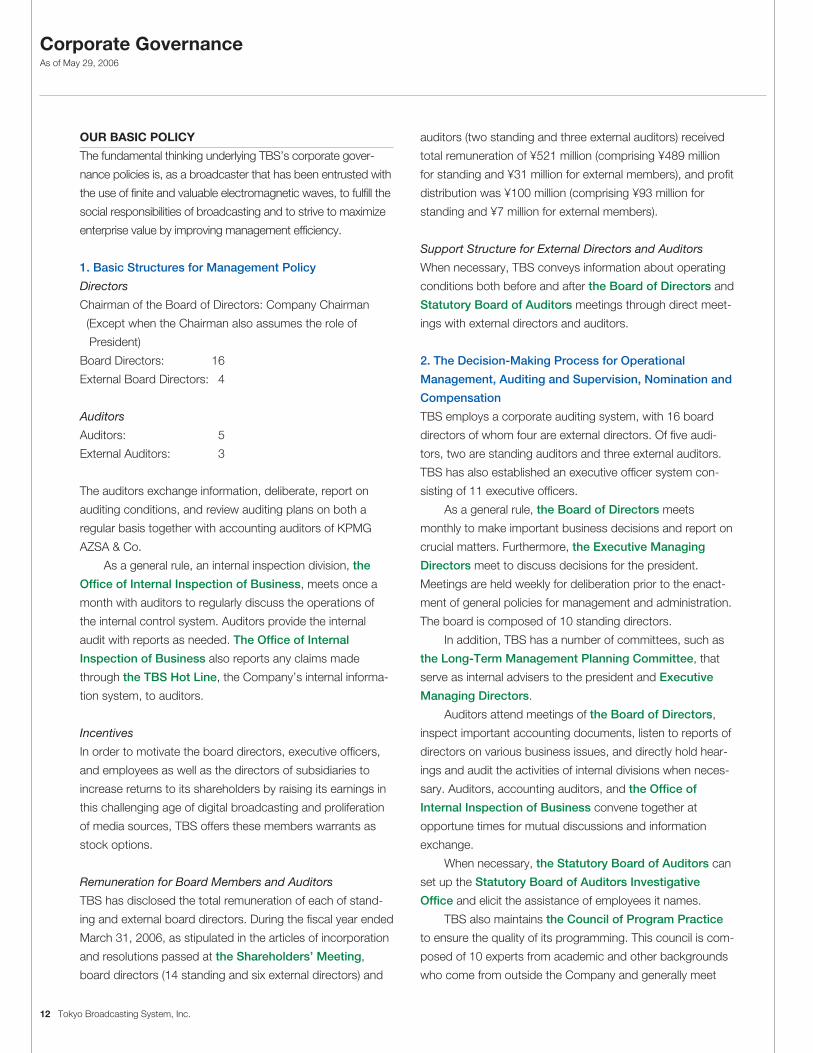
OUR BASIC POLICY
The fundamental thinking underlying TBS’s corporate gover-
nance policies is, as a broadcaster that has been entrusted with
the use of finite and valuable electromagnetic waves, to fulfill the
social responsibilities of broadcasting and to strive to maximize
enterprise value by improving management efficiency.
1. Basic Structures for Management Policy
Directors
Chairman of the Board of Directors: Company Chairman
(Except when the Chairman also assumes the role of
President)
Board Directors: 16
External Board Directors: 4
Auditors
Auditors: 5
External Auditors: 3
The auditors exchange information, deliberate, report on
auditing conditions, and review auditing plans on both a
regular basis together with accounting auditors of KPMG
AZSA & Co.
As a general rule, an internal inspection division, the
Office of Internal Inspection of Business, meets once a
month with auditors to regularly discuss the operations of
the internal control system. Auditors provide the internal
audit with reports as needed. The Office of Internal
Inspection of Business also reports any claims made
through the TBS Hot Line, the Company’s internal informa-
tion system, to auditors.
Incentives
In order to motivate the board directors, executive officers,
and employees as well as the directors of subsidiaries to
increase returns to its shareholders by raising its earnings in
this challenging age of digital broadcasting and proliferation
of media sources, TBS offers these members warrants as
stock options.
Remuneration for Board Members and Auditors
TBS has disclosed the total remuneration of each of stand-
ing and external board directors. During the fiscal year ended
March 31, 2006, as stipulated in the articles of incorporation
and resolutions passed at the Shareholders’ Meeting,
board directors (14 standing and six external directors) and
auditors (two standing and three external auditors) received
total remuneration of ¥521 million (comprising ¥489 million
for standing and ¥31 million for external members), and profit
distribution was ¥100 million (comprising ¥93 million for
standing and ¥7 million for external members).
Support Structure for External Directors and Auditors
When necessary, TBS conveys information about operating
conditions both before and after the Board of Directors and
Statutory Board of Auditors meetings through direct meet-
ings with external directors and auditors.
2. The Decision-Making Process for Operational
Management, Auditing and Supervision, Nomination and
Compensation
TBS employs a corporate auditing system, with 16 board
directors of whom four are external directors. Of five audi-
tors, two are standing auditors and three external auditors.
TBS has also established an executive officer system con-
sisting of 11 executive officers.
As a general rule, the Board of Directors meets
monthly to make important business decisions and report on
crucial matters. Furthermore, the Executive Managing
Directors meet to discuss decisions for the president.
Meetings are held weekly for deliberation prior to the enact-
ment of general policies for management and administration.
The board is composed of 10 standing directors.
In addition, TBS has a number of committees, such as
the Long-Term Management Planning Committee, that
serve as internal advisers to the president and Executive
Managing Directors.
Auditors attend meetings of the Board of Directors,
inspect important accounting documents, listen to reports of
directors on various business issues, and directly hold hear-
ings and audit the activities of internal divisions when neces-
sary. Auditors, accounting auditors, and the Office of
Internal Inspection of Business convene together at
opportune times for mutual discussions and information
exchange.
When necessary, the Statutory Board of Auditors can
set up the Statutory Board of Auditors Investigative
Office and elicit the assistance of employees it names.
TBS also maintains the Council of Program Practice
to ensure the quality of its programming. This council is com-
posed of 10 experts from academic and other backgrounds
who come from outside the Company and generally meet
Corporate GovernanceAs of May 29, 2006

Annual Report 2006 13
once a month to advise the Company about the
programming.
Important topics undergo prior deliberation by the
Executive Managing Directors. Decisions concerning
investment, financing, and other issues undergo prior scruti-
ny by the Investment and Financial Judging Committee.
The TBS Group Management Liaison Committee, which
comprises directors and executive officers, meets weekly to
coordinate goals and share information about key business
issues.
The Comprehensive Coordination Committee was
formed in June 1996 to gather information, conduct
research, and study policies about risk management. It
reports to the Executive Managing Directors. This com-
mittee is headed by a senior managing director in charge
and a vice chairman and supported by six committee mem-
bers who are at least division presidents, six executive secre-
taries, and 21 special committee members from departments
throughout the Company. In particular, for responding to
problems with program broadcasting and production, the
special committee members gather weekly, share informa-
tion, and examine how to prevent reoccurrences.
In June 2001, we established the Office of Internal
Inspection of Business to conduct internal audits of all
operations as well as engage in analysis and draft proposals
for improving businesses. It gathers information from
throughout the Group on potential problems that could
cause corporate economic deterioration or erode the com-
munity’s confidence in the Company, and then it compiles
detailed reports on effective strategies to counter such prob-
lems. In April 2005, the Office of Compliance was created
to build and operate internal control systems and to oversee
both compliance and crisis management.
The Division of Program Review and Media Literacy
examines programs for broadcasting before they are aired
and monitors live programs every day to ensure that they
meet the TBS Broadcasting Standards.
The Broadcast Ethics Committee is run by a commit-
tee chairman who is a board director in charge and other
members from across the Company and meets monthly. It
reports on issues related to ethics in broadcasting, shares
information, and works to thoroughly understand ethical
issues.
The Special Committee for Broadcasting and
Human Rights was formed in February 1997 and includes
lawyers and journalists from outside the Company who offer
constructive proposals about the issues involving human
rights in broadcasting. The Guidelines on News Ethics are
revised each year by TBS News, which works to enhance
ethical standards in broadcasting and prevent human rights
violations.
Aside from these bodies, TBS has established the
Insider Trading Regulations and works to prevent unfair
securities transactions by executives and employees; the
Company’s Privacy Policy is enforced by the Privacy
Management Committee to prevent misuse of personal
information and data leaks; the Regulations for IT
Networks were developed; and the IT Network Committee
strives to prevent inappropriate access to network systems.
It also examines the misuse of email and other problems.
The Information Disclosure Committee helps to fortify
our disclosure activities. The Board of Directors has formu-
lated the Basic Policies for Managing Market Risk. The
board takes a fresh look at market risks every six months
and reports to the Executive Managing Directors on hedg-
ing and other factors.
TBS promotes accounting audits based on the
Commercial Code and accounting audits based on the
Securities and Exchange Law through KPMG AZSA & Co.
The Company also notes that it maintains no special inter-
ests with the corporate auditing company or the auditors
seconded to audit the Company. TBS has selected account-
ing support staff based on criteria determined by this corpo-
rate auditing company. Specifically, TBS employs primarily
certified public accountants and assistant certified public
accountants.
3. Measures and Policies for Dealing with Shareholders
and Other Stakeholders
Measures to Invigorate the Shareholders’ Meeting
and to Promote Shareholder Voting
TBS announces the Shareholders’ Meeting Notice on its
website and also a site to be created by the administrator of
the shareholders’ list.
IR Activities
TBS conducts large meetings for analysts and institutional
investors on a quarterly basis, where the Company provides
information about its medium-term management objectives
and financial performance. The Company also holds small
meetings with investors when necessary and accepts one-
on-one visits on a request basis. In addition to publishing the
annual report, TBS lists all disclosure and IR documents on
its website.
14 Tokyo Broadcasting System, Inc.
Working to Respect the Interests of All Stakeholders
As part of efforts to respect the interests of stakeholders,
TBS has established the TBS Group Activities Charter and
the TBS Group Activities Standards. The Company has
also created the TBS Group Information Disclosure
Policies to define policy on providing information to stake-
holders.
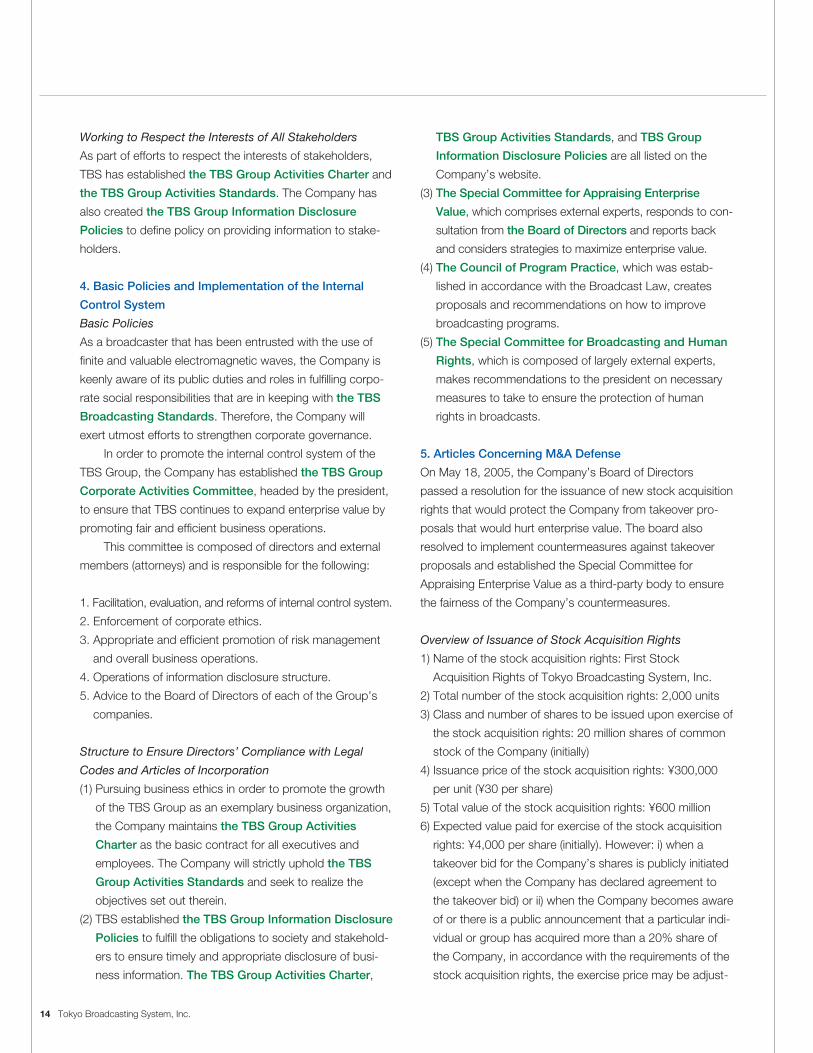
4. Basic Policies and Implementation of the Internal
Control System
Basic Policies
As a broadcaster that has been entrusted with the use of
finite and valuable electromagnetic waves, the Company is
keenly aware of its public duties and roles in fulfilling corpo-
rate social responsibilities that are in keeping with the TBS
Broadcasting Standards. Therefore, the Company will
exert utmost efforts to strengthen corporate governance.
In order to promote the internal control system of the
TBS Group, the Company has established the TBS Group
Corporate Activities Committee, headed by the president,
to ensure that TBS continues to expand enterprise value by
promoting fair and efficient business operations.
This committee is composed of directors and external
members (attorneys) and is responsible for the following:
1. Facilitation, evaluation, and reforms of internal control system.
2. Enforcement of corporate ethics.
3. Appropriate and efficient promotion of risk management
and overall business operations.
4. Operations of information disclosure structure.
5. Advice to the Board of Directors of each of the Group’s
companies.
Structure to Ensure Directors’ Compliance with Legal
Codes and Articles of Incorporation
(1) Pursuing business ethics in order to promote the growth
of the TBS Group as an exemplary business organization,
the Company maintains the TBS Group Activities
Charter as the basic contract for all executives and
employees. The Company will strictly uphold the TBS
Group Activities Standards and seek to realize the
objectives set out therein.
(2) TBS established the TBS Group Information Disclosure
Policies to fulfill the obligations to society and stakehold-
ers to ensure timely and appropriate disclosure of busi-
ness information. The TBS Group Activities Charter,
TBS Group Activities Standards, and TBS Group
Information Disclosure Policies are all listed on the
Company’s website.
(3) The Special Committee for Appraising Enterprise
Value, which comprises external experts, responds to con-
sultation from the Board of Directors and reports back
and considers strategies to maximize enterprise value.
(4) The Council of Program Practice, which was estab-
lished in accordance with the Broadcast Law, creates
proposals and recommendations on how to improve
broadcasting programs.
(5) The Special Committee for Broadcasting and Human
Rights, which is composed of largely external experts,
makes recommendations to the president on necessary
measures to take to ensure the protection of human
rights in broadcasts.
5. Articles Concerning M&A Defense
On May 18, 2005, the Company’s Board of Directors
passed a resolution for the issuance of new stock acquisition
rights that would protect the Company from takeover pro-
posals that would hurt enterprise value. The board also
resolved to implement countermeasures against takeover
proposals and established the Special Committee for
Appraising Enterprise Value as a third-party body to ensure
the fairness of the Company’s countermeasures.
Overview of Issuance of Stock Acquisition Rights
1) Name of the stock acquisition rights: First Stock
Acquisition Rights of Tokyo Broadcasting System, Inc.
2) Total number of the stock acquisition rights: 2,000 units
3) Class and number of shares to be issued upon exercise of
the stock acquisition rights: 20 million shares of common
stock of the Company (initially)
4) Issuance price of the stock acquisition rights: ¥300,000
per unit (¥30 per share)
5) Total value of the stock acquisition rights: ¥600 million
6) Expected value paid for exercise of the stock acquisition
rights: ¥4,000 per share (initially). However: i) when a
takeover bid for the Company’s shares is publicly initiated
(except when the Company has declared agreement to
the takeover bid) or ii) when the Company becomes aware
of or there is a public announcement that a particular indi-
vidual or group has acquired more than a 20% share of
the Company, in accordance with the requirements of the
stock acquisition rights, the exercise price may be adjust-

Annual Report 2006 15
ed to 90% of the average closing market price over the
six-month period ending on the date when one of the two
conditions is fulfilled. Also, after June 1, 2007, on the next
trading day after every Friday, the exercise price will be
adjusted to the fair market price (the average closing mar-
ket price of the latest successive five trading days).
7) Exercise period: June 6, 2005 through June 30, 2007
For the period through May 31, 2007, and only when the
exercise price has been adjusted, it is possible to exercise
the options at the adjusted exercise price for 45 days fol-
lowing the effective date of the adjustment.
8) Reason and conditions for retirement of the stock acquisi-
tion rights: In the event that it is deemed necessary to
retire the stock acquisition rights, the Company’s Board of
Directors may cancel all or a portion of the remaining
options issued at ¥300,000 per unit by making said deci-
sion at least one day in advance of the exercise price
adjustment, and by publicly announcing the retirement of
the options at least one month in advance of the said
retirement date decided by the Board of Directors.
9) Recipient of allotment: Nikko Principal Investments Japan
Ltd. (NPI) was the recipient of the entire third-party allot-
ment of stock acquisition rights by the Company.
Policies for Responding to Takeover Proposals
for the Company’s Stock
1. Objective
TBS is not only an ongoing business that takes on responsi-
bilities as part of its obligations as a public listed company to
contribute to growth in the market economy, but it is also a
company charged with an important public mission as a
broadcaster entrusted with the use of finite and valuable
electromagnetic waves. The nature of the Company is given
in the TBS Broadcasting Standards, established by the
Company in accordance with the Broadcast Law. The pref-
ace of the TBS Broadcasting Standards reads as follows:
“The mission of TBS shall be to recognize the social
responsibility of broadcasting and its public mission, to
endeavor to popularize and improve cultural expression by
sufficiently leveraging the characteristics of various media,
and to contribute to the public welfare and the realization of
a peaceful, democratic world, a better society, and a healthi-
er global environment. Based on the principle that electro-
magnetic waves are the property of the citizens of Japan,
TBS shall support freedom of expression, raise the social
effectiveness of advertising and publicity, and respond to the
expectations and trust of the Japanese people by respecting
basic human rights, valuing public opinion, maintaining
impartial positions, and ensuring autonomy.” Moreover, in
the event of public calamities or emergencies, the Company
would play a pivotal role as a timely and uninterrupted lifeline
to the community.
With the proliferation of digital terrestrial broadcasting and
the coming of the age of multimedia, the entire broadcasting
business now faces the challenge of how to improve the ability
and the quality of program production, planning, and develop-
ment. In meeting this challenge, the personnel of the TBS
Group, including employees and related staff, represent a key
business resource, while the long-term trusting relationships
with contractors, business partners, and staff who support the
Company to create programming and content are also a criti-
cal part of the foundation of business activities.
For TBS, these characteristics, which cannot be fully
measured in quantitative terms, are what create enterprise
value. Additionally, futile money games and speculative
behavior not only threaten the Company’s ability to generate
healthy returns for investors and shareholders but may also
cause considerable losses to society as a whole.
As a fundamental media and news organization, the
Company considers that it is a critical matter to prevent a
reduction in the Company’s enterprise value as a result of
misguided takeover activities. Therefore, the Company has
recently passed a resolution for the policies for responding to
takeover proposals, including the misguided takeover activi-
ties toward the Company, and will take appropriate counter-
measures.
The Company recognizes that it is necessary to further
examine comprehensive countermeasures to deal with
takeover proposals that are inconsistent with initiatives to
sustain and increase enterprise value. The following counter-
measures and policies are based on the passage and imple-
mentation of the Japanese Company Law, amendments to
regulations of the Tokyo Stock Exchange, and evolving
social consensus and regulations.
2. Advance Documents Submission and Deliberation Period
In the event that TBS becomes the target of a takeover pro-
posal that would have a substantial negative impact on its
enterprise value, and in light of the important public mission
entrusted upon the Company as a broadcaster, the Company
will gather and provide material that is necessary to evaluate
the takeover attempt on behalf of its shareholders, who will

16 Tokyo Broadcasting System, Inc.
make the final decision on the pros and cons of the takeover
proposal. Also, the Company itself will bear the responsibility
to assess that the post-acquisition management policies of
the party who proposes or makes a takeover bid (hereinafter
“takeover party”) contribute to improvement of the
Company’s enterprise value.
In order to carry out this due diligence process, TBS
will require the takeover party to submit adequate material
before the bid to the Company’s Board of Directors and will
also provide adequate deliberation time to the board to
properly examine and judge the impact of the takeover.
More specifically, the Board of Directors will ask the
takeover party to provide documents regarding the following
items as necessary. The board will also ask the party for an
adequate amount of time to assess the management poli-
cies and business plans provided by the takeover party and
to offer an alternative proposal. In addition, the Company will
disclose all or a part of the material received from the
takeover party, to the extent deemed necessary and appro-
priate, to its shareholders. If the alternative proposal by the
Company exists, the Company will propose it and ask its
shareholders for proactive involvement in the decision-making
process with regard to the takeover proposal and will take
into account that its shareholders can make the final decision.
• Overview of the takeover party
• Objectives of the takeover party and measures to acquire
the Company’s stocks
• Reason of calculation of the pricing and confirmation of the
purchase fund
• Names and descriptions of the organizations or individuals
providing funds for the takeover bid
• Details of the proposed management policies and business
plans of the takeover party after the acquisition (particularly
with regard to policies designed to sustain and steadily
increase enterprise value).
• The takeover party’s philosophy regarding an important
public mission as a broadcaster (including but not limited to
the thoughts regarding the matters subject to Chapters 1,
3, and 3-2 of the Broadcast Law).
• Treatment of the Company’s employees
3. Possible Responses
If requests and procedures prior to any action are ignored
and the party quickly proceeds with takeover actions unilat-
erally, or if the party deemed misguided as a result of prior
dealings launched a takeover bid, the Company may enact
its stock acquisition rights and other plans to the extent nec-
essary and appropriate to prevent damages to and reduc-
tions in enterprise value. The decision by the Company’s
Board of Directors will be made after hearing recommenda-
tions by the Company’s Special Committee for Appraising
Enterprise Value.
The members of the Special Committee for Appraising
Enterprise Value are as follows.
Committee Chairman: Ken Moroi (External Director of the
Company; Corporate Advisor,
Taiheiyo Cement Corporation)
Committee Member: Masatou Kitamura (External Director
of the Company; President, The
Mainichi Newspapers Co., Ltd.)
Committee Member: Keiichiro Okabe (External Auditor of
the Company; Chairman, Cosmo Oil
Co., Ltd.)
Committee Member: Yoshifumi Nishikawa (External
Auditor of the Company; President,
Japan Post Corporation)
Committee Member: Masakazu Iwakura (Attorney,
Nishimura & Partners)
Committee Member: Somitsu Takehara (Certified Public
Accountant, ZECOO Partners)
Committee Member: Zenichi Shishido (Professor, Seikei
Law School)
Annual Report 2006 17
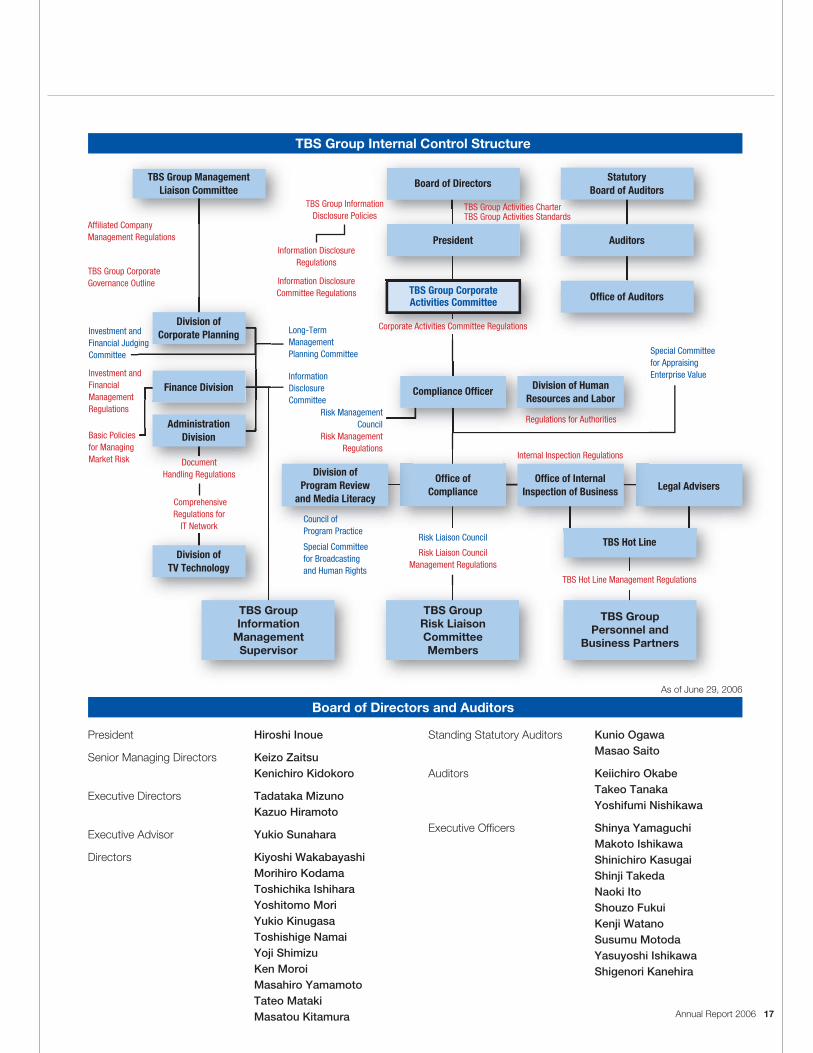
President Hiroshi Inoue
Senior Managing Directors Keizo ZaitsuKenichiro Kidokoro
Executive Directors Tadataka MizunoKazuo Hiramoto
Executive Advisor Yukio Sunahara
Directors Kiyoshi WakabayashiMorihiro KodamaToshichika IshiharaYoshitomo MoriYukio KinugasaToshishige NamaiYoji ShimizuKen MoroiMasahiro YamamotoTateo MatakiMasatou Kitamura
Standing Statutory Auditors Kunio OgawaMasao Saito
Auditors Keiichiro OkabeTakeo TanakaYoshifumi Nishikawa
Executive Officers Shinya YamaguchiMakoto IshikawaShinichiro KasugaiShinji TakedaNaoki ItoShouzo FukuiKenji WatanoSusumu MotodaYasuyoshi IshikawaShigenori Kanehira
TBS Group Internal Control Structure
Board of Directors
Board of Directors and AuditorsAs of June 29, 2006
President
Compliance Officer
Office ofCompliance
Division ofProgram Review
and Media Literacy
TBS GroupRisk LiaisonCommitteeMembers
TBS GroupInformation
ManagementSupervisor
TBS GroupPersonnel and
Business Partners
Affiliated CompanyManagement Regulations
TBS Group InformationDisclosure Policies
Corporate Activities Committee Regulations
Regulations for Authorities
Internal Inspection Regulations
TBS Hot Line Management Regulations
Information DisclosureRegulations
Information DisclosureCommittee Regulations
TBS Group Activities Charter TBS Group Activities Standards
TBS Group CorporateGovernance Outline
Investment andFinancialManagementRegulations
Basic Policiesfor ManagingMarket Risk Document
Handling Regulations
ComprehensiveRegulations for
IT Network
Long-TermManagementPlanning Committee Special Committee
for AppraisingEnterprise Value
TBS Group CorporateActivities Committee
InformationDisclosureCommittee
Investment andFinancial JudgingCommittee
Risk ManagementRegulations
Risk ManagementCouncil
Risk Liaison CouncilManagement Regulations
Risk Liaison Council
Council of Program Practice
Special Committeefor Broadcastingand Human Rights
TBS Hot Line
StatutoryBoard of Auditors
TBS Group ManagementLiaison Committee
Auditors
Office of Auditors
Legal AdvisersOffice of Internal
Inspection of Business
Division of HumanResources and Labor
Division ofCorporate Planning
Finance Division
Division ofTV Technology
AdministrationDivision

18 Tokyo Broadcasting System, Inc.
TBS Group As of March 31, 2006
TBS Radio & Communications, Inc.
Tokyo Broadcasting System Television, Inc.
TBS Service, Inc.
TBS-Vision, Inc.
Art Communication Systems Inc.
Tokyo Broadcasting System International, Inc.
Tohoseisaku, Inc.
TBS TriMedia, Inc.
Akasaka Video Center Co., Ltd.
Dreamax Television Inc.
Akasaka Graphics Art, Inc.
Pro Cam., Inc.
Sounds Art Co., Ltd.
F&F Inc.
Japan Artvideo Service Collaborative, Inc.
VuCast, Inc.
Telecom Sounds, Inc.
Broadcasting
17Companies
Midoriyama Studio City Inc.
TBS Kaikan Co., Ltd.
TBS Kikaku Co., Ltd.
Akasaka Heat Supply Co., Ltd.
TBS Sun Work, Inc.
Real Estate
5Companies
Nichion, Inc.
TBS Plaza Co., Ltd.
TBS Media Research Institute Inc.
OXYBOT, Inc.
TRC, Co., Ltd.
Grand Marché, Inc.
Yokohama Bay Stars Baseball Club, Inc.
Others
7Companies
BS-i, Incorporated
Tomo-Digi Corporation
Totsu Inc.
TLC Co., Ltd.4Companies
Tokyo Broadcasting System, Inc.
Consolidated Subsidiaries
Companies under the Equity Method
(NOTE)Businesses of Each Segment as of April 1, 2006Segment
BroadcastingMulti Visual Ventures& Cultural EventsReal estateOthers
Business
Television and radio broadcasting and related businessesPlanning and production of events and video software, management of a professional baseball club, investment in theatrical movies, e-commerce, video on demands, etc.Leasing of land and buildingsEtc.
*Former Others segment was split into two segments: Multi Visual Ventures & Cultural Events and Others.*TBS Service and TBS TriMedia were transferred from Broadcasting to Multi Visual Ventures & Cultural Events segment.*TC Entertainment newly joined the Multi Visual Ventures & Cultural Events segment.

Annual Report 2006 19
Network As of March 31, 2006
JNN (Japan News Network) JRN (Japan Radio Network)
JNN Overseas Bureaus
Television & RadioTelevisionRadio
TBS R&C
RFC
RAB
ABS
YBC
KNB
FBC
ABCWBS
RNC
RKCRNB
KRY
JRT
TBC
IBC
HBC
BSN
SBC
SBS
CBC
MRO
BSS
MBS
TBS Broadcasting Center Los Angeles
Moscow
Vienna
Cairo
Berlin
Paris
London
Washington, D.C.Seoul
Beijing
Shanghai
Bangkok
New York
RCC RSK
OBS
RKB
NBC
RKK
MBC MRT
RBC
TBSUTYYBS
TUF
ATV
TUY
TUT
KUTV
ITV
TYS

Financial Section
20 Tokyo Broadcasting System, Inc.
Net Sales by Segment
400
0
Broadcasting Real Estate Others
300
200
100
2002 2003 2004 2005 2006
Net Income / Net Income to Sales
15
0
Net Income Net Income to Sales (right scale)
10
5
8
0
6
4
2
2002 2003 2004 2005 2006
Operating Income / Operating Income to Sales
40
0
Operating Income Operating Income to Sales (right scale)
30
20
10
15
0
10
5
2002 2003 2004 2005 2006
(Billions of yen)
Non-Consolidated Net Sales by Segment
300
0
Television
Time Sales
Spot Sales
Programming
Others
Others
200
100
2004 2005 2006
(Billions of yen) (Billions of yen) (%)
(Billions of yen) (%)
SG&A Expenses / SG&A Ratio Capital Expenditures / Cash Flow*
*Cash Flow = Net Income + Depreciation and Amortization
*Debt-to-Equity Ratio = Total Liabilities ÷ Total Shareholders’ Equity x 100
40
0
Capital Expenditures Cash Flow
30
20
10
2002 2003 2004 2005 2006
Interest-Bearing Liabilities / Debt-to-Equity Ratio*
60
0
Interest-Bearing Liabilities Debt-to-Equity Ratio (right scale)
40
20
100
0
75
50
25
2002 2003 2004 2005 2006
(Billions of yen) 80
0
SG&A Expenses SG&A Ratio (right scale)
60
40
20
30
0
20
10
2002 2003 2004 2005 2006
(Billions of yen) (%)
(Billions of yen) (%)
ROA (Return on Assets) / ROE (Return on Equity)
Total Assets / Equity Ratio
600
0
400
200
2002 2003 2004 2005Total Assets Equity Ratio (right scale)
80
0
40
20
60
(Billions of yen) 6
0
ROA ROE
4
2
2002 2003 2004 2005 2006
(%) (%)
2006
Fact SheetTokyo Broadcasting System, Inc. and Consolidated SubsidiariesYears ended March 31

Annual Report 2006 21
Thousands ofMillions of yen U.S. dollars
2006 2005 2004 2003 2002 2001 2006
Television: ¥235,227 ¥233,919 ¥231,920 ¥234,004 ¥236,849 ¥234,203 $2,002,273Time sales 57,601 55,379 55,322 54,861 55,174 53,147 490,305Spot sales 103,019 103,556 101,110 101,295 104,196 109,301 876,910Programming 62,898 62,587 62,237 63,670 63,594 61,793 535,395Others 11,708 12,397 13,251 14,178 13,885 9,962 99,663
Radio — — — — 8,679 15,812 —Others 30,468 28,994 24,744 23,560 23,267 22,821 259,349Note: The U.S. dollar amounts in this report are provided for convenience only and have been converted at the rate of ¥117.48 to $1.00, the approximate rate of
exchange in effect as of March 31, 2006.
Reference Information
Non-Consolidated Net SalesTokyo Broadcasting System, Inc. Years ended March 31
Thousands ofMillions of yen U.S. dollars
2006 2005 2004 2003 2002 2001 2006
For the year:Net sales ¥306,041 ¥301,731 ¥295,016 ¥294,840 ¥291,256 ¥289,561 $2,605,048
Broadcasting 259,418 258,374 257,387 258,817 262,005 260,988 2,208,189Real estate 2,545 2,512 2,865 3,939 4,703 4,903 21,663Others 44,078 40,845 34,764 32,084 24,548 23,670 375,196
Cost of sales 218,658 210,957 201,924 197,992 193,028 186,968 1,861,236Gross profit 87,383 90,774 93,092 96,848 98,228 102,593 743,812Selling, general and
administrative expenses 70,978 68,264 67,821 72,521 66,986 66,766 604,171Operating income 16,405 22,510 25,271 24,327 31,242 35,827 139,641Income before income
taxes and minority interests 27,615 17,201 10,305 23,730 28,249 35,011 235,061Net income 13,514 9,891 4,077 10,599 14,652 19,143 115,032Capital expenditures 26,762 17,196 20,018 13,805 8,051 10,204 227,800Depreciation 14,082 13,079 10,811 10,023 9,875 9,869 119,867
At year-end:Total assets ¥555,272 ¥506,126 ¥484,606 ¥443,779 ¥522,130 ¥376,271 $4,726,524Interest-bearing liabilities 43,402 55,944 44,748 49,497 57,892 58,236 369,442Total shareholders’ equity 378,027 324,724 326,108 298,288 330,946 238,871 3,217,799
Per share data (in yen and U.S. dollars):Net income—basic ¥0,072.17 ¥0,054.59 ¥0,021.73 ¥0,059.10 ¥0,083.77 ¥ 0109.45 $00.614Shareholders’ equity 1,990.91 1,842.34 1,850.28 1,692.03 1,892.44 1,365.67 16.947
Ratios (%):Return on assets 2.6% 2.0% 0.9% 2.2% 3.3% 5.3%Return on equity 3.8 3.0 1.3 3.4 5.1 8.3Equity ratio 68.1 64.2 67.3 67.2 63.4 63.5Note: The U.S. dollar amounts in this report are provided for convenience only and have been converted at the rate of ¥117.48 to $1.00, the approximate rate of
exchange in effect as of March 31, 2006.
Six-Year SummaryTokyo Broadcasting System, Inc. and Consolidated SubsidiariesYears ended March 31

22 Tokyo Broadcasting System, Inc.
OVERVIEW
In the fiscal year under review, ended March 31, 2006, higher
crude oil prices and other factors led to uncertainties in the
Japanese economy. However, the economy continued to
recover briskly, as strong corporate earnings fueled upturns in
employment and personal income and buoyed household
expenditures, and personal consumption increased.
In the broadcasting industry, the advertising market
showed a bullish tone, but growth was relatively low due to
the disappearance of special demand for commercial adver-
tisements associated with the Athens Olympics in the previ-
ous fiscal year.
Under these circumstances, TBS and the TBS Group
placed priority on further improving content quality for the
age of digital broadcasting and the proliferation of media
sources. Recognizing that the mission of the TBS brand is
“Delivering Lasting Impressions and Reliable Information
while Transcending Generations,” the Group worked to
strengthen its programming and expand the scope of its
business domain. Moreover, in marketing, the Group actively
promoted flexible sales activities carefully geared toward the
diversifying needs of its advertising clients.
Consolidated net sales increased 1.4% year on year to
¥306,041 million, rising for the seventh straight fiscal year,
dating back to 1999. This increase was attributed to the
growth in the other businesses division of parent company,
TBS, and our subsidiary that conducts our television shop-
ping business. On the profit side, operating income fell
27.1% to ¥16,405 million owing to higher program produc-
tion costs, depreciation, and retirement benefit costs.
However, net income surged 36.6% to ¥13,514 million due
in part to the gain on sale of investment securities.
SEGMENT ANALYSIS
Broadcasting
Broadcasting revenues increased 0.4% year on year to
¥259,418 million, and operating income from broadcasting
fell 35.3% to ¥10,154 million.
<Television>
Time sales rose 2.1% year on year, thanks to solid sales for
one-time presentations, such as the sports programs The
World Track and Field Championships in Helsinki and The
Torino Winter Olympics, the drama Nada Sou Sou Kono Ai
Ni Ikite, and scientific documentaries, including 3.8 Billion
Years of Life—What is Mankind? Part IV.
Spot sales fell 0.5% year on year, due primarily to weak-
er sales during the first half of the fiscal year and despite a
general recovery in the second half, particularly strong recov-
ery in the fourth quarter, resulting from an improvement in
viewer ratings in the all-day time slot and other slots. By
client segment, strong growth in advertising demand from
the finance, retail, and entertainment & hobby industries, all
of which exceeded double-digit increases compared to the
previous fiscal year.
For programming, the average rating fell 0.1 percentage
points from the previous fiscal year, to 12.8% in both the
golden time and prime time slots. However, rank in golden
time rose from third to second place, marking the highest
ranking in 16 years. To increase its viewer ratings in the all-
day time slot, the Company renovated programs in the
morning, afternoon and evening slots from April 2005. Newly
introduced morning Mino Monta No Asa Zuba! and after-
noon programs Kyohatsu Plus! were able to beat their pre-
decessors’ ratings by large margins, and helped to boost our
ratings in the all-day time slot 0.5 percentage points to 8.0%.
Looking at dramas, Tiger & Dragon, Dragon Zakura,
Hana Yori Dango, and other programs, which broadcast on
Fridays at 10PM, received the strong support of our younger
viewer audience. In addition, special dramas with program-
ming to commemorate our 50th anniversary, such as Odeko
To Odeko Ga Butsukatte, The Birth of the Singer Misora
Hibari and Nada Sou Sou, Hiroshima, August 6, 1945,
scored high viewer ratings at about 20%, which demon-
strates the Company’s strength as a top drama producer.
The number of households capable of receiving BS digi-
tal broadcasting has increased rapidly surpassing 10 million
at the end of August 2005 and reaching 14 million at the end
of March 2006. Under these circumstances, revenues
derived from BS-i, Incorporated., a BS digital broadcasting
company, rose ¥622 million from the previous fiscal year, to
¥5,431 million. Operating loss improved ¥1,372 million to
¥2,601 million.
BS-i is offering content with attractive, high-quality
images and sounds, especially in the HD broadcasting area.
Management’s Discussion and Analysis

Annual Report 2006 23
It is making diligent efforts to further fortify its position as a
leading company in digital broadcasting in the industry.
<Radio>
In the radio segment, TBS’s radio license was transferred to
TBS Radio & Communications, Inc. (TBS R&C), a subsidiary,
and it began radio broadcast operations on October 1, 2001.
Net sales of TBS R&C decreased 1.3% year on year to
¥15,620 million, and operating income declined 46.0% year
on year to ¥504 million. Time sales suffered in part due to
weak sales for nighttime professional baseball programs.
Spot sales increased in the first half of the fiscal year, buoyed
by favorable viewer ratings, but fell in the third quarter,
reflecting the strong showing a year earlier. As a result, sales
fell from the previous fiscal year’s level.
In the audience rating surveys conducted every two
months, TBS R&C took the top slot in each of the six audi-
ence surveys during the fiscal year. As such, the company
has maintained the top ranking in the survey since August
2001 as the leading radio broadcaster in the Tokyo metro-
politan area.
Real Estate
Revenues from real estate increased 1.3% year on year to
¥2,545 million, and operating income declined 0.1% to ¥623
million. As the Akasaka Redevelopment Project is still under
way, there were no major changes in segment operations
during the fiscal year.
Other Businesses
Revenues from other businesses climbed 7.9% year on year
to ¥44,078 million, while operating income decreased 9.0%
to ¥5,640 million.
Sales generated by TBS’s Division of Project
Development and Content Business Division grew 5.5% year
on year to ¥25,833 million, marking the second consecutive
year of record high sales.
In the cultural events business, events such as the
World Heritage Sites and World Museums, Berlin National
Treasures Exposition, and various ballet events, including
Swan Lake and Nutcracker performed by Tetsuya
Kumakawa’s K Ballet Company, made a significant contribu-
tion to profits.
In the software business, DVD sales were favorable for
popular dramas, such as Tiger & Dragon, Dragon Zakura,
and Hana Yori Dango. Moreover, DVD compilations of Hachi
Ji Dayo! Zenin Shugo 2005 sold over 160,000 sets. In our
program rights business, the silver screen movie NANA
pulled in over 3 million customers and recorded over ¥4 bil-
lion in sales, although division sales still fell shy of the previ-
ous fiscal year in which we had two big hit films, Sekai no
Chushin de Ai wo Sakebu and Ima Ai ni Yukimasu.
In the communication satellite (CS) business, TBS-ch, a
pay-TV service, which broadcasts popular dramas from the
past and other programs, increased the number of subscriber
households and recorded profits in just three and a half years
from its start of operations.
In the mobile & net business, there was strong demand
for both our Internet advertising and pay-per-view mobile
content programming. Together with the CS business, these
helped expanding earnings.
Business revenues generated by the Yokohama Bay
Stars professional baseball team fell 1.5% year on year to
¥7,867 million, but operating loss narrowed ¥350 million, to
¥34 million. The Company aims to improve the team’s prof-
itability by reducing costs while at the same time increasing
the number of fans attending Bay Stars’ games by providing
greater interaction between athletes and fans.
COST OF SALES AND OPERATING INCOME
Cost of sales increased 3.7% year on year to ¥218,658 mil-
lion, raising the cost of sales ratio 1.5 percentage points to
71.4%.
Selling, general and administrative (SG&A) expenses
rose 4.0% year on year to ¥70,978 million, causing the
SG&A expense ratio to increase 0.6 percentage points to
23.2%. This increase is attributed to the inclusion of retire-
ment benefit expenses in SG&A expenses, which had been
incurred as an extraordinary loss during the previous fiscal
year, and to commission fees paid to advertising agencies,
up 2.3% year on year, due to increases in advertising
income.
Because of the substantial production costs arising from
our aggressive strategy to win back TV viewer ratings, our
program production costs rose ¥4.0 billion, or 3.3% year on
24 Tokyo Broadcasting System, Inc.
year to ¥124.9 billion. For the fiscal year ending March 31,
2007, the Company plans to revise production processes
and reduce its production costs by ¥1.4 billion year on year
to ¥123.5 billion.
During the year under review, capital expenditures
totaled ¥26,762 million, and depreciation was ¥14,082 mil-
lion. Capital expenditures consisted mainly of ¥3.8 billion for
facilities for digital terrestrial broadcasting and studio renova-
tions HD program investment; ¥4.3 billion for general broad-
casting equipment; and ¥11.8 billion for the Akasaka
Redevelopment Project.
The peak of our depreciation arising from investments in
broadcasting-related facilities occurred during the year under
review and will gradually decline from now on. However,
capital expenditures for the Akasaka Redevelopment Project
will peak over the next two years, with the project scheduled
for completion in January 2008. Consequently, the Company
expects capital expenditures to reach ¥26.5 billion and
depreciation to total ¥12.2 billion in the current fiscal year.
As a result of all of these factors, operating income
declined 27.1% year on year to ¥16,405 million and the ratio
of operating income to net sales decreased 2.1 percentage
points to 5.4%. Net income rose 36.6% to ¥13,514 million
and the ratio of net income to sales increased 1.1 percent-
age points to 4.4%, due in large part to ¥16,946 million in
extraordinary income from the sale of investment securities
and disappearance of extraordinary loss of ¥8.5 billion on the
conclusion of the retirement benefit plan that was recorded
in the previous fiscal year . Moreover, the implementation of
impairment accounting for the shares of our baseball sub-
sidiary, the Yokohama Bay Stars, contributed to losses of
about ¥3.9 billion at net income level.
FINANCIAL POSITION
Consolidated total assets increase ¥49,145 million, or 9.7%
year on year to ¥555,272 million at the end of the fiscal year.
Of total assets, current assets declined ¥40,824 million, or
23.5% to ¥133,165 million, because cash on hand and in
banks decreased ¥13,866 million; marketable securities
declined approximately ¥20 billion; and prepaid expenses
and other current assets decreased ¥12,044 million because
the restoration of retirement trust assets depressed
accounts receivable.
At the same time, total fixed assets rose ¥89,970 mil-
lion, or 27.1%, to ¥422,106 million. Due to progress in the
Akasaka Redevelopment Project, construction in progress
rose ¥12,613 million, and property, plant and equipment, net
increased ¥8,765 million, or 4.9%, to ¥189,213 million.
Investments and other assets increased ¥81,205 million, or
53.5% year on year to ¥232,894 million, as investments in
securities rose ¥81,979 million on the back of acquisitions of
securities and increases in the latent gains of our existing
shareholdings.
Total liabilities amounted to ¥175,586 million, down
2.3%, or ¥4,175 million from the previous fiscal year-end.
The decline is attributed to several factors. Although notes
and accounts payable—trade increased ¥5,875 million and
deferred tax liabilities increased ¥12,300 million due to the
increase in the value of investment securities, the Company
recorded a ¥10,000 million decrease due to the redemption
of bonds; ¥2,221 million in reductions in payments due for
investment securities purchased during the previous term
and for capital investments; a ¥2,675 million decrease in
income taxes payable; and a ¥5,367 million drop in other
long-term liabilities, due to such factors as the transfer to
defined contribution pension plans. Interest-bearing liabilities
at the year-end amounted to ¥43,402 million, a decrease of
¥12,541 million.
Shareholders’ equity increased ¥53,302 million, or
16.4% year on year to ¥378,027 million. The increase is
attributable to a third-party allotment of new shares in
September 2005 and the liquidation of treasury stock, which
increased common stock ¥10,522 million and additional
paid-in capital ¥17,391 million; a ¥9,372 million increase in
retained earnings; and a ¥15,587 million increase in unreal-
ized gain on available-for-sale securities. Consequently, the
shareholders’ equity ratio rose 3.9 percentage points to
68.1%.

Annual Report 2006 25
CASH FLOWS
Cash and cash equivalents declined ¥13,846 million from the
end of the previous fiscal year to ¥38,767 million. This can
be attributed primarily to net cash outflow from investing
activities of ¥49,818 million, which arose from purchases of
investment securities and payments relating to the Akasaka
Redevelopment Project. This outflow largely offset a ¥27,615
million, or 60.5%, year on year increase in income before
income taxes and minority interests and cash inflow of
¥28,221 million from our third-party allotment of newly
issued stocks and liquidation of treasury stock.
Cash Flows from Operating Activities
Net cash provided by operating activities totaled ¥23,261
million, which represents a decline of ¥2,917 million from the
previous fiscal year. While income before income taxes and
minority interests recorded a sharp increase, net extraordi-
nary income offset net operating cash inflow, mainly due to
¥16,946 million in gain on sale of investment securities. In
addition, ¥5,367 million decrease in other fixed liabilities
accompanying the transfer to defined contribution pension
plans is another reason. Also, income taxes paid increased
¥6,302 million to ¥15,019 million.
Based on the V!-up 2010, the Company’s new medium-
term management objectives, the Company set a target of
¥50 billion for cash flows from operating activities for the fis-
cal year ending March 2011, and it will continue working to
expand cash flows.
Cash Flows from Investing Activities
Net cash used in investing activities amounted to ¥49,818
million, a ¥9,351 million rise from the previous fiscal year.
The increase was attributable to net proceeds from sales of
marketable securities of ¥19,999 million and to proceeds
from sale of investments in securities of ¥17,019 million.
However, cash outflows were ¥60,113 million for payment
for purchase of investments in securities and ¥23,491 million
for payment for purchase of property and equipment.
Cash Flows from Financing Activities
Net cash provided by financing activities totaled ¥12,620 mil-
lion, which represents a ¥3,272 million increase from the
previous fiscal year. Although the redemption of bonds of
¥10 billion and other factors resulted in cash outflows, these
were more than offset by the third-party allotment of new
shares and the liquidation of treasury stock, which con-
tributed to inflows of ¥22,589 million and ¥5,633 million,
respectively.
OUTLOOK
There are several uncertainties, including the surge in crude
oil prices, the potential for interest-rate hikes in Japan, and
other concerns. Nonetheless, TBS expects the parent com-
pany’s core television broadcasting sales to increase in both
the time and spot categories, supported by the underlying
strength of the advertising market and the Company’s high
viewer rating. As evidence, the Company stood alone in sec-
ond place in average golden time viewer ratings for the first
time in 16 years. In non-broadcasting businesses as well, the
Company expects revenues to remain strong, underpinned
by brisk DVD sales and returns on its investments in movies
from theatrical productions.
The Company expects substantial increases in operat-
ing income, as it reviews and slims down its production cost
structure while continuing to make the necessary invest-
ments for strengthening its programming.
However, the Company forecasts that net income will
stay at about the same level as in the fiscal year under
review, due to the absence of extraordinary income of ¥17
billion from profits on the sale of shares in Tokyo Electron
Limited, which was recorded during the fiscal year under
review.
Given these factors, for the fiscal year ending March
2007, the Company forecasts consolidated net sales of
¥319.7 billion, up 4.5% year on year, operating income of
¥23.8 billion, up 45.1%, and net income of ¥13.2 billion,
down 2.3%.
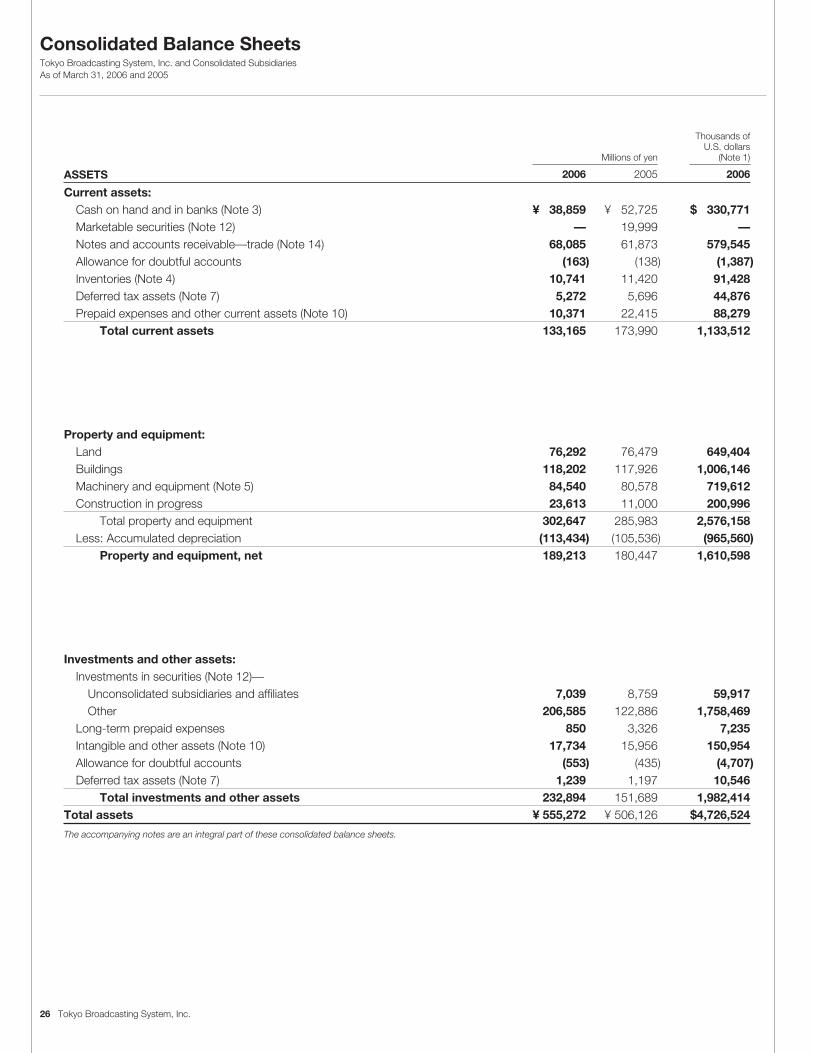
Consolidated Balance SheetsTokyo Broadcasting System, Inc. and Consolidated SubsidiariesAs of March 31, 2006 and 2005
26 Tokyo Broadcasting System, Inc.
Thousands ofU.S. dollars
Millions of yen (Note 1)
ASSETS 2006 2005 2006
Current assets:Cash on hand and in banks (Note 3) ¥ 38,859 ¥ 52,725 $ 330,771Marketable securities (Note 12) — 19,999 —Notes and accounts receivable—trade (Note 14) 68,085 61,873 579,545Allowance for doubtful accounts (163) (138) (1,387)Inventories (Note 4) 10,741 11,420 91,428Deferred tax assets (Note 7) 5,272 5,696 44,876Prepaid expenses and other current assets (Note 10) 10,371 22,415 88,279
Total current assets 133,165 173,990 1,133,512
Property and equipment:Land 76,292 76,479 649,404Buildings 118,202 117,926 1,006,146Machinery and equipment (Note 5) 84,540 80,578 719,612Construction in progress 23,613 11,000 200,996
Total property and equipment 302,647 285,983 2,576,158Less: Accumulated depreciation (113,434) (105,536) (965,560)
Property and equipment, net 189,213 180,447 1,610,598
Investments and other assets:Investments in securities (Note 12)—
Unconsolidated subsidiaries and affiliates 7,039 8,759 59,917Other 206,585 122,886 1,758,469
Long-term prepaid expenses 850 3,326 7,235Intangible and other assets (Note 10) 17,734 15,956 150,954Allowance for doubtful accounts (553) (435) (4,707)Deferred tax assets (Note 7) 1,239 1,197 10,546
Total investments and other assets 232,894 151,689 1,982,414Total assets ¥ 555,272 ¥ 506,126 $4,726,524
The accompanying notes are an integral part of these consolidated balance sheets.

Annual Report 2006 27
Thousands ofU.S. dollars
Millions of yen (Note 1)
LIABILITIES, MINORITY INTERESTS AND SHAREHOLDERS’ EQUITY 2006 2005 2006
Current liabilities:Short-term borrowings (Notes 6 and 14) ¥ 3,290 ¥ 5,759 $ 28,005Current portion of long-term debt (Notes 5 and 6) 10,072 10,072 85,734Notes and accounts payable—trade 32,165 26,290 273,791Accounts payable—other 21,391 23,250 182,082Income taxes payable (Note 7) 6,059 8,735 51,575Accrued expenses 4,465 5,848 38,006Other current liabilities 4,840 4,479 41,198
Total current liabilities 82,282 84,433 700,391
Long-term liabilities:Long-term debt (Notes 5 and 6) 30,040 40,113 255,703Allowance for retirement and severance benefits (Note 9) 9,197 8,802 78,286Deferred tax liabilities (Note 7) 41,245 28,944 351,081Negative goodwill 720 — 6,129Other long-term liabilities 12,102 17,470 103,013
Total long-term liabilities 93,304 95,329 794,212Total liabilities 175,586 179,762 1,494,603
Minority interests 1,659 1,640 14,122
Contingent liabilities (Note 16)
Shareholders’ equity (Note 8):Common stock 54,685 44,163 465,483
Authorized: 400,000,000 sharesIssued and outstanding:
190,138,968 shares at March 31, 2006 and179,996,968 shares at March 31, 2005
Additional paid-in capital (Note 8) 59,954 42,562 510,334Retained earnings (Note 8) 192,297 182,924 1,636,849Accumulated other comprehensive income—
Unrealized gain on available-for-sale securities (Note 12) 71,117 55,530 605,354Foreign currency translation adjustment 14 (33) 119
Treasury stock at cost (40) (422) (340)Total shareholders’ equity 378,027 324,724 3,217,799
Total liabilities, minority interests and shareholders’ equity ¥555,272 ¥506,126 $4,726,524
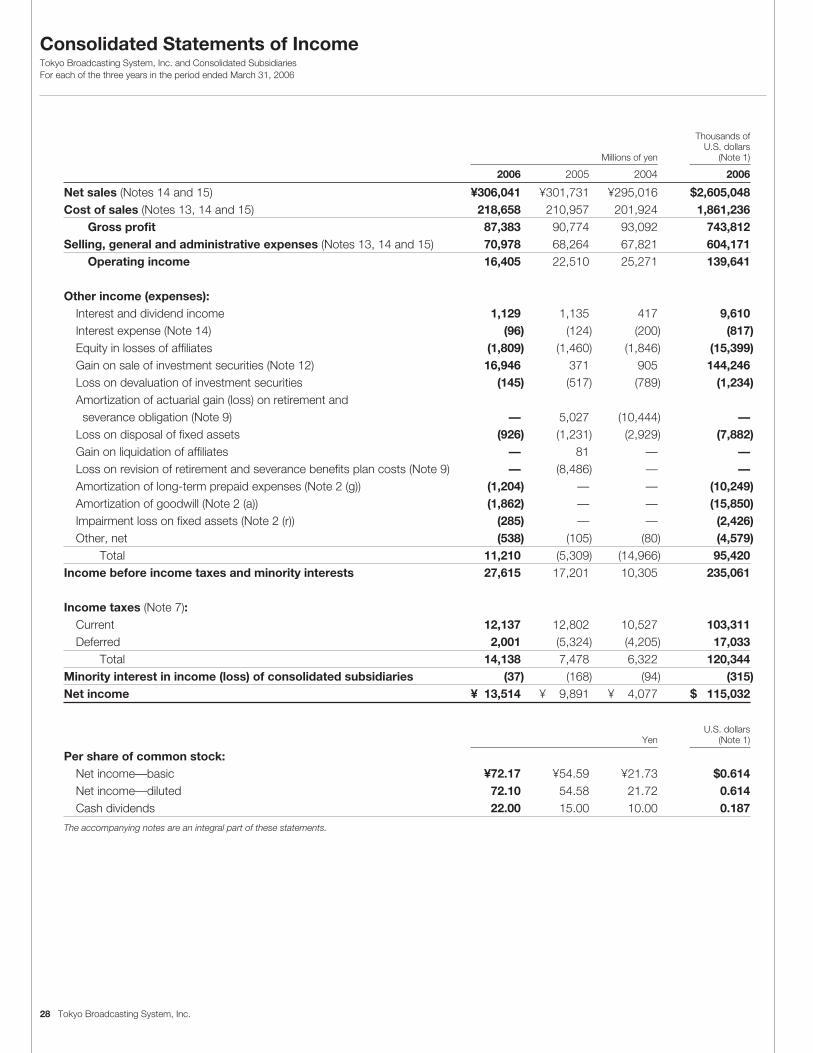
Consolidated Statements of Income Tokyo Broadcasting System, Inc. and Consolidated SubsidiariesFor each of the three years in the period ended March 31, 2006
28 Tokyo Broadcasting System, Inc.
Thousands ofU.S. dollars
Millions of yen (Note 1)
2006 2005 2004 2006
Net sales (Notes 14 and 15) ¥306,041 ¥301,731 ¥295,016 $2,605,048Cost of sales (Notes 13, 14 and 15) 218,658 210,957 201,924 1,861,236
Gross profit 87,383 90,774 93,092 743,812Selling, general and administrative expenses (Notes 13, 14 and 15) 70,978 68,264 67,821 604,171
Operating income 16,405 22,510 25,271 139,641
Other income (expenses):Interest and dividend income 1,129 1,135 417 9,610Interest expense (Note 14) (96) (124) (200) (817)Equity in losses of affiliates (1,809) (1,460) (1,846) (15,399)Gain on sale of investment securities (Note 12) 16,946 371 905 144,246Loss on devaluation of investment securities (145) (517) (789) (1,234)Amortization of actuarial gain (loss) on retirement and severance obligation (Note 9) — 5,027 (10,444) —
Loss on disposal of fixed assets (926) (1,231) (2,929) (7,882)Gain on liquidation of affiliates — 81 — —Loss on revision of retirement and severance benefits plan costs (Note 9) — (8,486) — —Amortization of long-term prepaid expenses (Note 2 (g)) (1,204) — — (10,249)Amortization of goodwill (Note 2 (a)) (1,862) — — (15,850)Impairment loss on fixed assets (Note 2 (r)) (285) — — (2,426)Other, net (538) (105) (80) (4,579)
Total 11,210 (5,309) (14,966) 95,420Income before income taxes and minority interests 27,615 17,201 10,305 235,061
Income taxes (Note 7):Current 12,137 12,802 10,527 103,311Deferred 2,001 (5,324) (4,205) 17,033
Total 14,138 7,478 6,322 120,344Minority interest in income (loss) of consolidated subsidiaries (37) (168) (94) (315)Net income ¥ 13,514 ¥ 9,891 ¥ 4,077 $ 115,032
U.S. dollarsYen (Note 1)
Per share of common stock:Net income—basic ¥72.17 ¥54.59 ¥21.73 $0.614Net income—diluted 72.10 54.58 21.72 0.614Cash dividends 22.00 15.00 10.00 0.187
The accompanying notes are an integral part of these statements.
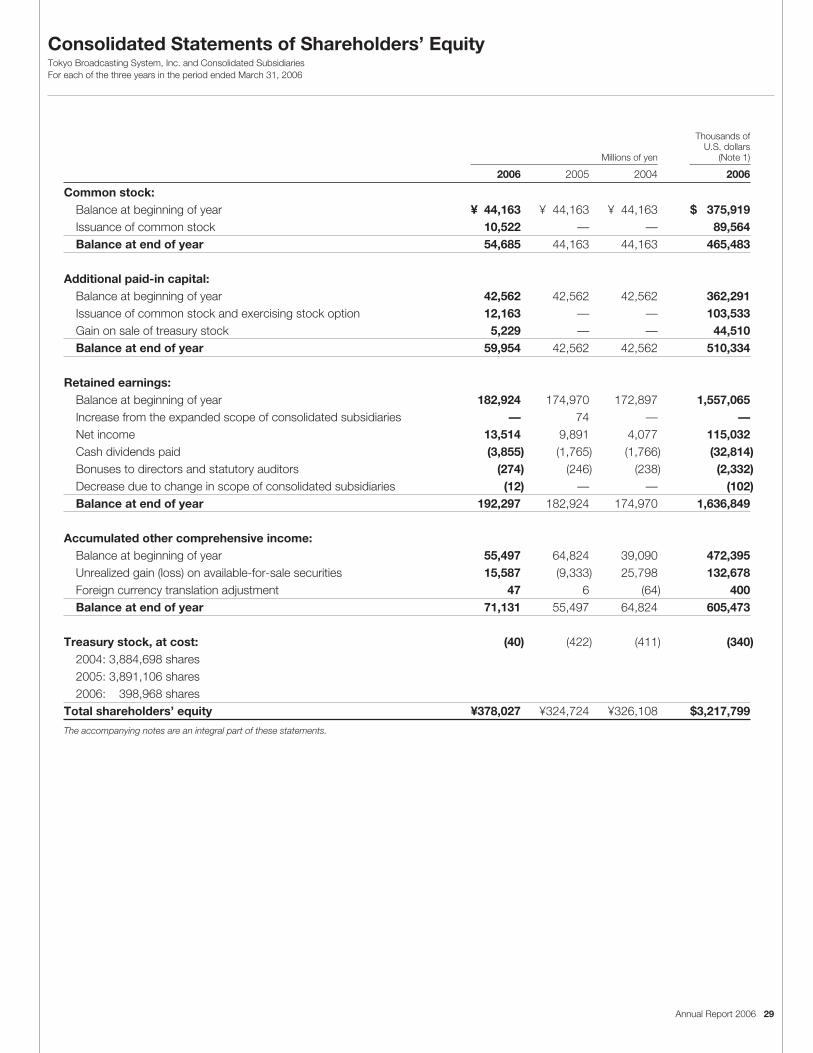
Annual Report 2006 29
Thousands ofU.S. dollars
Millions of yen (Note 1)
2006 2005 2004 2006
Common stock:Balance at beginning of year ¥ 44,163 ¥ 44,163 ¥ 44,163 $ 375,919Issuance of common stock 10,522 — — 89,564Balance at end of year 54,685 44,163 44,163 465,483
Additional paid-in capital:Balance at beginning of year 42,562 42,562 42,562 362,291Issuance of common stock and exercising stock option 12,163 — — 103,533Gain on sale of treasury stock 5,229 — — 44,510Balance at end of year 59,954 42,562 42,562 510,334
Retained earnings:Balance at beginning of year 182,924 174,970 172,897 1,557,065Increase from the expanded scope of consolidated subsidiaries — 74 — —Net income 13,514 9,891 4,077 115,032Cash dividends paid (3,855) (1,765) (1,766) (32,814)Bonuses to directors and statutory auditors (274) (246) (238) (2,332)Decrease due to change in scope of consolidated subsidiaries (12) — — (102)Balance at end of year 192,297 182,924 174,970 1,636,849
Accumulated other comprehensive income:Balance at beginning of year 55,497 64,824 39,090 472,395Unrealized gain (loss) on available-for-sale securities 15,587 (9,333) 25,798 132,678Foreign currency translation adjustment 47 6 (64) 400Balance at end of year 71,131 55,497 64,824 605,473
Treasury stock, at cost: (40) (422) (411) (340)2004: 3,884,698 shares2005: 3,891,106 shares2006: 398,968 shares
Total shareholders’ equity ¥378,027 ¥324,724 ¥326,108 $3,217,799
The accompanying notes are an integral part of these statements.
Consolidated Statements of Shareholders’ Equity Tokyo Broadcasting System, Inc. and Consolidated SubsidiariesFor each of the three years in the period ended March 31, 2006

Consolidated Statements of Cash Flows Tokyo Broadcasting System, Inc. and Consolidated SubsidiariesFor each of the three years in the period ended March 31, 2006
30 Tokyo Broadcasting System, Inc.
Thousands ofU.S. dollars
Millions of yen (Note 1)
2006 2005 2004 2006
Cash flows from operating activities:Income before income taxes and minority interests ¥ 27,615 ¥ 17,201 ¥ 10,305 $ 235,061Adjustments to reconcile income before income taxes and minority interests to net cash provided by operating activities:Depreciation 14,082 13,079 10,811 119,867Amortization of long-term prepaid expenses 3,108 1,944 2,064 26,456Impairment loss on fixed assets 285 — — 2,426Loss on devaluation of investment securities 145 517 789 1,234Retirement and severance benefit expenses 1,037 (5,099) 8,066 8,827Increase (Decrease) in allowance for doubtful accounts 143 (222) 149 1,217Interest and dividend income (1,129) (1,135) (417) (9,610)Interest expense 96 124 200 817Equity in earnings of affiliates 1,809 1,460 1,846 15,399Gain on sale of investment securities (16,946) (371) (905) (144,246)Loss on disposal of fixed assets 926 1,231 2,929 7,882Decrease (Increase) in notes and accounts receivable—trade (6,212) 1,293 (1,860) (52,877)(Increase) Decrease in inventories 697 519 (2,749) 5,933(Increase) Decrease in notes and accounts payable—trade 5,866 (484) (1,686) 49,932Others, net 5,714 3,835 2,502 48,638
Subtotal 37,236 33,892 32,044 316,956Interest and dividends received 1,139 1,149 416 9,695Interest paid (95) (146) (230) (809)Income taxes paid (15,019) (8,716) (13,155) (127,842)
Net cash provided by operating activities 23,261 26,179 19,075 198,000
Cash flows from investing activities:Proceeds from sales (Payment for purchase) of marketable securities, net 19,999 (18,999) 2,382 170,233Payment for purchase of property and equipment (23,491) (14,787) (15,196) (199,957)Proceeds from sales of property and equipment 10 15 30 85Payment for purchase of intangible assets (3,271) (3,203) (2,058) (27,843)Payment for purchase of investments in securities (60,113) (4,815) (6,036) (511,687)Proceeds from sale of investments in securities 17,019 704 1,031 144,867Others, net 29 618 (565) 247
Net cash used in investing activities (49,818) (40,467) (20,412) (424,055)
Cash flows from financing activities:Proceeds from short-term borrowings 542 1,231 472 4,613Repayment of short-term borrowings (2,838) (4,563) (5,149) (24,157)Proceeds from long-term borrowings — 20,000 — —Repayment of long-term borrowings (72) (5,472) (72) (613)Redemption of bonds (10,000) — — (85,121)Payment for purchase of treasury stock (22) (11) (5) (187)Proceeds from sale of treasury stock 5,633 — — 47,949Proceeds from issuance of common stock 22,589 138 60 192,280Dividends paid (3,855) (1,765) (1,766) (32,814)Dividends paid to minority shareholders (17) (17) (4) (145)Others, net 660 (194) (100) 5,618
Net cash provided by (used in) financing activities 12,620 9,347 (6,564) 107,423
Effect of exchange rate change on cash and cash equivalents 91 24 (65) 774Net increase (decrease) in cash and cash equivalents (13,846) (4,917) (7,966) (117,858)Cash and cash equivalents at beginning of year 52,613 57,530 65,496 447,846Cash and cash equivalents at end of year (Note 3) ¥ 38,767 ¥ 52,613 ¥ 57,530 $ 329,988
The accompanying notes are an integral part of these statements.

Annual Report 2006 31
Notes to Consolidated Financial Statements Tokyo Broadcasting System, Inc. and Consolidated Subsidiaries
1. BASIS OF PRESENTATION OF CONSOLIDATED FINANCIAL STATEMENTS
The accompanying consolidated financial statements have been prepared in accordance with the provisions set forth in the JapaneseSecurities and Exchange Law and its related accounting regulations, and in conformity with accounting principles generally accepted inJapan, which are different in certain respects as to application and disclosure requirements of International Financial Reporting Standards.
The accounts of overseas subsidiaries are based on their accounting records maintained in conformity with generally acceptedaccounting principles prevailing in the respective countries of domicile. The accompanying consolidated financial statements have beenrestructured and translated into English (with some expanded descriptions and the inclusion of consolidated statements of shareholders’equity) from the consolidated financial statements of the Company prepared in accordance with Japanese GAAP and filed with theappropriate Local Finance Bureau of the Ministry of Finance as required by the Securities and Exchange Law. Some supplementaryinformation included in the statutory Japanese language consolidated financial statements, but not considered necessary for fairpresentation, is not presented in the accompanying consolidated financial statements.
The translation of the Japanese yen amounts into U.S. dollars are included solely for the convenience of readers outside Japan, usingthe prevailing exchange rate at March 31, 2006, which was ¥117.48 to U.S. $1. The convenience translations should not be construed asrepresentations that the Japanese yen amounts have been, could have been, or could in the future be, converted into U.S. dollars at thisor any other rate of exchange.
2. SUMMARY OF SIGNIFICANT ACCOUNTING POLICIES
(a) Principles of consolidationConsolidationThe consolidated financial statements include the accounts of the Company and its significant subsidiaries which are controlled by theCompany through substantial ownership of more than 50% of the voting rights or through ownership of 40–50% of the voting rights and theexistence of certain conditions evidencing control by the Company of the decision-making body of such companies. Material inter-companybalances, transactions and profits have been eliminated in consolidation.
The number of the consolidated subsidiaries for the year ended March 31, 2006, 2005 and 2004 was 29, 28 and 28, respectively. Thenumber of the unconsolidated subsidiaries for the year ended March 31, 2006, 2005 and 2004 was 19, 16 and 17, respectively. The totalassets, net sales, net income and retained earnings of the unconsolidated subsidiaries were not material to the consolidated financialstatements.
In the elimination of investments in subsidiaries, the assets and liabilities of the subsidiaries, including the portion attributable to minorityshareholders, are recorded at the fair value at the time the Company acquired control of the respective subsidiaries. The amount of thedifference between the cost of investment in consolidated subsidiaries and the underlying net equity at the acquisition dates based on thefair value (hereafter, “goodwill”) is generally amortized over a period of five years on a straight-line basis, except that the goodwill related toYokohama Baystars Baseball Club, inc. (hereafter, “Yokohama BayStars”) is amortized over twenty years on a straight-line basis and animmaterial difference is expensed in the year of acquisition.
The consolidation goodwill related to “Yokohama BayStars” was supposed to be amortized over twenty years on a straight-line basis.However, as the Company recognized loss on devaluation of equity securities issued by its subsidiary “Yokohama BayStars” in non-consolidated statement of income, the unamortized balance of the consolidation goodwill amounting to ¥1,862 million ($15,850 thousand)was amortized in a lump sum and recorded as other expenses in consolidated statement of income for the year ended March 31, 2006.
TBS Sports, Inc. and TBS Live, Inc. were merged into TBS Entertainment, Inc., and TBS Entertainment, Inc. changed its corporate nameto TBS TV, Inc. on October 1, 2004. The Company added Japan Artvideo Service Collaborative, Inc. and Vucast Co., Ltd. to itsconsolidated subsidiaries based on materiality, on April 1, 2004. Pec Co., Ltd. changed its corporate name to TBS Trimedia, Inc. on April 1,2005. The Company added OXYBOT, Inc. to its consolidated subsidiaries based on materiality, on April 1, 2005.
The accounts of the consolidated subsidiaries are included on the basis of their respective fiscal years, which ended mainly on March 31.Significant transactions made after the respective fiscal year-end other than March 31 are adjusted for consolidation as necessary. Equity methodInvestments in unconsolidated subsidiaries and certain companies where the Company has 20% or more of the voting rights, or has morethan 15% of the voting rights and has the ability to significantly influence their financial, operational or business policies are accounted forusing the equity method. The number of companies accounted for under the equity method was 4 for 2006, 2005 and 2004.
(b) Foreign currency translationAll monetary assets and liabilities denominated in foreign currencies are translated at the current exchange rates at the balance sheet date,and the translation gains and losses are charged to income.
Balance sheets and statements of income of the consolidated overseas subsidiary are translated into Japanese yen at the year-end rateexcept for shareholders’ equity accounts, which are translated at the historical rates.
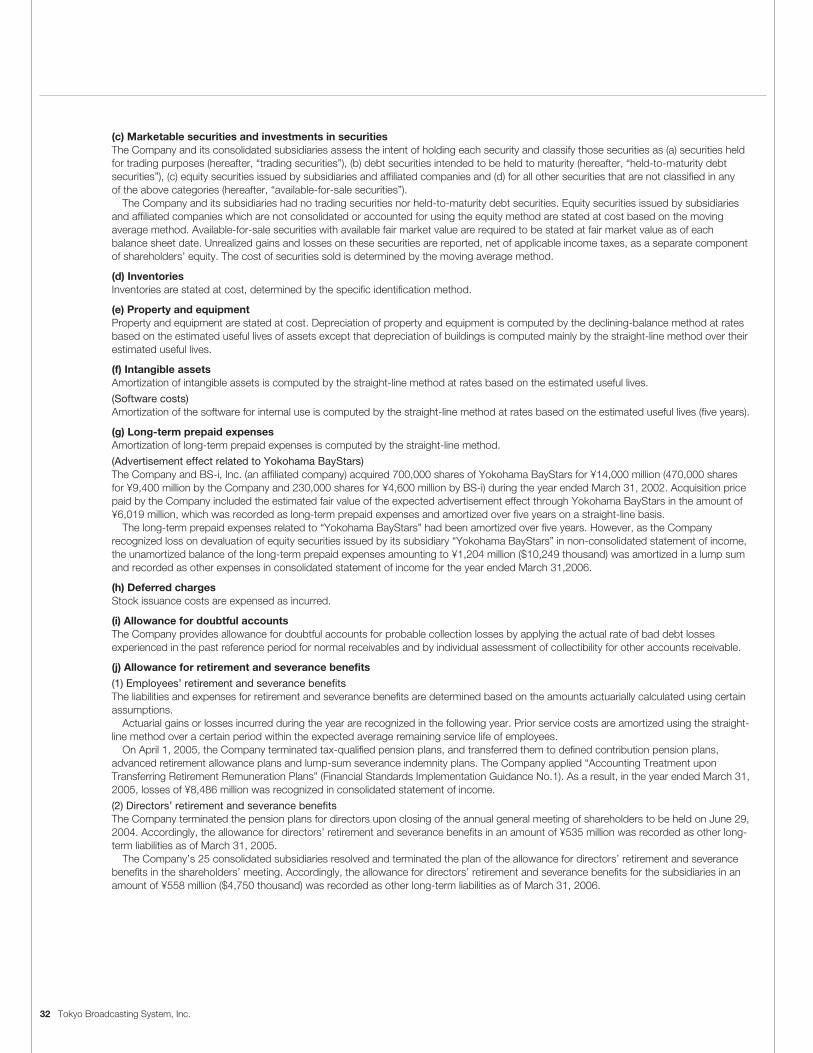
32 Tokyo Broadcasting System, Inc.
(c) Marketable securities and investments in securitiesThe Company and its consolidated subsidiaries assess the intent of holding each security and classify those securities as (a) securities heldfor trading purposes (hereafter, “trading securities”), (b) debt securities intended to be held to maturity (hereafter, “held-to-maturity debtsecurities”), (c) equity securities issued by subsidiaries and affiliated companies and (d) for all other securities that are not classified in anyof the above categories (hereafter, “available-for-sale securities”).
The Company and its subsidiaries had no trading securities nor held-to-maturity debt securities. Equity securities issued by subsidiariesand affiliated companies which are not consolidated or accounted for using the equity method are stated at cost based on the movingaverage method. Available-for-sale securities with available fair market value are required to be stated at fair market value as of eachbalance sheet date. Unrealized gains and losses on these securities are reported, net of applicable income taxes, as a separate componentof shareholders’ equity. The cost of securities sold is determined by the moving average method.
(d) InventoriesInventories are stated at cost, determined by the specific identification method.
(e) Property and equipmentProperty and equipment are stated at cost. Depreciation of property and equipment is computed by the declining-balance method at ratesbased on the estimated useful lives of assets except that depreciation of buildings is computed mainly by the straight-line method over theirestimated useful lives.
(f) Intangible assetsAmortization of intangible assets is computed by the straight-line method at rates based on the estimated useful lives.
(Software costs)Amortization of the software for internal use is computed by the straight-line method at rates based on the estimated useful lives (five years).
(g) Long-term prepaid expensesAmortization of long-term prepaid expenses is computed by the straight-line method.
(Advertisement effect related to Yokohama BayStars)The Company and BS-i, Inc. (an affiliated company) acquired 700,000 shares of Yokohama BayStars for ¥14,000 million (470,000 sharesfor ¥9,400 million by the Company and 230,000 shares for ¥4,600 million by BS-i) during the year ended March 31, 2002. Acquisition pricepaid by the Company included the estimated fair value of the expected advertisement effect through Yokohama BayStars in the amount of¥6,019 million, which was recorded as long-term prepaid expenses and amortized over five years on a straight-line basis.
The long-term prepaid expenses related to “Yokohama BayStars” had been amortized over five years. However, as the Companyrecognized loss on devaluation of equity securities issued by its subsidiary “Yokohama BayStars” in non-consolidated statement of income,the unamortized balance of the long-term prepaid expenses amounting to ¥1,204 million ($10,249 thousand) was amortized in a lump sumand recorded as other expenses in consolidated statement of income for the year ended March 31,2006.
(h) Deferred chargesStock issuance costs are expensed as incurred.
(i) Allowance for doubtful accountsThe Company provides allowance for doubtful accounts for probable collection losses by applying the actual rate of bad debt lossesexperienced in the past reference period for normal receivables and by individual assessment of collectibility for other accounts receivable.
(j) Allowance for retirement and severance benefits
(1) Employees’ retirement and severance benefitsThe liabilities and expenses for retirement and severance benefits are determined based on the amounts actuarially calculated using certainassumptions.
Actuarial gains or losses incurred during the year are recognized in the following year. Prior service costs are amortized using the straight-line method over a certain period within the expected average remaining service life of employees.
On April 1, 2005, the Company terminated tax-qualified pension plans, and transferred them to defined contribution pension plans,advanced retirement allowance plans and lump-sum severance indemnity plans. The Company applied “Accounting Treatment uponTransferring Retirement Remuneration Plans” (Financial Standards Implementation Guidance No.1). As a result, in the year ended March 31,2005, losses of ¥8,486 million was recognized in consolidated statement of income.
(2) Directors’ retirement and severance benefitsThe Company terminated the pension plans for directors upon closing of the annual general meeting of shareholders to be held on June 29,2004. Accordingly, the allowance for directors’ retirement and severance benefits in an amount of ¥535 million was recorded as other long-term liabilities as of March 31, 2005.
The Company’s 25 consolidated subsidiaries resolved and terminated the plan of the allowance for directors’ retirement and severancebenefits in the shareholders’ meeting. Accordingly, the allowance for directors’ retirement and severance benefits for the subsidiaries in anamount of ¥558 million ($4,750 thousand) was recorded as other long-term liabilities as of March 31, 2006.

Annual Report 2006 33
(k) LeasesFinance leases, except those leases for which the ownership of the leased assets is considered to be transferred to the lessee, areaccounted for in the same manner as operating leases.
(l) Income taxesThe provision for income taxes is computed based on the pretax income included in the consolidated statements of income. The asset andliability approach is used to recognize deferred income taxes for the expected future tax consequences of temporary differences betweenthe carrying amounts of assets and liabilities for financial reporting purposes and the amounts used for income tax purposes.
(m) Derivative transaction and hedge accountingFor the year ended March 31, 2001, the Company entered into forward foreign exchange contracts to hedge foreign currency payables.The Company defers recognition of gains or losses resulting from changes in fair value of forward exchange contract used for hedgingpurposes until the related losses or gains on the hedged items are recognized.
For the year ended March 31, 2002, the Company also entered into interest rate swap contracts to manage its interest rate riskexposures on certain liabilities. If interest rate swap contracts are used as hedges and meet certain hedging criteria, the net amount to bepaid or received under the contract is added to or deducted from the interest on the assets or liabilities for which they are used.
For the year ended March 31, 2005, the Company also entered into forward securities price exchange contracts to hedge securitiesprice. The Company defers recognition of gains or losses resulting from changes in fair value of forward securities price exchange contractsused for hedging purposes until the related losses or gains on the hedged items are recognized.
(n) Per share informationNet income per share is computed based on the weighted-average number of shares of common stock outstanding during each year.Dividends per share have been presented on an accrual basis and include dividends approved or to be approved after March 31 butapplicable to the year then ended.
(o) Statement of cash flowsIn preparing the consolidated statement of cash flows, cash on hand, readily-available deposits and short-term highly liquid investmentswith maturities of not exceeding three months at the time of purchase are considered to be cash and cash equivalents.
(p) ReclassificationCertain prior period amounts in the consolidated financial statements have been reclassified to conform to the March 31, 2006presentation. These reclassifications had no effect on the Company’s consolidated net income or shareholders’ equity.
(q) Use of estimatesThe preparation of financial statements in conformity with generally accepted accounting principles requires management to makeestimates and assumptions that affect the reported amounts of assets and liabilities and disclosures of contingent assets and liabilities atthe date of the financial statements and the reported amounts of revenues and expenses during the reporting period. Actual results coulddiffer from those estimates.
(r) New accounting standardEffective from the year ended March 31, 2006, the Company and its subsidiaries adopted the new accounting standard for impairmentof fixed Assets (“Opinion Concerning Establishment of Accounting Standard for Impairment of Fixed Assets” issued by the BusinessAccounting Deliberation Council on August 9, 2002) and the implementation guidance for the accounting standard for impairment of fixedassets (the Financial Accounting Standard Implementation Guidance No. 6 issued by the Accounting Standards Board of Japan on October31, 2003).
As a result of this change, income before income taxes and minority interests decreased by ¥285 million ($2,426 thousand) comparedwith what would have been recorded under the previous accounting standard.
3. CASH AND CASH EQUIVALENTS
Cash and cash equivalents at March 31, 2006, 2005 and 2004 were as follows: Thousands of
Millions of yen U.S. dollars
2006 2005 2004 2006
Cash on hand and in banks ¥38,859 ¥52,725 ¥57,661 $330,771Time deposits with the original maturity over three months (92) (112) (131) (783)Cash and cash equivalents ¥38,767 ¥52,613 ¥57,530 $329,988
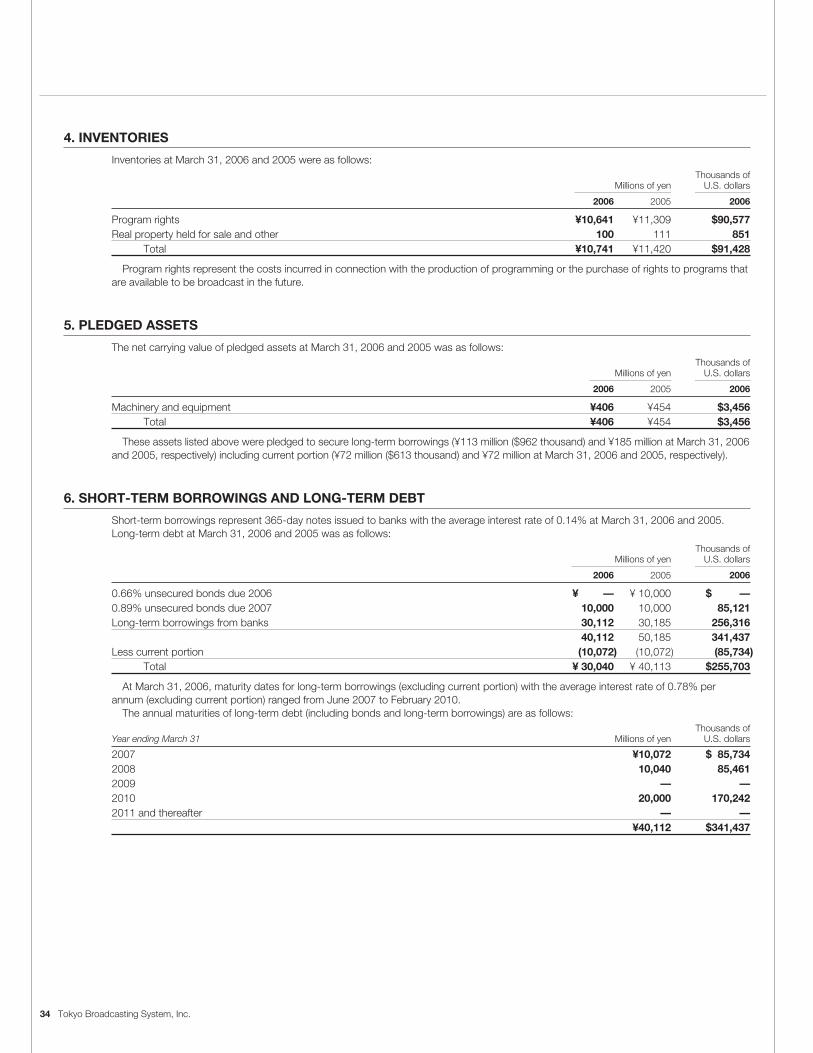
34 Tokyo Broadcasting System, Inc.
4. INVENTORIES
Inventories at March 31, 2006 and 2005 were as follows:Thousands of
Millions of yen U.S. dollars
2006 2005 2006
Program rights ¥10,641 ¥11,309 $90,577Real property held for sale and other 100 111 851
Total ¥10,741 ¥11,420 $91,428
Program rights represent the costs incurred in connection with the production of programming or the purchase of rights to programs thatare available to be broadcast in the future.
5. PLEDGED ASSETS
The net carrying value of pledged assets at March 31, 2006 and 2005 was as follows:Thousands of
Millions of yen U.S. dollars
2006 2005 2006
Machinery and equipment ¥406 ¥454 $3,456Total ¥406 ¥454 $3,456
These assets listed above were pledged to secure long-term borrowings (¥113 million ($962 thousand) and ¥185 million at March 31, 2006and 2005, respectively) including current portion (¥72 million ($613 thousand) and ¥72 million at March 31, 2006 and 2005, respectively).
6. SHORT-TERM BORROWINGS AND LONG-TERM DEBT
Short-term borrowings represent 365-day notes issued to banks with the average interest rate of 0.14% at March 31, 2006 and 2005.Long-term debt at March 31, 2006 and 2005 was as follows:
Thousands of Millions of yen U.S. dollars
2006 2005 2006
0.66% unsecured bonds due 2006 ¥ — ¥ 10,000 $ —0.89% unsecured bonds due 2007 10,000 10,000 85,121Long-term borrowings from banks 30,112 30,185 256,316
40,112 50,185 341,437Less current portion (10,072) (10,072) (85,734)
Total ¥ 30,040 ¥ 40,113 $255,703
At March 31, 2006, maturity dates for long-term borrowings (excluding current portion) with the average interest rate of 0.78% perannum (excluding current portion) ranged from June 2007 to February 2010.
The annual maturities of long-term debt (including bonds and long-term borrowings) are as follows:Thousands of
Year ending March 31 Millions of yen U.S. dollars
2007 ¥10,072 $ 85,7342008 10,040 85,4612009 — —2010 20,000 170,2422011 and thereafter — —
¥40,112 $341,437

Annual Report 2006 35
7. INCOME TAXES
Significant components of the deferred income taxes of the Company at March 31, 2006 and 2005 were as follows:Thousands of
Millions of yen U.S. dollars
2006 2005 2006
Excess allowance for retirement and severance benefits for employees ¥ 3,642 ¥ 2,984 $ 31,001Accrued expense due to change in retirement benefit plan 5,098 7,410 43,395Excess accrued bonuses 1,629 1,645 13,866Enterprise taxes 471 740 4,009Allowance for retirement and severance benefits for directors — 261 —Long-term account payable 214 — 1,822Devaluation of investments in securities 2,033 1,092 17,305Loss on program rights 587 768 4,997Unrealized gain on available-for-sale securities (49,186) (38,496) (418,676)Amortization of long-term prepaid expenses 2,500 1,470 21,280Other 778 1,545 6,622Less valuation allowance (2,500) (1,470) (21,280)
Deferred tax liabilities, net ¥(34,734) ¥(22,051) $(295,659)
Reconciliation of the differences between the statutory tax rate and the effective tax rate for the years ended March 31, 2006 and 2005were as follows:
2006 2005
Statutory tax rate 40.69% 40.69%Increase (reduction) in taxes resulting from:
Non-deductible expenses and non-taxable income 2.56 5.78Equity in (earnings) losses of affiliates 2.66 3.45Effect of tax credit .— (6.88)Amortization of goodwill 2.40 .—Amortization of long-term prepaid expenses 3.55 .—Other (0.66) 0.43
Effective tax rate 51.20% 43.47%
8. SHAREHOLDERS’ EQUITY
Under Japanese laws and regulations, the entire amount of payment for new shares is required to be designated as common stock,although, generally, a company may, by a resolution of the Board of Directors, designate an amount not exceeding one-half of the price ofthe new shares as additional paid-in capital.
Japanese Company Law (“the Law”) became effective on May 1, 2006, and, at the same time, the Japanese Commercial Code wasrepealed (“the Code”).
Under the Code, companies were required to set aside an amount equal to at least 10% of cash dividends and other cash appropriationsas legal earnings reserve until the total of legal earnings reserve and additional paid-in capital equaled 25% of common stock. Under theLaw, in cases when dividends are paid, an amount equal to 10% of the dividends or the excess of 25% of common stock over the total ofadditional paid-in-capital and legal earnings reserve, whichever is the smaller, must be set aside as additional paid-in capital or legalearnings reserve. Under the Code, additional paid-in capital and legal earnings reserve were available for distribution by the resolution of theshareholders’ meeting as long as the total amount of legal earnings reserve and additional paid-in capital remained equal to or exceeded25% of common stock. Under the Law, even when the total amount of additional paid-in-capital and legal earnings reserve is less than 25%of common stock, additional paid-in-capital and legal earnings reserve may be available for dividends if there are sufficient distributablesurplus. Under the Code, legal earnings reserve and additional paid-in capital could be used to eliminate or reduce a deficit by a resolutionof the shareholders’ meeting or may be capitalized by a resolution of the Board of Directors. Under the Law, both of those appropriationsrequire a resolution of the shareholders’ meeting. Legal earnings reserve is included in retained earnings in the accompanying consolidatedbalance sheets.
The maximum amount that the Company can distribute as dividends is calculated based on the non-consolidated financial statements ofthe Company and in accordance with Japanese laws and regulations.
At the Annual Shareholders’ Meeting held on June 29, 2006, the Company’s shareholders approved (1) a payment of a year-end cashdividend of ¥11.00 ($0.094) per share aggregating ¥2,087 million ($17,765 thousand) to the shareholders of record as of March 31, 2006and (2) a payment of bonuses to directors and statutory auditors aggregating ¥80 million ($681 thousand). In conformity with the Code,this declaration of cash dividends is not reflected in the consolidated financial statements as of March 31, 2006.

36 Tokyo Broadcasting System, Inc.
9. EMPLOYEES’ RETIREMENT AND SEVERANCE BENEFITS
The liabilities for retirement and severance benefits included in the consolidated balance sheets as of March 31, 2006 and 2005 consistedof the following:
Thousands of Millions of yen U.S. dollars
2006 2005 2006
Projected benefit obligation ¥12,433 ¥12,354 $105,831Less: Fair value of plan assets (3,099) (2,899) (26,379)Unfunded obligation 9,334 9,455 79,452Unrecognized actuarial differences (137) (355) (1,166)Unrecognized prior service costs — (940) —
Liability for retirement and severance benefits ¥ 9,197 ¥ 8,160 $ 78,286
The impact resulting from transfer of tax-qualified pension plans to defined contribution pension plans and advanced retirementallowance plans as of March 31, 2005 was as follows:
Millions of yen
Decreased in projected benefit obligation ¥ 41,985Plan assets (35,252)Unrecognized actuarial differences (1,913)Unrecognized prior service costs (5,074)Increase in liability for retirement and severance benefits ¥ (254)
Included in the consolidated statements of income for the years ended March 31, 2006 and 2005 were retirement and severance benefitexpenses comprised of the following:
Thousands of Millions of yen U.S. dollars
2006 2005 2006
Service costs-benefits earned during the year ¥ 559 ¥ 1,585 $ 4,758Interest cost on projected benefit obligation 175 1,007 1,490Expected return on plan assets — (620) —Amortization of actuarial differences 355 (5,027) 3,022Amortization of prior service costs 940 — 8,001Cost of defined benefit plans and advanced retirement allowance plans 674 — 5,737
Retirement and severance benefit expenses ¥2,703 ¥(3,055) $23,008
As a result of transfer of tax-qualified pension plans to defined contribution plans and advanced retirement allowance plans, losses of¥8,486 million was recognized in the consolidated statement of income as of March 31, 2005.
The discount rate and the rate of expected return on plan assets used by the Company are 2.25% as of March 31, 2006 and 2005. Theestimated amount of all retirement benefits to be paid at the future retirement date is allocated equally to each service year based on theestimated number of total service years. Prior service costs and actuarial differences are to be charged to income in the following year ofrecognition.
10. DEFERRED HEDGE LOSS
Hedge gain (losses) deferred and included in other assets in the accompanying consolidated balance sheets as of March 31, 2005consisted of the following:
Millions of yen
2005
Deferred hedge loss ¥(1,909)Deferred hedge gain 242
Deferred hedge loss, net ¥(1,667)
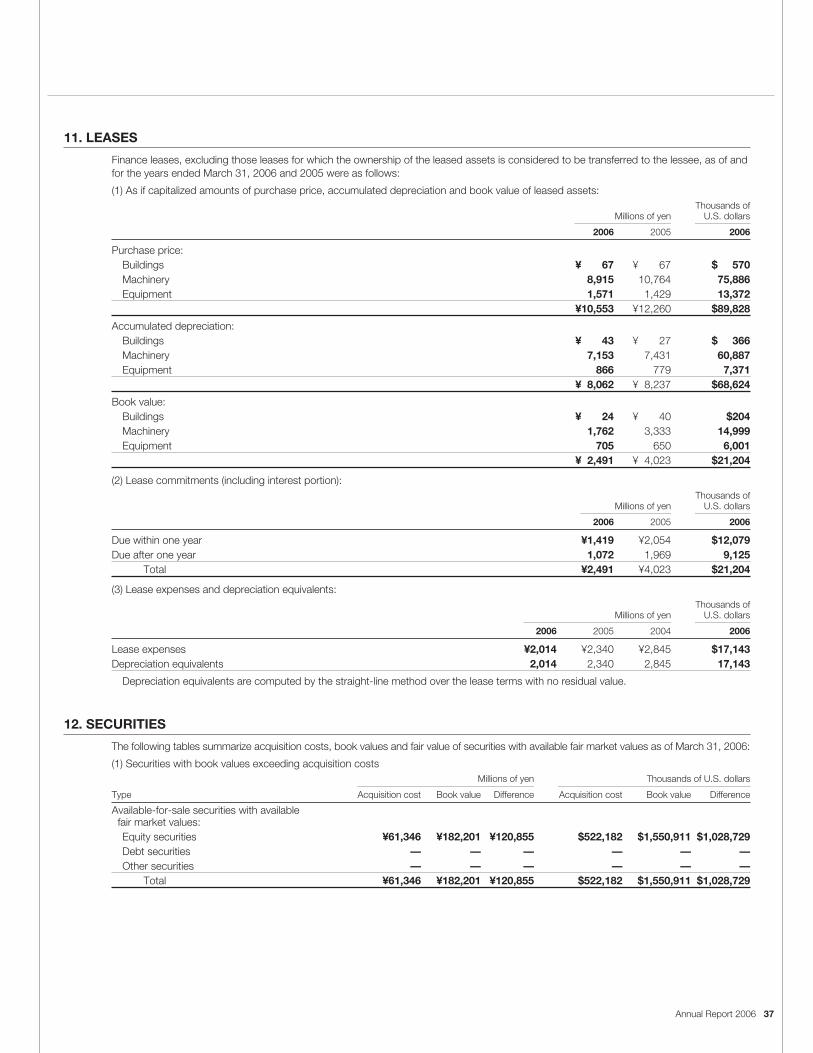
Annual Report 2006 37
11. LEASES
Finance leases, excluding those leases for which the ownership of the leased assets is considered to be transferred to the lessee, as of andfor the years ended March 31, 2006 and 2005 were as follows:
(1) As if capitalized amounts of purchase price, accumulated depreciation and book value of leased assets:Thousands of
Millions of yen U.S. dollars
2006 2005 2006
Purchase price:Buildings ¥ 67 ¥ 67 $ 570Machinery 8,915 10,764 75,886Equipment 1,571 1,429 13,372
¥10,553 ¥12,260 $89,828
Accumulated depreciation:Buildings ¥ 43 ¥ 27 $ 366Machinery 7,153 7,431 60,887Equipment 866 779 7,371
¥ 8,062 ¥ 8,237 $68,624
Book value:Buildings ¥ 24 ¥ 40 $204Machinery 1,762 3,333 14,999Equipment 705 650 6,001
¥ 2,491 ¥ 4,023 $21,204
(2) Lease commitments (including interest portion):Thousands of
Millions of yen U.S. dollars
2006 2005 2006
Due within one year ¥1,419 ¥2,054 $12,079Due after one year 1,072 1,969 9,125
Total ¥2,491 ¥4,023 $21,204
(3) Lease expenses and depreciation equivalents:Thousands of
Millions of yen U.S. dollars
2006 2005 2004 2006
Lease expenses ¥2,014 ¥2,340 ¥2,845 $17,143Depreciation equivalents 2,014 2,340 2,845 17,143
Depreciation equivalents are computed by the straight-line method over the lease terms with no residual value.
12. SECURITIES
The following tables summarize acquisition costs, book values and fair value of securities with available fair market values as of March 31, 2006:
(1) Securities with book values exceeding acquisition costs Millions of yen Thousands of U.S. dollars
Type Acquisition cost Book value Difference Acquisition cost Book value Difference
Available-for-sale securities with available fair market values:Equity securities ¥61,346 ¥182,201 ¥120,855 $522,182 $1,550,911 $1,028,729Debt securities — — — — — —Other securities — — — — — —
Total ¥61,346 ¥182,201 ¥120,855 $522,182 $1,550,911 $1,028,729

38 Tokyo Broadcasting System, Inc.
(2) Other securitiesMillions of yen Thousands of U.S. dollars
Type Acquisition cost Book value Difference Acquisition cost Book value Difference
Available-for-sale securities with available fair market values:Equity securities ¥6,797 ¥6,755 ¥(42) $57,857 $57,499 $(358)Debt securities — — — — — —Other securities 495 458 (37) 4,213 3,898 (315)
Total ¥7,292 ¥7,213 ¥(79) $62,070 $61,397 $(673)
Total sales of available-for-sale securities during the year ended March 31, 2006 amounted to ¥17,019 million ($144,867 thousand) andthe related gains and losses amounted to ¥16,946 million ($144,246 thousand) and ¥3 million ($26 thousand), respectively.
The following table summarizes book values of securities with no available fair market values as of March 31, 2006:Thousands of
Millions of yen U.S. dollars
Non-listed equity securities ¥ 7,039 $ 59,917Available-for-sale securities 17,171 146,161
Total ¥24,210 $206,078
The following tables summarize acquisition costs, book values and fair value of securities with available fair market values as of March31, 2005:
(1) Securities with book values exceeding acquisition costs Millions of yen
Type Acquisition cost Book value Difference
Available-for-sale securities with available fair market values:Equity securities ¥23,340 ¥117,986 ¥94,646Debt securities 5,000 5,000 —Other securities — — —
Total ¥28,340 ¥122,986 ¥94,646
(2) Other securitiesMillions of yen
Type Acquisition cost Book value Difference
Available-for-sale securities with available fair market values:Equity securities ¥ 41 ¥ 33 ¥ (8)Debt securities 6,000 6,000 —Other securities 316 268 (48)
Total ¥6,357 ¥6,301 ¥(56)
The above figures include marketable securities temporarily lent based on a securities lending agreement in an amount of ¥18,330 millionas of March 31, 2005.
Total sales of available-for-sale securities during the year ended March 31, 2005 amounted to ¥704 million and the related gains andlosses amounted to ¥371 million and ¥6 million, respectively.
The following table summarizes book values of securities with no available fair market values as of March 31, 2005:Millions of yen
Non-listed equity securities ¥ 8,759Available-for-sale securities 4,599Commercial paper 8,999
Total ¥22,357
Maturities of debt securities classified as available-for-sale at March 31, 2005 are as follows:Millions of yen
Over Overone year five years
Within but within but within OverType one year five years ten years ten years
Government bonds ¥11,000 ¥— ¥— ¥—Others 8,999 — — —
Total ¥19,999 ¥— ¥— ¥—

Annual Report 2006 39
13. RESEARCH AND DEVELOPMENT EXPENSES
Research and development expenses are included in both cost of sales and selling, general and administrative expenses. Research anddevelopment expenses for the years ended March 31, 2006, 2005 and 2004 were ¥376million ($3,201 thousand), ¥322 million and ¥429million, respectively.
14. RELATED PARTY TRANSACTIONS
Some of the Company’s directors and statutory auditors (collectively, “the said directors”) served as a representative director of otherparties (“the said parties”). In this connection, the transactions between the Company and the said parties have been recognized as relatedparty transactions in Japan. All of the following related party transactions were entered into by the said directors on behalf of the saidparties and were consummated at arm’s length.
The summary of related party transactions for each of the three years in the period ended March 31, 2006 was as follows:Thousands of
Millions of yen U.S. dollars
Description of transactions (Nature of related parties) 2006 2005 2004 2006
Revenues:a) Directors
Sales of advertising time (from certain broadcasting stations, an advertising agency and a newspaper publishing company) ¥85,966 ¥32,264 ¥111,668 $731,750
Room rent (from some associations) 3 3 4 26Advertisement fee (from some associations) 2 — — 17
b) Affiliated companyProduction fee 1,742 2,568 3,575 14,828
Expenses:a) Directors
Dealing commission (to an advertising agency) 17,734 6,219 21,561 150,953Network compensation (to certain broadcasting stations) 2,893 2,539 2,924 24,625Advertisement in the paper (to a certain newspaper publishing company) 10 39 85 85Donation (to a certain entity) 30 30 30 255Interest expense (to a certain financial institute) — 52 — —Commission expense (to a certain financial institute) 12 212 — 102
b) Affiliated companyProgram purchase expense 628 520 457 5,346Interest expense 6 10 14 51
Others:a) Affiliated company
Repayment of short-term borrowings, net 2,296 3,505 4,677 19,544
Thousands of Millions of yen U.S. dollars
Description of receivables and payables (Nature of related parties) 2006 2005 2006
Receivable pertaining to:a) Directors
Sales of advertising time (from certain broadcasting stations, an advertising agency and a newspaper publishing company) ¥24,618 ¥25,903 $209,551
Room rent (from some associations) 0 0 0b) Affiliates
Production fee (from a broadcasting station) 197 189 1,677Payable pertaining to:
a) DirectorsDealing commission (to an advertising agency) 1,874 208 15,952Network compensation (to certain broadcasting stations) 667 442 5,678Advertisement in the paper (to a certain newspaper publishing company) 1 2 9Commission expense (to a certain financial institute) 4 — 34
b) AffiliatesShort-term borrowings 3,290 5,586 28,005Program purchase expense (to a broadcasting station) 95 69 809

40 Tokyo Broadcasting System, Inc.
15. SEGMENT INFORMATION
The Company’s and its subsidiaries’ businesses are divided into the broadcasting segment, real estate segment and others segment. Theothers segment includes sales of DVD and VHS videos, overseas and domestic program sales, theatrical films, events, merchandising, e-commerce and management of professional baseball club, etc.
Financial information by industry segment for the years ended March 31, 2006, 2005 and 2004 were summarized as follows:Millions of yen
Elimination/Year ended March 31, 2006 Broadcasting Real estate Others Total Headquarters Consolidated
1. Operating revenues and operating incomeOperating revenues(1) Outside customers ¥259,418 ¥ 2,545 ¥44,078 ¥306,041 ¥ — ¥306,041(2) Inter-segment 4,474 4,972 5,476 14,922 (14,922) —Total 263,892 7,517 49,554 320,963 (14,922) 306,041Operating expenses 253,738 6,894 43,914 304,546 (14,910) 289,636Operating income ¥ 10,154 ¥ 623 ¥ 5,640 ¥ 16,417 ¥ (12) ¥ 16,405
2. Assets, depreciation and capital expendituresAssets ¥212,240 ¥109,582 ¥47,546 ¥369,368 ¥185,904 ¥555,272Depreciation ¥ 11,205 ¥ 1,606 ¥ 1,271 ¥ 14,082 ¥ — ¥ 14,082Capital expenditures ¥ 9,245 ¥ 12,807 ¥ 4,710 ¥ 26,762 ¥ — ¥ 26,762
Thousands of U.S. dollars
Elimination/Year ended March 31, 2006 Broadcasting Real estate Others Total Headquarters Consolidated
1. Operating revenues and operating incomeOperating revenues(1) Outside customers $2,208,189 $ 21,663 $375,196 $2,605,048 $ — $2,605,048(2) Inter-segment 38,083 42,322 46,612 127,017 (127,017) —Total 2,246,272 63,985 421,808 2,732,065 (127,017) 2,605,048Operating expenses 2,159,840 58,682 373,800 2,592,322 (126,915) 2,465,407Operating income $ 86,432 $ 5,303 $ 48,008 $ 139,743 $ (102) $ 139,641
2. Assets, depreciation and capital expendituresAssets $1,806,605 $932,772 $404,716 $3,144,093 $1,582,431 $4,726,524Depreciation $ 95,378 $ 13,670 $ 10,819 $ 119,867 $ — $ 119,867Capital expenditures $ 78,694 $109,014 $ 40,092 $ 227,800 $ — $ 227,800
Millions of yen
Elimination/Year ended March 31, 2005 Broadcasting Real estate Others Total Headquarters Consolidated
1. Operating revenues and operating incomeOperating revenues(1) Outside customers ¥258,374 ¥ 2,512 ¥40,845 ¥301,731 ¥ — ¥301,731(2) Inter-segment 4,021 4,853 6,006 14,880 (14,880) —Total 262,395 7,365 46,851 316,611 (14,880) 301,731Operating expenses 246,706 6,742 40,652 294,100 (14,879) 279,221Operating income ¥ 15,689 ¥ 623 ¥ 6,199 ¥ 22,511 ¥ (1) ¥ 22,510
2. Assets, depreciation and capital expendituresAssets ¥214,857 ¥94,811 ¥29,553 ¥339,221 ¥166,905 ¥506,126Depreciation ¥ 10,320 ¥ 1,591 ¥ 1,168 ¥ 13,079 ¥ — ¥ 13,079Capital expenditures ¥ 10,846 ¥ 4,047 ¥ 2,303 ¥ 17,196 ¥ — ¥ 17,196
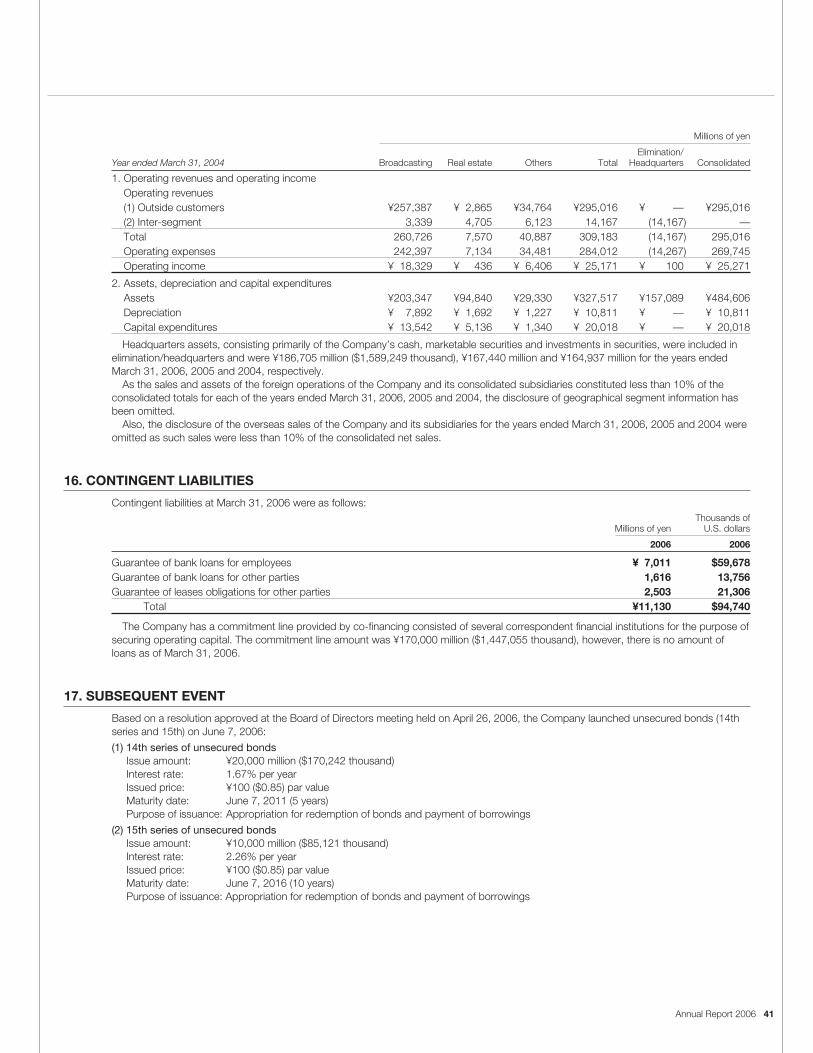
Annual Report 2006 41
Millions of yen
Elimination/Year ended March 31, 2004 Broadcasting Real estate Others Total Headquarters Consolidated
1. Operating revenues and operating incomeOperating revenues(1) Outside customers ¥257,387 ¥ 2,865 ¥34,764 ¥295,016 ¥ — ¥295,016(2) Inter-segment 3,339 4,705 6,123 14,167 (14,167) —Total 260,726 7,570 40,887 309,183 (14,167) 295,016Operating expenses 242,397 7,134 34,481 284,012 (14,267) 269,745Operating income ¥ 18,329 ¥ 436 ¥ 6,406 ¥ 25,171 ¥ 100 ¥ 25,271
2. Assets, depreciation and capital expendituresAssets ¥203,347 ¥94,840 ¥29,330 ¥327,517 ¥157,089 ¥484,606Depreciation ¥ 7,892 ¥ 1,692 ¥ 1,227 ¥ 10,811 ¥ — ¥ 10,811Capital expenditures ¥ 13,542 ¥ 5,136 ¥ 1,340 ¥ 20,018 ¥ — ¥ 20,018
Headquarters assets, consisting primarily of the Company’s cash, marketable securities and investments in securities, were included inelimination/headquarters and were ¥186,705 million ($1,589,249 thousand), ¥167,440 million and ¥164,937 million for the years endedMarch 31, 2006, 2005 and 2004, respectively.
As the sales and assets of the foreign operations of the Company and its consolidated subsidiaries constituted less than 10% of theconsolidated totals for each of the years ended March 31, 2006, 2005 and 2004, the disclosure of geographical segment information hasbeen omitted.
Also, the disclosure of the overseas sales of the Company and its subsidiaries for the years ended March 31, 2006, 2005 and 2004 wereomitted as such sales were less than 10% of the consolidated net sales.
16. CONTINGENT LIABILITIES
Contingent liabilities at March 31, 2006 were as follows:Thousands of
Millions of yen U.S. dollars
2006 2006
Guarantee of bank loans for employees ¥ 7,011 $59,678Guarantee of bank loans for other parties 1,616 13,756Guarantee of leases obligations for other parties 2,503 21,306
Total ¥11,130 $94,740
The Company has a commitment line provided by co-financing consisted of several correspondent financial institutions for the purpose ofsecuring operating capital. The commitment line amount was ¥170,000 million ($1,447,055 thousand), however, there is no amount ofloans as of March 31, 2006.
17. SUBSEQUENT EVENT
Based on a resolution approved at the Board of Directors meeting held on April 26, 2006, the Company launched unsecured bonds (14thseries and 15th) on June 7, 2006:
(1) 14th series of unsecured bondsIssue amount: ¥20,000 million ($170,242 thousand)Interest rate: 1.67% per yearIssued price: ¥100 ($0.85) par valueMaturity date: June 7, 2011 (5 years)Purpose of issuance: Appropriation for redemption of bonds and payment of borrowings
(2) 15th series of unsecured bondsIssue amount: ¥10,000 million ($85,121 thousand)Interest rate: 2.26% per yearIssued price: ¥100 ($0.85) par valueMaturity date: June 7, 2016 (10 years)Purpose of issuance: Appropriation for redemption of bonds and payment of borrowings

Independent Auditors’ Report
42 Tokyo Broadcasting System, Inc.
To the Shareholders and the Board of Directors of
Tokyo Broadcasting System, Inc.:
We have audited the accompanying consolidated balance sheets of Tokyo Broadcasting System, Inc. and consolidated subsidiaries
as of March 31, 2006 and 2005, and the related consolidated statements of income, shareholders’ equity and cash flows for each of
the three years in the period ended March 31, 2006, expressed in Japanese yen. These consolidated financial statements are the
responsibility of the Company’s management. Our responsibility is to independently express an opinion on these consolidated
financial statements based on our audits.
We conducted our audits in accordance with auditing standards generally accepted in Japan. Those standards require that we plan
and perform the audit to obtain reasonable assurance about whether the financial statements are free of material misstatement. An
audit includes examining, on a test basis, evidence supporting the amounts and disclosures in the financial statements. An audit also
includes assessing the accounting principles used and significant estimates made by management, as well as evaluating the overall
financial statement presentation. We believe that our audits provide a reasonable basis for our opinion.
In our opinion, the consolidated financial statements referred to above present fairly, in all material respects, the consolidated financial
position of Tokyo Broadcasting System, Inc. and subsidiaries as of March 31, 2006 and 2005, and the consolidated results of their
operations and their cash flows for each of the three years in the period ended March 31, 2006, in conformity with accounting
principles generally accepted in Japan.
The U.S. dollar amounts in the accompanying consolidated financial statements with respect to the year ended March 31, 2006 are
presented solely for convenience. Our audit also included the translation of yen amounts into U.S. dollar amounts and, in our opinion,
such translation has been made on the basis described in Note 1 to the consolidated financial statements.
Tokyo, Japan
June 29, 2006

Date of Establishment
May 10, 1951 (Registered on May 17)
Head Office
5-3-6 Akasaka, Minato-ku, Tokyo 107-8006, Japan
Business Activities
General broadcasting (television broadcasting) in accordancewith the Broadcast Law and other broadcasting regulations;production and distribution of television programs and DVDs,videos, etc.; telecommunication services; TV broadcasting:JORX-TV
Number of Employees
1,193
Stock Exchange Listing
Tokyo Stock Exchange
Common Shares Issued
190,138,968
Paid-in Capital
¥54,685 million
Number of Shareholders
16,766
Fiscal Year-End
March 31
Cash Dividends
Payable to registered shareholders as of March 31
Semi-Annual Cash Dividends
Payable to registered shareholders as of September 30,based on the resolution of the Board of Directors
ShareholdersÕ Meeting
June
Further Information:For further information about TBS’s operations, current programs,and more, please see our website at:
http://www.tbs.co.jp/
An interactive version of our Annual Report 2006 and back numbersfrom 2000 to 2005 can be found at:
http://www.tbs.co.jp/ir/index.html
If you would like complimentary copies of our latest annual report,please write to our Investor Relations Department at the followingaddress:
Department of Investor Relations
Tokyo Broadcasting System, Inc.
5-3-6 Akasaka, Minato-ku, Tokyo 107-8006, Japan
Editorial Supervision:Eiichiro InaiDepartment of Investor Relations
Major Shareholders
Ratio to total shares issued
Shareholders Number of shares held (% ownership)
Mizuho Trust & Banking Co., Ltd. (Trust Rakuten) 17,258,804 9.07
Rakuten Media Investment, Inc. 16,715,700 8.79
The Master Trust Bank of Japan, Ltd. (Trust Account) 10,170,700 5.34
The Master Trust Bank of Japan, Ltd.(Pension Account—Pension Trust Account held for Dentsu Inc.) 9,310,500 4.89
Nippon Life Insurance Company 7,821,735 4.11
Sumitomo Mitsui Banking Corporation 5,745,267 3.02
Mainichi Broadcasting System, Inc. 5,362,000 2.82
Japan Trustee Service Bank, Ltd. (Trust Account) 5,288,800 2.78
M&A Consulting, Inc. 5,220,600 2.74
Mitsui & Co., Ltd. 4,288,000 2.25Notes: 1. As defined by the Radio Law, ownership of voting rights by overseas shareholders was 6.08% at the end of the fiscal year under review.
2. The ratio to total shares issued is rounded down to the nearest hundredth. 3. The Master Trust Bank of Japan, Ltd. holds 9,310,500 shares in its pension trust account for Dentsu Inc. This represents TBS shares held by Dentsu
that this company has deposited in its pension trust. TBS owns 40,000 shares of Dentsu stock (1.43% of all shares issued). 4. TBS owns 2,247.81 shares (0.03% of all shares issued) of Sumitomo Mitsui Financial Group, Inc., the holding company of Sumitomo Mitsui Banking
Corporation. The ownership percentage for Sumitomo Mitsui Financial Group does not include preferred stock that has no voting rights.
Annual Report 2006 43
Corporate Data As of March 31, 2006

TOKYO BROADCASTING SYSTEM, INC.
5-3-6 Akasaka, Minato-ku, Tokyo 107-8006, Japanwww.tbs.co.jp
Printed on recycled paper in Japan
TOK
YO
BR
OA
DC
AS
TING
SY
STE
M, IN
C. A
nnual Rep
ort 2006