me'scope reference volume iia - basic operations - 株式会 … · ·...
TRANSCRIPT

i
ME’scopeVES 5.0 Reference Manual
Volume IIA – Basic Operations
(August 2008)

ME'scope Reference Volume IIA - Basic Operations
ii

Table Of Contents
iii
Notice
Information in this document is subject to change without notice and does not represent a commitment on the part of Vibrant Technology. Except as otherwise noted, names, companies, and data used in examples, sample outputs, or screen shots, are fictitious and are used solely to illustrate potential applications of the software.
Warranty
Vibrant Technology, Inc. warrants that (a) the software in this product will perform substantially in accordance with the accompanying documentation, for a period of one (1) year from the date of delivery, and that (b) any hardware accompanying the software will be free from defects in materials and workmanship for a period of one (1) year from the date of delivery. During this period, Vibrant Technology will provide software and hardware maintenance to the customer at no cost, excluding delivery charges.
Software maintenance includes normal "bug" fixes, documentation changes, and normal improvements to the software. Extra cost software enhancements are not considered normal improvements, and are not covered by this warranty. Any replacement software will be warranted for the remainder of the original warranty period or thirty (30) days, whichever is longer.
This warranty shall not apply to defects resulting from improper or inadequate maintenance by the customer, customer supplied software or interfacing, unauthorized modification or misuse, operation outside of the environmental specifications for the product, or improper site preparation or maintenance.
NO OTHER WARRANTY IS EXPRESSED OR IMPLIED. VIBRANT TECHNOLOGY SPECIFICALLY MAKES NO WARRANTY OF ANY KIND WITH REGARD TO THIS MATERIAL, INCLUDING, BUT NOT LIMITED TO, THE IMPLIED WARRANTIES OF MERCHANT ABILITY AND FITNESS FOR A PARTICULAR PURPOSE.
THE REMEDIES PROVIDED HEREIN ARE THE CUSTOMER'S SOLE AND EXCLUSIVE REMEDIES. VIBRANT TECHNOLOGY SHALL NOT BE LIABLE FOR ANY DIRECT, INDIRECT, SPECIAL, INCIDENTAL, OR CONSEQUENTIAL DAMAGES IN CONNECTION WITH THE FURNISHING, PERFORMANCE, OR USE OF THIS PRODUCT, WHETHER BASED ON CONTRACT, TORT, OR ANY OTHER LEGAL THEORY.

ME'scope Reference Volume IIA - Basic Operations
iv
Copyright
The software described in this document is copyrighted by Vibrant Technology, Inc. or its suppliers and is protected by United States copyright laws and international treaty provisions. You may make copies of the software only for backup or archival purposes.
No part of this manual may be reproduced or transmitted in any form or by any means for any purpose without the express written permission of Vibrant Technology.
Copyright © 1992-2008 by Vibrant Technology, Inc. All rights reserved. Printed in the United States of America.
Vibrant Technology, Inc. 5 Erba Lane, Suite B
Scotts Valley, CA 95066 phone: (831) 430-9045
fax: (831) 430-9057 E-mail: [email protected]
http://www.vibetech.com
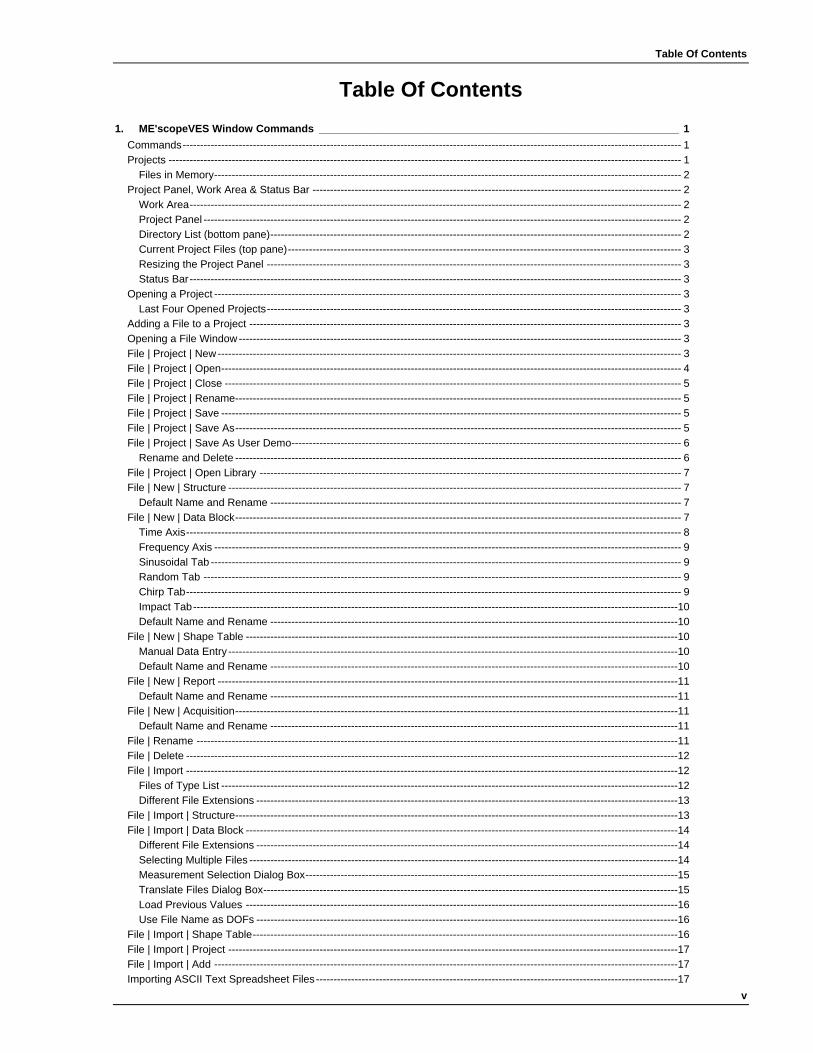
Table Of Contents
v
Table Of Contents 1. ME'scopeVES Window Commands _____________________________________________________________ 1
Commands---------------------------------------------------------------------------------------------------------------------------------------------- 1 Projects -------------------------------------------------------------------------------------------------------------------------------------------------- 1
Files in Memory------------------------------------------------------------------------------------------------------------------------------------- 2 Project Panel, Work Area & Status Bar --------------------------------------------------------------------------------------------------------- 2
Work Area-------------------------------------------------------------------------------------------------------------------------------------------- 2 Project Panel ---------------------------------------------------------------------------------------------------------------------------------------- 2 Directory List (bottom pane)--------------------------------------------------------------------------------------------------------------------- 2 Current Project Files (top pane)---------------------------------------------------------------------------------------------------------------- 3 Resizing the Project Panel ---------------------------------------------------------------------------------------------------------------------- 3 Status Bar-------------------------------------------------------------------------------------------------------------------------------------------- 3
Opening a Project ------------------------------------------------------------------------------------------------------------------------------------- 3 Last Four Opened Projects---------------------------------------------------------------------------------------------------------------------- 3
Adding a File to a Project --------------------------------------------------------------------------------------------------------------------------- 3 Opening a File Window------------------------------------------------------------------------------------------------------------------------------ 3 File | Project | New------------------------------------------------------------------------------------------------------------------------------------ 3 File | Project | Open----------------------------------------------------------------------------------------------------------------------------------- 4 File | Project | Close ---------------------------------------------------------------------------------------------------------------------------------- 5 File | Project | Rename------------------------------------------------------------------------------------------------------------------------------- 5 File | Project | Save ----------------------------------------------------------------------------------------------------------------------------------- 5 File | Project | Save As------------------------------------------------------------------------------------------------------------------------------- 5 File | Project | Save As User Demo--------------------------------------------------------------------------------------------------------------- 6
Rename and Delete ------------------------------------------------------------------------------------------------------------------------------- 6 File | Project | Open Library ------------------------------------------------------------------------------------------------------------------------ 7 File | New | Structure --------------------------------------------------------------------------------------------------------------------------------- 7
Default Name and Rename --------------------------------------------------------------------------------------------------------------------- 7 File | New | Data Block------------------------------------------------------------------------------------------------------------------------------- 7
Time Axis--------------------------------------------------------------------------------------------------------------------------------------------- 8 Frequency Axis ------------------------------------------------------------------------------------------------------------------------------------- 9 Sinusoidal Tab -------------------------------------------------------------------------------------------------------------------------------------- 9 Random Tab ---------------------------------------------------------------------------------------------------------------------------------------- 9 Chirp Tab--------------------------------------------------------------------------------------------------------------------------------------------- 9 Impact Tab------------------------------------------------------------------------------------------------------------------------------------------10 Default Name and Rename --------------------------------------------------------------------------------------------------------------------10
File | New | Shape Table ---------------------------------------------------------------------------------------------------------------------------10 Manual Data Entry --------------------------------------------------------------------------------------------------------------------------------10 Default Name and Rename --------------------------------------------------------------------------------------------------------------------10
File | New | Report -----------------------------------------------------------------------------------------------------------------------------------11 Default Name and Rename --------------------------------------------------------------------------------------------------------------------11
File | New | Acquisition------------------------------------------------------------------------------------------------------------------------------11 Default Name and Rename --------------------------------------------------------------------------------------------------------------------11
File | Rename -----------------------------------------------------------------------------------------------------------------------------------------11 File | Delete --------------------------------------------------------------------------------------------------------------------------------------------12 File | Import --------------------------------------------------------------------------------------------------------------------------------------------12
Files of Type List ----------------------------------------------------------------------------------------------------------------------------------12 Different File Extensions ------------------------------------------------------------------------------------------------------------------------13
File | Import | Structure------------------------------------------------------------------------------------------------------------------------------13 File | Import | Data Block ---------------------------------------------------------------------------------------------------------------------------14
Different File Extensions ------------------------------------------------------------------------------------------------------------------------14 Selecting Multiple Files --------------------------------------------------------------------------------------------------------------------------14 Measurement Selection Dialog Box----------------------------------------------------------------------------------------------------------15 Translate Files Dialog Box----------------------------------------------------------------------------------------------------------------------15 Load Previous Values ---------------------------------------------------------------------------------------------------------------------------16 Use File Name as DOFs ------------------------------------------------------------------------------------------------------------------------16
File | Import | Shape Table-------------------------------------------------------------------------------------------------------------------------16 File | Import | Project --------------------------------------------------------------------------------------------------------------------------------17 File | Import | Add ------------------------------------------------------------------------------------------------------------------------------------17 Importing ASCII Text Spreadsheet Files-------------------------------------------------------------------------------------------------------17

ME'scope Reference Volume IIA - Basic Operations
vi
Creating a File Template -----------------------------------------------------------------------------------------------------------------------17 Importing From a UFF File ------------------------------------------------------------------------------------------------------------------------18
UFF Format ----------------------------------------------------------------------------------------------------------------------------------------18 File | Printer Setup-----------------------------------------------------------------------------------------------------------------------------------19 File | Save Graphics in File------------------------------------------------------------------------------------------------------------------------19 File | Options ------------------------------------------------------------------------------------------------------------------------------------------19
Display Tab-----------------------------------------------------------------------------------------------------------------------------------------19 General Tab----------------------------------------------------------------------------------------------------------------------------------------19 Numbers Tab --------------------------------------------------------------------------------------------------------------------------------------20
File | Exit -----------------------------------------------------------------------------------------------------------------------------------------------20 Display Menu------------------------------------------------------------------------------------------------------------------------------------------20
Toolbars---------------------------------------------------------------------------------------------------------------------------------------------20 Status Bar ------------------------------------------------------------------------------------------------------------------------------------------20 Project Panel---------------------------------------------------------------------------------------------------------------------------------------20 Demo Toolbar -------------------------------------------------------------------------------------------------------------------------------------20 User Demos Toolbar-----------------------------------------------------------------------------------------------------------------------------21
Window Menu-----------------------------------------------------------------------------------------------------------------------------------------21 Arrange Sub Menu -------------------------------------------------------------------------------------------------------------------------------21 Auto Arrange---------------------------------------------------------------------------------------------------------------------------------------21 For Animation--------------------------------------------------------------------------------------------------------------------------------------21 Tile----------------------------------------------------------------------------------------------------------------------------------------------------22 Center------------------------------------------------------------------------------------------------------------------------------------------------22 Cascade---------------------------------------------------------------------------------------------------------------------------------------------22 Arrange Icons--------------------------------------------------------------------------------------------------------------------------------------22
Help Menu ---------------------------------------------------------------------------------------------------------------------------------------------22 Help | Demos --------------------------------------------------------------------------------------------------------------------------------------22 Help | Online Help --------------------------------------------------------------------------------------------------------------------------------22 Help | Show Tool Tips ---------------------------------------------------------------------------------------------------------------------------22 Help | About ----------------------------------------------------------------------------------------------------------------------------------------23 License Number-----------------------------------------------------------------------------------------------------------------------------------23 User Support Expiration ------------------------------------------------------------------------------------------------------------------------23 Version Number & Date Code-----------------------------------------------------------------------------------------------------------------23 Monthly or Annual License---------------------------------------------------------------------------------------------------------------------23 Options List-----------------------------------------------------------------------------------------------------------------------------------------24
2. Structure Window Commands ________________________________________________________________ 25 Draw & Animate States-----------------------------------------------------------------------------------------------------------------------------25 Graphics & Spreadsheets -------------------------------------------------------------------------------------------------------------------------25 Commands --------------------------------------------------------------------------------------------------------------------------------------------25 Special Mouse Operations ------------------------------------------------------------------------------------------------------------------------26
Rotation in the 3D View -------------------------------------------------------------------------------------------------------------------------26 Scrolling Spreadsheets -------------------------------------------------------------------------------------------------------------------------26 Zooming---------------------------------------------------------------------------------------------------------------------------------------------26 Moving & Resizing Objects --------------------------------------------------------------------------------------------------------------------26
Special Keyboard Operations --------------------------------------------------------------------------------------------------------------------26 Shift Key --------------------------------------------------------------------------------------------------------------------------------------------26 Ctrl Key----------------------------------------------------------------------------------------------------------------------------------------------26 Alt Key -----------------------------------------------------------------------------------------------------------------------------------------------27 Delete Key------------------------------------------------------------------------------------------------------------------------------------------27 F2, F3 & F4 Keys ---------------------------------------------------------------------------------------------------------------------------------27 Left & Right Arrow Keys ------------------------------------------------------------------------------------------------------------------------27 Ctrl X, Ctrl C, & Ctrl V ---------------------------------------------------------------------------------------------------------------------------27
Interactive Rotation in the 3D View -------------------------------------------------------------------------------------------------------------27 Interactive Zoom and Pan -------------------------------------------------------------------------------------------------------------------------27 File | Save----------------------------------------------------------------------------------------------------------------------------------------------27 File | Save In Project --------------------------------------------------------------------------------------------------------------------------------27 File | Save In Library --------------------------------------------------------------------------------------------------------------------------------27
SubStructure Library-----------------------------------------------------------------------------------------------------------------------------28 Saving a Single SubStructure -----------------------------------------------------------------------------------------------------------------28
File | Export--------------------------------------------------------------------------------------------------------------------------------------------28

Table Of Contents
vii
UFF File Export------------------------------------------------------------------------------------------------------------------------------------28 Structure & Shape Together -------------------------------------------------------------------------------------------------------------------28
File | Save Graphics in a File----------------------------------------------------------------------------------------------------------------------29 Importing a Structure Model in Spreadsheet Format ---------------------------------------------------------------------------------------29
Creating an (.STS) File Template-------------------------------------------------------------------------------------------------------------29 Adding Your Data to a Template--------------------------------------------------------------------------------------------------------------29 Importing an (.STS) File-------------------------------------------------------------------------------------------------------------------------29
File | Copy Graphics to Clipboard----------------------------------------------------------------------------------------------------------------30 Copying Spreadsheet Cells --------------------------------------------------------------------------------------------------------------------30
File | Print-----------------------------------------------------------------------------------------------------------------------------------------------30 Graphics---------------------------------------------------------------------------------------------------------------------------------------------30 Spreadsheet----------------------------------------------------------------------------------------------------------------------------------------30
File | Clone Structure & Source-------------------------------------------------------------------------------------------------------------------30 File | Options ------------------------------------------------------------------------------------------------------------------------------------------30
Display Tab -----------------------------------------------------------------------------------------------------------------------------------------31 Labels Tab ------------------------------------------------------------------------------------------------------------------------------------------31 Contour Colors Tab-------------------------------------------------------------------------------------------------------------------------------32 High & Low Contour Limits ---------------------------------------------------------------------------------------------------------------------32 Show/Hide Tab ------------------------------------------------------------------------------------------------------------------------------------32 Reset Column Widths----------------------------------------------------------------------------------------------------------------------------32 Movies Tab -----------------------------------------------------------------------------------------------------------------------------------------32 Units Tab --------------------------------------------------------------------------------------------------------------------------------------------32
File | Close ---------------------------------------------------------------------------------------------------------------------------------------------32 Edit | Undo ---------------------------------------------------------------------------------------------------------------------------------------------33 Edit | Redo ---------------------------------------------------------------------------------------------------------------------------------------------33 Edit | Objects (Objects List)------------------------------------------------------------------------------------------------------------------------33
Current Object Type------------------------------------------------------------------------------------------------------------------------------33 Object Spreadsheets --------------------------------------------------------------------------------------------------------------------------------33
Scroll Bars ------------------------------------------------------------------------------------------------------------------------------------------33 Select, Hide, Label, Color & Bold Columns ------------------------------------------------------------------------------------------------34 Showing & Hiding Spreadsheet Columns --------------------------------------------------------------------------------------------------34 Reset Spreadsheet Column Widths----------------------------------------------------------------------------------------------------------34 Ctrl X, Ctrl C, & Ctrl V----------------------------------------------------------------------------------------------------------------------------34
Edit | Add Object--------------------------------------------------------------------------------------------------------------------------------------34 Selecting Objects-------------------------------------------------------------------------------------------------------------------------------------34
Using the Object Selection Box ---------------------------------------------------------------------------------------------------------------35 Selecting All Objects -----------------------------------------------------------------------------------------------------------------------------35 Un-selecting All Objects-------------------------------------------------------------------------------------------------------------------------35 Toggling Object Selection ----------------------------------------------------------------------------------------------------------------------35 Selecting a Range of Objects in the Spreadsheet ---------------------------------------------------------------------------------------35
Editing Spreadsheet Properties by Column ---------------------------------------------------------------------------------------------------35 Points Spreadsheet----------------------------------------------------------------------------------------------------------------------------------35
Point Labels ----------------------------------------------------------------------------------------------------------------------------------------36 Point Numbering ----------------------------------------------------------------------------------------------------------------------------------36 Point Coordinates Columns --------------------------------------------------------------------------------------------------------------------36 Center Point Column-----------------------------------------------------------------------------------------------------------------------------37 Display Column------------------------------------------------------------------------------------------------------------------------------------37 Area & Normal Columns ------------------------------------------------------------------------------------------------------------------------37 Animate Using Column --------------------------------------------------------------------------------------------------------------------------37
Adding Points to a Model---------------------------------------------------------------------------------------------------------------------------37 Adding Points Graphically ----------------------------------------------------------------------------------------------------------------------37 Terminating Graphical Point Addition--------------------------------------------------------------------------------------------------------37 Adding Rows to the Spreadsheet-------------------------------------------------------------------------------------------------------------38
Editing Point Coordinates --------------------------------------------------------------------------------------------------------------------------38 Editing Spreadsheet Coordinates-------------------------------------------------------------------------------------------------------------38
Lines Spreadsheet -----------------------------------------------------------------------------------------------------------------------------------38 Adding Lines to a Model----------------------------------------------------------------------------------------------------------------------------39
Terminating Line Addition-----------------------------------------------------------------------------------------------------------------------39 Surface Spreadsheets ------------------------------------------------------------------------------------------------------------------------------40
Surface Triangles ---------------------------------------------------------------------------------------------------------------------------------40 Surface Quads-------------------------------------------------------------------------------------------------------------------------------------40
ME'scope Reference Volume IIA - Basic Operations
viii
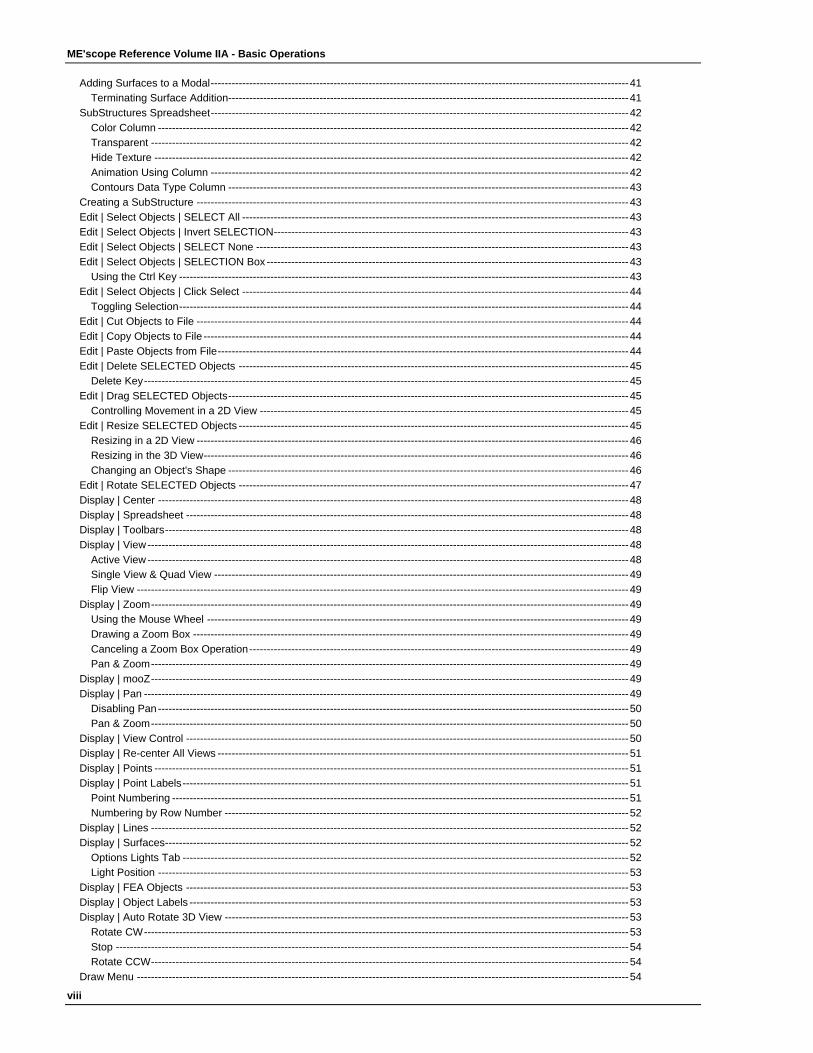
Adding Surfaces to a Modal-----------------------------------------------------------------------------------------------------------------------41 Terminating Surface Addition------------------------------------------------------------------------------------------------------------------41
SubStructures Spreadsheet-----------------------------------------------------------------------------------------------------------------------42 Color Column --------------------------------------------------------------------------------------------------------------------------------------42 Transparent ----------------------------------------------------------------------------------------------------------------------------------------42 Hide Texture ---------------------------------------------------------------------------------------------------------------------------------------42 Animation Using Column -----------------------------------------------------------------------------------------------------------------------42 Contours Data Type Column ------------------------------------------------------------------------------------------------------------------43
Creating a SubStructure ---------------------------------------------------------------------------------------------------------------------------43 Edit | Select Objects | SELECT All --------------------------------------------------------------------------------------------------------------43 Edit | Select Objects | Invert SELECTION-----------------------------------------------------------------------------------------------------43 Edit | Select Objects | SELECT None ----------------------------------------------------------------------------------------------------------43 Edit | Select Objects | SELECTION Box -------------------------------------------------------------------------------------------------------43
Using the Ctrl Key --------------------------------------------------------------------------------------------------------------------------------43 Edit | Select Objects | Click Select --------------------------------------------------------------------------------------------------------------44
Toggling Selection--------------------------------------------------------------------------------------------------------------------------------44 Edit | Cut Objects to File ---------------------------------------------------------------------------------------------------------------------------44 Edit | Copy Objects to File -------------------------------------------------------------------------------------------------------------------------44 Edit | Paste Objects from File---------------------------------------------------------------------------------------------------------------------44 Edit | Delete SELECTED Objects ---------------------------------------------------------------------------------------------------------------45
Delete Key------------------------------------------------------------------------------------------------------------------------------------------45 Edit | Drag SELECTED Objects------------------------------------------------------------------------------------------------------------------45
Controlling Movement in a 2D View ---------------------------------------------------------------------------------------------------------45 Edit | Resize SELECTED Objects ---------------------------------------------------------------------------------------------------------------45
Resizing in a 2D View ---------------------------------------------------------------------------------------------------------------------------46 Resizing in the 3D View-------------------------------------------------------------------------------------------------------------------------46 Changing an Object's Shape ------------------------------------------------------------------------------------------------------------------46
Edit | Rotate SELECTED Objects ---------------------------------------------------------------------------------------------------------------47 Display | Center --------------------------------------------------------------------------------------------------------------------------------------48 Display | Spreadsheet ------------------------------------------------------------------------------------------------------------------------------48 Display | Toolbars------------------------------------------------------------------------------------------------------------------------------------48 Display | View-----------------------------------------------------------------------------------------------------------------------------------------48
Active View-----------------------------------------------------------------------------------------------------------------------------------------48 Single View & Quad View ----------------------------------------------------------------------------------------------------------------------49 Flip View --------------------------------------------------------------------------------------------------------------------------------------------49
Display | Zoom----------------------------------------------------------------------------------------------------------------------------------------49 Using the Mouse Wheel ------------------------------------------------------------------------------------------------------------------------49 Drawing a Zoom Box ----------------------------------------------------------------------------------------------------------------------------49 Canceling a Zoom Box Operation------------------------------------------------------------------------------------------------------------49 Pan & Zoom----------------------------------------------------------------------------------------------------------------------------------------49
Display | mooZ----------------------------------------------------------------------------------------------------------------------------------------49 Display | Pan ------------------------------------------------------------------------------------------------------------------------------------------49
Disabling Pan--------------------------------------------------------------------------------------------------------------------------------------50 Pan & Zoom----------------------------------------------------------------------------------------------------------------------------------------50
Display | View Control ------------------------------------------------------------------------------------------------------------------------------50 Display | Re-center All Views ---------------------------------------------------------------------------------------------------------------------51 Display | Points ---------------------------------------------------------------------------------------------------------------------------------------51 Display | Point Labels-------------------------------------------------------------------------------------------------------------------------------51
Point Numbering ----------------------------------------------------------------------------------------------------------------------------------51 Numbering by Row Number -------------------------------------------------------------------------------------------------------------------52
Display | Lines ----------------------------------------------------------------------------------------------------------------------------------------52 Display | Surfaces------------------------------------------------------------------------------------------------------------------------------------52
Options Lights Tab -------------------------------------------------------------------------------------------------------------------------------52 Light Position --------------------------------------------------------------------------------------------------------------------------------------53
Display | FEA Objects ------------------------------------------------------------------------------------------------------------------------------53 Display | Object Labels -----------------------------------------------------------------------------------------------------------------------------53 Display | Auto Rotate 3D View -------------------------------------------------------------------------------------------------------------------53
Rotate CW------------------------------------------------------------------------------------------------------------------------------------------53 Stop --------------------------------------------------------------------------------------------------------------------------------------------------54 Rotate CCW----------------------------------------------------------------------------------------------------------------------------------------54
Draw Menu --------------------------------------------------------------------------------------------------------------------------------------------54
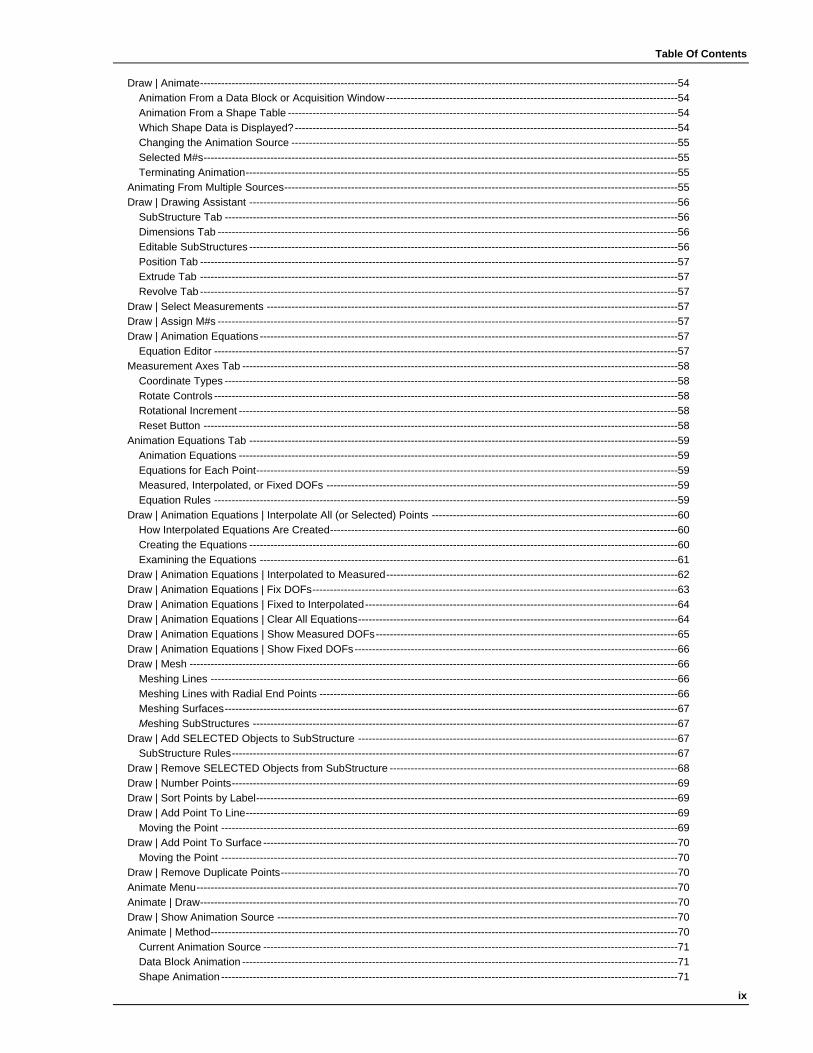
Table Of Contents
ix
Draw | Animate----------------------------------------------------------------------------------------------------------------------------------------54 Animation From a Data Block or Acquisition Window-----------------------------------------------------------------------------------54 Animation From a Shape Table ---------------------------------------------------------------------------------------------------------------54 Which Shape Data is Displayed?-------------------------------------------------------------------------------------------------------------54 Changing the Animation Source --------------------------------------------------------------------------------------------------------------55 Selected M#s---------------------------------------------------------------------------------------------------------------------------------------55 Terminating Animation---------------------------------------------------------------------------------------------------------------------------55
Animating From Multiple Sources----------------------------------------------------------------------------------------------------------------55 Draw | Drawing Assistant --------------------------------------------------------------------------------------------------------------------------56
SubStructure Tab ---------------------------------------------------------------------------------------------------------------------------------56 Dimensions Tab -----------------------------------------------------------------------------------------------------------------------------------56 Editable SubStructures --------------------------------------------------------------------------------------------------------------------------56 Position Tab ----------------------------------------------------------------------------------------------------------------------------------------57 Extrude Tab ----------------------------------------------------------------------------------------------------------------------------------------57 Revolve Tab ----------------------------------------------------------------------------------------------------------------------------------------57
Draw | Select Measurements ---------------------------------------------------------------------------------------------------------------------57 Draw | Assign M#s -----------------------------------------------------------------------------------------------------------------------------------57 Draw | Animation Equations -----------------------------------------------------------------------------------------------------------------------57
Equation Editor ------------------------------------------------------------------------------------------------------------------------------------57 Measurement Axes Tab ----------------------------------------------------------------------------------------------------------------------------58
Coordinate Types ---------------------------------------------------------------------------------------------------------------------------------58 Rotate Controls ------------------------------------------------------------------------------------------------------------------------------------58 Rotational Increment -----------------------------------------------------------------------------------------------------------------------------58 Reset Button ---------------------------------------------------------------------------------------------------------------------------------------58
Animation Equations Tab --------------------------------------------------------------------------------------------------------------------------59 Animation Equations -----------------------------------------------------------------------------------------------------------------------------59 Equations for Each Point------------------------------------------------------------------------------------------------------------------------59 Measured, Interpolated, or Fixed DOFs ----------------------------------------------------------------------------------------------------59 Equation Rules ------------------------------------------------------------------------------------------------------------------------------------59
Draw | Animation Equations | Interpolate All (or Selected) Points ----------------------------------------------------------------------60 How Interpolated Equations Are Created---------------------------------------------------------------------------------------------------60 Creating the Equations --------------------------------------------------------------------------------------------------------------------------60 Examining the Equations -----------------------------------------------------------------------------------------------------------------------61
Draw | Animation Equations | Interpolated to Measured-----------------------------------------------------------------------------------62 Draw | Animation Equations | Fix DOFs--------------------------------------------------------------------------------------------------------63 Draw | Animation Equations | Fixed to Interpolated-----------------------------------------------------------------------------------------64 Draw | Animation Equations | Clear All Equations-------------------------------------------------------------------------------------------64 Draw | Animation Equations | Show Measured DOFs--------------------------------------------------------------------------------------65 Draw | Animation Equations | Show Fixed DOFs--------------------------------------------------------------------------------------------66 Draw | Mesh -------------------------------------------------------------------------------------------------------------------------------------------66
Meshing Lines -------------------------------------------------------------------------------------------------------------------------------------66 Meshing Lines with Radial End Points ------------------------------------------------------------------------------------------------------66 Meshing Surfaces---------------------------------------------------------------------------------------------------------------------------------67 Meshing SubStructures -------------------------------------------------------------------------------------------------------------------------67
Draw | Add SELECTED Objects to SubStructure -------------------------------------------------------------------------------------------67 SubStructure Rules-------------------------------------------------------------------------------------------------------------------------------67
Draw | Remove SELECTED Objects from SubStructure ----------------------------------------------------------------------------------68 Draw | Number Points-------------------------------------------------------------------------------------------------------------------------------69 Draw | Sort Points by Label------------------------------------------------------------------------------------------------------------------------69 Draw | Add Point To Line---------------------------------------------------------------------------------------------------------------------------69
Moving the Point ----------------------------------------------------------------------------------------------------------------------------------69 Draw | Add Point To Surface ----------------------------------------------------------------------------------------------------------------------70
Moving the Point ----------------------------------------------------------------------------------------------------------------------------------70 Draw | Remove Duplicate Points-----------------------------------------------------------------------------------------------------------------70 Animate Menu-----------------------------------------------------------------------------------------------------------------------------------------70 Animate | Draw----------------------------------------------------------------------------------------------------------------------------------------70 Draw | Show Animation Source ------------------------------------------------------------------------------------------------------------------70 Animate | Method-------------------------------------------------------------------------------------------------------------------------------------70
Current Animation Source ----------------------------------------------------------------------------------------------------------------------71 Data Block Animation ----------------------------------------------------------------------------------------------------------------------------71 Shape Animation ----------------------------------------------------------------------------------------------------------------------------------71
ME'scope Reference Volume IIA - Basic Operations
x
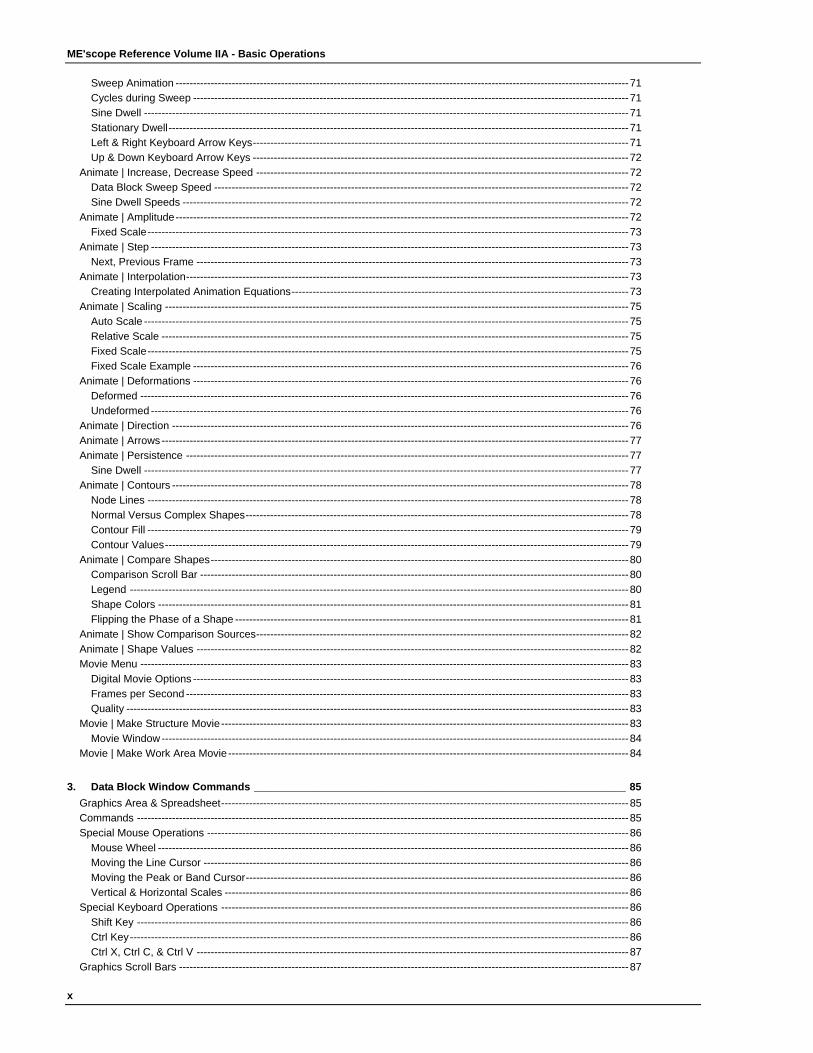
Sweep Animation ---------------------------------------------------------------------------------------------------------------------------------71 Cycles during Sweep ----------------------------------------------------------------------------------------------------------------------------71 Sine Dwell ------------------------------------------------------------------------------------------------------------------------------------------71 Stationary Dwell-----------------------------------------------------------------------------------------------------------------------------------71 Left & Right Keyboard Arrow Keys-----------------------------------------------------------------------------------------------------------71 Up & Down Keyboard Arrow Keys -----------------------------------------------------------------------------------------------------------72
Animate | Increase, Decrease Speed ----------------------------------------------------------------------------------------------------------72 Data Block Sweep Speed ----------------------------------------------------------------------------------------------------------------------72 Sine Dwell Speeds -------------------------------------------------------------------------------------------------------------------------------72
Animate | Amplitude---------------------------------------------------------------------------------------------------------------------------------72 Fixed Scale-----------------------------------------------------------------------------------------------------------------------------------------73
Animate | Step ----------------------------------------------------------------------------------------------------------------------------------------73 Next, Previous Frame ---------------------------------------------------------------------------------------------------------------------------73
Animate | Interpolation------------------------------------------------------------------------------------------------------------------------------73 Creating Interpolated Animation Equations------------------------------------------------------------------------------------------------73
Animate | Scaling ------------------------------------------------------------------------------------------------------------------------------------75 Auto Scale ------------------------------------------------------------------------------------------------------------------------------------------75 Relative Scale -------------------------------------------------------------------------------------------------------------------------------------75 Fixed Scale-----------------------------------------------------------------------------------------------------------------------------------------75 Fixed Scale Example ----------------------------------------------------------------------------------------------------------------------------76
Animate | Deformations ----------------------------------------------------------------------------------------------------------------------------76 Deformed -------------------------------------------------------------------------------------------------------------------------------------------76 Undeformed ----------------------------------------------------------------------------------------------------------------------------------------76
Animate | Direction ----------------------------------------------------------------------------------------------------------------------------------76 Animate | Arrows-------------------------------------------------------------------------------------------------------------------------------------77 Animate | Persistence ------------------------------------------------------------------------------------------------------------------------------77
Sine Dwell ------------------------------------------------------------------------------------------------------------------------------------------77 Animate | Contours ----------------------------------------------------------------------------------------------------------------------------------78
Node Lines -----------------------------------------------------------------------------------------------------------------------------------------78 Normal Versus Complex Shapes-------------------------------------------------------------------------------------------------------------78 Contour Fill -----------------------------------------------------------------------------------------------------------------------------------------79 Contour Values------------------------------------------------------------------------------------------------------------------------------------79
Animate | Compare Shapes-----------------------------------------------------------------------------------------------------------------------80 Comparison Scroll Bar --------------------------------------------------------------------------------------------------------------------------80 Legend ----------------------------------------------------------------------------------------------------------------------------------------------80 Shape Colors --------------------------------------------------------------------------------------------------------------------------------------81 Flipping the Phase of a Shape ----------------------------------------------------------------------------------------------------------------81
Animate | Show Comparison Sources----------------------------------------------------------------------------------------------------------82 Animate | Shape Values ---------------------------------------------------------------------------------------------------------------------------82 Movie Menu -------------------------------------------------------------------------------------------------------------------------------------------83
Digital Movie Options ----------------------------------------------------------------------------------------------------------------------------83 Frames per Second ------------------------------------------------------------------------------------------------------------------------------83 Quality -----------------------------------------------------------------------------------------------------------------------------------------------83
Movie | Make Structure Movie--------------------------------------------------------------------------------------------------------------------83 Movie Window-------------------------------------------------------------------------------------------------------------------------------------84
Movie | Make Work Area Movie------------------------------------------------------------------------------------------------------------------84
3. Data Block Window Commands _______________________________________________________________ 85 Graphics Area & Spreadsheet--------------------------------------------------------------------------------------------------------------------85 Commands --------------------------------------------------------------------------------------------------------------------------------------------85 Special Mouse Operations ------------------------------------------------------------------------------------------------------------------------86
Mouse Wheel --------------------------------------------------------------------------------------------------------------------------------------86 Moving the Line Cursor -------------------------------------------------------------------------------------------------------------------------86 Moving the Peak or Band Cursor-------------------------------------------------------------------------------------------------------------86 Vertical & Horizontal Scales -------------------------------------------------------------------------------------------------------------------86
Special Keyboard Operations --------------------------------------------------------------------------------------------------------------------86 Shift Key --------------------------------------------------------------------------------------------------------------------------------------------86 Ctrl Key----------------------------------------------------------------------------------------------------------------------------------------------86 Ctrl X, Ctrl C, & Ctrl V ---------------------------------------------------------------------------------------------------------------------------87
Graphics Scroll Bars --------------------------------------------------------------------------------------------------------------------------------87

Table Of Contents
xi
Vertical Scroll Bar ---------------------------------------------------------------------------------------------------------------------------------87 Horizontal Scroll Bar -----------------------------------------------------------------------------------------------------------------------------87
Traces Spreadsheet ---------------------------------------------------------------------------------------------------------------------------------87 Scroll Bars ------------------------------------------------------------------------------------------------------------------------------------------87 Showing & Hiding Spreadsheet Columns --------------------------------------------------------------------------------------------------88 Reset Spreadsheet Column Widths----------------------------------------------------------------------------------------------------------88 Unique M#s-----------------------------------------------------------------------------------------------------------------------------------------88 Selecting Traces ----------------------------------------------------------------------------------------------------------------------------------88 Changing Trace Properties---------------------------------------------------------------------------------------------------------------------89 Hide Column ---------------------------------------------------------------------------------------------------------------------------------------89 Measurement Type Column--------------------------------------------------------------------------------------------------------------------89 DOFs Column--------------------------------------------------------------------------------------------------------------------------------------89 Units Column---------------------------------------------------------------------------------------------------------------------------------------89 Color Column --------------------------------------------------------------------------------------------------------------------------------------90 Input Output ----------------------------------------------------------------------------------------------------------------------------------------90 Sound Column -------------------------------------------------------------------------------------------------------------------------------------90 Data Type Column--------------------------------------------------------------------------------------------------------------------------------90 Scale Method, Minimum Scale, & Maximum Scale Columns -------------------------------------------------------------------------90 Units Scaling Column ----------------------------------------------------------------------------------------------------------------------------90 Window Column-----------------------------------------------------------------------------------------------------------------------------------90 Window Value Column --------------------------------------------------------------------------------------------------------------------------91 dB Reference Value Column-------------------------------------------------------------------------------------------------------------------91 Amplitude Scaling Column ---------------------------------------------------------------------------------------------------------------------91 Label Column --------------------------------------------------------------------------------------------------------------------------------------91 Date/Time Column--------------------------------------------------------------------------------------------------------------------------------91 SubShape Column--------------------------------------------------------------------------------------------------------------------------------91 Source Column ------------------------------------------------------------------------------------------------------------------------------------91 Z-Axis Column -------------------------------------------------------------------------------------------------------------------------------------91
File | Save ----------------------------------------------------------------------------------------------------------------------------------------------91 File | Save In Project --------------------------------------------------------------------------------------------------------------------------------92 File | Save Graphics in a File----------------------------------------------------------------------------------------------------------------------92 File | Export --------------------------------------------------------------------------------------------------------------------------------------------92
UFF File Export------------------------------------------------------------------------------------------------------------------------------------92 Importing a Data Block in Spreadsheet Format ----------------------------------------------------------------------------------------------92
Column Format ------------------------------------------------------------------------------------------------------------------------------------92 Header Data----------------------------------------------------------------------------------------------------------------------------------------93 Creating a (BLS) File Template ---------------------------------------------------------------------------------------------------------------94 Adding Your Data to the Template -----------------------------------------------------------------------------------------------------------94 Importing a (.BLS) File---------------------------------------------------------------------------------------------------------------------------94
File | Copy Graphics to Clipboard----------------------------------------------------------------------------------------------------------------94 Bitmap------------------------------------------------------------------------------------------------------------------------------------------------94 Copying Spreadsheet Cells --------------------------------------------------------------------------------------------------------------------94
Editing Trace Data -----------------------------------------------------------------------------------------------------------------------------------94 Exporting the Trace Data -----------------------------------------------------------------------------------------------------------------------94 Importing the Edited Trace Data --------------------------------------------------------------------------------------------------------------95
File | Print-----------------------------------------------------------------------------------------------------------------------------------------------95 Trace Graphics ------------------------------------------------------------------------------------------------------------------------------------95 Traces Spreadsheet------------------------------------------------------------------------------------------------------------------------------95
File | Properties ---------------------------------------------------------------------------------------------------------------------------------------95 X-Axis Parameters--------------------------------------------------------------------------------------------------------------------------------95 Machine Speed ------------------------------------------------------------------------------------------------------------------------------------96
File | Options ------------------------------------------------------------------------------------------------------------------------------------------96 Display Tab -----------------------------------------------------------------------------------------------------------------------------------------97 Labels & Grids Tab -------------------------------------------------------------------------------------------------------------------------------97 Contour Colors Tab-------------------------------------------------------------------------------------------------------------------------------97 Show/Hide Tab ------------------------------------------------------------------------------------------------------------------------------------97 Reset Column Widths----------------------------------------------------------------------------------------------------------------------------98 Animation Tab -------------------------------------------------------------------------------------------------------------------------------------98
File | Close ---------------------------------------------------------------------------------------------------------------------------------------------98 Edit | Undo ---------------------------------------------------------------------------------------------------------------------------------------------98 Edit | Redo ---------------------------------------------------------------------------------------------------------------------------------------------98

ME'scope Reference Volume IIA - Basic Operations
xii
Edit | Select Traces----------------------------------------------------------------------------------------------------------------------------------98 Edit | Select Traces | By ------------------------------------------------------------------------------------------------------------------------99 Select By DOF----------------------------------------------------------------------------------------------------------------------------------- 100 Select By Roving DOF ------------------------------------------------------------------------------------------------------------------------ 100 Select By Reference DOF-------------------------------------------------------------------------------------------------------------------- 100 Select By Point ---------------------------------------------------------------------------------------------------------------------------------- 100 Select By Direction ----------------------------------------------------------------------------------------------------------------------------- 100 Select By Measurement Set ----------------------------------------------------------------------------------------------------------------- 100 Select By Roving DOF Only ----------------------------------------------------------------------------------------------------------------- 100 Select By Reference DOF Only------------------------------------------------------------------------------------------------------------- 100 Select By Data Type --------------------------------------------------------------------------------------------------------------------------- 100 Select By Measurement Type--------------------------------------------------------------------------------------------------------------- 101 Edit | Select Traces | All, None, Invert ---------------------------------------------------------------------------------------------------- 101
Edit | Sort Traces----------------------------------------------------------------------------------------------------------------------------------- 101 Edit | Sort Traces | By ------------------------------------------------------------------------------------------------------------------------- 101 Sort By DOF ------------------------------------------------------------------------------------------------------------------------------------- 102 Sort By Roving DOF --------------------------------------------------------------------------------------------------------------------------- 102 Sort By Reference DOF----------------------------------------------------------------------------------------------------------------------- 102 Sort By Point ------------------------------------------------------------------------------------------------------------------------------------- 102 Sort By Direction-------------------------------------------------------------------------------------------------------------------------------- 102 Sort By Measurement Set -------------------------------------------------------------------------------------------------------------------- 102 Sort By Roving DOF Only -------------------------------------------------------------------------------------------------------------------- 102 Sort By Reference DOF Only---------------------------------------------------------------------------------------------------------------- 102 Sort By Data Type------------------------------------------------------------------------------------------------------------------------------ 102 Sort By Measurement Type------------------------------------------------------------------------------------------------------------------ 103 Edit | Sort Traces | Manual ------------------------------------------------------------------------------------------------------------------- 103
Display | Center ------------------------------------------------------------------------------------------------------------------------------------ 103 Display | Spreadsheet ---------------------------------------------------------------------------------------------------------------------------- 103 Display | Toolbars---------------------------------------------------------------------------------------------------------------------------------- 103 Display | Real --------------------------------------------------------------------------------------------------------------------------------------- 104 Display | Imaginary -------------------------------------------------------------------------------------------------------------------------------- 104 Display | Magnitude ------------------------------------------------------------------------------------------------------------------------------- 104
Linear, Log or dB ------------------------------------------------------------------------------------------------------------------------------- 106 dB Units for Linear versus Power Quantities-------------------------------------------------------------------------------------------- 106
Display | Phase------------------------------------------------------------------------------------------------------------------------------------- 106 Display | CoQuad ---------------------------------------------------------------------------------------------------------------------------------- 106 Display | Bode -------------------------------------------------------------------------------------------------------------------------------------- 107 Display | Nyquist ----------------------------------------------------------------------------------------------------------------------------------- 107 Display | Cursor ------------------------------------------------------------------------------------------------------------------------------------ 108
Line Cursor --------------------------------------------------------------------------------------------------------------------------------------- 108 Band Cursor-------------------------------------------------------------------------------------------------------------------------------------- 108 Peak Cursor-------------------------------------------------------------------------------------------------------------------------------------- 108 Moving the Cursors ---------------------------------------------------------------------------------------------------------------------------- 108 Animating Shapes with a Cursor Displayed --------------------------------------------------------------------------------------------- 108 Saving Shapes with a Cursor Displayed ------------------------------------------------------------------------------------------------- 109 Cursor Values ----------------------------------------------------------------------------------------------------------------------------------- 109
Display | Zoom-------------------------------------------------------------------------------------------------------------------------------------- 109 Displaying a Range of Samples ------------------------------------------------------------------------------------------------------------ 109 Zooming Around a Sample------------------------------------------------------------------------------------------------------------------- 109 X & Y-axis Zoom-------------------------------------------------------------------------------------------------------------------------------- 109 Panning After a Zoom ------------------------------------------------------------------------------------------------------------------------- 109
Display | mooZ-------------------------------------------------------------------------------------------------------------------------------------- 110 Display | Maximize--------------------------------------------------------------------------------------------------------------------------------- 110
How It Works------------------------------------------------------------------------------------------------------------------------------------- 111 Maximizing Real & Imaginary Displays --------------------------------------------------------------------------------------------------- 111
Display | Fill Under Graph ----------------------------------------------------------------------------------------------------------------------- 111 Use Trace Color--------------------------------------------------------------------------------------------------------------------------------- 112 Use Fill Colors ----------------------------------------------------------------------------------------------------------------------------------- 112 Use Contour Colors ---------------------------------------------------------------------------------------------------------------------------- 112
Display | Complexity Plot ------------------------------------------------------------------------------------------------------------------------ 112 Display | Magnitude Ranking ------------------------------------------------------------------------------------------------------------------- 112
Table Of Contents
xiii
Which Magnitudes Are Ranked?------------------------------------------------------------------------------------------------------------113 Status Bar-----------------------------------------------------------------------------------------------------------------------------------------113
Format | Rows/Columns--------------------------------------------------------------------------------------------------------------------------113 Format | Overlay Traces--------------------------------------------------------------------------------------------------------------------------114 Format | Strip Chart--------------------------------------------------------------------------------------------------------------------------------114 Format | Cascade ----------------------------------------------------------------------------------------------------------------------------------115
Changing the Axes -----------------------------------------------------------------------------------------------------------------------------115 Format | Contour Map-----------------------------------------------------------------------------------------------------------------------------116 Format | Vertical Axis -----------------------------------------------------------------------------------------------------------------------------116
Scaling ---------------------------------------------------------------------------------------------------------------------------------------------117 Fixed Scaling-------------------------------------------------------------------------------------------------------------------------------------117 Scaling from the Traces Spreadsheet -----------------------------------------------------------------------------------------------------117 Linear/Log-----------------------------------------------------------------------------------------------------------------------------------------117 dB Units for Linear versus Power Quantities --------------------------------------------------------------------------------------------117 Labels & Grids -----------------------------------------------------------------------------------------------------------------------------------118
Format | Horizontal Axis --------------------------------------------------------------------------------------------------------------------------118 Display Limits ------------------------------------------------------------------------------------------------------------------------------------118 Time or Frequency X-Axis --------------------------------------------------------------------------------------------------------------------118 Labels & Grids -----------------------------------------------------------------------------------------------------------------------------------118
Format | Group By DOF --------------------------------------------------------------------------------------------------------------------------118 Tools | Assign M#s---------------------------------------------------------------------------------------------------------------------------------119
Connected Structure Window----------------------------------------------------------------------------------------------------------------119 Match Structure and Source DOFs --------------------------------------------------------------------------------------------------------119 Scalar Data ---------------------------------------------------------------------------------------------------------------------------------------119 Vector or Rotation Data -----------------------------------------------------------------------------------------------------------------------119 Trace DOFs --------------------------------------------------------------------------------------------------------------------------------------120 Editing DOFs -------------------------------------------------------------------------------------------------------------------------------------120 Multiple Reference Measurements---------------------------------------------------------------------------------------------------------120 Graphical Assignment -------------------------------------------------------------------------------------------------------------------------121 Click Select Versus Ctrl Select --------------------------------------------------------------------------------------------------------------121 Trace DOF Creation----------------------------------------------------------------------------------------------------------------------------122
Using the DOF Generator------------------------------------------------------------------------------------------------------------------------122 Single Channel DOFs--------------------------------------------------------------------------------------------------------------------------123 Cross Channel DOFs --------------------------------------------------------------------------------------------------------------------------123 Add To ---------------------------------------------------------------------------------------------------------------------------------------------124 Swap DOFs of Roving Hammer Impact Measurements------------------------------------------------------------------------------124 Delete ----------------------------------------------------------------------------------------------------------------------------------------------124
Tools | Animate Shape----------------------------------------------------------------------------------------------------------------------------124 Sweep or Dwell ----------------------------------------------------------------------------------------------------------------------------------124 Which Data is Animated? ---------------------------------------------------------------------------------------------------------------------125 Selected M#s-------------------------------------------------------------------------------------------------------------------------------------125 Multiple Reference DOFs ---------------------------------------------------------------------------------------------------------------------125 Terminating Animation-------------------------------------------------------------------------------------------------------------------------125
Tools | Save Shape--------------------------------------------------------------------------------------------------------------------------------125
4. Shape Table Window Commands _____________________________________________________________ 127 Shapes and DOFs Spreadsheets--------------------------------------------------------------------------------------------------------------127 Commands-------------------------------------------------------------------------------------------------------------------------------------------127 Special Mouse Operations-----------------------------------------------------------------------------------------------------------------------127
Mouse Wheel ------------------------------------------------------------------------------------------------------------------------------------127 Showing & Hiding Spreadsheet Columns ------------------------------------------------------------------------------------------------127
Special Keyboard Operations-------------------------------------------------------------------------------------------------------------------127 Ctrl Key --------------------------------------------------------------------------------------------------------------------------------------------127 Ctrl X, Ctrl C, & Ctrl V--------------------------------------------------------------------------------------------------------------------------128
Shapes and DOFs Spreadsheets--------------------------------------------------------------------------------------------------------------128 Scroll Bars ----------------------------------------------------------------------------------------------------------------------------------------128 Hiding & Showing Spreadsheet Columns ------------------------------------------------------------------------------------------------128 Reset Spreadsheet Column Widths--------------------------------------------------------------------------------------------------------128 Shapes Spreadsheet---------------------------------------------------------------------------------------------------------------------------128 DOFs Spreadsheet -----------------------------------------------------------------------------------------------------------------------------129
ME'scope Reference Volume IIA - Basic Operations
xiv
DOFs Spreadsheet Rows as M#s---------------------------------------------------------------------------------------------------------- 129 File | Save-------------------------------------------------------------------------------------------------------------------------------------------- 129 File | Save In Project ------------------------------------------------------------------------------------------------------------------------------ 129 Importing a Shape Table in Spreadsheet Format ----------------------------------------------------------------------------------------- 129
Creating an (.SHS) File Template---------------------------------------------------------------------------------------------------------- 129 Adding Your Data to the Template--------------------------------------------------------------------------------------------------------- 130 Importing an (.SHS) File ---------------------------------------------------------------------------------------------------------------------- 130
File | Export------------------------------------------------------------------------------------------------------------------------------------------ 130 UFF File Export --------------------------------------------------------------------------------------------------------------------------------- 130
File | Print -------------------------------------------------------------------------------------------------------------------------------------------- 131 Shapes -------------------------------------------------------------------------------------------------------------------------------------------- 131 DOFs----------------------------------------------------------------------------------------------------------------------------------------------- 131
File | Properties------------------------------------------------------------------------------------------------------------------------------------- 131 File | Options ---------------------------------------------------------------------------------------------------------------------------------------- 131
Display Tab--------------------------------------------------------------------------------------------------------------------------------------- 132 Animation Tab ----------------------------------------------------------------------------------------------------------------------------------- 132 Show/Hide Tab---------------------------------------------------------------------------------------------------------------------------------- 132 Reset Column Widths ------------------------------------------------------------------------------------------------------------------------- 132 Contour Colors Tab ---------------------------------------------------------------------------------------------------------------------------- 132
File | Close------------------------------------------------------------------------------------------------------------------------------------------- 133 Edit | Undo ------------------------------------------------------------------------------------------------------------------------------------------- 133 Edit | Redo ------------------------------------------------------------------------------------------------------------------------------------------- 133 Edit | Select Shapes------------------------------------------------------------------------------------------------------------------------------- 133 Edit | Sort Shapes --------------------------------------------------------------------------------------------------------------------------------- 133 Edit | Add a Shape--------------------------------------------------------------------------------------------------------------------------------- 133 Edit | Delete Selected Shapes------------------------------------------------------------------------------------------------------------------ 133 Edit | Select DOFs --------------------------------------------------------------------------------------------------------------------------------- 133
Edit | Select DOFs | By... --------------------------------------------------------------------------------------------------------------------- 134 Select By DOF----------------------------------------------------------------------------------------------------------------------------------- 134 Select By Roving DOF ------------------------------------------------------------------------------------------------------------------------ 134 Select By Reference DOF-------------------------------------------------------------------------------------------------------------------- 134 Select By Point ---------------------------------------------------------------------------------------------------------------------------------- 134 Select By Direction ----------------------------------------------------------------------------------------------------------------------------- 135 Select By Measurement Set ----------------------------------------------------------------------------------------------------------------- 135 Select By Roving DOF Only ----------------------------------------------------------------------------------------------------------------- 135 Select By Reference DOF Only------------------------------------------------------------------------------------------------------------- 135 Select By Data Type --------------------------------------------------------------------------------------------------------------------------- 135 Select By Measurement Type--------------------------------------------------------------------------------------------------------------- 135 Edit | Select DOFs | All, None, Invert------------------------------------------------------------------------------------------------------ 135
Edit | Sort DOFs------------------------------------------------------------------------------------------------------------------------------------ 135 Sort By DOF ------------------------------------------------------------------------------------------------------------------------------------- 136 Sort By Roving DOF --------------------------------------------------------------------------------------------------------------------------- 136 Sort By Reference DOF----------------------------------------------------------------------------------------------------------------------- 136 Sort By Point ------------------------------------------------------------------------------------------------------------------------------------- 137 Sort By Direction-------------------------------------------------------------------------------------------------------------------------------- 137 Sort By Measurement Set -------------------------------------------------------------------------------------------------------------------- 137 Sort By Roving DOF Only -------------------------------------------------------------------------------------------------------------------- 137 Sort By Reference DOF Only---------------------------------------------------------------------------------------------------------------- 137 Sort By Data Type------------------------------------------------------------------------------------------------------------------------------ 137 Sort By Measurement Type------------------------------------------------------------------------------------------------------------------ 137
Edit | Add DOFs ------------------------------------------------------------------------------------------------------------------------------------ 137 Edit | Delete Selected DOFs -------------------------------------------------------------------------------------------------------------------- 137 Display | Center ------------------------------------------------------------------------------------------------------------------------------------ 137 Display | Toolbars---------------------------------------------------------------------------------------------------------------------------------- 138 Display | Shapes ----------------------------------------------------------------------------------------------------------------------------------- 138
Magnitude / Phase ----------------------------------------------------------------------------------------------------------------------------- 138 Magnitude (dB) / Phase----------------------------------------------------------------------------------------------------------------------- 138 Magnitude ---------------------------------------------------------------------------------------------------------------------------------------- 138 Magnitude dB ------------------------------------------------------------------------------------------------------------------------------------ 138 Phase ---------------------------------------------------------------------------------------------------------------------------------------------- 138 Real / Imaginary--------------------------------------------------------------------------------------------------------------------------------- 139
Table Of Contents
xv
Real-------------------------------------------------------------------------------------------------------------------------------------------------139 Imaginary------------------------------------------------------------------------------------------------------------------------------------------139
Tools | Assign M#s---------------------------------------------------------------------------------------------------------------------------------139 Tools | Animate Shape----------------------------------------------------------------------------------------------------------------------------139
Sweep or Dwell ----------------------------------------------------------------------------------------------------------------------------------139 Dwell------------------------------------------------------------------------------------------------------------------------------------------------139 Which Data is Animated? ---------------------------------------------------------------------------------------------------------------------140 Selected M#'s ------------------------------------------------------------------------------------------------------------------------------------140 Multiple Reference DOFs ---------------------------------------------------------------------------------------------------------------------140 Terminating Animation-------------------------------------------------------------------------------------------------------------------------140
5. Picture Window Commands _________________________________________________________________ 141 Outlining ----------------------------------------------------------------------------------------------------------------------------------------------141 Commands-------------------------------------------------------------------------------------------------------------------------------------------142 File | Save --------------------------------------------------------------------------------------------------------------------------------------------142 File | Save In Project ------------------------------------------------------------------------------------------------------------------------------142 File | Copy Graphics to Clipboard--------------------------------------------------------------------------------------------------------------142 File | Print---------------------------------------------------------------------------------------------------------------------------------------------142 File | Close -------------------------------------------------------------------------------------------------------------------------------------------142 Display | Lock Aspect Ratio ---------------------------------------------------------------------------------------------------------------------142 Display | Zoom --------------------------------------------------------------------------------------------------------------------------------------142 Display | mooZ --------------------------------------------------------------------------------------------------------------------------------------143
6. Glossary _________________________________________________________________________________ 145
7. Index ____________________________________________________________________________________ 153

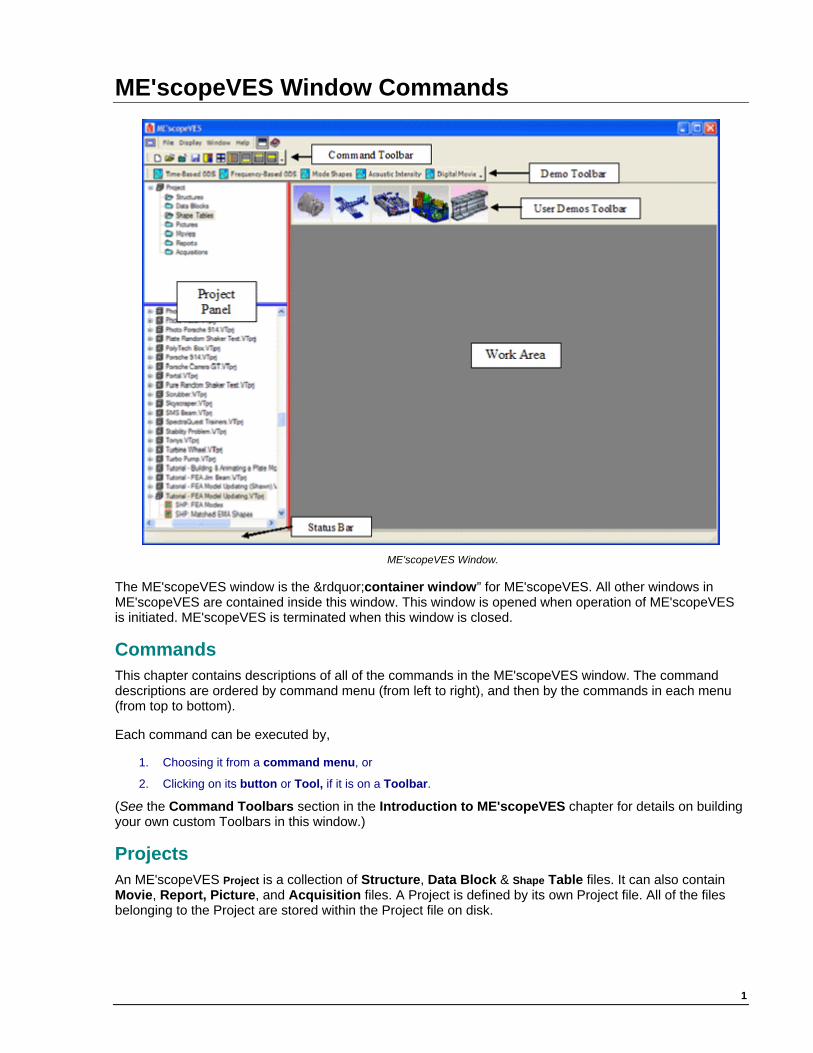
1
ME'scopeVES Window Commands
ME'scopeVES Window.
The ME'scopeVES window is the ”container window” for ME'scopeVES. All other windows in ME'scopeVES are contained inside this window. This window is opened when operation of ME'scopeVES is initiated. ME'scopeVES is terminated when this window is closed.
Commands This chapter contains descriptions of all of the commands in the ME'scopeVES window. The command descriptions are ordered by command menu (from left to right), and then by the commands in each menu (from top to bottom).
Each command can be executed by,
1. Choosing it from a command menu, or
2. Clicking on its button or Tool, if it is on a Toolbar.
(See the Command Toolbars section in the Introduction to ME'scopeVES chapter for details on building your own custom Toolbars in this window.)
Projects An ME'scopeVES Project is a collection of Structure, Data Block & Shape Table files. It can also contain Movie, Report, Picture, and Acquisition files. A Project is defined by its own Project file. All of the files belonging to the Project are stored within the Project file on disk.
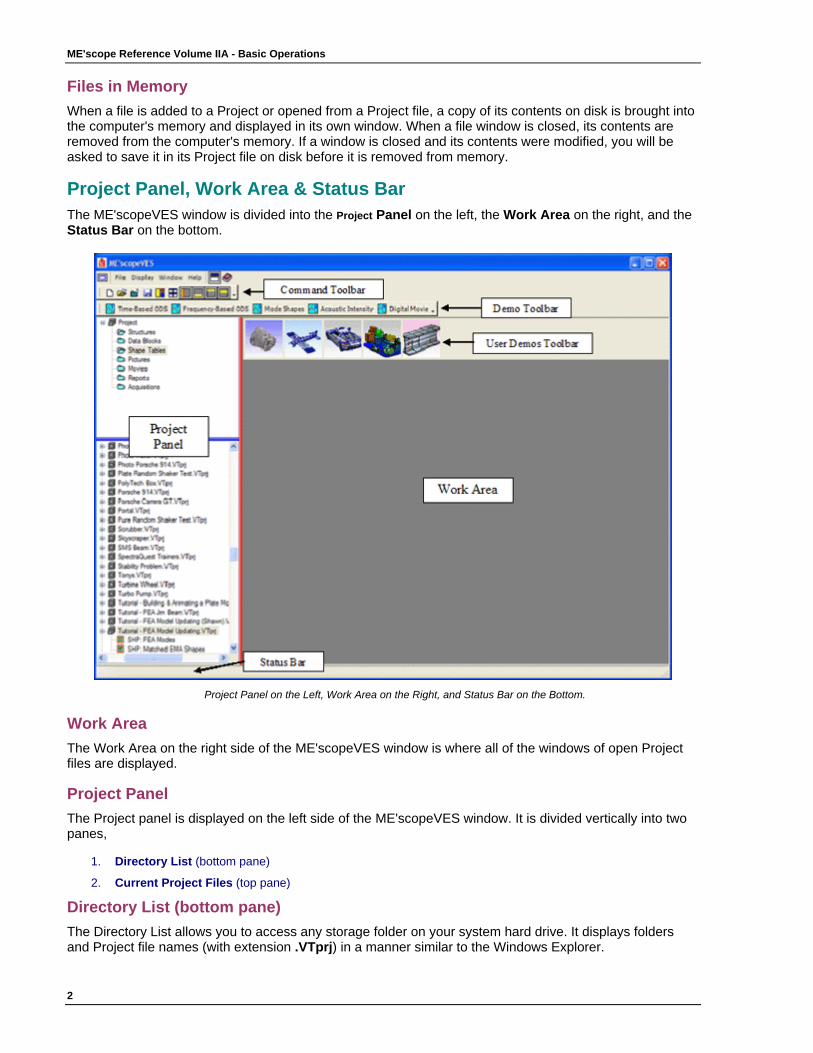
ME'scope Reference Volume IIA - Basic Operations
2
Files in Memory When a file is added to a Project or opened from a Project file, a copy of its contents on disk is brought into the computer's memory and displayed in its own window. When a file window is closed, its contents are removed from the computer's memory. If a window is closed and its contents were modified, you will be asked to save it in its Project file on disk before it is removed from memory.
Project Panel, Work Area & Status Bar The ME'scopeVES window is divided into the Project Panel on the left, the Work Area on the right, and the Status Bar on the bottom.
Project Panel on the Left, Work Area on the Right, and Status Bar on the Bottom.
Work Area The Work Area on the right side of the ME'scopeVES window is where all of the windows of open Project files are displayed.
Project Panel The Project panel is displayed on the left side of the ME'scopeVES window. It is divided vertically into two panes,
1. Directory List (bottom pane)
2. Current Project Files (top pane)
Directory List (bottom pane) The Directory List allows you to access any storage folder on your system hard drive. It displays folders and Project file names (with extension .VTprj) in a manner similar to the Windows Explorer.
ME'scopeVES Window Commands
3
Current Project Files (top pane) All of the files that are stored in the currently open Project are listed in the Current Project Files pane.
Resizing the Project Panel To change the width of the Project Panel,
• Drag the right edge horizontally of the Project Panel.
To change the size of each of the panes in the Project Panel,
• Drag the horizontal blue splitter bar vertically between the panes.
To hide or show the Project Panel,
• Execute Display | Project Panel or click on its Tool on the Toolbar.
Status Bar The Status Bar is where all status messages and helpful hints are displayed. To hide or show the Status Bar,
• Execute Display | Status Bar or click on its Tool on the Toolbar.
Opening a Project To open a previously saved Project,
1. Execute File | Project | Open in the ME'scopeVES window, or
2. Right click on the Project file name in the lower pane of the Project Panel, and select Open from the drop down menu.
3. Double click on the Project file name in the lower pane of the Project Panel, or drag it into the Work Area.
Last Four Opened Projects The last four saved Project files are listed in the bottom of the File menu in the ME'scopeVES window. Any one of these Projects can be opened by choosing it from the menu.
Adding a File to a Project To add a previously saved ME'scopeVES file to the current Project,
1. Execute one of the File | Import commands
2. Right click on the Project file name in the lower pane of the Project Panel, and select Add from the drop down menu.
3. Double click on the Project file name in the lower pane of the Project Panel, or drag it into the Work Area.
Opening a File Window To open the window of a file that has been closed in the current Project,
1. Double click on it in the Upper pane of the Project Panel, or
2. Right click on it in the Upper pane and select Open from the drop down menu, or
3. Right click on it in the Lower pane and select Add from the drop down menu.
File | Project | New This command creates a new (empty) Project file. When the new Project is created, all of the data files in the current Project window are removed from memory, and the new Project is initiated with a default name.
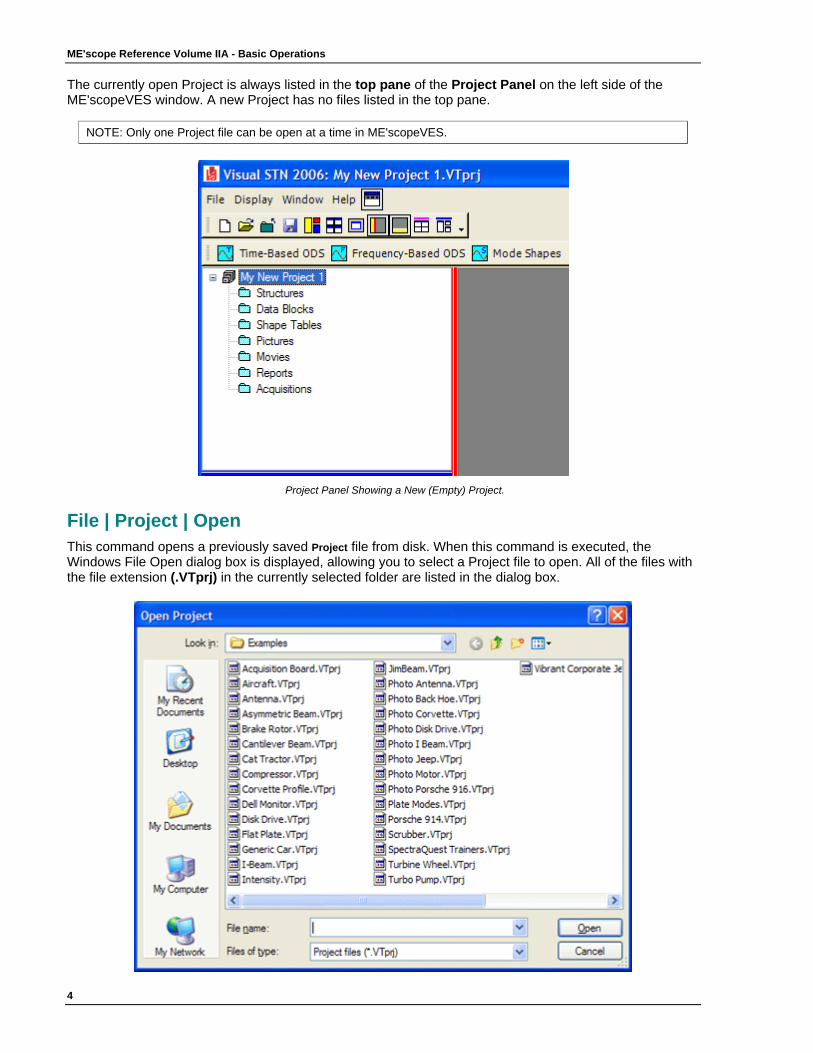
ME'scope Reference Volume IIA - Basic Operations
4
The currently open Project is always listed in the top pane of the Project Panel on the left side of the ME'scopeVES window. A new Project has no files listed in the top pane.
NOTE: Only one Project file can be open at a time in ME'scopeVES.
Project Panel Showing a New (Empty) Project.
File | Project | Open This command opens a previously saved Project file from disk. When this command is executed, the Windows File Open dialog box is displayed, allowing you to select a Project file to open. All of the files with the file extension (.VTprj) in the currently selected folder are listed in the dialog box.
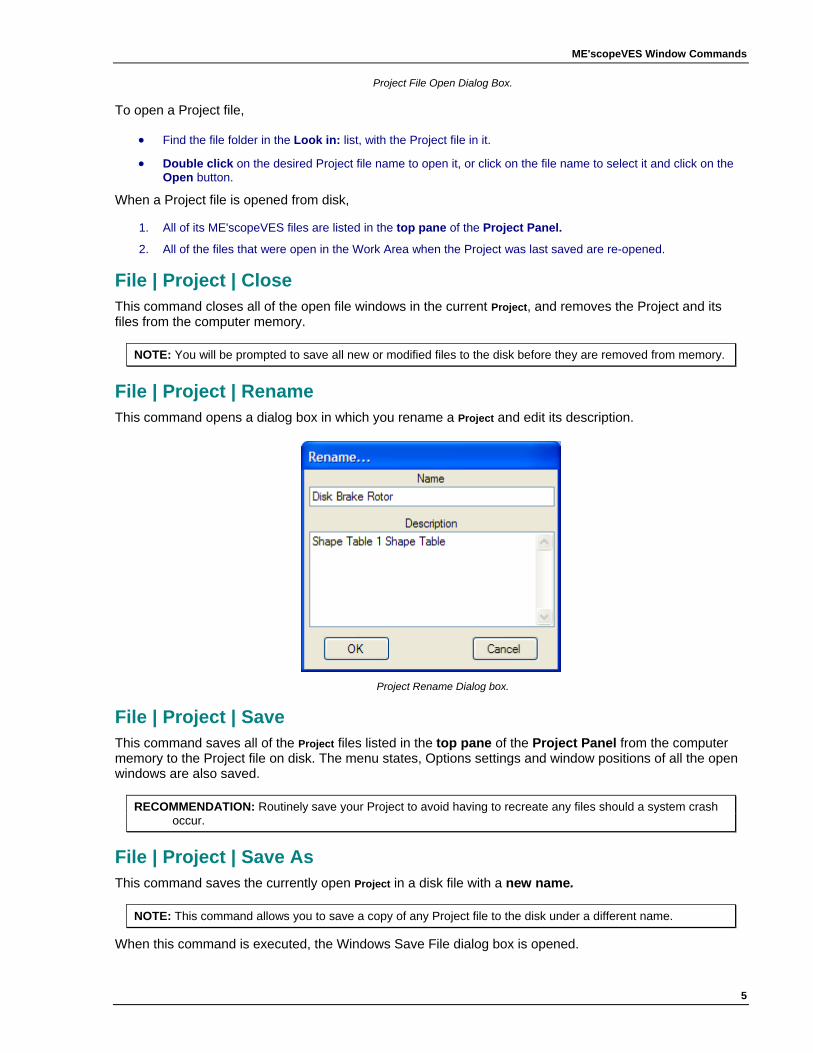
ME'scopeVES Window Commands
5
Project File Open Dialog Box.
To open a Project file,
• Find the file folder in the Look in: list, with the Project file in it.
• Double click on the desired Project file name to open it, or click on the file name to select it and click on the Open button.
When a Project file is opened from disk,
1. All of its ME'scopeVES files are listed in the top pane of the Project Panel.
2. All of the files that were open in the Work Area when the Project was last saved are re-opened.
File | Project | Close This command closes all of the open file windows in the current Project, and removes the Project and its files from the computer memory.
NOTE: You will be prompted to save all new or modified files to the disk before they are removed from memory.
File | Project | Rename This command opens a dialog box in which you rename a Project and edit its description.
Project Rename Dialog box.
File | Project | Save This command saves all of the Project files listed in the top pane of the Project Panel from the computer memory to the Project file on disk. The menu states, Options settings and window positions of all the open windows are also saved.
RECOMMENDATION: Routinely save your Project to avoid having to recreate any files should a system crash occur.
File | Project | Save As This command saves the currently open Project in a disk file with a new name.
NOTE: This command allows you to save a copy of any Project file to the disk under a different name.
When this command is executed, the Windows Save File dialog box is opened.
ME'scope Reference Volume IIA - Basic Operations
6
Project Save As Dialog Box.
All of the files with the file extension (.VTprj) in the currently selected folder are listed in the dialog box. To change the file name,
• Type the desired name for the Project file into the File name box.
• Click on the Save button to save the Project.
NOTE: You will be prompted to save all of the files in the current Project that are new or have been modified since they were last saved.
File | Project | Save As User Demo This command saves the currently open Project as a User Demo Project in the User Demo folder on disk. All User Demo Projects are displayed on the User Demos Toolbar at the top of the Work Area in the ME'scopeVES window. Each User Demo is displayed on the User Demos Toolbar as a thumbnail picture of the first Structure file in that Project.
NOTE: This command stores a copy of the currently open Project file into the User Demo folder on disk.
Rename and Delete To rename a User Demo Project or delete it from the User Demo folder,
• Right click on the User Demo picture and execute the Rename or Delete command from the drop down menu.
When this command is executed, the Demo Project picture is displayed on the User Demos Toolbar at the top of the Work Area as shown below.
ME'scopeVES Window Commands
7
ME''scope Window Showing User Demo Toolbar.
• Click on a User Demo Project thumbnail to open the Demo Project and begin animation using the animation settings that were last used when the Project was saved.
File | Project | Open Library This command opens the Structure model Library Project file.
NOTE: The Library Project file contains all of the Structure files that have been saved in the Library by executing the File | Save in Library command in a Structure window. The Library Project is saved in a special folder on disk, and cannot be opened from the Project Panel, or by executing the File | Project | Open command.
File | New | Structure This command creates a new Structure file, adds it to the current Project, and opens an empty Structure window for the new file. Normally, this command is used to begin drawing a new 3D structure model or part of a model (a SubStructure). When this command is executed, an empty Structure window will open with the file name in the Title Bar.
Default Name and Rename When each new Structure file is created, it is given a default name (Structure X, X=0,1,2, ), which is shown in the Title Bar of its window. To rename a Structure file,
• Right click on the file in the Project Panel and execute Rename from the drop down menu.
File | New | Data Block This command creates a new Data Block file and adds it to the current Project.
ME'scope Reference Volume IIA - Basic Operations
8
NOTE: Every Data Block file must have at least one Trace in it. This command is useful for creating Data Blocks with synthesized data in them in order to exercise other commands such as the FFT, curve fitting, etc.
When this command is executed, a dialog box will open allowing you to choose one of several different types of synthesized time waveforms to put into the new Data Block.
Synthesize Time Traces Dialog Box.
To create a new Data Block file,
• Enter the desired Time Axis & Frequency Axis parameters.
• Enter parameters into the Sinusoidal, Random, Chirp or Impact tab.
• Click on OK.
A new Data Block window will open showing the synthesized Traces.
Time Axis
The time axis parameters have the following meanings,
• Block Size (N): number of Samples per Trace.
ME'scopeVES Window Commands
9
• Ending Value (T): ending time of the Data Block time axis, in seconds.
• Resolution (delta t): time increment of the Data Block time axis, in seconds.
• Pre-Trigger Delay (Samples): Adds zero valued samples to the beginning of each Sampling Window.
• Number of Averages: Used for Spectrum Averaging. Number of Averages = the number of Sampling Windows. Interprets Number of Samples as the samples in a Sampling Window.
Samples per Trace = (Number of Averages) x (Number of Samples).
Frequency Axis
The frequency axis parameters have the following meanings,
• Block Size (N/2): number of Lines per Trace.
• Ending Value (Fmax): ending frequency of the Data Block frequency axis, in Hertz.
• Resolution (delta f): frequency increment of the Data Block frequency axis, in Hertz.
• Sample Rate (Samples/Second): Always equal to twice the value of Fmax.
NOTE: The maximum frequency (Fmax) and the Time Step are related to one another. Therefore, whenever either parameter is changed, the other parameter will also be changed according to the formula: Fmax = 1 / (2 x Time Step), or Sample Rate = 2Fmax.
Sinusoidal Tab
When this Tab is active (displayed on top of the other tabs), a new Data Block with sinusoidal Traces will be created. The parameters on the Sinusoidal tab have the following meanings,
• Number of Frequencies : number of rows in the sine wave spreadsheet, for entry of sinusoidal frequencies, (modal) damping, magnitude & phase.
• Number of Traces: number of Traces to be synthesized.
• Frequency (Hz): sinusoidal frequencies are entered in this column of the spreadsheet.
• Damping (%): the percentage of critical damping (decay) for each mode is entered in this column. Enter 0 for no damping. Enter non-zero damping (0<damping<100) to synthesize an Impulse Response Function (IRF).
• Magnitude: the sinusoidal magnitude is entered in this column.
• Phase (degrees): the sinusoidal phase is entered in this column
NOTE: When (Number of Traces =1), you can enter a magnitude & phase. When (Number of Traces >1), magnitudes & phases are randomly generated for all Traces
Random Tab
When this Tab is active (displayed on top of the other tabs), a new Data Block with random signal Traces will be created. The parameters on the Random tab have the following meanings,
• Number of Traces: number of Traces to be synthesized.
• Magnitude: All Traces are synthesized with this magnitude, and a random phase.
• Burst Random Width (%): Width of the non-zero random signal as a percentage of each Sampling Window. Used to make random response signals periodic in the Sampling Window.
Chirp Tab
When this Tab is active (displayed on top of the other tabs), a new Data Block with chirp (swept sine) Traces will be created. The parameters on the Chirp tab have the following meanings,
• Number of Traces: number of Traces to be synthesized.
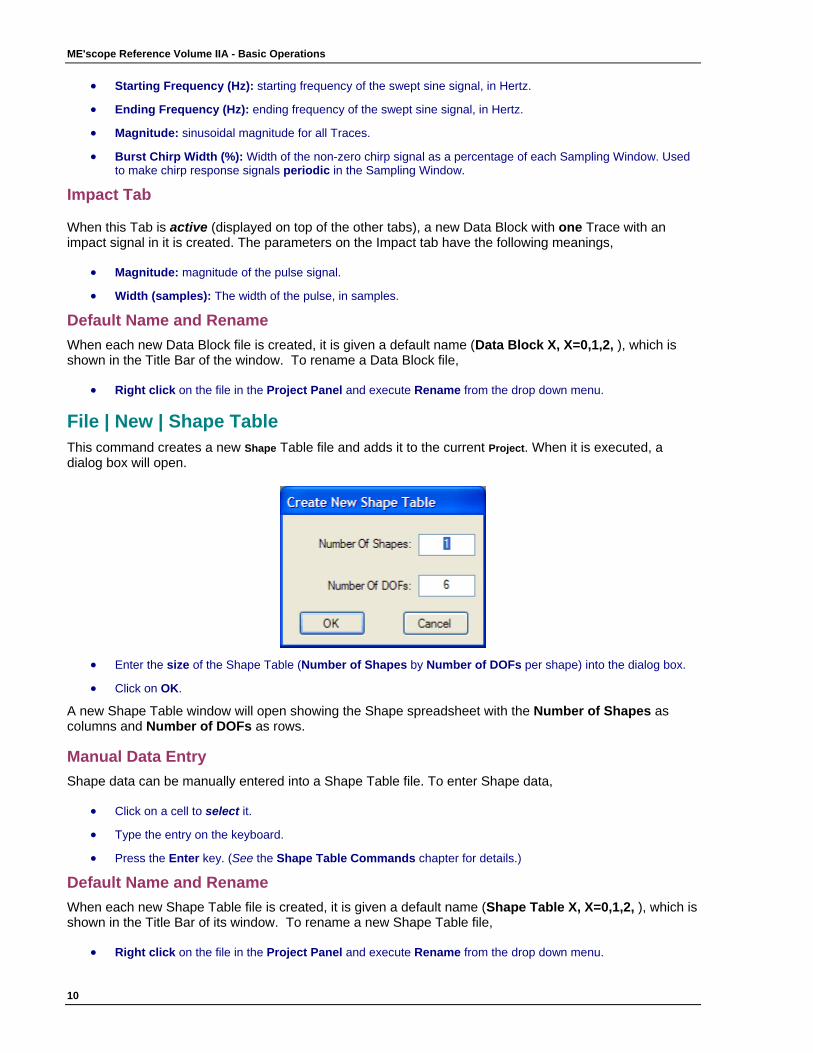
ME'scope Reference Volume IIA - Basic Operations
10
• Starting Frequency (Hz): starting frequency of the swept sine signal, in Hertz.
• Ending Frequency (Hz): ending frequency of the swept sine signal, in Hertz.
• Magnitude: sinusoidal magnitude for all Traces.
• Burst Chirp Width (%): Width of the non-zero chirp signal as a percentage of each Sampling Window. Used to make chirp response signals periodic in the Sampling Window.
Impact Tab
When this Tab is active (displayed on top of the other tabs), a new Data Block with one Trace with an impact signal in it is created. The parameters on the Impact tab have the following meanings,
• Magnitude: magnitude of the pulse signal.
• Width (samples): The width of the pulse, in samples.
Default Name and Rename When each new Data Block file is created, it is given a default name (Data Block X, X=0,1,2, ), which is shown in the Title Bar of the window. To rename a Data Block file,
• Right click on the file in the Project Panel and execute Rename from the drop down menu.
File | New | Shape Table This command creates a new Shape Table file and adds it to the current Project. When it is executed, a dialog box will open.
• Enter the size of the Shape Table (Number of Shapes by Number of DOFs per shape) into the dialog box.
• Click on OK.
A new Shape Table window will open showing the Shape spreadsheet with the Number of Shapes as columns and Number of DOFs as rows.
Manual Data Entry Shape data can be manually entered into a Shape Table file. To enter Shape data,
• Click on a cell to select it.
• Type the entry on the keyboard.
• Press the Enter key. (See the Shape Table Commands chapter for details.)
Default Name and Rename When each new Shape Table file is created, it is given a default name (Shape Table X, X=0,1,2, ), which is shown in the Title Bar of its window. To rename a new Shape Table file,
• Right click on the file in the Project Panel and execute Rename from the drop down menu.
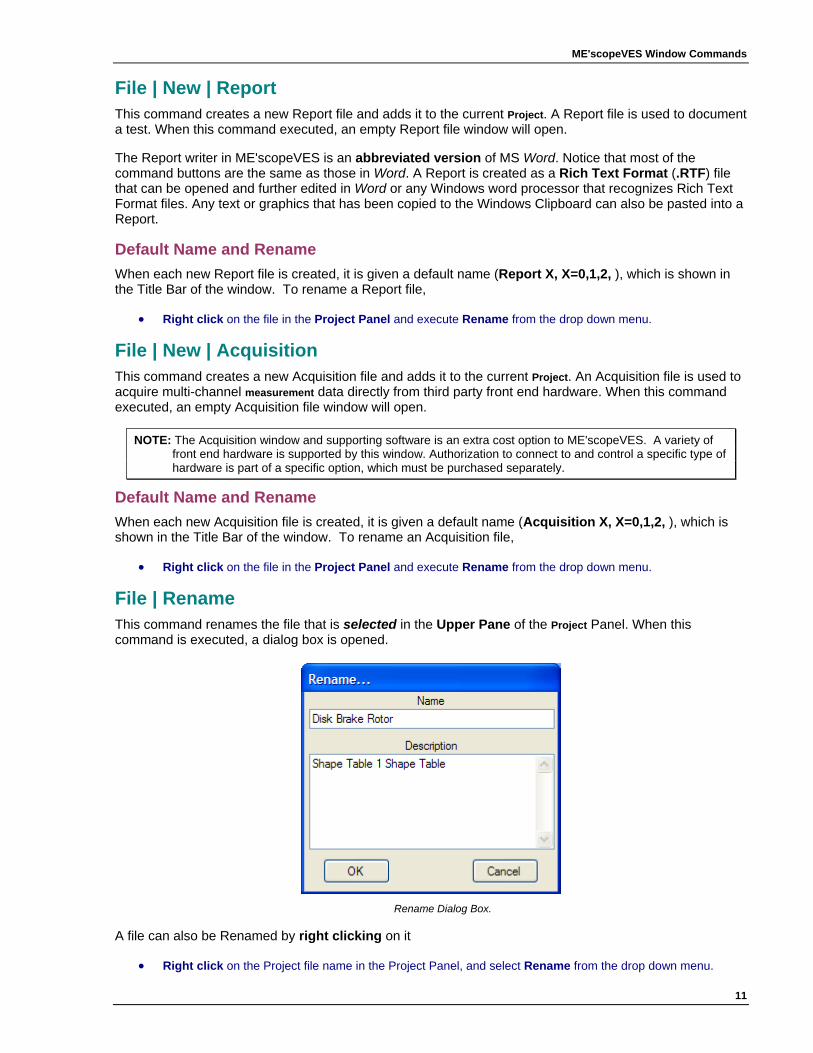
ME'scopeVES Window Commands
11
File | New | Report This command creates a new Report file and adds it to the current Project. A Report file is used to document a test. When this command executed, an empty Report file window will open.
The Report writer in ME'scopeVES is an abbreviated version of MS Word. Notice that most of the command buttons are the same as those in Word. A Report is created as a Rich Text Format (.RTF) file that can be opened and further edited in Word or any Windows word processor that recognizes Rich Text Format files. Any text or graphics that has been copied to the Windows Clipboard can also be pasted into a Report.
Default Name and Rename When each new Report file is created, it is given a default name (Report X, X=0,1,2, ), which is shown in the Title Bar of the window. To rename a Report file,
• Right click on the file in the Project Panel and execute Rename from the drop down menu.
File | New | Acquisition This command creates a new Acquisition file and adds it to the current Project. An Acquisition file is used to acquire multi-channel measurement data directly from third party front end hardware. When this command executed, an empty Acquisition file window will open.
NOTE: The Acquisition window and supporting software is an extra cost option to ME'scopeVES. A variety of front end hardware is supported by this window. Authorization to connect to and control a specific type of hardware is part of a specific option, which must be purchased separately.
Default Name and Rename When each new Acquisition file is created, it is given a default name (Acquisition X, X=0,1,2, ), which is shown in the Title Bar of the window. To rename an Acquisition file,
• Right click on the file in the Project Panel and execute Rename from the drop down menu.
File | Rename This command renames the file that is selected in the Upper Pane of the Project Panel. When this command is executed, a dialog box is opened.
Rename Dialog Box.
A file can also be Renamed by right clicking on it
• Right click on the Project file name in the Project Panel, and select Rename from the drop down menu.
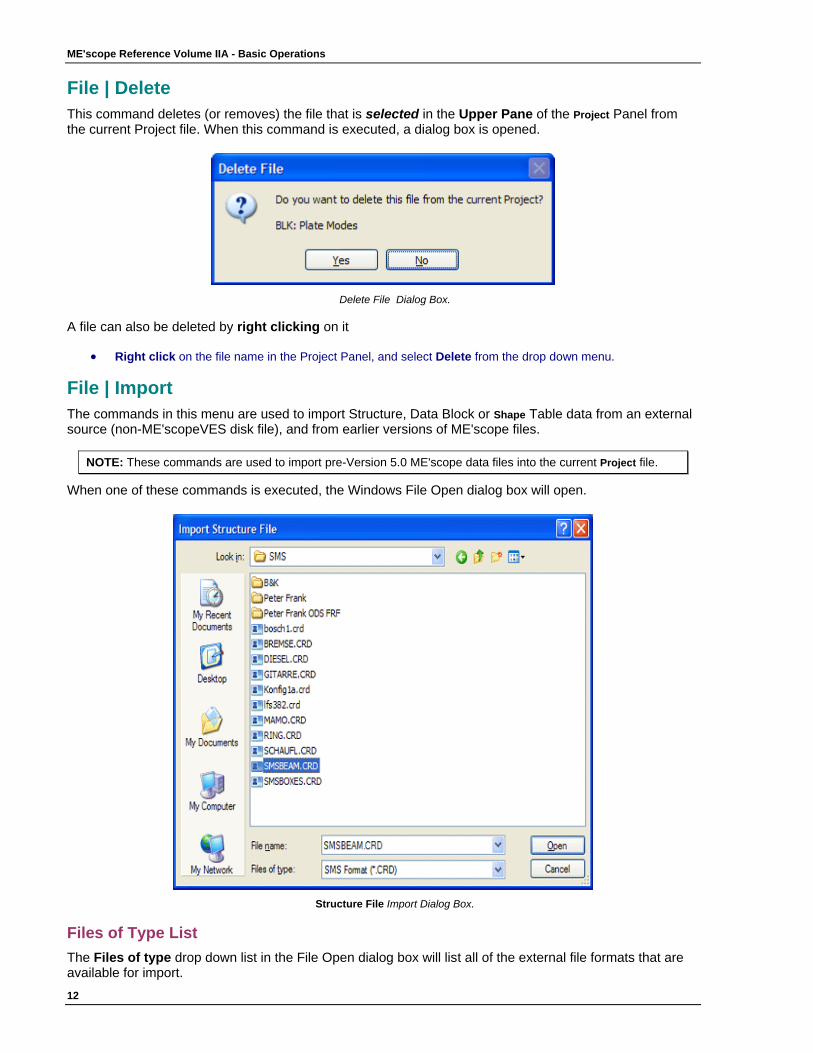
ME'scope Reference Volume IIA - Basic Operations
12
File | Delete This command deletes (or removes) the file that is selected in the Upper Pane of the Project Panel from the current Project file. When this command is executed, a dialog box is opened.
Delete File Dialog Box.
A file can also be deleted by right clicking on it
• Right click on the file name in the Project Panel, and select Delete from the drop down menu.
File | Import The commands in this menu are used to import Structure, Data Block or Shape Table data from an external source (non-ME'scopeVES disk file), and from earlier versions of ME'scope files.
NOTE: These commands are used to import pre-Version 5.0 ME'scope data files into the current Project file.
When one of these commands is executed, the Windows File Open dialog box will open.
Structure File Import Dialog Box.
Files of Type List The Files of type drop down list in the File Open dialog box will list all of the external file formats that are available for import.

ME'scopeVES Window Commands
13
NOTE: The Import command will only import files of the type chosen from the Files of type drop down list.
• Choose the appropriate external file format from the Files of Type list in the dialog box.
All of the external files in the current folder of the type you chose will be listed in the dialog box.
Different File Extensions If the external files you wish to import have different file extensions than the extensions listed in Files of Type,
• Enter ( *.* ) into the File Name box to list all of the files in the current folder.
All of the files in the current folder will be listed. To open a file and begin translating it,
• Double click on the file name, or click on it to select it and click on Open.
File | Import | Structure This command imports Structure data from one or more third party disk files into the current Project file. After the data has been imported, it is put into an ME'scopeVES Structure (STR) file within the current Project, and need not be imported again. When this command is executed, the Windows File Open dialog box will open, as shown below,
Windows Open File Dialog Box Showing a Structure File Selected.
• Choose the appropriate external file format from the Files of Type list in the Windows Open file dialog.
NOTE: The Files of Type list contains the names of all of the third party Structure file formats that can be imported into an ME'scopeVES Structure file.
• Select a file to import, and click on Open to import it
A new Structure window will open showing the imported structure model.

ME'scope Reference Volume IIA - Basic Operations
14
File | Import | Data Block This command imports time or frequency domain measurements from one or more third party disk data files using the File | Import | Data Block command. After the data has been imported, it is saved in a Data Block (BLK) file in the current Project, and need not be imported again. When this command is executed, the Windows Open dialog box will open, as shown below.
Windows Open Dialog Box Showing Multiple Files Selected.
• Choose the appropriate external file format from the Files of Type list in the dialog box. All of the files in the current folder of the type you chose will be listed in the dialog box.
NOTE: The Files of Type list contains the names of all of the third party Data Block file formats that can be imported into an ME'scopeVES Data Block.
Different File Extensions If the external files you wish to import have different file extensions than the extensions listed in Files of Type,
• Enter ( *.* ) into the File Name box to list all of the files in the current folder.
Selecting Multiple Files Some analyzers and data acquisition systems save only one measurement per disk file. Multiple files can be imported together and put into one Data Block by holding down either the Shift or Ctrl key while selecting multiple files in the Windows Open dialog box.
NOTE: In order to display ODS's in animation directly from a set of measurement data, all of the measurements must be contained in the same Data Block file. You can use this command to import multiple ME'scope (.BLK) or (.BLS) files so that all of your measurements are contained in one Data Block file.
• Hold down the Shift to select a range of multiple file names listed in the Windows Open dialog box.
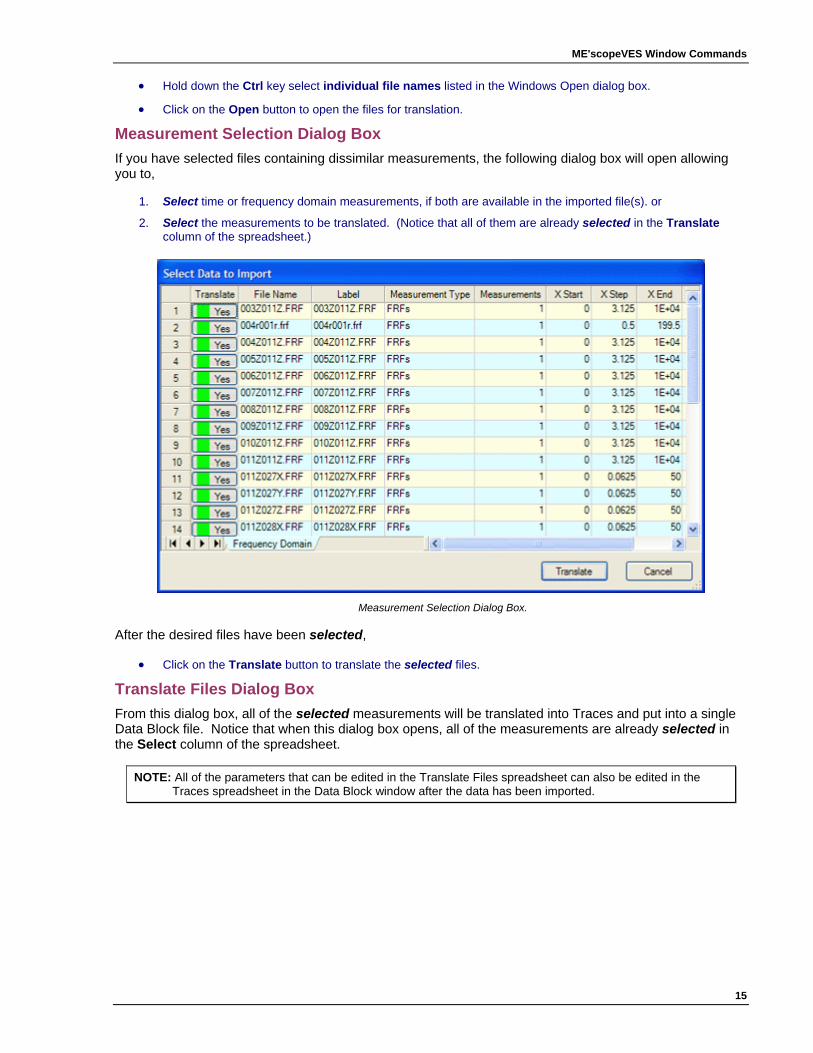
ME'scopeVES Window Commands
15
• Hold down the Ctrl key select individual file names listed in the Windows Open dialog box.
• Click on the Open button to open the files for translation.
Measurement Selection Dialog Box If you have selected files containing dissimilar measurements, the following dialog box will open allowing you to,
1. Select time or frequency domain measurements, if both are available in the imported file(s). or
2. Select the measurements to be translated. (Notice that all of them are already selected in the Translate column of the spreadsheet.)
Measurement Selection Dialog Box.
After the desired files have been selected,
• Click on the Translate button to translate the selected files.
Translate Files Dialog Box From this dialog box, all of the selected measurements will be translated into Traces and put into a single Data Block file. Notice that when this dialog box opens, all of the measurements are already selected in the Select column of the spreadsheet.
NOTE: All of the parameters that can be edited in the Translate Files spreadsheet can also be edited in the Traces spreadsheet in the Data Block window after the data has been imported.
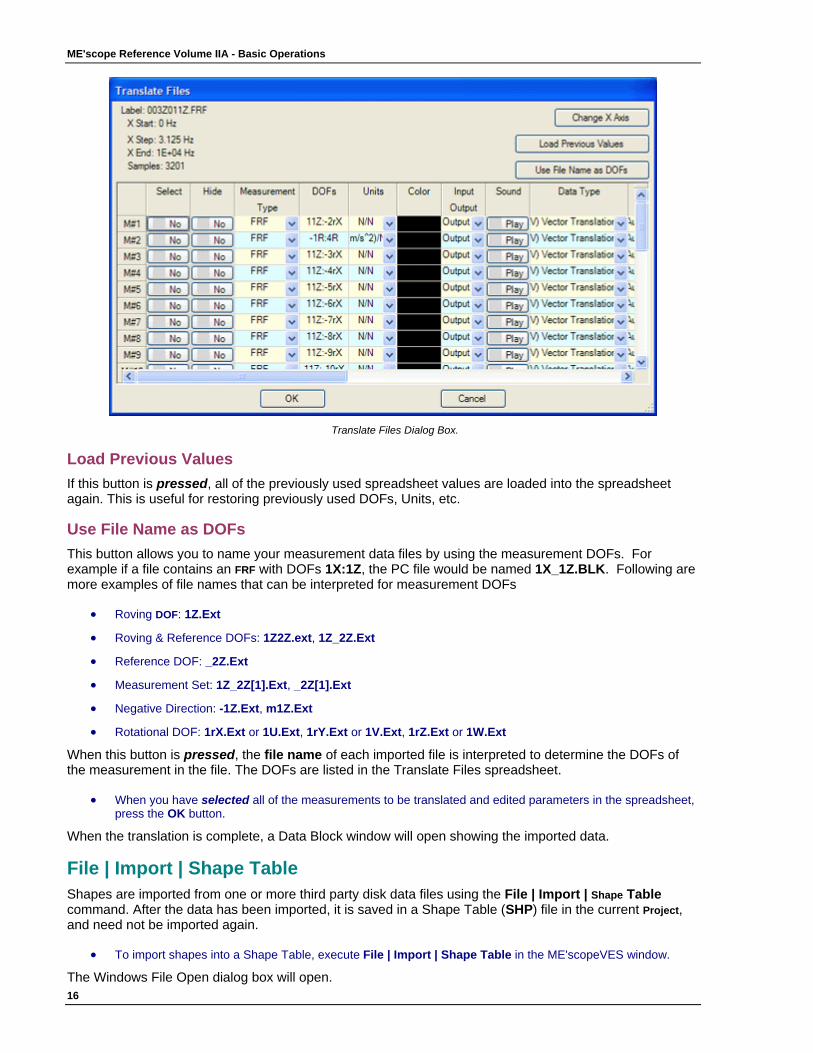
ME'scope Reference Volume IIA - Basic Operations
16
Translate Files Dialog Box.
Load Previous Values If this button is pressed, all of the previously used spreadsheet values are loaded into the spreadsheet again. This is useful for restoring previously used DOFs, Units, etc.
Use File Name as DOFs This button allows you to name your measurement data files by using the measurement DOFs. For example if a file contains an FRF with DOFs 1X:1Z, the PC file would be named 1X_1Z.BLK. Following are more examples of file names that can be interpreted for measurement DOFs
• Roving DOF: 1Z.Ext
• Roving & Reference DOFs: 1Z2Z.ext, 1Z_2Z.Ext
• Reference DOF: _2Z.Ext
• Measurement Set: 1Z_2Z[1].Ext, _2Z[1].Ext
• Negative Direction: -1Z.Ext, m1Z.Ext
• Rotational DOF: 1rX.Ext or 1U.Ext, 1rY.Ext or 1V.Ext, 1rZ.Ext or 1W.Ext
When this button is pressed, the file name of each imported file is interpreted to determine the DOFs of the measurement in the file. The DOFs are listed in the Translate Files spreadsheet.
• When you have selected all of the measurements to be translated and edited parameters in the spreadsheet, press the OK button.
When the translation is complete, a Data Block window will open showing the imported data.
File | Import | Shape Table Shapes are imported from one or more third party disk data files using the File | Import | Shape Table command. After the data has been imported, it is saved in a Shape Table (SHP) file in the current Project, and need not be imported again.
• To import shapes into a Shape Table, execute File | Import | Shape Table in the ME'scopeVES window.
The Windows File Open dialog box will open.

ME'scopeVES Window Commands
17
• Choose the appropriate external file format from the Files of Type list in the Windows Open file dialog.
NOTE: The Files of Type list contains the names of all of the external file formats that can be imported into an ME'scopeVES Shape Table.
• Select the external file, and click on Open to import it.
A new Shape Table window will open displaying the imported shape data.
File | Import | Project This command imports a pre-Version 5.0 ME'scope Project file and all of the data files referenced by it. After the data has been imported, it is put into a new Version 5.0 ME'scope Project file, and need not be imported again. When this command is executed, the Windows File Open dialog box will open.
• The pre-Version 5.0 ME'scope Project file extension (.PRJ) will be displayed in the Files of Type list in the Windows Open File dialog box.
• Select the Project file, and click on Open to import it.
A new Project file will open showing the imported data.
File | Import | Add This command imports data of any recognized type (Structure, Data Block, Shape, Report, Movie, Picture, or Acquisition) from one or more external disk files into the current Project file. After the data has been imported, it is added to the current Project, and need not be imported again. When this command is executed, the Windows File Open dialog box will open.
• Choose the appropriate external file format from the Files of Type list in the Windows Open file dialog.
• Double click on the file name, or click on it to select it and click on Open.
A new Structure window will open showing the imported data.
Importing ASCII Text Spreadsheet Files Many third party software packages can export data in an ASCII text spreadsheet format. ME'scopeVES can also import and export its data files in ASCII text spreadsheet formats. Structure, Data Block and Shape Tables can each be imported from ASCII text spreadsheet files.
The ME'scopeVES Import commands expect to read ASCII text spreadsheet data in the following format;
1. Special header information that identifies the data in the file, followed by
2. Columns of data separated by delimiters such as commas or tab characters.
Creating a File Template To view the header and column formats that the Import commands expect to read, export a Structure (STR), Data Block (BLK), or Shape Table (SHP) file in ASCII text spreadsheet format and open it in a text processor (such as MS Word) or a spreadsheet program (such as MS Excel).
• Open any Project that contains a Structure (STR), Data Block (BLK), or Shape Table (SHP) file.
• Execute File | Export in the appropriate file window to export the file in ASCII text spreadsheet format.
NOTE: When files are exported in ASCII spreadsheet format, they are given different file extensions; (.STS) for Structure, (.BLS) for Data Block, and (.SHS) for Shape Table files.
To attach the correct header information to a third party text file,
• Open the (.STS), (.BLS), or (.SHS) file in a spreadsheet or word processor.
• Open the third party ASCII text spreadsheet file into the same spreadsheet or word processor.

ME'scope Reference Volume IIA - Basic Operations
18
• Paste the columns of data from the third party spreadsheet file into the (.STS), (.BLS), or (.SHS) file.
• Edit the header information in the (.STS), (.BLS), or (.SHS) file as required to describe the data in the external file.
• Save the ASCII text file to disk.
• Execute one of the File | Import commands in the ME'scopeVES window to import the ASCII text file.
(See Importing a (Structure, Data Block, or Shape Table) in Spreadsheet Format in their respective Window Command chapters for more details.)
Importing From a UFF File The Universal File Format (UFF) is commonly used for exchanging data between different structural analysis applications. ME'scopeVES can import & export data in the UFF format. Structure models, measurements, and shapes can be stored in a UFF file. The most common UFF file format stores everything as ASCII text. Measurements can also be stored in a binary UFF data format.
UFF Format To observe the ASCII text UFF format,
• Execute File | Export in any Structure, Data Block or Shape Table window. The Export File dialog box will open.
• Choose ASCII Universal File Format in the Save as type list, and click on Save.
• Open the UFF file in a text processor.
NOTE: Each line of data in a UFF file is arranged in fixed field format. This means that all of the characters on each line must be precisely in the correct columns to be readable.
Each UFF data type is stored as a data set. Each UFF data set begins and ends with a "-1" line. Each UFF data set also has an identification number, which is on the second line of the data set. ME'scopeVES can import and export the following numbered data sets,
UFF Data Set Number Type of Data 15 Points 82 Lines 55 Shapes 58 Measurement Traces
In UFF terminology, Points are called Grid Points, Lines are called Trace Lines, and mode shapes are called Functions at Nodal DOFs. Imported Point and Line data is put into a Structure file. Imported mode shape data is put into a Shape file. The imported Structure and Shape files are added to the current Project and their new file names are displayed in the Project window. To import a structure or mode shapes from a UFF file,
• Execute File | Import | Structure or Shape Table in the ME'scopeVES window.
• A dialog box will open, allowing you to rename the imported file. Enter a name, or click on OK to accept the default name.
Next, the Windows Open File dialog box will open, allowing you to select the UFF disk file to import.
• Choose ASCII UFF from the Files of type drop down list.
To open a file and begin translating it,
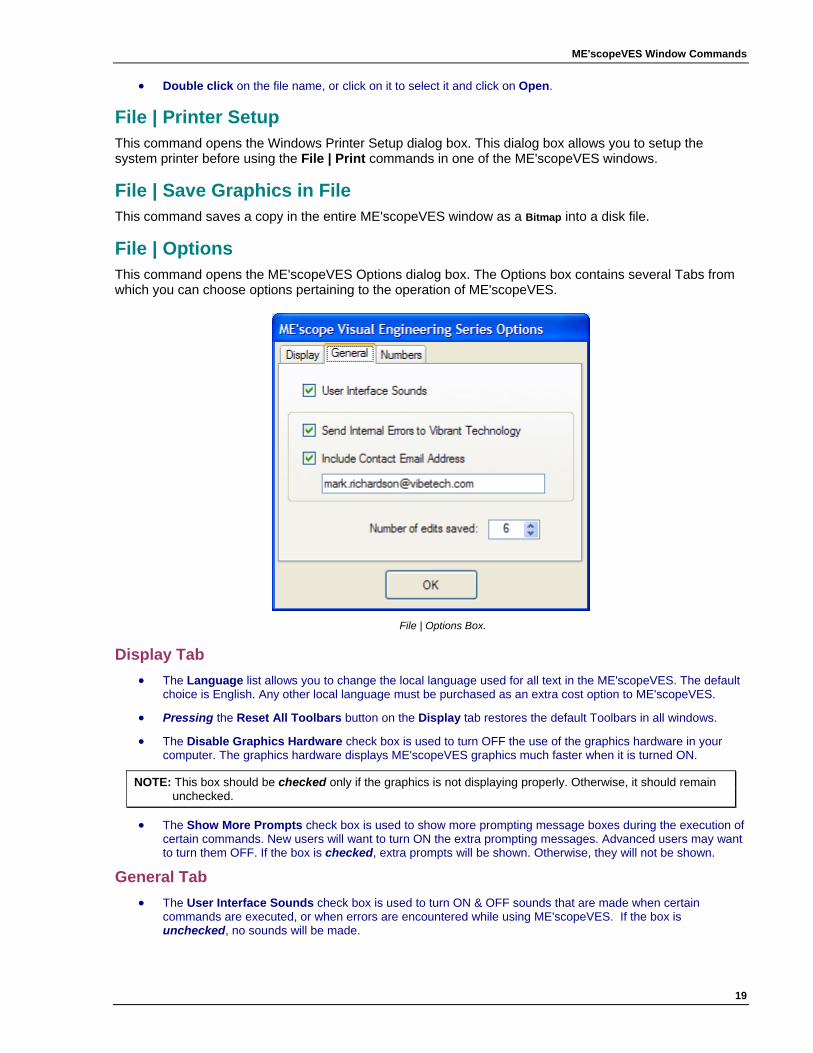
ME'scopeVES Window Commands
19
• Double click on the file name, or click on it to select it and click on Open.
File | Printer Setup This command opens the Windows Printer Setup dialog box. This dialog box allows you to setup the system printer before using the File | Print commands in one of the ME'scopeVES windows.
File | Save Graphics in File This command saves a copy in the entire ME'scopeVES window as a Bitmap into a disk file.
File | Options This command opens the ME'scopeVES Options dialog box. The Options box contains several Tabs from which you can choose options pertaining to the operation of ME'scopeVES.
File | Options Box.
Display Tab • The Language list allows you to change the local language used for all text in the ME'scopeVES. The default
choice is English. Any other local language must be purchased as an extra cost option to ME'scopeVES.
• Pressing the Reset All Toolbars button on the Display tab restores the default Toolbars in all windows.
• The Disable Graphics Hardware check box is used to turn OFF the use of the graphics hardware in your computer. The graphics hardware displays ME'scopeVES graphics much faster when it is turned ON.
NOTE: This box should be checked only if the graphics is not displaying properly. Otherwise, it should remain unchecked.
• The Show More Prompts check box is used to show more prompting message boxes during the execution of certain commands. New users will want to turn ON the extra prompting messages. Advanced users may want to turn them OFF. If the box is checked, extra prompts will be shown. Otherwise, they will not be shown.
General Tab • The User Interface Sounds check box is used to turn ON & OFF sounds that are made when certain
commands are executed, or when errors are encountered while using ME'scopeVES. If the box is unchecked, no sounds will be made.
ME'scope Reference Volume IIA - Basic Operations
20
• The Send Internal Errors to Vibrant Technology check box is used to turn ON & OFF sending the error log file to Vibrant Technology. (Use also include your email address by checking the Include Contact Email Address box and entering you email address below it.)
If an internal error occurs while ME’scopeVES is running, the error is logged into a file on your disk drive. Then, if your computer is connected to the Internet when you stop running ME’scopeVES, the errors in your log file will automatically be sent to a special Vibrant Internet log file. Bugs can be fixed more quickly when error reports are sent directly to Vibrant Technology when they are encountered by ME’scope users worldwide.
• The Number of Edits Saved box allows you to specify the number of edits that will be saved during editing operations in ME'scopeVES. Previous edits can be recovered by executing Edit | Undo in a window. Each time Edit | Undo is executed, a previous edit of the data is restored, up to the number of edits saved in memory.
Numbers Tab On this tab, you can specify the maximum number of digits used to display numbers in all windows.
File | Exit This command terminates the operation of ME'scopeVES.
NOTE: If any files in a Project are new or have been modified since they were last saved, you will be prompted to save them before exiting.
Display Menu The commands in this menu are used for showing or hiding Toolbars, the Project Panel, or the Status Bar in the ME'scopeVES window.
Toolbars This command shows or hides all of the command Toolbars in the ME'scopeVES window.
Status Bar This command shows or hides the Status Bar at the bottom of the ME'scopeVES window.
Project Panel This command shows or hides the Project Panel on the left side of the ME'scopeVES window.
Demo Toolbar This command shows or hides the Demos Toolbar in the ME'scopeVES window.
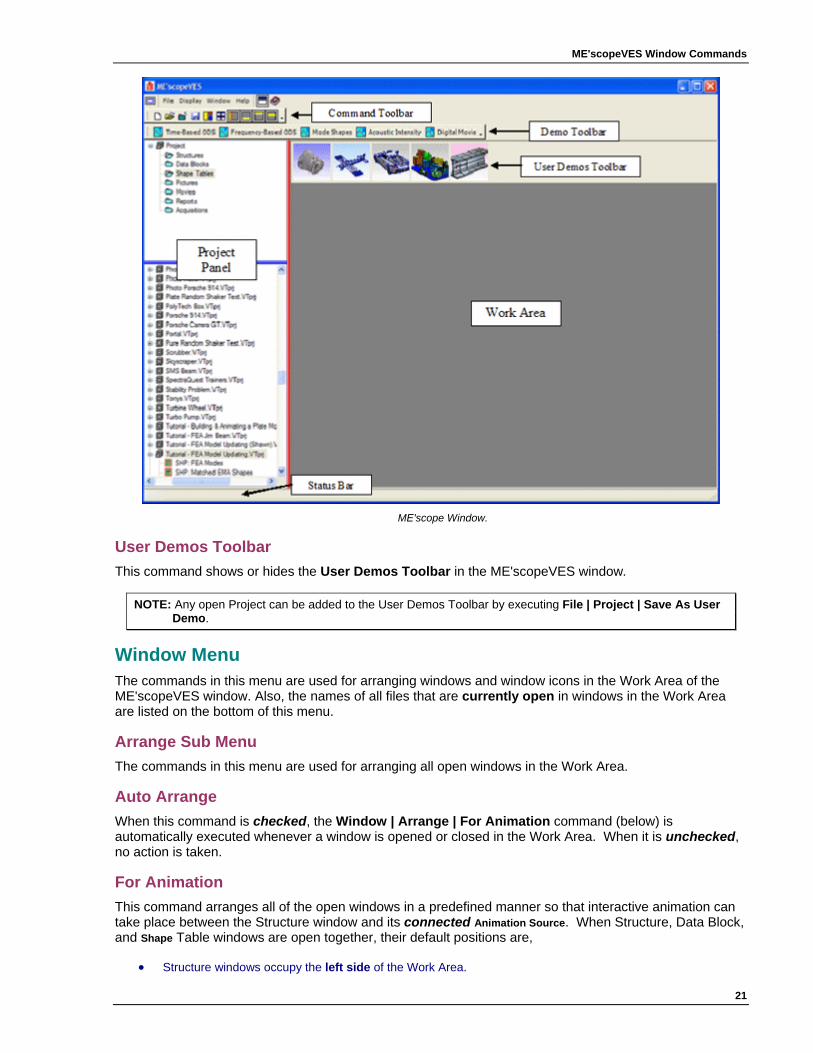
ME'scopeVES Window Commands
21
ME'scope Window.
User Demos Toolbar This command shows or hides the User Demos Toolbar in the ME'scopeVES window.
NOTE: Any open Project can be added to the User Demos Toolbar by executing File | Project | Save As User Demo.
Window Menu The commands in this menu are used for arranging windows and window icons in the Work Area of the ME'scopeVES window. Also, the names of all files that are currently open in windows in the Work Area are listed on the bottom of this menu.
Arrange Sub Menu The commands in this menu are used for arranging all open windows in the Work Area.
Auto Arrange When this command is checked, the Window | Arrange | For Animation command (below) is automatically executed whenever a window is opened or closed in the Work Area. When it is unchecked, no action is taken.
For Animation This command arranges all of the open windows in a predefined manner so that interactive animation can take place between the Structure window and its connected Animation Source. When Structure, Data Block, and Shape Table windows are open together, their default positions are,
• Structure windows occupy the left side of the Work Area.
ME'scope Reference Volume IIA - Basic Operations
22
• Data Block windows occupy the upper right side of the Work Area.
• Shape Table windows occupy the lower right side of the Work Area.
Tile This command tiles all of the open windows in the Work Area.
Center This command centers the ME'scopeVES window in the center of the computer's desktop.
Cascade This command cascades all open windows along a diagonal in the Work Area.
Arrange Icons This command arranges the Icons of all open but minimized windows at the bottom of the Work Area.
Help Menu The commands in this menu are used to execute self-running Demos, to open the Help window, and to open the About box.
Help | Demos The commands in this menu are used to execute one of the self-running demonstrations in ME'scopeVES; Time-Based ODS, Frequency-Based ODS, Mode Shapes, Acoustic Intensity or a Digital Movie. The Demo commands also have their own Toolbar that is displayed when the Display | Demo Toolbar button is depressed.
Help | Online Help This command opens the Help window. The Help window contains all of the same material as the Operating Manual.
NOTE: The Help window can be left open during other operations in ME'scopeVES.
Help | Show Tool Tips When this command’s Tool is depressed, and you place the mouse pointer over a button on a Toolbar, a brief description of the command is displayed next to the button. This is called a Tool Tip.
All of the menu commands in ME'scopeVES have buttons associated with them. These buttons are displayed in the menus, and can also be placed on any Toolbar. (See the Introduction to ME'scopeVES chapter for details on creating your own Toolbars.)
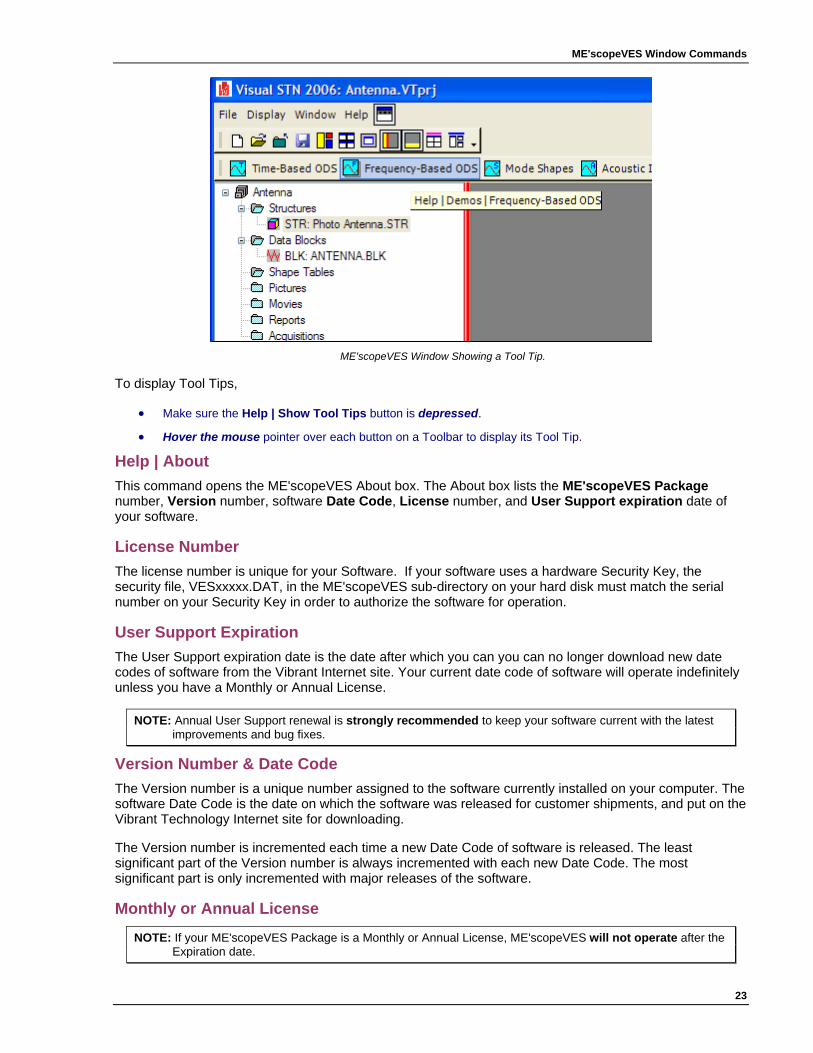
ME'scopeVES Window Commands
23
ME'scopeVES Window Showing a Tool Tip.
To display Tool Tips,
• Make sure the Help | Show Tool Tips button is depressed.
• Hover the mouse pointer over each button on a Toolbar to display its Tool Tip.
Help | About This command opens the ME'scopeVES About box. The About box lists the ME'scopeVES Package number, Version number, software Date Code, License number, and User Support expiration date of your software.
License Number The license number is unique for your Software. If your software uses a hardware Security Key, the security file, VESxxxxx.DAT, in the ME'scopeVES sub-directory on your hard disk must match the serial number on your Security Key in order to authorize the software for operation.
User Support Expiration The User Support expiration date is the date after which you can you can no longer download new date codes of software from the Vibrant Internet site. Your current date code of software will operate indefinitely unless you have a Monthly or Annual License.
NOTE: Annual User Support renewal is strongly recommended to keep your software current with the latest improvements and bug fixes.
Version Number & Date Code The Version number is a unique number assigned to the software currently installed on your computer. The software Date Code is the date on which the software was released for customer shipments, and put on the Vibrant Technology Internet site for downloading.
The Version number is incremented each time a new Date Code of software is released. The least significant part of the Version number is always incremented with each new Date Code. The most significant part is only incremented with major releases of the software.
Monthly or Annual License
NOTE: If your ME'scopeVES Package is a Monthly or Annual License, ME'scopeVES will not operate after the Expiration date.
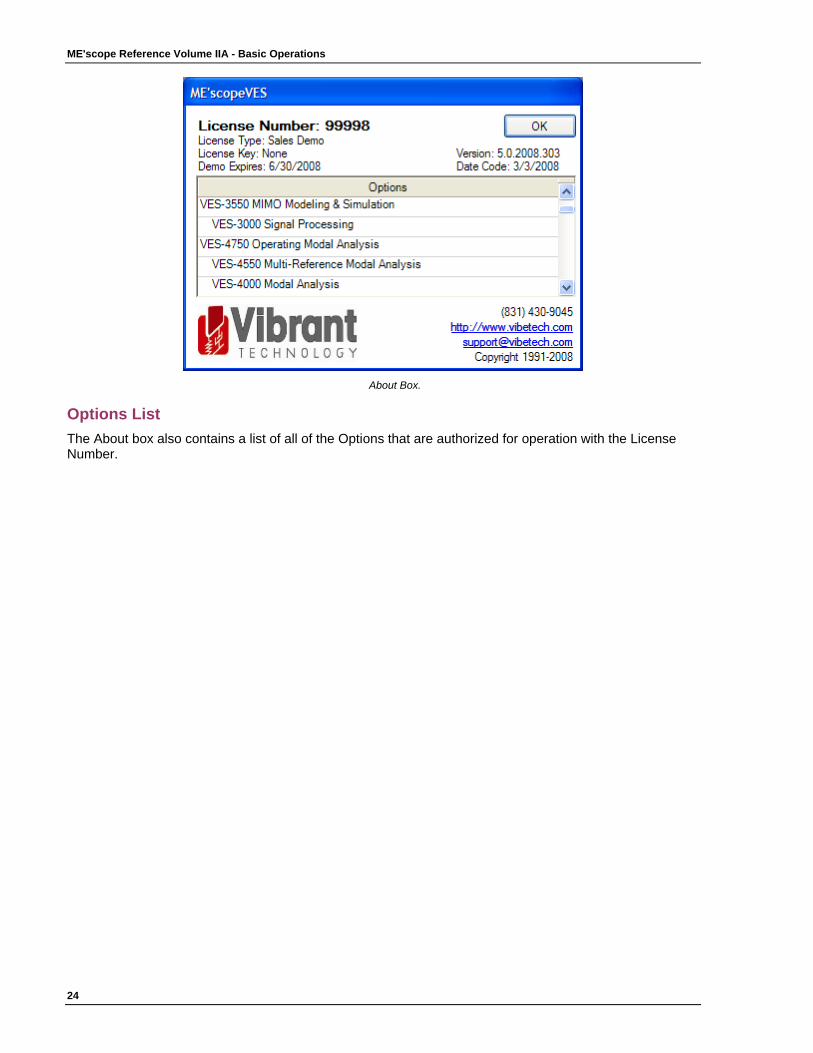
ME'scope Reference Volume IIA - Basic Operations
24
About Box.
Options List The About box also contains a list of all of the Options that are authorized for operation with the License Number.
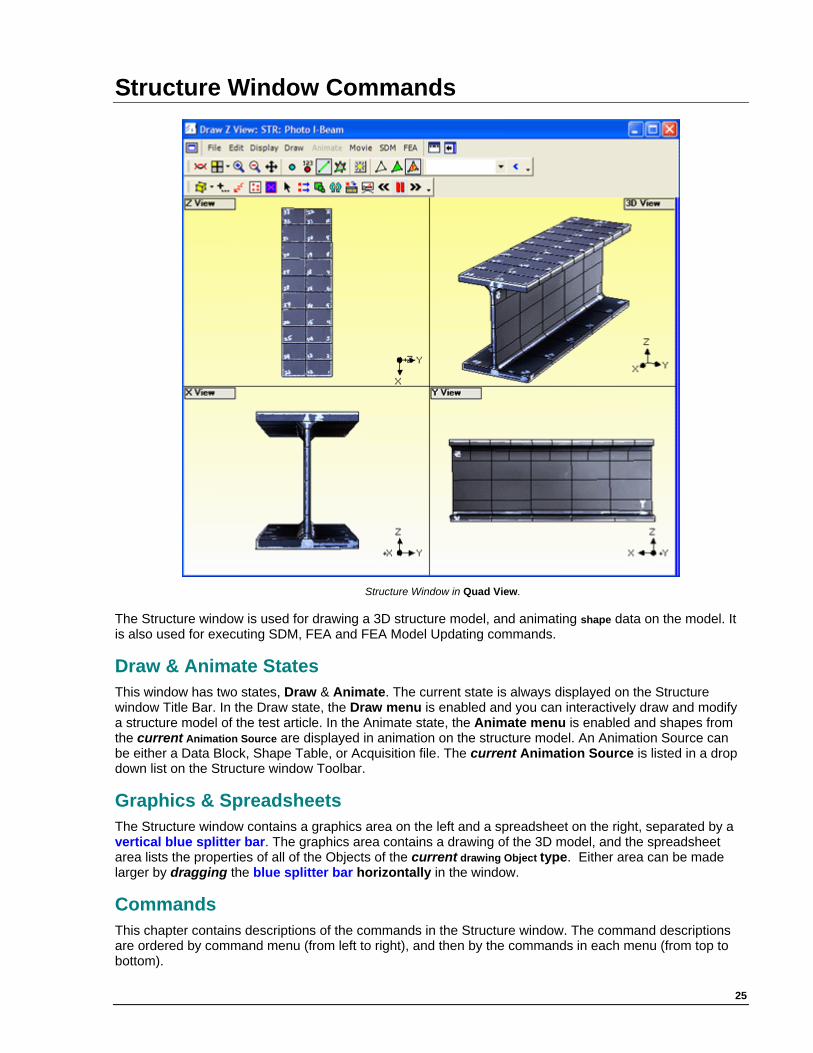
25
Structure Window Commands
Structure Window in Quad View.
The Structure window is used for drawing a 3D structure model, and animating shape data on the model. It is also used for executing SDM, FEA and FEA Model Updating commands.
Draw & Animate States This window has two states, Draw & Animate. The current state is always displayed on the Structure window Title Bar. In the Draw state, the Draw menu is enabled and you can interactively draw and modify a structure model of the test article. In the Animate state, the Animate menu is enabled and shapes from the current Animation Source are displayed in animation on the structure model. An Animation Source can be either a Data Block, Shape Table, or Acquisition file. The current Animation Source is listed in a drop down list on the Structure window Toolbar.
Graphics & Spreadsheets The Structure window contains a graphics area on the left and a spreadsheet on the right, separated by a vertical blue splitter bar. The graphics area contains a drawing of the 3D model, and the spreadsheet area lists the properties of all of the Objects of the current drawing Object type. Either area can be made larger by dragging the blue splitter bar horizontally in the window.
Commands This chapter contains descriptions of the commands in the Structure window. The command descriptions are ordered by command menu (from left to right), and then by the commands in each menu (from top to bottom).
ME'scope Reference Volume IIA - Basic Operations
26
NOTE: Additional Structure window commands are documented in the SDM, FEA, and FEA Model Updating Command Reference chapters.
Each command can be executed by,
1. Choosing it from a command menu, or
2. Clicking on its button or Tool, if it is on a Toolbar.
(See the Command Toolbars section in the Tutorial - Introduction to ME'scopeVES chapter for details on customizing the Toolbars in this window.)
Special Mouse Operations The mouse is used to perform special operations in a Structure window.
Rotation in the 3D View • Hold down the right mouse button, and drag the mouse pointer in the 3D View to rotate the structure model.
Scrolling Spreadsheets • Click on a spreadsheet and spin the mouse wheel to scroll the display of the spreadsheet.
Zooming • Click in a View, and spin the mouse wheel to Zoom the display of the structure model in or out in a View.
• Execute Display | Zoom to enable a Zoom operation. The mouse pointer will become a "cross" when moved onto a View.
• Draw a Zoom Box over the area to be zoomed.
Moving & Resizing Objects Selected Objects can be moved and resized by dragging them in a View. (See the Edit | Drag Selected Objects and Edit | Resize Selected Objects commands for details.)
Special Keyboard Operations Certain keyboard keys are used for special operations in a Structure window.
Shift Key • Hold down the Shift key and drag to Pan the display of the structure model.
• Hold down the Shift key and click on a Select Object button in the Object spreadsheet. Then click an a second Select button to select all Objects between the first and second selected Objects.
Ctrl Key Most operations in the Structure window are performed on selected Objects while in the Drawing state. Once an Object is selected, further operations can be performed on it.
• In the Drawing state, hold down the Ctrl key to enable the Edit | Select Objects | Click Select command.
• Click near an Object to toggle its selection, and maintain the selection of other Objects.
NOTE: The Ctrl key also performs the same function when used with the Edit | Select Objects | Selection Box command.
• In the Animate state, hold down the Ctrl key to display the shape value at the nearest Point to the mouse pointer on the model.
• Hold down the Ctrl key, click on a spreadsheet, and spin the mouse wheel to change the size of the spreadsheet,
Structure Window Commands
27
Alt Key • Execute Edit | Select Objects | Selection Box, hold down the Alt key, and draw a selection box to un-
select all Objects within the selection box..
Delete Key • In the Drawing state, if Objects are selected, press the Delete key to delete them from the drawing. (This is
the same as executing the Edit | Delete Selected Objects command.)
F2, F3 & F4 Keys The F2, F3 & F4 keys are used to control the movement and resizing of selected Objects. (See the Edit | Drag SELECTED Objects and Edit | Resize SELECTED Objects commands for details.)
Left & Right Arrow Keys During Dwell animation, using the Left & Right Arrow keys moves the cursor left or right in the Data Block window, or selects the next or previous shape in the Shape Table window.
Ctrl X, Ctrl C, & Ctrl V These commonly used key combinations can be used for cutting, copying or pasting text between any spreadsheet cells in a Structure window and the Windows Clipboard,
• Select the text in one or more spreadsheet cells.
• Hold down the Ctrl key and press the X key to cut the selected text to the Clipboard.
• Hold down the Ctrl key and press the C key to copy the selected text to the Clipboard.
• Hold down the Ctrl key and press the V key to paste text from the Clipboard into the selected cells.
Interactive Rotation in the 3D View Interactive rotation of the model in the 3D View is one of the most useful ways of examining structure models, both during model construction and during shape animation. To interactively rotate the model in the 3D View,
• Hold down the right mouse button and drag the mouse pointer in the 3D View.
Interactive Zoom and Pan • Click in any View and spin the mouse wheel to interactively Zoom the structure in that View.
• Hold down the Shift key and drag the mouse pointer to pan the structure model in any View.
File | Save This command saves the Structure file from the computer memory into the current Project file on disk.
File | Save In Project This command allows you to save the Structure file into any existing ME'scope Project (.VTprj) file. When this command is executed, the Windows File dialog box will open, allowing you to choose a Project file into which to save the Structure file.
File | Save In Library This command saves the current structure model as a SubStructure into the SubStructure Library on disk. This Library can be accessed whenever ME'scope is executed on the same computer.
ME'scope Reference Volume IIA - Basic Operations
28
SubStructure Library NOTE: All of the SubStructures in the SubStructure Library are displayed in the SubStructure browser when the
Drawing Assistant tabs are displayed. Any model in a Structure window can be saved in the SubStructure Library and used in the future for building other structure models. (See Draw | Drawing Assistant for details.)
Saving a Single SubStructure When this command is executed the entire structure model currently in the Structure window will be saved in the SubStructure Library, whether or not it contains any SubStructures. If your model already contains several SubStructures, you may want to save them separately. To save a single SubStructure,
• Select the desired SubStructure by depressing its Select button in the SubStructures spreadsheet.
• Execute Edit | Copy Objects to File.
The selected SubStructure will be copied to a new file and opened in its own window
• Execute File | Save In Library from the new Structure window to save the SubStructure in the Library.
File | Export This command exports the structure model in the Structure window to a disk file in an external disk format. Structure files can be exported in several formats, including the Universal File Format (UFF).
When this command is executed, the Windows File Save dialog box is opened. All of the available external file formats for exporting Structure files are listed in the Save as type list.
• Choose an export file format from the Save as type list.
• Choose a disk folder, or create a new one.
• Type the desired file name into the File name box.
• Click on the Save button.
UFF File Export The table below shows the Data Set Type that is created when a Structure file is exported to a disk file in UFF format.
ME'scopeVES File
Type of Data UFF Data Type
Structure (STR) Structure Points & Lines
15 & 82
Shape Table (SHP) Shapes 55 Data Block (BLK) Time
Waveforms, FRFs,
Transmissibility's, Auto & Cross
Spectra, Fourier Spectra.
58
Structure & Shape Together A Structure and Shape Table are connected together if the Shape Table name is listed in the Animation Source list on the Structure window Toolbar. If the Structure is connected to a Shape Table, a dialog box will open asking if you want to export both the Structure & Shape Table files together into the same UFF file.
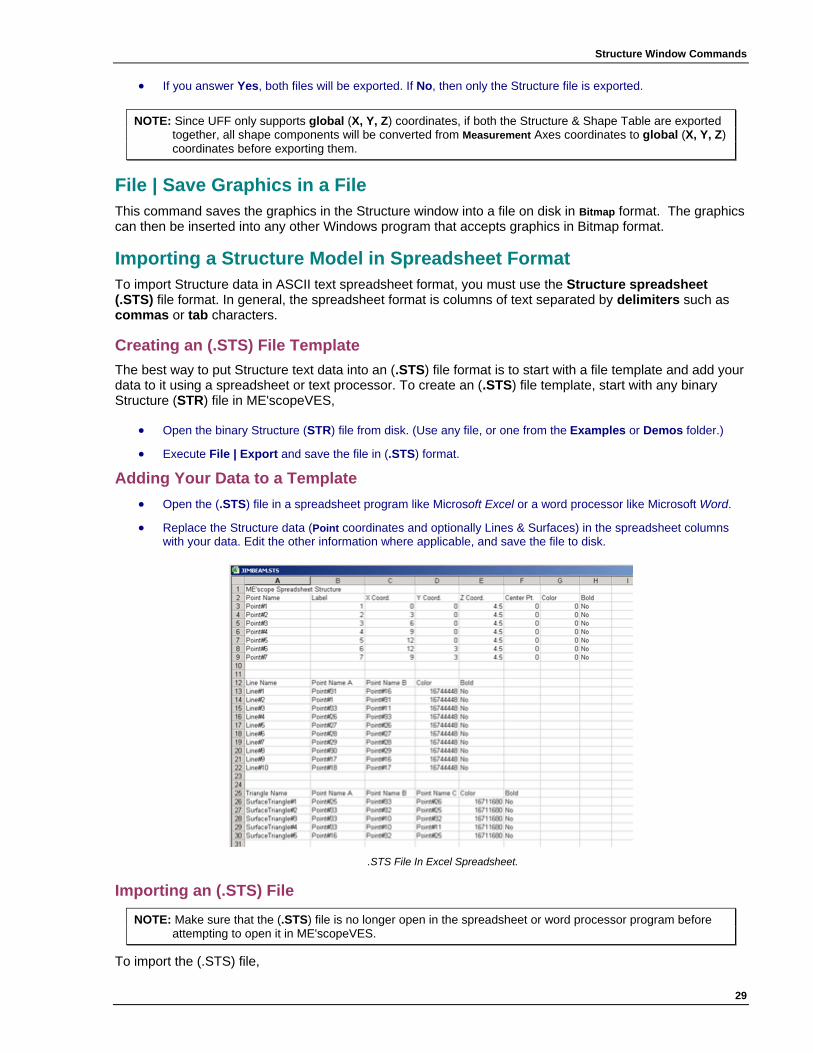
Structure Window Commands
29
• If you answer Yes, both files will be exported. If No, then only the Structure file is exported.
NOTE: Since UFF only supports global (X, Y, Z) coordinates, if both the Structure & Shape Table are exported together, all shape components will be converted from Measurement Axes coordinates to global (X, Y, Z) coordinates before exporting them.
File | Save Graphics in a File This command saves the graphics in the Structure window into a file on disk in Bitmap format. The graphics can then be inserted into any other Windows program that accepts graphics in Bitmap format.
Importing a Structure Model in Spreadsheet Format To import Structure data in ASCII text spreadsheet format, you must use the Structure spreadsheet (.STS) file format. In general, the spreadsheet format is columns of text separated by delimiters such as commas or tab characters.
Creating an (.STS) File Template The best way to put Structure text data into an (.STS) file format is to start with a file template and add your data to it using a spreadsheet or text processor. To create an (.STS) file template, start with any binary Structure (STR) file in ME'scopeVES,
• Open the binary Structure (STR) file from disk. (Use any file, or one from the Examples or Demos folder.)
• Execute File | Export and save the file in (.STS) format.
Adding Your Data to a Template • Open the (.STS) file in a spreadsheet program like Microsoft Excel or a word processor like Microsoft Word.
• Replace the Structure data (Point coordinates and optionally Lines & Surfaces) in the spreadsheet columns with your data. Edit the other information where applicable, and save the file to disk.
.STS File In Excel Spreadsheet.
Importing an (.STS) File
NOTE: Make sure that the (.STS) file is no longer open in the spreadsheet or word processor program before attempting to open it in ME'scopeVES.
To import the (.STS) file,
ME'scope Reference Volume IIA - Basic Operations
30
• Execute File | Import | Structure in the ME'scopeVES window.
File | Copy Graphics to Clipboard This command copies the graphics in the Structure window to the Windows Clipboard. The graphics can then be pasted from the Clipboard into any other Windows program that accepts graphics in Bitmap format.
Copying Spreadsheet Cells The contents of any Object properties spreadsheet text cell can also be copied to the Windows Clipboard, and pasted into other text cells. The following keyboard commands are used for cutting, copying or pasting text between spreadsheet cells and the Windows Clipboard,
• Select one or more spreadsheet cells.
• Hold down the Ctrl key and press the X key to cut the selected data to the Clipboard.
• Hold down the Ctrl key and press the C key to copy the selected data to the Clipboard.
• Hold down the Ctrl key and press the V key to paste data from the Clipboard into the selected cells.
File | Print The commands in this menu are used to print either the Structure window graphics or the current drawing Object spreadsheet on the Windows printer.
NOTE: To use these commands, the installed Windows printer must be a graphics printer. Before using these commands, use the File | Printer Setup command in the ME'scopeVES window to setup the printer.
Graphics • Execute File | Print | Graphics to print the currently displayed graphics, on the left of the vertical blue
splitter bar, on the system printer.
Spreadsheet • Execute File | Print | Spreadsheet to print the currently displayed Object spreadsheet, on the right of the
vertical blue splitter bar, on the system printer.
File | Clone Structure & Source This command copies both the Structure file and its current Animation Source file into new Structure and Source files. The cloned Structure file can then be used independently of the original file.
File | Options This command opens the Structure Options box, where a variety of options can be chosen for the Structure window. Options are grouped under Tabs.
NOTE: Many options take effect in the Structure window as soon as they are chosen in the Options box.
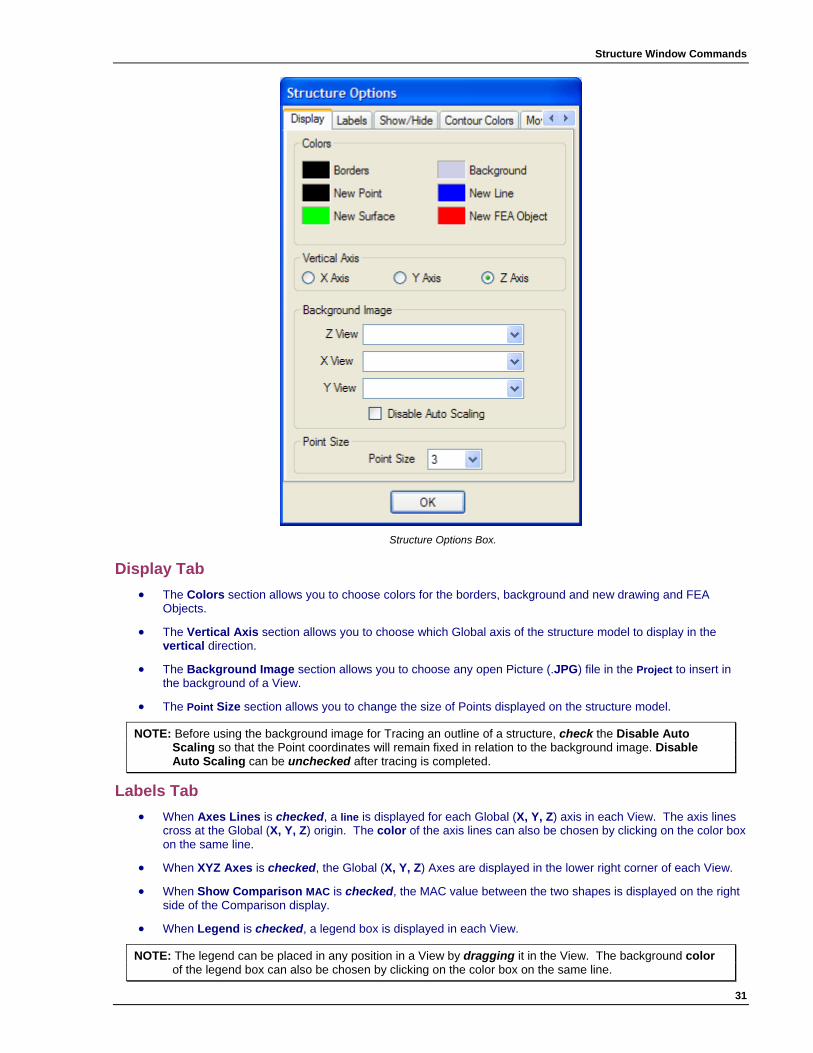
Structure Window Commands
31
Structure Options Box.
Display Tab • The Colors section allows you to choose colors for the borders, background and new drawing and FEA
Objects.
• The Vertical Axis section allows you to choose which Global axis of the structure model to display in the vertical direction.
• The Background Image section allows you to choose any open Picture (.JPG) file in the Project to insert in the background of a View.
• The Point Size section allows you to change the size of Points displayed on the structure model.
NOTE: Before using the background image for Tracing an outline of a structure, check the Disable Auto Scaling so that the Point coordinates will remain fixed in relation to the background image. Disable Auto Scaling can be unchecked after tracing is completed.
Labels Tab • When Axes Lines is checked, a line is displayed for each Global (X, Y, Z) axis in each View. The axis lines
cross at the Global (X, Y, Z) origin. The color of the axis lines can also be chosen by clicking on the color box on the same line.
• When XYZ Axes is checked, the Global (X, Y, Z) Axes are displayed in the lower right corner of each View.
• When Show Comparison MAC is checked, the MAC value between the two shapes is displayed on the right side of the Comparison display.
• When Legend is checked, a legend box is displayed in each View.
NOTE: The legend can be placed in any position in a View by dragging it in the View. The background color of the legend box can also be chosen by clicking on the color box on the same line.
ME'scope Reference Volume IIA - Basic Operations
32
• When Animation Source is checked, the name of the Animation Source file being used for animation is listed in the legend box.
• When Frequency (or Time) & Damping is checked, the frequency or time and damping of the shape being displayed in animation is listed in the legend box.
• When Settings is checked, the Amplitude and speed of animation are listed in the legend box.
• When User is checked, the contents of the text box on the same line is listed in the legend box.
Contour Colors Tab This tab allows you to choose contour colors to be used by commands in the Animate | Contours menu. Contour colors are used to display color fill on surfaces. Each color indicates the same shape level, or magnitude. Pressing one of the Default buttons assigns pre-selected colors to the spreadsheet on the left. To view contour colors,
• Execute Help | Demos | Frequency-Based ODS to open this Project and initiate animation.
• Execute Animate | Contours | Contour Fill.
High & Low Contour Limits You can also set the High & Low Limits of the shape levels to be displayed using color contours. These levels are entered into the High Limit and Low Limit boxes above and below the color bar. For example, if the Low Limit = 50 and the High Limit = 100, contours will only be displayed for shape values with magnitudes between 50 & 100.
If the High & Low Limits are both zero, then contours are drawn from zero to the maximum shape value, or between the minimum & maximum shape values.
NOTE: If Vector data is displayed in only one direction (by using only one of the Animate | Direction commands), then contours are displayed between + & - limits. Otherwise, contours are displayed between zero and the maximum shape value, or between two positive Low & High limits.
Show/Hide Tab All of the columns in an Object spreadsheet (except the Select column) can be shown or hidden.
• Un-check columns to hide them or check columns to show them for any Object type spreadsheet.
Reset Column Widths • Double click on Reset Column Widths to change the column widths in the current spreadsheet so that all
information in each column is visible.
Movies Tab • This tab contains options for controlling the quality and speed of Digital Movies made with the commands in
the Movies menu.
Units Tab This tab allows you to specify Mass, Force, and Length units to be used in the Structure window. These units are displayed in the appropriate column headings in the Drawing & FEA Object spreadsheets, and in the Drawing Assistant in a Structure window.
NOTE: Correct units are not required in order to draw a structure model and animate shapes on it. However, correct units are required by certain SDM and FEA commands. For certain commands, the Project units must be consistent with the Shape Table or Data Block units before calculations can proceed.
File | Close This command closes the Structure window. You can also close it by clicking on the close button in the upper right corner of the window. To re-open a Structure file,

Structure Window Commands
33
1. Double click on it in the Upper pane of the Project Panel, or
2. Right click on it in the Upper pane and execute Open from the drop down menu.
3. Right click on it in the Lower pane and execute Add from the drop down menu.
Edit | Undo This command restores the structure model to the state it was in before the last editing operation. This command can be used repeatedly to undo the last N editing operations, where N = Number of edits saved.
NOTE: N = Number of edits saved can be changed on the General tab in the File | Options dialog box of the ME'scopeVES window.
Edit | Redo This command restores the Structure model window to the state it was in before the last execution of the Edit | Undo command.
Edit | Objects (Objects List) This command menu lists all of the types of drawing and FEA Objects in ME'scopeVES. The Objects list is also displayed on a Toolbar when the Structure window is in the Draw state.
NOTE: The FEA Objects may not be enabled, depending on the Options that are authorized in your software.
Current Object Type NOTE: To perform further operations on an Object, its Object type must be chosen from this list. The current
Object type is displayed in the list on the Toolbar, and its Tools is depressed in the Edit | Objects menu.
When you choose an Object type from the Objects List, all Objects of the type chosen in the Objects list are displayed on the structure model, and the properties of all Objects of the type chosen are listed in the Objects spreadsheet.
• Click on the current Object type in the Object list to change the drawing Object type to the next type in the list,
• If SubStructures is displayed in the Object list, clicking on the list will display Points.
Object Spreadsheets Each type of modeling Object has properties that are displayed and edited in its own spreadsheet. The Object spreadsheet displays the properties for the current Object type in the Objects List on the Toolbar.
Scroll Bars Vertical and horizontal scroll bars are displayed if there is more data to display in an Object spreadsheet.
• To scroll vertically, click on the spreadsheet and rotate the mouse wheel, or drag on the vertical scroll bar
• To scroll horizontally, click and drag on the horizontal scroll bar.
Each column of an Object spreadsheet contains values of a property for all Objects of the current Object type. Each row of the spreadsheet contains all of the properties of a particular Object. A property can be changed by clicking on its cell in the Objects spreadsheet. This will either change its state, or select the cell contents so that you can type in a replacement value.
NOTE: All of the columns in each spreadsheet may not be enabled, depending on the Options that are authorized in your software.
ME'scope Reference Volume IIA - Basic Operations
34
Select, Hide, Label, Color & Bold Columns These five columns are common to all Object spreadsheets.
• The Select column contains a Select button for each Object. The Select button also contains the unique row number of the Object in the spreadsheet.
• The Hide column contains a button for hiding & showing each Object on the structure model.
• The Label column contains a text label for each Object (except Lines & Surfaces). Point labels are used for numbering Points, and for assigning measurements to Points on the structure model or acoustic surface. All other Labels are simply used for identification of particular Objects.
• The Color column allows you to specify a color for each Object on the structure model.
• The Bold column contains a button for displaying each Object as bold. Bold Points are displayed using larger dots. All other bold Objects are displayed using thick lines. When its button is depressed, the Object is displayed as bold.
Showing & Hiding Spreadsheet Columns All of the columns in an Object spreadsheet can be shown or hidden, except the Select column. To show or hide columns in the spreadsheet,
• Right click on any column heading in the spreadsheet. The File | Options box will open displaying the Show/Hide tab.
• Un-check columns to hide them. Check columns to show them.
Reset Spreadsheet Column Widths There are two ways to Reset column widths in the spreadsheet so that all information in each column is visible,
1. Press the Reset Column Widths button on the Show/Hide tab in the File | Options box.
2. Hold down the Ctrl key, and right click on any spreadsheet column heading.
Ctrl X, Ctrl C, & Ctrl V These commonly used key combinations can be used for editing text in one or more spreadsheet cells in the Objects spreadsheet,
• Select one or more spreadsheet cells.
• Hold down the Ctrl key and press the X key to cut the selected text to the Windows Clipboard.
• Hold down the Ctrl key and press the C key to copy the selected text to the Clipboard.
• Hold down the Ctrl key and press the V key to paste text from the Clipboard into the selected cells.
Edit | Add Object This command enables the Add Object function for the current Edit Object type. When its Tool is depressed the Add Object function is enabled. (See the Add Points, Lines, etc. to a Model sections below for details on adding Objects to a structure model.)
Selecting Objects Structure models are drawn using drawing Objects; Points, Lines, Surfaces, and SubStructures. The current Edit Object type is displayed in the Object list on the Toolbar. Only Objects of the current Edit Object type can be operated on at a time in the Structure window.
NOTE: Many operations in the Structure window are only performed on selected Objects. One or more Objects must be selected prior to executing certain commands. When an Object is selected, it is displayed differently on the model and its Select button is depressed in its spreadsheet.
There are several ways to select Objects,

Structure Window Commands
35
1. Enable Edit | Click Select and click near the center of an Object in one of the Views, or
2. Hold down the Ctrl key and click near an Object, or
3. Depress the Object Select button on the Object spreadsheet, or
4. Execute Edit | Selection Box and draw a Selection Box to surround Objects in one of the four Views.
Using the Object Selection Box To select one or more Objects within a rectangular area of one of the four Views,
• Execute Edit | Select Objects | SELECTION Box . The mouse pointer will change to a cross when moved inside a View.
• Move the cross to a corner of the desired selection area on one of the Views.
• Hold down the left mouse button and drag to enclose the Objects in the Selection Box.
• Release the mouse button to select the Objects.
To un-select all Objects inside a Selection Box,
• Hold down the Alt key while drawing the Selection Box.
Selecting All Objects 1. Double click on the Select column heading in the spreadsheet until all Select buttons say Yes, or
2. Execute Edit | Select Objects | SELECT All .
Un-selecting All Objects 1. Double click on the Select column in the spreadsheet until all of the Select buttons say No, or
2. Execute Edit | Select Objects | SELECT None .
Toggling Object Selection 1. Execute Edit | Objects | Invert SELECTION, or
2. Hold down the Ctrl before clicking near an Object, or draw a Selection Box.
Selecting a Range of Objects in the Spreadsheet 1. Depress the Select button for the first Object in the range to be selected.
2. Hold down the Shift key and depress the Select button for the last Object in the range.
Editing Spreadsheet Properties by Column To edit the spreadsheet properties of all (or selected) Objects in a column of the Objects spreadsheet,
• Double click on the column heading of the property to be edited. A dialog box will open.
• Choose or enter the property value, and click on OK.
Points Spreadsheet The Points spreadsheet contains the properties of all Points on the current structure model. The spreadsheet is displayed by selecting Points from the Object list on the Toolbar. Each Point is defined by its global coordinates, (X Coordinate, Y Coordinate, Z Coordinate) listed in its row of the Points spreadsheet.
NOTE: All of the columns in this spreadsheet may not be enabled, depending on the Options that are authorized in your software.

ME'scope Reference Volume IIA - Basic Operations
36
Point Properties Spreadsheet.
Point Labels Each Point has a text Label that is used for Point numbering or any other desired description of the Point.
NOTE: Numbered Point Labels are used by Draw | Assign M#s or the Assign M#s command in a Data Block, Shape Table, or Acquisition window to assign measurements to Points & directions on the structure model. (See one of these command descriptions for details.)
Point Numbering To number Points on a model,
1. Execute Draw | Number Points.
2. Type numbers into the cells in the Label column of the Points spreadsheet, or
To number the Points using their spreadsheet row number,
• Double click on the Label column heading. A dialog box will open.
• Check Set Label to Row Number and click on OK.
Point Coordinates Columns These three columns (X Coord, Y Coord & Z Coord) contain the Global rectangular (Cartesian) coordinates of each Point.
NOTE: If Length units are specified on the Units tab in the File | Options dialog box, those units will also be displayed in the Coordinates column headings. However, length units are not required in order to build a structure model and animate shape data on it.

Structure Window Commands
37
Center Point Column This column is used for cylindrical or spherical Points to reference another Point at the center of a cylinder or sphere. Any Point that is referenced by another Point in this column is called a Center Point. Any Point that references a Center Point is called a Radial Point. Radial Points are used for describing cylindrical structures, and for animating Shaft Rotational measurements and for continuously rotating SubStructures during animation. A Radial Point is defined in this column by selecting another Point (by row number & [Label] as its Center Point.
Display Column This column has buttons that have two states; Normal and Always. In the Always state, the Point is always displayed as a dot. In the Normal state, the Point is not displayed unless Points is chosen in the Objects List on the Toolbar, or the Display | Points Tool is depressed.
Area & Normal Columns These two columns are used for calculating the Sound Power passing through an acoustic surface. They contain the surface area surrounding the Point and the normal vector to the surface at the Point. These values are automatically calculated when an acoustic surface it created with the Drawing Assistant.
Animate Using Column This column restricts the type of animation allowed at a Point to Deformation, Arrows, Both or None.
NOTE: In order for the Animate Using property to take effect, either the Animate | Deformations | Deformed or Animate | Arrows command must be executed.
• Deformation means that only Deformation animation is allowed at the Point.
• Arrows means that only Arrows animation is allowed at the Point.
• Both means that either Deformation or Arrows, or both types of animation are allowed.
• None means that the Point will not be animated.
Adding Points to a Model New Points can be added to a structure model either graphically or by adding them directly to the Points spreadsheet.
Adding Points Graphically To add a Point graphically,
• Choose Points from the Object list on the Toolbar.
• Press the Add Object Tool on the Toolbar to turn ON the Add Points function.
• Move the mouse pointer into a View and click to add a Point.
The new Point will be added to both the structure model and the Points spreadsheet, and it will appear as a selected Point, both on the model and in the last row of the Points spreadsheet.
WARNING: When the Add Points function is turned ON (the Add Object Tool is depressed), a new Point is added to the structure model each time the left mouse button is clicked.
Terminating Graphical Point Addition To turn OFF the Add Points function,
• Execute Edit | Add Object again, or click on the depressed Add Object Tool.

ME'scope Reference Volume IIA - Basic Operations
38
Adding Rows to the Spreadsheet To add a new row (Point) directly to the Points spreadsheet,
• Place the cursor on one of coordinate columns in the last row of the spreadsheet, and press the Down Arrow key on the keyboard.
NOTE: When a new row is added to the Points spreadsheet, the coordinates of the previous Point (row) are copied into the new row. Also, the coordinate in the selected cell is incremented by the difference between the previous two coordinates in its column, or by ”1” if there is no difference.
Editing Point Coordinates Points coordinates can be modified by dragging Points in one of the Views, or by edited the coordinates in the Points spreadsheet. (See the Edit | Drag Selected Objects command for details on dragging Points.)
Editing Spreadsheet Coordinates To edit the coordinates of all (or selected) Points in the X Coord, Y Coord, or Z Coord, spreadsheet column,
• Select the Points to be edited.
• Double click on the appropriate X Coord, Y Coord or Z Coord column heading. A dialog box will open.
• Choose whether you want the coordinates in the column to be Replaced with, Added to or Scaled by the new value.
• Enter the new value, and click on OK.
Point Coordinate Editor Dialog Box.
Lines Spreadsheet The Lines spreadsheet contains the properties of all Line Objects on the structure model. The spreadsheet is displayed by selecting Lines from the Object list on the Toolbar. Each Line is defined between two Points, labeled Point 1 and Point 2 in its row of the Lines spreadsheet.
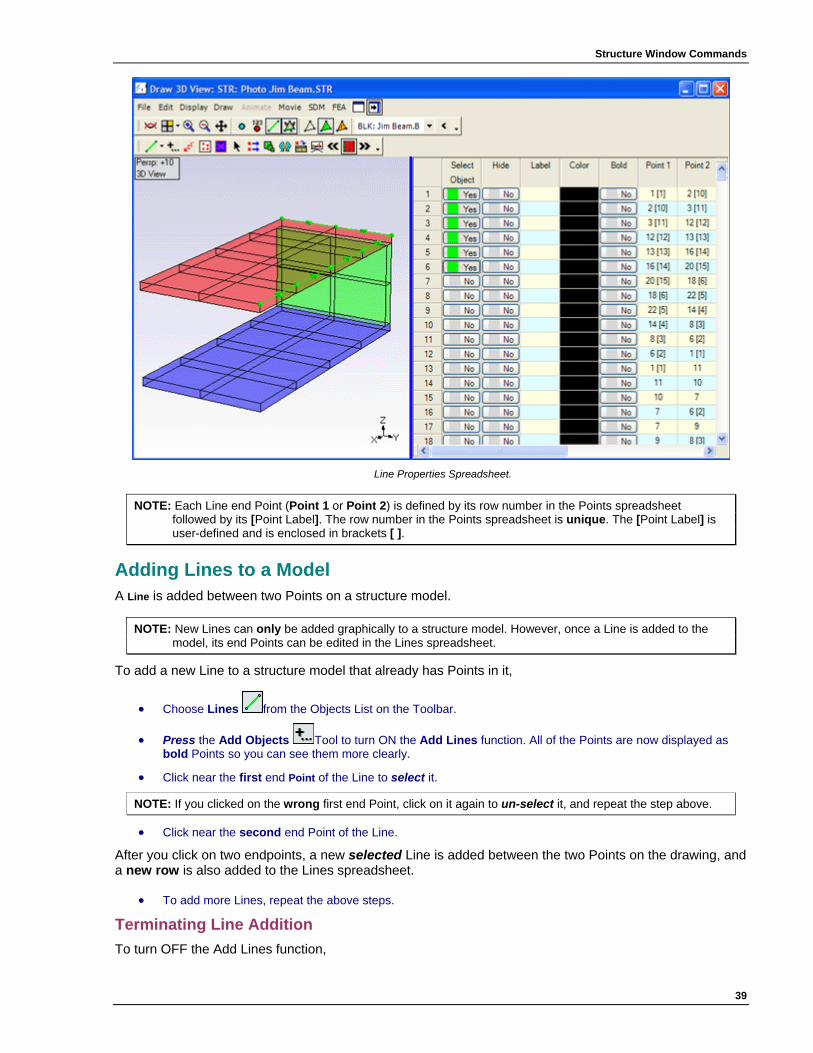
Structure Window Commands
39
Line Properties Spreadsheet.
NOTE: Each Line end Point (Point 1 or Point 2) is defined by its row number in the Points spreadsheet followed by its [Point Label]. The row number in the Points spreadsheet is unique. The [Point Label] is user-defined and is enclosed in brackets [ ].
Adding Lines to a Model A Line is added between two Points on a structure model.
NOTE: New Lines can only be added graphically to a structure model. However, once a Line is added to the model, its end Points can be edited in the Lines spreadsheet.
To add a new Line to a structure model that already has Points in it,
• Choose Lines from the Objects List on the Toolbar.
• Press the Add Objects Tool to turn ON the Add Lines function. All of the Points are now displayed as bold Points so you can see them more clearly.
• Click near the first end Point of the Line to select it.
NOTE: If you clicked on the wrong first end Point, click on it again to un-select it, and repeat the step above.
• Click near the second end Point of the Line.
After you click on two endpoints, a new selected Line is added between the two Points on the drawing, and a new row is also added to the Lines spreadsheet.
• To add more Lines, repeat the above steps.
Terminating Line Addition To turn OFF the Add Lines function,
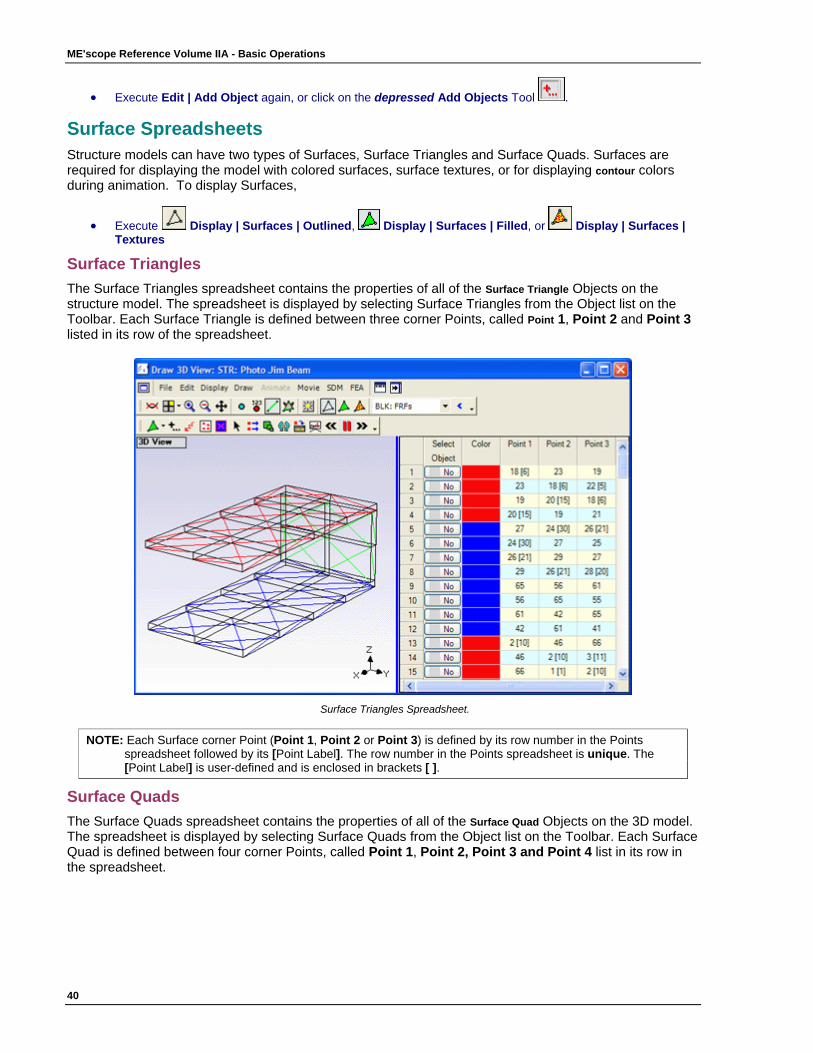
ME'scope Reference Volume IIA - Basic Operations
40
• Execute Edit | Add Object again, or click on the depressed Add Objects Tool .
Surface Spreadsheets Structure models can have two types of Surfaces, Surface Triangles and Surface Quads. Surfaces are required for displaying the model with colored surfaces, surface textures, or for displaying contour colors during animation. To display Surfaces,
• Execute Display | Surfaces | Outlined, Display | Surfaces | Filled, or Display | Surfaces | Textures
Surface Triangles The Surface Triangles spreadsheet contains the properties of all of the Surface Triangle Objects on the structure model. The spreadsheet is displayed by selecting Surface Triangles from the Object list on the Toolbar. Each Surface Triangle is defined between three corner Points, called Point 1, Point 2 and Point 3 listed in its row of the spreadsheet.
Surface Triangles Spreadsheet.
NOTE: Each Surface corner Point (Point 1, Point 2 or Point 3) is defined by its row number in the Points spreadsheet followed by its [Point Label]. The row number in the Points spreadsheet is unique. The [Point Label] is user-defined and is enclosed in brackets [ ].
Surface Quads The Surface Quads spreadsheet contains the properties of all of the Surface Quad Objects on the 3D model. The spreadsheet is displayed by selecting Surface Quads from the Object list on the Toolbar. Each Surface Quad is defined between four corner Points, called Point 1, Point 2, Point 3 and Point 4 list in its row in the spreadsheet.
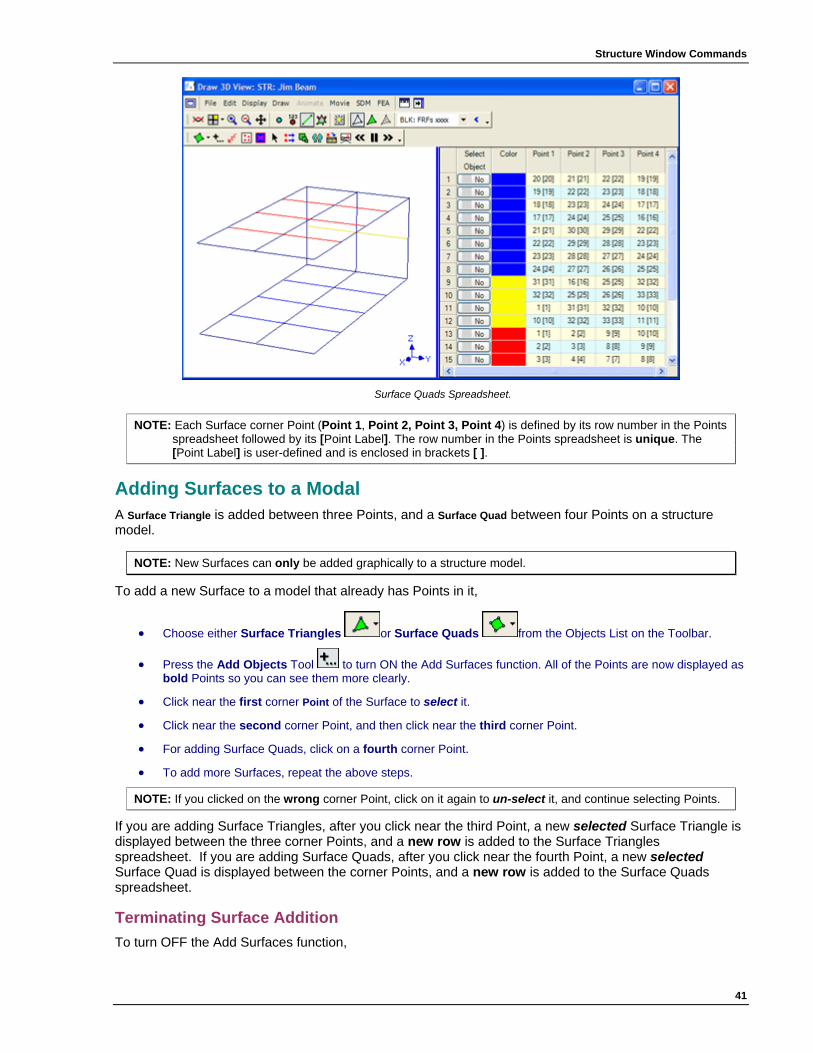
Structure Window Commands
41
Surface Quads Spreadsheet.
NOTE: Each Surface corner Point (Point 1, Point 2, Point 3, Point 4) is defined by its row number in the Points spreadsheet followed by its [Point Label]. The row number in the Points spreadsheet is unique. The [Point Label] is user-defined and is enclosed in brackets [ ].
Adding Surfaces to a Modal A Surface Triangle is added between three Points, and a Surface Quad between four Points on a structure model.
NOTE: New Surfaces can only be added graphically to a structure model.
To add a new Surface to a model that already has Points in it,
• Choose either Surface Triangles or Surface Quads from the Objects List on the Toolbar.
• Press the Add Objects Tool to turn ON the Add Surfaces function. All of the Points are now displayed as bold Points so you can see them more clearly.
• Click near the first corner Point of the Surface to select it.
• Click near the second corner Point, and then click near the third corner Point.
• For adding Surface Quads, click on a fourth corner Point.
• To add more Surfaces, repeat the above steps.
NOTE: If you clicked on the wrong corner Point, click on it again to un-select it, and continue selecting Points.
If you are adding Surface Triangles, after you click near the third Point, a new selected Surface Triangle is displayed between the three corner Points, and a new row is added to the Surface Triangles spreadsheet. If you are adding Surface Quads, after you click near the fourth Point, a new selected Surface Quad is displayed between the corner Points, and a new row is added to the Surface Quads spreadsheet.
Terminating Surface Addition To turn OFF the Add Surfaces function,
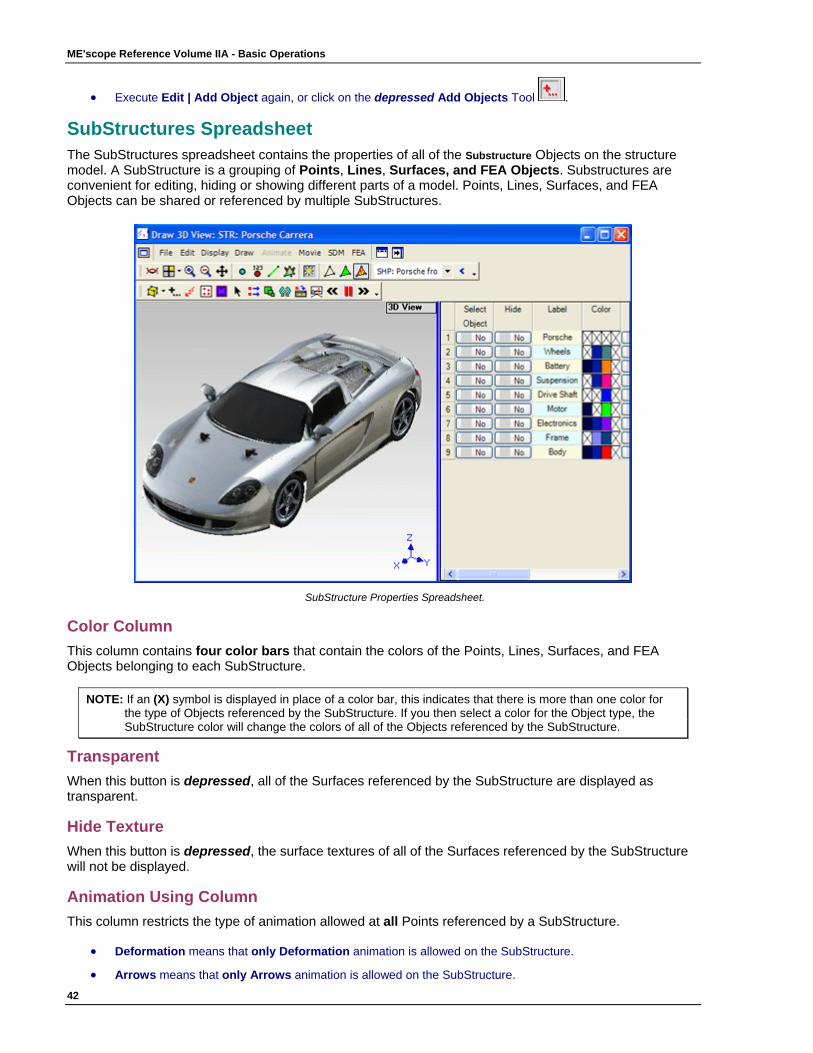
ME'scope Reference Volume IIA - Basic Operations
42
• Execute Edit | Add Object again, or click on the depressed Add Objects Tool .
SubStructures Spreadsheet The SubStructures spreadsheet contains the properties of all of the Substructure Objects on the structure model. A SubStructure is a grouping of Points, Lines, Surfaces, and FEA Objects. Substructures are convenient for editing, hiding or showing different parts of a model. Points, Lines, Surfaces, and FEA Objects can be shared or referenced by multiple SubStructures.
SubStructure Properties Spreadsheet.
Color Column This column contains four color bars that contain the colors of the Points, Lines, Surfaces, and FEA Objects belonging to each SubStructure.
NOTE: If an (X) symbol is displayed in place of a color bar, this indicates that there is more than one color for the type of Objects referenced by the SubStructure. If you then select a color for the Object type, the SubStructure color will change the colors of all of the Objects referenced by the SubStructure.
Transparent When this button is depressed, all of the Surfaces referenced by the SubStructure are displayed as transparent.
Hide Texture When this button is depressed, the surface textures of all of the Surfaces referenced by the SubStructure will not be displayed.
Animation Using Column This column restricts the type of animation allowed at all Points referenced by a SubStructure.
• Deformation means that only Deformation animation is allowed on the SubStructure.
• Arrows means that only Arrows animation is allowed on the SubStructure.
Structure Window Commands
43
• Both means that either Deformation or Arrows, or both types of animation are allowed.
• None means that the SubStructure will not be animated.
NOTE: In order for the Animate Using property to take effect, either the Animate | Deformations | Deformed or the Animate | Arrows command must be executed.
Contours Data Type Column This column specifies which type of data will be displayed on a Substructure using contours during animation. The data type is defined for each M# in the current Animation Source.
• Vector means that only Vector data will be displayed on the SubStructure using contours.
• Scalar means that only Scalar data will be displayed on the SubStructure using contours.
• Shaft Rotation means that only Shaft Rotation data will be displayed on the SubStructure using contours.
• FEA Rotation means that only FEA Rotation data will be displayed on the SubStructure using contours.
• None means that no contours will be displayed on the SubStructure.
NOTE: In order for contours to be displayed, surfaces must be defined on the Substructure and one of the Animate | Contours commands must be executed.
Creating a SubStructure To create a SubStructure,
• Select drawing Objects (Points, Lines, Surfaces, or FEA Objects) and execute Draw | Add SELECTED Objects to SubStructure.
(See the Draw | Add SELECTED Objects to SubStructure command reference for more details.)
Edit | Select Objects | SELECT All This command selects all Objects of the current Edit Object type on the structure model. Selected Objects are displayed differently on the model. The current Edit Object type is displayed in the Objects List on the Toolbar.
Edit | Select Objects | Invert SELECTION This command inverts the selection all Objects of the current Edit Object type on the structure model. That is, all selected Objects are un-selected, and all un-selected Objects are selected. The current Edit Object type is displayed in the Objects List on the Toolbar.
Edit | Select Objects | SELECT None This command un-selects all Objects of the current Edit Object type on the structure model. The current Edit Object type is displayed in the Objects List on the Toolbar.
Edit | Select Objects | SELECTION Box This command selects or un-selects one or more Objects within a rectangular area of one of the Views. When it is executed, the mouse pointer will change to a cross when moved inside a View.
• Move the cross to a corner of the desired selection area on one of the Views.
• Hold down the left mouse button and drag to enclose the Objects in the Selection Box.
• Release the mouse button to select the Objects.
Using the Ctrl Key • Hold down the Ctrl key, and draw a Selection Box to toggle the selection of the Objects in the box.
ME'scope Reference Volume IIA - Basic Operations
44
Edit | Select Objects | Click Select This command enables the Click Select function. Click Select allows you to select the Object that is nearest to the mouse pointer, and also to toggle the selection (select or un-select) an Object of the current Object type. When its Tool is depressed, Click Select is enabled.
• With Click Select enabled, click near the center of an Object in one of the Views to select it.
Toggling Selection • Hold down the Ctrl key and click near an Object to toggle its selection, and maintain the selection of other
Objects.
Edit | Cut Objects to File This command removes selected Objects from the structure model and puts them into another Structure file.
NOTE: If you attempt to cut Points that are being referenced by other Objects, you are given the option of cutting the other Objects too. (See Edit | Delete SELECTED Objects for details.)
Before executing this command,
1. Choose the current Edit Object type to be cut by executing one of the Edit | Object commands.
2. Select the Objects to be removed from the structure model.
Edit | Copy Objects to File This command copies all (or selected) Objects of the current Edit Object type from the structure model into another Structure file.
• If Objects other than Points are copied, then all Points that are referenced by the copied Objects will be copied also.
• If SubStructures are copied, then all Objects referenced by the copied SubStructures will be copied also.
NOTE: If Objects can be copied either to another structure file to the structure model in the same window. If they are copied to the same window, they are duplicated.
Before executing this command,
• Choose the current Edit Object type to be copied by executing one of the Edit | Object commands.
• Select the Objects on the structure model. (If none are selected, then all Objects will be copied.)
Edit | Paste Objects from File This command pastes all (or selected) Objects of the current Edit Object type from a Structure file into the structure model.
• If Objects other than Points are pasted, then all Points that are referenced by the pasted Objects will be pasted also.
• If SubStructures are pasted, then all Objects referenced by the pasted SubStructures will be pasted also.
NOTE: If Objects can be pasted either from another structure file or from the structure model in the same window. If they are pasted from the same window, they are duplicated.
Before executing this command,
1. Choose the current Edit Object type to be pasted by executing one of the Edit | Object commands.
2. Select the Objects on the structure model. (If none are selected, then all Objects will be pasted.)
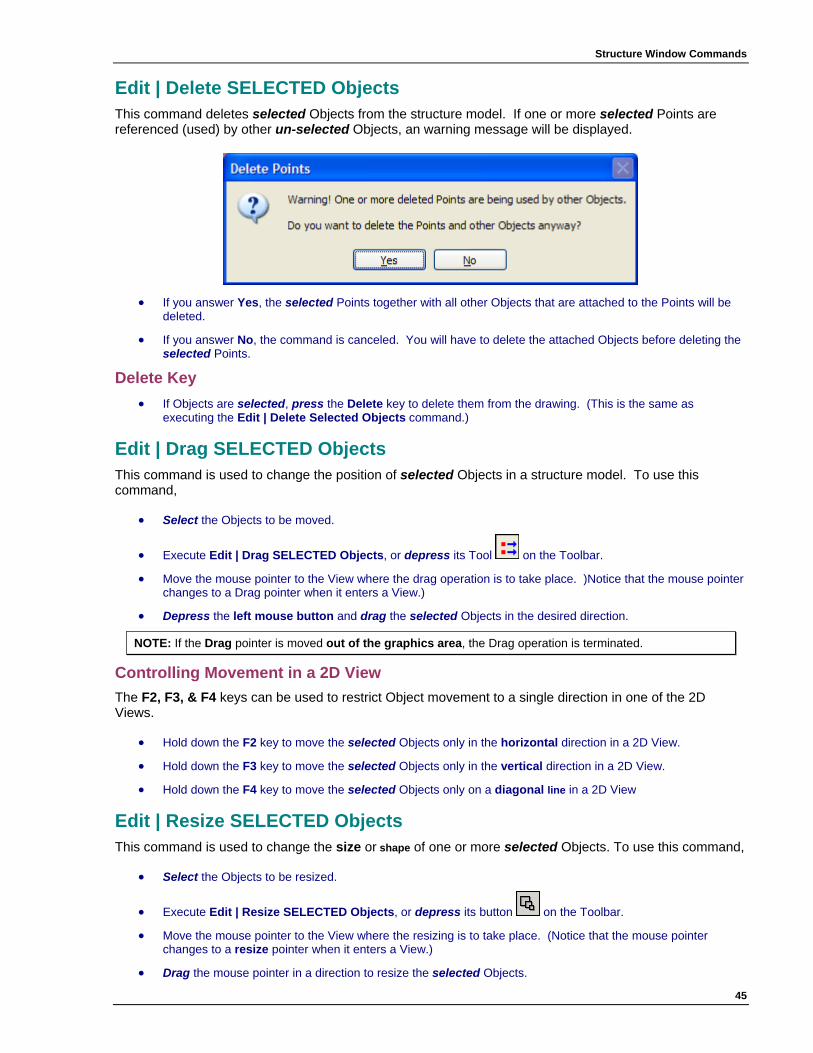
Structure Window Commands
45
Edit | Delete SELECTED Objects This command deletes selected Objects from the structure model. If one or more selected Points are referenced (used) by other un-selected Objects, an warning message will be displayed.
• If you answer Yes, the selected Points together with all other Objects that are attached to the Points will be
deleted.
• If you answer No, the command is canceled. You will have to delete the attached Objects before deleting the selected Points.
Delete Key • If Objects are selected, press the Delete key to delete them from the drawing. (This is the same as
executing the Edit | Delete Selected Objects command.)
Edit | Drag SELECTED Objects This command is used to change the position of selected Objects in a structure model. To use this command,
• Select the Objects to be moved.
• Execute Edit | Drag SELECTED Objects, or depress its Tool on the Toolbar.
• Move the mouse pointer to the View where the drag operation is to take place. )Notice that the mouse pointer changes to a Drag pointer when it enters a View.)
• Depress the left mouse button and drag the selected Objects in the desired direction.
NOTE: If the Drag pointer is moved out of the graphics area, the Drag operation is terminated.
Controlling Movement in a 2D View The F2, F3, & F4 keys can be used to restrict Object movement to a single direction in one of the 2D Views.
• Hold down the F2 key to move the selected Objects only in the horizontal direction in a 2D View.
• Hold down the F3 key to move the selected Objects only in the vertical direction in a 2D View.
• Hold down the F4 key to move the selected Objects only on a diagonal line in a 2D View
Edit | Resize SELECTED Objects This command is used to change the size or shape of one or more selected Objects. To use this command,
• Select the Objects to be resized.
• Execute Edit | Resize SELECTED Objects, or depress its button on the Toolbar.
• Move the mouse pointer to the View where the resizing is to take place. (Notice that the mouse pointer changes to a resize pointer when it enters a View.)
• Drag the mouse pointer in a direction to resize the selected Objects.
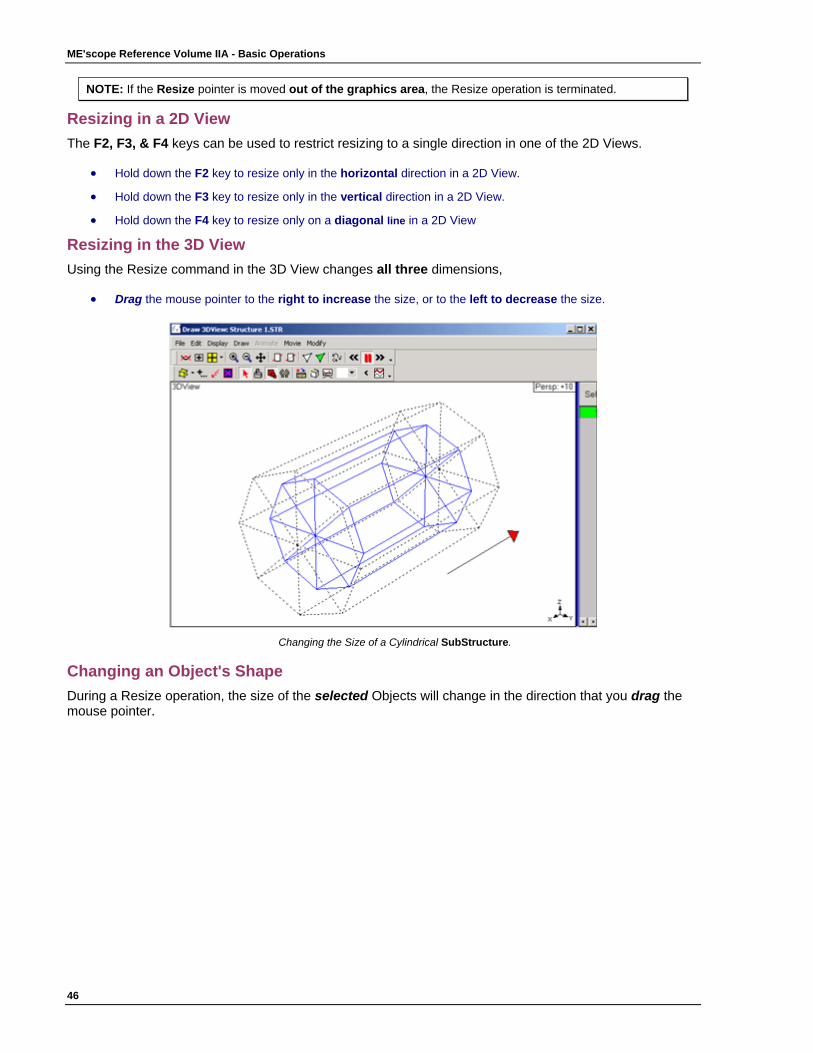
ME'scope Reference Volume IIA - Basic Operations
46
NOTE: If the Resize pointer is moved out of the graphics area, the Resize operation is terminated.
Resizing in a 2D View The F2, F3, & F4 keys can be used to restrict resizing to a single direction in one of the 2D Views.
• Hold down the F2 key to resize only in the horizontal direction in a 2D View.
• Hold down the F3 key to resize only in the vertical direction in a 2D View.
• Hold down the F4 key to resize only on a diagonal line in a 2D View
Resizing in the 3D View Using the Resize command in the 3D View changes all three dimensions,
• Drag the mouse pointer to the right to increase the size, or to the left to decrease the size.
Changing the Size of a Cylindrical SubStructure.
Changing an Object's Shape During a Resize operation, the size of the selected Objects will change in the direction that you drag the mouse pointer.

Structure Window Commands
47
Changing the Shape of a Cylindrical Object.
Edit | Rotate SELECTED Objects This command rotates selected Objects of the current Edit Object type about the global (X, Y, Z) axes. When Objects is rotated using this command, their Point coordinates are permanently changed. To rotate one or more Objects,
• Select the Objects to be rotated.
• Execute Edit | Rotate SELECTED Objects . A dialog box will open.
• Enter the Rotational Increment in degrees.
• Click on the Up/Down Arrows next to the axis about which rotation is desired.
• Press the Close button to terminate the Rotation operation.
NOTE: Substructures can also be rotated about their own Local Axes by using the Drawing Assistant.
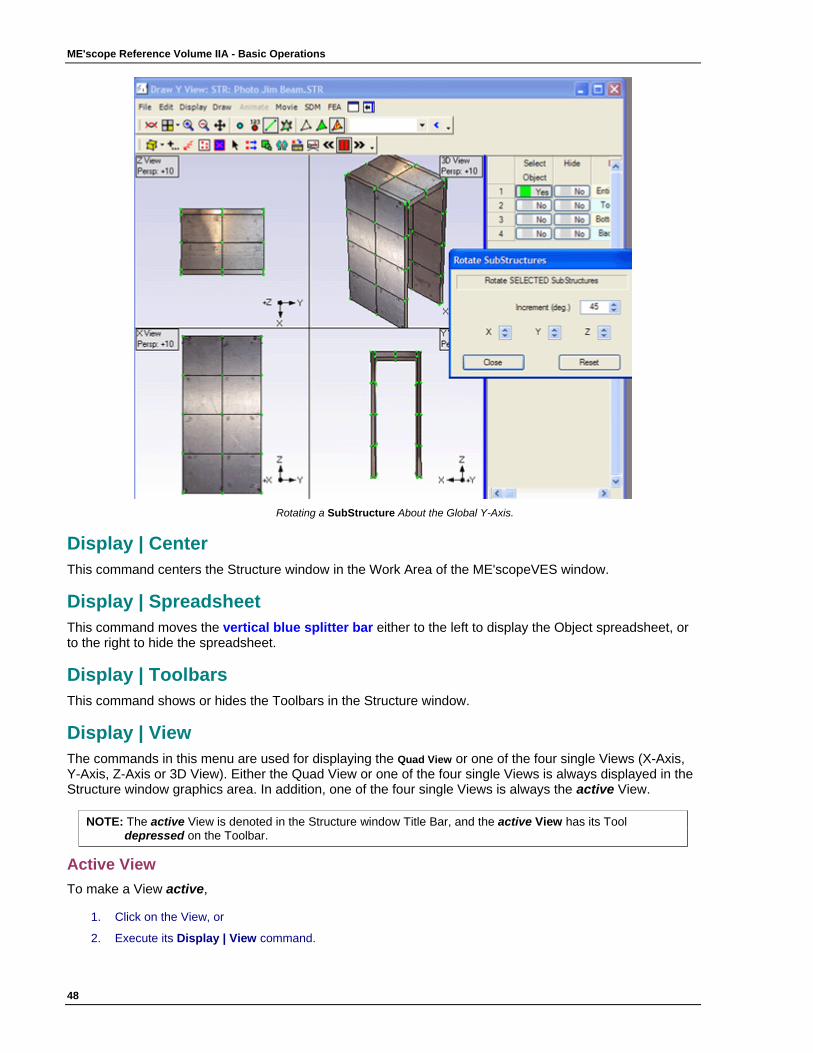
ME'scope Reference Volume IIA - Basic Operations
48
Rotating a SubStructure About the Global Y-Axis.
Display | Center This command centers the Structure window in the Work Area of the ME'scopeVES window.
Display | Spreadsheet This command moves the vertical blue splitter bar either to the left to display the Object spreadsheet, or to the right to hide the spreadsheet.
Display | Toolbars This command shows or hides the Toolbars in the Structure window.
Display | View The commands in this menu are used for displaying the Quad View or one of the four single Views (X-Axis, Y-Axis, Z-Axis or 3D View). Either the Quad View or one of the four single Views is always displayed in the Structure window graphics area. In addition, one of the four single Views is always the active View.
NOTE: The active View is denoted in the Structure window Title Bar, and the active View has its Tool depressed on the Toolbar.
Active View To make a View active,
1. Click on the View, or
2. Execute its Display | View command.
Structure Window Commands
49
Single View & Quad View • Double click on a single View to display the Quad View.
• Double click on one of the Views in the Quad View to make it the active View and display it.
Flip View This command rotates the active View by 180 degrees.
Display | Zoom The command is used to enlarge the display of the structure model in any View. A View can be zoomed in the active either by using the mouse wheel, or drawing a Zoom box in an area of a View.
Using the Mouse Wheel • Click on a View to make it the active View,
• Spin the mouse wheel to Zoom the structure display in or out in the active View,
Drawing a Zoom Box To draw a Zoom Box around an area to be enlarged,
• Depress the Zoom button on the Toolbar.
• Move the mouse pointer into the View to be zoomed. (Notice that the mouse pointer changes to the cross pointer.)
• Move the Zoom cursor to a corner of the area to be enlarged, and drag toward the opposite corner of the area. (A Zoom box will be drawn on the area.)
Canceling a Zoom Box Operation • Move the Zoom pointer out of the graphics area to cancel a Zoom Box command,
Pan & Zoom • Hold down the Shift key to enable the Display | Pan command.
• Hold down the left mouse button and drag to move the structure in the direction of the mouse pointer.
• Spin the mouse wheel to Zoom the display in or out.
Display | mooZ mooZ is the reverse of Zoom. This command is used to undo the Zoomed display in the active View.
• Click in a View to make it active.
• Execute Display | mooZ.
Display | Pan This command enables & disables the Pan function. Pan is used to move the structure model in a View. To enable the Pan function;
1. Hold down the Shift key to enable the Display | Pan command, or
2. Execute Display | Pan.
• Move the mouse pointer into a View. (The mouse pointer will change to a "cross".)
• Drag to Pan the structure in the active View.
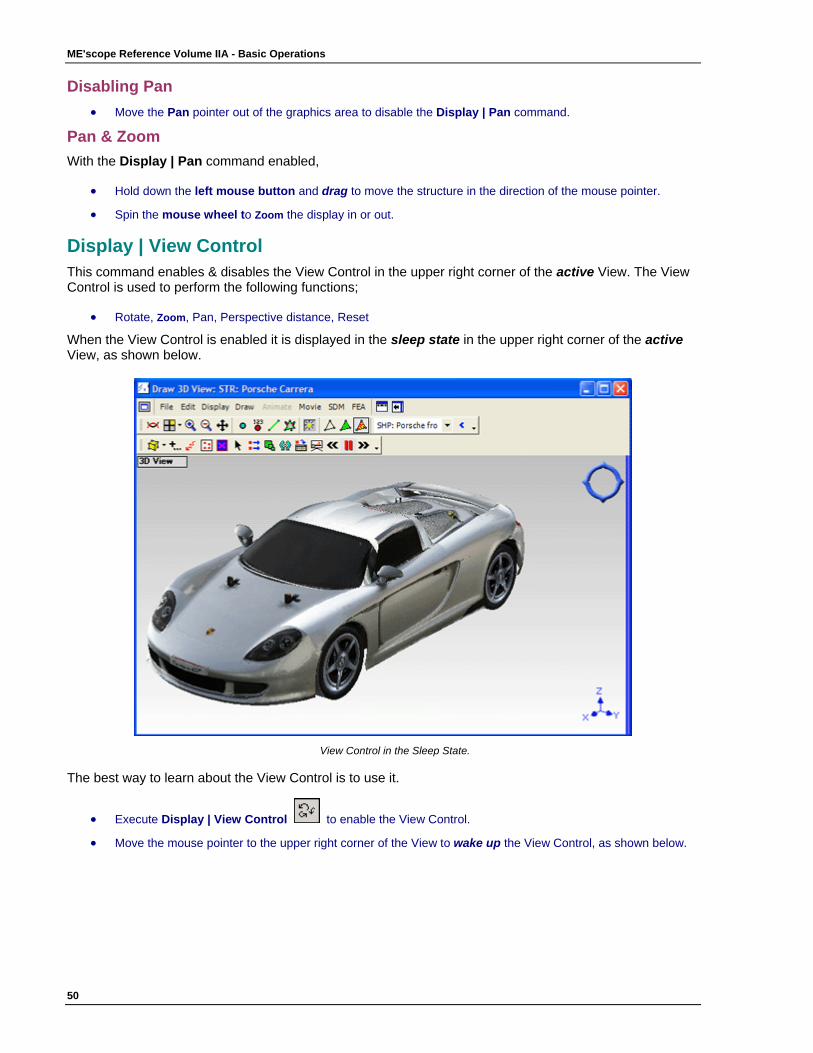
ME'scope Reference Volume IIA - Basic Operations
50
Disabling Pan • Move the Pan pointer out of the graphics area to disable the Display | Pan command.
Pan & Zoom With the Display | Pan command enabled,
• Hold down the left mouse button and drag to move the structure in the direction of the mouse pointer.
• Spin the mouse wheel to Zoom the display in or out.
Display | View Control This command enables & disables the View Control in the upper right corner of the active View. The View Control is used to perform the following functions;
• Rotate, Zoom, Pan, Perspective distance, Reset
When the View Control is enabled it is displayed in the sleep state in the upper right corner of the active View, as shown below.
View Control in the Sleep State.
The best way to learn about the View Control is to use it.
• Execute Display | View Control to enable the View Control.
• Move the mouse pointer to the upper right corner of the View to wake up the View Control, as shown below.
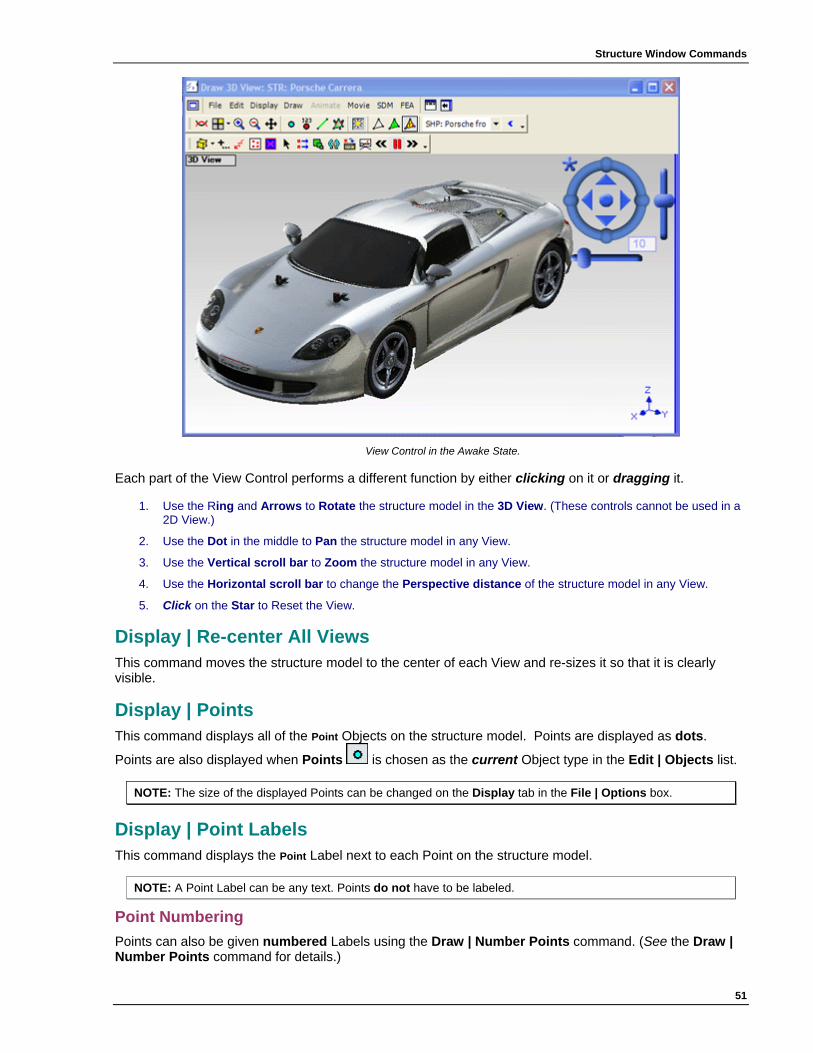
Structure Window Commands
51
View Control in the Awake State.
Each part of the View Control performs a different function by either clicking on it or dragging it.
1. Use the Ring and Arrows to Rotate the structure model in the 3D View. (These controls cannot be used in a 2D View.)
2. Use the Dot in the middle to Pan the structure model in any View.
3. Use the Vertical scroll bar to Zoom the structure model in any View.
4. Use the Horizontal scroll bar to change the Perspective distance of the structure model in any View.
5. Click on the Star to Reset the View.
Display | Re-center All Views This command moves the structure model to the center of each View and re-sizes it so that it is clearly visible.
Display | Points This command displays all of the Point Objects on the structure model. Points are displayed as dots.
Points are also displayed when Points is chosen as the current Object type in the Edit | Objects list.
NOTE: The size of the displayed Points can be changed on the Display tab in the File | Options box.
Display | Point Labels This command displays the Point Label next to each Point on the structure model.
NOTE: A Point Label can be any text. Points do not have to be labeled.
Point Numbering Points can also be given numbered Labels using the Draw | Number Points command. (See the Draw | Number Points command for details.)
ME'scope Reference Volume IIA - Basic Operations
52
NOTE: Numbered Point Labels are used by Draw | Assign M#s or the Assign M#s command in a Data Block, Shape Table, or Acquisition window to assign measurements to Points & directions on the structure model.
Numbering by Row Number To label all (or selected) Points with their row number in the Points spreadsheet
• Double click on the Label column heading in the spreadsheet. A dialog box will open.
• Check Set Label To Row Number in the dialog box
• Click on OK.
Display | Lines
This command displays all of the Lines on the structure model. Lines are also displayed when Lines is chosen as the current Object type in the Edit | Objects list.
Display | Surfaces The commands in this menu are used for displaying Surface Objects on the structure model. Surfaces are
also displayed when either Surface Triangles or Surface Quads is chosen as the current Object type in the Edit | Objects list.
Surface colors can be changed in the Color column of the Surface Triangles or Surface Quads spreadsheets. Also, all of the Surfaces referenced by a SubStructure can be colored by changing the Surface color in the Colors column of the SubStructure spreadsheet.
• When Display Surfaces | Filled is depressed, all Surfaces are displayed and filled with their individual colors.
• When Display Surfaces | Outlined is depressed, all Surfaces are displayed in outlined format using their individual colors.
• When Display Surfaces | Texture is depressed, all Surface textures are displayed if available.
• When Display Surfaces | Transparent is depressed, all Surfaces are displayed as transparent Surfaces.
• When Display Surfaces | Lights is depressed, all Surfaces are displayed with lights shining on them.
• When Display Surfaces | Surface Normals is depressed, all Surface normals are displayed.
• When Display Surfaces | Reverse Normals is executed, the Surface normals or all (or selected) Surfaces are reversed in direction.
Options Lights Tab This tab in the File | Options dialog box is for controlling the Surface lights in the Structure window.
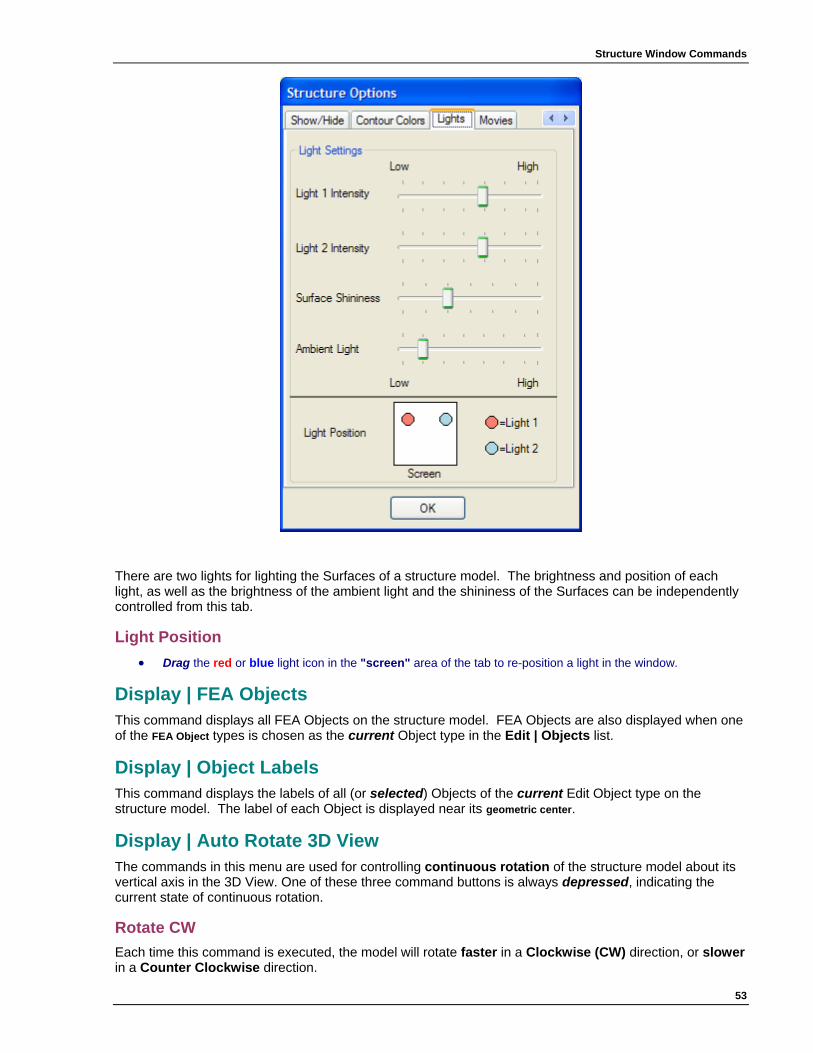
Structure Window Commands
53
There are two lights for lighting the Surfaces of a structure model. The brightness and position of each light, as well as the brightness of the ambient light and the shininess of the Surfaces can be independently controlled from this tab.
Light Position • Drag the red or blue light icon in the "screen" area of the tab to re-position a light in the window.
Display | FEA Objects This command displays all FEA Objects on the structure model. FEA Objects are also displayed when one of the FEA Object types is chosen as the current Object type in the Edit | Objects list.
Display | Object Labels This command displays the labels of all (or selected) Objects of the current Edit Object type on the structure model. The label of each Object is displayed near its geometric center.
Display | Auto Rotate 3D View The commands in this menu are used for controlling continuous rotation of the structure model about its vertical axis in the 3D View. One of these three command buttons is always depressed, indicating the current state of continuous rotation.
Rotate CW Each time this command is executed, the model will rotate faster in a Clockwise (CW) direction, or slower in a Counter Clockwise direction.
ME'scope Reference Volume IIA - Basic Operations
54
Stop This command stops continuous rotation of the model in the 3D View.
Rotate CCW Each time this command is executed, the model will rotate faster in a Counter Clockwise (CCW) direction, or slower in a Clockwise direction.
Draw Menu The Structure window is either in the Draw state or the Animate state, which is denoted on the window Title Bar. This menu is enabled when the Structure window is in the Draw state.
Draw | Animate This command initiates the Animate state of the Structure window. The structure model is animated using data from the connected Animation Source. The current Animation Source is the Data Block, Shape Table, or Acquisition window that is displayed in the Animation Source list on the Structure window Toolbar.
NOTE: Animation can also be initiated by executing the Animate Shapes command from any Data Block, Shape Table or Acquisition window
Two requirements must be met before animation can begin,
1. The structure model must have valid Measured Animation Equations at one or more Points.
2. An Animation Source (Data Block, Shape Table or Acquisition file window) must be open in the Work Area.
Animation From a Data Block or Acquisition Window Animation is achieved in three ways from a Data Block or Acquisition window,
• Sweep animation. The cursor is swept through the Traces in a Data Block and the Trace values at the cursor position are displayed on the 3D model as the shape.
• Sine Dwell at a cursor position. The Trace values at the cursor position are multiplied by sine wave values (ranging between -1 & +1) to give the shape a sinusoidal motion.
• Stationary Dwell at a cursor position. The Trace values at the cursor position are displayed as the shape.
Animation From a Shape Table Shape Table animation is also achieved in three ways,
• Sweep animation. Each shape in displayed in Sine Dwell animation followed by the next shape in the Shape Table. After the last shape in the Table is animated, animation continues using the first shape.
• Sine Dwell of a selected Shape. Each animation frame is created by multiplying each shape component for the selected Shape by a different sine wave value (ranging between -1 & +1).
• Stationary Dwell of a selected Shape. All shape components for the selected Shape are displayed without animation.
To observe each of the three kinds of animation,
• Execute each of the Animate | Animate With commands in the Structure window.
Which Shape Data is Displayed? The shape data that is displayed on the structure model depends upon which part of the data is displayed in the Animation Source.

Structure Window Commands
55
• If the Display | Real button is depressed, only the Real part of the Trace or Shape Table data is animated on the structure model.
• If the Display | Imaginary button is depressed, only the Imaginary part of the Trace or Shape Table data is animated on the model.
• For all other data displays, a complex shape (Magnitude & Phase) is animated.
Changing the Animation Source During animation, to animate data from any Data Block, Shape Table or Acquisition window that is open in the Work Area,
1. Click on the Data Block, Shape Table or Acquisition window to make it the current Animation Source, or
2. Choose the Data Block, Shape Table or Acquisition window from the Animation Source list on the Structure window Toolbar.
REMINDER: Since the Animation Equations only use M#s to display shape data, each M# in the current Animation Source must contain the correct measurement data for each DOF (point & direction) of the structure model. If Traces (M#s) or shape DOFs (M#s) are re-ordered, then new Animation Equations must be created in order to display shapes correctly. (See an Assign M#s command for details.)
Selected M#s If M#s are selected, then only shape data for the selected M#s will be displayed in animation.
• In a Data Block or Acquisition window, Traces (M#s) are selected by using one of the Edit | Select Traces commands.
• In a Shape Table window, Shape DOFs (M#s) are selected by using one of the Edit | Select DOFs commands.
Terminating Animation To terminate animation and return the Structure window to the Draw state,
• Execute Animate | Draw or press its button on the Toolbar.
Animating From Multiple Sources If the M#s in two or more Animation Sources correspond to measurements at the same DOFs on a structure, then animation can be switched from one Source to another without stopping the animation. To switch from one Animation Source to another,
1. Click on a Data Block or Acquisition window to animate its data, or
2. Click on a Shape button in a Shape Table window to animate its data, or
3. Choose a Source from the Animation Source list on the Structure window Toolbar.
To demonstrate animation from two Sources,
• Execute Help | Demos | Frequency-Based ODS in the ME'scopeVES window.
The DEMO Project will open and begin animation. Notice that the Project has two Animation Sources, a Data Block (BLK: FRFs) and a Shape Table (SHP: Mode Shapes).
• Right click on the SHP: Mode Shapes file in the Project panel, and select Open from the menu to open its window.
• Execute Window | Arrange | For Animation to arrange the three windows.
• Click on a Shape button in the Shape Table window to display its shape.
• Drag the Line cursor in the Data Block window to display its shape.
ME'scope Reference Volume IIA - Basic Operations
56
Animation From a Data Block or Shape Table.
Draw | Drawing Assistant This command opens and closes the Drawing Assistant tabs in the Structure window. The Drawing Assistant is used to draw and edit structure models. Complex structure models can be built by assembling together several simpler SubStructures. The Drawing Assistant allows you to build a structure model by assembling together SubStructures in two ways,
1. Choose SubStructures from a Library of pre-defined Substructures, or
2. Create new SubStructures starting from simple geometric structures such as squares, cubes, circles, cylinders, etc.
To open the Drawing Assistant,
• Execute Draw | Drawing Assistant, or
• Choose SubStructures from the Objects list on the Toolbar, and execute Edit | Add Object.
When the Drawing Assistant is open, the Drawing Assistant tabs are displayed in the Structure window to the right of the vertical blue splitter bar, as shown below.
Structure Window Showing Drawing Assistant Tabs.
• The Drawing Assistant displays the SubStructure, Dimensions, Position, Extrude & Revolve tabs.
NOTE: The controls on the Dimensions, Position, Extrude & Revolve tabs can only be applied to one selected SubStructure at a time.
SubStructure Tab This tab contains a browser listing of the Library of pre-defined SubStructures. The Library is stored in the SubStructure folder on disk. Any one of the SubStructures in the Library can be added to the model in the Structure window.
NOTE: You can add your own SubStructures to the SubStructure Library by executing the File | Save in Library command.
• Double click on a SubStructure in the Library browser list to add the SubStructure to the model in the Structure window,
Dimensions Tab The Length, Width, and Height of the selected SubStructure can be changed on this tab.
Editable SubStructures The Substructures with green surfaces in the top of the browser list are called editable SubStructures. If a SubStructure is an editable SubStructure, then in addition to its dimensions, you can also specify the Number of Points in each direction on the Dimensions tab. Depending on the coordinates of the editable SubStructure, its dimensions are,
Rectangular: Width, Height, Length.
Cylindrical: Radius, Radial Angle, Length.
Spherical: Radius, Radial Angle, Height Angle.
Some Substructures have additional properties that can also be changed. Each time you change a dimension, the SubStructure is re-drawn to reflect the change.
Structure Window Commands
57
Position Tab On this tab, you can do the following,
• Rotate a selected SubStructure about its Local or Global (X, Y, Z) axes.
• Translate the Local origin of a selected SubStructure with respect to the Global axes.
Extrude Tab This tab is used to extrude any Line into a 2D SubStructure, or any 2D SubStructure into a 3D SubStructure. In order to be extruded, a 2D SubStructure must be relatively "flat" in one of its Global (X, Y, Z) dimensions.
NOTE: A 2D SubStructure can only be extruded in the Global direction that is "flat" relative to the other two directions. The "flat" direction has a Global dimension that is nearly the same for all Points, and substantially less than the other two dimensions.
Revolve Tab This tab is used to revolve any Line into a 2D SubStructure, or any 2D SubStructure into a 3D SubStructure. In order to be revolved, a 2D SubStructure must be relatively "flat" in one Global (X, Y, Z) dimension.
NOTE: A 2D SubStructure can only be revolved in the Global directions that are not the "flat" direction. The "flat" direction has a Global dimension that is nearly the same for all Points, and substantially less than the other two dimensions.
Draw | Select Measurements This command selects the measurements (M#s) in the current Animation Source window that are contained in the Animation Equations of the selected Points on the structure model. When it is executed, the current Animation Source window is displayed, and the selected M#s are also displayed in the appropriate spreadsheet.
Draw | Assign M#s This command creates Measured Animation Equations at each Point on the structure model by assigning the measurements (M#s) of the current Animation Source to DOFs (Points & directions) on the model. The current Animation Source is the Data Block, Shape Table or Acquisition window listed in the Animation Source drop down list on the Toolbar.
NOTE: Executing this command is the same as executing Assign M#s in a Data Block, Shape Table or Acquisition window. (See Tools | Assign M#s in the Data Block Window Commands chapter for details on the use of this command.)
Draw | Animation Equations This menu contains commands for creating and editing Animation Equations. Animations Equations are used to animate each DOF (Point & direction) on the structure model with shape data from the current Animation Source.
Equation Editor This command opens or closes the Animation Equation Editor. When its button is depressed, the Equation Editor is open, and the Editor tabs are displayed above the Points spreadsheet as shown below.
When the Equation Editor is opened, the Edit | Click Select command is also enabled, so that Measurement Axes and Animation Equations can be displayed for selected Points. (Details of the Measurement Axes and Animation Equations tabs are contained in the following sections.)
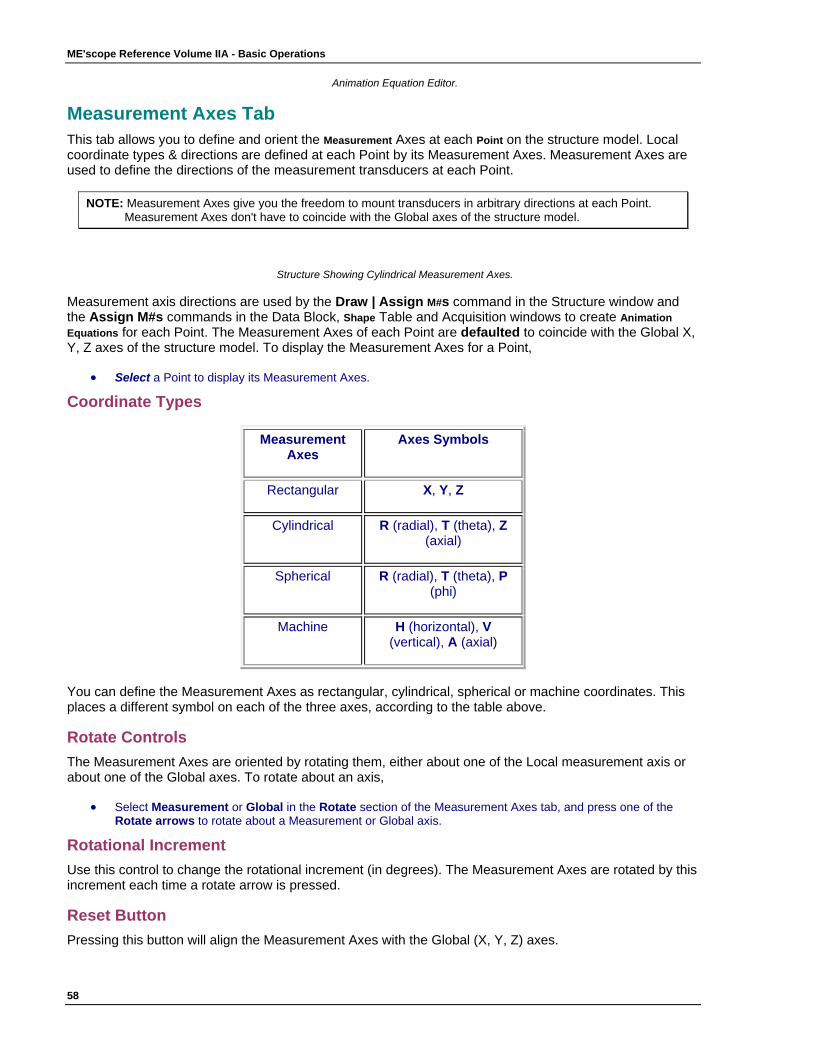
ME'scope Reference Volume IIA - Basic Operations
58
Animation Equation Editor.
Measurement Axes Tab This tab allows you to define and orient the Measurement Axes at each Point on the structure model. Local coordinate types & directions are defined at each Point by its Measurement Axes. Measurement Axes are used to define the directions of the measurement transducers at each Point.
NOTE: Measurement Axes give you the freedom to mount transducers in arbitrary directions at each Point. Measurement Axes don't have to coincide with the Global axes of the structure model.
Structure Showing Cylindrical Measurement Axes.
Measurement axis directions are used by the Draw | Assign M#s command in the Structure window and the Assign M#s commands in the Data Block, Shape Table and Acquisition windows to create Animation Equations for each Point. The Measurement Axes of each Point are defaulted to coincide with the Global X, Y, Z axes of the structure model. To display the Measurement Axes for a Point,
• Select a Point to display its Measurement Axes.
Coordinate Types
Measurement Axes
Axes Symbols
Rectangular X, Y, Z
Cylindrical R (radial), T (theta), Z (axial)
Spherical R (radial), T (theta), P (phi)
Machine H (horizontal), V (vertical), A (axial)
You can define the Measurement Axes as rectangular, cylindrical, spherical or machine coordinates. This places a different symbol on each of the three axes, according to the table above.
Rotate Controls The Measurement Axes are oriented by rotating them, either about one of the Local measurement axis or about one of the Global axes. To rotate about an axis,
• Select Measurement or Global in the Rotate section of the Measurement Axes tab, and press one of the Rotate arrows to rotate about a Measurement or Global axis.
Rotational Increment Use this control to change the rotational increment (in degrees). The Measurement Axes are rotated by this increment each time a rotate arrow is pressed.
Reset Button Pressing this button will align the Measurement Axes with the Global (X, Y, Z) axes.
Structure Window Commands
59
NOTE: If the Measurement axes are Cylindrical or Spherical, pressing the Reset button will align the local radial direction (R) of each Radial Point with the radial direction from its Center Point. (See Points Spreadsheet for a definition of Radial and Center Points.)
Animation Equations Tab This tab allows you to define and edit the Animation equations at each Point on the structure model.
• Select a Point to display its Animation Equations in the spreadsheet on this tab.
Animation Equations Each Point on a structure model is animated by evaluating its Animation equations. An Animation equation is simply a weighted summation of measurements (or M#s). If the current Animation Source has an M# that is contained in an Animation equation, data from the M# is used to evaluate the equation and animate the Point & direction (DOF) to which the equation belongs.
NOTE: Each Trace in a Data Block or Acquisition window has a unique M#. Each shape DOF in the DOFs spreadsheet of the a Shape Table also has a unique M#.
Once Animation equations are created, they become part of the Structure (STR) file and can be used to animate shape data from any Animation Source.
Equations for Each Point Four different types of Animation Equations can be created at each Point;
1. Translation Equations: Examples of translation data are vibration data and acoustic intensity. As many as three Translation equations can be created at each Point, one for each Measurement Axis direction.
2. Scalar Equation: Examples of scalar data are sound pressure level (SPL), sound power, temperature or pressure data. This data is typically animated using color contours on a surface model. Because scalar data has no direction associated with it, only one Scalar equation can be created at each Point.
3. Machine Rotations: Machine rotational data is measured from a rotating shaft. This data is animated by displaying the rigid body rotation of all Radial Points about a Center Point. As many as three Machine Rotation equations can be created at each Center Point, one for each Measurement Axis direction.
4. FEA Rotations: Rotational DOFs are created as part of FEA modal shapes. As many as three FEA Rotation equations can be created at each Point, one for each Measurement Axis direction. FEA Rotation equations are also used to perform Structural Modifications and FEA Model Updating using FEA mode shapes.
NOTE: Machine Rotations are enabled as part of the VES-2000 Rotating Machine Animation option. FEA Rotations are enabled as part of the VES-8000 Experimental FEA and VES-9000 FEA Model Updating options.
Measured, Interpolated, or Fixed DOFs Each DOF (Point & direction) on a structure model has one of the following types of animation defined for it;
1. Measured: A DOF with a Measured animation equation in a measured direction. Measured equations are created when M#s in an Animation Source (Data Block, Shape Table or Acquisition window) are assigned to DOFs of the structure model.
2. Interpolated: A DOF with a Interpolated animation equation in a un-measured direction. Interpolated equations are created by executing Draw | Animation Equations | Interpolate after Measured equations have been created.
3. Fixed: A Point and direction that will not move during animation.
Equation Rules Measured equations must be defined for all Measured Points before animation can occur at those Points. Interpolated equations and Fixed Points are optional.

ME'scope Reference Volume IIA - Basic Operations
60
Measured Points (& directions) should correspond to physical points (& directions) where measurements were actually made on a structure. Interpolated Points (& directions) should correspond to all remaining Points (& directions) where measurements were not made. All Points (& directions) on a new structure model are defaulted to Interpolated, with no equations defined for them.
Since the Animation equations use M#s to retrieve shape data for a structure DOF (Point & direction), the M#s in the current Animation Source must contain the correct measurement data for each structure DOF. The M#s always start with M#1 and are numbered consecutively in the current Animation Source.
Draw | Animation Equations | Interpolate All (or Selected) Points This command creates Interpolated animation equations for all (or selected) Points & directions (DOFs) that are un-measured.
NOTE: An un-measured DOF is one that has no Measured animation equation or that is Fixed.
Interpolated equations are used to provide animation for all un-measured DOFs on the structure model so that its animated shapes look more realistic.
NOTE: Interpolation is enabled during animation by executing Animate | Interpolation.
How Interpolated Equations Are Created An Interpolated equation is created by the "influence" of neighboring Measured & Fixed DOFs. Translation and Rotation Interpolated equations are created for each un-measured Point and Measurement axis direction where there is the influence of at least one Measured equation. Scalar Interpolated equations are generated for each un-measured Point.
Each Interpolated equation is a weighted summation of M#s, where the weighting is determined by the geometric distance of a Measured or Fixed Point from the Interpolated Point. Measured or Fixed Points that are "close" to the Interpolated Point are weighted more heavily than those that are a greater distance from the Interpolated Point.
Creating the Equations When this command is executed, a dialog box is opened, as shown below. In this dialog box you can select the Measurement Axes directions for creating Interpolated equations.

Structure Window Commands
61
Each Point has one of the following types of Measurement Axes, each type having different Axis Directions. The dialog box above allows you to select the first, second, or third axis direction for creating Translation or Rotation equations, regardless of the type of Measurement Axes at each Point.
Measurement Axes
Axes Directions
Rectangular X, Y, Z Cylindrical R (radial), T (theta), Z
(axial) Spherical R (radial), T (theta), P
(phi) Machine H (horizontal), V
(vertical), A (axial)
• Select directions and click on OK. The following dialog box will open.
In this dialog box, you can specify the maximum number of nearest neighboring Measured and Fixed Points to be used in creating the Interpolated equation for each un-measured DOF.
• Enter a maximum number of nearest Measured and Fixed Points (1 to 10).to be used for creating Interpolation equations.
• Click on OK to create the Interpolated equations.
Examining the Equations To examine the Interpolated equations,
• Execute Animation Equations | Equation Editor to display the Equation Editor tabs above the Point spreadsheet, and enable Edit | Click Select.
• Select the Animation Equation tab.
• Select a Point to display its animation equations.
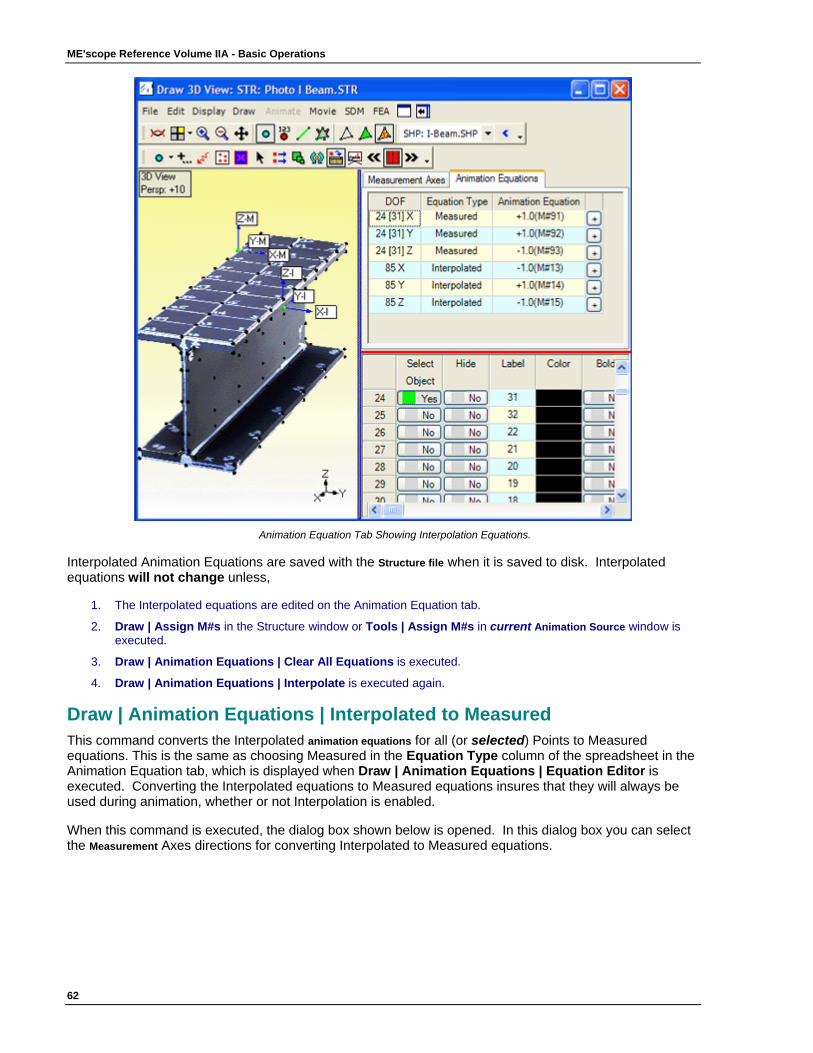
ME'scope Reference Volume IIA - Basic Operations
62
Animation Equation Tab Showing Interpolation Equations.
Interpolated Animation Equations are saved with the Structure file when it is saved to disk. Interpolated equations will not change unless,
1. The Interpolated equations are edited on the Animation Equation tab.
2. Draw | Assign M#s in the Structure window or Tools | Assign M#s in current Animation Source window is executed.
3. Draw | Animation Equations | Clear All Equations is executed.
4. Draw | Animation Equations | Interpolate is executed again.
Draw | Animation Equations | Interpolated to Measured This command converts the Interpolated animation equations for all (or selected) Points to Measured equations. This is the same as choosing Measured in the Equation Type column of the spreadsheet in the Animation Equation tab, which is displayed when Draw | Animation Equations | Equation Editor is executed. Converting the Interpolated equations to Measured equations insures that they will always be used during animation, whether or not Interpolation is enabled.
When this command is executed, the dialog box shown below is opened. In this dialog box you can select the Measurement Axes directions for converting Interpolated to Measured equations.
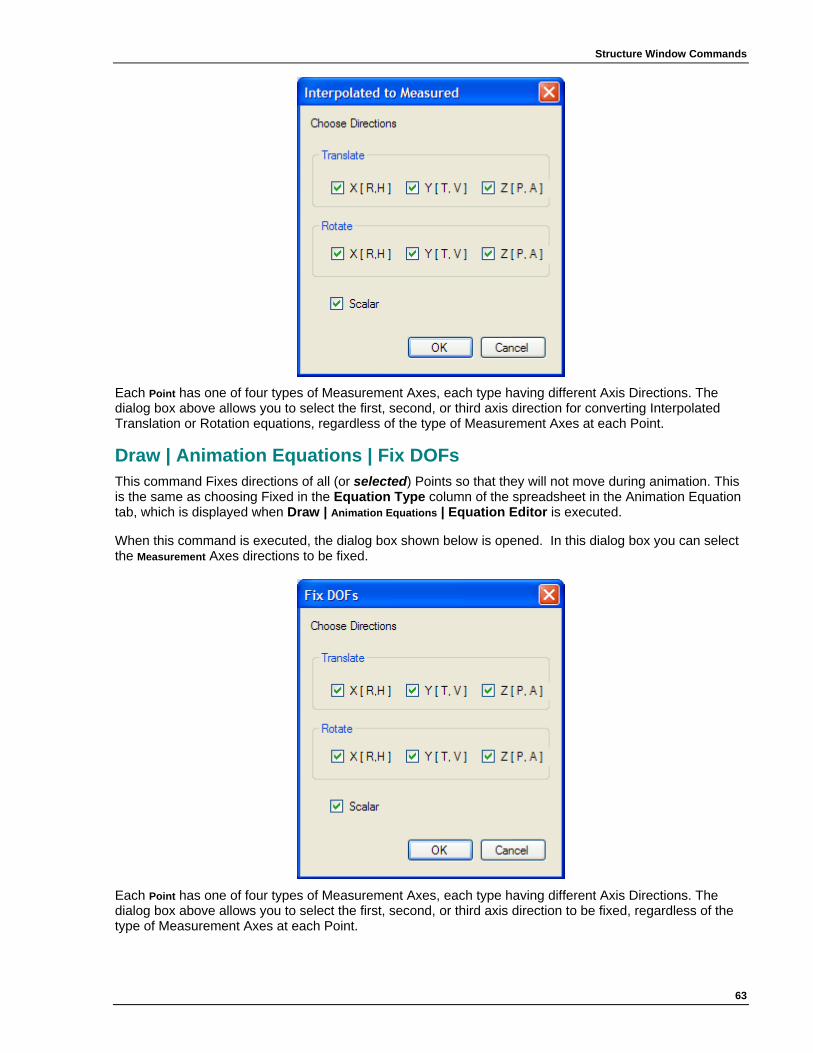
Structure Window Commands
63
Each Point has one of four types of Measurement Axes, each type having different Axis Directions. The dialog box above allows you to select the first, second, or third axis direction for converting Interpolated Translation or Rotation equations, regardless of the type of Measurement Axes at each Point.
Draw | Animation Equations | Fix DOFs This command Fixes directions of all (or selected) Points so that they will not move during animation. This is the same as choosing Fixed in the Equation Type column of the spreadsheet in the Animation Equation tab, which is displayed when Draw | Animation Equations | Equation Editor is executed.
When this command is executed, the dialog box shown below is opened. In this dialog box you can select the Measurement Axes directions to be fixed.
Each Point has one of four types of Measurement Axes, each type having different Axis Directions. The dialog box above allows you to select the first, second, or third axis direction to be fixed, regardless of the type of Measurement Axes at each Point.
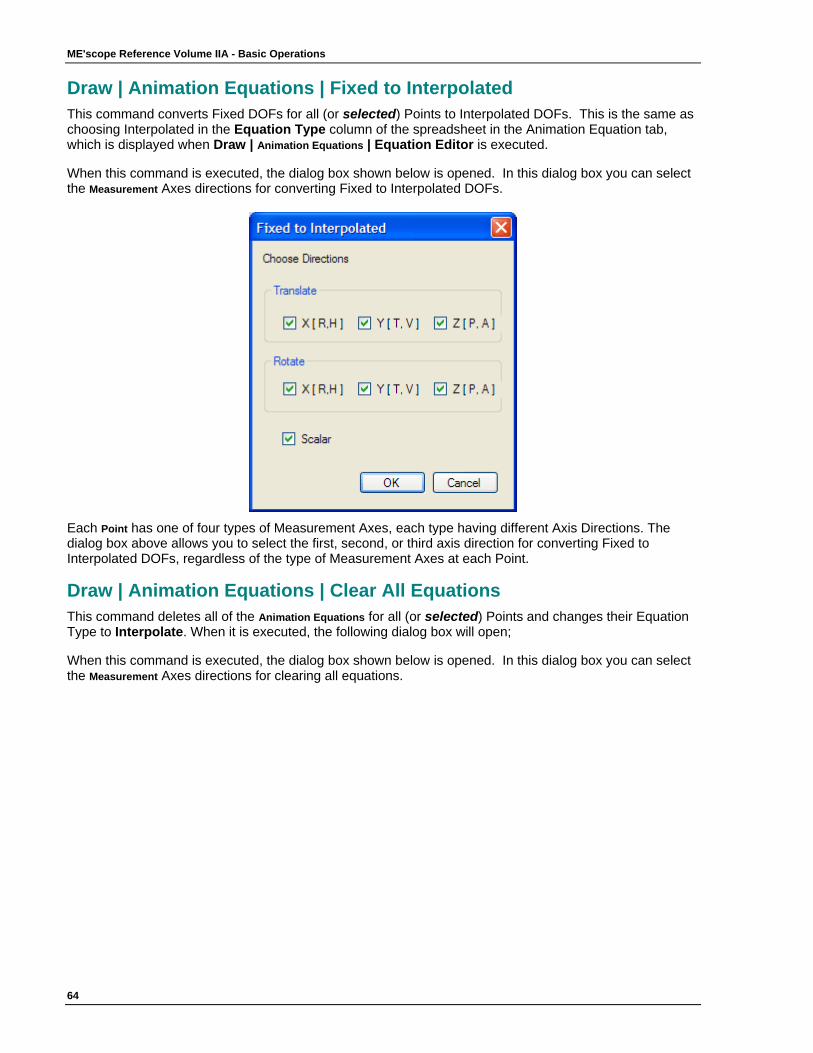
ME'scope Reference Volume IIA - Basic Operations
64
Draw | Animation Equations | Fixed to Interpolated This command converts Fixed DOFs for all (or selected) Points to Interpolated DOFs. This is the same as choosing Interpolated in the Equation Type column of the spreadsheet in the Animation Equation tab, which is displayed when Draw | Animation Equations | Equation Editor is executed.
When this command is executed, the dialog box shown below is opened. In this dialog box you can select the Measurement Axes directions for converting Fixed to Interpolated DOFs.
Each Point has one of four types of Measurement Axes, each type having different Axis Directions. The dialog box above allows you to select the first, second, or third axis direction for converting Fixed to Interpolated DOFs, regardless of the type of Measurement Axes at each Point.
Draw | Animation Equations | Clear All Equations This command deletes all of the Animation Equations for all (or selected) Points and changes their Equation Type to Interpolate. When it is executed, the following dialog box will open;
When this command is executed, the dialog box shown below is opened. In this dialog box you can select the Measurement Axes directions for clearing all equations.
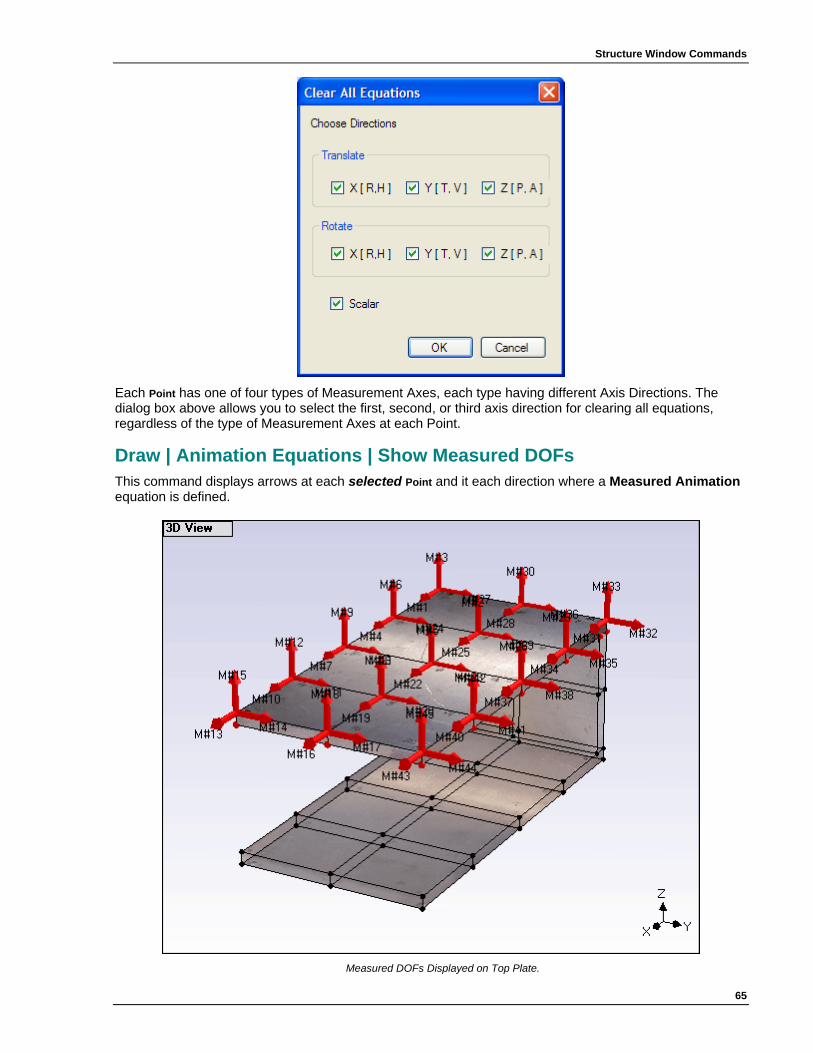
Structure Window Commands
65
Each Point has one of four types of Measurement Axes, each type having different Axis Directions. The dialog box above allows you to select the first, second, or third axis direction for clearing all equations, regardless of the type of Measurement Axes at each Point.
Draw | Animation Equations | Show Measured DOFs This command displays arrows at each selected Point and it each direction where a Measured Animation equation is defined.
Measured DOFs Displayed on Top Plate.
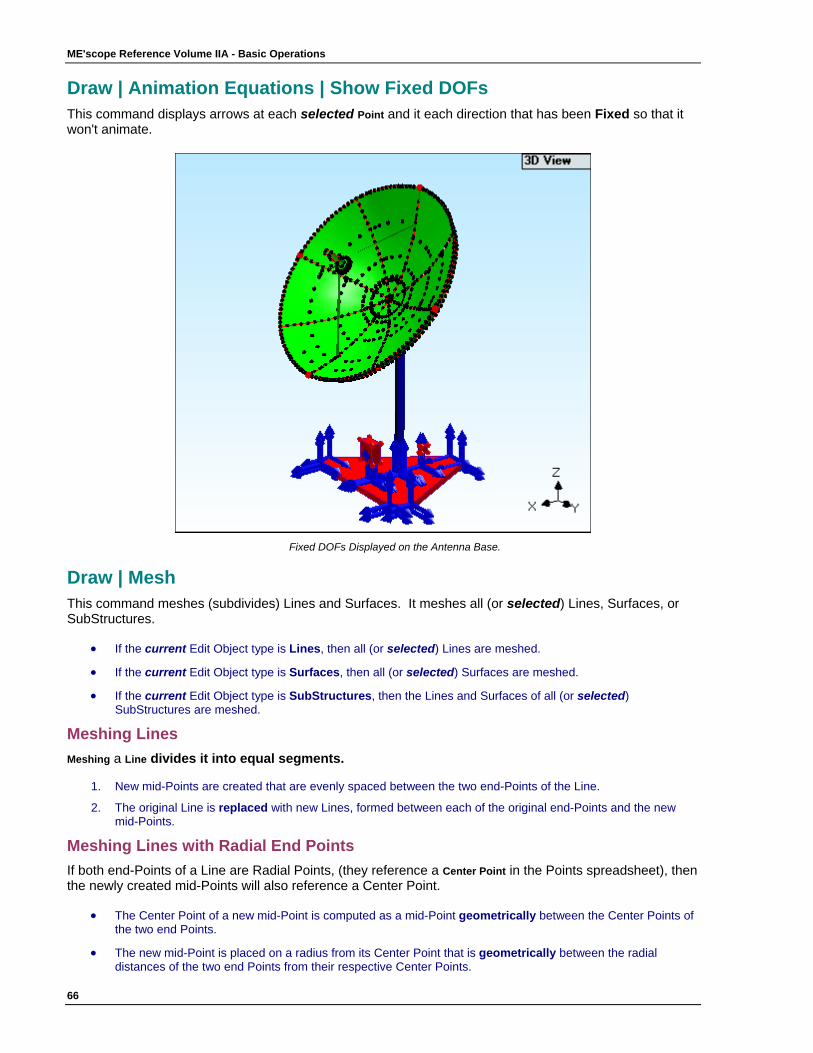
ME'scope Reference Volume IIA - Basic Operations
66
Draw | Animation Equations | Show Fixed DOFs This command displays arrows at each selected Point and it each direction that has been Fixed so that it won't animate.
Fixed DOFs Displayed on the Antenna Base.
Draw | Mesh This command meshes (subdivides) Lines and Surfaces. It meshes all (or selected) Lines, Surfaces, or SubStructures.
• If the current Edit Object type is Lines, then all (or selected) Lines are meshed.
• If the current Edit Object type is Surfaces, then all (or selected) Surfaces are meshed.
• If the current Edit Object type is SubStructures, then the Lines and Surfaces of all (or selected) SubStructures are meshed.
Meshing Lines Meshing a Line divides it into equal segments.
1. New mid-Points are created that are evenly spaced between the two end-Points of the Line.
2. The original Line is replaced with new Lines, formed between each of the original end-Points and the new mid-Points.
Meshing Lines with Radial End Points If both end-Points of a Line are Radial Points, (they reference a Center Point in the Points spreadsheet), then the newly created mid-Points will also reference a Center Point.
• The Center Point of a new mid-Point is computed as a mid-Point geometrically between the Center Points of the two end Points.
• The new mid-Point is placed on a radius from its Center Point that is geometrically between the radial distances of the two end Points from their respective Center Points.
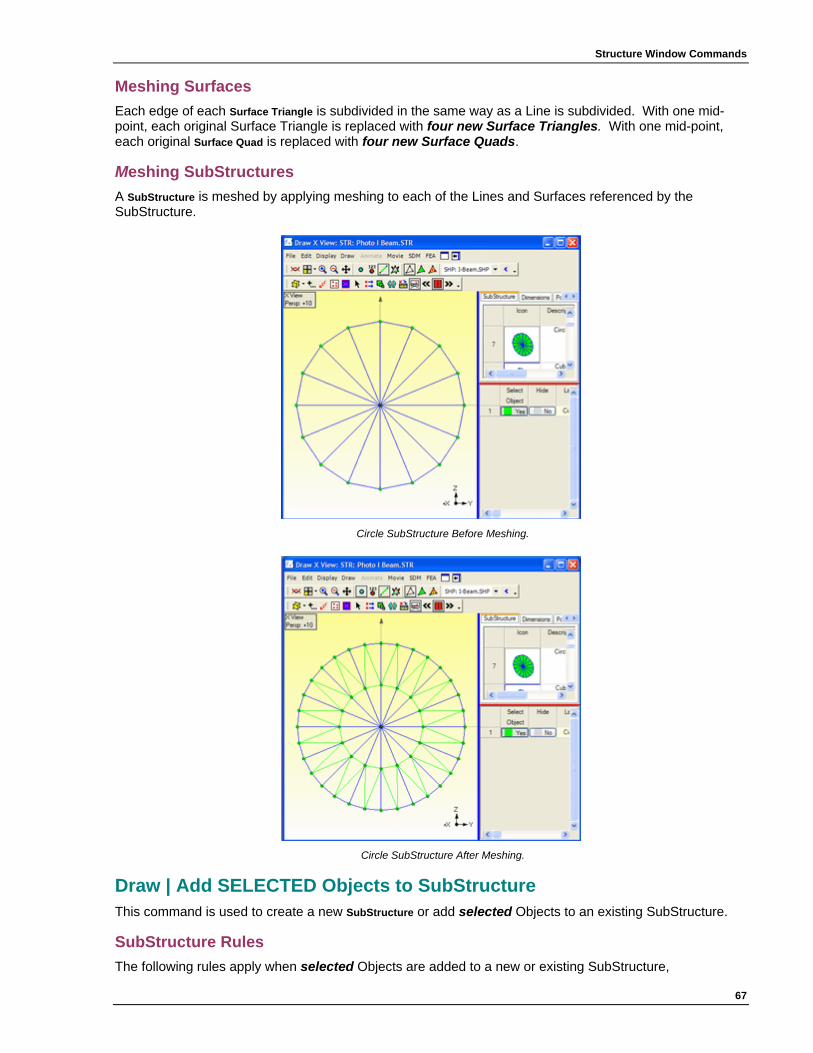
Structure Window Commands
67
Meshing Surfaces Each edge of each Surface Triangle is subdivided in the same way as a Line is subdivided. With one mid-point, each original Surface Triangle is replaced with four new Surface Triangles. With one mid-point, each original Surface Quad is replaced with four new Surface Quads.
Meshing SubStructures A SubStructure is meshed by applying meshing to each of the Lines and Surfaces referenced by the SubStructure.
Circle SubStructure Before Meshing.
Circle SubStructure After Meshing.
Draw | Add SELECTED Objects to SubStructure This command is used to create a new SubStructure or add selected Objects to an existing SubStructure.
SubStructure Rules The following rules apply when selected Objects are added to a new or existing SubStructure,

ME'scope Reference Volume IIA - Basic Operations
68
• The SubStructure only references the selected Objects. The Objects still exist as unique Objects in the Structure file.
• If the selected Objects are Points, then all of the Objects that use the Points as end Points will also be referenced by the SubStructure.
• If the selected Objects are not Points, then their end Points will also be referenced by the SubStructure.
• SubStructures cannot reference other SubStructures.
When this command is executed, the following dialog box will open, allowing you to choose an existing SubStructure or create a new one.
NOTE: If any un-selected Objects reference Points that are to be added to the SubStructure, those Points are duplicated and the un-selected Objects are re-referenced to the duplicate Points.
Draw | Remove SELECTED Objects from SubStructure This command removes selected Objects from a SubStructure, The selected Objects are no longer referenced by the SubStructure, but they are not removed from the structure model. When this command is executed, the following dialog box will open,
• Choose a SubStructure from which to remove the selected Objects, and Click on the Remove Objects
button.
NOTE: If any un-selected Objects reference selected Points that are to be removed from the SubStructure, the un-selected Objects will also be removed from the SubStructure.

Structure Window Commands
69
Draw | Number Points This command allows you to interactively number the Points on the structure model. The Point Labels are used for Point numbering. Point Labels are displayed next to each Point on the structure model by executing Display | Point Labels. Point Labels can also be viewing and edited in the Points spreadsheet.
NOTE: Point numbering is required before using the Match Structure and Source DOFS method in Draw | Assign M#s command or the Assign M#s command in a Data Block, Shape Table and Acquisition windows.
When this command is executed, all of the current Point Labels are displayed on the structure model and the floating Number Points dialog box is opened.
3D View During Point Numbering.
With the Number Points dialog box open,
• Each time you click the mouse near a Point, its Label is changed to the Next Point number in the dialog box and the new Label is displayed next to the Point on the model.
• Each time you number a Point, the Next Point number is incremented in the dialog box. You can edit this number in the dialog box at any time during Point numbering.
• To clear the next Point Label that you click near, check the Clear box in the Number Points dialog.
• To clear all of the Point Labels, click on Clear All in the Number Points dialog box.
• To terminate Point numbering, click on Close in the Number Points dialog box.
Draw | Sort Points by Label This command sorts (re-orders) Points in the Points spreadsheet according to an ascending order of their numbered Labels. Points with numbered labels are listed first, followed by Points with non-numeric Labels and finally by Points with no Labels.
Draw | Add Point To Line This command adds a new Point to a Line, thus replacing the Line with two new Lines. After the Point is added to the Line, you can also drag the Point along the Line to position it anywhere between the end Points of the Line.
To add a Point to a Line,
• Execute Draw | Add Point to Line.
• Click on a Line to select it and add a Point to the selected Line.
The new Point will be displayed on the Line, and the new Point will be added to the Points spreadsheet.
Moving the Point
NOTE: To move the new Point on the Line, do not release the mouse button after you clicked to add the Point.
• Drag the new Point to a desired position on the Line before releasing the mouse button.
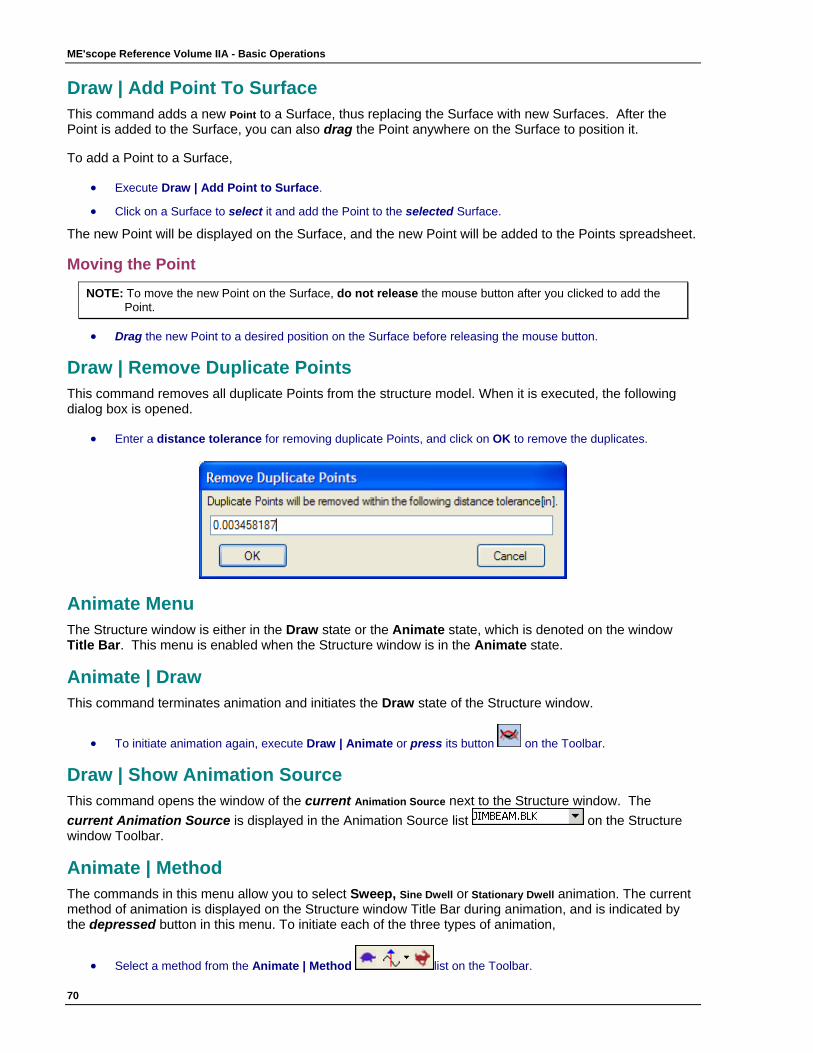
ME'scope Reference Volume IIA - Basic Operations
70
Draw | Add Point To Surface This command adds a new Point to a Surface, thus replacing the Surface with new Surfaces. After the Point is added to the Surface, you can also drag the Point anywhere on the Surface to position it.
To add a Point to a Surface,
• Execute Draw | Add Point to Surface.
• Click on a Surface to select it and add the Point to the selected Surface.
The new Point will be displayed on the Surface, and the new Point will be added to the Points spreadsheet.
Moving the Point
NOTE: To move the new Point on the Surface, do not release the mouse button after you clicked to add the Point.
• Drag the new Point to a desired position on the Surface before releasing the mouse button.
Draw | Remove Duplicate Points This command removes all duplicate Points from the structure model. When it is executed, the following dialog box is opened.
• Enter a distance tolerance for removing duplicate Points, and click on OK to remove the duplicates.
Animate Menu The Structure window is either in the Draw state or the Animate state, which is denoted on the window Title Bar. This menu is enabled when the Structure window is in the Animate state.
Animate | Draw This command terminates animation and initiates the Draw state of the Structure window.
• To initiate animation again, execute Draw | Animate or press its button on the Toolbar.
Draw | Show Animation Source This command opens the window of the current Animation Source next to the Structure window. The current Animation Source is displayed in the Animation Source list on the Structure window Toolbar.
Animate | Method The commands in this menu allow you to select Sweep, Sine Dwell or Stationary Dwell animation. The current method of animation is displayed on the Structure window Title Bar during animation, and is indicated by the depressed button in this menu. To initiate each of the three types of animation,
• Select a method from the Animate | Method list on the Toolbar.
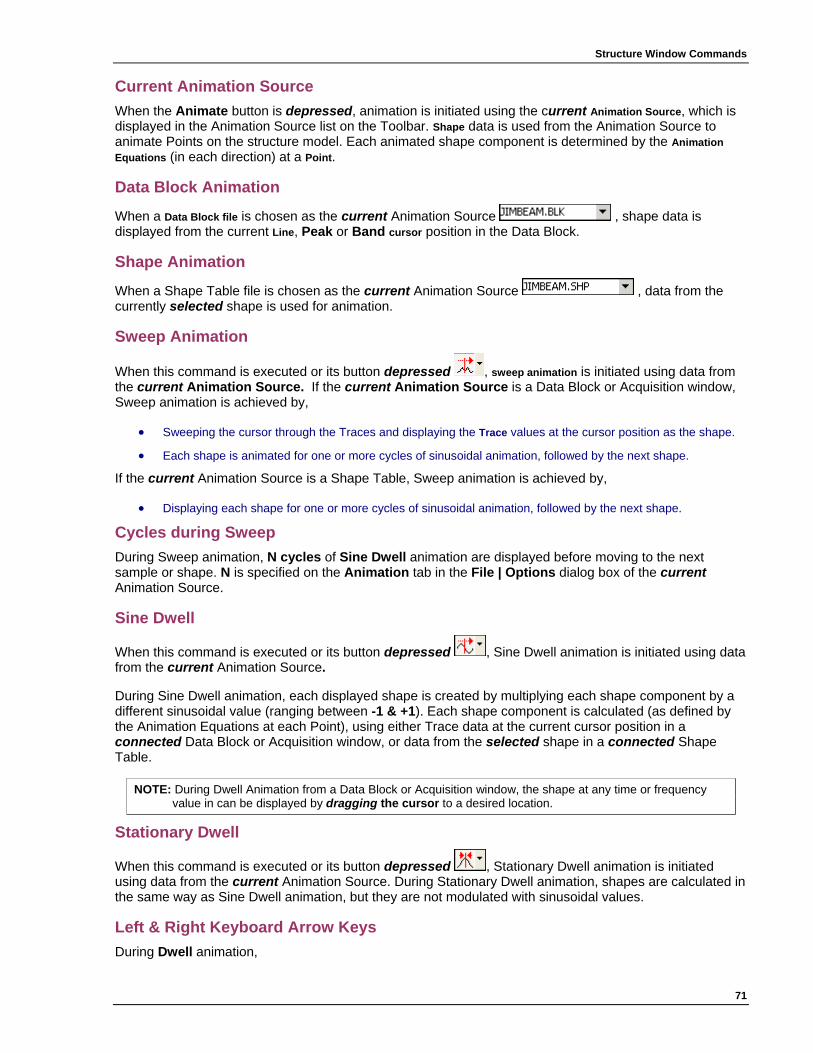
Structure Window Commands
71
Current Animation Source When the Animate button is depressed, animation is initiated using the current Animation Source, which is displayed in the Animation Source list on the Toolbar. Shape data is used from the Animation Source to animate Points on the structure model. Each animated shape component is determined by the Animation Equations (in each direction) at a Point.
Data Block Animation
When a Data Block file is chosen as the current Animation Source , shape data is displayed from the current Line, Peak or Band cursor position in the Data Block.
Shape Animation
When a Shape Table file is chosen as the current Animation Source , data from the currently selected shape is used for animation.
Sweep Animation
When this command is executed or its button depressed , sweep animation is initiated using data from the current Animation Source. If the current Animation Source is a Data Block or Acquisition window, Sweep animation is achieved by,
• Sweeping the cursor through the Traces and displaying the Trace values at the cursor position as the shape.
• Each shape is animated for one or more cycles of sinusoidal animation, followed by the next shape.
If the current Animation Source is a Shape Table, Sweep animation is achieved by,
• Displaying each shape for one or more cycles of sinusoidal animation, followed by the next shape.
Cycles during Sweep During Sweep animation, N cycles of Sine Dwell animation are displayed before moving to the next sample or shape. N is specified on the Animation tab in the File | Options dialog box of the current Animation Source.
Sine Dwell
When this command is executed or its button depressed , Sine Dwell animation is initiated using data from the current Animation Source.
During Sine Dwell animation, each displayed shape is created by multiplying each shape component by a different sinusoidal value (ranging between -1 & +1). Each shape component is calculated (as defined by the Animation Equations at each Point), using either Trace data at the current cursor position in a connected Data Block or Acquisition window, or data from the selected shape in a connected Shape Table.
NOTE: During Dwell Animation from a Data Block or Acquisition window, the shape at any time or frequency value in can be displayed by dragging the cursor to a desired location.
Stationary Dwell
When this command is executed or its button depressed , Stationary Dwell animation is initiated using data from the current Animation Source. During Stationary Dwell animation, shapes are calculated in the same way as Sine Dwell animation, but they are not modulated with sinusoidal values.
Left & Right Keyboard Arrow Keys During Dwell animation,
ME'scope Reference Volume IIA - Basic Operations
72
• Press the Left or Right Arrow key on the keyboard to move the animation cursor left or right in a connected Data Block or Acquisition window, or display the next or previous shape in a connected Shape Table.
Up & Down Keyboard Arrow Keys During Dwell animation with the Step button depressed,
• Press the Up or Down Arrow key on the keyboard to display the next or previous animation frame.
Using the Up & Down Keyboard Arrow Keys is the same as executing Animate | Next Frame or Animate | Previous Frame.
Animate | Increase, Decrease Speed These two commands are used to change the speed of animation. Each time one of these commands is executed, the speed is either increased (the rabbit tool) or decreased (the turtle Tool).
Data Block Sweep Speed During Sweep animation from a Data Block or Acquisition window, animation speed ranges between values of 0.1 & 15, The slowest speed is 0.1 and the fastest speed is 15.
For speeds equal or greater than 1, speed is increased by skipping over samples of data. For a speed of 1, every sample is displayed. For a speed of 2, every other sample is displayed, for a speed of 3 every third sample, etc.
For speeds less than 1 speed is decreased by linearly interpolating between adjacent samples of Trace data. To decrease speed, more interpolated values between samples are displayed in animation. For a speed of 0.1, ten shape values are interpolated between adjacent samples of Trace data.
Sine Dwell Speeds During Sine Dwell, animation speed ranges between values of 1 & 15. Animation speed is determined by using a different number of sine wave values per cycle. For a speed of 1, the maximum number of sine values per cycle is used. For a speed of 15, only four sine values per cycle are used.
Animate | Amplitude These commands allow you to change the amplitude of animation. Amplitude values range between 1 and 1000. The amplitude of shape animation is influenced by the type of shape scaling (Auto, Relative or Fixed)
you choose, and by using the Animation | Amplitude commands or their Tools on the Toolbar. Regardless of which scaling (Auto, Relative or Fixed) is used, you can always change the amplitude of Deformation or Arrows animation by using the Animate | Amplitude commands.
• Execute Animate | Increase Amplitude or Animate | Decrease Amplitude to change the amplitude value.
When the Animate | Increase Amplitude or Animate | Decrease Amplitude command is executed, the amplitude value is changed in increments of 1 between 1 and 5, and in increments of 5 above a value of 5.
• Execute Animate | Amplitude to enter an amplitude value in the dialog box that opens.
NOTE: The default value in the dialog box is the current Amplitude.

Structure Window Commands
73
Fixed Scale Animation amplitude is also used in conjunction with the Fixed Scale to fix the amplitude of animation. (See Animate | Scaling | Fixed Scale for details.)
Animate | Step This command is used to pause and resume the animation. When its button is depressed, animation is paused. When the animation is paused, the current animation frame is displayed, and the Animate | Next Frame and Animate | Previous Frame commands are enabled, allowing you to step through the animation frames one at a time.
• To pause animation, execute Animate | Step or click on its button on the Toolbar.
Next, Previous Frame To display the next or previous animation frame,
• Press the Next Frame or Previous Frame button on the Toolbar, or the Left or Right Arrow key on the keyboard.
• To resume animation, execute Animate | Step again or click on its depressed button.
NOTE: When Step is enabled, you can drag the cursor in a connected Data Block window to display a different shape, or select a different shape from a connected Shape Table.
Animate | Interpolation This command turns shape interpolation ON and OFF during animation. When interpolation is ON, shape values for all Interpolated DOFs are computed using the Interpolated Animation Equations at each Point. When interpolation is turned OFF, only Points with Measured Animation Equations are animated.
Creating Interpolated Animation Equations When Interpolation is enabled, if some Points have Interpolated directions but no Interpolated Animation Equations exist, you will be asked if you want to create new Interpolation Equations.
• If you answer Yes, a dialog box will open.
This dialog allows you to specify the number of nearest Measured and Fixed Points to be used to create new Interpolated Equations for each Point. (See Draw | Animation Equations | Interpolate for details.)
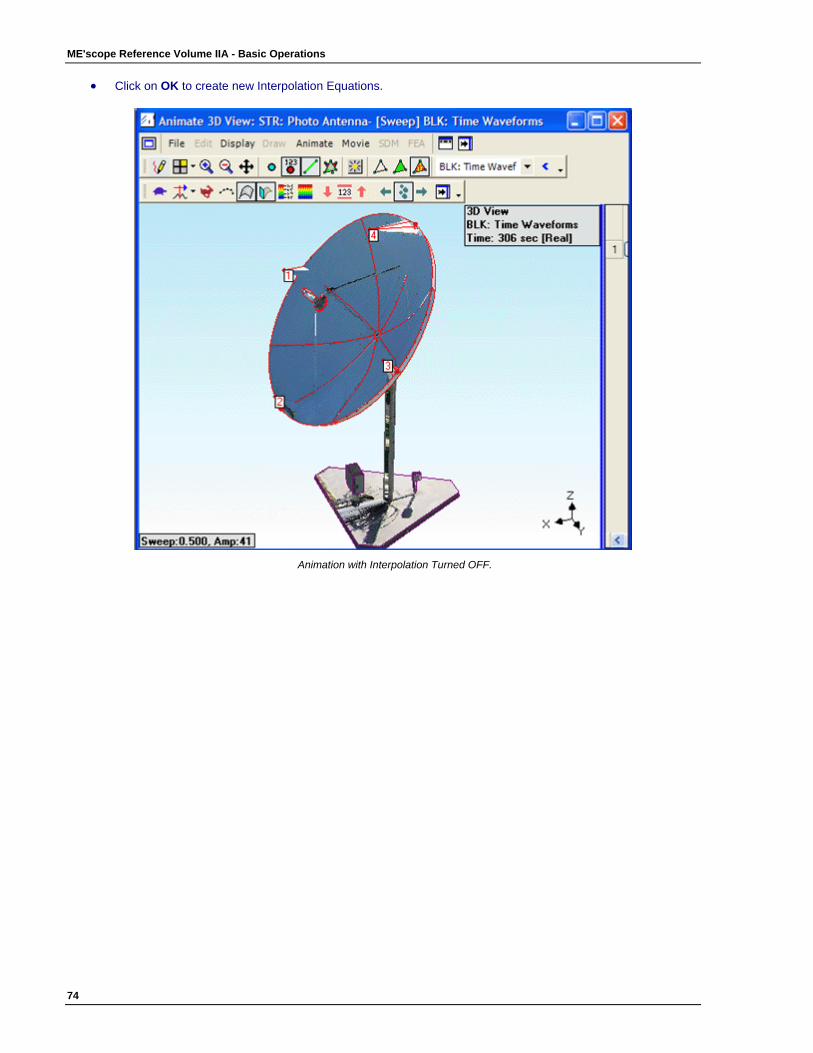
ME'scope Reference Volume IIA - Basic Operations
74
• Click on OK to create new Interpolation Equations.
Animation with Interpolation Turned OFF.
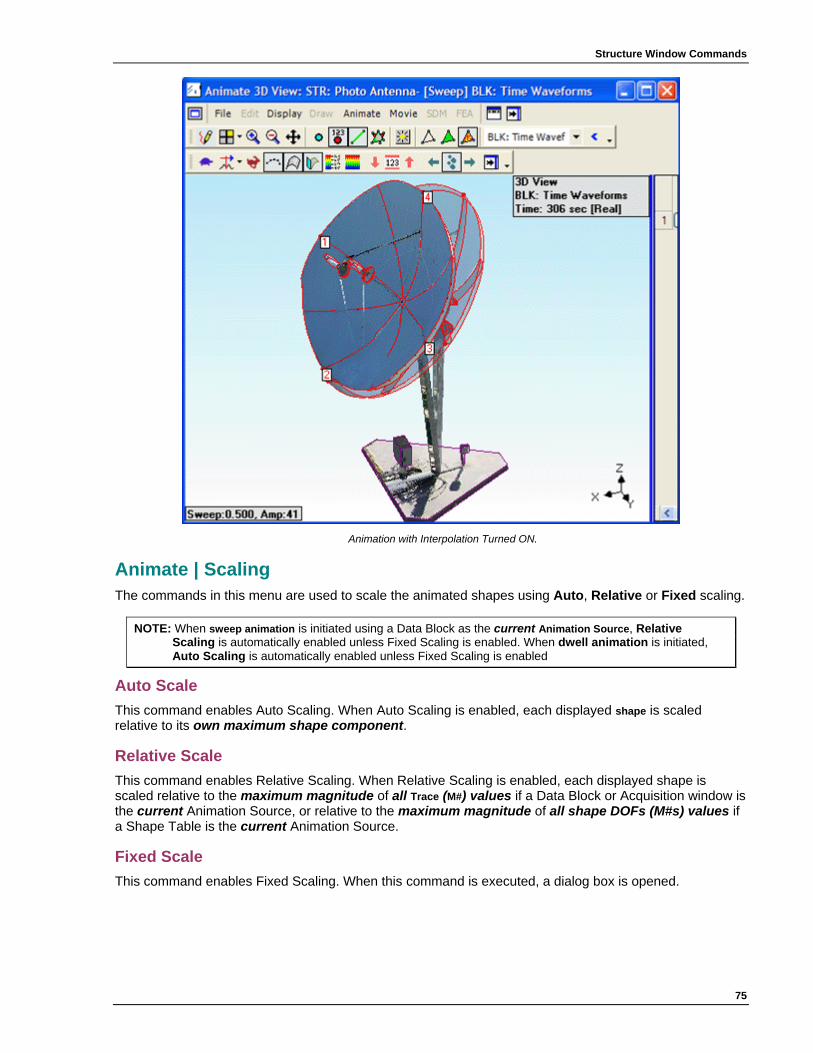
Structure Window Commands
75
Animation with Interpolation Turned ON.
Animate | Scaling The commands in this menu are used to scale the animated shapes using Auto, Relative or Fixed scaling.
NOTE: When sweep animation is initiated using a Data Block as the current Animation Source, Relative Scaling is automatically enabled unless Fixed Scaling is enabled. When dwell animation is initiated, Auto Scaling is automatically enabled unless Fixed Scaling is enabled
Auto Scale This command enables Auto Scaling. When Auto Scaling is enabled, each displayed shape is scaled relative to its own maximum shape component.
Relative Scale This command enables Relative Scaling. When Relative Scaling is enabled, each displayed shape is scaled relative to the maximum magnitude of all Trace (M#) values if a Data Block or Acquisition window is the current Animation Source, or relative to the maximum magnitude of all shape DOFs (M#s) values if a Shape Table is the current Animation Source.
Fixed Scale This command enables Fixed Scaling. When this command is executed, a dialog box is opened.
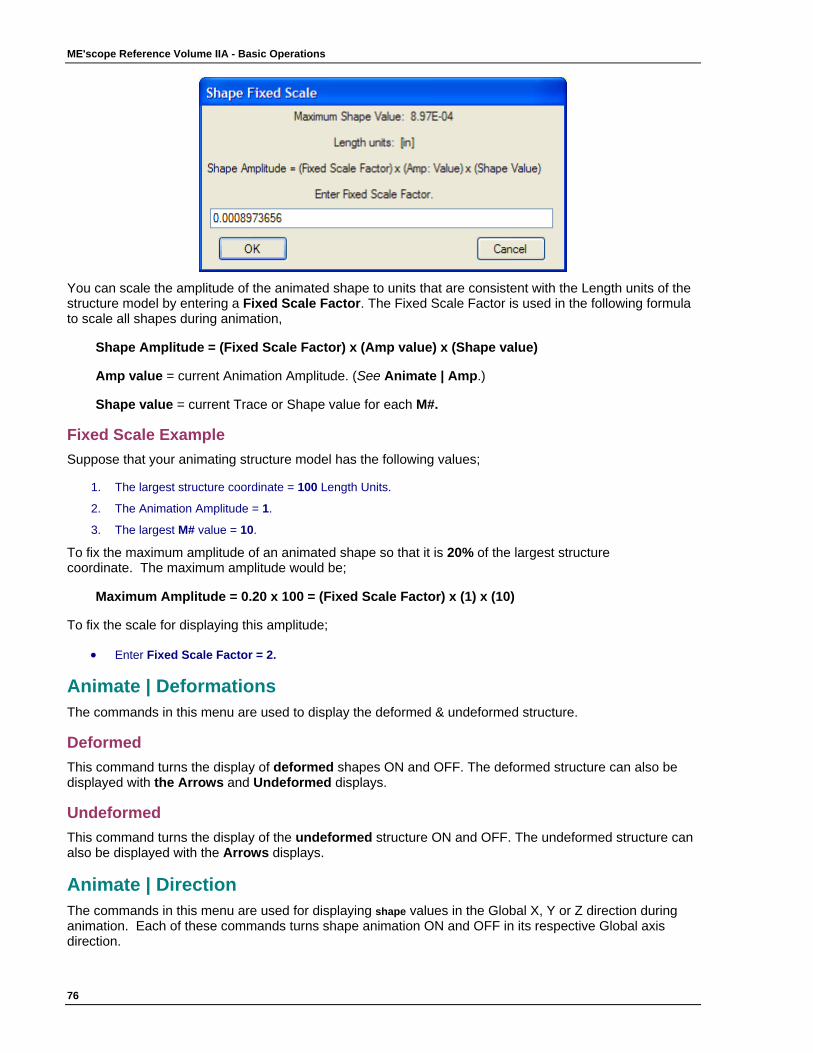
ME'scope Reference Volume IIA - Basic Operations
76
You can scale the amplitude of the animated shape to units that are consistent with the Length units of the structure model by entering a Fixed Scale Factor. The Fixed Scale Factor is used in the following formula to scale all shapes during animation,
Shape Amplitude = (Fixed Scale Factor) x (Amp value) x (Shape value)
Amp value = current Animation Amplitude. (See Animate | Amp.)
Shape value = current Trace or Shape value for each M#.
Fixed Scale Example Suppose that your animating structure model has the following values;
1. The largest structure coordinate = 100 Length Units.
2. The Animation Amplitude = 1.
3. The largest M# value = 10.
To fix the maximum amplitude of an animated shape so that it is 20% of the largest structure coordinate. The maximum amplitude would be;
Maximum Amplitude = 0.20 x 100 = (Fixed Scale Factor) x (1) x (10)
To fix the scale for displaying this amplitude;
• Enter Fixed Scale Factor = 2.
Animate | Deformations The commands in this menu are used to display the deformed & undeformed structure.
Deformed This command turns the display of deformed shapes ON and OFF. The deformed structure can also be displayed with the Arrows and Undeformed displays.
Undeformed This command turns the display of the undeformed structure ON and OFF. The undeformed structure can also be displayed with the Arrows displays.
Animate | Direction The commands in this menu are used for displaying shape values in the Global X, Y or Z direction during animation. Each of these commands turns shape animation ON and OFF in its respective Global axis direction.

Structure Window Commands
77
Animate | Arrows This command enables the display of shapes using arrows. Arrows can also be used with the Deformed display.
NOTE: The Arrow colors are the same as the Point colors.
Animation with Arrows and Deformed Turned ON.
Animate | Persistence This command turns Persistence ON and OFF during animation.
Sine Dwell When Persistence is turned ON during Sine Dwell animation, animation proceeds without erasing previous animation frames until a complete cycle of animation is completed.
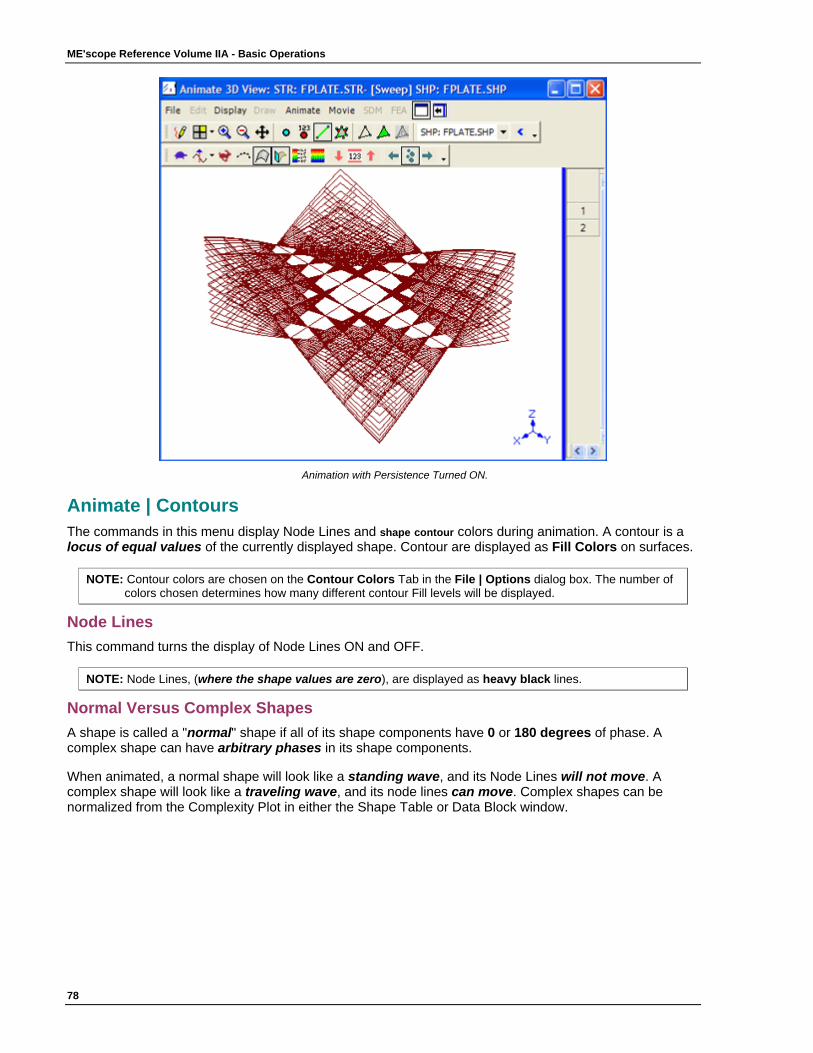
ME'scope Reference Volume IIA - Basic Operations
78
Animation with Persistence Turned ON.
Animate | Contours The commands in this menu display Node Lines and shape contour colors during animation. A contour is a locus of equal values of the currently displayed shape. Contour are displayed as Fill Colors on surfaces.
NOTE: Contour colors are chosen on the Contour Colors Tab in the File | Options dialog box. The number of colors chosen determines how many different contour Fill levels will be displayed.
Node Lines This command turns the display of Node Lines ON and OFF.
NOTE: Node Lines, (where the shape values are zero), are displayed as heavy black lines.
Normal Versus Complex Shapes A shape is called a "normal" shape if all of its shape components have 0 or 180 degrees of phase. A complex shape can have arbitrary phases in its shape components.
When animated, a normal shape will look like a standing wave, and its Node Lines will not move. A complex shape will look like a traveling wave, and its node lines can move. Complex shapes can be normalized from the Complexity Plot in either the Shape Table or Data Block window.
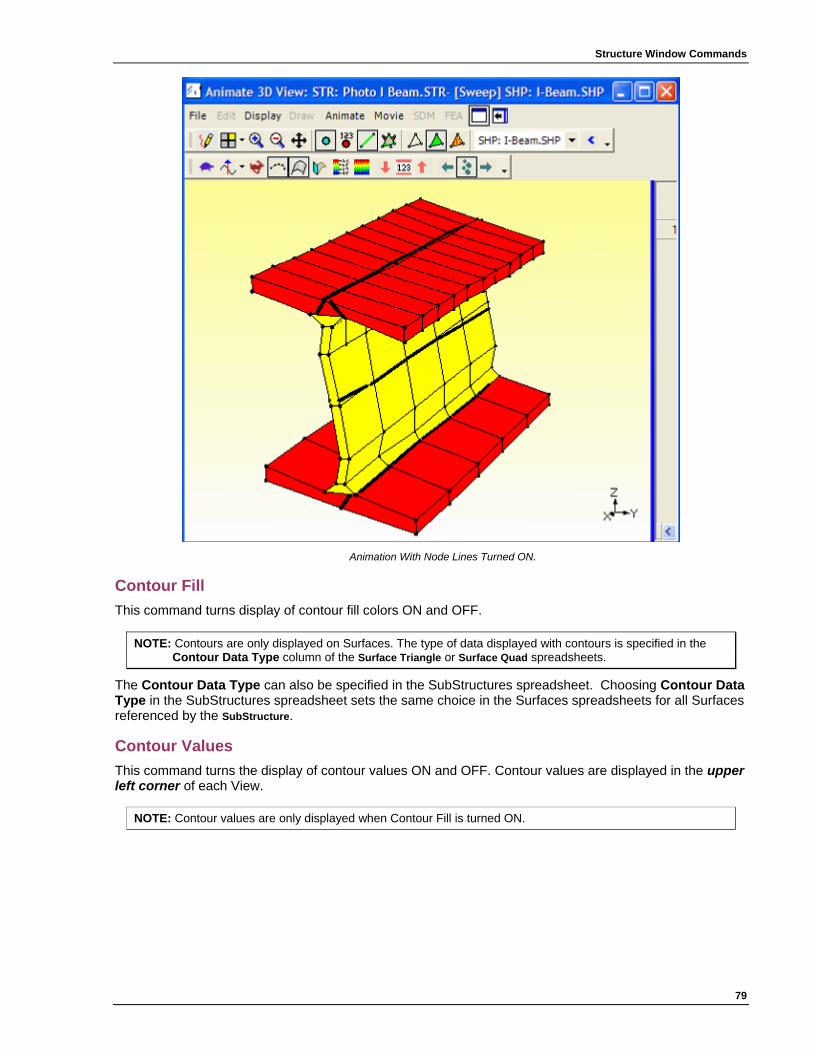
Structure Window Commands
79
Animation With Node Lines Turned ON.
Contour Fill This command turns display of contour fill colors ON and OFF.
NOTE: Contours are only displayed on Surfaces. The type of data displayed with contours is specified in the Contour Data Type column of the Surface Triangle or Surface Quad spreadsheets.
The Contour Data Type can also be specified in the SubStructures spreadsheet. Choosing Contour Data Type in the SubStructures spreadsheet sets the same choice in the Surfaces spreadsheets for all Surfaces referenced by the SubStructure.
Contour Values This command turns the display of contour values ON and OFF. Contour values are displayed in the upper left corner of each View.
NOTE: Contour values are only displayed when Contour Fill is turned ON.

ME'scope Reference Volume IIA - Basic Operations
80
Animation With Contour Fill and Contour Values turned ON.
Animate | Compare Shapes This command is used to display shapes from two Animation Sources on the same or different structure models. During comparison, shapes from two Animation Sources are displayed together, either side by side or overlaid.
When this command is executed, the following can happen,
• If more than one Structure window is open, a dialog box will open allowing you to choose a comparison structure model.
• If more than two Animation Source windows are open, a dialog box will open allowing you to choose a comparison Animation Source.
Comparison animation will begin with the Structure window above, and the two Animation Source windows below. (See Animate | Show Comparison Sources for details.)
Comparison Scroll Bar During comparison animation, a scroll bar is displayed along the bottom of the Structure window. This scroll bar is used for moving the two structure models closer together or farther apart.
Legend To more clearly identify the Animation Sources and shapes being compared,
• Execute File | Options in the Structure window.
• On the Labels tab, check Legend, Animation Sources, Time/Frequency, etc., and click on OK.
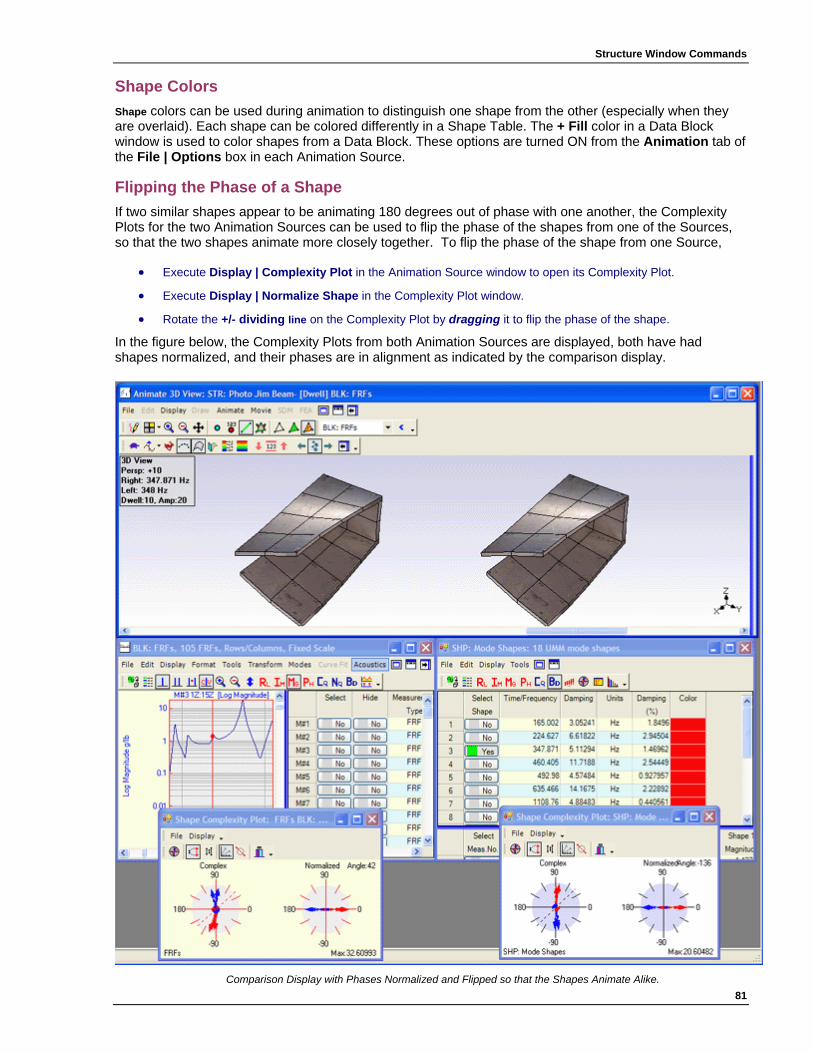
Structure Window Commands
81
Shape Colors Shape colors can be used during animation to distinguish one shape from the other (especially when they are overlaid). Each shape can be colored differently in a Shape Table. The + Fill color in a Data Block window is used to color shapes from a Data Block. These options are turned ON from the Animation tab of the File | Options box in each Animation Source.
Flipping the Phase of a Shape If two similar shapes appear to be animating 180 degrees out of phase with one another, the Complexity Plots for the two Animation Sources can be used to flip the phase of the shapes from one of the Sources, so that the two shapes animate more closely together. To flip the phase of the shape from one Source,
• Execute Display | Complexity Plot in the Animation Source window to open its Complexity Plot.
• Execute Display | Normalize Shape in the Complexity Plot window.
• Rotate the +/- dividing line on the Complexity Plot by dragging it to flip the phase of the shape.
In the figure below, the Complexity Plots from both Animation Sources are displayed, both have had shapes normalized, and their phases are in alignment as indicated by the comparison display.
Comparison Display with Phases Normalized and Flipped so that the Shapes Animate Alike.
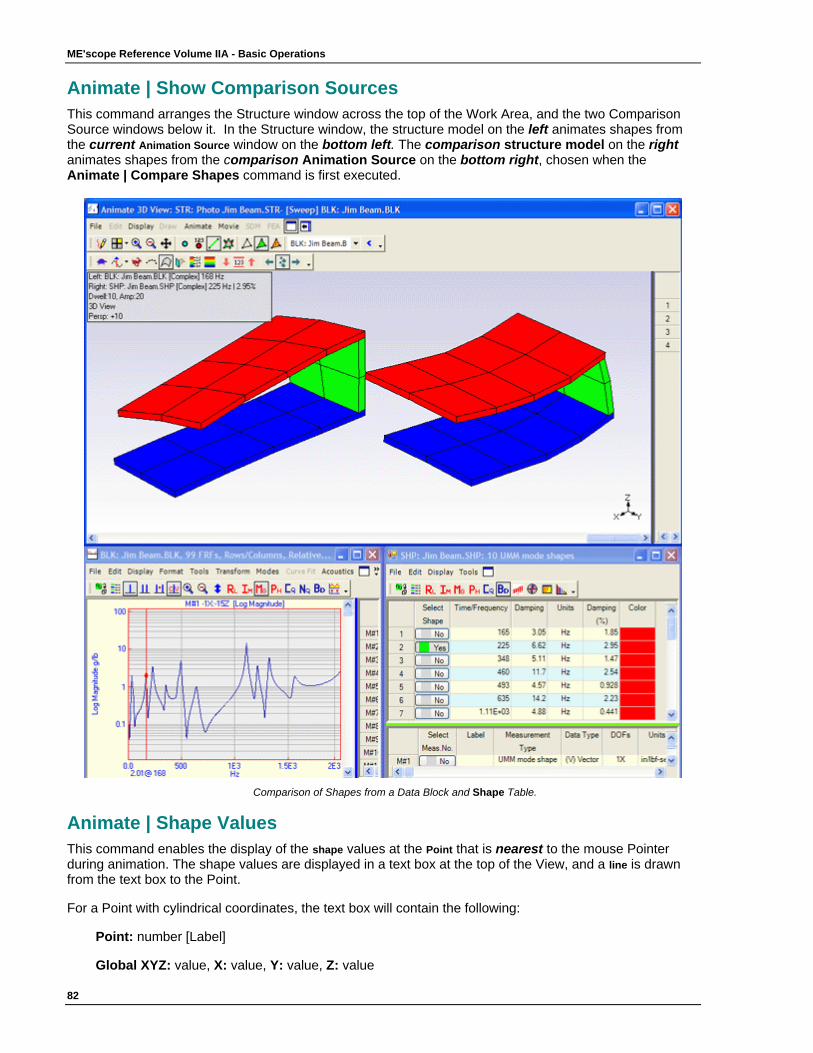
ME'scope Reference Volume IIA - Basic Operations
82
Animate | Show Comparison Sources This command arranges the Structure window across the top of the Work Area, and the two Comparison Source windows below it. In the Structure window, the structure model on the left animates shapes from the current Animation Source window on the bottom left. The comparison structure model on the right animates shapes from the comparison Animation Source on the bottom right, chosen when the Animate | Compare Shapes command is first executed.
Comparison of Shapes from a Data Block and Shape Table.
Animate | Shape Values This command enables the display of the shape values at the Point that is nearest to the mouse Pointer during animation. The shape values are displayed in a text box at the top of the View, and a line is drawn from the text box to the Point.
For a Point with cylindrical coordinates, the text box will contain the following:
Point: number [Label]
Global XYZ: value, X: value, Y: value, Z: value
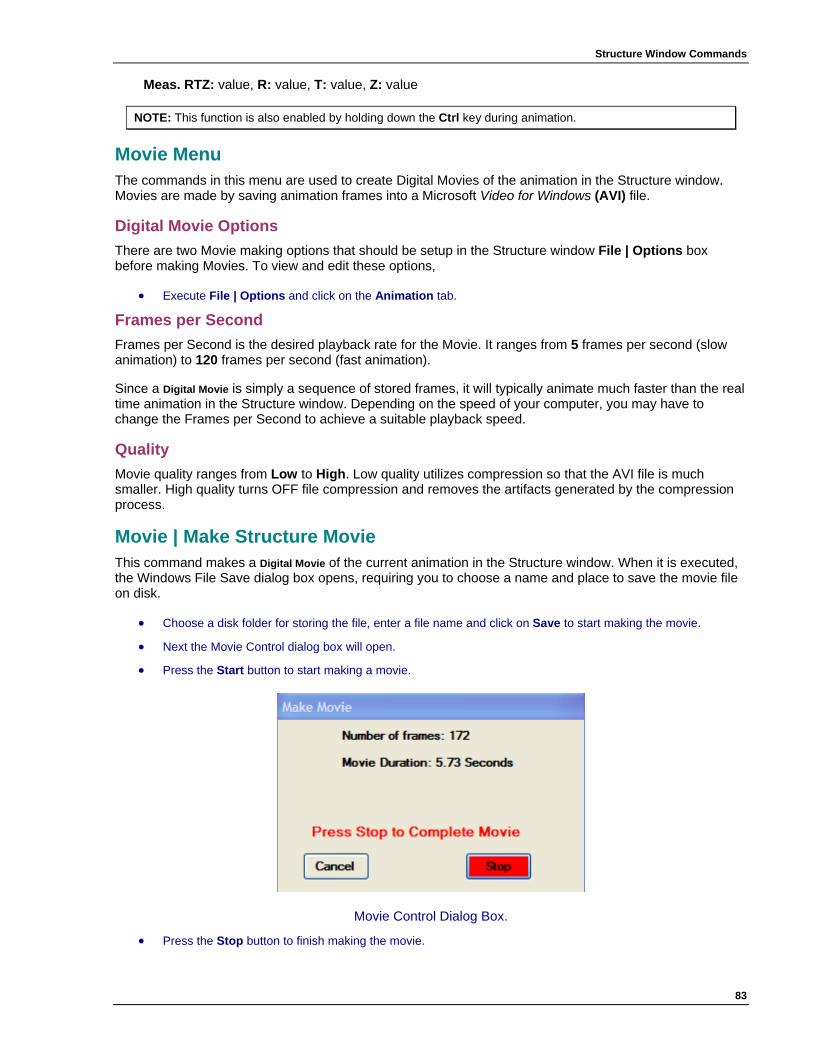
Structure Window Commands
83
Meas. RTZ: value, R: value, T: value, Z: value
NOTE: This function is also enabled by holding down the Ctrl key during animation.
Movie Menu The commands in this menu are used to create Digital Movies of the animation in the Structure window. Movies are made by saving animation frames into a Microsoft Video for Windows (AVI) file.
Digital Movie Options There are two Movie making options that should be setup in the Structure window File | Options box before making Movies. To view and edit these options,
• Execute File | Options and click on the Animation tab.
Frames per Second Frames per Second is the desired playback rate for the Movie. It ranges from 5 frames per second (slow animation) to 120 frames per second (fast animation).
Since a Digital Movie is simply a sequence of stored frames, it will typically animate much faster than the real time animation in the Structure window. Depending on the speed of your computer, you may have to change the Frames per Second to achieve a suitable playback speed.
Quality Movie quality ranges from Low to High. Low quality utilizes compression so that the AVI file is much smaller. High quality turns OFF file compression and removes the artifacts generated by the compression process.
Movie | Make Structure Movie This command makes a Digital Movie of the current animation in the Structure window. When it is executed, the Windows File Save dialog box opens, requiring you to choose a name and place to save the movie file on disk.
• Choose a disk folder for storing the file, enter a file name and click on Save to start making the movie.
• Next the Movie Control dialog box will open.
• Press the Start button to start making a movie.
Movie Control Dialog Box.
• Press the Stop button to finish making the movie.
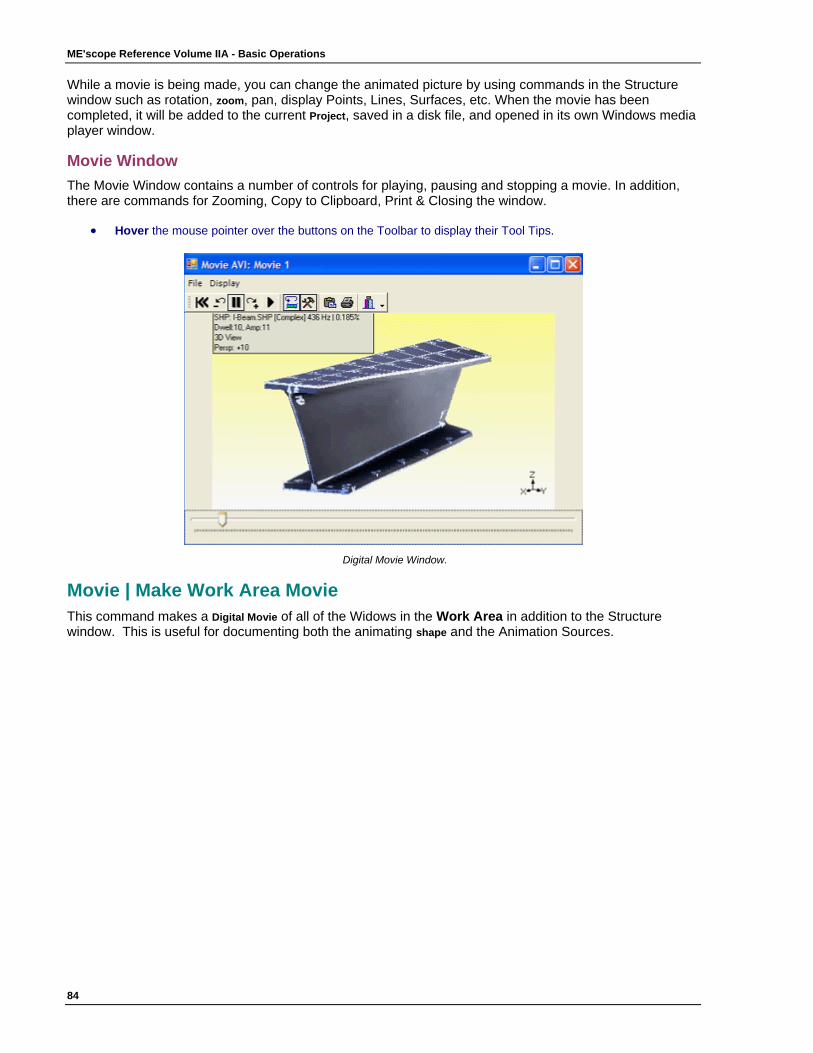
ME'scope Reference Volume IIA - Basic Operations
84
While a movie is being made, you can change the animated picture by using commands in the Structure window such as rotation, zoom, pan, display Points, Lines, Surfaces, etc. When the movie has been completed, it will be added to the current Project, saved in a disk file, and opened in its own Windows media player window.
Movie Window The Movie Window contains a number of controls for playing, pausing and stopping a movie. In addition, there are commands for Zooming, Copy to Clipboard, Print & Closing the window.
• Hover the mouse pointer over the buttons on the Toolbar to display their Tool Tips.
Digital Movie Window.
Movie | Make Work Area Movie This command makes a Digital Movie of all of the Widows in the Work Area in addition to the Structure window. This is useful for documenting both the animating shape and the Animation Sources.
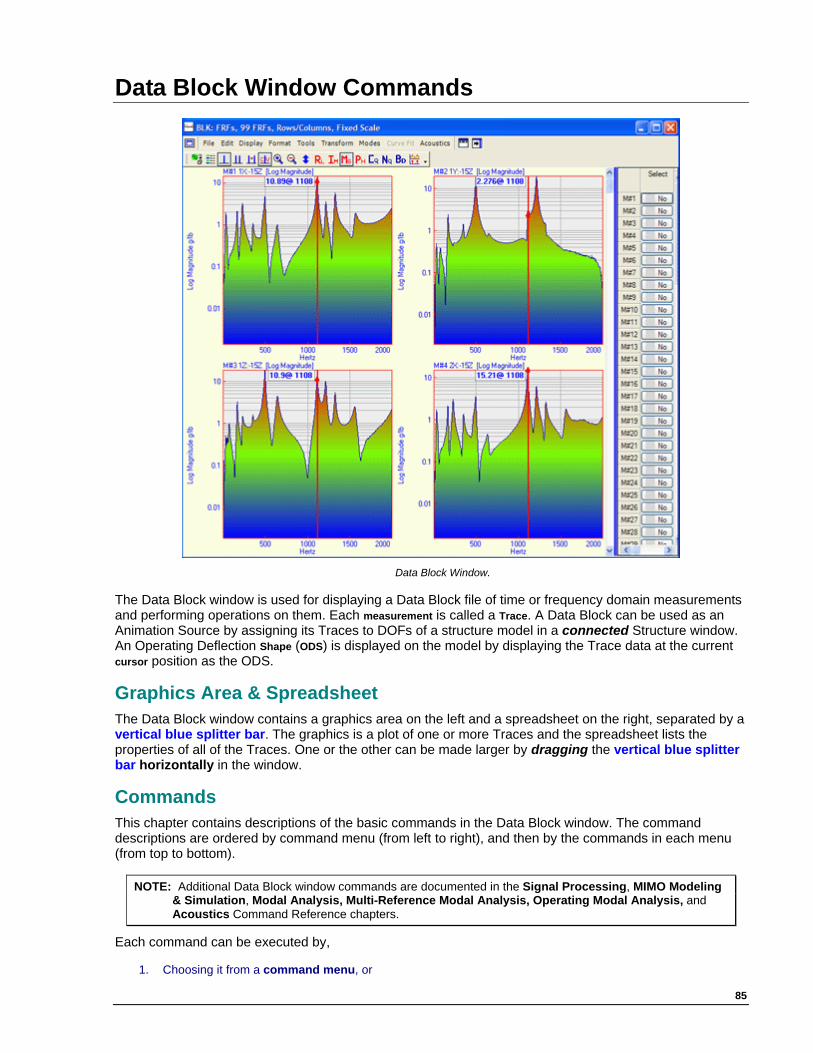
85
Data Block Window Commands
Data Block Window.
The Data Block window is used for displaying a Data Block file of time or frequency domain measurements and performing operations on them. Each measurement is called a Trace. A Data Block can be used as an Animation Source by assigning its Traces to DOFs of a structure model in a connected Structure window. An Operating Deflection Shape (ODS) is displayed on the model by displaying the Trace data at the current cursor position as the ODS.
Graphics Area & Spreadsheet The Data Block window contains a graphics area on the left and a spreadsheet on the right, separated by a vertical blue splitter bar. The graphics is a plot of one or more Traces and the spreadsheet lists the properties of all of the Traces. One or the other can be made larger by dragging the vertical blue splitter bar horizontally in the window.
Commands This chapter contains descriptions of the basic commands in the Data Block window. The command descriptions are ordered by command menu (from left to right), and then by the commands in each menu (from top to bottom).
NOTE: Additional Data Block window commands are documented in the Signal Processing, MIMO Modeling & Simulation, Modal Analysis, Multi-Reference Modal Analysis, Operating Modal Analysis, and Acoustics Command Reference chapters.
Each command can be executed by,
1. Choosing it from a command menu, or
ME'scope Reference Volume IIA - Basic Operations
86
2. Clicking on its button or Tool, if it is on a Toolbar.
(See the Command Toolbars section in the Tutorial - Introduction to ME'scopeVES chapter for details on customizing the Toolbars in this window.)
Special Mouse Operations The mouse is used to perform special operations in a Data Block window.
Mouse Wheel The mouse wheel is used in several different ways in a Data Block window;
• To scroll the Traces display, click on the vertical Traces scroll bar, and spin the mouse wheel.
• To Zoom the Traces display, move the mouse pointer into the Trace graphics area, and spin the mouse wheel.
• To scroll the Traces spreadsheet, click on the spreadsheet scroll bar, and spin the mouse wheel
• To change the size of the Traces spreadsheet, hold down the Ctrl key, click on the spreadsheet and spin the mouse wheel
Moving the Line Cursor • If the Line cursor is displayed;
• Click anywhere on a Trace to move the cursor to the mouse pointer position.
• Hold down the left mouse button and drag to make the cursor follow the mouse pointer.
Moving the Peak or Band Cursor If the Peak or Band cursor is displayed;
• To move the nearest edge of the band, place the mouse pointer outside the band and drag.
• To move both edges of the band, place the mouse pointer inside the band and drag.
Vertical & Horizontal Scales • Double click anywhere on the vertical (Y-axis) area of a Trace to open the Vertical Scaling dialog box for
changing the vertical scale of all Traces.
• Double click anywhere on the horizontal (X-axis) area of a Trace to open the Horizontal Scaling dialog box for changing the horizontal scale of all Traces,
Special Keyboard Operations Certain keys on the keyboard are used for performing special operations in a Data Block window.
Shift Key • Hold down the Shift key and drag to Pan the display of already Zoomed Trace data. This is the same as
using the Zoom scroll bar displayed below the Traces.
• Hold down the Shift key and click on a Select button in the Traces spreadsheet. Then click an a second Select button to select all Traces between the first and second selected Traces.
Ctrl Key • Hold down the Ctrl key, and click anywhere on a Trace graph to toggle the selection of the Trace.
NOTE: A selected Trace has a shaded background, and its Select button is depressed in the Traces spreadsheet.
• Hold down the Ctrl key, and right click on a spreadsheet column heading to change the column widths so that the data in each column is visible.
Data Block Window Commands
87
• Hold down the Ctrl key, click on the Traces spreadsheet, and spin the mouse wheel to change the size of the Traces spreadsheet,
• During curve fitting, hold down the Ctrl key and move the mouse pointer near to a pole (frequency & damping) on the Mode Indicator graph to display its frequency & damping values. (See the Multi-Reference Modal Analysis command reference chapter for details,)
Ctrl X, Ctrl C, & Ctrl V These commonly used key combinations can be used for cutting, copying, and pasting text between any spreadsheet cells in a Data Block window and the Windows Clipboard;
• Select the text in one or more spreadsheet cells.
• Hold down the Ctrl key and press the X key to cut the selected text to the Clipboard.
• Hold down the Ctrl key and press the C key to copy the selected text to the Clipboard.
• Hold down the Ctrl key and press the V key to paste text from the Clipboard into the selected cells.
Graphics Scroll Bars Under certain conditions, both vertical & horizontal scroll bars will be displayed on the right side and below the graphics area in a Data Block window.
Vertical Scroll Bar When the number of Traces being displayed in the graphical area is less than the total number of Traces in the Data Block file, a vertical scroll bar is displayed on the right side of the Trace graphics area.
• Use the vertical scroll bar on the right side of the Trace graphics area to scroll through all of the Traces in the Data Block.
Horizontal Scroll Bar When the Data Block display is Zoomed, not all of the Trace samples are displayed and a horizontal scroll bar is displayed below the Trace graphics area.
• Use the horizontal scroll bar below the Trace graphics area to scroll through all of the Trace samples.
Traces Spreadsheet All of the properties associated with each Trace in a Data Block file are listed in the Traces spreadsheet. Each column of the spreadsheet contains a property for all Traces. Each row contains the properties of a single Trace.
NOTE: All of the columns in this spreadsheet may not be enabled, depending on the Options that are authorized in your software.
To view more of the Traces spreadsheet,
1. Drag the Vertical Blue Splitter Bar to the left, or
2. Execute Display | Spreadsheet.
Scroll Bars If the spreadsheet contains more rows and columns than are currently displayed, scroll bars will appear on the right side and bottom of the spreadsheet.
• Use the vertical scroll bar to display more rows of the spreadsheet.
• Use the horizontal scroll bar to display more columns of the spreadsheet.
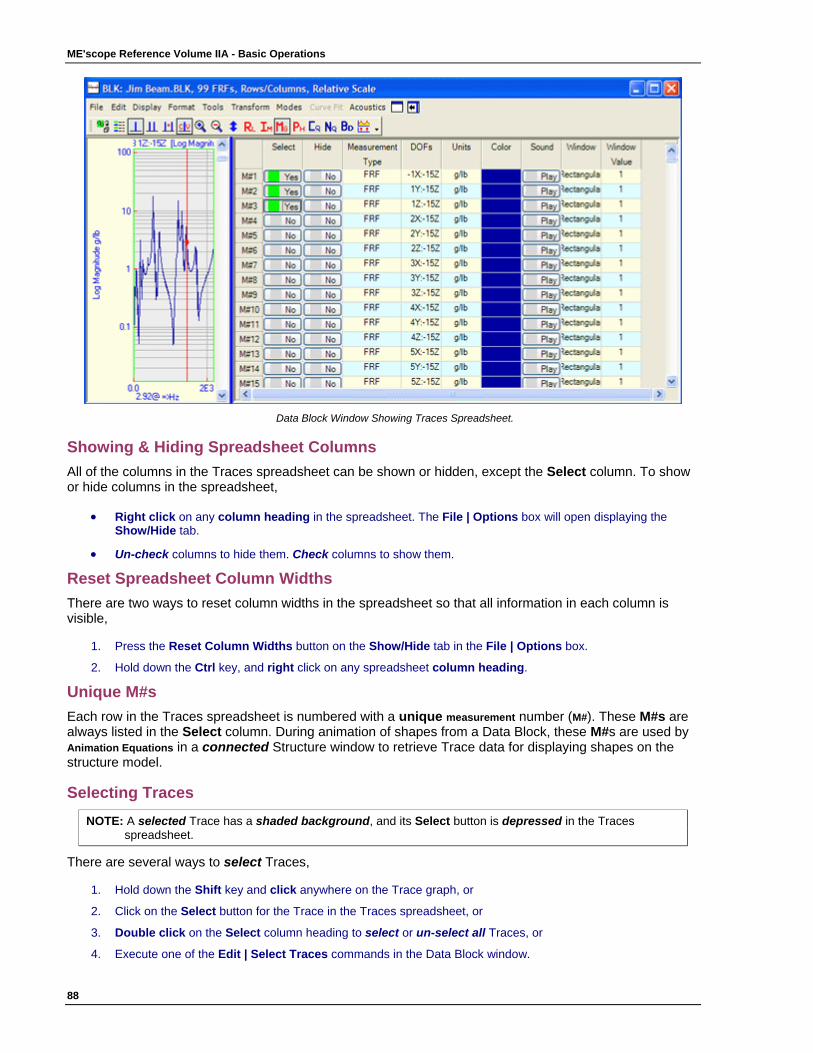
ME'scope Reference Volume IIA - Basic Operations
88
Data Block Window Showing Traces Spreadsheet.
Showing & Hiding Spreadsheet Columns All of the columns in the Traces spreadsheet can be shown or hidden, except the Select column. To show or hide columns in the spreadsheet,
• Right click on any column heading in the spreadsheet. The File | Options box will open displaying the Show/Hide tab.
• Un-check columns to hide them. Check columns to show them.
Reset Spreadsheet Column Widths There are two ways to reset column widths in the spreadsheet so that all information in each column is visible,
1. Press the Reset Column Widths button on the Show/Hide tab in the File | Options box.
2. Hold down the Ctrl key, and right click on any spreadsheet column heading.
Unique M#s Each row in the Traces spreadsheet is numbered with a unique measurement number (M#). These M#s are always listed in the Select column. During animation of shapes from a Data Block, these M#s are used by Animation Equations in a connected Structure window to retrieve Trace data for displaying shapes on the structure model.
Selecting Traces NOTE: A selected Trace has a shaded background, and its Select button is depressed in the Traces
spreadsheet.
There are several ways to select Traces,
1. Hold down the Shift key and click anywhere on the Trace graph, or
2. Click on the Select button for the Trace in the Traces spreadsheet, or
3. Double click on the Select column heading to select or un-select all Traces, or
4. Execute one of the Edit | Select Traces commands in the Data Block window.
Data Block Window Commands
89
Changing Trace Properties To change a property for a single Trace,
• Click on the property cell, either to toggle its button, edit its text contents, or select from its drop down list.
To change a property for all (or selected) Traces,
• Double click on the column heading of the property to be changed. A dialog box will open.
• Choose or enter the property value, and click on OK.
Hide Column This column is for hiding (or showing) each Trace.
NOTE: Hidden Traces are not displayed, and are excluded from all Data Block calculations.
Measurement Type Column This column is for defining the Measurement Type of each Trace.
• Click on a cell in this column to display a drop down list of Measurement Type choices.
DOFs Column This column is used to specify the DOFs of each Trace. A DOF is typically the Point number & direction of the transducer location on the test structure. All DOFs are either a Roving DOF (moving transducer) or a Reference DOF (fixed transducer).
If the transducer is Roving, its DOF should contain its Point number followed by its direction. For example, if the Roving transducer is located at Point 1 in the X direction, its DOF should be,
Roving DOF = 1X
If the transducer is a Reference, its DOF should contain a colon (:) in front of the Point number & direction. For example, if the Reference transducer is located at Point 2 in the Z direction, its DOF should be,
Reference DOF = :2Z
If a Trace contains a cross-channel measurement (like an FRF or Cross Spectrum), it should contain both Roving & Reference DOFs. For example, if a Trace contains an FRF made with a Roving impact hammer, and the impact was made at DOF 1X, and the Reference accelerometer was fixed at DOF 2Z, then,
Trace DOF = 1X : 2Z
• Double click on the DOFs column header to open the DOF Generator for creating DOFs.
• (See Using the DOF Generator section in this chapter for details on using the DOF Generator.)
Units Column This column is used to specify the transducer engineering units of each Trace. Typical input (or excitation) units are force units. Typical response (or output) units are displacement, velocity, or acceleration units.
• FRF units are (response units / force units).
• Transmissibility units are (Roving response units / Reference response units).
• Cross Spectrum units are (response units)^2 or (response units * force units).
• ODS FRF units are (Roving response units : Reference response units).
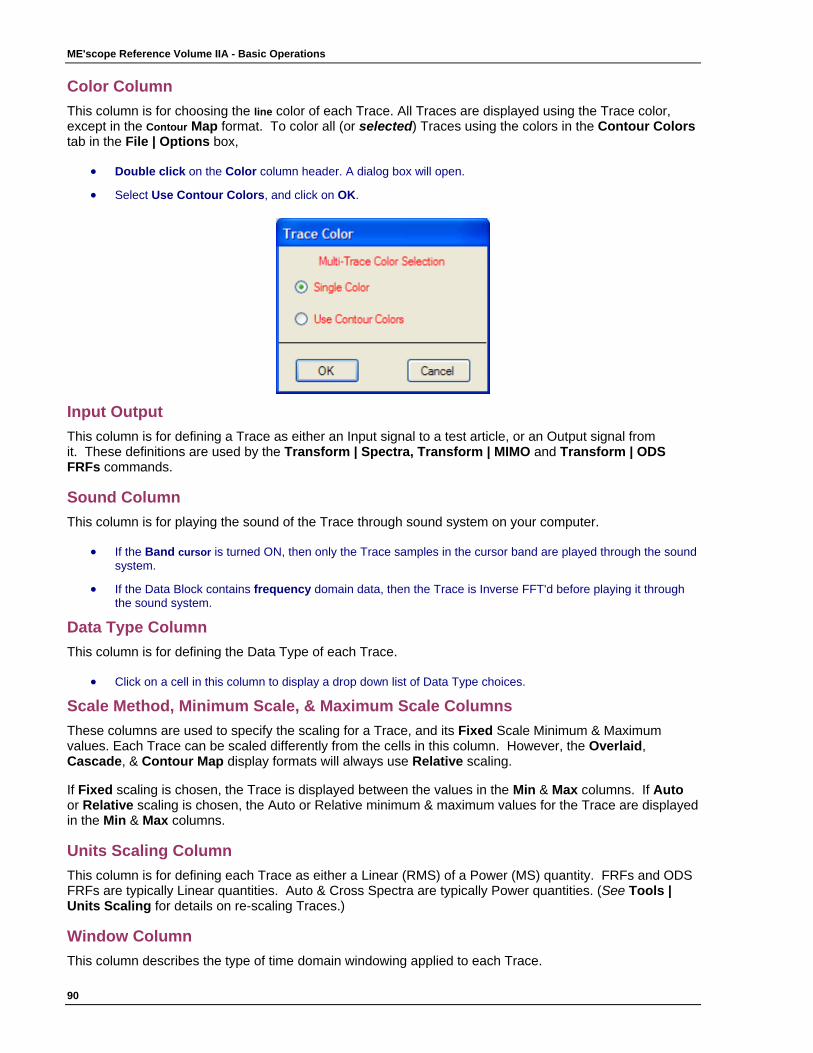
ME'scope Reference Volume IIA - Basic Operations
90
Color Column This column is for choosing the line color of each Trace. All Traces are displayed using the Trace color, except in the Contour Map format. To color all (or selected) Traces using the colors in the Contour Colors tab in the File | Options box,
• Double click on the Color column header. A dialog box will open.
• Select Use Contour Colors, and click on OK.
Input Output This column is for defining a Trace as either an Input signal to a test article, or an Output signal from it. These definitions are used by the Transform | Spectra, Transform | MIMO and Transform | ODS FRFs commands.
Sound Column This column is for playing the sound of the Trace through sound system on your computer.
• If the Band cursor is turned ON, then only the Trace samples in the cursor band are played through the sound system.
• If the Data Block contains frequency domain data, then the Trace is Inverse FFT'd before playing it through the sound system.
Data Type Column This column is for defining the Data Type of each Trace.
• Click on a cell in this column to display a drop down list of Data Type choices.
Scale Method, Minimum Scale, & Maximum Scale Columns These columns are used to specify the scaling for a Trace, and its Fixed Scale Minimum & Maximum values. Each Trace can be scaled differently from the cells in this column. However, the Overlaid, Cascade, & Contour Map display formats will always use Relative scaling.
If Fixed scaling is chosen, the Trace is displayed between the values in the Min & Max columns. If Auto or Relative scaling is chosen, the Auto or Relative minimum & maximum values for the Trace are displayed in the Min & Max columns.
Units Scaling Column This column is for defining each Trace as either a Linear (RMS) of a Power (MS) quantity. FRFs and ODS FRFs are typically Linear quantities. Auto & Cross Spectra are typically Power quantities. (See Tools | Units Scaling for details on re-scaling Traces.)
Window Column This column describes the type of time domain windowing applied to each Trace.
Data Block Window Commands
91
NOTE: This window is applied by using one of the commands in the Transform menu, not by selecting it in the spreadsheet.
Window Value Column This column contains the window value of each Trace corresponding to the type of window applied to it, which is listed in the Window column.
NOTE: This value is determined when the window is applied by using one of the commands in the Transform menu.
The exponential window value is the amount of damping added by the window (in Hz). This amount of damping is subtracted from each modal damping estimate when modal parameters are saved into a Shape Table file during curve fitting.
dB Reference Value Column This column is used for specifying a dB Reference value for each Trace. This value is used for displaying Traces magnitudes in dB units. (See the Acoustics Command Reference for details.)
Amplitude Scaling Column This column lists the Amplitude Scaling of each Trace. Amplitude scaling is applied by using one of the Tools | Amplitude Scaling commands.
Label Column This column is used to enter a text description of each Trace. Its use is optional.
Date/Time Column This column is used to enter a text date & time of the acquisition or calculation of each Trace. Its use is optional.
SubShape Column This column is used to enter a text name for each Trace belonging to a SubShape. SubShapes are used for scaling different types of shape data (such as vibration and acoustic data), so that both types of data can be displayed together in animation. Its use is optional.
Source Column This column is used to enter a text name for each Trace belonging to an acoustic source. Acoustic shapes can be displayed in animation by source when they have been given Source names. Its use is optional.
Z-Axis Column This column is used to enter a text Z-Axis label for each Trace. Traces can be selected by Z-Axis label (using Edit | Select Traces | By), so that all of the data with the same label is displayed together in animation.
For example, Order Tracked ODS data for several different orders can be displayed in animation by using the Z-Axis label to select Traces belonging to each order. (See the Signal Processing Command Reference for details.)
File | Save This command saves the contents the Data Block file from the computer memory to the Project file on disk.
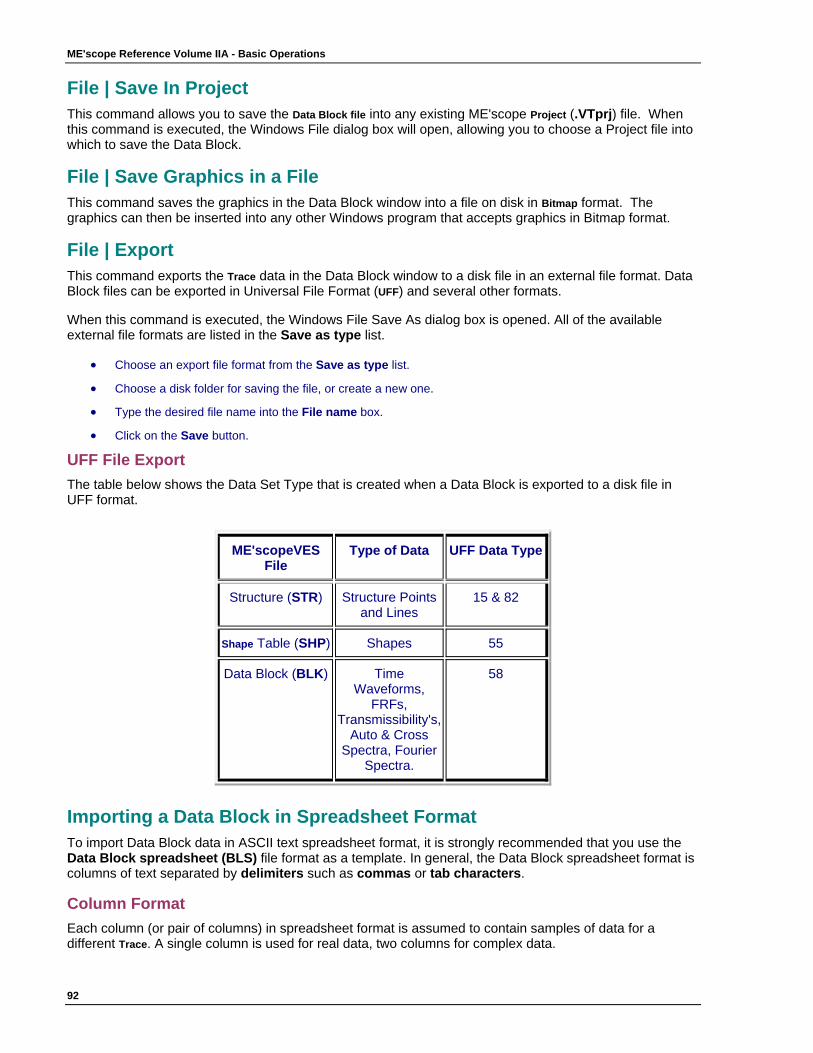
ME'scope Reference Volume IIA - Basic Operations
92
File | Save In Project This command allows you to save the Data Block file into any existing ME'scope Project (.VTprj) file. When this command is executed, the Windows File dialog box will open, allowing you to choose a Project file into which to save the Data Block.
File | Save Graphics in a File This command saves the graphics in the Data Block window into a file on disk in Bitmap format. The graphics can then be inserted into any other Windows program that accepts graphics in Bitmap format.
File | Export This command exports the Trace data in the Data Block window to a disk file in an external file format. Data Block files can be exported in Universal File Format (UFF) and several other formats.
When this command is executed, the Windows File Save As dialog box is opened. All of the available external file formats are listed in the Save as type list.
• Choose an export file format from the Save as type list.
• Choose a disk folder for saving the file, or create a new one.
• Type the desired file name into the File name box.
• Click on the Save button.
UFF File Export The table below shows the Data Set Type that is created when a Data Block is exported to a disk file in UFF format.
ME'scopeVES File
Type of Data UFF Data Type
Structure (STR) Structure Points and Lines
15 & 82
Shape Table (SHP) Shapes 55
Data Block (BLK) Time Waveforms,
FRFs, Transmissibility's,
Auto & Cross Spectra, Fourier
Spectra.
58
Importing a Data Block in Spreadsheet Format To import Data Block data in ASCII text spreadsheet format, it is strongly recommended that you use the Data Block spreadsheet (BLS) file format as a template. In general, the Data Block spreadsheet format is columns of text separated by delimiters such as commas or tab characters.
Column Format Each column (or pair of columns) in spreadsheet format is assumed to contain samples of data for a different Trace. A single column is used for real data, two columns for complex data.
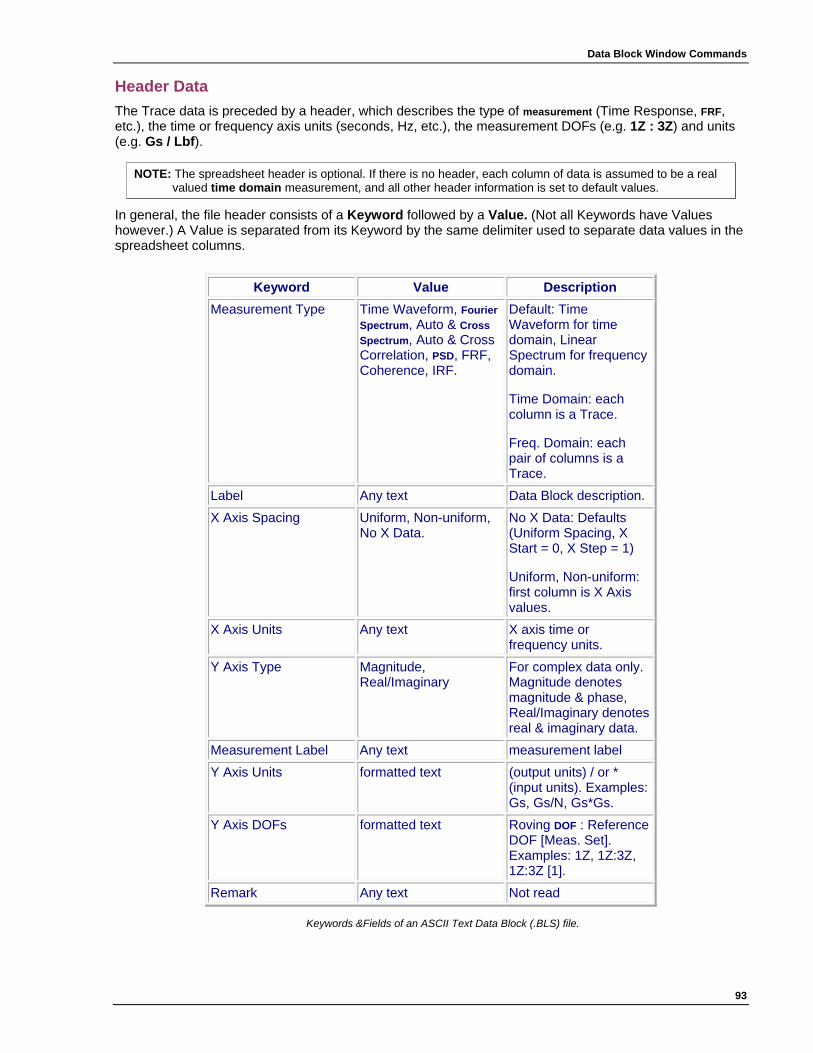
Data Block Window Commands
93
Header Data The Trace data is preceded by a header, which describes the type of measurement (Time Response, FRF, etc.), the time or frequency axis units (seconds, Hz, etc.), the measurement DOFs (e.g. 1Z : 3Z) and units (e.g. Gs / Lbf).
NOTE: The spreadsheet header is optional. If there is no header, each column of data is assumed to be a real valued time domain measurement, and all other header information is set to default values.
In general, the file header consists of a Keyword followed by a Value. (Not all Keywords have Values however.) A Value is separated from its Keyword by the same delimiter used to separate data values in the spreadsheet columns.
Keyword Value Description Measurement Type Time Waveform, Fourier
Spectrum, Auto & Cross Spectrum, Auto & Cross Correlation, PSD, FRF, Coherence, IRF.
Default: Time Waveform for time domain, Linear Spectrum for frequency domain.
Time Domain: each column is a Trace.
Freq. Domain: each pair of columns is a Trace.
Label Any text Data Block description. X Axis Spacing Uniform, Non-uniform,
No X Data. No X Data: Defaults (Uniform Spacing, X Start = 0, X Step = 1)
Uniform, Non-uniform: first column is X Axis values.
X Axis Units Any text X axis time or frequency units.
Y Axis Type Magnitude, Real/Imaginary
For complex data only. Magnitude denotes magnitude & phase, Real/Imaginary denotes real & imaginary data.
Measurement Label Any text measurement label Y Axis Units formatted text (output units) / or *
(input units). Examples: Gs, Gs/N, Gs*Gs.
Y Axis DOFs formatted text Roving DOF : Reference DOF [Meas. Set]. Examples: 1Z, 1Z:3Z, 1Z:3Z [1].
Remark Any text Not read
Keywords &Fields of an ASCII Text Data Block (.BLS) file.
ME'scope Reference Volume IIA - Basic Operations
94
Creating a (BLS) File Template The best way to put measurement text data into an (.BLS) file format is to start with a file template and add your data to it using a spreadsheet or text program. To create a (.BLS) file template, start with any Data Block file in ME'scopeVES. Start with a time domain Data Block file if you want to import time domain measurements, or a frequency domain Data Block file if you want to import frequency domain measurements.
• Open the binary Data Block (BLK) file from disk. (Use any file, or one from the Examples or Demos folder.)
• Execute File | Export and save the file in (.BLS) format.
Adding Your Data to the Template • Open the (.BLS) file in a spreadsheet program like Microsoft Excel or a word processor like Microsoft Word.
• Replace the Trace data into the spreadsheet columns with your measurement data. Edit the other information where applicable, and save the file to disk.
Importing a (.BLS) File
NOTE: Make sure that the (.BLS) file is no longer open in the spreadsheet or word processor program before importing it into ME'scopeVES.
• Execute File | Import | Data Block in the ME'scopeVES window and import the (.BLS) File.
File | Copy Graphics to Clipboard This command copies the Trace graphics to the Windows Clipboard in Bitmap format. The graphics can then be pasted from the Clipboard into any other Windows program that accepts graphics in Bitmap format.
Bitmap A Bitmap is a copy of the screen pixels in the graphics area. Bitmaps can be pasted from the Clipboard into the ME'scopeVES Report writer, and most other graphics and text editing programs.
Copying Spreadsheet Cells • The contents of any text spreadsheet cell can be copied to the Windows Clipboard, and pasted into other text
cells. The following keyboard commands are used for cutting, copying and pasting text between spreadsheet cells and the Windows Clipboard,
• Select one or more spreadsheet cells.
• Hold down the Ctrl key and press the X key to cut the selected data to the Clipboard.
• Hold down the Ctrl key and press the C key to copy the selected data to the Clipboard.
• Hold down the Ctrl key and press the V key to paste data from the Clipboard into the selected cells.
Editing Trace Data The Data Block text spreadsheet (.BLS) file format can be used together with a text (like MS Word) or spreadsheet program (like MS Excel) to edit Trace data. To edit several samples of a single Trace,
• Open the Data Block file containing the Trace data that requires editing.
• Select the Trace (or Traces) that requires editing.
• If editing frequency domain data, display the CoQuad format to edit the Real & Imaginary parts, or the Bode format to edit the Magnitudes & Phases.
Exporting the Trace Data • Execute File | Export, and save the data in Data Block text spreadsheet (.BLS) file format to a disk file.
Data Block Window Commands
95
• Open the Data Block text spreadsheet (.BLS) file in a word processor or spreadsheet program. (See Importing a Data Block in Spreadsheet Format for details.)
• Edit the Trace samples as required.
• Save the file to the Windows Desktop.
Importing the Edited Trace Data • Execute File | Import in the ME'scopeVES window.
• Select All Files in the File of type drop down list, and open the file from the Desktop. A new Data Block window will open with the edited Trace data in it.
• Make sure the unedited Traces are still selected in the original Data Block window.
• Execute Edit | Delete Selected Traces to delete the unedited Trace.
• Execute Edit | Paste Traces from File. A dialog box will open.
• Choose the new Data Block from the list, and press the Paste button.
The original Data Block will now contain all of the original Traces plus the edited Traces.
File | Print The commands in this menu are used to print the Trace graphics or the Traces spreadsheet on the installed Windows printer.
NOTE: To use these commands, the installed Windows printer must be a graphics printer. Use the File | Printer Setup command in the ME'scopeVES window to setup the printer
Trace Graphics • Execute File | Print | Trace Graphics to print the currently displayed graphics, on the left of the vertical blue
splitter bar, on the system printer.
Traces Spreadsheet • Execute File | Print | Traces Spreadsheet to print the Traces spreadsheet, on the right of the vertical blue
splitter bar, on the system printer.
.
File | Properties This command opens the Data Block Properties dialog box, from which you can edit the Data Block Label, Block Size (number of samples per Trace), Starting, Step, and Ending Time or Frequency Axis values, and the Time or Frequency Axis Label. You can also enter a Machine Speed and Notes that are saved with the Data Block.
NOTE: This command is also executed by double clicking on the graphics area of any Trace.
X-Axis Parameters If the X-axis has uniformly spaced samples, you can also edit the X-axis parameters (Starting, Step and Ending or Time or Frequency).
NOTE: Changing the X-axis Starting, Step and Ending values or the X-Axis Label does not alter the Trace data. These parameters only affect the labeling of the X-Axis.
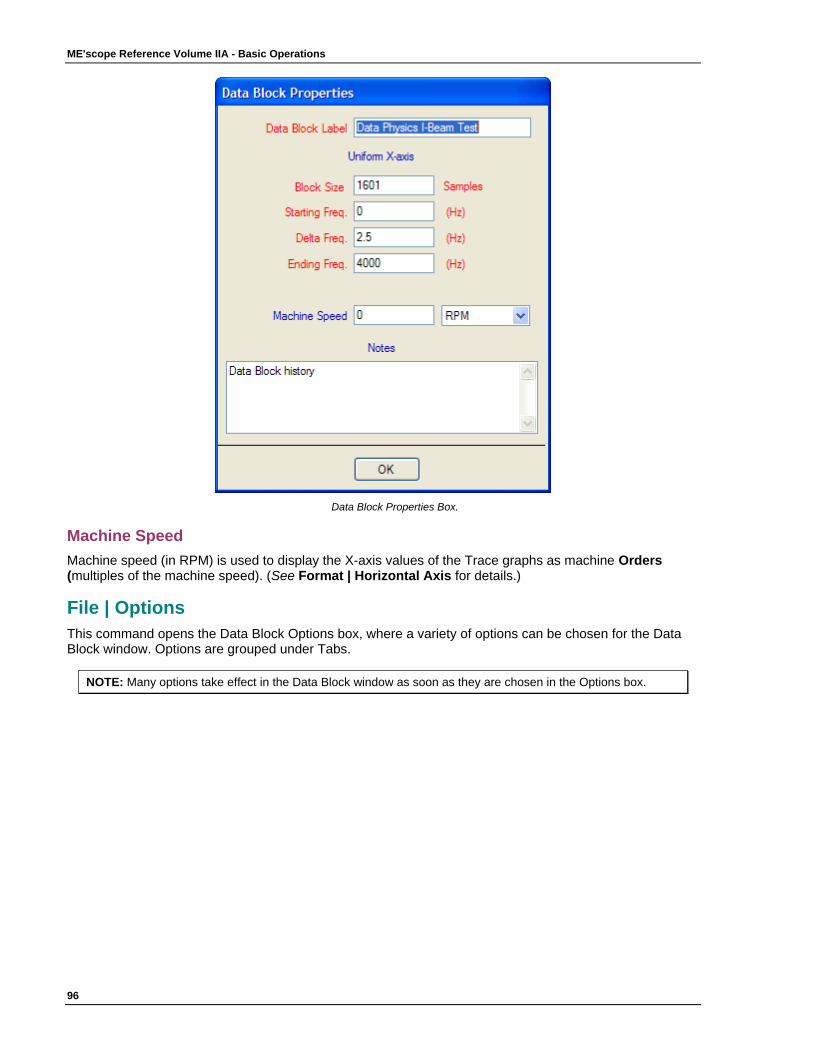
ME'scope Reference Volume IIA - Basic Operations
96
Data Block Properties Box.
Machine Speed Machine speed (in RPM) is used to display the X-axis values of the Trace graphs as machine Orders (multiples of the machine speed). (See Format | Horizontal Axis for details.)
File | Options This command opens the Data Block Options box, where a variety of options can be chosen for the Data Block window. Options are grouped under Tabs.
NOTE: Many options take effect in the Data Block window as soon as they are chosen in the Options box.
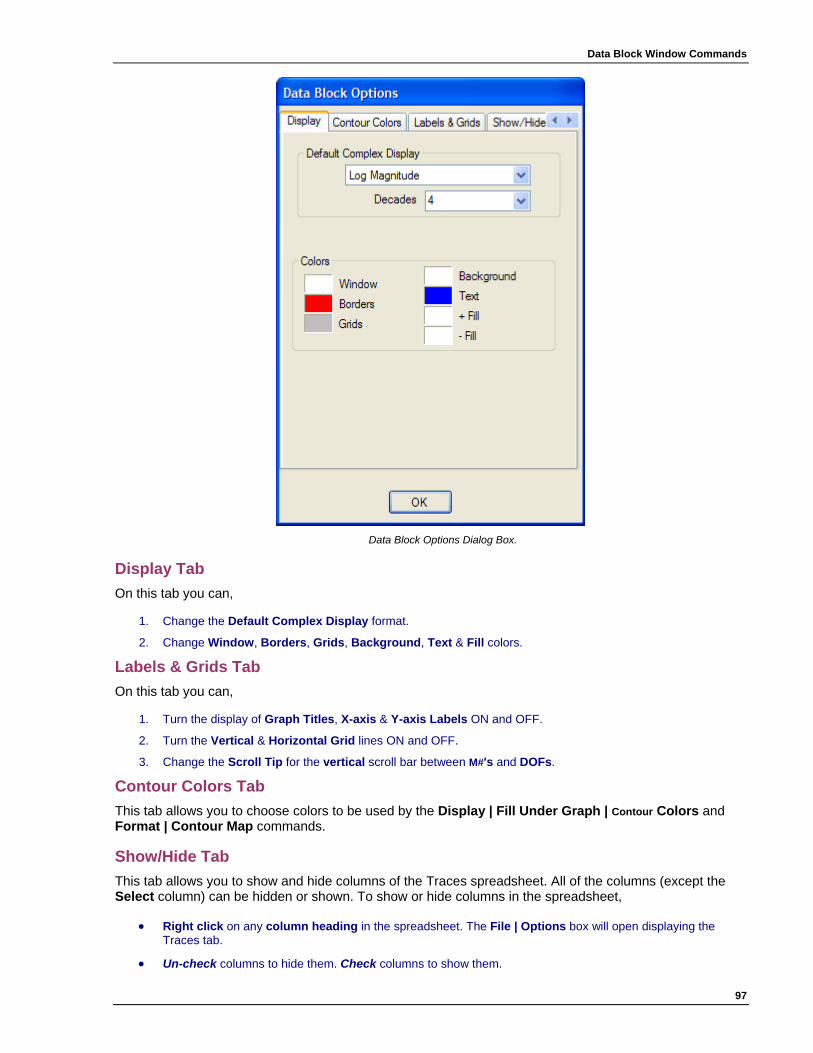
Data Block Window Commands
97
Data Block Options Dialog Box.
Display Tab On this tab you can,
1. Change the Default Complex Display format.
2. Change Window, Borders, Grids, Background, Text & Fill colors.
Labels & Grids Tab On this tab you can,
1. Turn the display of Graph Titles, X-axis & Y-axis Labels ON and OFF.
2. Turn the Vertical & Horizontal Grid lines ON and OFF.
3. Change the Scroll Tip for the vertical scroll bar between M#'s and DOFs.
Contour Colors Tab This tab allows you to choose colors to be used by the Display | Fill Under Graph | Contour Colors and Format | Contour Map commands.
Show/Hide Tab This tab allows you to show and hide columns of the Traces spreadsheet. All of the columns (except the Select column) can be hidden or shown. To show or hide columns in the spreadsheet,
• Right click on any column heading in the spreadsheet. The File | Options box will open displaying the Traces tab.
• Un-check columns to hide them. Check columns to show them.
ME'scope Reference Volume IIA - Basic Operations
98
Reset Column Widths There are two ways to change column widths in spreadsheets so that all information in each column is visible,
1. Double click on Reset Column Widths on the Show/Hide tab
2. Hold down the Ctrl key, and right click on a spreadsheet column heading.
Animation Tab This tab contains options that are used during animation of shapes from the Data Block. During Sweep animation the number of Cycles of Dwell (animation) per Sample (or shape) can be user-specified. This "pauses" the Sweep at each sample and executes the number of cycles of Sine Dwell animation before proceeding to the next sample.
The + Fill color (chosen on the Display tab) can also be used to display shapes in the Structure window by checking Animate Using + Fill Color on this tab. This is useful for making shapes from different Animation Sources more distinguishable.
File | Close This command closes the Data Block window. You can also close it by clicking on the close button in the upper right corner of the window. To re-open a Data Block file,
1. Double click on the file name in the Project Panel, or
2. Right click on it in the Upper pane and execute Open from the drop down menu.
3. Right click on it in the Lower pane and execute Add from the drop down menu.
Edit | Undo This command restores the Data Block window to the state it was in before the last operation. This command can be used repeatedly to undo the last N operations, where N = Number of edits saved.
NOTE: N = Number of edits saved can be changed on the General tab in the File | Options dialog box of the ME'scopeVES window.
Edit | Redo This command restores the Data Block window to the state it was in before the last execution of the Edit | Undo command.
Edit | Select Traces The commands in this menu are used to select Traces. Some Data Block window commands will operate only on selected Traces. Others will operate on all (or selected) Traces. A selected Trace is outlined with a green background, and its Select button is depressed in the Traces spreadsheet.
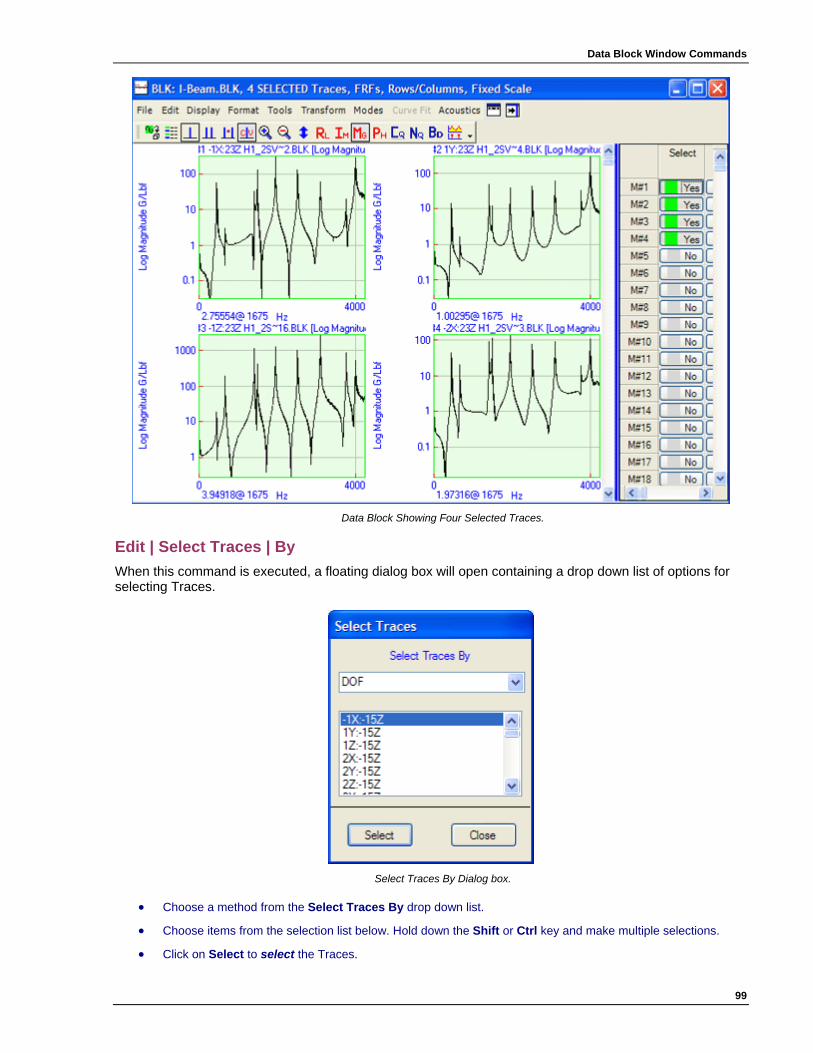
Data Block Window Commands
99
Data Block Showing Four Selected Traces.
Edit | Select Traces | By When this command is executed, a floating dialog box will open containing a drop down list of options for selecting Traces.
Select Traces By Dialog box.
• Choose a method from the Select Traces By drop down list.
• Choose items from the selection list below. Hold down the Shift or Ctrl key and make multiple selections.
• Click on Select to select the Traces.

ME'scope Reference Volume IIA - Basic Operations
100
Select By DOF This method selects Traces by their Trace DOFs. Trace DOFs are displayed in the DOFs column in the Traces spreadsheet, and have the form,
Trace DOF = Roving DOF : Reference DOF [Measurement Set]
The Roving DOF precedes the colon ":" and the Reference DOF follows the colon ":". The Measurement Set number is enclosed in brackets [ ].
Single-channel measurements normally have only a Roving DOF, and cross-channel measurements normally have Roving & Reference DOFs. Measurement Set numbers are used when data is acquired in multiple measurement sets.
Select By Roving DOF This method selects Traces by the Roving DOF portion of their Trace DOF,
Trace DOF = Roving DOF : Reference DOF
Select By Reference DOF This method selects Traces by the Reference DOF portion of their Trace DOF
Trace DOF = Roving DOF : Reference DOF
Select By Point This method selects Traces by the Point number in the Roving DOF portion of their Trace DOF,
Trace DOF = Point Number & Direction : Reference DOF
Select By Direction This method selects Traces by the direction in the Roving DOF portion of their Trace DOF,
Trace DOF = Point Number & Direction : Reference DOF
Select By Measurement Set This method selects Traces by the [Measurement Set] portion of their Trace DOF,
Trace DOF = Roving DOF: Reference DOF [Measurement Set]
Select By Roving DOF Only This method selects Traces that only have a Roving DOF,
Trace DOF = Roving DOF
Select By Reference DOF Only This method selects Traces that only have a Reference DOF,
Trace DOF = : Reference DOF
Select By Data Type This method selects Traces by their Data Type. Data Types are listed in the Data Type column in the Traces spreadsheet.

Data Block Window Commands
101
Select By Measurement Type This method selects Traces by their Measurement Type. Measurement Types are listed in the Meas. Type column in the spreadsheet.
Edit | Select Traces | All, None, Invert Edit | Select Traces | All selects all Traces. Edit | Select Traces | None un-selects all Traces. All Traces can also be selected or un-selected by double clicking on the Select column heading in the Traces spreadsheet. Edit | Select Traces | Invert changes all un-selected to selected Traces, and all selected to un-selected Traces.
Edit | Sort Traces The commands in this menu sort (re-order) Traces by several different methods. These commands operate on all (or the selected) Traces.
Traces are numbered in order, from (M# 1) to (M# N), N = the number of Traces in the Data Block. Therefore, each Trace has a unique M# based on its order.
NOTE: Trace order is important because the Animation Equations on a structure model use measurement numbers (M#s) to animate shape data from a Data Block. Following the use of these commands, execute Tools | Assign M#s to create new Animation Equations in the connected Structure window before initiating animation.
Edit | Sort Traces | By When this command is executed, a floating dialog box will open that contains a drop down list of options for sorting Traces.
Sort Traces By Dialog box.
• Choose a sorting method from the Sort Traces By drop down list.
• Choose items from the Select From list, or check Select All to choose all items in the Select From list.
• Use Ascending, Descending, and the Remove button to obtain the desired Sort Using list.
• Click on Sort to sort the Traces according to the Sort Using list.
NOTE: All Traces that don't satisfy the criterion in the Sort Using list will follow the sorted Traces in the new sorted order.
ME'scope Reference Volume IIA - Basic Operations
102
Sort By DOF This method sorts Traces by their Trace DOFs. Trace DOFs are displayed in the DOFs column in the Traces spreadsheet, and have the form,
Trace DOF = Roving DOF : Reference DOF [Measurement Set]
The Roving DOF precedes the colon ":" and the Reference DOF follows the colon ":". The Measurement Set number must be enclosed in brackets [ ].
Single-channel measurements normally have only a Roving DOF. Cross-channel measurements normally have Roving & Reference DOFs. Measurement Set numbers are used when data is acquired in multiple measurement sets.
Sort By Roving DOF This method sorts Traces by the Roving DOF portion of their Trace DOF,
Trace DOF = Roving DOF : Reference DOF
Sort By Reference DOF This method sorts Traces by the Reference DOF portion of their Trace DOF,
Trace DOF = Roving DOF : Reference DOF
Sort By Point This method sorts Traces by the Point number in the Roving DOF portion of their Trace DOF,
Trace DOF = Point Number & Direction : Reference DOF
Sort By Direction This method sorts Traces by the direction in the Roving DOF portion of their Trace DOF,
Trace DOF = Point Number & Direction : Reference DOF
Sort By Measurement Set This method sorts Traces by the [Measurement Set] portion of their Trace DOF,
Trace DOF = Roving DOF: Reference DOF [Measurement Set]
Sort By Roving DOF Only This method sorts Traces that only have a Roving DOF,
Trace DOF = Roving DOF
Sort By Reference DOF Only This method sorts Traces that only have a Reference DOF,
Trace DOF = : Reference DOF
Sort By Data Type This method sorts Traces by their Data Type. Data Types are listed in the Data Type column in the Traces spreadsheet.
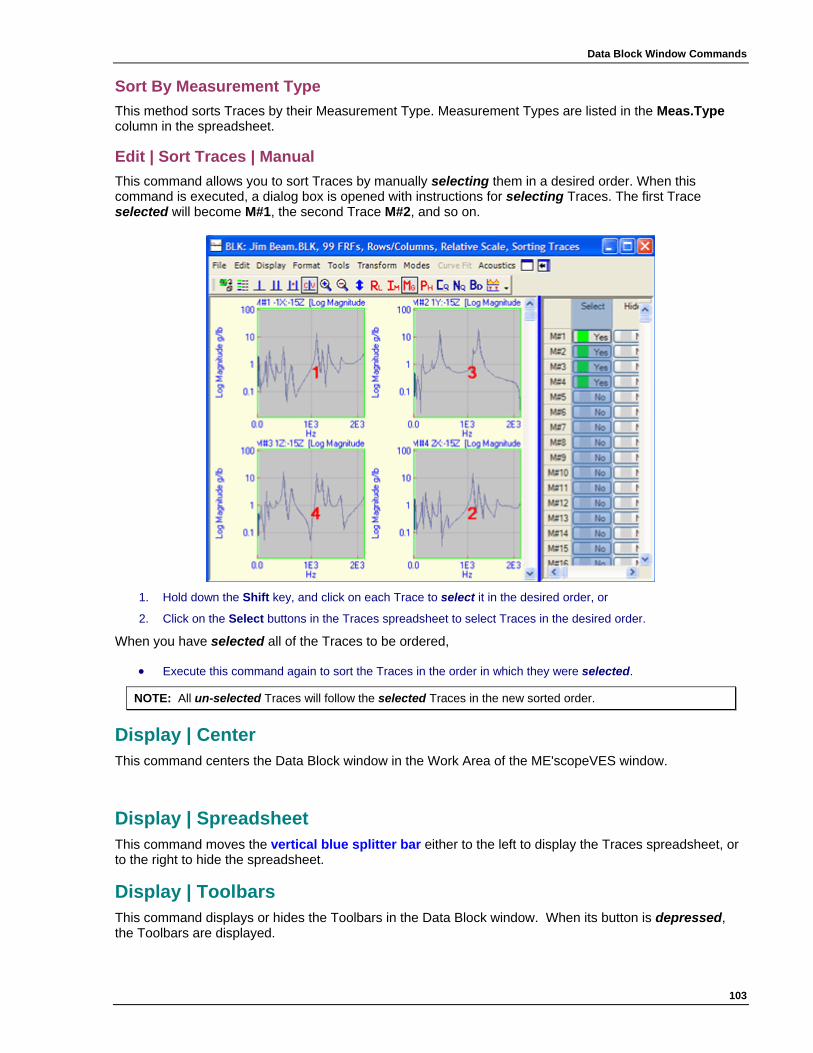
Data Block Window Commands
103
Sort By Measurement Type This method sorts Traces by their Measurement Type. Measurement Types are listed in the Meas.Type column in the spreadsheet.
Edit | Sort Traces | Manual This command allows you to sort Traces by manually selecting them in a desired order. When this command is executed, a dialog box is opened with instructions for selecting Traces. The first Trace selected will become M#1, the second Trace M#2, and so on.
1. Hold down the Shift key, and click on each Trace to select it in the desired order, or
2. Click on the Select buttons in the Traces spreadsheet to select Traces in the desired order.
When you have selected all of the Traces to be ordered,
• Execute this command again to sort the Traces in the order in which they were selected.
NOTE: All un-selected Traces will follow the selected Traces in the new sorted order.
Display | Center This command centers the Data Block window in the Work Area of the ME'scopeVES window.
Display | Spreadsheet This command moves the vertical blue splitter bar either to the left to display the Traces spreadsheet, or to the right to hide the spreadsheet.
Display | Toolbars This command displays or hides the Toolbars in the Data Block window. When its button is depressed, the Toolbars are displayed.
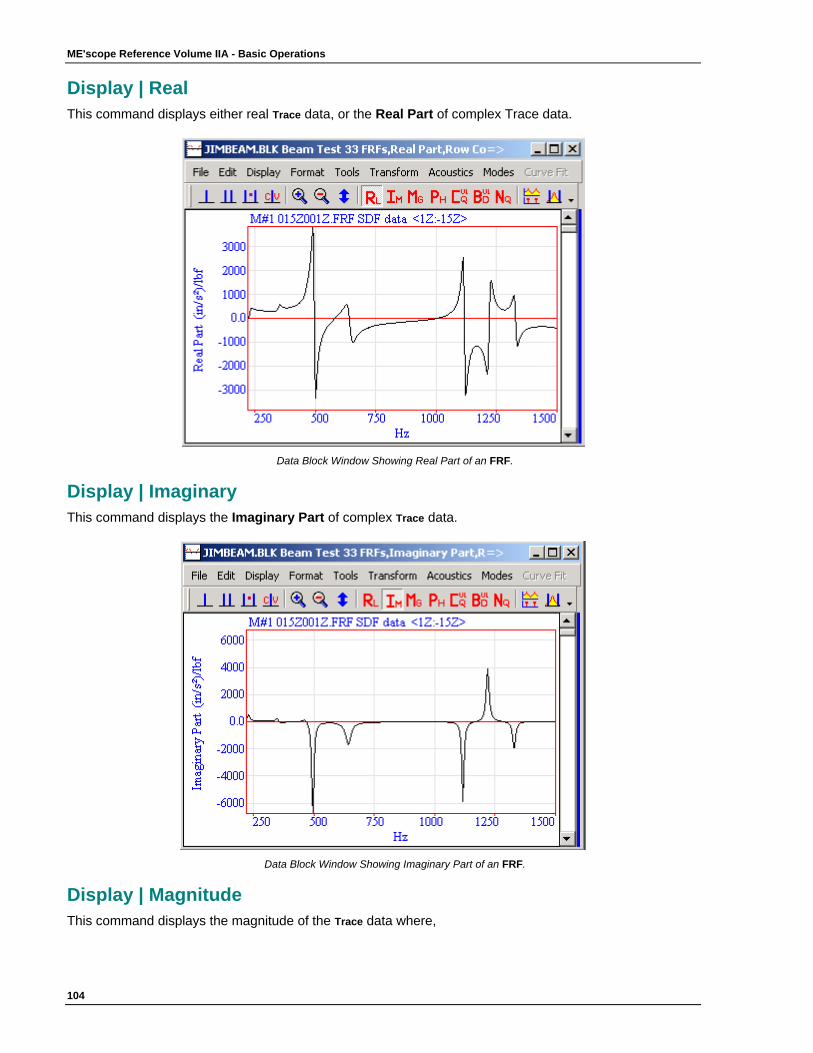
ME'scope Reference Volume IIA - Basic Operations
104
Display | Real This command displays either real Trace data, or the Real Part of complex Trace data.
Data Block Window Showing Real Part of an FRF.
Display | Imaginary This command displays the Imaginary Part of complex Trace data.
Data Block Window Showing Imaginary Part of an FRF.
Display | Magnitude This command displays the magnitude of the Trace data where,
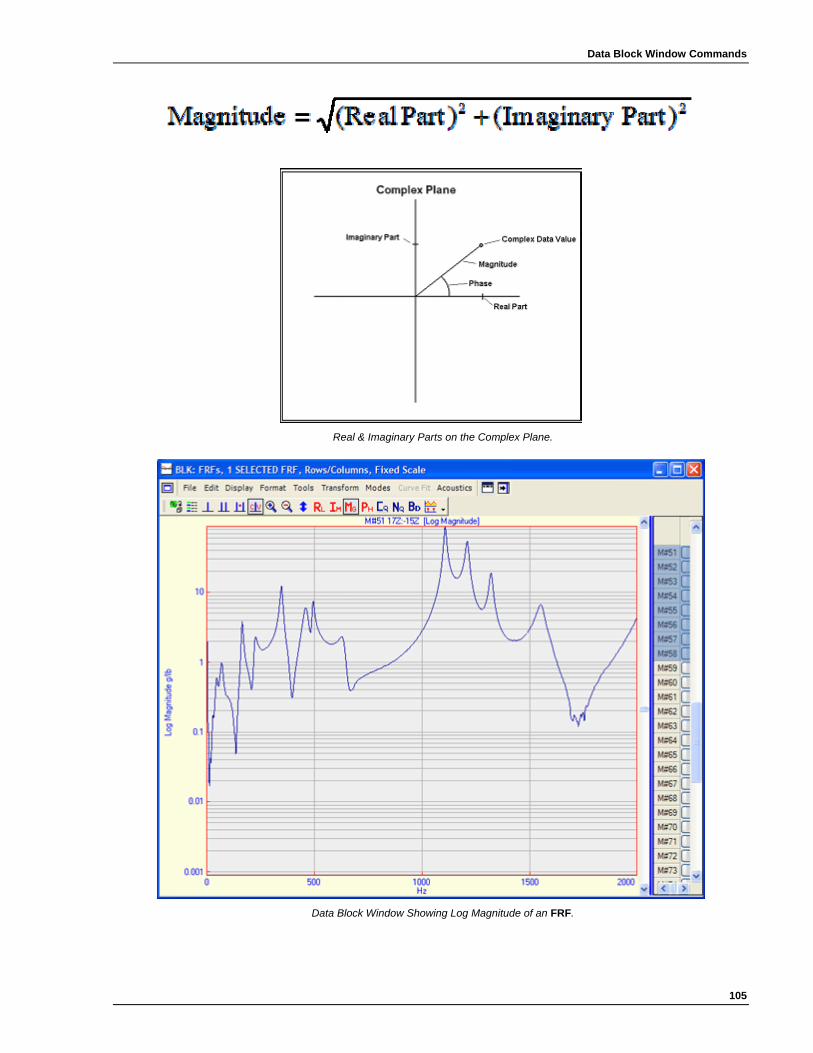
Data Block Window Commands
105
Real & Imaginary Parts on the Complex Plane.
Data Block Window Showing Log Magnitude of an FRF.

ME'scope Reference Volume IIA - Basic Operations
106
Linear, Log or dB Magnitudes can be displayed in Linear, Log or dB format. When Log or dB is chosen, you can also choose the number of decades (powers of 10) to display in the range (1 to 14).
NOTE: Linear, Log, dB & decades choices are made in the Format | Vertical Axis dialog box. Double click on the vertical axis labels area to open this dialog box.
dB Units for Linear versus Power Quantities Magnitudes can be displayed in dB (decibel) units. For Linear (RMS) quantities, such as FRFs, Fourier Spectra, etc., the Magnitude is displayed as,
Magnitude (dB) = 20 Log 10( Magnitude )
For Power (MS) quantities, such as Auto Spectra, PSD’s, etc., the Magnitude is displayed as,
Magnitude (dB) = 10 Log 10( Magnitude )
Display | Phase This command displays the Phase of complex Trace data, with values between +180 and -180 degrees. (See Display | Magnitude for a description of phase.)
Data Block Window Showing Phase of an FRF.
Display | CoQuad This command displays the Traces in Co-Quad (Real & Imaginary part) format. The Real part is also called the Coincident waveform, and the Imaginary part is called the Quadrature waveform, hence the term Co-Quad refers to both parts shown together.

Data Block Window Commands
107
CoQuad Display.
Display | Bode This command displays the Traces in Bode (Magnitude & Phase) format. A Bode plot can be displayed using either a Log or Linear frequency axis. The Phase is displayed in the upper half and the Magnitude in the lower half of each Trace display.
Bode Plot.
Display | Nyquist This command displays the Traces in Nyquist format. A Nyquist plot displays the Real part on the horizontal axis and the Imaginary part on the vertical axis.
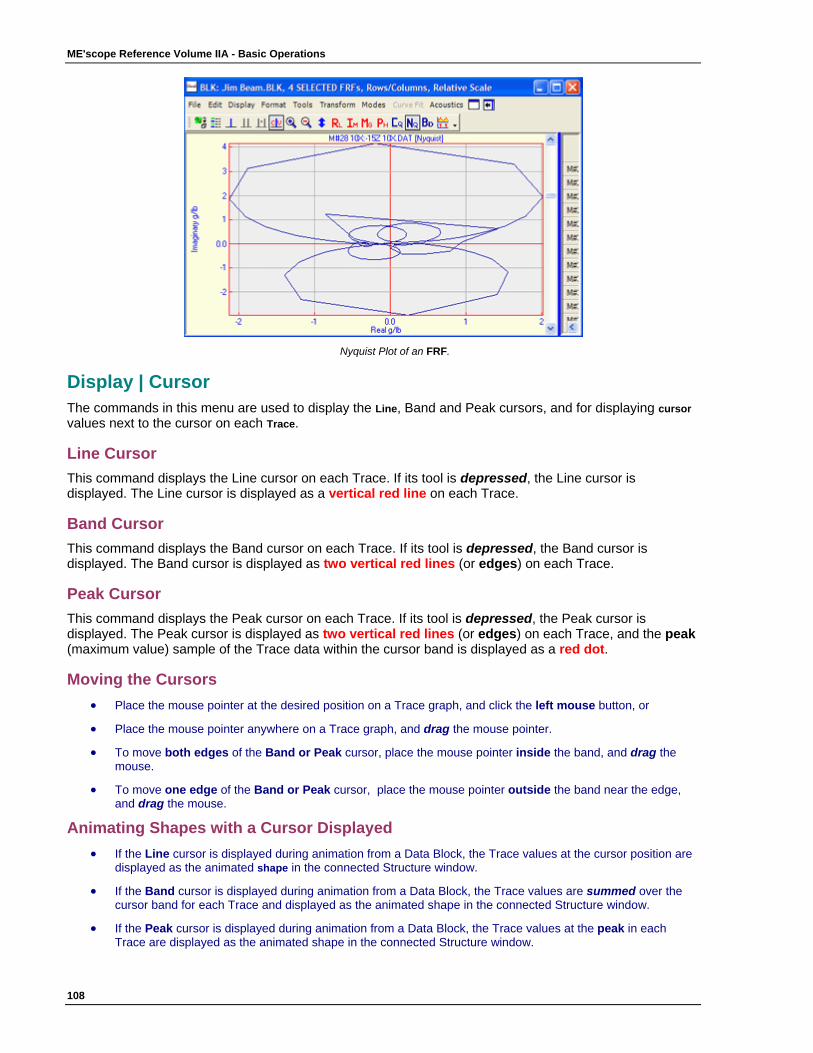
ME'scope Reference Volume IIA - Basic Operations
108
Nyquist Plot of an FRF.
Display | Cursor The commands in this menu are used to display the Line, Band and Peak cursors, and for displaying cursor values next to the cursor on each Trace.
Line Cursor This command displays the Line cursor on each Trace. If its tool is depressed, the Line cursor is displayed. The Line cursor is displayed as a vertical red line on each Trace.
Band Cursor This command displays the Band cursor on each Trace. If its tool is depressed, the Band cursor is displayed. The Band cursor is displayed as two vertical red lines (or edges) on each Trace.
Peak Cursor This command displays the Peak cursor on each Trace. If its tool is depressed, the Peak cursor is displayed. The Peak cursor is displayed as two vertical red lines (or edges) on each Trace, and the peak (maximum value) sample of the Trace data within the cursor band is displayed as a red dot.
Moving the Cursors • Place the mouse pointer at the desired position on a Trace graph, and click the left mouse button, or
• Place the mouse pointer anywhere on a Trace graph, and drag the mouse pointer.
• To move both edges of the Band or Peak cursor, place the mouse pointer inside the band, and drag the mouse.
• To move one edge of the Band or Peak cursor, place the mouse pointer outside the band near the edge, and drag the mouse.
Animating Shapes with a Cursor Displayed • If the Line cursor is displayed during animation from a Data Block, the Trace values at the cursor position are
displayed as the animated shape in the connected Structure window.
• If the Band cursor is displayed during animation from a Data Block, the Trace values are summed over the cursor band for each Trace and displayed as the animated shape in the connected Structure window.
• If the Peak cursor is displayed during animation from a Data Block, the Trace values at the peak in each Trace are displayed as the animated shape in the connected Structure window.
Data Block Window Commands
109
Saving Shapes with a Cursor Displayed • If the Line cursor is displayed and Tools | Save Shape is executed, the Trace values at the cursor position
are saved as components of the shape in a Shape Table.
• If the Band cursor is displayed and Tools | Save Shape is executed, the Trace values are summed over the cursor band for each Trace and saved as components of the shape in a Shape Table.
• If the Peak cursor is displayed and Tools | Save Shape is executed, the Trace values at the peak are saved as components of the shape in a Shape Table.
Cursor Values This command displays the cursor values in a text box on each Trace. If its button is depressed, the cursor values are always displayed. Otherwise, the cursor values are only displayed when the cursors are turned ON and the left mouse button is held down. The cursor values are displayed in a text box next to the cursor vertical line or lines. Cursor values are displayed in the format:
(Vertical Axis Value @ Horizontal Axis Value)
NOTE: Each cursor value text box can be moved up and down on the display by dragging it vertically.
Display | Zoom This command allows you to expand the display of the Traces in the horizontal (X-axis) and vertical (Y-axis) directions. To initiate a Zoom operation,
• Execute Display | Zoom, or depress its button on the Toolbar.
The mouse pointer will change to the Zoom cursor <=> when placed on any Trace.
Displaying a Range of Samples To display a range of samples in the X-axis direction,
• Move the Zoom cursor to one end of the range of Trace data to be zoomed.
• Drag the Zoom cursor to the other end of the range of data, and release the mouse button to display the zoomed range of samples.
Zooming Around a Sample To Zoom in the X-axis direction around a particular sample of data,
• Move the Zoom cursor to the sample of Trace data to be zoomed around, and click the left mouse button.
Each time you Zoom around a sample, half of the number of displayed samples are displayed, except at the beginning and end of the sample range.
X & Y-axis Zoom To Zoom in both the vertical & horizontal directions on a Trace,
• Hold down the Ctrl key on the keyboard. The Zoom cursor will change to a cross when placed on a Trace.
• Drag the cursor to draw a Zoom box on the Trace, and release the mouse button to display the data in the Zoom box.
Panning After a Zoom After you have zoomed the display, the Zoom scroll bar will be displayed at the bottom of the Trace graphics area. To pan the display to other samples of data along the X-axis.
1. Use the horizontal scroll bar, or
2. Hold down the Ctrl key and drag the mouse pointer in the graphics area..
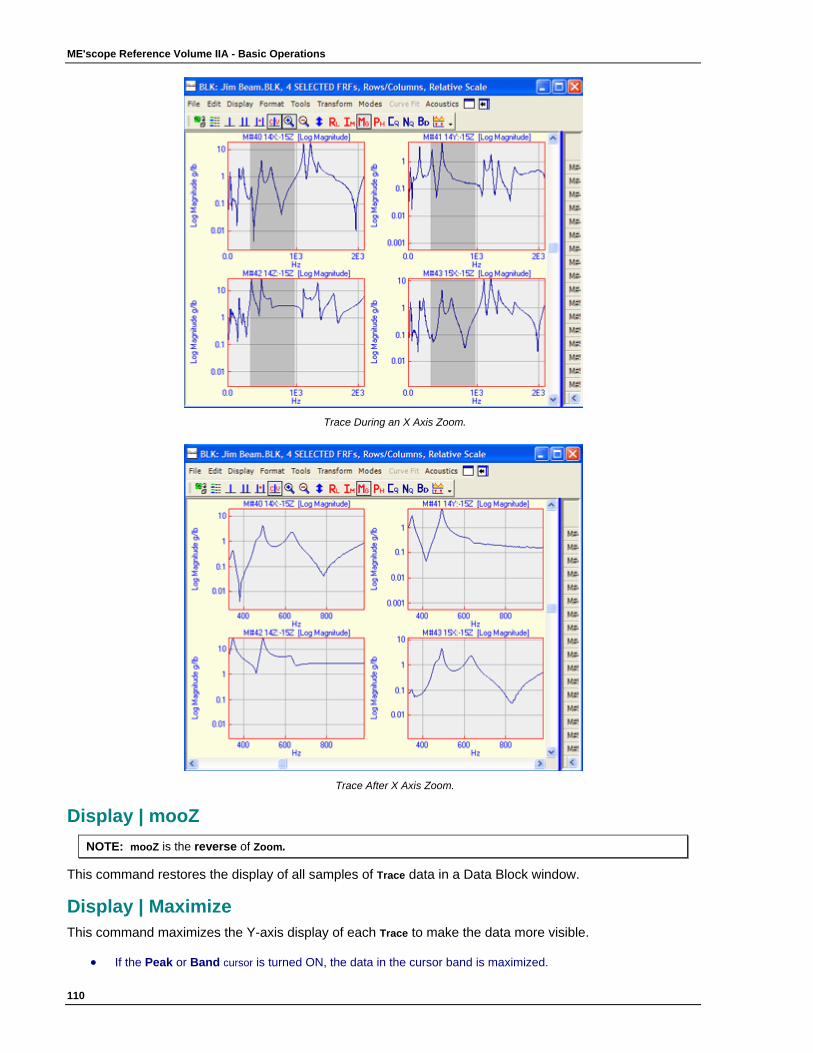
ME'scope Reference Volume IIA - Basic Operations
110
Trace During an X Axis Zoom.
Trace After X Axis Zoom.
Display | mooZ NOTE: mooZ is the reverse of Zoom.
This command restores the display of all samples of Trace data in a Data Block window.
Display | Maximize This command maximizes the Y-axis display of each Trace to make the data more visible.
• If the Peak or Band cursor is turned ON, the data in the cursor band is maximized.

Data Block Window Commands
111
• If Traces are selected, then only the selected Traces are maximized.
How It Works When this command is executed, the data in the band (or the visible data) is scanned to find its maximum value. The Traces are then changed to Fixed Scale, and the maximum (& minimum) value is used as the maximum (& minimum) fixed value. These values are also displayed in the Max (& Min) Trace spreadsheet columns.
Traces before Maximizing in a Cursor Band.
Traces after Maximizing in a Cursor Band.
Maximizing Real & Imaginary Displays If the Real part or Imaginary part of the Traces is displayed, successive execution of Display | Maximize will change the display between,
1. Plus (+) and minus (-) limits.
2. The vertical axis centered about the Zero (0) axis.
Display | Fill Under Graph The commands in this menu are used for turning color fill under the Trace graphs ON and OFF.
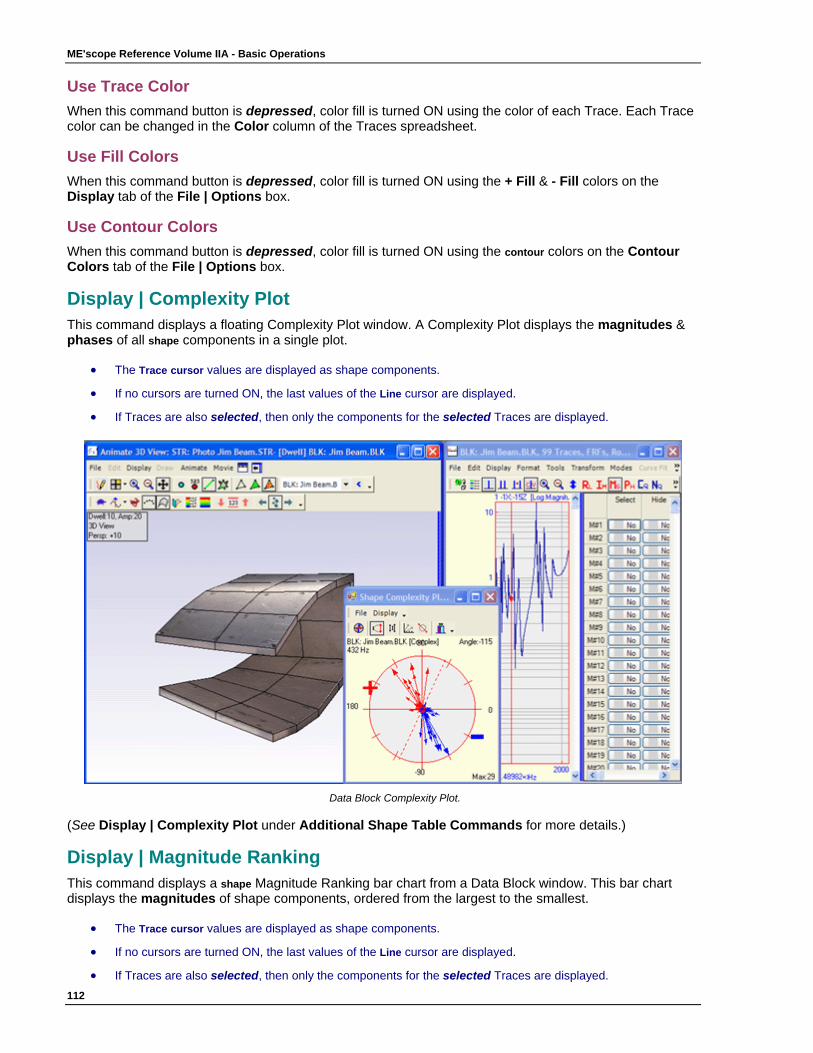
ME'scope Reference Volume IIA - Basic Operations
112
Use Trace Color When this command button is depressed, color fill is turned ON using the color of each Trace. Each Trace color can be changed in the Color column of the Traces spreadsheet.
Use Fill Colors When this command button is depressed, color fill is turned ON using the + Fill & - Fill colors on the Display tab of the File | Options box.
Use Contour Colors When this command button is depressed, color fill is turned ON using the contour colors on the Contour Colors tab of the File | Options box.
Display | Complexity Plot This command displays a floating Complexity Plot window. A Complexity Plot displays the magnitudes & phases of all shape components in a single plot.
• The Trace cursor values are displayed as shape components.
• If no cursors are turned ON, the last values of the Line cursor are displayed.
• If Traces are also selected, then only the components for the selected Traces are displayed.
Data Block Complexity Plot.
(See Display | Complexity Plot under Additional Shape Table Commands for more details.)
Display | Magnitude Ranking This command displays a shape Magnitude Ranking bar chart from a Data Block window. This bar chart displays the magnitudes of shape components, ordered from the largest to the smallest.
• The Trace cursor values are displayed as shape components.
• If no cursors are turned ON, the last values of the Line cursor are displayed.
• If Traces are also selected, then only the components for the selected Traces are displayed.
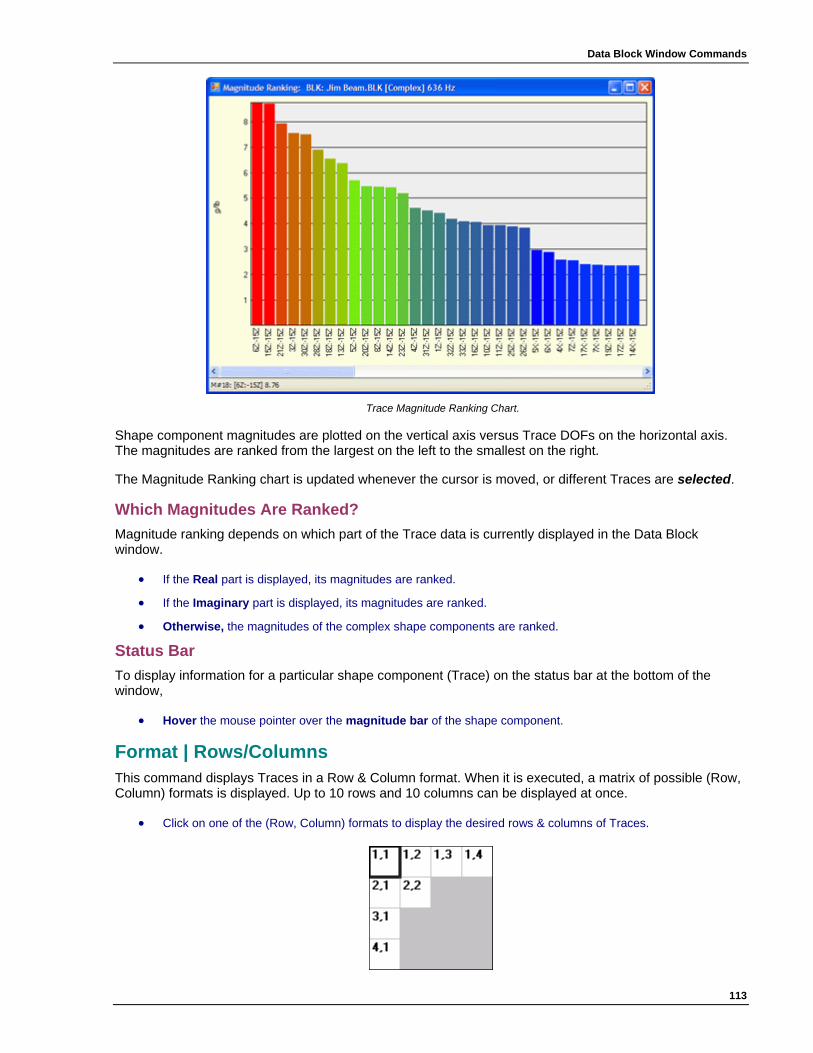
Data Block Window Commands
113
Trace Magnitude Ranking Chart.
Shape component magnitudes are plotted on the vertical axis versus Trace DOFs on the horizontal axis. The magnitudes are ranked from the largest on the left to the smallest on the right.
The Magnitude Ranking chart is updated whenever the cursor is moved, or different Traces are selected.
Which Magnitudes Are Ranked? Magnitude ranking depends on which part of the Trace data is currently displayed in the Data Block window.
• If the Real part is displayed, its magnitudes are ranked.
• If the Imaginary part is displayed, its magnitudes are ranked.
• Otherwise, the magnitudes of the complex shape components are ranked.
Status Bar To display information for a particular shape component (Trace) on the status bar at the bottom of the window,
• Hover the mouse pointer over the magnitude bar of the shape component.
Format | Rows/Columns This command displays Traces in a Row & Column format. When it is executed, a matrix of possible (Row, Column) formats is displayed. Up to 10 rows and 10 columns can be displayed at once.
• Click on one of the (Row, Column) formats to display the desired rows & columns of Traces.
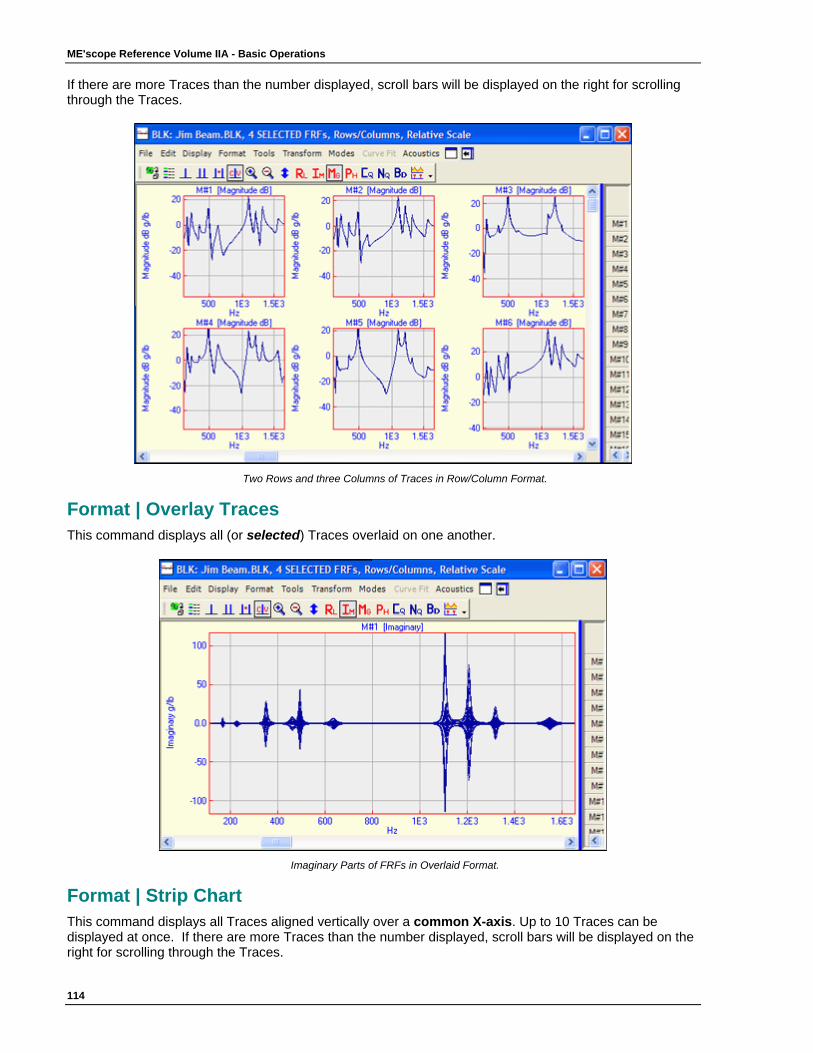
ME'scope Reference Volume IIA - Basic Operations
114
If there are more Traces than the number displayed, scroll bars will be displayed on the right for scrolling through the Traces.
Two Rows and three Columns of Traces in Row/Column Format.
Format | Overlay Traces This command displays all (or selected) Traces overlaid on one another.
Imaginary Parts of FRFs in Overlaid Format.
Format | Strip Chart This command displays all Traces aligned vertically over a common X-axis. Up to 10 Traces can be displayed at once. If there are more Traces than the number displayed, scroll bars will be displayed on the right for scrolling through the Traces.
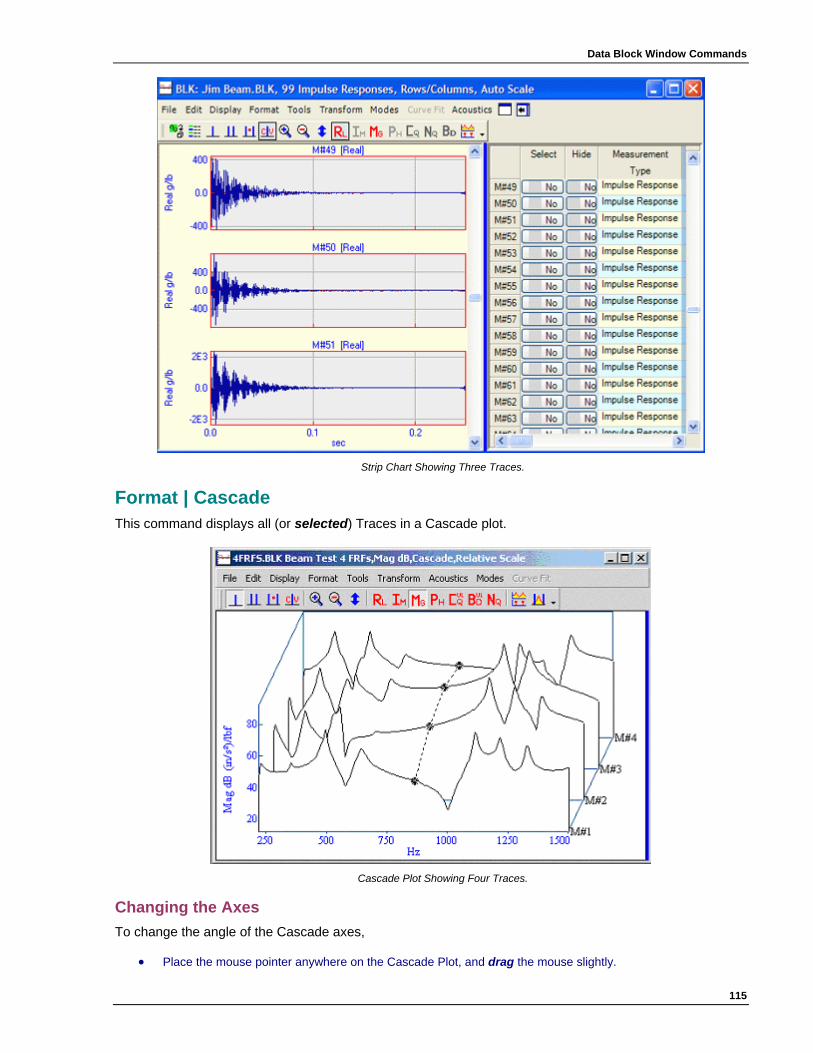
Data Block Window Commands
115
Strip Chart Showing Three Traces.
Format | Cascade This command displays all (or selected) Traces in a Cascade plot.
Cascade Plot Showing Four Traces.
Changing the Axes To change the angle of the Cascade axes,
• Place the mouse pointer anywhere on the Cascade Plot, and drag the mouse slightly.
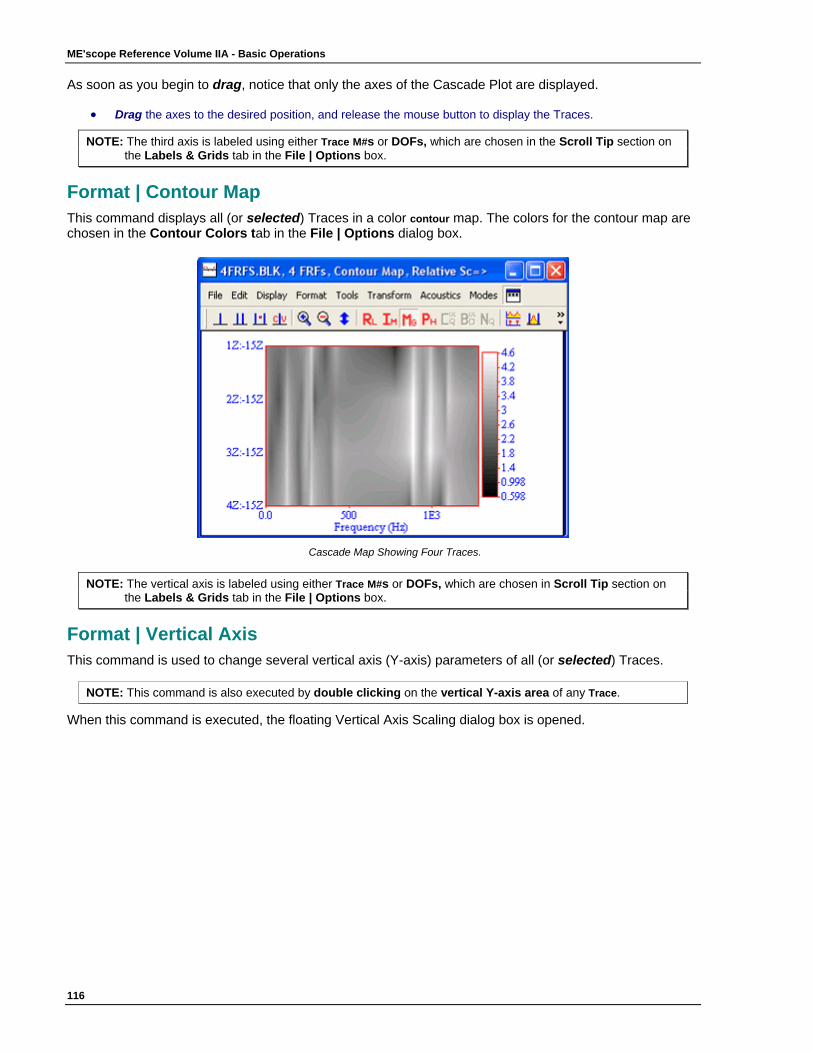
ME'scope Reference Volume IIA - Basic Operations
116
As soon as you begin to drag, notice that only the axes of the Cascade Plot are displayed.
• Drag the axes to the desired position, and release the mouse button to display the Traces.
NOTE: The third axis is labeled using either Trace M#s or DOFs, which are chosen in the Scroll Tip section on the Labels & Grids tab in the File | Options box.
Format | Contour Map This command displays all (or selected) Traces in a color contour map. The colors for the contour map are chosen in the Contour Colors tab in the File | Options dialog box.
Cascade Map Showing Four Traces.
NOTE: The vertical axis is labeled using either Trace M#s or DOFs, which are chosen in Scroll Tip section on the Labels & Grids tab in the File | Options box.
Format | Vertical Axis This command is used to change several vertical axis (Y-axis) parameters of all (or selected) Traces.
NOTE: This command is also executed by double clicking on the vertical Y-axis area of any Trace.
When this command is executed, the floating Vertical Axis Scaling dialog box is opened.
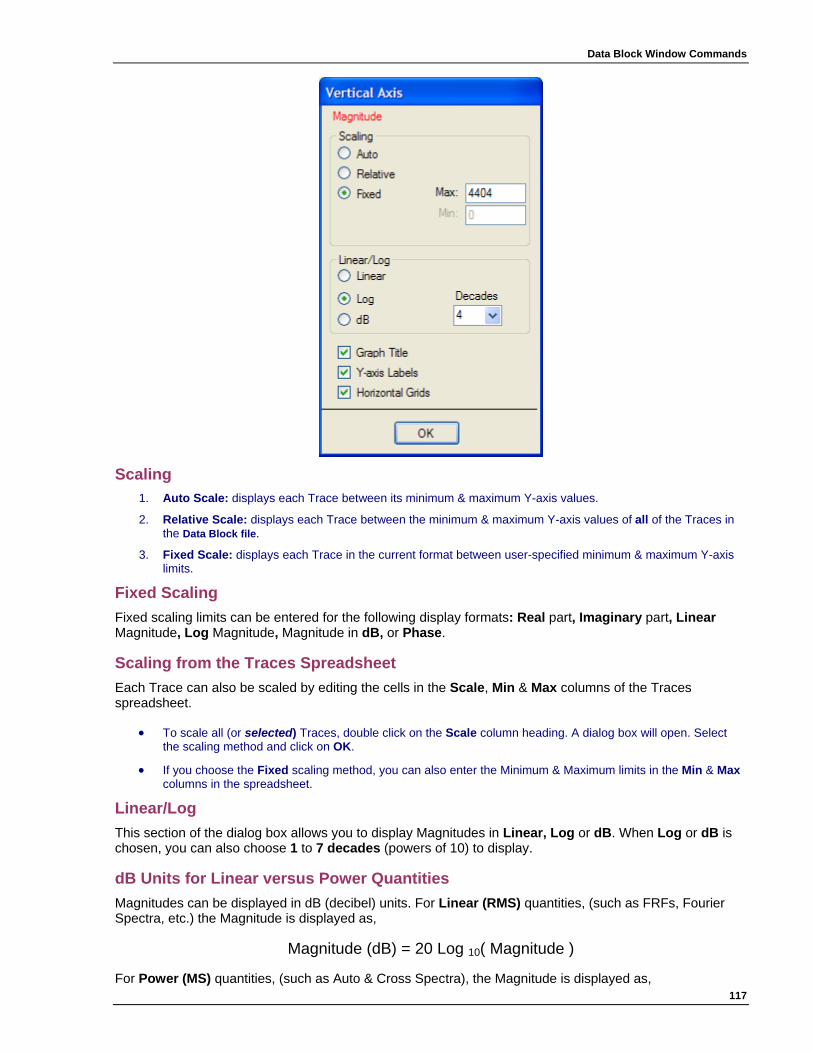
Data Block Window Commands
117
Scaling 1. Auto Scale: displays each Trace between its minimum & maximum Y-axis values.
2. Relative Scale: displays each Trace between the minimum & maximum Y-axis values of all of the Traces in the Data Block file.
3. Fixed Scale: displays each Trace in the current format between user-specified minimum & maximum Y-axis limits.
Fixed Scaling Fixed scaling limits can be entered for the following display formats: Real part, Imaginary part, Linear Magnitude, Log Magnitude, Magnitude in dB, or Phase.
Scaling from the Traces Spreadsheet Each Trace can also be scaled by editing the cells in the Scale, Min & Max columns of the Traces spreadsheet.
• To scale all (or selected) Traces, double click on the Scale column heading. A dialog box will open. Select the scaling method and click on OK.
• If you choose the Fixed scaling method, you can also enter the Minimum & Maximum limits in the Min & Max columns in the spreadsheet.
Linear/Log This section of the dialog box allows you to display Magnitudes in Linear, Log or dB. When Log or dB is chosen, you can also choose 1 to 7 decades (powers of 10) to display.
dB Units for Linear versus Power Quantities Magnitudes can be displayed in dB (decibel) units. For Linear (RMS) quantities, (such as FRFs, Fourier Spectra, etc.) the Magnitude is displayed as,
Magnitude (dB) = 20 Log 10( Magnitude )
For Power (MS) quantities, (such as Auto & Cross Spectra), the Magnitude is displayed as,
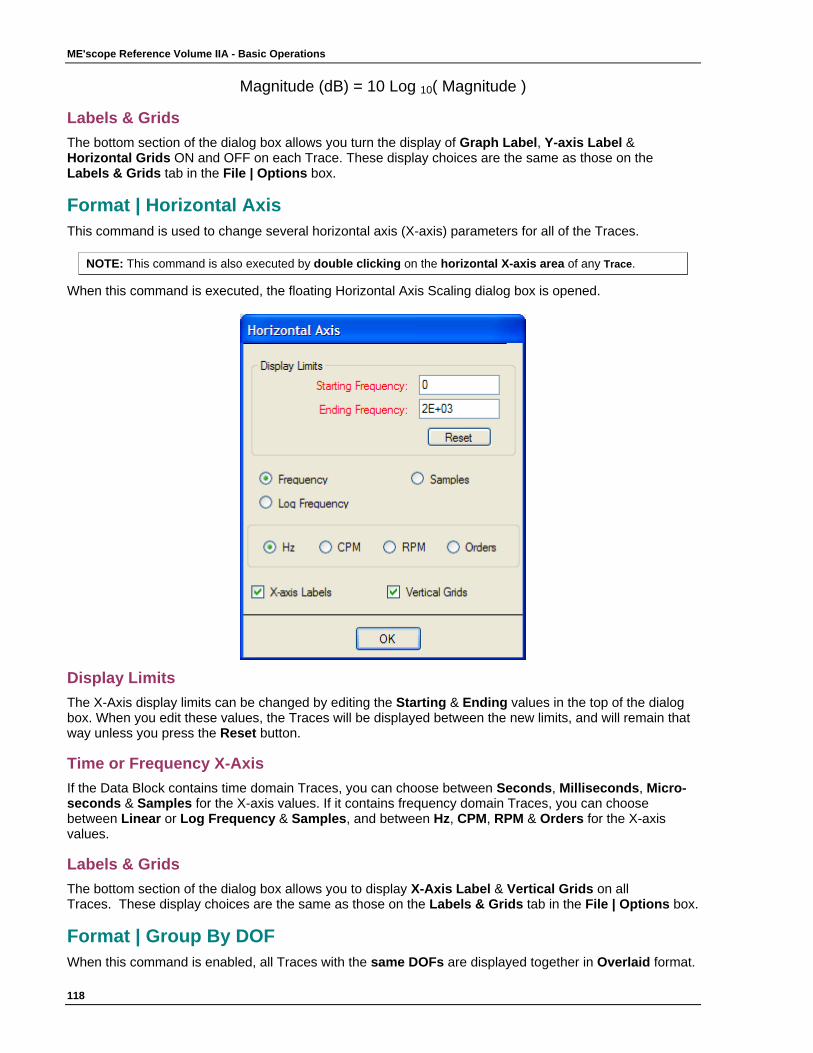
ME'scope Reference Volume IIA - Basic Operations
118
Magnitude (dB) = 10 Log 10( Magnitude )
Labels & Grids The bottom section of the dialog box allows you turn the display of Graph Label, Y-axis Label & Horizontal Grids ON and OFF on each Trace. These display choices are the same as those on the Labels & Grids tab in the File | Options box.
Format | Horizontal Axis This command is used to change several horizontal axis (X-axis) parameters for all of the Traces.
NOTE: This command is also executed by double clicking on the horizontal X-axis area of any Trace.
When this command is executed, the floating Horizontal Axis Scaling dialog box is opened.
Display Limits The X-Axis display limits can be changed by editing the Starting & Ending values in the top of the dialog box. When you edit these values, the Traces will be displayed between the new limits, and will remain that way unless you press the Reset button.
Time or Frequency X-Axis If the Data Block contains time domain Traces, you can choose between Seconds, Milliseconds, Micro-seconds & Samples for the X-axis values. If it contains frequency domain Traces, you can choose between Linear or Log Frequency & Samples, and between Hz, CPM, RPM & Orders for the X-axis values.
Labels & Grids The bottom section of the dialog box allows you to display X-Axis Label & Vertical Grids on all Traces. These display choices are the same as those on the Labels & Grids tab in the File | Options box.
Format | Group By DOF When this command is enabled, all Traces with the same DOFs are displayed together in Overlaid format.
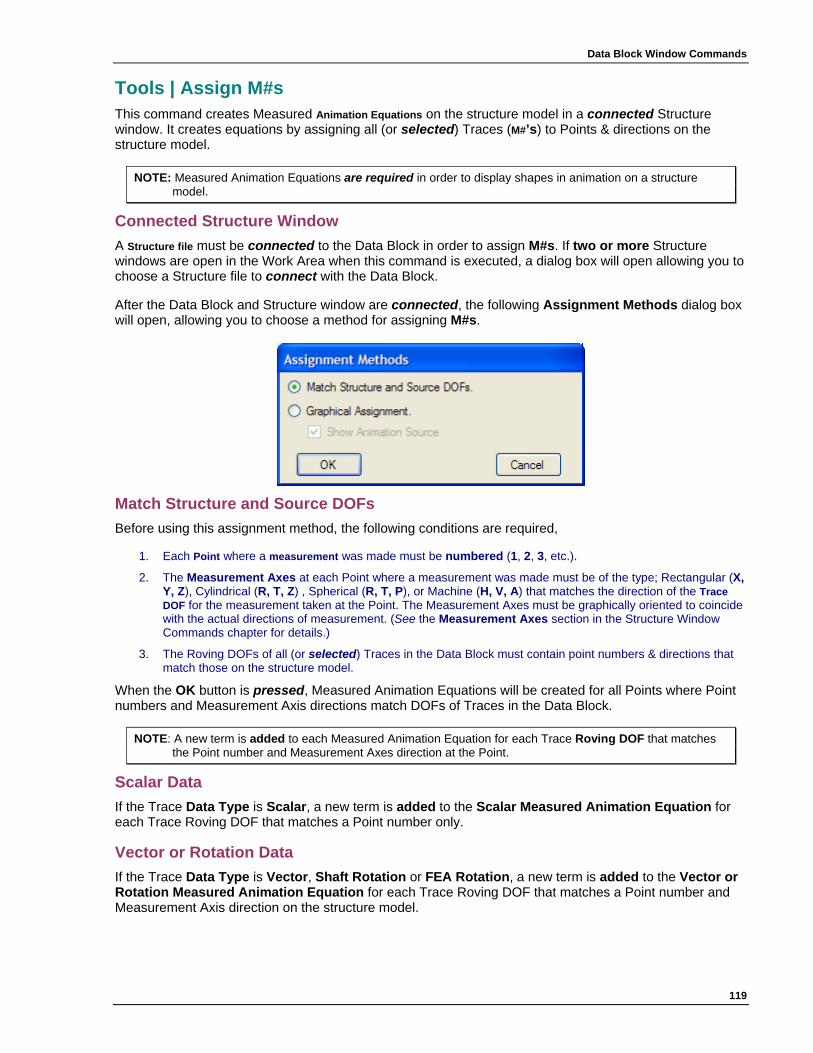
Data Block Window Commands
119
Tools | Assign M#s This command creates Measured Animation Equations on the structure model in a connected Structure window. It creates equations by assigning all (or selected) Traces (M#’s) to Points & directions on the structure model.
NOTE: Measured Animation Equations are required in order to display shapes in animation on a structure model.
Connected Structure Window A Structure file must be connected to the Data Block in order to assign M#s. If two or more Structure windows are open in the Work Area when this command is executed, a dialog box will open allowing you to choose a Structure file to connect with the Data Block.
After the Data Block and Structure window are connected, the following Assignment Methods dialog box will open, allowing you to choose a method for assigning M#s.
Match Structure and Source DOFs Before using this assignment method, the following conditions are required,
1. Each Point where a measurement was made must be numbered (1, 2, 3, etc.).
2. The Measurement Axes at each Point where a measurement was made must be of the type; Rectangular (X, Y, Z), Cylindrical (R, T, Z) , Spherical (R, T, P), or Machine (H, V, A) that matches the direction of the Trace DOF for the measurement taken at the Point. The Measurement Axes must be graphically oriented to coincide with the actual directions of measurement. (See the Measurement Axes section in the Structure Window Commands chapter for details.)
3. The Roving DOFs of all (or selected) Traces in the Data Block must contain point numbers & directions that match those on the structure model.
When the OK button is pressed, Measured Animation Equations will be created for all Points where Point numbers and Measurement Axis directions match DOFs of Traces in the Data Block.
NOTE: A new term is added to each Measured Animation Equation for each Trace Roving DOF that matches the Point number and Measurement Axes direction at the Point.
Scalar Data If the Trace Data Type is Scalar, a new term is added to the Scalar Measured Animation Equation for each Trace Roving DOF that matches a Point number only.
Vector or Rotation Data If the Trace Data Type is Vector, Shaft Rotation or FEA Rotation, a new term is added to the Vector or Rotation Measured Animation Equation for each Trace Roving DOF that matches a Point number and Measurement Axis direction on the structure model.
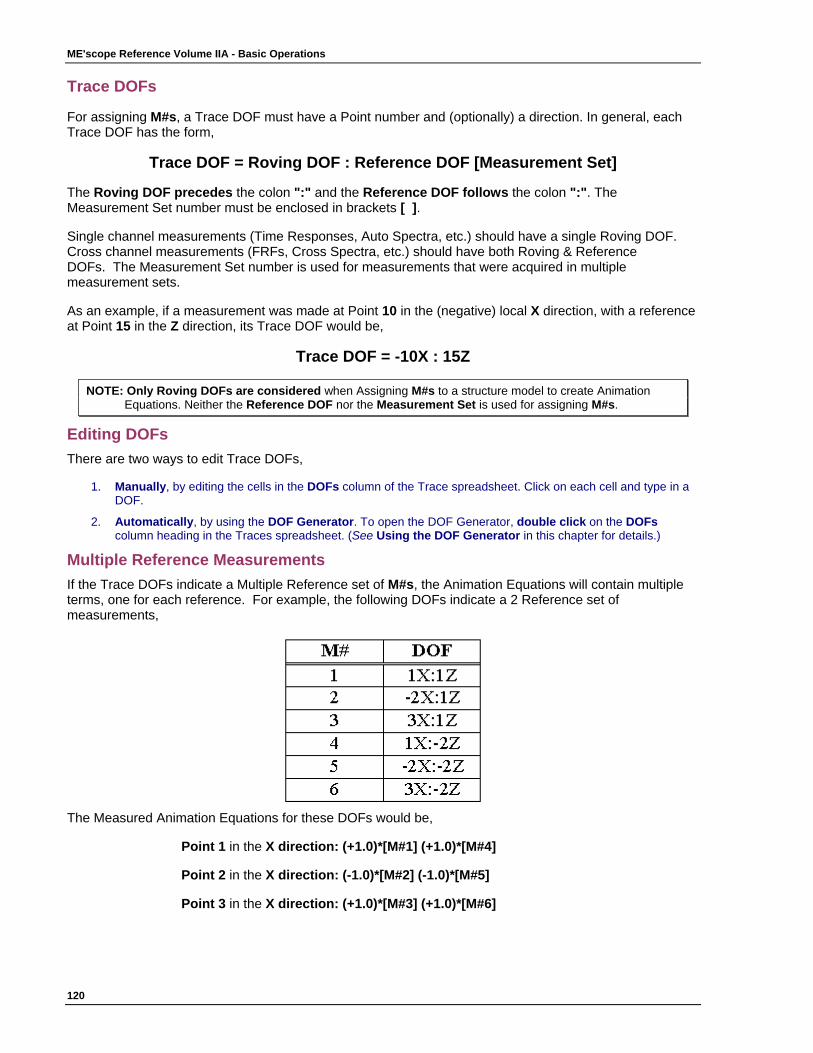
ME'scope Reference Volume IIA - Basic Operations
120
Trace DOFs
For assigning M#s, a Trace DOF must have a Point number and (optionally) a direction. In general, each Trace DOF has the form,
Trace DOF = Roving DOF : Reference DOF [Measurement Set]
The Roving DOF precedes the colon ":" and the Reference DOF follows the colon ":". The Measurement Set number must be enclosed in brackets [ ].
Single channel measurements (Time Responses, Auto Spectra, etc.) should have a single Roving DOF. Cross channel measurements (FRFs, Cross Spectra, etc.) should have both Roving & Reference DOFs. The Measurement Set number is used for measurements that were acquired in multiple measurement sets.
As an example, if a measurement was made at Point 10 in the (negative) local X direction, with a reference at Point 15 in the Z direction, its Trace DOF would be,
Trace DOF = -10X : 15Z
NOTE: Only Roving DOFs are considered when Assigning M#s to a structure model to create Animation Equations. Neither the Reference DOF nor the Measurement Set is used for assigning M#s.
Editing DOFs There are two ways to edit Trace DOFs,
1. Manually, by editing the cells in the DOFs column of the Trace spreadsheet. Click on each cell and type in a DOF.
2. Automatically, by using the DOF Generator. To open the DOF Generator, double click on the DOFs column heading in the Traces spreadsheet. (See Using the DOF Generator in this chapter for details.)
Multiple Reference Measurements If the Trace DOFs indicate a Multiple Reference set of M#s, the Animation Equations will contain multiple terms, one for each reference. For example, the following DOFs indicate a 2 Reference set of measurements,
The Measured Animation Equations for these DOFs would be,
Point 1 in the X direction: (+1.0)*[M#1] (+1.0)*[M#4]
Point 2 in the X direction: (-1.0)*[M#2] (-1.0)*[M#5]
Point 3 in the X direction: (+1.0)*[M#3] (+1.0)*[M#6]
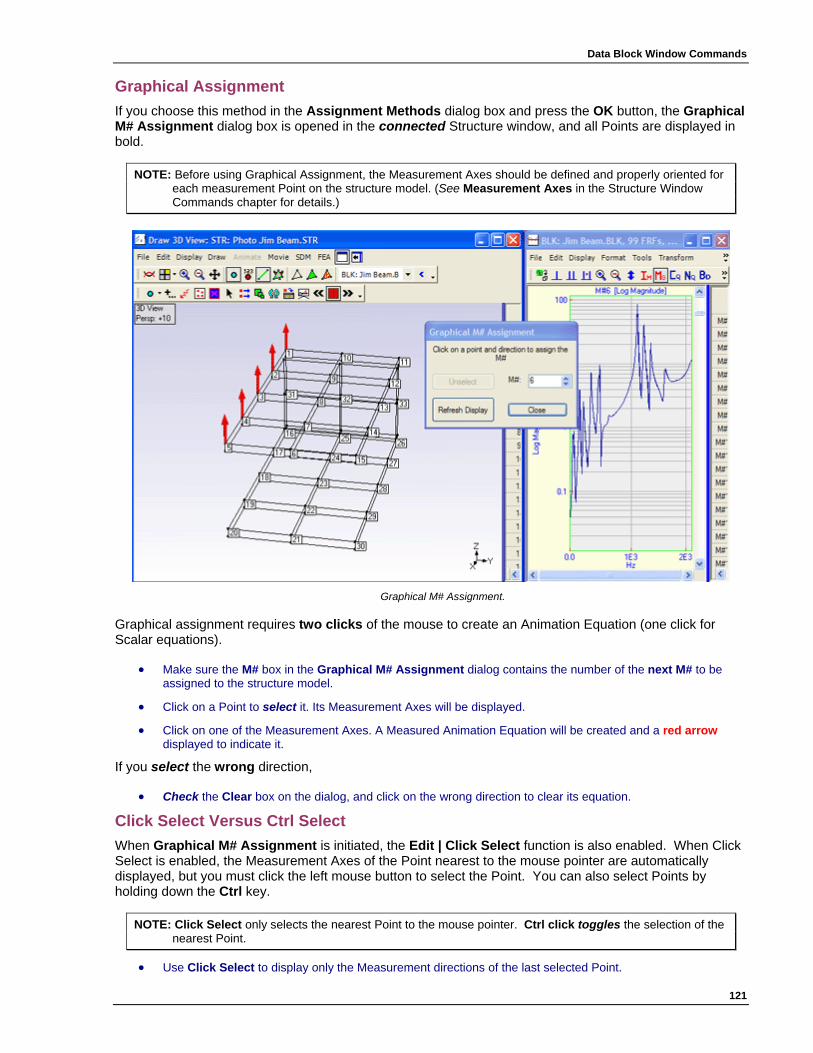
Data Block Window Commands
121
Graphical Assignment If you choose this method in the Assignment Methods dialog box and press the OK button, the Graphical M# Assignment dialog box is opened in the connected Structure window, and all Points are displayed in bold.
NOTE: Before using Graphical Assignment, the Measurement Axes should be defined and properly oriented for each measurement Point on the structure model. (See Measurement Axes in the Structure Window Commands chapter for details.)
Graphical M# Assignment.
Graphical assignment requires two clicks of the mouse to create an Animation Equation (one click for Scalar equations).
• Make sure the M# box in the Graphical M# Assignment dialog contains the number of the next M# to be assigned to the structure model.
• Click on a Point to select it. Its Measurement Axes will be displayed.
• Click on one of the Measurement Axes. A Measured Animation Equation will be created and a red arrow displayed to indicate it.
If you select the wrong direction,
• Check the Clear box on the dialog, and click on the wrong direction to clear its equation.
Click Select Versus Ctrl Select When Graphical M# Assignment is initiated, the Edit | Click Select function is also enabled. When Click Select is enabled, the Measurement Axes of the Point nearest to the mouse pointer are automatically displayed, but you must click the left mouse button to select the Point. You can also select Points by holding down the Ctrl key.
NOTE: Click Select only selects the nearest Point to the mouse pointer. Ctrl click toggles the selection of the nearest Point.
• Use Click Select to display only the Measurement directions of the last selected Point.
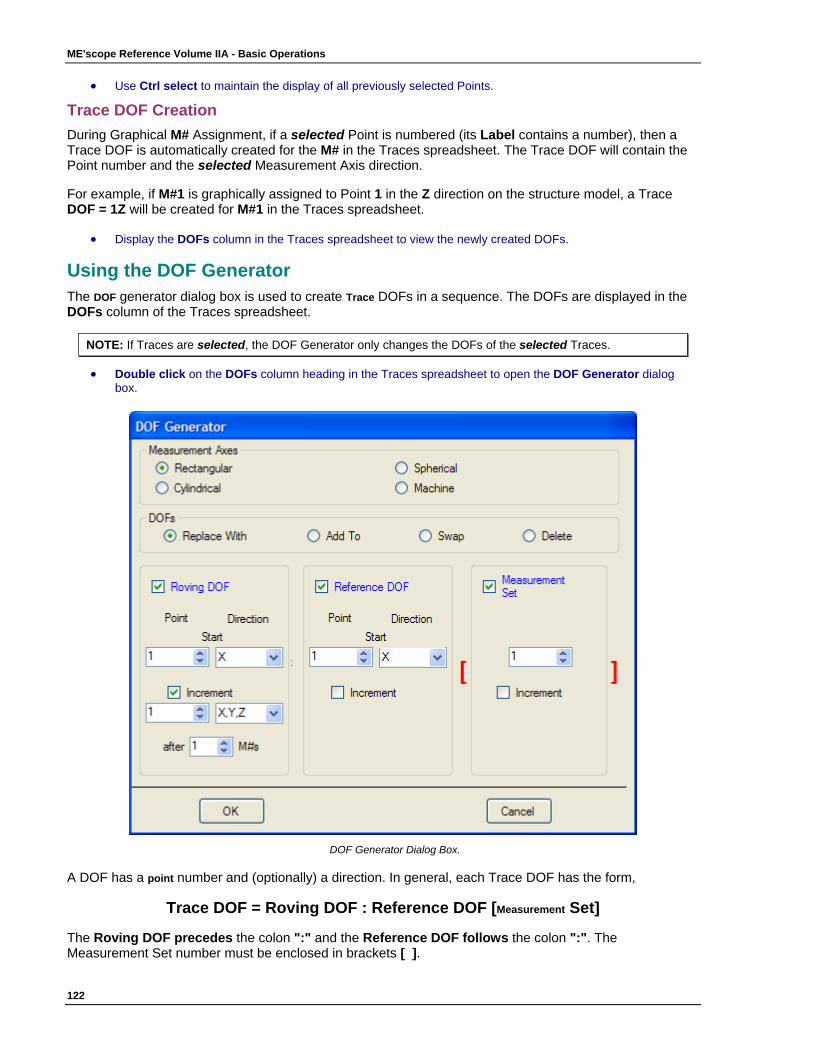
ME'scope Reference Volume IIA - Basic Operations
122
• Use Ctrl select to maintain the display of all previously selected Points.
Trace DOF Creation During Graphical M# Assignment, if a selected Point is numbered (its Label contains a number), then a Trace DOF is automatically created for the M# in the Traces spreadsheet. The Trace DOF will contain the Point number and the selected Measurement Axis direction.
For example, if M#1 is graphically assigned to Point 1 in the Z direction on the structure model, a Trace DOF = 1Z will be created for M#1 in the Traces spreadsheet.
• Display the DOFs column in the Traces spreadsheet to view the newly created DOFs.
Using the DOF Generator The DOF generator dialog box is used to create Trace DOFs in a sequence. The DOFs are displayed in the DOFs column of the Traces spreadsheet.
NOTE: If Traces are selected, the DOF Generator only changes the DOFs of the selected Traces.
• Double click on the DOFs column heading in the Traces spreadsheet to open the DOF Generator dialog box.
DOF Generator Dialog Box.
A DOF has a point number and (optionally) a direction. In general, each Trace DOF has the form,
Trace DOF = Roving DOF : Reference DOF [Measurement Set]
The Roving DOF precedes the colon ":" and the Reference DOF follows the colon ":". The Measurement Set number must be enclosed in brackets [ ].
Data Block Window Commands
123
Single channel measurements (e.g. Auto Spectrum, PSD) normally have a Roving DOF. Cross-channel measurements (e.g. FRF or Cross Spectrum) normally have a Roving DOF & Reference DOF. Measurement Set number is used for measurements that were acquired in multiple measurement sets.
Measurement directions depend on the type of Measurement Axes used. The notations shown in the Table below are used.
Measurement Axes Direction Symbols
Rectangular X, Y, Z
Cylindrical R (radial), T (theta angle), Z (axial)
Spherical R (radial), T (theta angle), P (phi angle)
Machine H (horizontal), V (vertical), A (axial)
Single Channel DOFs Single channel measurements only require a Roving DOF. To generate Roving DOFs,
• Choose Measurement Axes (Rectangular, Cylindrical, Spherical or Machine).
• Choose Replace With.
• Check Roving DOF, and un-check Reference DOF & Measurement Set.
• Enter a Point number & Direction in the Start boxes under Roving DOF.
• Check Increment under the Roving DOF.
• If the Data Type is Vector, Rotational or Strain, enter a Point number & direction in the Increment boxes under Roving DOF. If the Data Type is Scalar, enter a Point number in the Increment box under Roving DOF.
NOTE: If the DOF drop down list doesn't contain the correct sequence of directions, type in the desired sequence.
• Enter the number of M#’s after which the Roving DOF is to be incremented. For example, it you enter 10, the same Roving DOF will be given to the first 10 M#’s. Then, the Roving DOF will be incremented and given to the next 10 M#'s.
• Click on OK to generate new DOFs for all (or the selected) Traces.
Cross Channel DOFs Cross channel measurements (like FRFs) require Roving & Reference DOFs. To generate Trace DOFs with both Roving & Reference DOFs,
• Choose Measurement Axes (Rectangular, Cylindrical, Spherical or Machine).
• Choose Replace With.
• Check Roving DOF & Reference DOF, and un-check Measurement Set.
• Setup the Roving DOF & Reference DOF sections as described above.

ME'scope Reference Volume IIA - Basic Operations
124
• Click on OK to generate new DOFs for the all (or selected) Traces.
Add To This choice in the DOF Generator retains a portion of the existing Trace DOFs, and either replaces a portion or adds to them. For example, choose this option to add Measurement Set numbers to existing Trace DOFs.
Swap DOFs of Roving Hammer Impact Measurements Normally, your Trace DOFs should have varying Roving DOFs and a fixed Reference DOF. If your measurements were acquired with a roving impact hammer, the Roving DOF in your measurements should correspond to the hammer impact Points & directions, and the Reference DOF should be the fixed accelerometer DOF.
If your Trace DOFs have a fixed Roving DOF and variable Reference DOFs, the Roving & Reference DOFs should be swapped. To swap the Roving & Reference DOFs,
• Choose Swap in the DOF Generator, and click on OK.
Delete If this option is chosen in the DOF Generator, all the other parameters will be ignored and the existing DOFs of all (or the selected) Traces will be deleted (cleared).
Tools | Animate Shape This command initiates animation in the connected Structure window using Trace values from the Data Block.
NOTE: Executing this command is the same as executing Draw | Animate in a connected Structure window.
When this command is executed, one of the following will occur,
1. If the Data Block is connected to a Structure window, animation will begin immediately in the connected Structure window.
2. If the Data Block is not connected to a Structure window, a dialog box will open allowing you to choose a Structure file to connect with the Data Block before animation is initiated.
During animation, the displayed shape is defined by the current position of the Line, Peak or Band cursor in the Data Block.
REMINDER: Since the Animation Equations in the connected Structure file only use M#s to retrieve Trace data, the M#s in the Data Block must contain the correct Trace data for each DOF of the structure model. If the Traces are re-ordered, new Animation Equations must be created in order to display shapes correctly.
Sweep or Dwell Data Block animation is achieved in three ways,
1. Sweeping the cursor through the Traces, and using the Trace values at the cursor position for shape components.
2. Sine Dwell at the cursor position. The Trace values at the cursor position are used for shape components. The shape components are multiplied by sine wave values (ranging between -1 & +1) to give the shape a sinusoidal motion.
3. Stationary Dwell at the cursor position. The Trace values at the cursor position are used for shape components.
To cycle through each of the three kinds of animation,
• Repeatedly click on the Animate | Animate With commands list in the connected Structure window.

Data Block Window Commands
125
Which Data is Animated? The shape data that is displayed in animation on the structure model depends on which part of the data is currently displayed in the Data Block window.
• If the Display | Real button is depressed, only the Real part is animated on the model.
• If the Display | Imaginary button is depressed, only the Imaginary part is animated on the model.
• For all other data displays, a complex shape (Magnitude & Phase) is animated.
Selected M#s If M#s are selected, then only Trace values from the selected M#s are used for shape animation. Otherwise, values from all M#s specified in the Animation Equations are used.
Multiple Reference DOFs If you initiate animation from a Data block that contains Traces with multiple reference DOFs, you will be asked if you want the Trace Selection By dialog box opened. This is because shapes can only be animated from one reference of data at a time. Shapes are animated from a multiple reference set of Traces by selecting Traces by the Reference DOF during animation. During animation, to select Traces by their Reference DOFs,
• Execute Edit | Select Traces | By. The floating Trace selection dialog box will open.
• Choose by Reference DOF from the drop down list.
• Choose a Reference DOF, and press the Select button to display shapes for the Reference DOF.
Multi-Reference Trace Selection Box.
Terminating Animation
• Execute Tools | Animate Shape again, or press the Animate | Draw button on the Toolbar in the connected Structure window to terminate animation.
Tools | Save Shape This command saves the data from all (or selected) Traces defined by the current Line, Peak or Band cursor position into a Shape Table. If the Band cursor is turned ON, the sum of the Trace values in the band is saved as the shape component from each Trace. Shapes are saved according to the following rules,
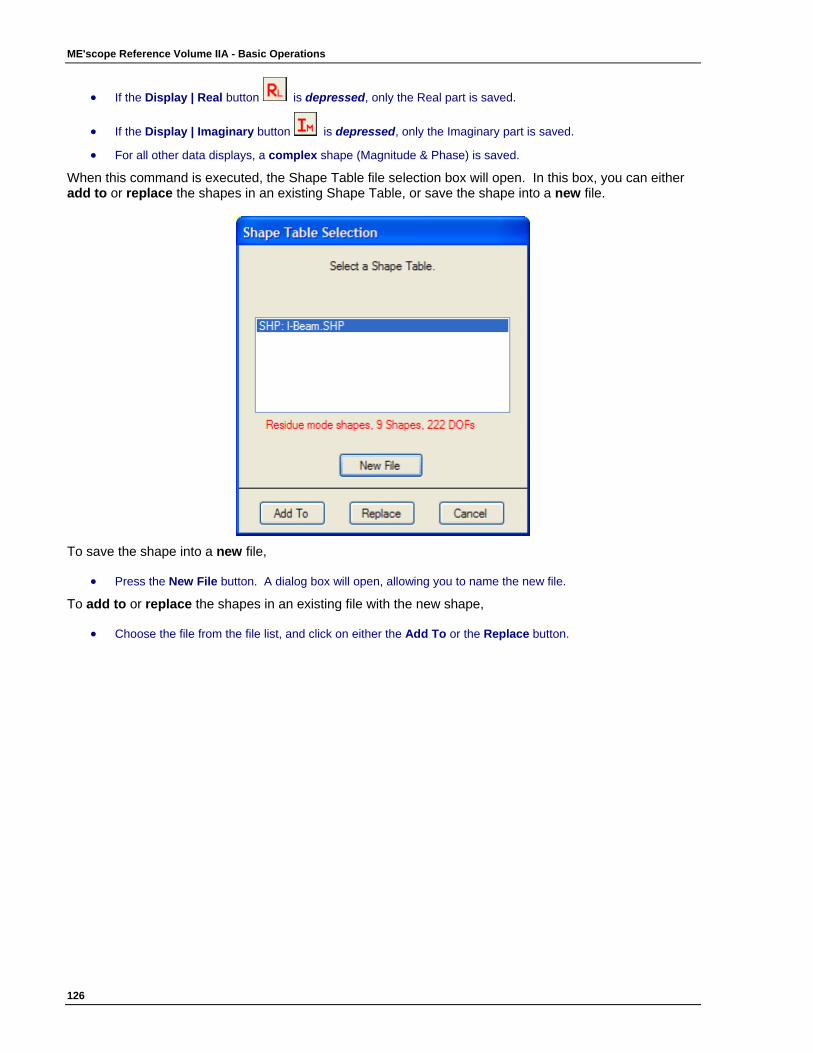
ME'scope Reference Volume IIA - Basic Operations
126
• If the Display | Real button is depressed, only the Real part is saved.
• If the Display | Imaginary button is depressed, only the Imaginary part is saved.
• For all other data displays, a complex shape (Magnitude & Phase) is saved.
When this command is executed, the Shape Table file selection box will open. In this box, you can either add to or replace the shapes in an existing Shape Table, or save the shape into a new file.
To save the shape into a new file,
• Press the New File button. A dialog box will open, allowing you to name the new file.
To add to or replace the shapes in an existing file with the new shape,
• Choose the file from the file list, and click on either the Add To or the Replace button.
127
Shape Table Window Commands
Shape Table Window.
The Shape Table window is used for viewing, editing, and performing operations on shape data.
Shapes and DOFs Spreadsheets The Shape Table window is divided into two upper and lower spreadsheets, separated by a horizontal blue splitter bar. The upper spreadsheet is called the Shapes spreadsheet, and a lower spreadsheet is called the DOFs spreadsheet. Either spreadsheet can be made larger by dragging the horizontal blue splitter bar vertically in the window.
Each row in the DOFs spreadsheet is called a measurement, and has a unique measurement number (M#). A Shape Table can be used as an Animation Source by assigning its M#s to DOFs of a structure model in a connected Structure window. An Operating Deflection Shape (ODS) or mode shape is displayed on the model by displaying the M# data for a selected Shape.
Commands This chapter contains descriptions of the basic commands in the Shape Table window. The command descriptions are ordered by command menu (from left to right), and then by the commands in each menu (from top to bottom).
NOTE: Additional Shape Table window commands are documented in the Signal Processing, MIMO Modeling and Simulation, Modal Analysis, Multi-Reference Modal Analysis, Operating Modal Analysis, and Acoustic Analysis Command Reference chapters.
Each command can be executed by,
1. Choosing it from a command menu, or
2. Clicking on its button or Tool, if it is on a Toolbar.
(See the Command Toolbars section in the Tutorial - Introduction to ME'scopeVES chapter for details on customizing the Toolbars in this window.)
Special Mouse Operations The mouse is used to perform the following special operations in a Shape Table window.
Mouse Wheel If scroll bars are displayed next to a spreadsheet,
• Click on the spreadsheet and scroll it by spinning the mouse wheel.
Showing & Hiding Spreadsheet Columns • Right click on any spreadsheet column heading. The File | Options box will open displaying the Show/Hide
tab.
• Check or un-check the desired spreadsheet columns, and click on OK.
Special Keyboard Operations Certain keys are used for performing special operations in the Shape Table window.
Ctrl Key • Hold down the Ctrl key, click on a spreadsheet, and spin the mouse wheel to change the size of the
spreadsheet,
ME'scope Reference Volume IIA - Basic Operations
128
Ctrl X, Ctrl C, & Ctrl V These commonly used key combinations can be used for cutting, copying or pasting text between spreadsheet cells in the Shape Table window and the Windows Clipboard,
• Select the text in one or more spreadsheet cells.
• Hold down the Ctrl key and press the X key to cut the selected text to the Clipboard.
• Hold down the Ctrl key and press the C key to copy the selected text to the Clipboard.
• Hold down the Ctrl key and press the V key to paste text from the Clipboard into the selected cells.
Shapes and DOFs Spreadsheets The Shape Table window is divided into an upper & lower spreadsheets, separated by a horizontal green splitter bar. The upper spreadsheet is called the Shape Header, and a lower spreadsheet is called the Shapes spreadsheet. Either spreadsheet can be made larger by dragging the horizontal green splitter bar vertically in the window.
Scroll Bars If scroll bars are displayed, a spreadsheet can be scrolled by using the mouse wheel.
• To scroll vertically, click on the spreadsheet, and rotate the mouse wheel.
• To scroll horizontally, click on the horizontal scroll bar, and rotate the mouse wheel.
Hiding & Showing Spreadsheet Columns All of the columns in a spreadsheet (except the Shape column in the Shapes spreadsheet, and the Select column in the DOFs spreadsheet) can be hidden or shown. To show or hide columns in a spreadsheet,
• Right click on any column heading in the spreadsheet. The File | Options box will open displaying the Show/Hide tab.
• Un-check columns to hide them. Check columns to show them.
Reset Spreadsheet Column Widths There are two ways to reset column widths in a spreadsheet so that all information in each column is visible,
1. Press the Reset Column Widths button on the Show/Hide tab in the File | Options box.
2. Hold down the Ctrl key, and right click on any spreadsheet column heading.
Shapes Spreadsheet Each row of the Shapes spreadsheet contains the parameters of one of the shapes in the Shape Table. The Shapes spreadsheet displays the following information;
• Shape button, used for selecting a shape.
• Label for the shape.
• Frequency (or Time) of each shape.
• Damping of a mode shape.
• Units of frequency & damping (or time).
• Damping (%) of a mode shape.
• Date/time of the shape.
• Color of the shape. (Used during animation if Animate Using the Shape Color is checked on the File | Options Animation tab.)
Shape Table Window Commands
129
DOFs Spreadsheet The DOFs spreadsheet contains the following columns,
• Select button, used for selecting shape DOFs.
• Label of each shape DOF.
• Meas. Type of each shape DOF. (Choices are in a drop down list.)
• Data Type of each shape DOF. (Choices are in a drop down list.)
• DOFs of each shape DOF.
• Units of each shape DOF.
• Linear/Power of each shape DOF.
• Pk/Pk-Pk/RMS of each shape DOF.
• Color of each shape DOF.
• Weighting of each shape DOF. (Acoustics Option)
• Source of each shape DOF. (Acoustics Option)
• SubShape of each shape DOF. (Acoustics Option)
In addition to the above columns, the DOFs spreadsheet contains (one or two) columns of data for each shape.
NOTE: All shape data is assumed to be complex valued, therefore having Magnitude & Phase, or Real & Imaginary parts.
Shape Magnitude & Phase, or Real & Imaginary parts can be displayed in the Shape spreadsheet by executing one of the Display | Shapes | Real, Imaginary, Magnitude, Phase, etc. commands.
DOFs Spreadsheet Rows as M#s Each row of the DOFs spreadsheet contains a shape component, also called a shape DOF or measurement number (M#). M#s are used by the Animation Equations in a connected Structure window to display shape data on a structure model.
File | Save This command saves the contents the Shape Table file from the computer memory into the Project file on disk.
File | Save In Project This command allows you to save the Shape Table file into any existing ME'scope Project (.VTprj) file. When this command is executed, the Windows File dialog box will open, allowing you to choose a Project file into which to save the Shape Table.
Importing a Shape Table in Spreadsheet Format To import Shape data in ASCII text spreadsheet format, you must use the Shape Table spreadsheet (.SHS) file format. In general, the spreadsheet format is columns of text separated by delimiters such as commas or tab characters.
Creating an (.SHS) File Template The best way to put shape data into an (.SHS) file format is to start with a file template and add your data to it using a spreadsheet or text program. To create an (.SHS) file template, start with any binary Shape Table (SHP) file in ME'scopeVES,
• Open the binary Shape Table (SHP) file from disk. (Use any file, or one from the Examples or Demos folder.)

ME'scope Reference Volume IIA - Basic Operations
130
• Execute File | Export and save the file in (.SHS) format.
Adding Your Data to the Template • Open the (.SHS) file in a spreadsheet program like MS Excel or a word processor like MS Word.
• Replace the shape data in the spreadsheet columns with your data. Edit the other information where applicable, and save the file to disk.
Importing an (.SHS) File
NOTE: Make sure that the (.SHS) file is no longer open in the spreadsheet or word processor program before opening it in ME'scopeVES.
• Execute File | Import | Shape Table in the ME'scopeVES window and import the (.SHS) File.
File | Export This command exports the data in the Shape Table window to a disk file in an external file format. Shape Table files can be exported in Universal File Format (UFF), and several other formats.
When this command is executed, the Windows File Save As dialog box is opened. All of the available external file formats are listed in the Save as type list.
• Choose an export file format from the Save as type list.
• Choose a disk folder in which to save the file, or create a new one.
• Type the desired file name into the File name box.
• Click on the Save button.
UFF File Export The table below shows the Data Set Type that is created when a Shape Table is exported to a disk file in UFF format.
ME'scopeVES File
Type of Data UFF Data Type
Structure (.STR) Structure Points & Lines
15 & 82
Shape Table (.SHP)
Shapes 55
Data Block (.BLK) Time Waveforms,
FRFs, Transmissibility's,
Auto & Cross Spectra, Fourier
Spectra.
58
If the Shape Table is connected to a Structure file, a dialog box will open asking if you want to export both the Structure & Shape Table files together in the same file.
• If you answer Yes, both files are exported. If No, then only the Shape Table file is exported.
NOTE: Since UFF only supports global (X, Y, Z) coordinates, if both the Structure & Shape Table are exported together, all shape components will be converted from Measurement Axes coordinates to global (X, Y, Z) coordinates before exporting them.
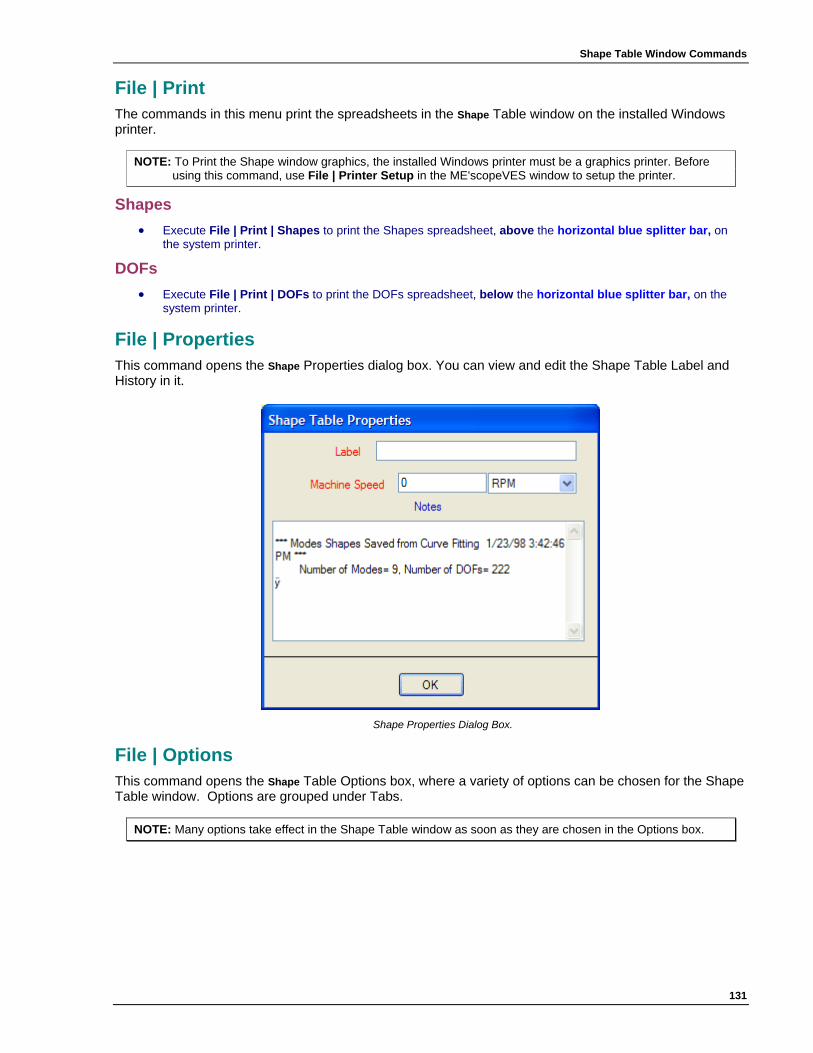
Shape Table Window Commands
131
File | Print The commands in this menu print the spreadsheets in the Shape Table window on the installed Windows printer.
NOTE: To Print the Shape window graphics, the installed Windows printer must be a graphics printer. Before using this command, use File | Printer Setup in the ME'scopeVES window to setup the printer.
Shapes • Execute File | Print | Shapes to print the Shapes spreadsheet, above the horizontal blue splitter bar, on
the system printer.
DOFs • Execute File | Print | DOFs to print the DOFs spreadsheet, below the horizontal blue splitter bar, on the
system printer.
File | Properties This command opens the Shape Properties dialog box. You can view and edit the Shape Table Label and History in it.
Shape Properties Dialog Box.
File | Options This command opens the Shape Table Options box, where a variety of options can be chosen for the Shape Table window. Options are grouped under Tabs.
NOTE: Many options take effect in the Shape Table window as soon as they are chosen in the Options box.

ME'scope Reference Volume IIA - Basic Operations
132
Display Tab This tab allows you to choose the format for displaying shape Phase angles.
• Phase angles can be displayed in the ranges (0 to 360) or (-180 to 180) degrees.
Animation Tab This tab contains options that are used during animation of shapes from the Shape Table. During Sweep animation the number of Cycles of Dwell (animation) per Shape is specified on this tab. Sweep animation "pauses" and executes the number of Cycles of Dwell before displaying the next Shape.
Each Shape color (chosen in the Shape Headers spreadsheet) can also be used to display shapes in the Structure window by checking Animate Using Shape Color on this tab. Shape color is useful for distinguishing one shape from another.
Show/Hide Tab All of the columns in a Shape Table spreadsheet (except the Shape or Select columns) can be hidden or shown. To hide & show columns in the spreadsheet,
• Right click on any column heading in the spreadsheet. The File | Options box will open displaying the Show/Hide tab.
• Un-check columns to hide them. Check columns to show them.
Reset Column Widths There are two ways to change column widths in spreadsheets so that all information in each column is visible,
1. Double click on Reset Column Widths on the Show/Hide tab
2. Hold down the Ctrl key, and right click on a spreadsheet column heading.
Contour Colors Tab This tab allows you to choose colors to be used by the Display | MAC and Display | Source Rank commands.
Shape Table Window Commands
133
File | Close This command closes the Shape Table window. You can also close it by clicking on the close button in the upper right corner of the window. To re-open a Shape Table file,
1. Double click on it in the Upper pane of the Project Panel, or
2. Right click on it in the Upper pane and execute Open from the drop down menu.
3. Right click on it in the Lower pane and execute Add from the drop down menu.
Edit | Undo This command restores the Shape Table window to the state it was in before the last operation. This command can be used repeatedly to undo the last N operations.
NOTE: N = Number of edits saved can be changed on the General tab in the File | Options dialog box of the ME'scopeVES window.
Edit | Redo This command restores the Shape Table window to the state it was in before the last execution of the Edit | Undo command.
Edit | Select Shapes The commands in this menu are used to select and un-select Shapes in the Shape spreadsheet.
• Edit | Select Shapes | All selects all Shapes.
• Edit | Select Shapes | None un-selects all Shapes. All Shapes can also be selected or un-selected by double clicking on the Shape column heading in the Shapes spreadsheet.
• Edit | Select Shapes | Invert changes un-selected Shapes to selected, and selected Shapes to un-selected.
Edit | Sort Shapes The commands in this menu sort all shapes in a Shape Table by ascending or descending order of their frequencies (or times).
Edit | Add a Shape This command adds a new shape to the Shape Table. Data for the new shape can be entered in two ways,
1. Clicking on a spreadsheet cell and typing in the data.
2. Choosing an item from a cell’s drop down list when available.
Edit | Delete Selected Shapes This command deletes selected Shapes from a Shape Table.
Edit | Select DOFs The commands in this menu are used to select and un-select DOFs (or M#s) in the DOFs spreadsheet.
NOTE: Each DOF is a row (or M#) in the DOFs spreadsheet. Shape DOFs are numbered in order, from (M# 1) to (M# N), N = the number of DOFs in the Shape Table. Therefore, each DOF has a unique M# based on its order.

ME'scope Reference Volume IIA - Basic Operations
134
A DOF (or M#) is selected if its Select button is depressed in the Shapes spreadsheet. Some commands only operate on selected DOFs, or on all DOFs if none are selected. During animation from a Shape Table, if DOFs (M#s) are selected, then only data from the selected DOFs is displayed.
Edit | Select DOFs | By... When this command is executed, a dialog box is opened containing a drop down list of options for selecting DOFs.
Select DOFs By Dialog box.
• Choose a method from the Select DOFs By drop down list.
• Make individual selections from the selection list, or use the Shift & Ctrl keys to make multiple selections.
• Click on Select to select the DOFs.
Select By DOF This method selects M#s by their Shape DOFs. Shape DOFs are displayed in the DOFs column in the DOFs spreadsheet, and have the form,
Shape DOF = Roving DOF : Reference DOF [Measurement Set]
The Roving DOF precedes the colon ":" and the Reference DOF follows the colon ":". The Measurement Set number must be enclosed in brackets [ ].
Shapes obtained from single-channel measurements normally have only a Roving DOF. Shapes obtained from cross-channel measurements normally have Roving & Reference DOFs. Measurement Set numbers are used when data is acquired in multiple measurement sets.
Select By Roving DOF This method selects M#s by the Roving DOF portion of the Shape DOF,
Shape DOF = Roving DOF : Reference DOF
Select By Reference DOF This method selects M#s by the Reference DOF portion of the Shape DOF,
Shape DOF = Roving DOF : Reference DOF
Select By Point This method selects M#s by the Point number in the Roving DOF portion of the Shape DOF,
Shape Table Window Commands
135
Shape DOF = Point Number & Direction : Reference DOF
Select By Direction This method selects M#s by the direction in the Roving DOF portion of the Shape DOF,
Shape DOF = Point Number & Direction : Reference DOF
Select By Measurement Set This method selects M#s by the Measurement Set portion of the Shape DOF,
Shape DOF = Roving DOF: Reference DOF [Measurement Set]
Select By Roving DOF Only This method selects M#s that only have a Roving DOF,
Shape DOF = Roving DOF
Select By Reference DOF Only This method selects M#s that only have a Reference DOF,
Shape DOF = : Reference DOF
Select By Data Type This method selects M#s by Data Type. Data Types are listed in the Data Type column in the Shapes spreadsheet.
Select By Measurement Type This method selects M#s by Measurement Type. Measurement Types are listed in the Meas.Type column in the Shapes spreadsheet.
Edit | Select DOFs | All, None, Invert • Edit | Select DOFs | All selects all shape DOFs (or M#s).
• Edit | Select DOFs | None un-selects all DOFs (or M#s). All DOFs can also be selected or un-selected by double clicking on the Select column heading in the Shapes spreadsheet.
• Edit | Select DOFs | Invert changes all un-selected to selected DOFs, and all selected to un-selected DOFs (or M#s).
Edit | Sort DOFs This command sorts DOFs (or M#s) in the DOFs spreadsheet. It operates on all (or selected) DOFs (or M#s).
NOTE: Each DOF is a row (or M#) in the DOFs spreadsheet. Shape DOFs are numbered in order, from (M# 1) to (M# N), N = the number of DOFs in the Shape Table. Therefore, each DOF has a unique M# based on its order.
DOF ordering is important because the Animation Equations in a connected Structure window use Animation Equations containing measurement numbers (M#s) to animate shapes from a Shape Table. When this command is executed, a dialog box opens containing a drop down list of methods for sorting shape DOFs.

ME'scope Reference Volume IIA - Basic Operations
136
Sort DOFs By Dialog box.
• Choose a sorting method from the Sort DOFs By drop down list.
• Use individual selections from the Select From list, or Select All to obtain an initial Sort Using list.
• Use Ascending, Descending, or selections in the Sort Using list and the Remove button to obtain the desired list.
• Click on Sort to sort the shape DOFs according to the Sort Using list.
All DOFs that don't satisfy the criterion in the Sort Using list will follow the sorted DOFs in the newly sorted order.
WARNING: DOF ordering is important because the Animation Equations on a structure model in a connected Structure window use measurement numbers (M#s) to animate shapes from a Shape Table. Following the use of this command and before initiating animation, execute Tools | Assign M#s to create new Animation Equations in the connected Structure window.
Sort By DOF This method sorts DOFs by their Shape DOFs. Shape DOFs are displayed in the DOFs column in the DOFs spreadsheet, and have the form,
Shape DOF = Roving DOF : Reference DOF [Measurement Set]
The Roving DOF precedes the colon ":" and the Reference DOF follows the colon ":". The Measurement Set number must be enclosed in brackets [ ].
Shapes obtained from single-channel measurements normally have only a Roving DOF. Shapes obtained from cross-channel measurements normally have Roving & Reference DOFs. Measurement Set numbers are used when data is acquired in multiple measurement sets.
Sort By Roving DOF This method sorts M#s by the Roving DOF portion of the Shape DOF,
Shape DOF = Roving DOF : Reference DOF
Sort By Reference DOF This method sorts M#s by the Reference DOF portion of the Shape DOF,
Shape DOF = Roving DOF : Reference DOF
Shape Table Window Commands
137
Sort By Point This method sorts M#s by the Point number in the Roving DOF portion of the Shape DOF,
Shape DOF = Point Number & Direction : Reference DOF
Sort By Direction This method sorts M#s by the direction in the Roving DOF portion of the Shape DOF,
Shape DOF = Point Number & Direction : Reference DOF
Sort By Measurement Set This method sorts M#s by the Measurement Set portion of the Shape DOF,
Shape DOF = Roving DOF: Reference DOF [Measurement Set]
Sort By Roving DOF Only This method sorts M#s that only have a Roving DOF,
Shape DOF = Roving DOF
Sort By Reference DOF Only This method sorts M#s that only have a Reference DOF,
Shape DOF = : Reference DOF
Sort By Data Type This method sorts M#s by Data Type. Data Types are listed in the Data Type column in the DOFs spreadsheet.
Sort By Measurement Type This method sorts M#s by Measurement Type. Measurement Types are listed in the Measurement Type column in the spreadsheet.
Edit | Add DOFs This command adds DOFs (rows or M#s) to the end of the Shapes spreadsheet. When it is executed, a dialog box is opened allowing you to enter the number of DOFs to add.
• Enter the number of DOFs to add, and click on OK.
Edit | Delete Selected DOFs This command deletes the selected DOFs (rows or M#s) from the DOFs spreadsheet. When it is executed, a dialog box is opened.
WARNING: DOF ordering is important because the Animation Equations on a structure model use measurement numbers (M#s) to animate shapes from a Shape Table. Following the use of this command and before initiating animation, execute Tools | Assign M#s to create new Animation Equations in the connected Structure window before initiating animation.
Display | Center This command centers the Shape Table window in the Work Area of the ME'scopeVES window.
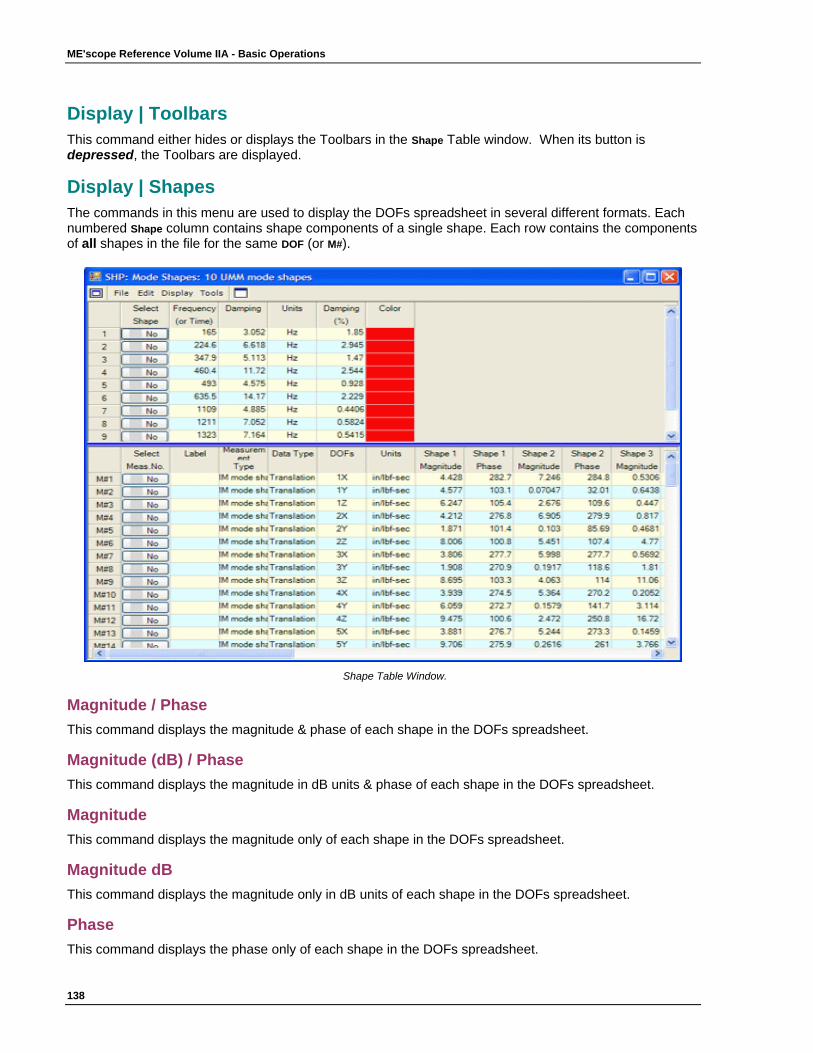
ME'scope Reference Volume IIA - Basic Operations
138
Display | Toolbars This command either hides or displays the Toolbars in the Shape Table window. When its button is depressed, the Toolbars are displayed.
Display | Shapes The commands in this menu are used to display the DOFs spreadsheet in several different formats. Each numbered Shape column contains shape components of a single shape. Each row contains the components of all shapes in the file for the same DOF (or M#).
Shape Table Window.
Magnitude / Phase This command displays the magnitude & phase of each shape in the DOFs spreadsheet.
Magnitude (dB) / Phase This command displays the magnitude in dB units & phase of each shape in the DOFs spreadsheet.
Magnitude This command displays the magnitude only of each shape in the DOFs spreadsheet.
Magnitude dB This command displays the magnitude only in dB units of each shape in the DOFs spreadsheet.
Phase This command displays the phase only of each shape in the DOFs spreadsheet.

Shape Table Window Commands
139
Real / Imaginary This command displays the real & imaginary parts of each shape in the DOFs spreadsheet.
Real This command displays the real part of each shape in the DOFs spreadsheet.
Imaginary This command displays the imaginary part of each shape in the DOFs spreadsheet.
Tools | Assign M#s This command creates Animation Equations on the structure model in a connected Structure window by assigning all (or selected) DOFs (M#s) of the DOFs spreadsheet to Points & directions on the structure model.
NOTE: Executing this command is the same as executing Tools | Assign M#s in a Data Block window or Draw | Assign M#s in a Structure window. (See Tools | Assign M#s in the Data Block Window Commands chapter for details on the use of this command.)
Tools | Animate Shape This command initiates animation in the connected Structure window using shape components of the currently selected shape.
NOTE: Executing this command is the same as executing Draw | Animate in a connected Structure window.
When this command is executed, one of the following will occur,
1. If the Shape Table is connected to a Structure window, animation will begin immediately in the connected Structure window.
2. If the Shape Table is not connected to a Structure window, a dialog box will open allowing you to choose a Structure file to connect with the Shape Table before animation s initiated.
Data for only one selected Shape in the Shapes spreadsheet is displayed during animation.
REMINDER: Since the Animation Equations in the connected Structure file only use M#s to retrieve shape data, the M#s in the Shape Table must contain the correct shape data for each Point & direction on the structure model. If the shape DOFs are re-ordered, new Animation Equations must be created in order to display shapes correctly.
Sweep or Dwell Shape Table animation is achieved in three ways,
1. Sweep. Each shape is displayed using N cycles of Sine Dwell animation, and then the next shape is displayed. (N is specified on the Animation tab in the File | Options dialog box.)
2. Sine Dwell. Each frame of sinusoidal animation is created by multiplying the shape by a different sine wave value (ranging between -1 & +1).
3. Stationary Dwell. Each shape is displayed without any animation.
To cycle through each of the three kinds of animation,
• Repeatedly click on the Animate | Animate With commands list in the connected Structure window.
Dwell To display a different shape during Dwell animation,
ME'scope Reference Volume IIA - Basic Operations
140
1. Depress its Shape button in the Shapes spreadsheet.
2. Or use the Up & Down arrow keys on the keyboard.
Which Data is Animated? The shape data that is animated on the 3D model depends on which part of the data is displayed in the Shape Table window,
• If the Display | Real button is depressed, only the Real part of the shapes is animated.
• If the Display | Imaginary button is depressed, only the Imaginary part of the shapes is animated.
• For all other data displays, a complex shape (Magnitude & Phase) is animated.
Selected M#'s Shape DOFs (M#s) can be selected in the DOFs spreadsheet using any of the Edit | Select DOFs commands. If M#s are selected, then only shape components from the selected M#s are used to animate shapes. Otherwise, shape values for all M#s specified in the Animation Equations are used.
Multiple Reference DOFs Shapes are animated from a Multiple Reference set of shapes by selecting Shape DOFs during animation,
• Execute Edit | Select DOFs | By. The floating Trace selection dialog box will open.
• Choose by Reference DOF from the drop down list.
• Choose a Reference DOF, and press the Select button to display shapes for the chosen Reference DOF.
Terminating Animation
• Execute Tools | Animate Shape again, or press the Animate | Draw button on the Toolbar in the connected Structure window to terminate animation.
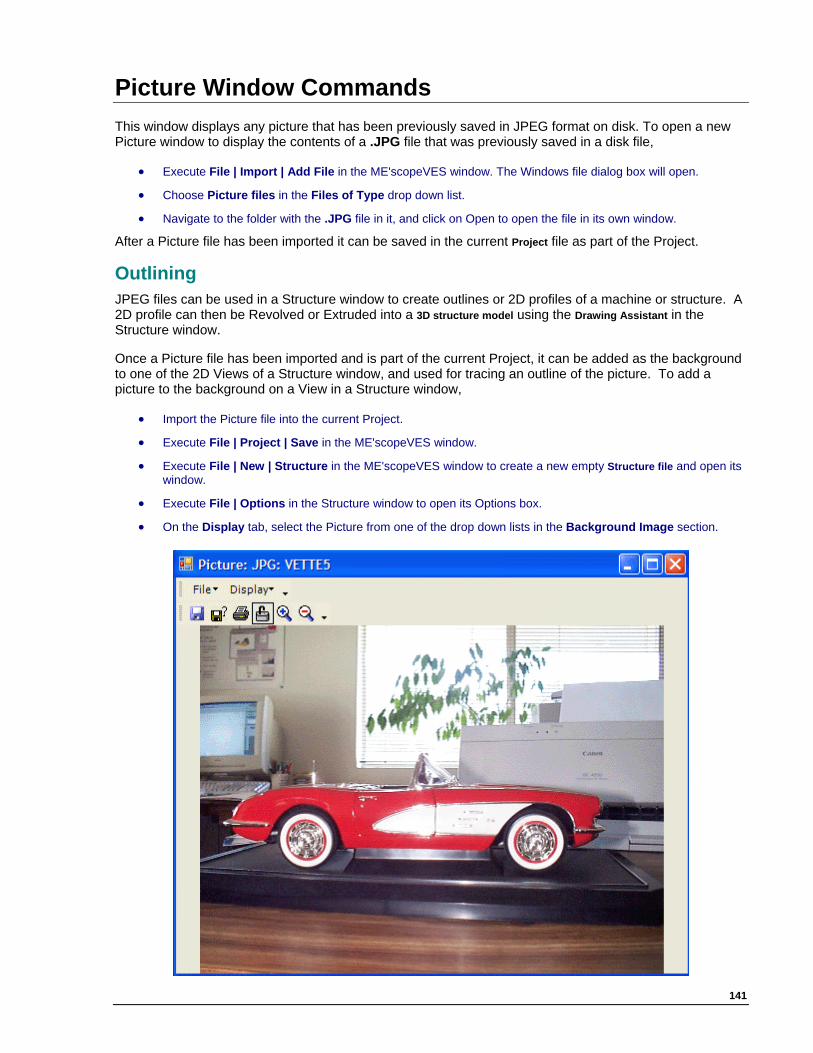
141
Picture Window Commands This window displays any picture that has been previously saved in JPEG format on disk. To open a new Picture window to display the contents of a .JPG file that was previously saved in a disk file,
• Execute File | Import | Add File in the ME'scopeVES window. The Windows file dialog box will open.
• Choose Picture files in the Files of Type drop down list.
• Navigate to the folder with the .JPG file in it, and click on Open to open the file in its own window.
After a Picture file has been imported it can be saved in the current Project file as part of the Project.
Outlining JPEG files can be used in a Structure window to create outlines or 2D profiles of a machine or structure. A 2D profile can then be Revolved or Extruded into a 3D structure model using the Drawing Assistant in the Structure window.
Once a Picture file has been imported and is part of the current Project, it can be added as the background to one of the 2D Views of a Structure window, and used for tracing an outline of the picture. To add a picture to the background on a View in a Structure window,
• Import the Picture file into the current Project.
• Execute File | Project | Save in the ME'scopeVES window.
• Execute File | New | Structure in the ME'scopeVES window to create a new empty Structure file and open its window.
• Execute File | Options in the Structure window to open its Options box.
• On the Display tab, select the Picture from one of the drop down lists in the Background Image section.
ME'scope Reference Volume IIA - Basic Operations
142
Picture Window.
Commands This chapter contains descriptions of all of the commands in the Picture window. The command descriptions are ordered by command menu (from left to right), and then by the commands in each menu (from top to bottom). Each command can be executed by,
1. Choosing it from a command menu, or
2. Clicking on its command button if it is on a Toolbar.
(See the Command Toolbars section in the Tutorial - Introduction to ME'scopeVES chapter for details on customizing the Toolbars in this window.)
File | Save This command saves the contents the Picture file from the computer memory to the Project file on disk.
File | Save In Project This command allows you to save the Picture file into any existing ME'scope Project (.VTprj) file. When this command is executed, the Windows File dialog box will open, allowing you to choose a Project file into which to save the Picture file.
File | Copy Graphics to Clipboard This command copies the graphics of the Picture window to the Windows Clipboard as a Bitmap. A Bitmap can then be pasted from the Clipboard into the ME'scopeVES Report writer, or any graphics or text processor that accepts Bitmaps.
File | Print This command prints the currently displayed picture on the installed Windows printer.
NOTE: To Print the Picture window graphics, the installed Windows printer must be a graphics printer. Before using this command, use File | Printer Setup in the ME'scopeVES window to setup the printer.
File | Close This command closes the Picture window. You can also close it by clicking on the close button in the upper right-hand corner of the window. To re-open a Picture file,
1. Double click on it in the Upper pane of the Project Panel, or
2. Right click on it in the Upper pane and execute Open from the drop down menu.
3. Right click on it in the Lower pane and execute Add from the drop down menu.
Display | Lock Aspect Ratio This command Locks and Unlocks the picture aspect ratio. When the aspect ratio is Locked (button depressed), the ratio of the horizontal to vertical dimensions of the picture remains fixed.
Display | Zoom The command is used to Zoom the display of the picture in and out. It uses the mouse wheel for Zooming the display.
• Depress the Zoom button on the Toolbar to initiate a Zoom.
• Move the mouse pointer into the window and spin the mouse wheel to Zoom the display.
Picture Window Commands
143
Display | mooZ NOTE: mooZ is the reverse of Zoom.
This command is used to undo the Zoomed display of the picture and return it to its original size.
• Press the mooZ button to return the display of the picture to its original size.

145
Glossary
3 3D Structure Model: 3D structure models are used for displaying operating deflection shapes and mode shapes
in animation, and for creating Experimental FEA models. A model normally consists of two or more points connected by lines. If surfaces are added to the model, it is called a surface, or solid model. If digital photos are attached to the surfaces, the model is called a photo realistic model.
A Acoustic Source: A group of Points on an Acoustic Surface containing measurements from an identified noise
source. Sources are used for Source Ranking of acoustic data. Source names are entered in the Source column in the Traces or Shapes spreadsheet.
Acoustic Surface: A special type of SubStructure represented by a grid of measurement Points with Lines & Surfaces. Each measurement Point has a surrounding area and surface normal vector. Acoustic Surfaces are created with the Drawing Assistant.
Active Graph: Either the Upper or Lower Traces in the graphics area on the left side of the Acquisition window. The Upper or Lower Traces are made active by clicking on them, or by executing Display | Active Graph in the Acquisition window.
Active Traces: The Acquisition window displays upper & lower Traces in its graphics area. The upper Traces are time domain data acquired from the Front End, and the lower Traces are time or frequency domain measurements calculated from the upper Traces. The Display | Active Graph command toggles the Active Traces between the upper & lower Traces.
Active View: The last one of the four Views clicked on in the Structure window, or the last one displayed. Drawing operations like Move, Rotate and Resize are performed on the active View.
Animation Equations: All animation is created by evaluating the Animation Equations at each Point on a structure model. Animation Equations define which measurements (M#s) are used to animate a Point. Each Point can have one Scalar (with no directions), three Translational, and three Rotational Animation Equations. At least one Animation Equation must be defined at a Point for animation to occur. Measured Animation Equations are created using Tools | Assign M#s in the Data Block, Acquisition or Shape Table windows, or Draw | Assign M#s in the Structure window. Interpolated Animation Equations are created using Draw | Animation Equations | Interpolate. Animation Equations are displayed on tabs above the Points spreadsheet in the Structure window by executing Edit | Animation Equations | Equation Editor.
Animation Frame: Animation is created by displaying still pictures (frames) in rapid succession in a Structure window. Digital Movies are made by saving frames of animation into an (.AVI) file. When the Step button is depressed, you can step through the frames of animation by using the Next & Previous Frame commands.
Animation Source: Any Data Block, Acquisition or Shape Table file that is currently open in the Work Area. Normally, only one Animation Source is used for animation at a time. However, during a comparison display, two Animation Sources are used. The current Animation Source is displayed in the Animation Source list on the Toolbar in the Structure window. During animation, data from the current Animation Source is animated according to the Animation Equations for each Point on the structure model.
Auto Spectrum: An Auto Spectrum is calculated by multiplying a Fourier Spectrum by its complex conjugate. Consequently, the Auto Spectrum has magnitude only. Its phase is zero. An Auto Spectrum can have either Linear (RMS) units or Power (MS) units.
B Band cursor: One of the three Data Block window cursors. It is represented by two vertical lines on each Trace.
Placing the mouse pointer outside the band and dragging will move the nearest edge of the band. Placing the mouse pointer inside the band and dragging will move the band.
Bitmap: A copy of the pixels used to draw the graphics in a window. Bitmaps are used in all Copy to Clipboard and Print commands that operate on graphics.
ME'scope Reference Volume IIA - Basic Operations
146
Block Size: The number of samples (time or frequency values) in all of the Traces of a Data Block or Acquisition window. The current Block Size is displayed in the File | Properties dialog box, and can be changed. Increasing the Block Size appends zeros to each Trace. Decreasing the Block Size removes samples from the right hand side (high frequencies or time values) of each Trace.
C Center Point: Any Point that is referenced by another Point in the Center Point column of the Points spreadsheet.
A Point that references a Center Point is called a Radial Point. If a measurement with rotational motion (in degrees) is assigned to a Center Point using a Shaft Rotation Animation Equation, then the rigid body rotational motions of all Radial Points about the Center Point are displayed during animation.
Closely Coupled Modes: Two or more modes that appear as a single peak in any spectral measurement function. This occurs when the modal frequencies are close together with sufficient damping so that their resonance peaks sum together to form a single peak.
CMIF: An acronym for Complex Mode Indicator Function. The CMIF is one of the mode indicator functions available during the first step of curve fitting. Multiple CMIFs are calculated from a Multiple Reference set of FRFs, and are used to locate closely coupled modes and repeated roots. Modal participation factors are also calculated with the CMIFs, which are used for multiple reference curve fitting in succeeding curve fitting steps.
CoMAC: An Acronym for Coordinate Modal Assurance Criterion. CoMAC has values from 0 to 1, and indicates whether or not two different shape DOFs are the same. If CoMAC > 0.95, the shape components are the same. If CoMAC > 0.8, the shape components are similar. If CoMAC < 0.8 the shape components are different.
Complex Shape: A shape with components that have phase angles other than 0 or 180 degrees. When animated, the Node Lines of a complex shape will move. Complex shapes can be converted to normal shapes from the Complexity Plot in either the Shape Table or Data Block window.
Contour: A contour is a locus of equal values of the currently displayed shape data on a structure model. Contours are displayed only on the surfaces of the structure model. Traces in a Data Block window can also be displayed together using a contour plot.
Cross Spectrum: The Cross Spectrum is a cross-channel measurement. It is calculated by multiplying the Fourier Spectrum of one signal by the complex conjugate of the Fourier Spectrum of another signal. A Cross Spectrum has magnitude & phase. For Operating Modal Analysis, Cross spectra are calculated between two or more Roving response signals and a (fixed) Reference response. Operating mode shapes can be obtained after DeConvolution windowing and FRF-based curve fitting of a set of Cross spectra.
Cross-channel Measurement: A measurement that was calculated using digital data that was simultaneously acquired from two or more acquisition channels. Examples are Transfer Functions, ODS FRFs, and Cross spectra. During simultaneous data acquisiton, analog data from multiple transducers is simultaneously amplified, anti-alias filtered, and digitized. Cross-channel measurements are then calculated using digital signal processing techniques on multiple channels of data.
Current Animation Source: The Data Block, Acquisition, or Shape Table file that is currently shown in the Animation Source drop down list on the Structure window Toolbar.
Cursor: There are three different types of cursors in the Data Block and Acquisition windows; the Line, Band, and Peak cursor.
D Data Block file: One or more measurement Traces with a common time or frequency axis. Time domain
measurements are real valued. Frequency domain measurements are complex valued (real & imaginary or magnitude & phase). Each Trace contains values measured on the structure or acoustic surface, at a Point and in a direction (Scalar measurements have no direction.) Each Trace is numbered, starting from M#1. Measurement numbers (M#s) are used in the Animation Equations at each Point to display shape components in each direction.
DFT: An acronym for Digital (or sampled) Fourier Transform. The forward FFT transforms a sampled time domain waveform into its equivalent DFT. The inverse FFT transforms a DFT back into its equivalent sampled time waveform. If the time domain signal has N real valued samples, then the DFT has (N/2) complex valued samples.

Glossary
147
Digital Movie: A Windows AVI file that documents the animation in the Structure window. Digital Movies are made using commands in the Movies menu of the Structure window. Each Digital Movie file is opened into and played back from its own window.
DOF: An acronym for Degree-Of-Freedom. A DOF includes a Point number & direction. Each measurement (M#) in a Data Block, Shape Table or Acquisition window has a DOF. It is defined in the DOFs column of the Traces spreadsheet in a Data Block or Acquisition window, or in the DOFs spreadsheet in a Shape Table window. Directions are defined by the Measurement Axes directions at Points on a connected Structure model. Only Translational and rotational data have directions associated with them. Scalar data has no direction associated with it.
Drawing Assistant: A set of tabs in the Structure window that are used for drawing and modifying 3D structure models. The Drawing Assistant tabs are displayed above the SubStructure spreadsheet by executing Draw | Drawing Assistant.
Drawing Object: A Point, Line, Surface, or SubStructure in a structure model. Each Point is defined by its global X, Y, Z coordinates. Each Line is defined between two Points, each Surface Triangle between three Points, and each Surface Quad between four Points. Each SubStructure is a collection of Points, Lines and Surfaces.
Driving Point: The Point and direction (DOF) where excitation is applied to a structure. A driving point measurement has the same Roving and Reference DOFs.
Driving Point Residue: A driving point residue is obtained by FRF-based curve fitting of a driving point measurement, where the Roving and Reference DOFs are the same.
E EMA: An acronym for Experimental Modal Analysis. During an EMA, the test article is artificially excited with either
an impactor or a shaker. The excitation force and one or more responses caused by the force are simultaneously measured, and a set of FRF measurements is calculated The FRFs are then curve fit to obtain a set of experimental modal parameters for the structure.
Engineering Data Shape: A general term for any type of data measured from or calculated for two or more Points on a machine, structure, or acoustic surface. Engineering data can be Scalar, Translational, or Rotational.
F FEA Assistant: A set of tabs in the Structure window that are used for drawing a 3D structure model and adding
FEA Objects to it. The FEA Assistant tabs are displayed above the SubStructure spreadsheet by executing FEA | FEA Assistant.
FEA Object: FEA Objects are used by the SDM commands to add modification elements to a structure model, by Experimental FEA commands to construct FEA models, and by FEA Model Updating commnads to modifiy element properties. FEA Objects include masses, springs, dampers, rods, bars, plates and solid finite elements. FEA Objects are added to a structure model like any drawing Object, but their material and physical properties must be defined before using them.
FFT: An acronym for Fast Fourier Transform. The FFT is a numerical algorithm that transforms a uniformly sampled time domain signal into it equivalent DFT (Digital Fourier Transform). The Inverse FFT transforms the DFT into its equivalent sampled time domain signal. The FFT in ME'scopeVES is a prime number FFT, which doesn't restrict the number of samples transformed to powers of 2.
Fixed DOF: A Fixed DOF on a structure model will not move during animation. Fixed DOFs are defined in the Animation Equations Tabs above the Points spreadsheet.
Fixed Point: A Fixed Point has no animation in all three Measurement Axes directions. Points are fixed by executing Draw | Animation Equations | Fix Points in the Structure window.
Fourier Spectrum: A Fourier Spectrum is the forward FFT of a uniformly sampled time waveform. Another name for the Fourier Spectrum is the DFT.
FRF: An acronym for Frequency Response Function. An FRF is a cross-channel frequency domain measurement that defines the dynamic properties of a machine or structure between a response DOF and an excitation force DOF. It is defined as the ratio (response Fourier spectrum / force Fourier spectrum). Excitation force is typically measured with a load cell. Response motion is measured with an acceleration, velocity or displacement transducer. The FRF is a special case of a Transfer Function.
ME'scope Reference Volume IIA - Basic Operations
148
G Geometric Center: The average of the minimum & maximum coordinates in each direction (X,Y,Z) of all Points on
a structure drawing or FE Object.
I Interpolated DOF: An Interpolated DOF has its animated shape component calculated using an Interpolated
Animation Equation. Interpolated Animation Equations are normally defined for all DOFs that are not measured. Display of Interpolated shape components is turned ON & OFF using Animate | Interpolation.
L Line: A drawing Object, displayed as a straight line between two Points. All of the Lines on a structure model are
displayed by choosing Lines in the Objects List on the Structure window Tool Bar. Line properties are displayed and editing in the Lines spreadsheet.
Line cursor: One of the three Data Block or Acquisition window cursors. It is represented by a vertical line on each Trace. Placing the mouse pointer anywhere on a Trace and dragging will move the cursor. Clicking anywhere on a Trace will place the cursor at the mouse pointer.
M M#: An abbreviation for Measurement Number. Each Trace in a Data Block or Acquisition window, and each row
in the DOFs spreadsheet of a Shape Table window has a unique M#. M#s are used in the Animation Equations at each Point on a structure model. They define the source of data (Trace or Shape DOF values) for animating each Point & direction on the model.
MAC: An Acronym for Modal Assurance Criterion. MAC indicates whether or not two shapes are the same or different. If MAC > 0.95 the shapes are the same. If MAC > 0.8, the shapes are similar. If MAC < 0.8 the shapes are different.
Measured DOF: A measured DOF has its animation defined by a Measured Animation Equation. A Measured Animation Equation is a weighted summation of M#s that specifies which Trace or Shape DOF data is to be used to animate the Point in a specific direction. Animation Equations can be viewed & edited by using the Animation Equator tabs, These tabs are displayed above the Points spreadsheet by executing Draw | Animation Equations | Equation Editor.
Measurement: A Trace in a Data Block or Acquisition window, or a row in the DOFs spreadsheet in a Shape Table window. Traces and shape DOFs are numbered using M#s. To obtain an animated shape display, each M# must be assigned to one or more DOFs of a structure model, M# Assignment creates Measured Animation Equations which are used to animate each Point on the model.
Measurement Axes: Each Point on a structure model has 3 Measurement Axes. Measurement Axes define the directions in which measurements were made at the Point. Measurement Axes are displayed & edited using the Measurement Axes tab, which is displayed by executing Draw | Animation Equations | Equation Editor.
Measurement Set: All of the data that was simultaneously acquired during data acquisition. Simultaneous acquisition includes simultaneous amplification, anti-alias filtering, and analog to digital conversion. Cross-channel measurement functions are calculated using data from the same measurement set.
Meshing: Selected Lines, Surfaces, and SubStructures are meshed (or subdivided) using the Draw | Mesh command. Lines and Surfaces are subdividing into additional Lines and Surfaces. If a SubStructure is meshed, all of its Lines and Surfaces are subdivided.
MIMO model: A Multiple Input Multiple Output frequency domain matrix model made up of a matrix of FRFs or Transfer Functions. The FRF matrix can be multiplied by Fourier transforms of Forces (or Inputs) to yield Fourier transforms of Responses (or Outputs).
MMIF: An acronym for Multivariate Mode Indicator Function. The MMIF is one of the mode indicator choices available during the first step of curve fitting. Multiple MMIFs are calculated from a Multiple Reference set of FRFs, and indicate closely coupled modes & repeated roots. Modal participation factors are also calculated which are used for multiple reference curve fitting in succeeding curve fitting steps.
Modal Model: A set of scaled mode shapes that can be used as a complete representation of the dynamics of a structure. Unit modal mass (UMM) scaling is one method of scaling that preserves the mass and stiffness properties of the structure.
Glossary
149
Modal Peaks Function: One of the mode indicator choices available during the first step of curve fitting. It is used with the Count Peaks button for determining how many modes are in a set of measurements.
Mode Shape: Modes are used to characterize resonant vibration in structures. Each mode has natural frequency, damping value, and a mode shape. The mode shape is a standing wave deformation of the vibrating structure at its resonant (or modal) frequency.
mooZ: The reverse of a Zoom operation in a Structure, Data Block, or Acquisition window. It restores the full display of the structure model in a Structure window, or all of the Trace data in a Data Block or Acquisition window.
Multiple Reference Test: Using two or more fixed exciters or fixed response transducers during a structural test. In a modal test, this is equivalent to measuring two or more rows or columns of the MIMO matrix model.
N Node Line: A line where all shape components are zero. Node Lines are displayed as heavy black lines in an
animated display of Contour Lines. The Node Lines of a complex shape will move during animation, while Node Lines of a normal shape will not.
Normal Shape: A shape with components that all have phase of 0 and 180 degrees. When a normal shape is animated, it looks like a standing wave and its Node Lines will not move. On the other hand, a complex shape will look like a traveling wave, and its node lines will move. Complex shapes can be "normalized" (their phases rotated to 0 or 180 degrees) from the Complexity Plot in either a Shape Table or Data Block window.
O ODS: An acronym for Operating Deflection Shape. An ODS is the deformation of a machine or structure at two or
more Points due to its own operation and/or other externally applied forces. An ODS obtained from a set of time domain responses characterizes the deformation at a specific moment in time. An ODS obtained from a set of cross-channel frequency domain functions (FRFs, ODS FRFs or Cross Spectra) characterizes the deformation of a machine or structure at a specific frequency. .
ODS FRF: A cross-channel frequency domain measurement that is made from operating data. It requires the simultaneous acquisition of two signals, a Roving and a (fixed) Reference response. ODS's can be displayed in animation directly from a set of ODS FRFs. Operating mode shapes can be obtained after DeConvolution windowing and FRF-based curve fitting of a set of ODS FRFs.
OMA: Acronym for Operating Modal Analysis or Operational Modal Analysis. This type of modal analysis is done when the excitation forces are not measured. One or more reference (fixed) responses are used, and Cross Spectra or ODS FRFs are calculated instead of FRFs. With Devolution windowing, FRF-based curve fitting can be applied to these measurements to estimate operating modal parameters.
Operating Modal Parameters: Modal parameters obtained by FRF-based curve fitting a set of measurements calculated from operating data, typically Cross Spectra or ODS FRFs.
Operating Mode Shape: A mode shape obtained from a set of measurements calculated from operating data.
Orthogonal Views: The three 2D Views that are part of the Quad View in the Structure window. These three Views are orthogonal (at right angles) to one another. When the Quad View is displayed, all three orthogonal Views and the 3D View are displayed together.
P Peak cursor: One of the three Data Block window cursors. It is represented by a band (two vertical lines) on each
Trace. It finds the largest value of the displayed data in the band. Placing the mouse pointer outside the band and dragging will move the nearest edge of the band. Placing the mouse pointer inside the band and dragging will move the band.
Periodic Signal: The FFT assumes that the signal to be transforming is periodic in the transform window (the samples used by the FFT). To be periodic, the Trace waveform cannot have a discontinuity at the ends of the window. Traces that are completely contained within the transform window satisfy this criterion. Cyclical signals that complete an integer number of cycles within the transform window also satisfy this criterion.
Photo Realistic Model: A surface or solid model that has digital photographs attached to its surfaces. Photo realistic models are created using third party software, and imported into ME'scope.
ME'scope Reference Volume IIA - Basic Operations
150
Point: A 3D Object defined by three global coordinates (X,Y,Z). Points are used as the end points for all other 3D Objects in the Structure window. The properties of each Point can be viewed and edited in the Points spreadsheet. Each Point has its own Animation Equations that are used to animate the Point with shape data from the current animation source (Data Block, Shape Table or Acquisition window).
Pole: The frequency & damping of a resonance or mode of vibration.
Poles Diagram: A graph of modal frequency & damping (Pole) estimates from different model sizes obtained during the Stability curve fitting step. Pole estimates from different model sizes that are within tolerance limits are said to be stable. Stable Pole estimates are displayed on a Poles diagram. When the Save Poles button is pressed on the Stability tab, each stable group average pole value is added to the Modal Parameters spreadsheet.
Polynomial: One of the FRF curve fitting methods for estimating modal parameters. Either Global or a Local curve fiitting can be chosen for frequency & damping curve fitting. Global curve fitting processes data from multiple FRFs to obtain a single global frequency & damping estimate for each mode. Local curve fitting estimates a local frequency & damping estimate from each FRF.
Project: A Project file contains all of the data files for an ME'scope Project. It can contain one or more Structure, Data Block, Shape Table, Acquisition, Picture, Movie, or Report files. All of the files of the currently open Project are displayed in the top pane of the Project Panel on the left side of the ME'scopeVES window.
PSD: An acronym for Power Spectral Density. A PSD is calculated by dividing an Auto Spectrum by its frequency resolution (the increment between frequency lines).
Q Quad View: Four Views (three 2D and a 3D View) of a structure model displayed together in the Structure
window. The Quad View is displayed by double clicking on a single View.
R Radial Point: Any Point that references a Center Point in the Center Point column of the Points spreadsheet. A
Radial Point is given rigid body rotational motion about its Center Point if the Center Point has Shaft Rotation Animation Equations.
Reference DOF: The fixed DOF in a set of cross-channel measurements. All cross-channel measurements should have a Roving and a Reference DOF, denoted as; Measurement DOF = Roving DOF : Reference DOF.
Repeated Roots: Two or more modes with exactly the same modal frequency but different mode shapes. Repeated Roots will occur in many types of geometrically symmetric structures such as disks, cylinders, square plates and cubes.
Residue: One of the three modal parameters (along with modal frequency & damping) obtained from FRF-based curve fitting. The modal residue is the constant numerator term in the partial fraction form of an FRF, and carries the FRF engineering units multiplied by Hz or radians per second. Each mode has a Residue matrix associated with it. The rows and columns of the Residue matrix correspond to the same rows and columns of the FRF matrix model of the structure. The residues from one row or column of the Residue matrix define a Residue mode shape.
Residue Mode Shape: The Residues from any row or column of the Residue matrix for a mode. A fundamental assumption of EMA and OMA is that; "All rows and columns of the Residue matrix contain the mode shape, multiplied by one of its own components".
Rotational Data: One of the kinds of shape data that can be displayed in animation on a structure model. Shaft Rotational data is normally assigned to a Center Point. During animation, all of the Radial Points that reference a Center Point are animated with rigid body rotation about the Center Point. FEA rotational data is used for SDM and FEA calculations, and can be displayed in animation using color contours.
Roving DOF: The DOF that changes in a set of cross-channel measurements. All cross-channel measurements should have a Roving and a (fixed) Reference DOF, denoted as; Measurement DOF = Roving DOF : Reference DOF.
S
Glossary
151
Sampling Window: The time domain samples used by the FFT to calculate a DFT. Also called the transform window. Depending on the type of data in the sampling window, a special time domain windowing function (Hanning, Exponential, etc.) may also be applied to the samples in the Sampling Window prior to applying the FFT.
Scalar Data: One of the kinds of shape data that can be displayed in animation on a structure model. Scalar data has no direction associated with it. Examples include Sound Pressure Level (SPL), Sound Power, temperature, and pressure. Scalar data is animated on a structure model using a Scalar Animation Equation at each test Point.
Shape: The measured or calculated values at two or more DOFs on a machine, structure or Acoustic Surface. Shape components can be made up of Scalar, Translational, or Rotational data. For animation, all shape components must have correct magnitude & phase values relative to one another. Specific types of Shapes are Operating Deflection Shapes (ODS's), mode shapes, and Engineering Data Shapes (EDS's).
Shape Interpolation: DOFs at each Point of a structure model can be Measured, Fixed or Interpolated. During animation, the shape components of Interpolated DOFs are calculated by evaluting Interpolated Animation Equations. Interpolated Equations are created using neighboring Measured or Fixed DOFs. Interpolated Animation Equations are viewed and edited on the Animation Equations tab displayed above the Points spreadsheet. This tab is displayed by executing Draw | Animation Equations | Equation Editor.
Shape Table file: A file for storing shapes. A shape is a spatial description of data measured or calculated for two or more DOFs on a structure or Acoustic Surface. Shapes can be imported from an external source, saved during animation or during modal parameter estimation (curve fitting).
Sine Dwell: One of the types of shape animation. During dwell animation, the current shape is defined by a Data Block or Acquisition window cursor position, or by the selected shape in a Shape Table. During sine dwell animation, the shape is animated using sine wave values.
Single Reference Test: Using a single fixed exciter or fixed response transducer during a structural test. In a modal test, this is equivalent to measuring one row or column of the FRF matrix.
Single-channel Measurement: A measurement that was calculated using digital data that was acquired from a single acquisition channel. Examples are Fourier and Auto spectra. During data acquisiton, analog data from a transducer is amplified, anti-alias filtered, and digitized. Single-channel measurements are then calculated using digital signal processing techniques on each channel of data.
Stability Diagram: A graph of modal frequency & damping (or Pole) estimates from different curve fitting model sizes. Pole estimates from different model sizes that are within tolerance limits are said to be stable. When the Save Stable Groups button is pressed on the Stability tab. each stable group average pole value is added to the Modal Parameters spreadsheet.
Stationary Dwell: One of the types of shape animation. During dwell animation, the current shape is defined by a current Data Block or Acquisition window cursor position, or by the selected shape in a Shape Table. During stationary dwell, the shape is merely displayed on the structure model or Acoustic surface.
Structure file: A file of drawing Objects used to model a machine, structure or acoustic surface. Points, Lines, and Surfaces are used for drawing structure models and Acoustic Surfaces. FEA Objects can also be added to a structure model, and are used by the SDM, Experimental FEA, and FEA Model Updating commands to add modification elements to a structure or construct FEA models.
SubShape: SubShapes are used to animate two or more different types of shape data together on the same structure model. SubShapes are named in the SubShape column on the Traces and DOFs spreadsheets.
SubStructure: A collection of Points, Lines, Surfaces and FE Objects that have already been defined on a structure model. SubStructures can be selected, moved, cut, copied & pasted like any other Object. SubStructure properties are viewed and editing in the SubStructures spreadsheet. The Drawing Assistant is used to create new SubStructures, paste them from the SubStructure library, or modify SubStructures. The FEA Assistant is used to add FEA Objects to a structure model.
SubStructure Library: A collection of pre-defined SubStructures that can be added to a structure drawing using the Drawing Assistant.
Surface Quad: A 3D Object that defines a surface between four Points on a structure model. Surfaces are used for hidden line, surface fill, texture, and contour displays. Surface Quad properties are viewed & edited in the Surface Quads spreadsheet.
Surface Triangle: A 3D Object that defines a surface between three Points on a structure model. Surfaces are used for hidden line, surface fill, texture, and contour displays. Surface Triangle properties are viewed & edited in the Surface Triangles spreadsheet.
ME'scope Reference Volume IIA - Basic Operations
152
Sweep Animation: One of the types of shape animation. During Sweep animation from a Data Block, the cursor is automatically moved through the Traces from left to right, and the shape is displayed at each cursor position. During Sweep animation from a Shape Table, each shape is displayed in succession.
T Tool Tip: A brief description of each button (or Tool) on a Toolbar. If the Help | Show Tool Tips command button is
depressed, a Tool Tip will be displayed when the mouse pointer is hovered on a button.
Trace: One of the measurements displayed in a Data Block or Acquisition window. Each Trace contains values measured at a DOF(single channel measurement), or between two DOFs (cross-channel measurement) on the structure or Acoustic Surface. Each Trace is numbered by its row number in the Traces spreadsheet, starting from M#1. These M#s are used in the Animation Equations in a connected Structure window, to display shapes in animation using the Data Block as an animation source.
Transfer Function: A cross-channel frequency domain measurement between an Output signal and an Input signal It is defined as the ratio (Output Fourier spectrum / Input Fourier spectrum). An FRF is a special case of a Transfer Function.
Translational Data: One of the kinds of shape data that can be displayed in animation on a structure modal. Examples are vibration and acoustic intensity. Translational data has a Point & direction associated with each measurement. Measurement directions are defined by the Measurement Axes at each Point on the structure model. Translational data is animated using Translational Animation Equations.
Transmissibility: A cross-channel frequency domain measurement typically made from operating data, or when excitation forces cannot be measured. It is defined as the ratio (Output Fourier Spectrum / Input Fourier Spectrum). Mode shapes can be displayed in animation from a set of Transmissibility's, calculated between two or more Roving responses and a (fixed) Reference response. Transmissibility is a special case of a Transfer Function where the Output and Input units are the same. A set of ODS FRFs can be obtained by multiplying a set of Transmissibilities by a reference Auto spectrum,
U UFF: An acronym for Universal File Format. The UFF is a disk file format used for exchanging data between
different structural testing and analysis systems. Structure models (Points & Lines), mode shapes, ODS's, and time or frequency domain measurements can be imported to and exported from ME'scope using UFF. Typical UFF file name extensions are .UFF, .UNV and .ASC.
UMM Mode Shape: A mode shape that has been scaled to a Unit Modal Mass. A set of UMM mode shapes preserves the mass and stiffness properties of a structure. UMM Mode Shapes are used for Structural Modifications, FRF Synthesis, MIMO calculations and FEA modal updating.
Z Zoom: Enlarging the display of the model in a Structure window, or the Traces in a Data Block or Acquisition
window. A Zoom is initiated by executing Display | Zoom. Execute Display | mooZ to return the display to its un-zoomed state.

153
Index

154
A Acoustic Surface..................................7, 33, 57, 58, 60 Active View ................................................................47 Add Object ...........................................................37, 43 Animation Equations....................57, 60, 119, 138, 139 Animation speed........................................................72 Assign M#s ................................................57, 119, 139
C Color ..............................................30, 78, 96, 116, 131 Complexity Plot........................................................112 Contours ..............................................................40, 78 Copy to Clipboard ..........................................27, 30, 94 Cursors ....................................................................108
D Damping ....................................................................95 Data Block Animation ........................................70, 124 DOF Generator ........................................119, 122, 139 Drawing Object ....................................................34, 37
E Exponential Window ..................................................95
F FFT............................................................................. 7 Fixed Point.................................................................57
G Group.........................................................................43
I Import ........................................................................18 Interpolated Point.................................................57, 60 Interpolation...............................................................60
L Lines ..........................................................................38
M Measured Point .........................................................57 Measurement Axes....................................................58
Meshing.....................................................................66 Mouse Operations.....................................................26
P Pan......................................................................49, 50 Paste .........................................................................44 Perspective ...............................................................50 Points ...................................................... 35, 51, 57, 69 Print....................................................... 19, 30, 95, 131 Project Panel...........................................................1, 2
Q Quad View.................................................................47
R Residue .......................................................................7 Resize .......................................................................51 Rotate............................................................ 26, 47, 50
S Selection Box ...................................................... 26, 34 Shape
DOFs spreadsheet ................................ 57, 138, 139 Shape Animation................................. 124, 138, 139 Shapes spreadsheet ........................................... 139
Sort.......................................................... 101, 133, 135 SubStructure ............................... 42, 56, 60, 66, 67, 68 Surface Area .............................................................40
T Traces spreadsheet............................................. 87, 95
U UFF ....................................................... 18, 28, 92, 130
V View Control ..............................................................50
W Work Area ................................................... 2, 4, 12, 32
Z Zoom..................................................... 26, 49, 50, 109