저작자표시 비영리 공연 및 방송할 수...
TRANSCRIPT

저 시-비 리-동 조건 경허락 2.0 한민
는 아래 조건 르는 경 에 한하여 게
l 저 물 복제, 포, 전송, 전시, 공연 송할 수 습니다.
l 차적 저 물 성할 수 습니다.
다 과 같 조건 라야 합니다:
l 하는, 저 물 나 포 경 , 저 물에 적 허락조건 확하게 나타내어야 합니다.
l 저 터 허가를 러한 조건들 적 지 않습니다.
저 에 른 리는 내 에 하여 향 지 않습니다.
것 허락규약(Legal Code) 해하 쉽게 약한 것 니다.
Disclaimer
저 시. 하는 원저 를 시하여야 합니다.
비 리. 하는 저 물 리 적 할 수 없습니다.
동 조건 경허락. 하가 저 물 개 , 형 또는 가공했 경에는, 저 물과 동 한 허락조건하에서만 포할 수 습니다.

공학석사학위논문
Enhanced Electrochemical Properties of Electrolytes with
Nitrile-Functionalized Zwitterions for Lithium-Ion Batteries
니트릴 관능기를 포함하는 양쪽성이온을 이용한
리튬이온전지용 전해질의 전기화학적 특성 향상에 관한 연구
2012년 8월
서울대학교 대학원
재료공학부
이 범 진

i
Abstract
Nitrile-functionalized zwitterion such as 1-(propane nitrile)-2-
methylimidazolium-3-(propyl sulfonate) (NI) is synthesized and investigated as an
electrolyte additive toward the stabilization of the solid electrolyte interface (SEI) layer
on the electrode surfaces and enhacement of ion conductivity, which can be crucial to
improving the initial discharge capacity, C-rate performance and the cyclic
performance under room temperature. The methyl-functionalized zwitterion (DM) is
used as compared with NI in order to explain the effect of the nitrile group. The
synthesized zwitterions were characterized by 1H nuclear magnetic resonance (
1H–
NMR), elemental analysis (EA), and fast atom bombardment mass spectrometry
(FAB–MS). The 1.0 M LiPF6 in EC/DEC (3/7 V/V) is used as a baseline liquid (E_0)
electrolyte. Various amounts of the two types of synthesized zwitterion (0.02, 0.04,
0.08, 0.12, and 0.16 M) are added to E_0 (to produce the corresponding E_NI and
E_DM). The electrolytes containing suitable contents of NI (E_NI), contrary to the
electrolytes containing contents of DM (E_DM), is increased the ion conductivity to

ii
that of E_0. The ion conductivity gradually increases with increasing NI content. The
ion conductivity of electrolytes containing 0.08 M of NI reaches a maximum value of
7.64 mS/cm. From the FT−IR spectroscopy, it is concluded that nitrile group and
sulfonate group interacted with Li+ ion, so that these effects lead to enhancing lithium
salt dissociation. The effects of both zwitterions on electrochemical performance are
investigated via a combination of cyclic voltammetry (CV), linear sweep voltammetry
(LSV), differential capacity measurements and electrochemical impedance
spectroscopy (EIS). The interfacial resistance of the lithium-ion battery containing
E_NI is lower than that of E_0. It is confirmed that a NI can enhance the stability of
SEI layer on the graphite electrode surface. These results are attributed to the
electrochemical adsorption of NI on the electrode surface during aging process, which
prevent electrolytes decomposition on electrode surface. However, although the ion
conductivity of electrolytes containing 0.08 M of NI examine here have higher values
than electrolytes containing 0.04 M of NI, the initial discharge capacity and C-rate
performance display the inverse behavior. Accordingly, the ion conductivity is not

iii
crucial to determining the performance of the single full cell, at least over this ion
conductivity range and in this system. The cell performance is found to depend
significantly on the stability of the SEI layer, and one of the most stable SEI layers is
produced by electrolytes containing 0.04 M of NI during the initial cycle. Therefore,
we conclude that the nitrile-functionalized zwitterion (NI) is expected to be a good
candidate for an additive to high performance lithium-ion batteries.

iv
Keywords
Zwitterion, Nitrile group, Electrolyte additive, Solid electrolyte interface, Lithium ion
battery
Student Number: 2010-23192

v
CONTENTS
ABSTRACT .....................................................................................................ⅰ
CONTENTS .....................................................................................................ⅴ
1. Introduction ...................................................................................................1
2. Experimental Section ..................................................................................13
2.1. Materials …………………………………………………………….……..22
2.2. Preparation of the zwitterion……………………………………………….22
2.2.1. Synthesis of nitrile-functionalized zwitterion (NI)….………………..23
2.2.2. Synthesis of methyl-functionalized zwitterion (DM) ………………..23
2.3. Preparation of electrolytes mixture…..…………………………………….24
2.4. Fabrication of single full cell………………………………………………24
2.5. Characterization …………………………………………………………...25
2.5.1. Identification of the zwitterion formation……………………………25
2.5.2. Ion conductivity test ………………………………….……………...26
2.5.3 Interfacial reaction between electrode and electrolytes….…….…….26
2.5.4. Single full cell performance test……………………………………..27
3. Results and Discussion ................................................................................31

vi
3.1. Synthesis of nitrile functionalized zwitterion (NI)….…………….….….....31
3.2. Synthesis of methyl functionalized zwitterion (DM) ………………….…..37
3.3. Thermal properties……………………………………………………....…43
3.4. Electrochemical analysis of electrolytes ……………………………..……47
3.4.1. Ion conductivity test………………………………………………….47
3.4.2. Analysis of interfacial reaction between electrode and electrolytes...51
3.5. Single full cell performance test ………………………………………….58
3.5.1. Initial charge-discharge test ……………………………………….…58
3.5.2. Internal resistance test ……………………………………………….64
3.5.3. C-rate and cyclic performance test ………………………………….67
4. Conclusions ..................................................................................................72
5. References ....................................................................................................78
KOREAN ABSTRACT ...................................................................................82
ACKNOWLEDGEMENT ..............................................................................87

1
1. Introduction
Since 1912, lithium batteries have been researched by G.N. Lewis and Pioneers.
However, lithium batteries did not commercially available until 1970 when the first non-
rechargeable lithium batteries did. Lithium is the lightest of all metals, has the greatest
electrochemical potential and provides the largest energy density for weight [1, 2].
However, lithium metal batteries are attempts to develop rechargeable lithium batteries
failed due to lithium metal batteries short lifetime and explosion problem result from
roughening and lithium dendrite growth on the lithium surface. This dendrite punctures the
separator and then creates an internal short and in the worst case scenario, to explosion and
fire accident. Because of such reason that the potentially instability of lithium metal,
research turn direction to a non-metallic material using Li+ ions.
Lithium-ions are lower energy density than lithium metal, lithium-ion is safe,
provided certain precaution are acquired when battery charging and discharging
performance. Sony firstly introduced the commercial lithium-ion battery (LIB) in the early
1990’s and the release was a culmination of three decades worth of research intensely
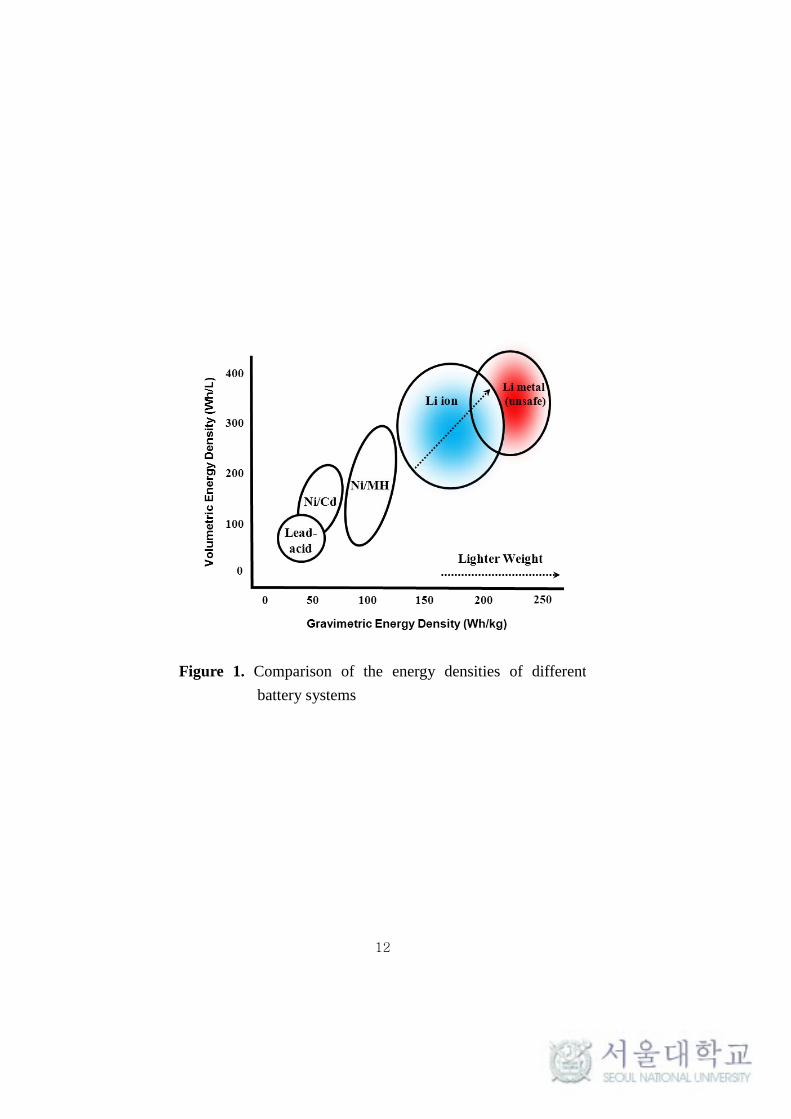
focused on lithium insertion materials. LIBs have become attractive as they provide higher
energy density compared to other rechargeable systems such as lead-acid, nickel-cadmium,
and nickel-metal hydride batteries as shown in Figure 1.
Since then, the sharp improvement in small portable appliances such as lap top

2
notebook and mobile phones have created an new market demand for compact, light-weight,
rechargeable energy storage system offering high energy densities. Moreover, renewable
energy storage system for day-to-night power shift and power source for electric vehicle
(EV), hybrid electric vehicle (HEV), aerospace and military application are being pursued
in national laboratories, universities and industry research facilities.
The LIB is composed of three primary functional components such as anode,
cathode and electrolyte, for which a variety of materials may be used. Lithium intercalation
or insertion materials have been widely investigated in the search for new electrode
materials for use in high-voltage rechargeable batteries. Both the cathode and anode are
lithium intercalation and insertion materials from/into which Li+ ion can be reversibly
extracted/ inserted. While one insertion materials, such as the commercially used layered
LiCoO2, serves as the cathode due to its high electrode potential (~4V versus Li), the other
insertion materials, such as graphite , serves as the anode due its low electrode potential (<
1V versus Li).
The commercially used electrolyte solution composed of a lithium salt in variety
organic carbonates mixture. The electrolyte for LIB should in theory be a perfect electronic
insulator and mechanical separator with good ion conductivity. The electrolyte should have a
large thermodynamic/electrochemical stability window. Since the electrolyte is near perfect
electronic insulator, the electrons coupled to the Li+ ions are transferred through the external
circuit in the form of electrical energy. The lithium salt, such as LiPF6, LiClO4 and LiBF4 for

3
electrolyte should be easy to dissolve, dissociate in organic solvent and dissociated ion
should have the high mobility and anion should have internal oxidation in electrochemical at
high voltage that should be considered when choosing a lithium salt [3]. The organic
carbonated mixture containing ring shaped Ethylene carbonate (EC), chain type Diethyl
carbonate (DEC), Ethylmethyl carbonate (EMC), and Dimethyl carbonate (DMC) are
generally used for solvent of electrolyte. The physical and chemical properties of typical
carbonated organic solvent are on the table 1 [4].
During the battery discharge performance, the Li+ ions oxidation take place in the
cathode surface, and then inserted into crystal structure (interaction) of the anode material
through the electrolyte solution without it being consumed. At the same time the electrons
move toward the electrode and flow out around the external circuit and accepted by the host
to balance the reaction.
In order that should be useful cathode or anode material, they must have a high
degree of lithium insertion, high electronic and lithium conductivity, and good reversible
insertion/extraction capability with good structural and chemical stability to support
repeated recharge [5].
The anode half reaction (with charging be forward) is:
𝐿𝑖𝐶𝑜𝑂2 − 𝑥𝑒− ↔ 𝐿𝑖1−𝑥𝐶𝑜𝑂2 + 𝑥𝐿𝑖+

4
The cathode half reaction (with charging be forward) is
Overall reaction
Generally, suitable electrolyte for LIB can be broad classified into liquid
electrolyte (organic carbonate and ionic liquid) and polymer electrolyte (solid polymer
electrolytes (SPE), gel polymer electrolytes (GPE) and hybrid polymer electrolytes).
Organic carbonate electrolyte such as EC and DEC are generally used for solvent of
electrolyte. The main components of LIB should resist the inevitable heating of batteries
during high electric current flow; however, these are volatile and potentially flammable and
can lead to the thermal runaway of batteries at any abuse condition. Many kind of
electrolyte, such as gel polymer electrolyte, solid electrolyte and ionic liquid, have been
tried to alternative organic carbonate electrolyte.
𝐶 + 𝑥𝐿𝑖+ + 𝑥𝑒− ↔ 𝐶𝐿𝑖𝑥
𝐿𝑖𝐶𝑜𝑂2 + 𝐶 ↔ 𝐿𝑖1−𝑥𝐶𝑜𝑂2 + 𝐿𝑖𝑥𝐶

5
Solid polymer electrolytes (SPE) prepared by complexing/dissolving lithium salt
into polymer matrix such as PEO and PPO. The high molecular weight polyethylene oxide
(PEO)-based composite polymer electrolytes are focused as the best applicants for polymer
matrix [5]. Although SPE have the advantage of no-leakage of electrolyte, flexible
geometry besides higher energy density, those are still limits application for electrolyte due
to insufficient ion conductivity in stable LIB systems. This reason is well known that Li+
ion transport of SPE only occurs in the amorphous polymer region and is often controlled
by the segmental motion of polymer chain.
Gel polymer electrolytes have liquid electrolyte (carbonates electrolytes or ionic
liquid) trapped in polymer matrix and the preparation of physical and chemical cross-linked
gel, thereby preventing leakage of liquid electrolytes. These materials have received
attention because are not only the high conductivity, high energy density and better
possibility, but these are also better possibility of geometrical variation and safety.
Polymers including poly(ethylene oxide) (PEO), polyacrylonitrile (PAN), poly(methyl
methacrylate) (PMMA), poly(vinylidene fluoride) (PVDF), and their copolymers such as
poly(acrylonitrile-methyl methacrylate) (P(AN-MMA)) and poly(vinylidene fluoride-co-
hexafluoropropylene) (P(VDF-HFP)) have been used as polymer matrixes for are suitable
immobilize and transfer liquid electrolytes in matrixes.
Ionic liquids (ILs, so called room temperature ionic liquid) have been proposed to
overcome organic carbonated electrolyte safety problem as alternative liquid electrolytes.
6
Many studies are focused on ILs due to their favorable electrochemical and physical
properties, such as thermal stability, moderate ion conductivity, non-flammability,
negligible volatility and a broad liquid temperature range [6]. However, most of ILs is still
expensive and high viscosity, so that ILs can’t alternate organic carbonate electrolyte
solvent and used for additive to organic carbonate electrolyte to be reduction of cost and
viscosity.
It is important to confirm that the difference between ILs and organic carbonate
solvents. Organic carbonate electrolyte containing lithium salts, there are only two ions
(cation and anion) that are came from the added salts. In contrast, ILs containing lithium
salt, there are two ions from ILs as well as ions generated from the added salts. For
example, if a lithium salt (LiBF4) is added into imidazole-type (N-ethyl-N’-methyl
imidazolium tetrafluoroborate (EMIBF4)) ILs, both EMI+ and Li
+ behave as cation in the
salt/ILs mixture [7]. Therefore, the two cations (EMI+ and Li
+) compete with each other
during the charge-discharge performance. In this case, it is impossible to transport Li+
selectively in salt and ILs mixture in a potential gradient, so that the competition of EMI+
with Li+
ions leads to decreasing the Li+ ions transference number. Another example is
Butyldimethyl-imidazolium hexafluorophosphate (BDMIPF6) added electrolytes which are
composed of PC and LiPF6 1M. During the charge-discharge, BDMI+ and Li
+ two cations
compete against each other under potential gradient [8]. Thus the BDMI+ forms a blocking
layer around the electrodes, resulting in deceasing performance.

7
The workers have been trying to solve the ILs problem of which is the migration
of ILs ions under potential gradient. Dr. Masahiro Yoshizawa et al. proposed a simple and
brilliant idea, namely, covalently immobilized of both cationic unit and anionic one on
same molecular [9]. These salts called “zwitterions” as shown in Figure 3. The zwitterions
are expected to stationary under potential gradient, and these are showing little migration
under potential gradient because they have a zero net charge. Moreover, use of a zwitterion
as a dissociation enhancer in combination with the lithium salts results in single ion
electrolytes, so that these electrolytes showed ions conductivity of 10-5
– 10-7
S/cm at room
temperature. Moreover, it is also founded that the rate capability of asymmetrical lithium
cell is enhanced by adding zwitterion in electrolytes due to formation of the low resistance
solid electrolyte interface layer (SEI layer) [10]. Because these advantages are affected by
the structural characteristics of the zwitterion, many researchers have attempted to
synthesize a variety of molecular zwitterion structures. The Table 2 summarizes structure
and thermal property of previously prepared zwitterions. However, the electrochemical
stability of positive charge site on zwitterion is not sufficient for the reversible charge–
discharge so that zwitterion decomposed on the electrode surface. This problem is results in
reducing stability of the SEI layer and results in low cyclic performance and C-rate
performance. Therefore, the improved electrochemical stability of positive charge site of
zwitterion is necessary.
Since this problem is affected by molecular structure of the zwitterion, the design

8
of molecules for enhanced electrochemical stability is an important part. There are several
kinds of structure parameters that affect the electrochemical properties, such as anion and
cation site, structure and chain length of spacer between anion and cation. Particularly, the
characteristic of anion site is very important because anion site have to interact with Li+ ion.
Dr. Asako Narita [10] elucidated the effect of these three parts on the characteristics of the
zwitterions. She determined that electrolytes containing sulfonate or Bis(sulfonyl)imide
anion type zwitterion are relatively high Li+ ion transport. She concluded the most
appropriate cation structure by comparing with several zwitterions containing different
cation site. These results indicate that cation structures like typical ILs, such as N-
methylpyrrolidinio-sites and TFSI anions, are not always effective for improving ion
conductivity of electrolytes containing zwitterion and lithium salt mixture. In this reason,
N-ethylimidazolio group was recommended by the one of the most appropriate cation site.
And, the last factor of alkyl chain (spacer) length between the cation was determined to be
4 to 7 CH2 units. Therefore, these properties can be utilized to design new molecular.
Recently, many workers have been tried to synthesize of the diverse molecular
zwitterion structure. For instance, the introduction of long alkyl chains in cation site is
possible to make zwitterion with a low Tm, but the introduction of long alkyl chains
accompanied by lower ion density and increases viscosity [11]. Another example is the
various types of multi-functional zwitterions. These are expected that the favorable
interaction between functional group and Li+ ions could enhance electrochemical properties

9
of electrolytes. For example, introducing both functional group (ester, ether group) and
sulfonate group on the imidazole ring, it can obtain more enhanced electrochemical
property than zwitterions having alkyl chains and sulfonate groups [12−14]. Hence, it is
possible that enhancement of electrochemical properties can be obtained by introduction of
different functional group on zwitterion structure.
A nitrile (interchangeably by the cyano in industrial literature) is any organic that
which has a polar carbon and nitrogen triple bond group. A nitrile group which is composed
of carbon and nitrile strongly polarized towards nitrogen due to the difference in the
electronegativity between the carbon =2.55 and the nitrogen = 3.04. Hence, molecular
dipole moments (negative charge) can be high. These characterizations were used for LIB
electrolytes. For example, polyacrylonitrile (PAN) base gel polymer electrolytes exhibit ion
conductivity ranging from 10-4
to 10–3
S/cm at room temperature, which is near to that of
commercial electrolytes, because interaction between the Li+ and the nitrile group of PAN
promote dissociation of lithium salt [15, 16]. The nitrile group is not only the effect of the
structural formula of polymer matrix but also the effect of the molecular structure of the
ionic liquid on electrochemical properties. Introducing nitrile group on ILs was use as the
electrolytes [17, 18]. The nitrile-functionalized ILs show enhanced the cathodic stability
and improved cyclic performance due to formation of the stable solid electrolytes interface
(SEI) layer. Therefore, it was postulated that the presence of nitrile groups on a zwitterion
could yield similar effects.
10
This study introduced nitrile functional groups onto zwitterions based on an
imidazolium ring to synthesize highly electrochemically stable zwitterions. The influence
of the nitrile functional zwitterion on LIB performance was examined. These imidazole
based zwitterion consist of nitrile group at 1-C position, methyl group at 2-C position and
sulfopropyl at 3-C position on the imidazolium ring as shown in Figure 4. The nitrile-
functionalized zwitterion is expected to promote stability of positive charge site, which
electrochemically absorb on electrode surface and suppress the decomposition of the
electrolytes on the electrode surface, as shown in Figure 5. Furthermore, the functionalized
nitrile group is also expected to dissociation of the lithium salts. Because the nitrile group
can straightly interact of Li+ ion, it can be cooperated with sulfonate group in dissociation
of the lithium salts, as shown in Figure 6. The synthesized zwitterion was characterized by
1H nuclear magnetic resonance (
1H–NMR), elemental analysis (EA) and fast atom
bombardment mass spectrometry (FAB–MS), respectively. The thermal properties were
determined by thermo gravimetric analysis (TGA) and differential scanning calorimetry
(DSC). The electrolytes were prepared by mixing the zwitterions and the organic carbonate
electrolytes. The ion conductivity is estimated by electrochemical impedance spectroscopy
(EIS). In addition, the interaction of lithium salt and functional groups has been
investigated by means of Fourier–Transform Infrared (FT–IR) spectra. The interfacial
reaction between electrode and electrolytes were obtained by linear sweep voltammetry
(LSV) and cyclic voltammetry (CV). Finally, a cell performance test was conducted using a

11
single full cell (SFC).
12
Figure 1. Comparison of the energy densities of different
battery systems

13
Solvent name structure melting point (℃) boiling point (℃) Dielectric constant (40℃)
Ethylene Carbonate (EC) 39 248 89.6
Propylene Carbonate (PC) -49 240 64.4
Dimethyl Carbonate (DMC) 4.6 91 3.12
Diethyl Carbonate (DEC) -43 126 2.82
2-methyl-tetra-hydrofuran (2-MeTHF) -137 79 6.29
γ- Butyro lactone (GBL) -43 204 39.1
Table 1. Structure and properties of some solvents used for LIB electrolytes

14
Figure 2. General layouts of a LIB and the charge-
discharge process
CathodeElectrolyte
Anode
Li+
e- e-
Li+ Li+
Li+

15
Figure 3. Zwitterion immobilized cationic and anionic charges on
the same molecule
Negative
chargePositive
charge

16
Table 2. Summarizes structure and thermal property of various zwitterions
Zwitterion structure Melting point (℃)
158
158
206
285
174
175

17
Figure 4. Schematic diagrams of nitrile-functionalized zwitterion

18
Figure 5. Schematic diagram of formation SEI layer on electrode surface
Anode
Carbonate electrolyte

19
Figure 6. Schematic diagram of dissociation of Li+ ion by nitrile-
functionalized zwitterion
Li+
Li+
Li+
PF6-
PF6-
PF6-
Li+
PF6-
Li+
20
anode
Single full cell
cathode
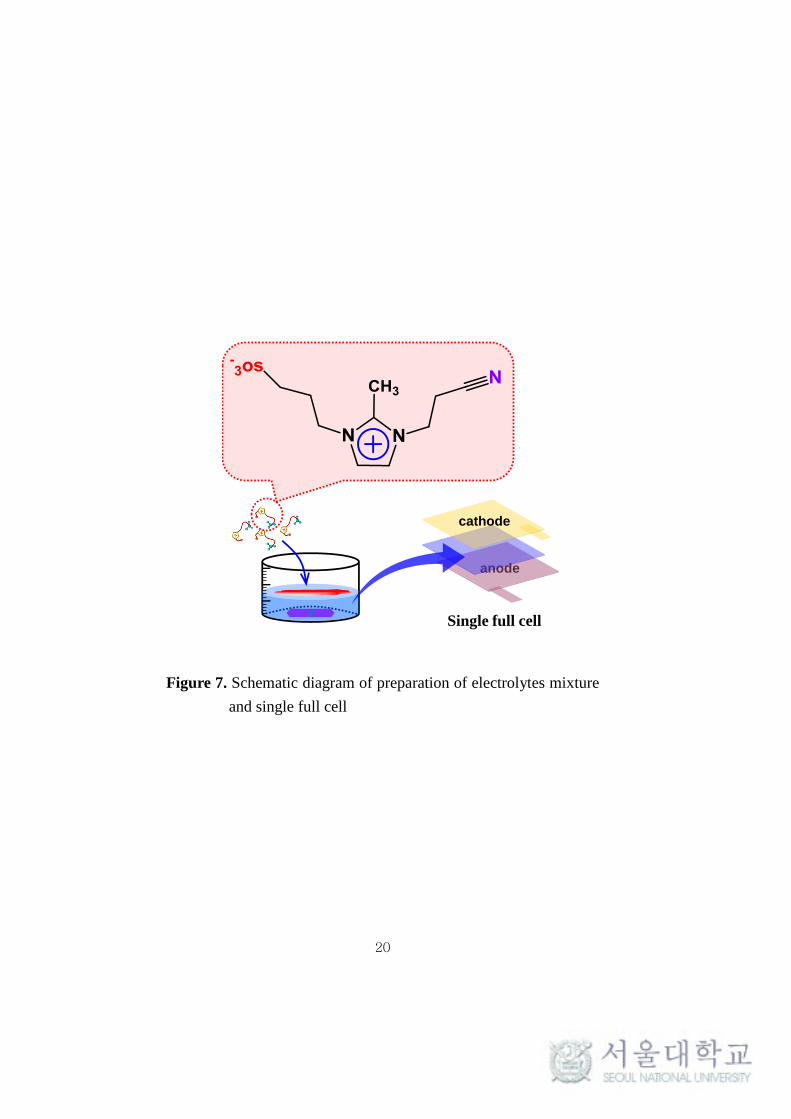
Figure 7. Schematic diagram of preparation of electrolytes mixture
and single full cell

21
2. Experimental Section
2.1. Materials
1-(2-Cyano ethyl)-2-methylimidazole (97%, TCI) and 1, 2- Dimethyl-1H-
imidazole (98%, Aldrich) were used as precursor for synthesizing of two kind of zwitterion.
1, 3-Propanesultone (99%, Aldrich) was used as synthesizing for zwitterion anion site. N,
N-dimethylformamide (DMF) (99.9%, Junsei), Acetone (99.9% Junsei) were used for
solvent which were distilled over appropriate drying agents prior to use.
Battery-grade ethylene carbonate (EC), diethyl carbonate (DEC), and LiPF6
(99.99%, battery grade, Aldrich) were used without further purification. Graphite and
LiCoO2 electrodes were received from Enerland Co. as the mass-producing grade of Li-ion
battery. The electrolytes systems were prepared in the 1 M LiPF6 in EC/DEC (3/7 v/v).
2.2. Preparation of the zwitterion
The two kinds of imidazolium zwitterion were prepared by nucleophilic ring-
opening reactions, the first of which consisted of nitrile group at 1-C position, methyl group
at 2-C position and sulfopropyl at 3-C position on the imidazolium ring (hereafter referred
to NI), and second of which consisted of methyl group at 1-C and 2-C position and
sulfopropyl at 3-C position on the imidazolium ring (hereafter referred to DM). These two

22
kinds of zwitterion synthetic scheme were shown in Figure 9.
2.2.1. Synthesis of nitrile functionalized zwitterion (NI)
Firstly, DMF, solvent, was degassed for 1h. 1-(2-Cyano ethyl)-2-methylimidazole
(50 mmol) was dissolved in degassed DMF (50 ml) and stirred for 2h. 1, 3-Propanesultone
(55 mmol) was added slowly dropwise at 80 °C and reacted for overnight at reflux with a
vigorous stirring. Then the white precipitates collected, washed with DMF several times,
dried under vacuum. These NI are store in a glove-box due to hygroscopic.
2.2.2. Synthesis of nitrile methyl functionalized zwitterion (DM)
Firstly, Acetone, solvent, was degassed for 1h. 1, 2- Dimethyl-1H-imidazole (50
mmol) was dissolved in degassed acetone (50 ml) and stirred for 2h. 1, 3-Propanesultone
(55 mmol) was added slowly dropwise at room temperature and reacted for 8 hour at reflux
with a vigorous stirring. Then the white precipitates collected, washed with acetone several
times, dried under vacuum. These DM are also store in a glove-box.
2.4. Preparation of electrolytes mixture and ion conductivity test

23
The 1.0 mol/L LiPF6 in EC/DEC (3/7) was used as baseline liquid (E_0)
electrolytes as shown in Figure 8. Various amounts of the two types of synthesized
zwitterion (0.02, 0.04, 0.08, 0.12, and 0.16 M) were added to E_0 (to produce the
corresponding E_NI and E_DM). The mixed electrolytes were dissolved by vigorous
stirring for 24h. Electrolytes formulation was performed under an argon atmosphere in a
glove box whose humidity was controlled below 10 ppm. As shown in Table 3, there is the
sample code of resulting electrolytes mixtures.
2.5. Fabrication of single full cell
All the experiments were performed using 3 × 3 cm2 homemade pouch single full
cells as shown in Figure 9. All the single full cells were composed of graphite (synthetic
graphite) and LiCoO2, which were received from Enerland Co. as mass production grade
for Li ion battery. Each electrode was dried for 12 hr at 80 °C in a vacuum oven before the
cell fabrication. Celgard 3051 was used as a separator. The entire single full cell system was
assembled in the glove box filled with argon gas, whose humidity was controlled below 10
ppm.
2.6. Characterization

24
2.6.1. Identification of the zwitterion formation
The structure of all synthesized NI and DM was performed by 1H Nuclear
magnetic resonance (1H–NMR) spectroscopy employing a Buker Avance 600 MHz
spectrometer with the tetramethylsilane (TMS) proton signal as an internal standard in
deuterium oxide (D2O). The molecular weight of NI and DM was confirmed by fast atom
bombardment mass spectrometry (FAB–MS) employing a Jeol JMS-700 high resolution
mass spectrometer. The elemental analysis (EA) was carried out using CE instruments EA
1112 elemental analyzer to determine the C, N, H and S atom contents of the NI and DM.
The thermal properties of NI and DM was analyzed by dynamic scanning
calorimeters (DSC) and thermal gravimetric analyzer (TGA) with and TA Instruments
Q500 under heating rate 10 °C/ min from 25 to 500 °C in N2 and TA Instruments 2920
under heating rate 5 °C / min from 0 to 260 °C, in N2
2.6.2. Ion conductivity test
The conductivities of the NI and DM incorporated electrolytes at different weight
ratio and temperature were confirmed by electrochemical impedance (EIS, frequency from
100 kHz to 1 kHz) using an Solartron 1255. For this test, stainless still (SS) disc cell was
assembled as Figure 10 and kept at thermo hydrostat incubator for constant temperature.

25
The interaction between functional group in zwitterion and Li+ ion was measured Fourier-
Transform Infrared (FT–IR) spectra on a Perkin Elmer GX spectrophotometer.
2.6.3. Interfacial reaction between electrode and electrolytes
The electrochemical stability for electrolytes mixtures were evaluated by linear sweep
voltammetry (LSV) with a scan rate 5 mV s-1
at 20 ºC , which were carried out using a
scanning electrochemical microscopy (SECM, CHI900B, CH Instruments, USA) in the
glove box. As for the working electrode, platinum (Pt, d = 0.2 cm) was used and as for the
counter and reference electrode the lithium metal was used. Before the LSV measurement,
the Pt was polished on diamond slurry (15 m, BASI). Cyclic voltammetry (CV) was
performed on graphite negative electrode in a range from 3.0 V to 0.0 V (vs. Li/Li+) with
0.05 mV/s. LSV and CV are performed with using a beaker-type electrochemical cell.
2.6.4. Single full cell performance test
The open circuit voltage (OCV) was checked using a battery cycler (WBCS3000,
Wonatech) for 2 hr. Then the SFCs were charged from OCV to 4.2 V at 0.2 C rate, followed
by a constant voltage (4.2 V) to 0.02 C capacity drop (CC–CV charging), and were
discharged to 2.75 V at 0.2 C (CC discharging), and SFCs were charged to 4.2 V at 0.2 C,

26
and then discharged to 2.75 V with different C rate (0.2, 0.5, 1.0 and 2.0 C) to investigate
the rate performance. Finally, all SFCs were cycled with 1.0 C rate charge and discharge at
100th. The resistance of SFCs was measured by AC impedance analyzer with frequency
range from 200 KHz to 10 mHz at 4.2 V (Li/Li+). The obtained impedance data were
analyzed using the Zman ver. 2.0 software.

27
Figure 8. Preparation of electrolytes mixture

28
Sample Content of zwitterion
(M)
Sample
code
EC/DEC/LiPF6
(3/7 (V/V)/ 1 M) 0.00 E_0
E_0
+
NI
0.02 E_NI 2
0.04 E_NI 4
0.08 E_NI 8
0.12 E_NI 12
0.16 E_NI 16
E_0
+
DM
0.02 E_DM 2
0.04 E_DM 4
0.08 E_DM 8
0.12 E_DM 12
0.16 E_DM 16
Table 3. Formulation of electrolytes mixture

29
Figure 9. Stainless still (SS) disc cell and Single full cell (SFC) with graphite/
LiCoO2 electrode

30
3. Results and Discussion
3.1. Synthesis of 1-(propane nitrile)-2-methylimidazolium-3-(propyl sulfonate) (NI)
The 600MHz 1H nuclear magnetic resonance (
1H–NMR) spectra of 1-(2-Cyano
ethyl)-2-methylimidazole (Pre-NI) and 1-(propane nitrile)-2-methylimidazolium-3-(propyl
sulfonate) (NI) is shown in Figure 12. The nucleophilic attack of the Pre-NI (1-H singlet at
7.14 ppm, 2-H singlet at 6.92 ppm, 3-H singlet at 2.39 ppm, a-H triplet at 4.29 ppm and b-
H triplet at 2.98 ppm) nitrogen occurs at the carbon of propanesultone. The all NMR
spectrum of synthesized NI (1-H doublet at 7.56 ppm, 2-H doublet at 7.55 ppm, 3-H singlet
at 2.39 ppm, 4-H triplet at 4.34 ppm, 5-H quintet at 2.73, 6-H triplet at 2.97, a-H triplet at
4.54 ppm and b-H triplet at 3.13 ppm, as shown in Table 4) shifted downfield due to
positive charge indication of imidazole ring on NI. Particularly, the 1 and 2 peaks which are
signals of NCH2 in hetero aromatic in Pre-NI appear to 7.14 and 6.92 ppm. However,
because NI indicated a symmetrical structure, these are so overlap each other (7.56 ppm
and 7.55 ppm), and look like a doublet. This results show that NI is clearly synthesized by
nucleophilic ring-opening reactions. The value of degree of substitution (DS) was
determined by Elemental analysis (EA). The stoichiometry of NI was derived from the EA
are shown in Table 5. From the results of the EA, the value of Degree of substitution (DS)
was found to be approximately 0.98. These results mean that Pre-NI is successfully
31
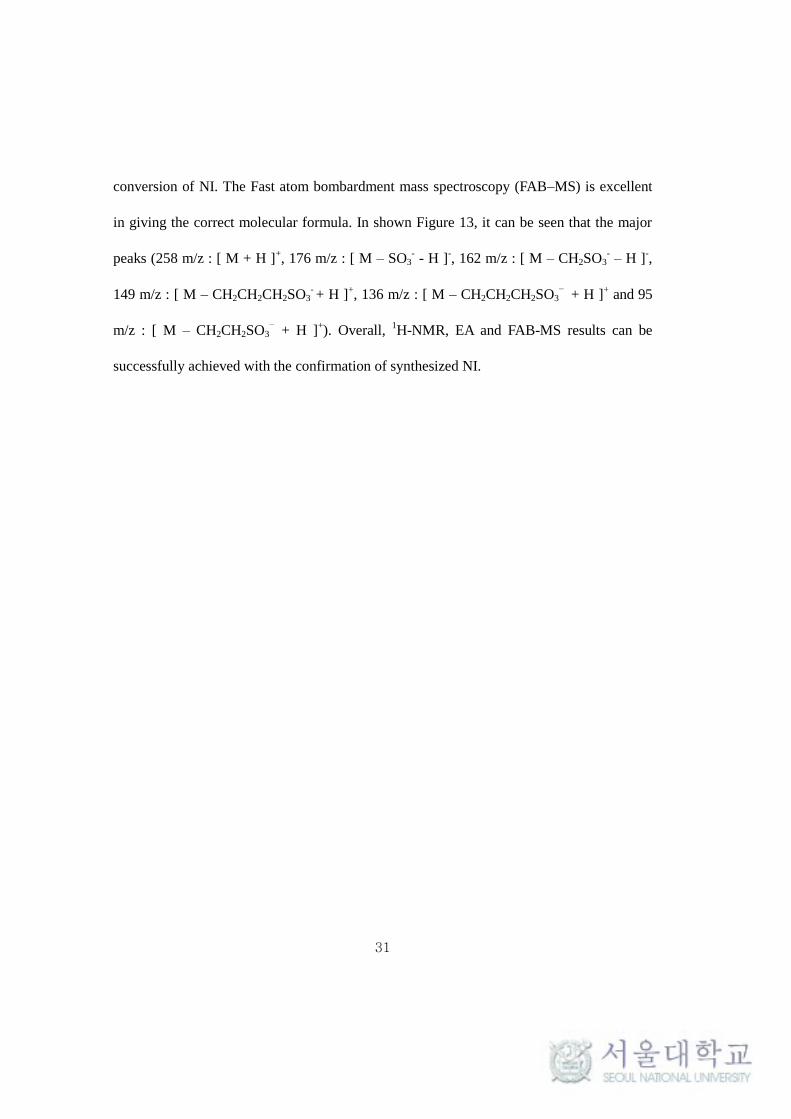
conversion of NI. The Fast atom bombardment mass spectroscopy (FAB–MS) is excellent
in giving the correct molecular formula. In shown Figure 13, it can be seen that the major
peaks (258 m/z : [ M + H ]+, 176 m/z : [ M – SO3
- - H ]
-, 162 m/z : [ M – CH2SO3
- – H ]
-,
149 m/z : [ M – CH2CH2CH2SO3- + H ]
+, 136 m/z : [ M – CH2CH2CH2SO3
– + H ]
+ and 95
m/z : [ M – CH2CH2SO3– + H ]
+). Overall,
1H-NMR, EA and FAB-MS results can be
successfully achieved with the confirmation of synthesized NI.

32
8 7 6 5 4 3 2
(ppm)
In
ten
sit
y (
a.u
.)
1 2
4
35
1 2
4
35
6
78
1 2 4
3
5
Solvent : D2O
1 2 64 85
3
7
Figure 10. 1H−NMR spectrum of NI

33
Table 4. The interpretation of the 1H−NMR spectrum of NI
Region split Relative
integral Region split
Relative
integral
1 NCH d 1.91
5 CH2 t 2.02
2 NCH d 6 NCH2 t 2.07
3 CH3 s 3.0 7 CH
2 q 2.10
4 NCH2 t 1.99 8 CH
2S t 2.16
*S : Singlet *t : triplet *d : doublet *q : quintet

34
Element C N H S
Weight percentage (%) 46.88 16.34 6.04 12.36
Atomic weight 12.01 14.00 1.00 32.00
Number ratio 10.06 3.03 15.68 1.00
Target number ratio 10 3 15 1
Table 5. Elemental analysis of NI

35
Figure 11. FAB–MS spectrum of NI
258
m/z : 257

36
3.2. Synthesis of 1,2-dimethylimidazolium-3-(propyl sulfonate) (DM)
The 600MHz 1H−NMR spectra of 1,2-Dimethylimidazole (Pre-DM) and 1,2-
dimethylimidazolium-3-(propyl sulfonate) (DM) which are comparison group with NI is
shown in Figure 14. It is also nucleophilic attack of the Pre- DM (1-H doublet at 6.82 ppm,
2-H singlet at 6.71 ppm, 3-H singlet at 2.18 ppm and a-H triplet at 3.41 ppm) nitrogen
occurs at the carbon of propanesultone. The all NMR spectrum of synthesized DM (1-H
doublet at 7.41 ppm, 2-H doublet at 7.34 ppm, 3-H singlet at 2.61 ppm, 4-H triplet at 4.29
ppm, 5-H quintet at 2.26, 6-H triplet at 2.95 ppm and a-H singlet at 3.77 ppm, as shown in
Table 6) shifted downfield due to similar effects of positive charge indication on NI. In
comparison with NI, because DM indicated an asymmetrical structure, the 1 and 2 peaks
(7.41 ppm and 7.34 ppm) which are signals of NCH2 in hetero aromatic in DM are
obviously indicated in each chemical shift. This results show that DM is clearly synthesized.
The value of DS was determined by EA. The stoichiometry of DM was derived from the
EA are shown in Table 7. From the results of the EA, The value of DS was found to be
approximately 1.00. These results mean that Pre-DM is successfully conversion of DM.
The FAB–MS is excellent in giving the correct molecular formula. In shown Table 5, it can
be seen that the major peaks ( 219 m/z : [ M + H ]+, 137 m/z : [ M – SO3
- – H ]
-, 123 m/z :
[ M – CH3SO3-]
+, 110 m/z : [ M – CH2CH2SO3
- + H ]
+). Overall,
1H−NMR, EA and FAB−
MS results can be successfully achieved with the confirmation of synthesized DM.

37
8 7 6 5 4 3 2
(ppm)
In
ten
sit
y (
a.u
.)
12
4 3
5
4
7
3
6121 2
4
3
5
67
1 2
4
3
Solvent : D2O
Figure 12. 1H−NMR spectrum of DM

38
Table 6. The interpretation of the 1H−NMR spectrum of DM
Region split Relative
integral Region split
Relative
integral
1 NCH d 1.00 5 NCH2 t 2.20
2 NCH d 0.98 6 CH2 t 2.19
3 CH3 s 3.21 7 CH
2S t 2.23
4 NCH3 s 3.22

39
Element C N H S
Weight percentage (%) 43.89 12.83 6.66 14.65
Atomic weight 12.01 14.00 1.00 32.00
Number ratio 7.97 2.02 14.63 1.00
Target number ratio 8 2 14 1
Table 7. Elemental analysis of DM

40
219
m/z : 219
Figure 13. FAB–MS spectrum of DM

41
3.3. Thermal properties
The thermal stabilities and thermal properties of the zwitterion were examined by
TGA and DSC, respectively. Figure 15 illustrate the DSC diagrams of the zwitterions on
their second heating trace (10 °C min–1
). The phase properties of NI and DM were
examined, including the crystallization point (Tc), the melting point (Tm), and the glass
transition temperature (Tg). The DSC curves during the first heating scan of the zwitterion
indicated Tm values of 237 °C (NI) and 240 °C (DM); however, during the second heating
scan, the DM displayed one exothermic peak and two endothermic peaks. The DM showed
an endothermic peak prior to melting, which suggested that the crystal was transformed into
a different crystalline form. On the other hand, the NI only displayed a Tg during the second
scan. The nitrile group includes strongly electron-withdrawing groups. This functional
group can change the electron distribution over the whole zwitterion molecular system.
Accordingly, although introducing alkyl chains may be effective in reducing the
crystallinity of the zwitterions, the biased electron distribution in NI compared with DM
made it more difficult to form crystalline structures. Moreover, because the NI decomposed
prior to melting, the melting temperature was superseded by the decomposition temperature
of the zwitterion, as shown in Figure 16. A comparison of these two zwitterions showed
that DM displayed a weight loss region, whereas NI displayed two distinct stability regions.
The initial weight loss of NI occurred around 24% in the temperature range 220–250 °C,

42
which was likely attributed to the nitrile functional group. Only a small degree of weight
loss was displayed in DM at 110 °C due to the solvate or hydrate. As a result, the NI
exhibited a high thermal stability, and the LIB electrolytes containing this zwitterion were
expected to be safe, even at high temperatures.

43
Figure 14. DSC diagram of NI and DM zwitterion
50 100 150 200 250
NI
DM
Endo
H
ea
t F
low
Temperature (oC)
Exo
DM
NI

44
Figure 15. TGA diagram of NI and DM zwitterion
0 100 200 300 400 500 600
20
40
60
80
100
DM
Temperature (oC)
W
eig
ht
(%)
NI
DM
NI

45
3.4. Electrochemical Analysis of Electrolytes
3.4.1. Ion conductivity test
The ion conductivity reflects of the total charge on each species of the electrolytes.
Because a high ionic conductivity is associated with a low ohmic potential loss, the high
ion conductivity is an essential requirement for electrolytes. The room temperature (20 °C)
ion conductivities of samples which incorporated with various amounts of each zwitterion
are shown in Figure 18 and which calculated by using the bulk electrolytes resistance (Rb)
according to the following equation:
σ =L
R𝑏 ∙ A
where A is the contact area between stainless steel electrode and the electrolytes and L is
the thickness between two SS. The bulk resistance, Rb, was obtained from the impedance
data. The calculated ion conductivity of E_0 can approach the similar value as compared to
reference paper [19, 20]. The ion conductivity of the NI added electrolytes increases
gradually at low concentration. Ion conductivity of E_NI 8 reaches the maximum value,
7.64 mS∙cm−1
. When the NI concentration is more than the E_NI 8, the ion conductivity is
gradually decreased. Therefore, the E_NI 8 was considered the highest conducting

46
electrolytes. In contrast, when the DM added into E_0, ion conductivity gradually reduces
the increasing the DM concentration. This is explained by assuming that the functionalized
nitrile group is cooperated with sulfonate group in dissociation of Li+ from the salts, thus
causing a decrease in the interaction between Li+ and the PF6
-, followed by a decrease in
viscosity and an increase in Li+ ion mobility. However, if excessive the NI is mixed with
the electrolytes, Li+
will be surrounded by a large number of nitrile group or SO3- forming
ionic atmosphere; therefore Li+ are trapped in the ionic atmosphere and increasing viscosity
results in decreasing ion conductivity [21]. Almost all of the most commonly studied that
the ion conductivity of an organic carbonates base electrolytes decreases by addition of ILs
or additives, because of the increase of the viscosity [22, 23]. Thus the DM mixed
electrolytes is corresponded to this case. Figure 19 illustrated of temperature dependence of
ion conductivities electrolytes which are consisted with the E_0, the E_NI 8 and the E_DM
8. Overall, the ion conductivity was found to increase with increasing temperatures in the
range. The conductivity of the E_NI 8 is higher than that of the E_0 and the E_DM 8 at the
same temperature.
The interaction between Li+ ions and zwitterion was investigated by FT−IR
spectroscopy. The Figure 20 illustrates of FT−IR spectra of zwitterion and LiPF6 mixtures.
The peak of 2250 cm−1
at (C) that associated with the bearing nitrile group at NI shifted to
the high frequency at 2258 cm−1
when mixed with 1.0 equiv. of LiPF6. It is suggested that
lithium salts were solubilized with the support of interaction between nitrile group and Li+

47
ion. Furthermore, the peak of 1039 cm−1
that assigned to the double bond of the sulfonate
group moved to the 1051 cm−1
. In comparison with the DM, the NI is stronger interaction
between Li+ and sulfonate group than the DM. Therefore, FT−IR spectra with NI and DM
demonstrate that Li+ ion interacts with both nitrile and sulfonate group, thereby NI is
facilitating Li+ dissociation.

48
Figure 16. Variation of conductivity with zwitterion concentration
0.00 0.04 0.08 0.12 0.162
3
4
5
6
7
8
9
Co
nd
ucti
vit
y (
mS
/cm
)
Contents (M)
E_NI
E_DM

49
Figure 17. Temperature dependence on ion conductivities of
electrolytes containing 0.08 M zwitterion
270 285 300 315 3302
4
6
8
10
12 E_0
E_NI 8
E_DM 8
Co
nd
ucti
vit
y (
mS
/cm
)
Temperature (K)

50
Figure 18. FT−IR spectra of interaction between zwitterion and
LiPF6; NI, NI+ LiPF6, DM, DM+LiPF6
2200 2000 1800 1600 1400 1200 1000
Tra
ns
mit
tan
ce
(a
.u.)
Wavenumber (cm1
)
1043
1048
DM
DM + LiPF6S=O
stretch
C≡Nstretch
2250
2258
1039
1051
NI
NI + LiPF6 S=Ostretch

51
3.4.2. Interfacial reaction between electrode and electrolytes
The electrochemical stability of the electrolytes was determined by linear sweep
voltammetry (LSV). This was performed with counter and reference electrode of lithium
metal and working electrode of platinum (Pt) at a scanning rate of 5.0 mV/s. In the Figure
19 of E_0, the two reduction peaks are observed between 2.0 V and 3.2 V which related
with the reduction of the EC and DEC [24]. In case of the E_NI 4 and the E_DM 4, they
show three reduction peaks which are associated with decomposition of containing
electrolytes and zwitterion. These three electrolytes show difference of reduction current
intensity. Comparing the E_NI 4 with the E_0, the E_NI 4 has the lower reduction current
than the E_0. These low-intensity current mean that electrolytes reduced the reduction
decomposition on the electrode surface. In other words, NI prevented the electrolytes
decomposition on the electrode surface. Otherwise, the E_DM 4 has higher current
intensity compared to the E_0. Therefore, LSV indicated that The NI was inferred to
prevent electrolyte decomposition on the electrode surface.
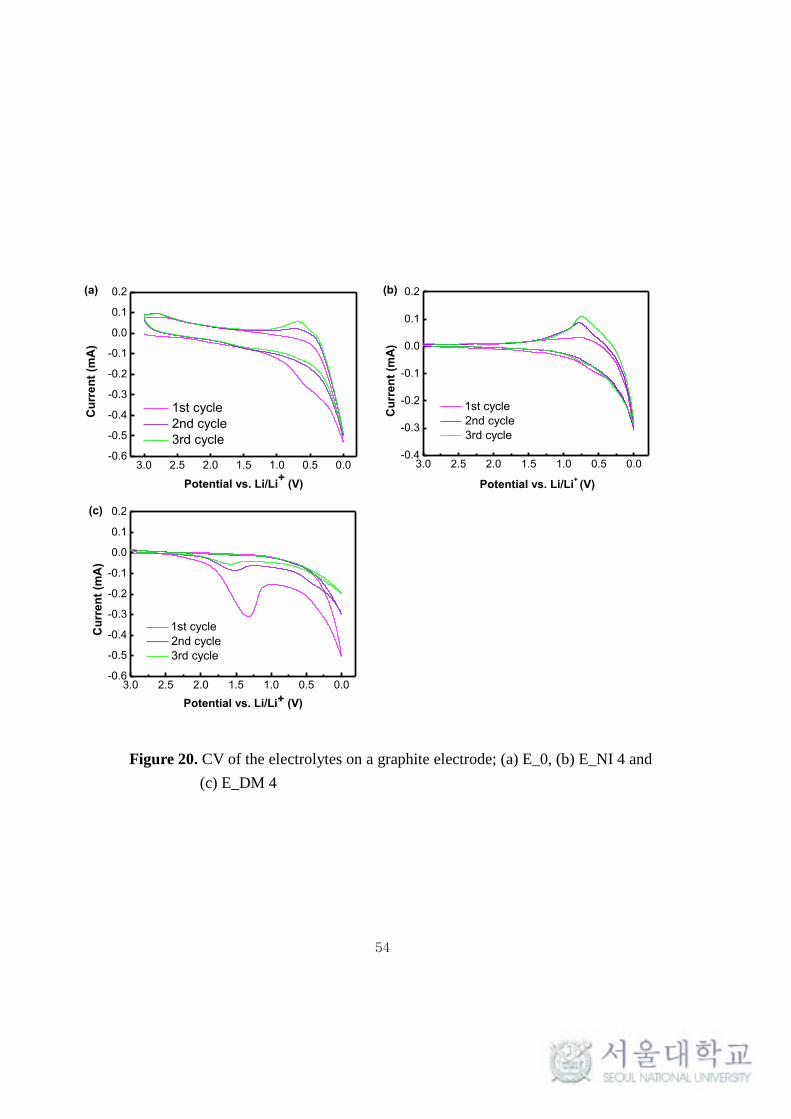
The zwitterion compounds affected the compatibility between the graphite anode
and the electrolytes, as further investigated by cyclic voltammograms (CV). The CV of E_0,
E_NI 4 and E_DM 4 are shown in Figure 20. Graphite electrodes, three cycles, a scan rate
of 0.5 mV/s, and a voltage range of 0–3 V (versus Li/Li+) were used. As shown in Figure 20
(a), the E_0 has several redox peaks in the first cycle. The broad intense reduction peak

52
indicated between around 0.7 V and 0.5 V, corresponding to the reduction of the EC. The
reduction at 0 V and the oxidation at around 0.6 V related to lithium
intercalation/deintercalation at the graphite layers [25]. The reduction peak of EC is
disappeared in the second scan, which is effected by formation of the SEI layer on the
graphite electrode preventing the further decomposition of electrolytes. As shown in Figure
20 (b), E_NI 4 displayed several redox peaks at 0.5 V, 0 V, and 0.6 V, attributed to the
reduction of EC, lithium intercalation, and lithium deintercalation at the graphite electrode
surface. The reduction peak corresponding to EC disappeared in further cycles because the
SEI layer on the graphite electrode blocked the further decomposition of the solvent. The
electrolytes containing NI was inferred to form a stable SEI layer. Figure 20 (c) shows that
E_DM 4 displayed a broad intense reduction peak between 2.0 V and 1.0 V that was
present during all cycles tested. This deposition peak was attributed to the irreversible
reduction of DM. Furthermore, the oxidation peak corresponding to lithium deintercalation
was not observed because the E_DM 4 did not form an adequate SEI layer on the graphite
electrode during the first reduction cycle. These features mainly resulted from the
irreversible reductive decomposition of DM at the electrode surface. The LSV and CV
results indicated that NI prevented the decomposition of the electrolytes and supported the
formation of a stable SEI layer on the graphite electrode.

53
Figure 19. LSV of the electrolytes on a Pt disk electrode; E_0, E_NI 4,
and E_DM 4
0.0 0.5 1.0 1.5 2.0 2.5 3.0 3.5
-12
-8
-4
0
E_DM 4
E_0
E_0
E_NI 4
E_DM 4
Potential vs Li/Li+ (V)
Cu
rre
nt
(mA
/cm
2)
Scan rate : 0.5 mV/sE_NI 4
54
Figure 20. CV of the electrolytes on a graphite electrode; (a) E_0, (b) E_NI 4 and
(c) E_DM 4
3.0 2.5 2.0 1.5 1.0 0.5 0.0-0.4
-0.3
-0.2
-0.1
0.0
0.1
0.2
1st cycle
2nd cycle
3rd cycle
Potential vs. Li/Li+ (V)
Cu
rre
nt
(mA
)
(b)
3.0 2.5 2.0 1.5 1.0 0.5 0.0-0.6
-0.5
-0.4
-0.3
-0.2
-0.1
0.0
0.1
0.2
Cu
rren
t (m
A)
1st cycle
2nd cycle
3rd cycle
Potential vs. Li/Li+ (V)
(c)
3.0 2.5 2.0 1.5 1.0 0.5 0.0-0.6
-0.5
-0.4
-0.3
-0.2
-0.1
0.0
0.1
0.2
1st cycle
2nd cycle
3rd cycle
Cu
rre
nt
(mA
)
Potential vs. Li/Li+
(V)
(a)

55
3.5. Single full cell performance test
3.5.1. Initial charge-discharge test
Effect of the NI on the graphite/LiCoO2 SFC performance is confirmed by comparing
E_0 and E_NI containing various amounts of the NI. The Figure 21 illustrated the initial
charge-discharge profiles. All of the initial discharge curves indicated the irreversible
capacity loss, which is contributed to the charge consumption at the graphite anode. In
other word, this loss is related to formation of SEI layer on the graphite electrode at first
cycle. The initial columbic efficiency of the full cells is found to decrease with the
increasing amount of the NI. Furthermore, comparing with the E_0 and the E_NI indicated
more enhanced initial discharge capacity except E_NI 16. The results listed in Table 6
shows that the coulomb efficiency of E_NI 4 was the highest value, 2.42 mAh with less
than that of the E_0. In the work for the design of electrolytes, almost researchers have
focused on designing the high ion conductivity electrolytes, accompanied with a low
resistance SEI layer because these two factors affect to LIB performances [26]. The above
mentioned results show that ion conductivity of E_NI is higher than that of E_0. If these
results are only determined by ion conductivity value, it would be critical factor of decisive
initial charge-discharge property. However, although the ion conductivity of E_NI 8
examined here has a higher value than that of the E_NI 4, initial capacity of E_NI 8

56
appeared the inversely proportional result. Hence, the ion conductivity is not a crucial
factor to determine the initial performance of the full cell at least in this ion conductivity
range and in this system. Therefore, the initial cell performance is significantly influenced
by the stability of the SEI layer. As a result, it is inferred that one of the most stable SEI
layer was produced in E_NI 4.
The formation of an SEI layer during the initial charging process could be monitored
using the differential capacity (dQ/dV) curve data. Figure 23 shows the dQ/dV plots of the
SFCs during the 1st and 2nd cycles. As shown in Figure 22, all curves displayed an initial
decomposition peak during the first cycle that vanished during the second cycle. These
properties were common to all SEI layer formation. The SEI layer formed during the initial
charge, and this film prevented further decomposition of the electrolytes during subsequent
charge processes. Furthermore, the E_DM 4 show peak in the 1.5–2.0 V range, which
is not seen for the E_NI 4. This Peak is associated with a component in the DM
additive that is reduced (and apparently decomposed) early on the initial charge
process, which the prior reduction of the DM does not prevent solvent reduction on
the graphite anode. This result suggests that imidazolium-based zwitterion is
enhanced the electrochemical stability by introduction of nitrile group. The nitrile
group includes strongly electron-withdrawing groups. This functional group can
change the electron distribution over the whole zwitterion molecular system.
Accordingly, NI zwitterion has a symmetrical structure, so that charge is uniformly

57
distributed throughout the nitrile functional group which can improve the
electrochemical stability. As shown in Figure 23, increasing the NI content gradually
shifted the initial decomposition peak toward higher voltages. This movement could be
explained in terms of an electrochemical reaction on the graphite electrode. Jung [27]
described the initial events involved in electrolytes decomposition on graphite surfaces,
illustrating that the initial decomposition peak of the dQ/dV curve was shifted toward
higher potentials as the BF4– anion content increased due to the adsorption of BF4
– anions.
Moreover, it has been reported that zwitterionic surfactant is electrochemically adsorbed on
the electrode, and at low bulk surfactant concentrations, it corresponds to the formation of a
film of adsorbed molecules on the electrode surface [28]. It was, therefore, inferred that the
NI electrochemically adsorbed onto the graphite surface during the aging process, and these
reactions modified the electrode surfaces.

58
0 2 4 6 8 10 12 14 16 18 201.5
2.0
2.5
3.0
3.5
4.0
4.5
5.0
(b)
Po
ten
tial vs. L
i/L
i+ (
V)
Capacity (mAh)
E_0
E_NI 2
E_NI 4
E_NI 8
E_NI 12
E_NI 16
(a) (e)(d) (c)(f)
Figure 21. Battery performance of charge and discharge profiles of
graphite/LiCoO2 single full cell using E_0 and E_NI containing
various amounts of the NI, obtained from first cycle: (a) E_0 (b)
E_NI 2 (c) E_NI 4 (d) E_NI 8 (e) E_NI 12 (f) E_NI 16

59
Sample
1st cycle
capacity (mAh) Columbic
efficiency (%)a
Charge Discharge
E_0 18.99 14.34 75
E_NI 2 20.73 15.78 76
E_NI 4 20.84 16.76 80
E_NI 8 20.02 15.40 75
E_NI 12 20.76 14.90 72
E_NI 16 16.03 9.13 56
Columbic efficiency a
: (Discharge capacity/charge capacity)×100
Table 8. Discharge capacities and coulombic efficiencies of the E_0 and
E_NI electrolytes, obtained from the first cycle.

60
Figure 22. The differential capacity (dQ/dV) plots graph of the single full cells at
1st and 2nd cycle: (a) E_0 (b) E_NI 4 (c) E_DM 4 the arrows indicate the location
of the initial decomposition peaks, respectively
1.5 2.0 2.5 3.0 3.50.00
0.01
0.02
0.03
0.04
dQ
/dV
Cell voltage (V)
Decomposition
of DM
SEI layer
formation
1.5 2.0 2.5 3.0 3.50.00
0.01
0.02
0.03
0.04
SEI layer
formationdQ
/dV
Cell voltage (V)
1.5 2.0 2.5 3.0 3.50.00
0.01
0.02
0.03
0.04
1st cycle
2nd cycled
Q/d
V
Cell voltage (V)
SEI layer
formation
E_0
E_NI 4
E_DM 4
(a)
(b)
(c)

61
Figure 23. The differential capacity (dQ/dV) plots graph of the single full cells at 1st
and 2nd cycle: (a) E_0 (b) E_NI 2 (c) E_NI 4 (d) E_NI 8 (e) E_NI 12 (f)
E_NI 16; the arrows indicate the location of the initial decomposition
peaks, respectively
2.6 2.8 3.0 3.2 3.4 3.6 3.80.00
0.01
0.02
0.03
0.04(a) 1st cycle
2nd cycle
dQ
/dV
Cell voltage (V)
E_0
SEI layer
formation
2.6 2.8 3.0 3.2 3.4 3.6 3.80.00
0.01
0.02
0.03
0.04(b)E_NI 2
dQ
/dV
Cell voltage (V)
2.6 2.8 3.0 3.2 3.4 3.6 3.80.00
0.01
0.02
0.03
0.04E_NI 4
dQ
/dV
Cell voltage (V)
(c)
2.6 2.8 3.0 3.2 3.4 3.6 3.80.00
0.01
0.02
0.03
0.04(f)
dQ
/dV
Cell voltage (V)
E_NI 16
2.6 2.8 3.0 3.2 3.4 3.6 3.80.00
0.01
0.02
0.03
0.04
E_NI 12
dQ
/dV
Cell voltage (V)
(e)
2.6 2.8 3.0 3.2 3.4 3.6 3.80.00
0.01
0.02
0.03
0.04(d)d
Q/d
V
Cell voltage (V)
E_NI 8

62
3.5.2. Electrochemical Impedance Spectroscopy (EIS) analysis
In order to find the crucial factor about above initial charge-discharge and cell
performance, EIS analysis is required. Using EIS analysis can elucidate the resistive
components and the mechanism of enhancement of the cell performance. Reasonable
AC impedance data may be obtained from SFCs fully charged to 4.2 V because the
impedance of an SFC with a low capacity is generally very sensitive to the state of the
charge. Figure 24 shows the nyquist plots of SFCs. All plots were composed of
overlapping semicircles between the high and middle frequency regions and a straight
line at low frequencies. These plots could be described in terms of three resistances, the
bulk resistance (Rb) at high frequencies, the SEI layer resistance (RSEI) corresponding to
the semi-circular response at high frequencies, and the charge transfer resistance (Rct)
corresponding to the semi-circular response at medium to low frequencies. These single
full cell impedance data was mainly affected by the graphite anode. Moreover, the main
differences were observed in the mid-frequency semicircles of the EIS data, which
indicated differences in the graphite–electrolytes interface, that is, in the SEI formed in
various electrolytes. The order of interfacial resistance of these electrolytes is as
follows: E_NI 16 > E_0 > E_NI 8 > E_NI 12 > E_NI 2 > E_NI 4. This result is shown
that the NI containing electrolytes exhibits much lower interfacial resistance than the
E_0. Especially, RSEI and Rct of E_NI 4, both of which represented the interfacial

63
resistance, yielded the lowest values. Interfacial resistance is associated with the SEI
layer properties; therefore, E_NI 4 appeared to form low-resistance and stable SEI layer
on the graphite surface; however, all resistance values (Rb, RSEI, and Rct) in E_NI 16
were found to be higher than those of E_0. These results were attributed to an increase
the viscosity of the electrolytes and increase the interfacial resistance of the SEI layer
[29]. As a result, the resistance to Li+ ion transport through the SEI layer deceased in
E_NI 2, E_NI 4, E_NI 8 and E_NI 12.
In case of the E_NI 4 results, it is necessary to understand of the SEI layer
formation process. Accordingly, the main cause of enhancing SEI layer property can be
verified by above mentioned differential capacity and LSV data. As shown in
differential capacity data, shifting a reduction peak can be explained by electrochemical
absorption of the NI. Thus, indicating low current intensity of E_NI 4 can be elucidated
by effect of electrochemical absorption of NI on the electrode surface as shown LSV
reduction data. Therefore, these results suggest that the adsorbed NI prevented
decomposition of the electrolytes at the electrode surface during the initial charge
process so that this process supported the formation of a stable SEI layer with a low
interfacial resistance, thereby improving the initial capacity, rate discharge capability
and cyclic performance.

64
Figure 24. EIS data of the single full cells at 4.2 V after
formation in a frequency range from 200 kHz to 10
mHz.
2 4 6 8 10 12 140
-1
-2
-3
-4
-5
ZIm
(O
hm
)
ZRe
(Ohm)
E_0
E_NI 2
E_NI 4
E_NI 8
E_NI 12
E_NI 16

65
3.5.2. C-rate and cyclic performance
In order to evaluate the effects of NI addition on the single full cell, charge–discharge
tests were performed. These processes are performed at 20 °C at different discharge rates of
0.2 C, 0.5 C, 1.0 C and 2.0 C, respectively. Figure 25 shows the C-rate performance of E_0
and E_NI containing various amounts of the NI. All of the electrolytes indicated that
discharge capacity was decreased with increasing C-rate. It is explained by the electric
polarization because to the increase of the IR drop [30]. Moreover, although they have
differential initial columbic efficiency, samples exhibit similar discharge performance at
low discharge rate. However, with gradually increased the C-rate, the effect of NI on rate
performance becomes more noticeable. Especially, the E_NI 4 can still deliver a capacity of
14.8 mAh at 2.0 C, showing an excellent high rate discharge capability. The E_NI 4 showed
the capacity retention at 89.0% of the capacity at the discharge rate of 2.0 C. The rate
performance of cell with the E_0, E_NI 2, E_NI 8 and the E_NI 12 were 83.5%, 88.4%,
87.4% and 87.1% of capacity retention at 2.0 C, respectively. The order of capacity
retention of these electrolytes at 2.0 C is as follows: E_NI 4 > E_NI 2 E_NI 8 > E_NI 12>
E_0 > E_NI 16. This result is shown that the NI containing electrolytes exhibits much
higher rate capability than the E_0. The high rate capability arising from the high electronic
conductivity induced by the thick SEI layer formed on electrode surface and high ion
conductivity of the electrolyte. Thus, since electrolyte containing NI is enhancement of ion

66
conductivity as well as formation of low resistance and stable SEI layer, these
improvements brought high rate capability.
The cyclic performances were also evaluated with the electrolytes. As shown in Figure
26, the initial discharge capacities of the single full cells containing the E_NI 2, E_NI 4,
E_NI 8, E_NI 12 and E_0 at 1.0 C rate were maintained without the noticeable fluctuating
to 100 cycles. On the contrary, the cell capacity of containing the E_NI 16 is rapidly
reduced during the cycles. The noticeable thing that the cell capacity of the battery
containing E_NI 2, E_NI 4, E_NI 8 and E_NI 12 exhibited better cyclic performance at 1.0
C than that containing the E_0. However, compared their cell capacity, there are a little
different in the single full cell system. These phenomena correspond with above C-rate
capability results indicating a little gap of capacity at 1.0 C rate.
These high cyclic performances were caused by enhanced SEI layer properties. In EIS
results, the interfacial resistance (RSEI and Rct) was increased with amount of the NI
contents. Increased interfacial resistance is strongly depends on thickness and resistance of
the SEI layer. Therefore, in these results, it can prove that the E_NI, except E_NI 16,
indicating best cyclic performance formed low-resistance and stable SEI layer on the
graphite surface.

67
0.2 C 0.5 C 1.0 C 2.0 C10
11
12
13
14
15
16
17
Cap
acit
y (
mA
h)
Rate
E_0
E_NI 2
E_NI 4
E_NI 8
E_NI 12
E_NI 16
89.0%
87.4%87.1%
88.4%
83.5%
69.7%
Figure 25. C-rate dependency of the discharge capacities of the
graphite/LiCoO2 cell at different discharge rates of 0.2 C,
0.5 C, 1.0 C and 2.0 C

68
Figure 26. Cyclic performance for the graphite/LiCoO2 cell at 1.0 C rate
0 10 20 30 40 50 60 70 80 90 1000
4
8
12
16
20
Ca
pacit
y (
mA
h)
Cycle number
E_0
E_NI 2
E_NI 4
E_NI 8
E_NI 12
E_NI 16

69
4. Conclusions
In this study, In order to find out effect of the nitrile-functionaliuzed zwitterion (NI)
was synthesized and added into organic carbonated electrolytes to application for LIB.
Some of the results are as the follow.
1. The nitrile-functionalized zwitterion (NI) is synthesized to using of LIB
electrolytes. The results of the 1H−NMR and EA confirmed that Pre-NI is
successfully conversion of the NI. Moreover, the FAB−MS is excellent in
giving the correct molecular formula.
2. The methyl-functionalized zwitterion (DM) is synthesized using for control
group of NI. The successfully conversion of the DM structures was verified by
1H−NMR and EA. Moreover, the FAB−MS can identify of the correct
molecular formula.
3. The thermal properties of the NI and DM were examined by TGA and DSC,
respectively. From these results, it is indicated that the DSC curve of NI
showed Tg and overwrapped between Tm and decomposition point.
Additionally, TGA curve of the NI present two distinct stability regions. The

70
initial weight loss of the NI occurred in around 24% in the temperature range
of between 220 °C and 250
°C, which is likely attributed to the nitrile
functional group. Consequently, the NI exhibited high thermal stability so that
LIB electrolytes using this zwitterion would be safe even at high thermal
environment.
4. The room temperature (20 °C) ion conductivity of electrolytes which
incorporated with various amount of two kinds of zwitterion are estimated.
The ion conductivity gradually increased with increasing NI content. The ion
conductivity of E_NI 8 reached a maximum value of 7.64 mS/cm; however, as
the NI concentration exceeded that in E_NI 8, the ion conductivity rapidly
decreased. This was explained by assuming that the functionalized nitrile
groups cooperated with the sulfonate groups in dissociating Li+ ions from the
salts. The interaction between Li+ ions and zwitterion was investigated by
FT−IR spectroscopy. In this results, it is founds that the NI that Li+ ion
interacts with both nitrile group and sulfonate group, thereby the NI facilitates
dissociation of lithium salt.
5. LSV show that comparing the E_NI 4 with the E_0, the E_NI 4 has the lower
reduction current than the E_0. These low-intensity current mean that

71
electrolytes reduced the reduction decomposition on the electrode surface. In
other words, NI prevented the electrolytes decomposition on the electrode
surface. Therefore, LSV indicated that The NI was inferred to prevent
electrolyte decomposition on the electrode surface. Moreover, effect of the NI
on the compatibility between the graphite anode and the electrolytes is
investigated by cyclic voltammetry (CV) testing. These results show that E_NI
4 can form a stable SEI layer on the graphite electrode. The LSV and CV
results indicated that NI prevented the decomposition of the electrolytes and
supported the formation of a stable SEI layer on the graphite electrode.
6. Effect of NI on the SFC performance is confirmed by comparing E_0 and
E_NI with various amounts of the NI. Comparing with the E_0, the E_NI
indicated more enhanced initial discharge capacity except E_NI 16.
Furthermore, examining the differential capacity (dQ/dV) curve, it can be
found that the shifting initial decomposition peak to high voltage is caused by
modified graphite surface due to electrochemical absorption of NI on the
electrode surface.
7. Using EIS analysis can elucidate the resistive components and the mechanism
of enhancement of the cell performance. The order of interfacial resistance of

72
these electrolytes is as follows: E_NI 16 > E_0 > E_NI 8 > E_NI 12 > E_NI 2
> E_NI 4. This result is shown that the NI containing electrolytes exhibits
much lower interfacial resistance than the E_0. Especially, RSEI and Rct of
E_NI 4, both of which represented the interfacial resistance, yielded the lowest
values. In case of E_NI 4, interfacial resistance, such as RSEI and Rct, is
indicated the lowest value. As a result, the resistance to Li+ ion transport
through the SEI layer deceased in E_NI 2, E_NI 4, E_NI 8 and E_NI 12.
8. In order to evaluate the effects of NI on the single full cell, charge–discharge
tests are performed at 20 °C at different discharge rates of 0.2 C, 0.5 C, 1.0 C
and 2.0 C, respectively. The E_NI 4 can still deliver the capacity of 14.8 mAh
at 2.0 C, showing an excellent high rate discharge capability. The order of
capacity retention of these electrolytes at 2.0 C is as follows: E_NI 4 > E_NI 2
> E_NI 8 > E_NI 12> E_0 > E_NI 16. This result is shown that the NI
containing electrolytes exhibits much higher rate capability than the E_0.
9. The cyclic performances were evaluated with the electrolytes. The initial
discharge capacities of the single full cells containing the E_NI 2, E_NI 4,
E_NI 8, E_NI 12 and E_0 at 1.0 C rate were maintained without the noticeable
fluctuating to 100 cycles. On the contrary, the capacity of containing E_NI 16

73
is rapidly reduced during the cycles. The noticeable thing that the cell capacity
of the single full cells containing E_NI 2, E_NI 4, E_NI 8 and E_NI 12
exhibited better cyclic performance at 1.0 C than that containing the E_0.
In conclusion, NI with enhanced electrochemical stability was successfully
synthesized, and the NI as an additive of the electrolytes plays an importance
role in the stabilization of SEI layer on electrode and enhancement of ion
conductivity, which can be a crucial factor to improve initial capacity and
cyclic performance.

74
4. Reference
[1] Lithium Battery Energy Storage (LIBES) Publication, Technological Reserch
Association, Tokyo, 1994.
[2] G.A. Narzri, G. Pistoia, 2003, Science and Technology of Lithium Batteries, Kluwer
Academic Publishers, Boston, pp. 3–41.
[3] K. Xu, Chem. Rev. 104 (2004) 4303–4417.
[4] C. Jung, Solid State Ionics, 179 (2008) 1717–1720.
[5] W.H. Meyer, Adv. Mater. 10 (1998) 439–448.
[6] M. Armand, F. Endres, D. R. MacFarlane, H. Ohno, B. Scrosati, Nat. Mater. 8 (2009)
621–629.
[7] A. Lewandowski, A. Swiderska-Mocek, J. Power Sources 194 (2009) 601–609.
[8] S.-Y. Lee, H.H. Yong, Y.J. Lee, S.K., S. Ahn, Phys. Chem. B 109 (2005) 13663–13667.
[9] M. Yoshizawa, M. Hirao, K. Ito-Akita, H. Ohno, Mater. Chem. 11 (2001) 1057–1062.
[10] A. Narita, W. Shibayama, H. Ohno, J. Mater. Chem. 16 (2006), 1475–1482.
[11] C. Tiyapiboonchaiya, J.M. Pringle, J. Sun, N. Byrne, P.C. Howlett, D.R. MacFarlane,

75
M. Forsyth, Nat. Mater. 3 (2004) 29–32.
[12] D.Q. Nguyen, H.W. Bae, E.H. Jeon, J.S. Lee, M. Cheong, H. Kim, H.S. Kim, H. Lee, J.
Power Sources 183 (2008) 303–309.
[13] H. Kim, D.Q. Nguyen, H.W. Bae, J.S. Lee, B.W. Cho, H.S. Kim, M. Cheong, H. Lee,
Electrochem. Commun. 10 (2008) 1761–1764
[14] M. Yoshizawa-Fujita, T. Tamura, Y. Takeoka, M. Rikukawa, Electrochem. Commun.
47 (2011) 2345–2347.
[15] H. Tsutsumi, A. Matsuo, K. Takase, S. Doi, A. Hisanaga, K. Onimura, T. Oishi, J.
Power Sources 90 (2000) 33–38.
[16] Z. Wang, , B. Huang, R. Xue, X. Huang, L. Chen, Solid State Ionics 121 (1999) 141–
156.
[17] M. Egashira, S. Okada, J.-I. Yamaki, D.A. Dri, F. Bonadies, B. Scrosati, J. Power
Sources 138 (2004) 240–244.
[18] L. Zhao, J.-i. Yamaki, M. Egashira, J. Power Sources 174 (2007) 352–358.
[19] P. Isken, C. Dippel, R. Schmitz, R.W. Schmitz, M. Kunze, S. Passerini, M. Winter, A.
76
Lex-Balducci, Electrochim. Acta 56 (2011) 7530–7535.
[20] M.Z. Kufian, S.R. Majid, Electrochim. Acta 16 (2010) 409–416.
[21] Z.H. Li, Q.L. Xi, L.L. Liu, G.T. Lei, Q.Z. Xiao, D.S. Gao, X.D. Zhou. Electrochim.
Acta 56 (2010) 804–809.
[22] B. Garcia, S. Lavallee, G. Perron, C. Michot, M. Armand, Electrochim. Acta 49 (2004)
4583–4588.
[23] M. Egashira, S. Okada, J. Yamaki, N. Yoshimoto, and M. Morita, Electrochim. Acta
50 (2005) 3708–3712.
[24] F. Xu, B. Beak, C. Jung, J Solid State Electrochem. 16 (2012) 305–311.
[25] K. Abe, H. Yoshitake, T. Kitakura, T. Hattori, H. Wang, M. Yoshio, Electrochim. Acta
49 (2004) 4613–4622.
[26] K. Xu, S. Zhang, J.L. Allen, T.R. Jow, J. Electrochem. Soc. 150 (2003) A170–A175.
[27] C. Jung, Solid State Ionics 179 (2008) 1717–1720.
[28] E. Cholewa, I. Burgess, J. Kunze, J. Lipkowski, J. Solid State Electrochem. 8 (2004)
693–705.

77
[29] J. Liu, Z. Chen, S. Busking, I. Belharouak, K. Amine, J. Power Sources 174 (2007)
852–855.
[30] O.K. Park, Y. Cho, S. Lee, H.-C. Yoo, H.-K. Song, J. Cho, Energy Environ. Sci. 4
(2011) 1621–1633.

78
국문 초록
본 연구에서는 니트릴 관능기를 포함하는 양쪽성 이온이 첨가된 유기
카보네이트계 전해질을 리튬이온전지용 전해질로 사용 시, 이온 전도도의 향상
과 전극 계면에 안정한 Solid electrolyte interface layer (SEI layer)을 형성 함으로
써 리튬이온전지의 초기 방전용량 증가, C-rate 특성 향상과 장기 안정성이 향
상 됨을 확인하였다. 이러한 양쪽성이온에서 니트릴 관능기의 효과를 확인하기
위해 니트릴 관능기를 갖는 1-(propane nitrile)-2-methylimidazolium-3-(propyl
sulfonate) (NI)와 메틸기를 포함하는 1,2-dimethylimidazolium-3-(propyl
sulfonate) (DM)을 합성하여 비교 실험을 실시하였다. 두 양쪽성 이온의 합성 여
부를 확인하기 위해, 핵자기 공명(1H−NMR), 원소분(EA)과 질량분석(FAB−MS)을
실시하였다. 이렇게 합성된 두 양쪽성 이온은 1 M의 LiPF6리튬염과 유기 카보네
이트계 전해질인 에틸렌 카보네이트(ethylene carbonate EC): 디에틸렌 카보네이
트(diethylene carbonate DEC) (3:7 V/V) 구성되어 있는 전해질에 0.02 M, 0.04 M,
0.08 M, 0.12 M, 0.16 M의 다양한 함량으로 첨가(두 양쪽성 이온을 포함하는 전

79
해질과 포함하지 않는 전해질을 각각 E_NI, E_DM와 E_0로 명명하였다)하여 이
온 전도도 측정 및 전극 계면에서 분해 반응을 평가하였다. 그리고 흑연과
LiCoO2 전극으로 구성된 리튬이차전지를 제조하여 NI가 0.02 M, 0.04 M, 0.08 M,
0.12 M, 0.16 M 함량 별로 첨가된 전해질의 초기 충∙방전 용량, C-rate 특성 및
장기 수명 특성 등의 리튬이온전지의 성능을 비교 평가하였다.
먼저 상온(20 °C)에서 두 양쪽성 이온의 함량에 따른 이온 전도도 측정
결과, E_DM의 경우에는 모든 함량에서 E_0 보다 낮은 이온 전도도를 나타낸 반
면, 일정 함량의 NI (0.02 M, 0.04 M, 0.08 M, 0.12 M)를 포함하는 전해질의 경우,
E_0 보다 이온 전도도가 향상됨을 확인하였다. 특히 NI가 0.08 M 포함된 전해
질의 경우 이온 전도도가 7.64 mS/cm로 가장 큰 값을 나타내었다. 그리고 적외
선 분광법(FT−IR)을 통해서는 리튬 이온과 양쪽성이온 간의 상호 작용력을 확인
하였다. 그 결과, NI의 설포네이트기와 니트릴기가 동시에 리튬 이온과 강한 상
호작용을 한다는 것을 확인하였다. 이러한 리튬 이온과의 강한 상호작용력은 리
튬염의 해리도를 향상시킴으로써 전해질의 점도 감소 및 리튬 이온의 이동성을
증가시킴으로써 전해질의 이온 전도도가 향상 되었다고 볼 수 있었다.

80
전극 계면에서의 전해질의 분해반응을 확인하기 위해 선형주사 전압 전
류법(linear sweep voltammetry, LSV)과 순환주사 전압 전류법(cyclic voltammetry,
CV)를 실시하였다. LSV를 통해서는 니트릴기를 양쪽성 이온에 도입함으로써 전
기화학적 안정성이 향상 됨을 확인하였다. 또한 전극계면에서의 전해질의 분해
가 E_NI가 E_0에 비해 큰 폭으로 감소함을 확인함으로써, NI가 전극 계면에서
전해질 분해를 보호함을 확인하였다. CV를 통해서는 흑연 전극 계면에 E_NI 4의
경우 안정한 SEI layer가 형성되는 반면, E_DM 4는 계속적인 양쪽성 이온의 분
해반응으로 인하여 안정한 SEI layer를 형성하지 못하여 리튬 이온의 탈∙삽입이
원활하지 못함을 확인하였다.
NI의 함량에 따른 전지 성능 평가 결과, 일정함량의 NI (0.02 M, 0.04 M,
0.08 M, 0.12 M)가 포함된 전해질을 주입한 전지에서 E_0를 주입한 전지보다 초
기 충∙방전 용량이 증가하였으며, C-rate 특성 및 장기 안정성 또한 향상 됨을
확인하였다. 특히 NI가 0.04 M 첨가된 전해질의 경우 16.76 mAh의 초기 방전
용량과 80%의 columbic efficiency로 가장 우수하게 나타내었다. 그리고 C-rate
특성 평가에서도 높은 C-rate에서도 가장 높은 방전 용량과 용량 유지율를 나타

81
내었으며, 장기 수명 특성 평가에서 또한 100 싸이클 동안 높은 용량을 유지하
며 안정하게 충∙방전을 하는 것을 확인하였다.
전기화학적 임피던스 분광법을 통해서는 전지 내부저항을 측정하여 전
지의 계면저항을 비교하였다. 비교 결과, E_0를 주입한 전지보다 우수한 전지 성
능을 나타낸 일정 함량의 NI (0.02 M, 0.04 M, 0.08 M, 0.12 M)가 첨가된 전해질
을 주입한 전지의 경우, E_0보다 낮은 계면 저항을 나타냄을 확인하였으며, 가장
우수한 성능을 나타낸 NI가 0.04 M 첨가된 전해질을 주입한 전지의 경우, 가장
낮은 계면저항을 나타내었다. 이러한 낮은 계면저항은 전극 계면에 낮은 저항의
안정한 SEI layer가 형성됨을 의미한다. 이러한 안정한 SEI layer가 형성된 원인
은 NI가 에이징(aging) 과정 중 전극 계면에 안정하게 흡착 함으로써 초기 충∙
방전 시에 나타나는 전극 계면에서의 전해질 분해를 보호하여 낮은 저항의 안
정한 SEI layer가 형성되었다는 것을 LSV 결과와 초기 충전 과정의 미분용량
(differential capacity dq/dv) 결과를 바탕으로 해석하였다.
위의 실험들을 통해, 전지 성능의 향상이 이온 전도도의 향상과 및 전
극 계면의 안정한 SEI layer의 형성에 모두 기인한 것임을 확인 하였다. 하지만

82
향상된 이온 전도도의 효과보다 SEI layer의 안정성 향상이 전지 성능 향상에 더
크게 기여함을 실험 결과들을 통해 확인하였다. 위의 결과를 통해, 새롭게 합성
한 니트릴 관능기를 포함하는 양쪽성이온을 전해질에 첨가 시, 이온 전도도의
향상과 안정한 SEI layer의 형성을 통해 전지 성능이 향상 됨을 확인함으로써,
NI가 리튬이차전지 전해질의 첨가제로써 활용 가능성이 있음을 확인하였다.
83
감사의 글
2년간의 길고도 짧았던 석사과정을 마치고 이제 다음 단계로 도약하고자 합니다.
먼저 2년 동안 좋은 연구환경을 만들어 주시고 많은 지도와 가르침을 통해 논문이 완
성되기까지 큰 도움을 주신 곽승엽 교수님께 진심으로 감사를 드리며 바쁘신 와중에도 논문
심사와 지도를 해주신 장지영 교수님과 안철희 교수님, 그리고 큰 어려움 없이 연구를 진행할
수 있도록 도와주신 한국에너지기술연구원 전재덕 박사님께도 감사의 말을 전하고 싶습니다.
석사과정 동안 힘들고 어려운 일이 있어도 이겨낼 수 있었던 것은 항상 힘이 되어주고 격
려와 조언을 해준 연구실 식구들이 함께 하였기 때문이 아닐까 싶습니다. 바쁘신 와중에도 귀
한 시간 쪼개어 졸업 논문을 도와주신 병용이형과 성학이형, 컴퓨터를 잘 모르던 저에게 기초
를 잘 가르쳐 주신 형구형, 에너지팀 팀장으로서 항상 옆에서 조언을 아끼지 않으셨던 현중이
형, 처음 연구를 시작 할 때 정말 많은 도움을 주셨던 성용이형, 졸업 논문을 처음부터 끝까지
잘 지도해주신 우혁이형, 나이는 비록 어리지만 선배로서 많을 것을 도와준 지훈이, 2년 동안
힘들고 지칠 때마다 옆에서 항상 힘이 되어준 믿음직하고 성실한 최고의 동기 지환이와 태선
이, 오랜 기간 연구실 궂은 일도 마다 않고 도맡아 해 준 규원이, 효원이형 그리고 비록 한 학
기뿐이 같이 하지 못하여 아쉽지만 항상 옆에서 성실히 도와준 준호와 민영이 모두의 도움이
없었더라면 이러한 결실을 맺을 수 없을 것이었기에 진심으로 고맙다는 말을 전하고 싶습니다.
끝으로 2년동안 아무런 탈없이 잘 마무리 할 수 있도록 지켜봐 주신 하나님께 감사 드리
고 저를 지켜봐 주시고 힘이 되어준 많은 친구들과 교회 식구들 그리고 2년 동안 물심양면
으로 묵묵히 지원해시고 인생의 멘토 역할을 해주신 부모님과 저의 하나뿐인 형 원진이형에
게 작지만 소중한 결실로써 보답할 수 있게 되어 너무나 기쁘고, 한없이 감사하고 또 감사하
다는 말을 전하고 싶으며 큰 은혜에 보답할 수 있도록 앞으로도 최선을 다하겠다는 말을 전
합니다.