one hundred years of oil income - economic … · one hundred years of oil income and the iranian...
TRANSCRIPT


ONE HUNDRED YEARS OF OIL INCOME AND THE IRANIAN ECONOMY: A CURSE OR A BLESSING?
Kamiar Mohaddes and M. Hashem Pesaran
Working Paper 771
September 2013
Send correspondence to: Kamiar Mohaddes University of Cambridge [email protected]
First published in 2013 by The Economic Research Forum (ERF) 21 Al-Sad Al-Aaly Street Dokki, Giza Egypt www.erf.org.eg Copyright © The Economic Research Forum, 2013 All rights reserved. No part of this publication may be reproduced in any form or by any electronic or mechanical means, including information storage and retrieval systems, without permission in writing from the publisher. The findings, interpretations and conclusions expressed in this publication are entirely those of the author(s) and should not be attributed to the Economic Research Forum, members of its Board of Trustees, or its donors.
1
Abstract
This paper examines the impact of oil revenues on the Iranian economy over the past hundred years, spanning the period 1908--2010. It is shown that although oil has been produced in Iran over a very long period, its importance in the Iranian economy was relatively small up until the early 1960s. It is argued that oil income has been both a blessing and a curse. Oil revenues when managed appropriately are a blessing, but their volatility (which in Iran is much higher than oil price volatility) can have adverse effects on real output, through excessively high and persistent levels of inflation. Lack of appropriate institutions and policy mechanisms which act as shock absorbers in the face of high levels of oil revenue volatility have also become a drag on real output. In order to promote growth, policies should be devised to control inflation; to serve as shock absorbers negating the adverse effects of oil revenue volatility; to reduce rent seeking activities; and to prevent excessive dependence of government finances on oil income.
JEL Classifications: E02, N15, Q32.
Keywords: Oil price volatility, oil income, rent seeking, inflation, macroeconomic policy.
لخصم
من فترةفى الالورقة تأثیر عائدات النفط على االقتصاد اإلیراني على مدى مئات من السنین الماضیة، والتي تمتد تبحث ھذه
في االقتصاد أھمیتھاال ان في إیران على مدى فترة طویلة جدا، ویظھر أنھ على الرغم من النفط تم إنتاجھ. 1908-2010
عائدات النفط . دخل النفط على حد سواء نعمة ونقمة قد یعتبر ویقال أنھ .لستینیاتاصغیرة نسبیا حتى أوائل تكاناإلیراني
یمكن أن یكون لھا آثار سلبیة على الناتج الحقیقي، من خالل مستویات نعمة، ولكن تقلباتھا تصبح بشكل مناسب دارتعندما
مؤسسات المالئمة وآلیات السیاسات التي تعمل بمثابة ماصات أصبحت غیاب ال. بشكل مفرط ومستمر من التضخموعالیة
يحیث تمثل عالیة من التقلب المستویات الالصدمات في مواجھة اتج الحقیق ى الن ا عل ا عبئ نفط أیض دات ال ل و. عائ ن أج م
دمات ب لتتعزیز النمو، ینبغي وضع سیاسات للسیطرة على التضخم؛ لتكون بمثابة امتصاص الص لبیة لتقل ار الس ي اآلث لغ
.ة على عائدات النفطیللحد من األنشطة التي تسعى اإلیجار؛ ومنع االعتماد المفرط للمالیة الحكوموت النفط، عائدا
2
1. Introduction This paper examines the impact of oil revenues on the Iranian economy over the past hundred years, spanning the period 1908--2010. It begins with an overview of the history of oil exploration and development in Iran, and considers the quantitative importance of revenues from oil exports for the Iranian economy over the period 1908--2010. In this regard, three sub-periods are identified. In the first sub-period, 1908--1959, oil started to be produced in significant quantities, but Iran's share of profits from exports of oil remained rather limited, despite repeated renegotiations over the oil contracts between the Iranian government and international (mainly British) oil companies, the nationalization of the oil industry, and the subsequent establishment of the National Iranian Oil Company.
The second sub-period, 1960--1978, saw major changes in the international oil industry and expanding oil revenues for Iran. Iran's revenues from oil exports started to become significant, more or less steadily, from 1960 onwards thanks to increased production and better royalty terms made possible partly due to the increasing importance of OPEC in contract re-negotiations between producers and host companies. But the main factor behind Iran's huge oil revenues in 1970s was price increases, which were modest initially but then became substantial after the quadrupling of international oil prices in 1973--74. The third sub-period, 1979--2010, coincides with the overthrow of the Shah's regime in the February 1979 Revolution, the halving of oil exports as an intended policy change by the Revolutionary government, and significant volatilities in Iran's oil revenues due to the eight-year war with Iraq (September 1980 to August 1988), US economic sanctions (targeting Iran's oil and gas industry), and the vagaries of international oil markets.
In short, although oil has been produced in Iran for a long time, its importance for the development of the Iranian economy was relatively small until the 1960s. The quadrupling of oil prices in the 1970s and the Shah's policy of spending almost all of the increased revenues domestically substantially increased the country's dependence on oil income, which also happened to coincide with a much higher volatility of international oil prices. Revolution, war and economic sanctions, through their impacts on oil production and exports, have introduced further important sources of variation in Iran's oil revenues. As a result, the Iranian economy has been subject to unprecedented oil revenue volatility. Annual oil revenue volatility has risen from 35.5% per annum during 1960--1978, to 51.1% per annum during 1979--2010, as compared to oil price volatility which rose from 11.3% to 26.1% over the same periods. In this paper we argue that it is the volatility in oil revenues and the government's inappropriate economic and political responses to these volatilities that are the curse and not the abundance of revenues from oil exports in itself. To this end we review the literature on resource abundance and growth, as well as the recent macro-econometric evidence on the Iranian economy. Although the early literature showed the existence of a negative relationship between real output per capita and resource abundance, more recent evidence is not so clear cut. Firstly, the early literature used cross-country analysis that fails to take account of dynamic heterogeneity and error cross-sectional dependence, and this could bias the results. Secondly, the early analysis ignores the effects of oil revenue volatility on growth, which turns out to be important. Using appropriate econometric techniques and including measures of resource revenue volatility in the analysis, the evidence in fact points to resource revenues having a positive effect on growth, with resource volatility affecting growth negatively. Seen from this perspective, resource revenues can be both a blessing and a curse, and the overall outcome very much depends on the way the negative effects of resource revenue volatility are countered by use of suitable stabilization funds and other policy
3
mechanisms that smooth out the flow of government expenses over time. There are also a number of political economy considerations that are highlighted, such as government accountability, generous subsidy policy, and general rent-seeking activities that often manifest themselves in higher inflation and reduced economic efficiencies. Turning to the macro-econometric evidence, we first review the historical trends over the period 1937--2010. We show that there are strong positive correlations between growth of real GDP and real oil export revenues over the whole period and a number of different sub-periods. But, at the same time, we observe strong negative correlations between real GDP growth and inflation, again over the full sample period and the same sub-periods. These results are corroborated by the more formal macro-econometric evidence, also reviewed in the paper. We note that, whilst oil revenues affect real output positively, inflation has a statistically significant negative effect on real output even in the long-run. Based on standard economic theory we would expect inflation to have a significant positive effect on real output only in the short run (through the Phillips curve trade-off), and no effects on real output in the long run. We view the negative long-run relationship between real output and inflation as an indication of the adverse effects of a combination of factors (such as rent-seeking, poor institutional arrangements for dealing with oil revenue volatility, and general economic mismanagement) on economic growth. Econometric analysis also reveals additional insights into the way the Iranian economy functions, which is not apparent from a historical analysis. Using generalized impulse response analysis it is shown that the effects of oil revenue or foreign output shocks work themselves out through the economy within two years, which is much shorter in duration than what is generally obtained (3-5 years) in the more developed economies. Such rapid responses to shocks could be due to the relatively underdeveloped nature of money and capital markets in Iran, and the country's relative isolation from the global economic and finance community. Such a fast rate of response to shocks makes it even more important that appropriate stabilization policies are put into effect so that the adverse effects of negative shocks on output and consumption are dealt with in a timely manner. We conclude that, in order to promote growth, policies should be devised to control inflation, serve as shock absorbers negating the adverse effects of oil revenue volatility, reduce rent seeking activities, and prevent excessive dependence of government finances on oil income.
The rest of the paper is set out as follows: Section 2 discusses the history of the oil sector and its importance for the Iranian economy during the three sub-periods: 1908-1959, 1960-1978, and 1979-2010. Section 3 reviews the literature on resource abundance and growth, and discusses the relevance of the "Dutch disease" and the "resource curse" literature to Iran. Section 4 considers the macroeconomic trends and reviews the existing macro-econometric evidence on the relationship between oil income, inflation and economic growth, both over the course of a business cycle as well as in the long-run. Section 5 presents the evidence on oil price and revenue volatilities and discuss how they interact and influence the economy. Some concluding remarks are given in Section 6.
2. Importance of the Oil Sector in the Iranian Economy It is now over one hundred years since oil was discovered in Iran in commercial quantities. But as we shall see, oil export revenues started to play an important role in the Iranian economy only after 1960, largely due to the low levels of royalties that the Iranian government received from foreign oil companies operating in Iran before 1954. The period post 1960 can also be conveniently split into the pre and post-revolution periods. More specifically, we group the years since 1908 into three sub-periods: 1908--1959, 1960--1978, and 1979--2010, and consider each of these periods separately below.
4
2.1 1908--1959 In 1901 William Knox D'Arcy signed an agreement (which became known as the D'Arcy Concession) with Muzaffar al-Din, the Shah of Iran, in which D'Arcy was given the exclusive rights to explore, develop and produce any oil and gas fields in an area that covered three quarters of the country. In exchange for this right, the Shah would receive a lump sum payment of £ 20,000 in cash and an equal amount worth of shares of the company that was granted the right to explore oil in Iran. More importantly, the Shah would also receive 16 percent of net annual profits of the company (Article 10 of the D'Arcy Concession 1901 reproduced in Ferrier 1982). A large number of test wells were drilled in Iran between 1901 and 1904, and while oil was discovered, the amounts found were not commercially viable. As D'Arcy was slowly running out of money, in order to finance further explorations, he was forced to find other sources of funding and finally in 1905 sold most of his right to oil exploration and production to the Burmah Oil Company. By 1908 the cost of exploration had reached over half a million pounds without any viable oil fields being discovered. Thus the decision was made to shut down operations in Iran. Although George Reynolds, the chief explorer in Iran, received a telegraph from London telling him to stop drilling, he continued exploring for oil until the order was confirmed by post (Kinzer 2003).
Before the letter from England reached Reynolds, large amounts of oil were found in Masjid-i-Suleiman on 26 May 1908. With this discovery a new corporation was formed later that year called the Anglo-Persian Oil Company (APOC). In 1913, in exchange for secure and cheap oil supply from APOC, the British government, on the initiative of Winston Churchill, injected 2 million pounds into the company and in doing so acquired a majority ownership (51 percent of total shares). Thus in effect APOC controlled all oil operations in Iran and the interest of the British government and APOC became aligned. This partnership made sure that the British government became an important player in the Iranian oil industry, enhancing her sphere of influence in Iran.
During the first few years of APOC's operations a massive infrastructure of oil wells and pipelines were put in place. One of the largest oil refineries in the world (up until the first half of the 20th century) was built in Abadan, which enabled APOC to become a major oil producer in the Persian Gulf region. The main impetus to demand for Iranian oil came when the British Admiralty under Winston Churchill decided to run the British naval fleets on oil instead of coal. This created an important demand for Iranian oil which led to significant increases in oil production and exports especially during the First World War. Oil extraction being merely 5 thousand barrels per day in 1913, reached 33 thousand barrels in 1920, and over 115 thousand in 1929. In the early years and up until the mid 1920s the majority of the oil was sold at a discount to the Royal Navy, with whatever remained passed on to consumers in Britain and elsewhere in the world. However, while oil production had increased by 23-fold between 1914 and 1929, the royalties to the Iranian government had increased by less than 5-fold. According to the D'Arcy concession these royalties were calculated as 16 percent of net profits of the company. However, given the massive increase in oil production at the end of the 1920's and with it the soaring profits of APOC, the manner in which Iran's entitlement of net profits were calculated became questionable and Reza Shah raised concerns that APOC was falsifying its accounts (Kinzer 2003). Note that at no point before 1929 did the revenue from APOC exceeded 19 percent of the total Iranian government revenues (Ferrie 1982). Moreover, the share of government revenue from oil exports to the total oil export revenue by APOC was between 5.3 and 6.5 percent over the years 1920--1929, see Table 0. This table also shows that the company's taxes to the British government was larger than the royalties paid to the
5
Iranian government between 1914--1924, while the latter was marginally larger than the former between 1924 and 1929. Employment generating effect of the oil industry was also very limited, and at its peak before nationalization in 1949 amounted to 78,162 Iranian nationals, most of whom were unskilled workers (see Table 14.1 in Bamberg 1994). This figure included both those directly employed by the Company as well as indirectly by contractors working on Company projects. As already noted, the most important customer of APOC in the early years was the British government, which in July 1914 had requested that at least 6 million tons of fuel oil should be supplied to the Admiralty over a 20 year period, with this amount being larger in the event of a war. The Royal Navy received between 66 and 69 percent of APOC's total refined oil during the first World War, but even in 1919 and 1920 had over 53 percent of its total fuel oil supplied by the company (Ferrier 1982). As set out in the D'Arcy concession the oil sold by APOC to the Royal Navy was at a discount and so the benefits of the British government from the Company was much larger than the amount of taxes reported in Table 0. Thus in the period from initial extraction up until 1929, the amount of revenues generated by oil production for the Iranian government was not significant and in most years amounted to less than 19 percent of total Iranian government revenues.
Negotiations to revise the concession of 1901, due to the growing concerns about the way in which Iran's royalties were calculated, took place between the Iranian government and the company throughout 1928--1932, which culminated in Reza Shah cancelling the D'Arcy Concession in 1932. However, in 1933 Reza Shah signed a new agreement which extended the D'Arcy Concession, due to expire in 1961, up to the end of 1993. The new agreement resulted in a reduction of 80 percent of the total area granted for exploration and extraction by the 1901 concession, although APOC would choose the 100,000 square miles that it would keep, see Bamberg (1994). But most importantly royalties were now based on actual volumes (tons of oil produced) rather than profits. Although the agreement took effect from January 1933, the royalties of 1931 and 1932 were recalculated, with the 1931 payment being increased by 4-fold; from £ 306,383 (based on 16 percent of net profits) to £ 1,339,132 (based on volume). For further details see Ferrier (1982). Although, the change in calculation of Iran's royalties from oil production led to a large increase in Iranian oil income between 1930 and 1950, with oil production increasing from 126 to 648 thousand barrels per day, British taxes throughout the period 1940--1950 were more than twice as much as the royalties that were paid to Iran by AIOC as can be seen from Table 0.1
After a series of disputes between the Iranian government and the AIOC during the 1940s, the Iranian oil industry was nationalized in 1951, through a mandate given by the Iranian parliament, Majles, to Prime Minister Mossadegh. The nationalization caused the production of oil, and thus government revenues, to fall dramatically. During the years 1952 and 1953 only 28 thousand barrels per day were produced on average, which was around 4 percent of the level of oil production which was achieved in 1950. Although this was partly due to the lack of technical skills as all British personnel had left the country, the main reason for the large slow down in production was the British government's embargo on Iranian oil and seizure of any oil tanker that tried to do business with the Iranian government.
One of the reasons for the nationalization was that Mossadegh and others felt that profits from the oil industry were not impacting the Iranian economy or the country's development due to the relative small percentage of the total oil revenues that the Iranian government actually received. In a speech to the United Nations Security Council on 15 October 1951, 1In 1935 the APOC was re-named as the Anglo Iranian Oil Company (AIOC),
6
Mossadegh declared that "the petroleum industry has contributed nothing to well-being of the people or to the technological progress or industrial development of my country" (UN 1951). The negotiations between the British and Iranian governments throughout 1951--53 did not result in any concrete progress, and eventually the British could see no way out other than to remove Mossadegh, and accordingly initiated and backed a successful coup against Mossadegh's government financed and organized by CIA in August 1953.2 The end of the Mossadegh era meant that negotiations could open between the new pro-Western Iranian government of Prime Minister Fazlollah Zahedi and the British as well as the Americans. The negotiations resulted in the formation of the 1954 Consortium Agreement which gave the rights of extracting petroleum in the 100,000 square mile area covered by the 1933 Concession to a Consortium of eight European and American companies. 40 percent of the shares of the Consortium was allocated to British Petroleum (BP), which AIOC had been renamed earlier, 14 percent to Royal Dutch Shell, 6 percent to Compagnie Française des Pétroles (CFP), with the remaining 40 percent to be split equally between five American companies (Exxon, Gulf Oil, Mobil, Socony, and Standard Oil of California). Under the new agreement Iran would share the profits from the oil production with the Consortium members on a 50-50 basis, which was the agreement that most Middle Eastern countries had with foreign oil companies, but have no say in the administration of the Consortium, see Europa (2004) and NIOC. In 1955 oil production had increased to 353 thousand barrels per day and by 1959 reached the level of 951 thousands barrels per day, which was 50 percent more than the level of production in the pre-nationalization period.
On the external side, although oil exports formed a large part of total exports (51 percent on average between 1936 and 1959, see Esfahani (2009), due to the royalty system in place, Iran's share of foreign exchange receipts from oil exports was relatively small, and non-oil exports continued to be the dominant factor in balancing Iran's external account.
2.2 1960--1978 As can be seen from Figure 1 oil production increased significantly from 1960 onwards as compared to the earlier period. By 1961 over 1.2 million barrels of oil per day were being produced, which was twice as much as the pre-nationalization peak in 1950 (0.6 million). Oil production increased at a steady rate between 1960 and 1973 and peaked in 1974 at 6 million barrels per day before dropping slightly in the following years before the 1979 Revolution.3 Figure 2 also shows the ratio of total oil export revenues to domestic output, which peaked at 23 percent in 1950 just before nationalization. Despite this, due to the unfavorable terms with the Anglo Iranian Oil Company, only 8.1 percent of the total oil export revenues were actually received by the Iranian government in terms of taxes and royalties (Table 0). However, with the Consortium agreement of 1954, the Iranian government was entitled to 50 percent of the total net profits from oil production, therefore, the significant increase in production during these two decades meant that government revenues from oil exports started to rise significantly and steadily. Consequently, the ratio of oil export revenues to GDP rose to 47 percent by 1974. Therefore, oil's role in the Iranian economy, although muted during 1908--1959, became gradually more and more important between 1960 and 1978. Although significant increases in oil production had been achieved during the 1954-1975 period, this was not the only factor driving the Iranian oil export revenues and domestic output. Another important factor was oil prices. With the foundation of the Organization of the Petroleum Exporting Countries (OPEC) in 1960, oil prices, which had been falling in real
2For an extensive discussion of the coup see Elm (1992), Gasiorowski (1987), Kinzer (2003), and E Pesaran (2011). 3See Pesaran (1985) Iran for a discussion of macroeconomic trends in Iran between 1954 and 1979.
7
terms since 1920, started to stabilize (Figure 3).4 Following the Yom Kippur War, and the decision by the Organisation of Arab Petroleum Exporting Countries (OAPEC) excluding Iraq to introduce production cutbacks as well as an embargo against USA and Netherlands, international oil prices quadrupled in 1973-74. Real oil prices then stabilized over the period 1975 to 1978. Figure 4 shows a close positive relationship between real output and oil revenues. The relationship is particularly strong during the post 1960 period when oil revenues started to rise significantly and were sustained over a prolonged period. The quadrupling of oil prices in 1973--74 presented Iran with a substantial, largely unexpected, increase in oil revenues. A prudent economic management of such large external funds would suggests a gradual and planned infusion of the new oil revenues into the Iranian economy. The remaining funds could have been invested abroad for future use and as a buffer against weak global economic conditions and lower oil prices. Such a policy was discussed in a critical meeting of technocrats and policy makers in Gajereh, but was flatly rejected by the Shah who insisted on spending almost all of the increased oil revenues domestically and over a relatively short period. This resulted in an excessive expansion of aggregate demand, which could not be matched by increased supply, even from imports, due to limited port and road capacities and other infrastructure limitations and bottlenecks. As a result inflation started to rise rapidly, and heavy-handed tactics of the government of arrest and imprisonment of merchants and industrialists only resulted in political and economic alienation without any permanent success at curbing inflation. See, for example Pesaran (1997) Iran. The rapid expansion of the economy also resulted in higher expectations which could not be fulfilled, and amplified the structural weaknesses of the regime. This was one of the major factors behind the mass discontent that erupted in 1977-78 which led to the February 1979 Revolution and the downfall of the Pahlavi regime.
2.3 1979--2010 Upon seizing power, the Provisional Government of Mehdi Bazargan decided to reduce oil production from its height of 6 million barrels to around 4 million barrels per day. Although the revolutionary upheavals and the strikes by oil workers had halted oil production, it was the conscious decision by the Provisional Government to reduce the level of oil production to around 30 percent below its average level over the 1971-78 period. See Isfahani (1996) and Figure 1.5 This was the first time that an Iranian government had managed to control the level of its oil production, and the 1973 agreement between the Consortium and National Iranian Oil Company (NIOC), which bound Iran to production and sales at a discount to the Consortium, was cancelled in March 1979 (see Europa 2004).
During the pre-revolutionary period, the Shah's oil policy was heavily criticized, and in mass demonstrations people called for the conservation of the country's oil resources. The high levels of oil production were seen as responsible for waste, corruption and the relative decline of the agricultural sector (Hakimian 1988). It was argued that oil production and income need to be reduced substantially if the agricultural and industrial sectors were to flourish. As it turned out, the invasion of Iran by Iraq in 1980, reduced oil production and refining capacity significantly. Technical difficulties and the start of the war with Iraq made the initial cut in production inspired by revolutionary ideals a permanent feature and production did not reach the post-revolution target of 4 million barrels per day until much later in 2003. The following
4For an early history of the OPEC see Rouhani (1971) and for an extensive survey of different models emphasizing the oil market as being non-competitive and the role of the OPEC as a price maker during this period see Cremer (1991). 5See also Karshenas2005, 2007 and Pesaran (2000) Iran for a discussion of economic trends and macroeconomic policies in the post-revolutionary Iran.

8
eight years of war, meant that Iran had to live with a much reduced levels of oil production, by choice initially and by circumstances as the result of the war. However, despite these production cutbacks oil revenues continued to form a large part of the country's foreign exchange receipts and government revenues. The ratio of oil exports to domestic output declined somewhat and fluctuated around 12 percent between 1979 and 1988 before starting to rise slowly with the end of the Iran-Iraq war (Figure 2). The 1979 revolution, the eight year Iran-Iraq war, and the US economic sanctions imposed on Iran, whilst reducing Iran's oil revenues also resulted in falling or at best stagnant real output, which has taken almost 30 years to return to its pre-revolution levels (Figure 4).6
Although agricultural production increased after the revolution, agricultural exports did not increase significantly. This was mainly due to the rapid population growth of the 1980s, which meant that most of the increased agricultural production was absorbed by the higher domestic demand for food. As a result, the role of oil exports and food imports in the Iranian economy remained as high as they had been before the revolution.
Looking at Figure 5a we see that in nominal terms oil export revenues per capita, having dropped significantly after the revolution and during the eight years of war, has been increasing rapidly since 2003. Having peaked at $1209 in 2008, it fell to around $795 in 2010. However, correcting for inflation we see that in real terms oil export revenues per capita peaked in 1974 at $2558 ( $2009 in US dollars), whilst in 2010 it had fallen to $715, or about 40 percent lower than its peak before the revolution (Figure 5b). Therefore, although the total amount of export revenues has increased over time, this is not so once the effects of rising population is taken into account. Figure 5b also shows the relative importance of oil in the Iranian economy since 1913. Taking into account the percentage of total oil export revenues that the Iranian government actually received in royalties and taxes (Table 1), oil export revenues per capita was not more than $25 before 1954 and well below $85 after the Consortium agreement in 1954, which significantly increased Iran's take of profits from oil production. There is a clear divide between the period before and after 1960, and it is from 1960 onwards that oil started to play a significant role in the Iranian economy.
A further factor which had a major impact on Iran's oil export revenues was introduced in early 1970s when oil prices were no longer administratively determined by the so-called `Seven Sisters',7 and begun to be determined in international markets. This in turn introduced a significant degree of volatility in prices, as compared to the remarkable stability of oil prices during the earlier periods, particularly in the 1960s (Figure 3).
To summarize, although oil has been produced in Iran for over 100 years, the importance of oil in the development of the Iranian economy had been relatively small up until the 1960s (Table 1). The surge in oil prices in 1970s and the Shah's insistence on injecting almost all of the increased oil revenues into the economy further enhanced the country's dependence on oil income. This increased dependence coincided with a higher volatility of international oil prices. The effects of price volatility on oil revenues were further accentuated due to the volatile effects of revolution, war, and economic sanctions on oil production and exports. As a result the Iranian economy is faced with the problem of how to deal with substantial but highly volatile oil revenues. In the rest of this paper we argue that it is the volatility in oil
6 Karshenas (2005) also show that the technological gap between Iran and the rest of the world (Korea, Malaysia, and Turkey) has widened since 1979. 7Anglo-Persian Oil (British Petroleum), Gulf Oil, Royal Dutch Shell, Standard Oil of California (Socal), Standard Oil of New Jersey (Esso), Standard Oil of New York (Socony), and Texaco.
9
export revenues and governments' inappropriate economic and political responses to these volatilities which is the curse and not the abundance of revenues from oil exports in itself.
3. Resource Abundance and Growth Most papers in the growth literature do not include major oil exporting economies in their cross-country empirical analysis. The literature that specifically deals with resource abundant economies tends to focus on short-term effects of unexpected gains that flow from the resource discovery, which are viewed as `intrinsically temporary' (Ploeg 2009). In this section we provide an overview of three prominent strands of the resource curse literature and examine their relevance to our understanding of the Iranian economy.
3.1 The Dutch Disease A number of early studies considered the macroeconomic effects of the resource discovery and focussed on the `Dutch disease' phenomenon first experienced in Netherlands after the large, but short-lived, discovery of gas in the 1960s. The Dutch disease states that an exogenous unexpected increase in foreign exchange revenues from the resource discovery will result in a real exchange rate appreciation and a fall in output and employment of the non-resource traded goods sector, often manufacturing. Therefore, discovering natural resources is viewed as a curse for economic development. See, for example, Corden (1982), Krugman (1987), and Neary (1986) among others. However, the Dutch disease by itself need not have adverse long-run implications for the economy as a whole. One would expect the economy to re-adjust once the revenues from the resource are diminished or vanish altogether, unless there are important non-convexities or imperfections in the economy. For example, if the manufacturing sector is subject to economies of scale or learning by doing, the loss of manufacturing capacity will be very costly to reverse.
Figure 6 shows the relationship between the evolution of real oil prices and real exchange rate over the period 1945--2010. Note that since the exchange rate is measured in terms of the number of rials per US dollar, a rise (fall) in the real exchange rate series indicates real depreciation (appreciation). The relationship between the two series is quite complicated. They tend to move in opposite directions in the short run, but not over the long run. There are also periods that the two series are basically flat. For example, over the period 1963--1973, when GDP per capita growth rate averaged 8.2 percent per annum (Figure 4) coupled with low levels of inflation, the real exchange rate and oil prices did not change much. However, with the quadrupling of oil prices in 1973--74, while the Iranian oil revenues were rising in real terms (Figure 5b), the real exchange rate also started to appreciate. This process continued until the start of the Iran-Iraq war in 1980 after which oil prices started to fall with the real exchange rate depreciating. Figure 6 also shows that the real exchange rate appreciated with the oil price boom in 2003 and the subsequent oil price increases. In short, whilst the Dutch disease theory seems to hold in the short run, over the course of a given business cycle, the same cannot be said about the secular trends in the real oil prices and real exchange rates. Seen from the long-term perspective both series are trending upward over the whole period from 1945 to 2010. This is contrary to the prediction of the theory, which is more appropriate in the short run. The secular trend in the real exchange rate is determined by many factors beside the price of natural resources. For instance, political factors influence the way oil revenues are spent in the economy, whether the revenues are used for consumption or investment, and the management of the economy in general. In particular, policy responses to the volatile nature of oil prices seem to play an important role in this process. The Dutch disease phenomenon is applicable to economies that have been subject to sudden unexpected income flows from resource discoveries that are temporary and are not expected to last that long. It is less relevant to economies such as Iran, where oil income has been, and

10
is expected, to be an important feature of the economy for a long period to come. As we have seen, since 1960 oil has formed a large part of government finances and country's foreign exchange reserves. Furthermore, even after 100 years of exploration and production, current estimated reserve-to-extraction ratio in Iran suggests a further 87 years of oil production. In addition, Iran has the second largest natural gas reserves after Russia, around 60 percent of which is yet to be developed.8 Although, it is clear that Iran's oil and gas reserves will be exhausted eventually, this is likely to take place over a relatively long period. In fact over the past two decades, even with low oil prices between 1990--2002, the ratio of Iran's oil export revenues to GDP has been on average 19 percent (Figure 2). Of course, Iran is not unique in this regard. As Figure 7 shows most other Organization of the Petroleum Exporting Countries such as Saudi Arabia, Venezuela, Nigeria, Algeria, United Arab Emirates and Kuwait, and a few countries outside OPEC such as Norway and Russia have similar oil income GDP ratios that have remained relatively stable (and in some cases have even been rising as in Norway). Therefore, there is little evidence to suggest that in these economies oil income will be diminishing any time soon.
3.2 The Resource Curse According to the resource curse hypothesis, resource rich countries perform poorly when compared to
countries which are not endowed with oil, natural gas, minerals and other non-renewable resources. Therefore, resource abundance is believed to be an important determinant of economic failure, which implies that oil abundance is a curse and not a blessing. Empirical support for the resource curse was originally provided by Sachs (1995) who showed the existence of a negative relationship between real GDP growth per capita and different measures of resource abundance, such as the ratio of resource exports to GDP. This finding is clearly paradoxical and has led to a growing theoretical and empirical literature.
However, the empirical evidence on the resource curse paradox is rather mixed. Most papers in the literature tend to follow Sachs and Warner's cross-sectional specification but try new measures for the resource dependence/abundance variable. See, for example, Rodriguez (1999), Gylfason (1999), and Bulte (2005). The results could be quite sensitive to the measure of resource abundance employed. Sachs (1995), for instance, use the ratio of primary-product exports to GDP in the initial period as a measure of resource abundance. But as pointed out by Brunnschweiler et al. (2008), this ratio measures resource dependence rather than resource abundance. The latter should be introduced in the growth regressions as the stock or the flow of natural resources. In their study, Brunnschweiler et al.(2008) argue that the evidence in favour of the resource curse hypothesis is non-existent or at best weak, if the correct measure of resource abundance is used. They also show that while resource dependence, when instrumented in growth regressions, does not affect growth, resource abundance in fact positively affects economic growth.
There are also a number of other reasons why the econometric evidence on the negative effects of resource abundance on output growth might be questioned. Firstly, the literature relies primarily on a cross-sectional approach to test the resource curse hypothesis, and as such does not fully take account of the time dimension of the data. Secondly, a cross-sectional growth regression augmented with the resource abundance variable could suffer from endogeneity and omitted variable problems, and this is perhaps the most important reason for being skeptical about the econometric studies suggesting a positive or negative association between resource abundance and growth. For example, Alexeev (2009) shows evidence against the resource curse hypothesis by considering a few additional regressors, such as exogenous geographical factors.
In addition, even when panel data techniques are used most studies make use of homogeneous panel data models, such as fixed and random effects estimators, the instrumental variable (IV) technique proposed by Anderson (1981,1982), and the generalized methods of moments (GMM) model of Arellano (1991,1995), among others.9 While homogeneous panel data models allow the intercepts to differ across countries all slope parameters are constrained to be the same. Therefore, a high degree of homogeneity is still imposed. As discussed in Pesaran (1995), the problem with these dynamic panel data techniques, when applied to testing growth effects, is that they can produce inconsistent and potentially very misleading estimates of the average values of the parameters, since growth regressions typically exhibit a substantial degree of cross-sectional heterogeneity.
8See, for example, Amuzegar (2008) and British Petroleum Statistical Review of World Energy. 9For a comprehensive survey of the econometric methods employed in the growth literature, and some of their shortcomings, see Durlauf (2005,2009).
11
In view of the above considerations Cavalcanti (2011b) adopt the common correlated effects (CCE) estimator recently developed in Pesaran (2006) and estimate dynamic heterogeneous panel data models with interactive effects. The approach takes account of the institutional and geographical differences that exist across countries and, unlike the standard FE estimator, allows the coefficients of the growth regressions to differ across countries. The CCE estimator also takes account of error cross-sectional dependence (again ignored by the FE estimator) by augmenting the growth regressions with cross-sectional averages of the variables included in the regressions.10 Such multi-factor processes have been used in the literature to model the effects of unobserved factors such as technological innovation, political and institutional developments that are difficult to measure, and factors that affect the degree of openness of economies. It is clearly important that such effects are also taken into account in estimation of growth regressions; otherwise the estimates of the effects of resource abundance on growth could be seriously biased.
Cavalcanti (2011b) base their analysis on a panel of 53 countries (including Iran) over the period 1980--2006, and estimate the heterogeneous growth regressions by the CCE estimator. To check for the robustness of their results they consider three different proxies measuring resource abundance, namely the real value of oil production, the rent component of oil income, and oil reserves. They conclude that oil abundance is in fact a blessing and not a curse, in the long run as well as in the short run, and challenge the consensus view that oil abundance affects economic growth negatively.11
The positive effect of resource abundance on development and growth is also supported by Arezki (2007), Cavalcanti (2011), Esfahani (2009), Leong (2011), and Ploeg (2010). Therefore, using appropriate econometric techniques the recent empirical literature seems to provide evidence against the conventional resource curse literature, which argues for an unconditional negative relationship between resource income and growth.
3.3 Political Economy Considerations
Although the growth enhancing effect of oil income is now generally accepted, the volatility of oil
income presents important policy challenges with political economy considerations that must be taken into account. As was noted earlier, Iran's revenues form oil exports have been even more volatile than international oil prices, due to revolution, war and economic sanctions. Such volatilities tend to affect economic growth negatively. To deal with the adverse effects of oil price volatility, some of the major oil exporters have set up oil stabilization or sovereign wealth funds. The success of such funds depends on the fund's political ownership (management and right of access), and the mechanisms governing the allocation of the proceeds from the fund to the government and other political bodies. In the case of Iran an Oil Stabilization Fund was set up under Khatami's Presidency but was closed down by President Ahmadinejad in favour of a National Development Fund which shifted the political power from the Parliament to the President.
Another important political economy consideration is rent-seeking activities that are primarily initiated due to the existence of large oil incomes. In the case of oil exporting countries the problem of rent seeking has been discussed by Mahdavi (1970), Amuzegar (1972), and Pesaran (1982b). The accrual of large income from oil exports to the government also reduces government accountability, mainly because the government does not need to rely on taxation, tend to induce government intervention in the economy motivated more by short-term crises rather than long-term development perspectives, and encourages and sustains populists' policies longer than would have otherwise been possible. Finally, large oil revenues can promote dictatorship and lead to a system of dependent capitalism where the economic activities of the private sector is also dependent on active government support (Pesaran 1982). State's dependence on oil revenues in turn makes it politically less accountable.
The more recent literature on resource abundance and economic growth focusses on some of these political economy considerations and argues that large windfalls from oil and other resources create incentives for rent-seeking activities that involve corruption (Mauro 1995 and Leite 1999), voracity (Lane 1996 and Tornell 1999), and possibly civil conflicts (Collier 2004). Some of these considerations have been recently formalized by Caselli (2009), with a recent survey provided in Ploeg (2009).
A number of recent empirical work have also focused on the role of institutions. Mehlum (2006) and Beland (2009), using a cross-sectional approach, show that the impact of natural resources on growth and development depends primarily on institutions, while Boschini (2007) illustrate that the type of natural resources possessed is also an important factor. These authors argue that controlling for institutional quality and including an interaction term between institutional quality and resource abundance a threshold effect arises. This suggests there are levels of institutional quality above which resource abundance becomes growth enhancing.
Political economy and institutional factors are clearly very important for a proper evaluation of the effects of oil income on the Iranian economy. However, an empirical investigation of these issues is 10Different forms of cross-section dependence are discussed and formally defined in Pesaran (2007). 11See also Cavalcanti (2011).
12
complicated. It is difficult to obtain accurate measurements of rent-seeking activities and institutional quality, and most attempts made in the literature in this regard tend to use proxy measures that are highly correlated with oil revenues, thus making it impossible to separate the possible positive effects of oil income on growth from the negative effects of rent-seeking and poor institutional quality. An alternative approach that we follow in the rest of the paper is to consider the overall macroeconomic effects of oil income and domestic inflation on real output in the long run. In a well managed economy we do not expect inflation to have a significant impact on real output in the long run. Inflation tends to have a positive effect on real output in the short run (the Phillips curve effect), but not in the long run where output is determined by technological and endowment factors. By focussing on the long-run effects of inflation on real output we hope to provide some indirect evidence on the importance of political economy factors in the case of Iran.
4 Macro-Econometric Evidence We begin with an investigation of the main macroeconomic trends of the Iranian economy using data on real output, consumption, oil export revenues and inflation. Using annual data over the period 1937--2010 we investigate the historical relationships that exist between these variables. We then briefly outline the growth model for major oil exporting economies developed in Esfahani (2012), and discuss the results of a quarterly macro-econometric model for Iran estimated over the period 1979Q1- 2006Q4. Interestingly enough, the econometric results in Section 4.2 are in line with the historical analysis that follows.
4.1 Macroeconomic Trends 1937--2010 Figure 8 depicts the growth rate of per capita real output, private consumption, and oil export revenues, from which we see that due to the revolution and the Iran-Iraq war both consumption and GDP have been quite volatile. However, in comparison with the oil revenue volatility experienced in Iran, these two variables seem relatively stable. Moreover, notice that as previously mentioned oil revenues are much more volatile than real output and consumption.
Table 2 shows the growth rates of per capita real output and real oil export revenues over different sub-periods. We observe that since 1937 the growth rate of oil export revenues
(denoted by og ) has been higher than that of real output (
yg ), with the two series being significantly positively correlated, with a correlation coefficient of around 40% computed over the period 1960-2010 (see also Figure 4). Moreover, as to be expected, oil export revenues show a much higher degree of volatility than real output. But it is important to bear in mind that the relationship between real output and oil exports is not stable and changes across the different sub-periods. For instance, over the period 1960--1978 real output per capita grew on average by 5.48 percent per annum, as compared to oil revenues which showed a much higher annual average growth rate of around 12.3 percent. These very high growth rates are to be contrasted with those of the post-revolutionary experience where output grew on average by 0.16 percent per annum, as compared to the negative growth of oil revenues of around -2.84 percent per annum over the period 1979--1988. The post-war picture is much more encouraging with output and real oil revenues rising on average by 2.2 and 3.63 percent per annum, respectively. Despite these differences across the different sub-periods, the overall picture points to oil revenues being an important driver of the Iranian economy.
Consider now the relationship between GDP growth and inflation as depicted in Figure 9. It is clear that, in general, these two series tend to move in opposite directions. We also observe that over the whole period (1937--2010) inflation has been quite high at 12.69 percent per annum, whilst output growth averaged around 4.96 percent per annum (Table 3). Once again the high growth years of 1960--1978 proved to be an exception, where high output growth in fact coincided with a relatively low inflation. The average annual rate of inflation over this sub-period was less than half of the inflation rate experienced in all other sub-periods under
13
consideration. More recent evidence also corroborate a negative relationship between inflation and output growth.12
The negative association between the two series is documented in Table 3. Over the full sample period the correlation coefficient between the two series amounted to -0.39, with the negative relationship between output growth and inflation being apparent in all sub-periods. This is a difficult result to explain using standard economic theory, which as noted earlier predicts no long-run relationship between output growth and inflation. The only theoretically justified relationship between output growth and inflation is for a positive (and not a negative) short-term relation, known as the Phillips curve. As already argued, we view the negative relationship between growth and inflation as an indication of rent-seeking activities, poor institutional arrangements for dealing with oil revenue volatility, and general economic mismanagement. Although, it is beyond the scope of the present paper to identify the relative contributions of these factors to the observed negative relationship between growth and inflation, we nevertheless consider our analysis as a first step towards this aim.
There is also the concern that the correlation analysis of the type offered above, namely a positive relationship between output growth and oil revenues and a negative relationship between output growth and inflation, might be spurious or could be due to other factors omitted from our discussion. Furthermore, it is unclear if such correlations are stable and/or statistically significant once other determinants of output growth such as technological innovation are also taken into account. In what follows we consider these issues using a simple quarterly econometric model developed for the Iranian economy by Esfahani (2009).
4.2 A Macro-econometric Model for the Iranian Economy As outlined in Section 3, most macroeconomic analysis of oil revenues tend to take a short-term perspective. They usually focus on the effects of oil revenues on the real exchange rate (Dutch disease) and government budget expansion, thus failing to consider the effects of oil revenues on long-run growth. This approach makes sense for countries with a limited amount of oil reserves, but not for major oil exporting countries such as Iran, Iraq and Saudi Arabia for which oil income should be treated more as a part of the steady state growth outcome and not as a transient state. To this end Esfahani (2012) developed a long-run output relation for a major oil exporting economies where the oil income to output ratio is expected to remain high over a prolonged period. The stochastic growth model developed in Binder (1999) is extended to allow for the possibility that a certain fraction of oil export revenues is invested in the domestic economy via the capital accumulation channel. The long-run output equation including oil exports is then given by:
,)(= ,321 tyyyttttt tcxopeyy (1)
where ty ( ty ) is the logarithm of real domestic (foreign) output, te is the log of the nominal
exchange rate, tp is the logarithm of the domestic Consumer Price Index (CPI), txo is oil export revenue in US dollars, yc is a fixed constant, and ty, is a mean zero stationary process, which represents the error correction term of the long-run output equation. As discussed in Section 2.1 in Esfahani (2012), the coefficient of the variables in equation (1) have further restrictions imposed on them based on economic theory, namely:
12See also the following articles in Farsi by M. H. Pesaran arguing that controlling the high inflation rate must be one of the most important objectives for the Iranian economy: "Inflation: The Most Important Issue for the Iranian Economy," Jam-e Jam, May 20, 2012 and "One Needs to Find the Underlying Causes of Exchange Rate Volatility," Donya-e Eqtesad, July 2, 2012.
14
),)((1=and,==),(1= 3221 nny (2)
where is the share of capital in output and measures the extent to which foreign technology is diffused and adapted successfully by the domestic economy in the long run. In this relationship,
ty , acts as a proxy for global technological progress. The diffusion of technology is at par with the rest of the world if 1= , whilst a value of below unity suggests inefficiency that prevents the adoption of best practice techniques, possibly due to rent-seeking activities and general economic mismanagement. Note that the empirical literature which is mainly based on cross-section regressions (see Section 3) most likely captures short-term deviations from the steady states and in view of the substantial heterogeneity that exists across countries can be quite misleading, particularly as far as the identification of is concerned, which most likely could differ across countries.
There is a need to distinguish between two cases where the growth of oil income, og , is less than the natural growth rate (the sum of the population growth, n , and the growth of technical progress, g ) and when nggo . Under the former, the effects of oil income on the economy's steady growth rate will vanish eventually. In such a case, we have =1 and
0== 32 . For most of the resource abundant economies, where nggo < , their steady state growth rates cannot exceed that of the rest of the world unless 1> . However, when
nggo , oil income enters the long-run output equation with a coefficient which is equal to the share of capital if it is further assumed that the underlying production technology can be represented as a Cobb-Douglas production function. In this case we have == 32 .
Esfahani (2009) examine the empirical validity of the long-run output equation (1) for the Iranian economy by incorporating it into a vector autoregressive error correction model (VECX*) augmented with foreign output,
ty , treated as a weakly exogenous variable.13 The foreign output variable is constructed as a weighted average of the log of real output of Iran's trading partners with the weights based on the relative size of their trade with Iran (exports plus imports). The domestic variables included in the model are real GDP, the rate of inflation computed using the consumer price index (CPI); the official and `free' market exchange rates; and money and quasi money. All variables except for the inflation rate are log-transformed. The Iranian VECX* model is estimated using quarterly observations over the period 1979Q1--2006Q4. The estimates support the existence of a long-run relation between domestic output, foreign output, and real oil exports. Therefore, as predicted by the theory, oil exports contribute to real income through capital accumulation. The estimates also confirm that Iran has experienced a similar rate of technological progress as its trading partners over the past three decades ( 1= ) and that the share of capital ( ) is about 0.26, which is in line with the estimates obtained in recent studies for oil exporting economics, see for instance Cavalcanti (2011). However, the estimates also suggest that inflation has a statistically significant negative effect on real output even in the long-run, and establishes that the negative effect of inflation on output growth observed using the simple correlation techniques cannot be explained away by allowing for other factors such as money, exchange rates, and technology. The econometric results provide further evidence of the inherent inefficiencies in the Iranian economy that appear as high and sustained levels of inflation.
13See Esfahani (2009) for a review of earlier work on macroeconomic models for Iran.

15
The above results seem to be reasonably robust regardless of how foreign output is constructed, what measure of the exchange rate is used, and whether a dummy variable for revolution and war (over the period 1979Q1--1988Q2) is included in the model. The historical analysis in Section 4.1 and the econometric results in Esfahani (2009) are surprisingly in line both when it comes to the growth enhancing effects of oil income and the growth dampening effects of high inflation. Esfahani (2009) illustrate the impact of oil export revenues on the Iranian economy, by considering the Generalized Impulse Response Functions of a unit shock (equal to one standard error) to oil exports. Figure 10 shows that the effects of the shock work themselves through the economy within 2 years. As such the Iranian economy adjusts very quickly to shocks when compared to the response rates of other economies, especially developed ones. This seems to be due to the limitations of Iran's financial markets that restrict expenditure smoothing options and thereby cause the economy to move up and down quickly as external and internal conditions change. The figures clearly show that a positive unit shock to oil exports significantly increases inflation, strengthens the real exchange rate ( tt pe ), and increases real output significantly (by 3.2 percent), but its effect on real money balances, whilst positive, is not statistically significant. The real exchange rate appreciation of around 7.6 percent in the aftermath of the positive shock to oil exports can be viewed as supporting the Dutch disease, although here the rise in the real exchange rate is in fact accompanied with a rise in real output, which does not sit comfortably with the view of the Dutch disease as a resource curse.
Esfahani et al. (2012a) also tested the empirical validity of the long-run theory on eight other major oil exporting economies, with a variety of development experiences and political systems, showing that the long-run output equation (1) applies equally to OPEC (Kuwait, Libya, Nigeria, Saudi Arabia, and Venezuela), former OPEC (Indonesia), and OECD (Mexico and Norway) oil exporters. For most OPEC members, not surprisingly, the long-run estimates and short-run dynamics are very close to the ones obtained for Iran. Therefore, the results indicate that oil abundance by itself is not a curse.
5. Oil Revenue Volatility and Economic Performance The above discussion and in particular the empirical analysis in Esfahani (2009) strongly suggest that overall oil income has been a blessing for the growth and development of the Iranian economy. But the positive influence of oil incomes have often been counteracted by the adverse effects of excessive volatility of oil revenues and the government's inappropriate responses to it. To investigate the impact of oil price volatility on the Iranian economy we follow the finance literature and use a measure of realized oil price volatility. See, for instance, Andersen (2001,2003) and Barndorff-Nielsen (2002, 2004). In the finance literature intra-daily data are generally used to compute daily realized volatilities for asset returns. Here we apply the same idea and calculate annual volatility using monthly changes in oil prices.14 Our measure of realized oil price volatility for year t is then given by:
2,12
1==ot
ot
ot ggvol (3)
where )(ln= ,,o
tot Pg , o
tot gg ,
12
1=121= , and o
tg , denotes the rate of change in oil prices
otP , during month in year t . The same method is also used to calculate annual volatilities
14When available, weekly or daily observations can be used to construct more accurate annual realized volatility measures. But for the present analysis we do not expect the results to be much affected if instead of monthly data we used weekly or daily observations.

16
of oil production and oil revenues. The three series are plotted in Figure 11 from which we see that oil price volatility was rather small before 1970. This is not surprising as during this period oil prices were largely regulated by the major international oil companies. Substantial volatility was first experienced due to the first and second oil price shocks after which volatility continued to remain a major feature of the oil markets. Moreover, with the OPEC pricing system collapsing in 1985, crude oil prices were instead determined on international markets, which resulted in further price volatility.
However, the volatility of oil prices was not the only factor impacting the Iranian economy. The volatility of oil production and exports were also important features of the post 1970 period. In fact, as can be seen from our account of the theoretical growth model for major oil exporting economies, it is the volatility of export revenues that matters, and seen from this perspective, it is the combined effects of price and quantity volatilities that should be considered. Figure 11 shows that although there is a strong co-movement between the volatilities of oil prices and production, there are also some important short-term deviations. For instance, production was more volatile between the first oil price shock and the end of the Iran-Iraq war, while oil prices have been more volatile since the late 1980s. This is also clearly illustrated in Table 4, which provides average realized volatilities of the three series calculated over four sub-periods. In most economies oil price volatility and production/export revenue volatility are very similar. The reason for this is that production and exports usually remain reasonably steady over time, with some small year on year changes. However, due to the political developments in Iran since 1978 the Iranian oil industry has experienced several supply disruptions and restrictions. First, during the revolution production was halted due to strike by oil workers. Second, as noted earlier the post revolutionary regime almost halved the rate of oil production with the aim of stimulating the agricultural sector. Finally, the Iran-Iraq war meant that exports during certain periods were not possible. Also, sanctions by the US, and more recently by the European Union, have further added to the volatility of Iran's oil exports, and hence oil revenues.15
Figure 11 and Table 4 both show that starting from 1973, Iran's oil revenues have been extremely volatile, and much more volatile than the volatility of international oil prices.16 Quantitatively, over the period 1960--2010 the volatility of Iran's oil revenues was around 45.3 percent per annum, as compared to the oil price volatility of 20.6 percent per annum over the same period, see Table 4. This volatility differential, although higher during the revolution and the war period (1979--1988), has declined significantly since 1988. Over the period 1988--2010, volatility of Iran's oil revenues was around 35.3 percent per annum, as compared to the volatility of oil prices of 27.9 percent per annum. Although oil revenue volatility has dropped since 1988, it still remains well above 35 percent. This is to be compared with the volatility in private consumption, which was below 7 percent between 1960 and 2007 and dropped even lower post 1988, averaging 3.6 percent.17 Therefore, oil revenue volatility is around 10 times that of consumption volatility. Comparing the results in Tables 2 and 4 we notice that while there is a positive correlation between the growth rates of real GDP and oil export revenues, it is also the case that the sub-periods with higher growth coincide with those of lower oil revenue volatility. To examine 15See also E. Pesaran (2012) for a discussion on the economic impact of the most recent sanctions, as well as the article in Farsi by M. H. Pesaran: "Economic Sanctions and the 'Market Economy,'" Donya-e Eqtesad November 17, 2012. 16Figure 10 also shows that, except for the first oil shock in 1974, the realized volatilities of oil revenues and production are very similar over the period 1957-1985. This is partly due to the fact that oil prices did not vary much before 1973, and even though oil price volatility started to increase after the first oil price shock, the volatility of oil revenues was much more affected by production rather than price volatility. 17As monthly data is not available for consumption, we calculated the annualised consumption volatility using quarterly observations.

17
whether oil revenue volatility is a curse for Iran we plot annual observations on real output per capita growth against oil revenue volatility for the period 1957--2010. Figure 12 shows a clear negative relationship between the two variables, with a correlation of -0.62. We also observe that there is a positive relationship between output and oil revenue growth, also evident in Figure 4 and Table 2. The existence of a negative relationship between commodity price volatility and growth has also been documented in Leong (2011) and Cavalcanti (2011). Using a panel of 62 primary commodity abundant countries (including Iran), these papers argue that it is the commodity price volatility, rather than resource abundance as such, that drives the "resource curse" paradox.
Therefore, while abundance of oil in itself is growth enhancing there are two main problems with this oil income for the Iranian economy: one is the volatility of oil revenues, and the second is that it accrues to the government. Because revenues are highly volatile their management needs appropriate institutions and political arrangements so that the domestic expenditures from oil revenues become less volatile. The fact that oil revenues accrue to the government tends to make the government less immediately accountable for their policies and actions, and increases incentives for rent-seeking activities as discussed in Section 3.3. However, even if oil income did not accrue to the government, or the government was politically accountable (as is the case in Norway), excessive revenue volatility might still be a problem. Therefore, while democracy and accountability are both important, it is also crucial to have a system in place that deals with adverse effects of excess oil revenue volatility. Moreover, as already noted, in the case of Iran the unexpected changes in oil revenues tend to work themselves through the economy rather rapidly. See, for instance, Figure 10 that shows how quickly the effects of an oil export revenue shock dies out. This is mainly due to the relative under-development of money and capital markets in Iran, and the country's relative isolation from the world economy and finance community. Because of the lack of shock absorbers, oil revenue volatility has an even bigger impact on the Iranian economy, which makes having a policy of how to govern the country in terms of dealing with this volatility even more important. The establishment of the Oil Stabilization Fund (OSF) in Iran, which was approved by the Iranian parliament in 2000, was an important step towards managing the volatility curse with the aim of insulating the economy from fluctuations in oil prices. However, the adoption of populist policies since the start of the Ahmadinejad presidency in 2005 resulted in the Fund being used during good times when oil prices were rising, and was thus rendered ineffective as an instrument of stabilization when oil prices started to collapse in 2009. The OSF was replaced by the National Development Fund (NDF) in 2011, but it is not clear whether the NDF is going to be any more effective. Therefore, good institutions and accountable governments are a prerequisite to creating a mechanism of short-term management of oil revenue volatility through stabilization funds. However, there needs to be further checks and balances on how oil incomes are spent and how the OSF is managed.
Finally, it is important to note that the lack of an appropriate mechanism for the management of oil revenue volatility can also result in excessive exchange rate volatility, as witnessed in Iran particularly since the Revolution. We have seen periods of relative stability in the rate of rial to US dollar punctuated with large devaluations of rial, generally reflecting the differential levels of inflation in Iran relative to the rest of the world. We have also seen that high inflation and excess oil revenue volatility both affect output growth negatively, which harms the competitiveness of the Iranian economy domestically (in the case of imports) and abroad (in the case of non-oil exports). But such losses in competitiveness do not show up in the rate of rial to dollar immediately, and their effects work gradually and are often triggered by some exogenous shock, such as major domestic political developments, military threats, or
18
the announcement of new sanctions. The establishment of an effective oil revenue stabilization fund can therefore also play a crucial role in the stabilization of the rial, which is a worthy objective in its own right.
6. Concluding Remarks The historical data presented in this paper show that in terms of maintaining and sustaining GDP growth, oil income has been a blessing. But it has also been a curse in inducing excess inflation, exchange rate volatility and macro-economic inefficiencies, with adverse political and institutional implications. The econometric model of the Iranian economy, as developed in Esfahani (2009), supports these results and quantifies the positive effects of oil income on growth in the long run. However, it also points to certain inefficiencies in the demand management of the economy that manifest themselves as a significantly negative effect of inflation on real output. The estimates also suggest a rather rapid response of the economy to shocks, which could be due to the relatively underdeveloped nature of the money and capital markets in Iran. Such markets tend to act as shock absorbers in developed economies during normal conditions although, as we have seen recently, they can also act as shock magnifiers during crisis periods.
We also illustrated the adverse effects of oil revenue volatility on growth in Iran and showed that not only oil price volatility, but also volatility in production and exports has remained high over the past fifty years. The question is whether we can avoid some of the undesirable consequences of oil revenue volatility. Norway's experience suggests that it might be possible within a democratic political system with good institutions and an accountable government. The Norwegian Government Pension Fund, which aims to manage petroleum revenues in the long term is an example of how a stabilization and sovereign wealth fund can help offset not only the volatility of oil revenues but also help to smooth out government expenditures.
Appropriate policy responses are needed to deal with the large swings in oil revenues that Iran has been facing, particularly over the past three decades. In this regard it is crucial that large swings in government expenditures be avoided, and government finances and private credit expansion be set at levels that are conducive to relatively low rates of inflation. Once inflation is brought under control and it is seen by the public as a credible outcome, we would expect greater private investment, as well as a more stable currency market with reduced possibilities for rent-seeking activities.
19
References Alexeev, M. and R. Conrad (2009). The Elusive Curse of Oil. The Review of Economics and
Statistics 91(3), 586-598.
Amuzegar, J. (2008). Iran’s Oil as a Blessing and a Curse. The Brown Journal of World Affairs 15, 46-61.
Amuzegar, J. and M. A. Fekrat (1972). Iran: Economic Development Under Dualistic Conditions. University of Chicago Press, Chicago.
Andersen, T. G., T. Bollerslev, F. X. Diebold, and P. Labys (2001). The Distribution of Realized Exchange Rate Volatility. Journal of the American Statistical Association 96, 42-55.
Andersen, T. G., T. Bollerslev, F. X. Diebold, and P. Labys (2003). Modeling and Forecasting Realized Volatility. Econometrica 71 (2), 579-625.
Anderson, T. W. and C. Hsiao (1981). Estimation of Dynamic Models with Error Components. Journal of the American Statistical Association 76(375), 598-606.
Anderson, T. W. and C. Hsiao (1982). Formulation and Estimation of Dynamic Models Using Panel Data. Journal of Econometrics 18(1), 47-82.
Arellano, M. and S. Bond (1991). Some Tests of Specification for Panel Data: Monte Carlo Evidence and an Application to Employment Equations. The Review of Economic Studies 58(2), 277-297.
Arellano, M. and O. Bover (1995). Another Look at the Instrumental Variable Estimation of Error-components Models. Journal of Econometrics 68(1), 29-51.
Arezki, R. and F. van der Ploeg (2007). Can the Natural Resource Curse be Turned into a Blessing? The Role of Trade Policies and Institutions. CEPR Discussion Paper 6225.
Bamberg, J. (1994). The History of the British Petroleum Company, Volume 2: The Anglo-Iranian Years 1928 - 1954. Cambridge University Press, Cambridge.
Barndorff-Nielsen, O. E. and N. Shephard (2002). Estimating Quadratic Variation Using Realized Variance. Journal of Applied Econometrics 17(5), 457-477.
Barndorff-Nielsen, O. E. and N. Shephard (2004). Econometric Analysis of Realized Covariation: High Frequency Based Covariance, Regression, and Correlation in Financial Economics. Econometrica 72(3), pp. 885-925.
Binder, M. and M. Pesaran (1999). Stochastic Growth Models and Their Econometric Implications. Journal of Economic Growth 4, 139-183.
Boschini, A., J. Pettersson, and J. Roine (2007). Resource Curse or Not: A Question of Appropriability. Scandinavian Journal of Economics 109(3), 593-617.
Brunnschweiler, C. N. and E. H. Bulte (2008). The Resource Curse Revisited and Revised: A Tale of Paradoxes and Red Herrings. Journal of Environmental Economics and Management 55(3), 248-264.
Bulte, E. H., R. Damania, and R. T. Deacon (2005). Resource Intensity, Institutions, and Development. World Development 33(7), 1029-1044.
Béland, L.-P. and R. Tiagi (2009). Economic Freedom and the "Resource Curse": An Empirical Analysis. Studies in Mining Policy, Fraser Institute.
Caselli, F. and T. Cunningham (2009). Leader Behavior and the Natural Resource Curse. Oxford Economic Papers 61(4), 628-650.

20
Cavalcanti, T. V. d. V., K. Mohaddes, and M. Raissi (2011a). Growth, Development and Natural Resources: New Evidence Using a Heterogeneous Panel Analysis. The Quarterly Review of Economics and Finance 51(4), 305-318.
Cavalcanti, T. V. d. V., K. Mohaddes, and M. Raissi (2011b). Does Oil Abundance Harm Growth? Applied Economics Letters 18(12), 1181-1184.
Cavalcanti, T. V. d. V., K. Mohaddes, and M. Raissi (2012). Commodity Price Volatility and the Sources of Growth. IMF Working Paper WP/12/12.
Collier, P. and A. Hoeffler (2004). Greed and Grievance in Civil War. Oxford Economic Papers 56, 563-595.
Corden, W. M. and J. P. Neary (1982). Booming Sector and De-Industrialization in a Small Open Economy. The Economic Journal 92 (368), 825-848.
Crémer, J. and D. Salehi-Isfahani (1991). Models of the Oil Market. Harwood Academic Publisher.
Dean, L. E. (2004). Regional Studies of the World: The Middle East and North Africa 2004. Volume 50. Europa Publications, London.
Durlauf, S. N., P. A. Johnson, and J. R. Temple (2005). Chapter 8 Growth Econometrics. Volume 1 of Handbook of Economic Growth, pp. 555 .677. Elsevier.
Durlauf, S. N., P. A. Johnson, and J. R.W. Temple (2009). The Methods of Growth Econometrics. Volume 2 of Palgrave Handbook of Econometrics. Palgrave Macmillan, London.
Elm, M. (1992). Oil, Power, and Principle: Iran.s Oil Nationalization and Its Aftermath. Syracuse University Press, Syracuse, NY.
Esfahani, H. S., K. Mohaddes, and M. H. Pesaran (2012a). An Empirical Growth Model for Major Oil Exporters. Journal of Applied Econometrics, doi: 10.1002/jae.2294.
Esfahani, H. S., K. Mohaddes, and M. H. Pesaran (2013). Oil Exports and the Iranian Economy. The Quarterly Review of Economics and Finance, 53 (3), 221–237.
Esfahani, H. S. and M. H. Pesaran (2009). The Iranian Economy in the Twentieth Century: A Global Perspective. Iranian Studies 42, 177-211.
Ferrier, R. W. (1982). The History of the British Petroleum Company, Volume 1: The Developing Years 1901-1932. Cambridge University Press, Cambridge.
Gasiorowski, M. J. (1987). The 1953 Coup D’etat in Iran. International Journal of Middle East Studies 19(3), 261-286.
Gylfason, T., T. T. Herbertsson, and G. Zoega (1999). A Mixed Blessing. Macroeconomic Dynamics 3(2), 204-225.
Hakimian, H. (1988). The Impact of the 1970s’ Oil Boom on Iranian Agriculture. Journal of Peasant Studies 15(2), 218-237.
Karshenas, M. and H. Hakimian (2005). Oil, Economic Diversification and the Democratic Process in Iran. Iranian Studies 38(1), 67-90.
Karshenas, M. and H. Hakimian (2007). Managing Oil Resources and Economic Diversification in Iran. In H. Katouzian and S. Hossein (Eds.), Iran in the 21st Century: Politics, Economics and Confrontation. Routledge, London.
Kinzer, S. (2003). All the Shah’s Men: An American Coup and the Roots of Middle East Terror. John Wiley & Sons, New Jersey.
21
Krugman, P. (1987). The Narrow Moving Band, the Dutch Disease, and the Competitive Consequences of Mrs. Thatcher: Notes on Trade in the Presence of Dynamic Scale Economies. Journal of Development Economics 27(1-2), 41-55.
Lane, P. R. and A. Tornell (1996). Power, Growth, and the Voracity Effect. Journal of Economic Growth 1, 213-241.
Leite, C. and M. Weidmann (1999). Does Mother Nature Corrupt? Natural Resources, Corruption and Economic Growth. IMF Working Paper WP/99/85.
Leong, W. and K. Mohaddes (2011). Institutions and the Volatility Curse. Cambridge Working Papers in Economics CWPE 1145.
Mahdavi, H. (1970). The Patterns and Problems of Economic Development in Rentier States: The Case of Iran. In M. Cook (Ed.), Studies in the Economic History of the Middle East. Oxford University Press, London.
Mauro, P. (1995). Corruption and Growth. The Quarterly Journal of Economics 110(3), 681.712.
Mehlum, H., K. Moene, and R. Torvik (2006). Institutions and the Resource Curse. The Economic Journal 116, 1-20.
Neary, J. P. and S. J. G. vanWijnbergen (1986). Natural Resources and the Macroeconomy. MIT Press, Cambridge, MA.
NIOC. (2011). The National Iranian Oil Company. Website Accessed: 15 April 2011.
Pesaran, E. (2011). Iran.s Struggle for Economic Independence: Reform and Counter-Reform in the Post-Revolutionary Era. Routledge, London.
Pesaran, E. (2012). Challenges Facing the Iranian Economy. In R. Parsi (Ed.), Iran: A Revolutionary Republic in Transition. European Union Institute for Security Studies, Paris.
Pesaran, M. H. (1982). The System of Dependent Capitalism in Pre- and Post-Revolutionary Iran. International Journal of Middle East Studies 14(4), 501-522.
Pesaran, M. H. (1985). Economic Development and Revolutionary Upheavals in Iran. In H. Afshar (Ed.), Iran: A Revolution in Turmoil. MacMillan, London.
Pesaran, M. H. (1997). The Iranian Economy During the Pahlavi Era. In E. Yarshater (Ed.), Encyclopaedia Iranica, Volume VIII Fascicle 2, Economy V-Education XX, 143-156. Mazda Publishers, Costa Mesa, California.
Pesaran, M. H. (2000). Economic Trends andMacroeconomic Policies in Post-Revolutionary Iran. In P. Alizadeh (Ed.), The Economy of Iran: Dilemmas of an Islamic State. I.B. Tauris, London.
Pesaran, M. H. (2006). Estimation and Inference in Large Heterogeneous Panels with a Multifactor Error Structure. Econometrica 74(4), 967-1012.
Pesaran, M. H. and R. Smith (1995). Estimating Long-run Relationships from Dynamic Heterogeneous Panels. Journal of Econometrics 68(1), 79-113.
Pesaran, M. H. and E. Tosetti (2011). Large Panels with Common Factors and Spatial Correlations. Journal of Econometrics 161(2), 182-202.
Rodriguez, F. and J. D. Sachs (1999). Why Do Resource-Abundant Economies Grow More Slowly? Journal of Economic Growth 4, 277-303.
Rouhani, F. (1979). A History of O.P.E.C. Praeger, New York.
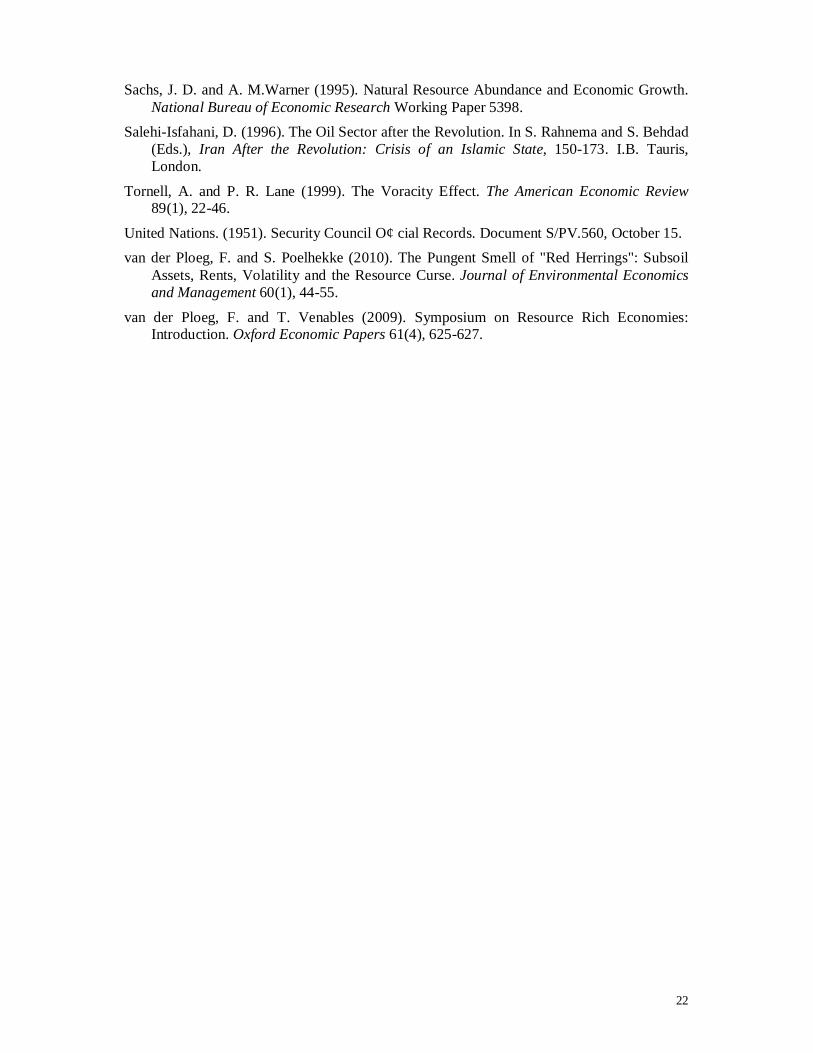
22
Sachs, J. D. and A. M.Warner (1995). Natural Resource Abundance and Economic Growth. National Bureau of Economic Research Working Paper 5398.
Salehi-Isfahani, D. (1996). The Oil Sector after the Revolution. In S. Rahnema and S. Behdad (Eds.), Iran After the Revolution: Crisis of an Islamic State, 150-173. I.B. Tauris, London.
Tornell, A. and P. R. Lane (1999). The Voracity Effect. The American Economic Review 89(1), 22-46.
United Nations. (1951). Security Council O¢ cial Records. Document S/PV.560, October 15. van der Ploeg, F. and S. Poelhekke (2010). The Pungent Smell of "Red Herrings": Subsoil
Assets, Rents, Volatility and the Resource Curse. Journal of Environmental Economics and Management 60(1), 44-55.
van der Ploeg, F. and T. Venables (2009). Symposium on Resource Rich Economies: Introduction. Oxford Economic Papers 61(4), 625-627.
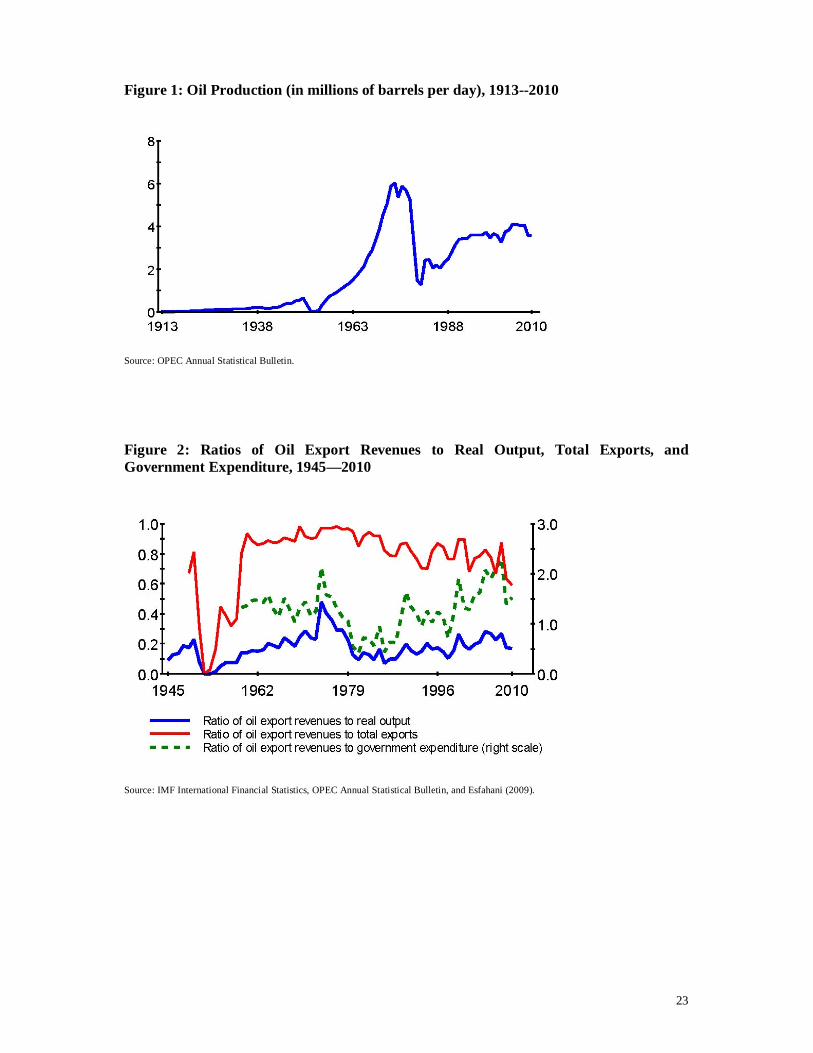
23
Figure 1: Oil Production (in millions of barrels per day), 1913--2010
Source: OPEC Annual Statistical Bulletin.
Figure 2: Ratios of Oil Export Revenues to Real Output, Total Exports, and Government Expenditure, 1945—2010
Source: IMF International Financial Statistics, OPEC Annual Statistical Bulletin, and Esfahani (2009).

24
Figure 3: International Price of Oil per Barrel, 1913--2010
Source: British Petroleum Statistical Review of World Energy.
Figure 4: Real Ouput and Oil Production Revenues, 1948--2010
Source: IMF International Financial Statistics and OPEC Annual Statistical Bulletin.

25
Figure 5: Per capita Oil Export Revenues, 1913--2010
Source: IMF International Financial Statistics and OPEC Annual Statistical Bulletin.
Figure 6: Real Oil Prices and the Real Exhange Rate, 1945--2010
Note: The real exchange rate measure used is the 'free market' rate. Source: British Petroleum Statistical Review of World Energy and IMF International Financial Statistics.
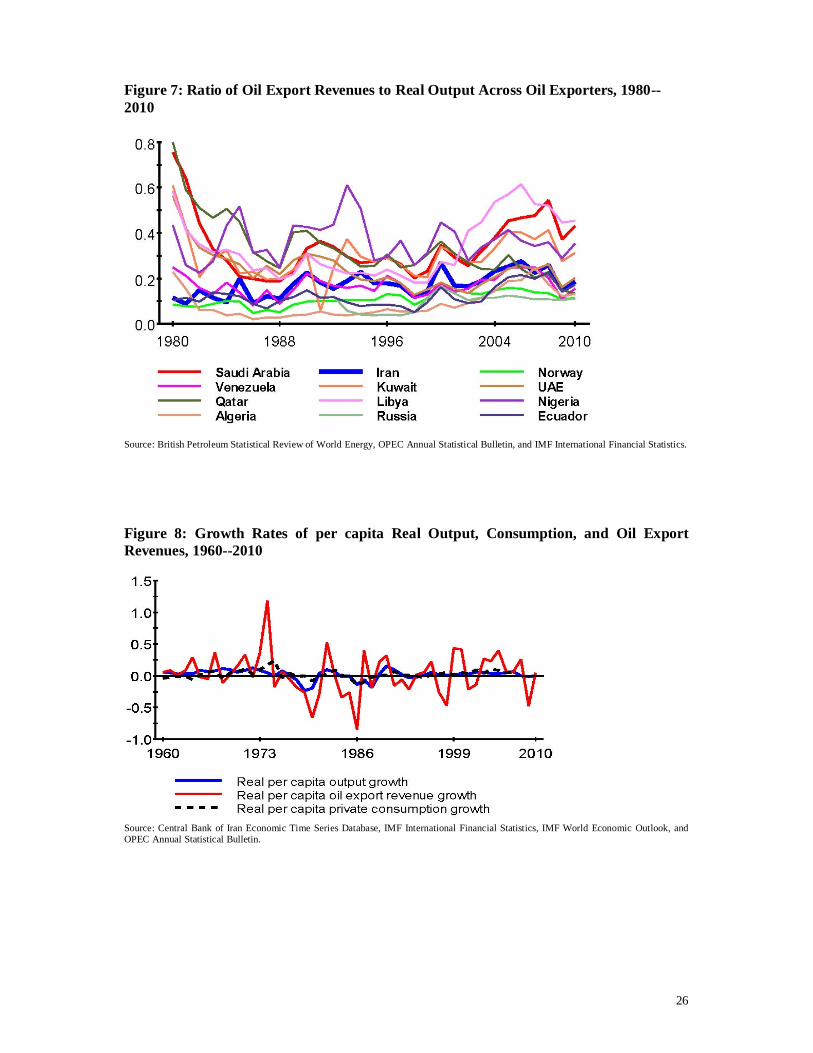
26
Figure 7: Ratio of Oil Export Revenues to Real Output Across Oil Exporters, 1980--2010
Source: British Petroleum Statistical Review of World Energy, OPEC Annual Statistical Bulletin, and IMF International Financial Statistics.
Figure 8: Growth Rates of per capita Real Output, Consumption, and Oil Export Revenues, 1960--2010
Source: Central Bank of Iran Economic Time Series Database, IMF International Financial Statistics, IMF World Economic Outlook, and OPEC Annual Statistical Bulletin.

27
Figure 9: Real Output Growth and Inflation, 1937--2010
Source: IMF International Financial Statistics and IMF World Economic Outlook.
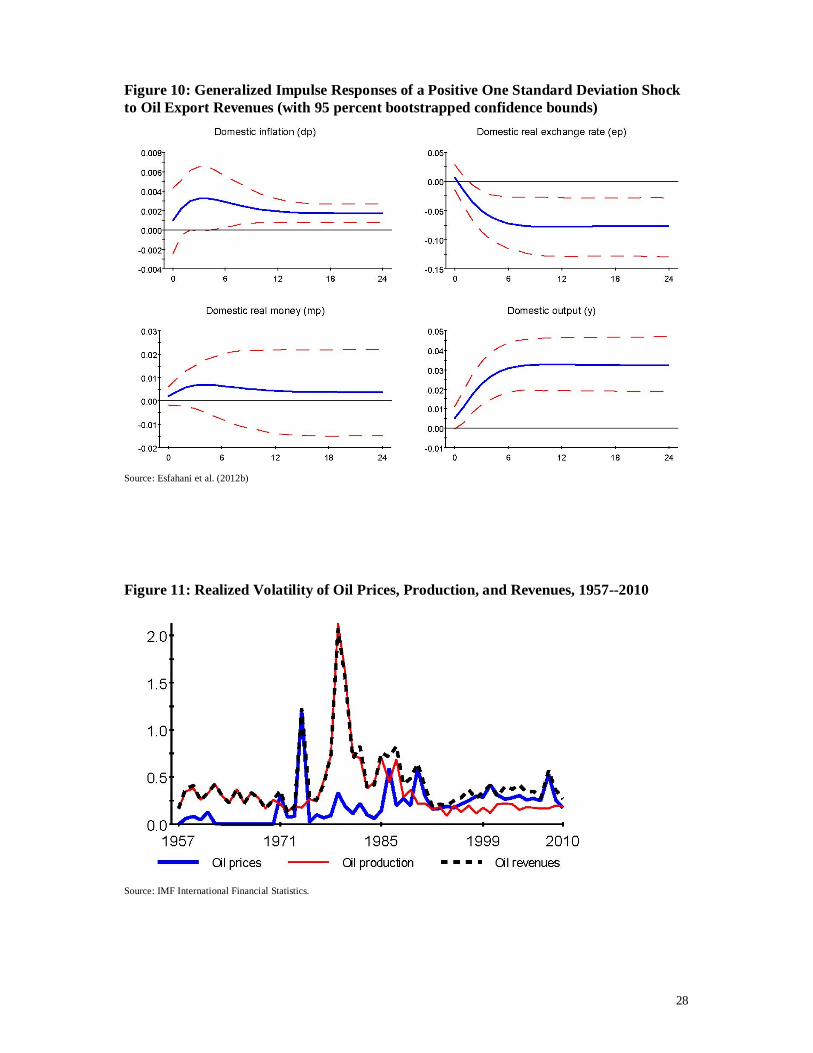
28
Figure 10: Generalized Impulse Responses of a Positive One Standard Deviation Shock to Oil Export Revenues (with 95 percent bootstrapped confidence bounds)
Source: Esfahani et al. (2012b)
Figure 11: Realized Volatility of Oil Prices, Production, and Revenues, 1957--2010
Source: IMF International Financial Statistics.

29
Figure 12: Scatter Plots of Oil Revenue Growth and Oil Revenue Volatility Against Real per capita Output Growth, 1957--2010
Source: IMF International Financial Statistics.

30
Table 1: Iranian Royalties and Taxation vs British Taxation, 1914--1950 Iranian Royalties Ratio of Iranian Government and Taxation British Taxation to Total Oil Export Revenue
Years (in million £ ) (in million £ ) (in percent)
1914 - 1919 0.22 0.23 - 1920 - 1924 0.52 0.76 5.3 1925 - 1929 1.05 0.87 6.3 1930 - 1934 1.63 1.32 17.2 1935 - 1939 3.19 2.38 18.4 1940 - 1944 4.09 11.18 15.2 1945 - 1949 8.50 22.66 10.7 1950 16.03 51.40 8.1
Note: The figures are averaged over the years considered. Source: Royalties and taxation data is from Ferrier (1982) and Bamberg (1994), while government and total revenue data is from Esfahani (2009).
Table 2: Growth of Real Output and Real Oil Export Revenue (per capita), 1937--2010 Real Output Real Oil Export Revenues
Sample Period per capita Growth per capita Growth Correlation (in percent) (in percent)
1937 - 2010 2.54 2.80 0.31 1960 - 2010 2.14 2.80 0.47 1960 - 1978 5.48 12.30 0.15 1979 - 2010 0.16 -2.84 0.53 1988 - 2010 2.20 3.63 0.33
Source: IMF World Economic Outlook, OPEC Annual Statistical Bulletin, and Esfahani (2009).
Table 3: Real Output Growth and Inflation, 1937--2010 Sample Period Real Output Growth Inflation Correlation
(in percent) (in percent) 1937 - 2010 4.96 12.69 -0.39 1960 - 2010 4.64 13.08 -0.39 1960 - 1978 8.37 6.18 -0.42 1979 - 2010 2.42 17.18 -0.14 1988 - 2010 3.82 17.65 -0.40
Source: IMF International Financial Statistics, IMF World Economic Outlook, and Esfahani (2009).
Table 4: Realized Volatility of Oil Prices, Production, and Revenues, 1960--2010 Sample Period Oil Price Oil Production Oil Revenue
Volatility (in %) Volatility (in %) Volatility (in %) 1960 - 2010 20.6 34.8 45.3 1960 - 1978 11.3 29.3 35.5 1979 - 2010 26.1 38.0 51.1 1988 - 2010 27.9 18.8 35.3
Source: IMF Interational Financial Statistics