parliamentary budget office – the hse national service ... · the hse national service plan and...
TRANSCRIPT

An Oifig Buiséid Pharlaiminteach Parliamentary Budget Office
The HSE National Service Plan and its Relationship with the Health Vote
Briefing Paper 14 of 2018

Séanadh
Is í an Oifig Buiséid Pharlaiminteach (OBP) a d’ullmhaigh an doiciméad seo mar áis do Chomhaltaí Thithe an Oireachtais ina gcuid dualgas parlaiminteach. Ní bheartaítear é a bheith uileghabhálach ná críochnúil. Féadfaidh an OBP aon fhaisnéis atá ann a bhaint as nó a leasú aon tráth gan fógra roimh ré. Níl an OBP freagrach as aon tagairtí d’aon fhaisnéis atá á cothabháil ag tríú páirtithe nó naisc chuig aon fhaisnéis den sórt sin ná as ábhar aon fhaisnéise den sórt sin. Tá baill foirne an OBP ar fáil chun ábhar na bpáipéar seo a phlé le Comhaltaí agus lena gcuid foirne ach ní féidir leo dul i mbun plé leis an mórphobal nó le heagraíochtaí seachtracha.
Disclaimer
This document has been prepared by the Parliamentary Budget Office (PBO) for use by the Members of the Houses of the Oireachtas to aid them in their parliamentary duties. It is not intended to be either comprehensive or definitive. The PBO may remove, vary or amend any information contained therein at any time without prior notice. The PBO accepts no responsibility for any references or links to or the content of any information maintained by third parties. Staff of the PBO are available to discuss the contents of these papers with Members and their staff, but cannot enter into discussions with members of the general public or external organisations.

Executive Summary 3
Introduction 5
Development of the HSE National Service Plan over time 8
From Budget 2018 to National Service Plan 2018 – the process 13
Health expenditure proposed in respect of 2018 14
National Service Plan 2018 16
Gross and Net Expenditure 17
Exchequer Appropriations-in-Aid 17
HSE Income 18
Health sector income 2011-2018 19
From HSE Budget to Outturn 21
Conclusion 23
Appendix I: HSE Income – December 2017 24
Appendix II: HSE National Service Plan Net Allocations 2011-2018 26
Appendix III: HSE National Service Plan Gross Allocation 2011-2018 28
Boxes
Box 1: Contents of the National Service Plan 14
Figures
Figure 1: Gross Expenditure Allocations of HSE budget
and selected Votes, Current and Capital 5
Figure 2: HSE total expenditure allocation 2011-2018 (€millions) 9
Figure 3: Net Current Expenditure Allocations under the National Service Plan 11
Figure 4: Net Current Expenditure under selected areas of the National Service Plan 12
Figure 5: Distribution of gross expenditure and income across
HSE operational and demand-led areas 2018 19
Figure 6: Health Sector Appropriations-in-Aid and National Service Plan Income, 2011-2018 20
Figure 7: Comparison of allocation to actual spend in Acute Hospitals (€billions) 22
The
HS
E N
atio
nal S
ervi
ce P
lan
and
its
Rel
atio
nshi
p w
ith
the
Hea
lth
Vote
1
The HSE National Service Plan and its Relationship with the Health Vote
Contents
Tables
Table 1: Changes in Net Allocation for Divisions in the National Service Plan
and Management Data Reports, 2016 10
Table 2: Allocations relating to the HSE in the Revised Estimates 2018 (€millions) 14
Table 3: Allocations in Indicative Appendices to Vote 38 (€millions) 15
Table 4: Breakdown of 2017 HSE Income, top 4 areas in €000s (Full table in appendices) 18
The
HS
E N
atio
nal S
ervi
ce P
lan
and
its
Rel
atio
nshi
p w
ith
the
Hea
lth
Vote
The HSE National Service Plan and its Relationship with the Health Vote
2

This Parliamentary Budget Office (PBO) briefing paper discusses the budget of the Health Service Executive (HSE). In the
PBO’s analysis of the Revised Estimates for Public Services 2018 (the ‘Revised Estimates 2018’), the PBO identified the
Health Vote (Vote 38), as one that may require a more detailed and focussed analysis. Specifically, the relationship
between the Health Vote and the HSE’s National Service Plan was an issue that the PBO identified for further scrutiny.
This paper sets out the outcome of that analysis.
It should be stressed that the primary focus of this paper is on identifying the relationship between budgetary
allocations in order to identify ways in which the information presented to Dáil Éireann (and its committees), when
scrutinising and approving the Health Vote, can be improved. On that basis, the PBO set out to analyse the budgetary
provisions set out in the National Service Plan based on the monies voted by the Dáil. It should be noted that this PBO
paper does not attempt to assess the adequacy of the funding set out in the National Service Plan, or the efficacy of the
policy measures contained therein.
The PBO has attempted to identify where Voted monies are being allocated in the National Service Plan as this would
assist in tracking trends over time and in monitoring performance. Through that attempt, the PBO has identified that the
relationship between the Health Vote and the National Service Plan is highly complex. The allocations set out in the
Health Vote itself, and the indicative appendices included, do not map onto the National Service Plan, even when the
different accounting methods (accruals vs. cash-based) used are allowed for.
Within the total budget allocation available to the HSE in its National Service Plan, the proportional share of net
allocation under each of the larger subheads has not changed substantially during the period from 2011 to 2018, apart
from three areas:
nPrimary Care and Mental Health have increased substantially;
nWhile Pensions have decreased in net allocation, this is due to income reducing the net cost, as the gross
allocation has increased by 43%.
Following the dis-establishment of the HSE Vote, the amount of income that is included in the National Service Plan but
not in the Estimates for Public Services, has increased significantly.1 As a result, the gap between the Gross Expenditure
approved in the Estimates process and the Gross Expenditure implemented in the HSE’s National Service Plan has
grown. For example, the net allocation in the National Service Plan for pensions has decreased significantly between
2011 and 2018. Contradictorily, the gross allocation has increased by 43% over the same period. While this allocation
does not appear directly in the Estimate, the net allocation of the National Service Plan is met by the determination from
the Health Vote. Trend analyses of this net determination over time are complicated by the fact that the disestablishment
of the HSE Vote involved the movement of income out of the voted system to the statutory sector.
1 The Health Service Executive (Financial Matters) Act 2014 provided for the dis-establishment of the Vote of the Health Service Executive from January 2015. From that date the funding of the HSE is mainly through the Vote of the Office of the Minister for Health to the HSE. The HSE continues to collect the income it generates through statutory charges, superannuation contributions and other miscellaneous income. In accordance with Section 7 of the above Act the Minister determines the maximum amount of net non-capital expenditure that may be incurred by the HSE.
Source: Health Service Executive Code of Governance, Chapter 2.
The
HS
E N
atio
nal S
ervi
ce P
lan
and
its
Rel
atio
nshi
p w
ith
the
Hea
lth
Vote
3
The HSE National Service Plan and its Relationship with the Health Vote
Executive Summary

The Parliamentary Budget Office’s overall conclusions are that:
nThe framework of accountability for expenditure under the Health Service Executive to the Dáil is highly complex
and technical. Further clarification would enhance the oversight role of the Dáil.
nThe key requirement for improving this accountability framework is the ease with which the different
performance, budgetary and accounting records prepared by the HSE and the Department of Health can be
compared and/or combined.
nAt present, performance and financial information is reported on different bases (the key difference being
between accruals and cash based accounting), making the results of changes in one part of the framework
difficult to quantify and evaluate.
nIn order to increase the effectiveness of the Vote oversight role of the Dáil, a reconciliation of the Income and
Expenditure allocation of the National Service Plan with the Indicative Appendices to the Revised Estimates for
Public Services should be presented to the Dáil as part of its scrutiny of the Revised Estimates for Vote 38.
nThe Monthly and Quarterly Management Data and Performance Reports are an indispensable tool for policy
makers, and should be produced regularly.
The
HS
E N
atio
nal S
ervi
ce P
lan
and
its
Rel
atio
nshi
p w
ith
the
Hea
lth
Vote
The HSE National Service Plan and its Relationship with the Health Vote
4
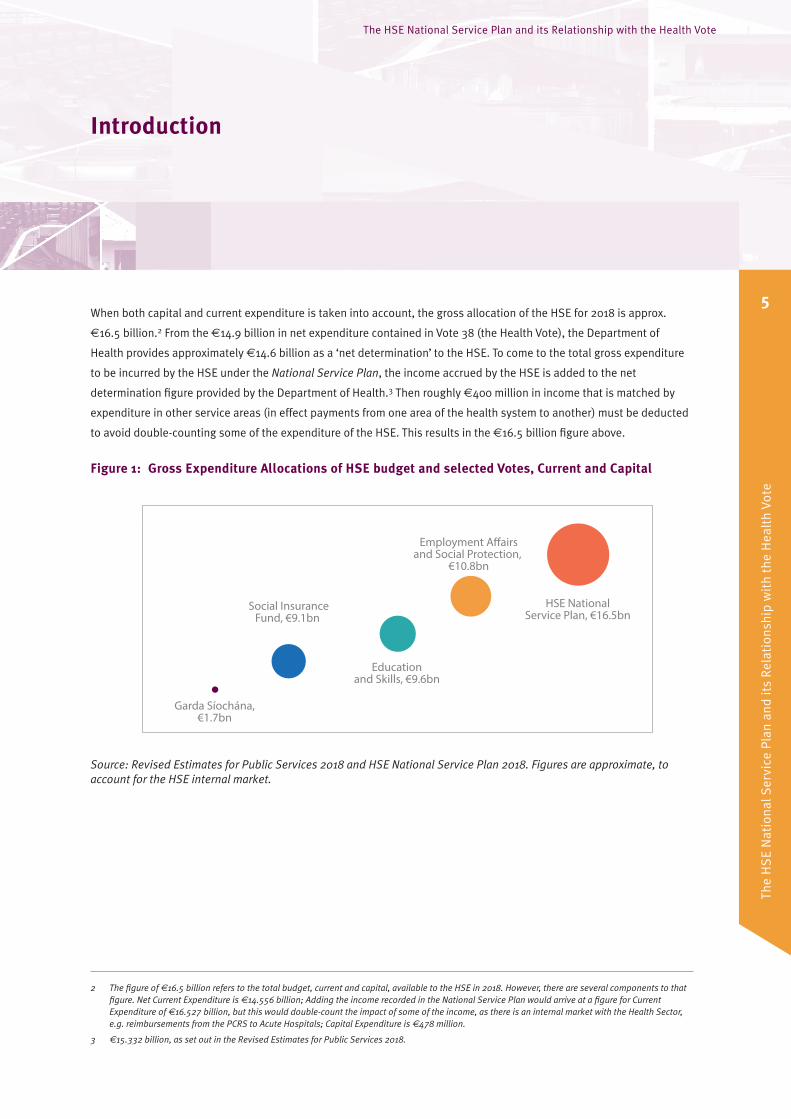
When both capital and current expenditure is taken into account, the gross allocation of the HSE for 2018 is approx.
€16.5 billion.2 From the €14.9 billion in net expenditure contained in Vote 38 (the Health Vote), the Department of
Health provides approximately €14.6 billion as a ‘net determination’ to the HSE. To come to the total gross expenditure
to be incurred by the HSE under the National Service Plan, the income accrued by the HSE is added to the net
determination figure provided by the Department of Health.3 Then roughly €400 million in income that is matched by
expenditure in other service areas (in effect payments from one area of the health system to another) must be deducted
to avoid double-counting some of the expenditure of the HSE. This results in the €16.5 billion figure above.
Figure 1: Gross Expenditure Allocations of HSE budget and selected Votes, Current and Capital
Garda Síochána,€1.7bn
Social InsuranceFund, €9.1bn
Educationand Skills, €9.6bn
Employment A�airsand Social Protection,
€10.8bn
HSE NationalService Plan, €16.5bn
Source: Revised Estimates for Public Services 2018 and HSE National Service Plan 2018. Figures are approximate, to account for the HSE internal market.
2 The figure of €16.5 billion refers to the total budget, current and capital, available to the HSE in 2018. However, there are several components to that figure. Net Current Expenditure is €14.556 billion; Adding the income recorded in the National Service Plan would arrive at a figure for Current Expenditure of €16.527 billion, but this would double-count the impact of some of the income, as there is an internal market with the Health Sector, e.g. reimbursements from the PCRS to Acute Hospitals; Capital Expenditure is €478 million.
3 €15.332 billion, as set out in the Revised Estimates for Public Services 2018.
The
HS
E N
atio
nal S
ervi
ce P
lan
and
its
Rel
atio
nshi
p w
ith
the
Hea
lth
Vote
5
The HSE National Service Plan and its Relationship with the Health Vote
Introduction

Both the volume of spending forecast by the National Service Plan, and the possibility of a lack of transparency around
this spending was identified by the Parliamentary Budget Office (PBO) in its consideration of the Revised Estimates for
Public Services 2018 (the ‘Revised Estimates 2018’). This provides the context for the PBO’s decision to analyse the
HSE’s National Service Plan 2018. In addition, 2018 marks the beginning of the process of implementing the
recommendations of the Sláintecare Report published in 2017. However, implementation of these recommendations is
still at a nascent stage, and the PBO has therefore, on that basis, decided not to include it in the analysis set out in this
paper.
Ireland’s healthcare system faces significant challenges.4 In order to meet the existing level of service in 2018 within
budget, the HSE will need to make savings of €346 million across its operational areas.5 Beyond this, the health service
is faced with increasing demographic challenges, particularly in the form of the increasing proportion of the population
that is aged above 65. As this older population cohort makes greater use of the health services than those under 65 (and
the age bracket over 85 makes even greater use of the health services than those 65-84), the ESRI has estimated that
demand will increase by 27% for in-patients and 26% for outpatients between 2015 and 2030.6 In order to avoid a
potential cost of €819 million annually (based on current costs) from these two changes alone, significant increases in
efficiency will be needed.7 The ESRI is expected to also produce a report that estimates the cost implications of the
change in demand brought on by demographics, but this report is not likely to be published in 2018.8
In this context, this paper explores the process for agreeing and presenting the budget of the Health Service Executive. If
the level of public spending on the health sector is expected to rise further due to demographic and other pressures, it is
essential that issues relating to visibility and structural coherence are identified and addressed to ensure greater
parliamentary accountability and oversight for this sectoral budget. Given the fiscal significance of the health sector
budget to the overall national budget, this is essential.
This paper is structured as follows:
n‘Development of the National Service Plan over time’ details the change in the relative apportionment of the
HSE’s budget over the period 2011 to 2018;
n‘From Budget 2018 to National Service Plan 2018’ tracks the process of determining the available Budget for the
HSE based on the allocations voted in the annual Estimates process. The process by which the budget is set out
in the HSE National Service Plan is identified and detailed. It also contains an analysis of the National Service
Plan 2018 and the extent to which the net allocations therein correspond to the Health Vote;
n‘Gross and Net Expenditure’ examines the changing relationship between Gross Expenditure, Income, and Net
Expenditure in the health sector over time. It includes an analysis of health sector Appropriations-in-Aid/Direct
Income over the period 2011-2018;
4 As stated in the terms of reference of the Sláintecare report, Appendix 5, available here.
5 National Service Plan 2018, p.1, p.68, p.79.
6 Projections of Demand for Healthcare in Ireland 2015-2030: First Report from the Hippocrates Model, ESRI.
7 PBO’s own calculations based on figures from Projections of Demand for Healthcare in Ireland, 2015-2030, ESRI, October 2017, and Acute Hospital Expenditure Review, IGEES, May 2017. Calculation is an extrapolated cost based on the weighted average cost (IGEES) multiplied by numbers in demand projection by ESRI.
8 Dr. Maev-Ann Wren, Joint Committee on Health Debate – Wednesday 14 February 2018: Review of the Sláintecare Report (resumed).
The
HS
E N
atio
nal S
ervi
ce P
lan
and
its
Rel
atio
nshi
p w
ith
the
Hea
lth
Vote
The HSE National Service Plan and its Relationship with the Health Vote
6

n‘From HSE Budget to Outturn’ briefly introduces the issue of the translation of HSE budgetary allocations into
expenditure and the differences between year-end expenditure and allocations, but does not go into detail on
realised expenditure in the HSE.
This paper does not address issues such as performance information and consideration of issues around actual
expenditure (as opposed to budgetary allocations) is limited.
The
HS
E N
atio
nal S
ervi
ce P
lan
and
its
Rel
atio
nshi
p w
ith
the
Hea
lth
Vote
The HSE National Service Plan and its Relationship with the Health Vote
7

The net current expenditure of the HSE has risen from €12.9 billion to €14.5 billion between 2011 and 20189. However
within this overall change there is significant variation, net expenditure reached a low of €12.1 billion in 2015 before
rising to its current level of €14.5 billion. The National Service Plan sets out only the current expenditure of the HSE,
while capital projects are set out in the multi-annual capital plan.
In the mid-point of this period, the HSE Vote was dis-established, which had two impacts on the relationship between
the Gross Voted Current Expenditure (i.e. the Gross Current Expenditure in the Revised Estimates), Gross Current
Expenditure and Net Current Expenditure (both in the National Service Plan). These are:
1. The income received by the statutory sector moved off-vote, as it was no longer income accruing directly to a
vote;
2. The inclusion in the Service Plan of the income formerly accrued as an Appropriation-in-Aid to the Health Vote
significantly increased the Gross Current Expenditure under the Service Plan, without increasing the net
exchequer requirement.
This meant that the gross and net current expenditure figures in the National Service Plan diverged from each other in
2015, as income in the National Service Plan rose from €594 million in 2014 to €2 billion in 2015 (however, this income
includes the internal market that exists within the health sector). Since this level change in 2015, gross and net
expenditure have moved largely in tandem. In this section of the paper, the main focus will be upon the net current
expenditure allocation, as this is the element that the Exchequer is required to meet.
9 Figures modified to reflect the transfer of Child and Family Services to Tusla in 2014 (absent from National Service Plan 2015 and onwards), for comparability.
The
HS
E N
atio
nal S
ervi
ce P
lan
and
its
Rel
atio
nshi
p w
ith
the
Hea
lth
Vote
8
The HSE National Service Plan and its Relationship with the Health Vote
Development of the HSE National Service Plan over time

Figure 2: HSE total expenditure allocation 2011-2018 (€millions)
2011 2012 2013 2014 2015 2016 2017 201810,000
11,000
12,000
13,000
14,000
15,000
16,000
17,000
Gross Expenditure Net Expenditure
Source: National Service Plans 2011-2018; figures for 2014 are taken from the National Service Plan 2015.
As Figures 3 and 4 illustrate, the proportional share of the main headline items under the National Service Plan has not
changed markedly during the years of reduced expenditure, and the past three years of rising expenditure. Throughout
that time, Acute Hospitals was largely protected from the reductions, and its share of the overall expenditure increased
as the overall budget reached its lowest point. The greatest proportional change in net allocation occurred under Mental
Health and Primary Care, though the majority of the increase in Primary Care was a result of the reallocation of approx.
€400 million to specific areas from the Multi-Care Group (which was disbanded in 2014). Full detail of the Net and Gross
Allocations of this expenditure is given in Appendices II and III to this paper.
However, the actual growth in respect of some areas is exaggerated by viewing the net allocation in isolation.
Expenditure under Acute Hospitals regularly exceeds its budget, and budgets are transferred from other areas into Acute
Hospitals. An important point that can be inferred from the table below is that the National Service Plan is not a
definitive record of the budgetary allocation for service areas. As the year progresses, budgets will move between
service areas. This further complicates the relationship between the voted budget and the services funded from
exchequer funds. Table 1 shows how the budget for Acute Hospitals develops within a given year, as funds are
transferred from other divisions and additional funds are made available (in 2016, a second Revised Estimates Volume
was introduced by the new government, providing an additional €500 million to the Health Vote).
The
HS
E N
atio
nal S
ervi
ce P
lan
and
its
Rel
atio
nshi
p w
ith
the
Hea
lth
Vote
The HSE National Service Plan and its Relationship with the Health Vote
9
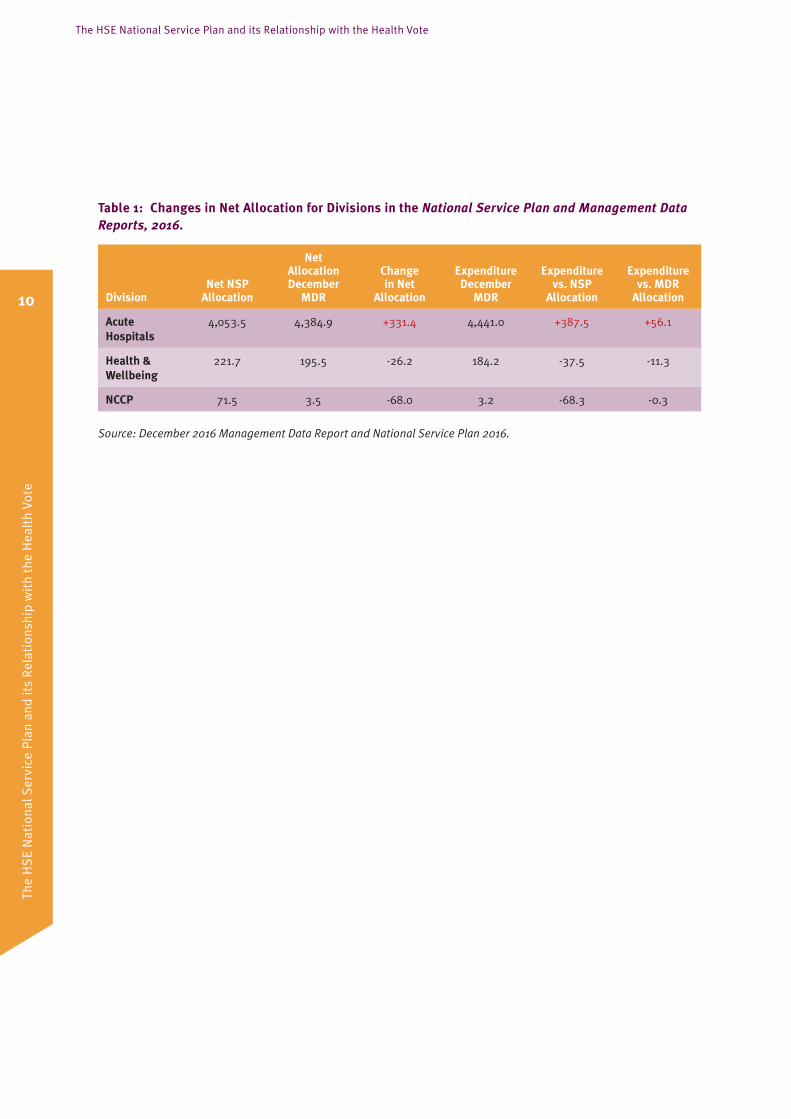
Table 1: Changes in Net Allocation for Divisions in the National Service Plan and Management Data Reports, 2016.
DivisionNet NSP
Allocation
Net Allocation December
MDR
Change in Net
Allocation
Expenditure December
MDR
Expenditure vs. NSP
Allocation
Expenditure vs. MDR
Allocation
Acute Hospitals
4,053.5 4,384.9 +331.4 4,441.0 +387.5 +56.1
Health & Wellbeing
221.7 195.5 -26.2 184.2 -37.5 -11.3
NCCP 71.5 3.5 -68.0 3.2 -68.3 -0.3
Source: December 2016 Management Data Report and National Service Plan 2016.
The
HS
E N
atio
nal S
ervi
ce P
lan
and
its
Rel
atio
nshi
p w
ith
the
Hea
lth
Vote
The HSE National Service Plan and its Relationship with the Health Vote
10

Figure 3: Net Current Expenditure Allocations under the National Service Plan
Net Allocation for HSE Service Areas 2011-2018 (figures in €millions)
201320122011 2014 2016 201820172015
Acute Hospitals PCRS Disability ServicesAll Remaining Areas 4 Next Largest Areas
0
500
1,000
1,500
2,000
2,500
3,000
3,500
4,000
4,500
5,000
Net Allocation for HSE Service Areas 2011-2018 (% of total)
201320122011 2014 2016 201820172015
Acute Hospitals PCRS Disability ServicesAll Remaining Areas 4 Next Largest Areas
0%
5%
10%
15%
20%
25%
30%
35%
40%
Source: National Service Plans 2011-2018, figures for 2014 are taken from National Service Plan 2015, as the HSE temporarily combined Disability Services and Older Person Services under one “Social Care” heading in 2014.
The
HS
E N
atio
nal S
ervi
ce P
lan
and
its
Rel
atio
nshi
p w
ith
the
Hea
lth
Vote
The HSE National Service Plan and its Relationship with the Health Vote
11
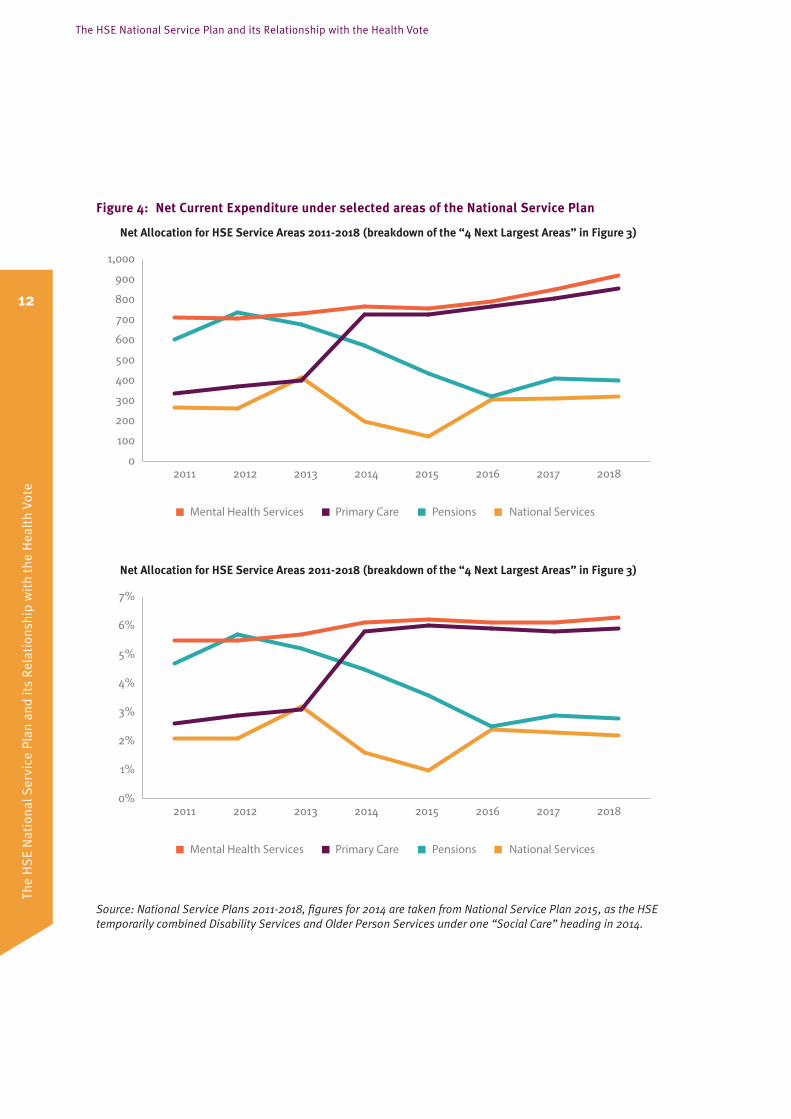
Figure 4: Net Current Expenditure under selected areas of the National Service Plan
Net Allocation for HSE Service Areas 2011-2018 (breakdown of the “4 Next Largest Areas” in Figure 3)
201320122011 2014 2016 201820172015
Mental Health Services Primary Care Pensions National Services
0
100
200
300
400
500
600
700
800
900
1,000
Net Allocation for HSE Service Areas 2011-2018 (breakdown of the “4 Next Largest Areas” in Figure 3)
201320122011 2014 2016 201820172015
Mental Health Services Primary Care Pensions National Services
0%
1%
2%
3%
4%
5%
6%
7%
Source: National Service Plans 2011-2018, figures for 2014 are taken from National Service Plan 2015, as the HSE temporarily combined Disability Services and Older Person Services under one “Social Care” heading in 2014.
The
HS
E N
atio
nal S
ervi
ce P
lan
and
its
Rel
atio
nshi
p w
ith
the
Hea
lth
Vote
The HSE National Service Plan and its Relationship with the Health Vote
12

The total Exchequer funding available for transfer to the HSE in 2018 is contained in Vote 38, as set out in the Revised
Estimates for Public Services 2018. This funding is presented at a more granular level than was set out in the Expenditure
Report published on Budget day and contains an additional €41 million allocation as a result of policy changes post-
Budget 2018.
The HSE is formally notified of the total funding that will be provided by the Exchequer in a ‘Letter of Determination’,
which is sent by the Minister for Health within 21 days of the Estimates for Public Services (on Budget day).
That letter provides the Capital and Current Expenditure funding separately, as they are delivered to the HSE under
different sections of the Health Act (2004).10 This letter is not generally publically available, but has been made available
under the provisions of Freedom of Information legislation.
In the letter, the Minister for Health also informs the HSE as to which priorities the National Service Plan should include.
The letter specifies amounts of funding to be set aside in respect of particular issues. For example, the Letter of
Determination for 2015 specified that €25 million should be set aside to address delayed discharges.11
The HSE produces the National Service Plan in accordance with the relevant legislative provisions, the directions in the
letter and utilising the funding specified. The Plan is then laid in the Library of the Houses of the Oireachtas within 21
days of its approval by the Minister for Health.
10 Current Expenditure is provided under Section 30A(1) of the Health Act (2004) as amended by the Health Service Executive (Financial Matters) Act 2014, while Capital is provided under Section 33B(1) of same. This clear division of capital and current expenditure was one of the recommendations of the Considine Report (2009).
11 Letter of Determination from Minister Leo Varadkar T.D. to Director General Tony O’Brien, 31st October 2014, p. 3.
The
HS
E N
atio
nal S
ervi
ce P
lan
and
its
Rel
atio
nshi
p w
ith
the
Hea
lth
Vote
13
The HSE National Service Plan and its Relationship with the Health Vote
From Budget 2018 to National Service Plan 2018 – the process

Box 1: Contents of the National Service Plan
Section 31 of the Health Act (2004), as amended by the Health Service Executive Acts of 2013 and 2014, requires
the HSE to submit a Service Plan, which must:
1. Indicate the type and volume of health and social services for the year;
2. Indicate any capital plans proposed by the executive;
3. Contain estimates of the income and expenditure of the Executive;
4. Contain estimates of the number of employees (including Section 38 Agencies) relating to the period and
services set out in the plan;
5. Any other information as specified by the Minister for Health;
6. Accord with the policies and objectives of the Minister and the Government.
In addition, the Minister “may issue a direction to the Executive as respects the form and manner in which the
service plan is to be prepared”.
The income and expenditure of the Executive is presented on an accruals basis. The net figure reported here is
equal to the determination decided upon by the Minister and communicated in the above described ‘Letter of
Determination’. The gross is calculated by adding the income of the HSE to the net determination.
The requirement regarding the period and services set out in the plan was amended in 2013, to specific that it
must “relate to the period of the service plan and the services to which it relates”. National Service Plan 2018
includes an estimate of employee numbers in December 2017.
Health expenditure proposed in respect of 2018
In the Revised Estimates 2018, the allocations within the Health Vote that relate to the HSE comprise the following:
Table 2: Allocations relating to the HSE in the Revised Estimates 2018 (€millions)
Cost Group Description Current Capital Total
H Corporate Admin 96 0 96
I HSE Regions and Other Agencies 10,140 0 10,140
J Other HSE Services 431 0 431
K Care Programme 3,806 0 3,806
L Capital Services 104 47812 582
Total 14,577 478 15,055
Source: Revised Estimates 2018
12 Capital Services in this table excludes €15 million that does not relate to the HSE.
The
HS
E N
atio
nal S
ervi
ce P
lan
and
its
Rel
atio
nshi
p w
ith
the
Hea
lth
Vote
The HSE National Service Plan and its Relationship with the Health Vote
14

These allocations are not mapped directly onto the National Service Plan 2018. In addition, these allocations combine
HSE expenditure with Department of Health expenditure. To aid the tracking of specific allocations from Vote 38 to the
HSE’s National Service Plan, the Department of Health provides a set of indicative appendices to the Revised Estimates
(see Table 3).
Table 3: Allocations in Indicative Appendices to Vote 38 (€millions)
Area Current Capital
Acute Hospitals 4,600.5 182
Primary Care Reimbursement Scheme 2,844.4
Disability Services 1,762.3 35
Long term residential care 961.6
Mental Health Services 917.8 83
Primary Care 853.3 29.3
Services for Older People 811.3 45
Health and Wellbeing 241 3
National Ambulance Service 165.6 22
Social Inclusion 144.5 1.1
National Cancer Control Programme 85.3 16.5
Palliative Care 78.2 1.1
Total 13,465.8 418
Source: Revised Estimates 2018
A number of expenditure items budgeted for under the National Service Plan 2018 are not directly included in these
appendices. These omitted items comprise approximately €1.1 billion and include Pensions, National Services, and the
State Claims Agency among other areas (see Table 3 of this paper). It appears that €60 million Capital Expenditure for IT
is not included in the appendices, as this would bring the total capital to €478 million. This allocation appears to be
included under ‘Information services and related services for Health Agencies’ in the main Vote, which records a capital
allocation of €60 million, but does not appear anywhere in the indicative appendices.
The
HS
E N
atio
nal S
ervi
ce P
lan
and
its
Rel
atio
nshi
p w
ith
the
Hea
lth
Vote
The HSE National Service Plan and its Relationship with the Health Vote
15
National Service Plan 2018
The National Service Plan is produced by the HSE, in accordance with statutory provisions, in December each year. The
Plan sets out only current expenditure, i.e. the HSE’s capital expenditure is not presented in its Income and Expenditure
and Financial Allocations tables, but is included in the appendices. Capital projects are set out separately in the HSE’s
multi-annual capital plan.
The National Service Plan 2018 states that the Minister for Health’s letter of determination for 2018 included allocations
of €14,556 million for current expenditure and €418 million in capital expenditure. It then separately states that €60
million in capital is approved for IT projects.
Expenditure across the HSE is reported on a monthly basis in the Management Data Reports. In May of the following
year, a final financial position is published in the Annual Financial Statement (AFS), together with an annual report on
the activities of the HSE. The headings presented in the AFS are different to those used in the National Service Plan and
Monthly Data Reports (e.g. the Acutes heading in the AFS also includes the National Ambulance Service, which is
reported separately in the Management Data Reports and the National Service Plan).
While many of the same headings that are included in the National Service Plan do appear in the indicative appendices,
many headings under the National Service Plan are not quantified in these appendices (9 areas with a combined
expenditure of €1.3 billion in 2018). While some of the totals for operational and demand-led areas differ, this may be
due to expenditure being committed to towards the end of the year, meaning it would fall in the HSE’s accounts but not
in the accounts for the Vote. The €14.5 billion net allocation in the National Service Plan 2018 does fall within the overall
€14.8 billion net allocation budgeted in the Revised Estimates process for Vote 38. However, the exact level of funding
being provided to the HSE is not separately set out in the Revised Estimates, but is notified to HSE in the Letter of
Determination. The alignment of the programmes in the Vote has been a recommendation for reform since at least the
Considine Report in 2008.13 In the absence of this alignment, reporting that reconciles the Voted Current Expenditure
with the service areas of the National Service Plan in some way would serve to improve the accountability framework for
health expenditure.
This complexity is compounded by the lack of clarity regarding gross and net current expenditure allocated under the
Revised Estimates and National Service Plan. It is important to understand why the distinction between gross and net
expenditure matters in this context and this is addressed in the following section.
13 Study of certain accounting issues related to the Health Service Executive (HSE), September 2008, p. 94.
The
HS
E N
atio
nal S
ervi
ce P
lan
and
its
Rel
atio
nshi
p w
ith
the
Hea
lth
Vote
The HSE National Service Plan and its Relationship with the Health Vote
16

While net expenditure represents the net cost to the Exchequer of a public service, the gross expenditure represents the
actual expenditure that will be incurred in implementing that public service, before income is netted from the
expenditure figure. When income accrues to a Vote, it is classed as an Appropriation-in-Aid and falls within the vote
system. Income that does not accrue directly to the holder of a Vote is not classed as such, and therefore falls outside of
the vote system. In the case of the Vote, the gross current expenditure includes the Appropriations-in-Aid. In the case of
the HSE’s National Service Plan, the gross current expenditure includes the income of the HSE but not the income
accruing to the Health Vote. In order to estimate the full resources available to agencies of the State in any given year, it
is important that both the gross and net expenditure allocated are considered. In addition, the trend in income may
suppress growth in Gross Expenditure (e.g. under Pensions).
Exchequer Appropriations-in-Aid
In the Revised Estimates for Public Services, the Health Vote includes Appropriations-in-Aid. These receipts arise from:
nrecovery of the cost of Health Services provided as required under European law;
ncertain receipts from excise duties on tobacco products;
npayments from the Social Insurance Fund (SIF);
nPension-related Deductions paid by staff; and
nother miscellaneous areas.
In 2018, the Appropriations-in-Aid for Vote 38 are estimated to total €460.2 million. This is a minor increase since 2015,
when the corresponding figure was €455 million.
However, between 2014 and 2015 (i.e. at the time of the dis-establishment of the HSE Vote), Appropriations-in-Aid (as an
overall category) dropped from €1.4 billion to €455 million, a drop of €954 million (when the Appropriations in Aid from
both Vote 38 and the then Vote 39 (HSE) are included in 2014’s figure). This is because income to the HSE statutory
system could not be considered Appropriations-in-Aid following dis-establishment of the HSE Vote.
The
HS
E N
atio
nal S
ervi
ce P
lan
and
its
Rel
atio
nshi
p w
ith
the
Hea
lth
Vote
17
The HSE National Service Plan and its Relationship with the Health Vote
Gross and Net Expenditure

HSE Income
Income that is received directly by the HSE is recorded in the National Service Plan. This figure is netted against the
gross expenditure figure that is allocated by the HSE to the services it provides. Therefore, the €14.5 billion net
allocation in the National Service Plan 2018 represents the Exchequer portion of the funding available.
A detailed breakdown of Income is published in the Management Data Reports. The largest single source of income has
historically been Maintenance Charges, and large growth has been seen in this area since 2011.14 These maintenance
charges are related to private patient charges in public hospitals. A sum of €1.97 billion is projected as income in the
National Service Plan. However, this income contains an internal market, where income under one service area is
matched by expenditure in another. The approximate size of this market is €400 million. This means that, in effect, the
gross figure for resources available to the HSE for current expenses in 2018 is not projected to be €14.5 billion but
roughly €16.1 billion. Table 4 details the latest returns for income from 2017, showing the split between hospitals,
community and corporate as receivers of income.
Table 4: Breakdown of 2017 HSE Income, top 4 areas in €000s (Full table in appendices)
Actual Income Budgeted Income Variance from Budget
Hospital (800,025) (806,478) 6,452
In-Patient Charges (27,491) (22,932) (4,559)
Maintenance Charges (570,816) (590,644) 19,827
Other Income (184,749)* (176,828)* (7,921)
Out-Patient Charges (16,969) (16,074) (895)
Community (559,527) (564,702) 5,175
In-Patient Charges (12,427) (14,173) 1,747
Long Stay (125,754) (126,525) 771
Other Grants (17,448) (13,639) (3,810)
Other Income (403,898)* (410,365)* 6,467
Corporate (510,846) (478,156) (32,692)
Agency/Services (3,380) (3,589) 209
Maintenance Charges (3,145) (01) (3,145)
Other Income (25,962) (14,764) (11,198)
Superannuation (478,359) (459,802) (18,558)
Total (1,870,398) (1,849,336) (21,065)
Source: December Management Data Report 2017
*Contains income matched by expenditure under a different Service Area, e.g. payments from the PCRS to hospitals.
14 Acute Hospital Expenditure Review, July 2017, p.17.
The
HS
E N
atio
nal S
ervi
ce P
lan
and
its
Rel
atio
nshi
p w
ith
the
Hea
lth
Vote
The HSE National Service Plan and its Relationship with the Health Vote
18

Figure 5 illustrates the income recorded in National Service Plan 2018. However, there are some caveats which must be
considered when examining the income recorded here. Some of this income will be reimbursed from the Primary Care
Reimbursement Service (PCRS) to Hospitals and matched to expenditure under non-pay in the hospital. This means that
adding the income back to the expenditure results in double-counting. 15
Figure 5: Distribution of gross expenditure and income across HSE operational and demand-led areas 2018
AcuteHospitals
OlderPersons'Services
PCRS DisabilityServices
Primary Care
MentalHealth
Pensions0
1,000
2,000
3,000
4,000
5,000
6,000
Gross Budget Income
Source: National Service Plan 2018, PCRS is the abbreviation for the Primary Care Reimbursement Scheme.
Health sector income 2011-2018
There has been a significant change in the size and composition of the Appropriations-in-Aid of the health sector since
the dis-establishment of the Health Service Executive Vote after 2014. Two notable changes are that some of the income
reported as Appropriations-in-Aid under the HSE Vote are now only recorded in the National Service Plan, while other
income is now reported under the Health Vote, and the Appropriations-in-Aid under that Vote has increased by over
€400 million, as certain recoupments and excise revenues must be recorded as Appropriations-in-Aid.
This means that because of the dis-establishment, the Appropriations-in-Aid reported to the Dáil in 2018 as part of the
Estimates process do not include roughly €1.6 billion in direct income projected by the HSE (see Figure 2). As previously
noted, while the total figure for this income is close to €2 billion, there is an internal market within the health sector that
accounts for €400 million in income accruing from expenditure elsewhere in the sector. This internal market complicates
analysis of the income over time, as it is not clearly isolated from historical data. As such, Figure 6 should be viewed with
this internal market in mind.
15 Acute Hospital Expenditure Review, July 2017, IGEES, p. 17.
The
HS
E N
atio
nal S
ervi
ce P
lan
and
its
Rel
atio
nshi
p w
ith
the
Hea
lth
Vote
The HSE National Service Plan and its Relationship with the Health Vote
19

Accordingly, from a parliamentary perspective the dis-establishment of the HSE Vote (and its removal therefore from the
Revised Estimates for Public Services) has made the process of scrutinising public health sector funding more
complicated. In addition, the Appropriations-in-Aid under the Health Vote and income recorded in the National Service
Plan taken together has increased substantially (from €2 billion to €2.4 billion16) since dis-establishment, thereby
increasing the gap between the voted gross expenditure and the gross expenditure of the HSE.
Figure 6: Health Sector Appropriations-in-Aid and National Service Plan Income, 2011-2018
2011 20132012 2014 2015 2016 2017 20180
1,000
500
1,500
2,000
2,500
3,000
Health Vote Health Service Executive Vote National Service Plan Income
Source: Revised Estimates and National Service Plans 2011-2018.
16 Both figures include the ‘Internal Market’ of payments from one area of the health service to another.
The
HS
E N
atio
nal S
ervi
ce P
lan
and
its
Rel
atio
nshi
p w
ith
the
Hea
lth
Vote
The HSE National Service Plan and its Relationship with the Health Vote
20

This paper has primarily examined the trend in changes to budgeted allocations, rather than the actual expenditure that
occurred. This helps clarify the change in the baseline starting point of HSE expenditure year-on-year, but the actual
expenditure outturn also tells an important story about the management of health expenditure and highlights pressures
within the headings of the National Service Plan.
The Irish Fiscal Advisory Council (IFAC) published an analytical note on Controlling the health budget in August 2015. Its
conclusion at the time was that “public health expenditure in Ireland has exceeded planned levels repeatedly in recent
years”17 and had exceeded its budget “every year since the crisis began in 2008”.18 Since then, the Health sector has
required a supplementary estimate in 2015 and 2017, but not in 2016. However, it should be noted that 2016 was
unusual as a result of the change of government. In June 2016, a second Revised Estimate for some Votes was published.
As a result, the Dáil approved an additional €500 million for the Health Vote.
IFAC identified two main expenditure drivers which resulted in the persistent inability of the HSE to remain within budget:
nAcute Hospitals; and
nThe Primary Care Reimbursement Service.19
Reviewing the management data, this trend has continued, with Acute Hospitals over budget by €55 million and €140
million in 2016 and 2017 respectively.20 However, this is based on the final approved budget as at December of the
respective year, compared to the expectation in January. The final approved budget for Acute Hospitals was €318 million
and €274 million higher than the expected annual budget in 2016 and 2017 respectively. This shows how there are both
budgetary pressures exerting upward pressure on the approved budget of this area in-year, and that the area has
exceeded the increased approved budget.
Figure 7 details the changing position of the Acute Hospital sector throughout the year, and the way the spending pressure of
the sector demands increases within year and year-on-year. The change in the allocations between January and September
captures Supplementary Estimates while the actual spend shows that even these increased budgetary allocations are
consistently overran each year. Normally, the variance within Acute Hospitals is counterbalanced by under-spends in other
areas. For example, in 2016 Acute Hospitals recorded a variance of €56 million. Spends in other areas mitigated this,
resulting in a total variance of just over €14 million. However, in 2017 the variance in Acute Hospitals was unusually large at
just under €140 million. In addition, a number of other areas reported spend above budgets, resulting in an overall variance
of €166 million.21 This overspend in the Acute sector will be split across Voluntary Hospitals and HSE Direct Provision, but at
least a portion (the portion related to HSE direct provision) of this spend will fall into 2018’s accounts as a ‘First Charge’. This
will place additional pressure upon an already challenging financial position for the HSE in 2018.
17 IFAC, p. 4.
18 Ibid, p. 9.
19 Ibid, p. 27.
20 December 2016 and December 2017 Management Data Reports, HSE.
21 Ibid.
The
HS
E N
atio
nal S
ervi
ce P
lan
and
its
Rel
atio
nshi
p w
ith
the
Hea
lth
Vote
21
The HSE National Service Plan and its Relationship with the Health Vote
From HSE Budget to Outturn

Figure 7: Comparison of allocation to actual spend in Acute Hospitals (€billions)
2013
2014
2016
2017
2015
Allocation in January Allocation in December (After Supplementaries) Spend
0 1,000,000 2,000,000 3,000,000 4,000,000 5,000,000
Source: Management Data Reports 2013-2017.
The
HS
E N
atio
nal S
ervi
ce P
lan
and
its
Rel
atio
nshi
p w
ith
the
Hea
lth
Vote
The HSE National Service Plan and its Relationship with the Health Vote
22

This paper has examined the process of dispersing the voted expenditure approved under Vote 38 into the Health
Service Executive’s National Service Plan, and followed this data through in specific areas to examine historical
performance against budget allocations. This process is complex, and the examination of the data highlights the lack of
clarity around precisely where resources are allocated to. This has implications for the capacity of the Houses of the
Oireachtas, and its committees, to scrutinise expenditure and the HSE’s performance from a budgetary perspective.
Pending the completion of the IFMS project to implement a shared financial system for the HSE, the goal of those
involved in budgetary management should be to increase the accessibility of the financial framework of Ireland’s health
system.
The Health Service Executive’s Vote was dis-established from 2015 onwards to “allow for greater accountability to the
Minister for Health … and allow the Department to exercise much greater control of expenditure and resource
allocation.”22 However, the dis-establishment of the HSE Vote has resulted in a situation where the large growth in
income reported only in the HSE’s National Service Plan and no longer included in the Voted Appropriations-in-Aid
means that the Gross Expenditure in the National Service Plan is significantly larger than the Gross Expenditure
scrutinised in the estimates process.
In addition, the programmes used in Vote 38 have not changed materially from those reported under the previous HSE
Vote. The fact that there is only an indirect relationship between the programmes in the Health Vote and the operational
and demand-led areas in the National Service Plan makes it more difficult for the Oireachtas to scrutinise the
effectiveness of health expenditure in the budgetary process. The programming of expenditure under the Health Vote
was another priority of Future Health and aligning the programmes of Vote 38 with the HSE’s internal allocations would
make the relationship between what the Oireachtas approves and what is spent on the ground more direct.
22 Future Health, Department of Health, p. 25.
The
HS
E N
atio
nal S
ervi
ce P
lan
and
its
Rel
atio
nshi
p w
ith
the
Hea
lth
Vote
23
The HSE National Service Plan and its Relationship with the Health Vote
Conclusion
Actual Income Budgeted Income Variance from Budget
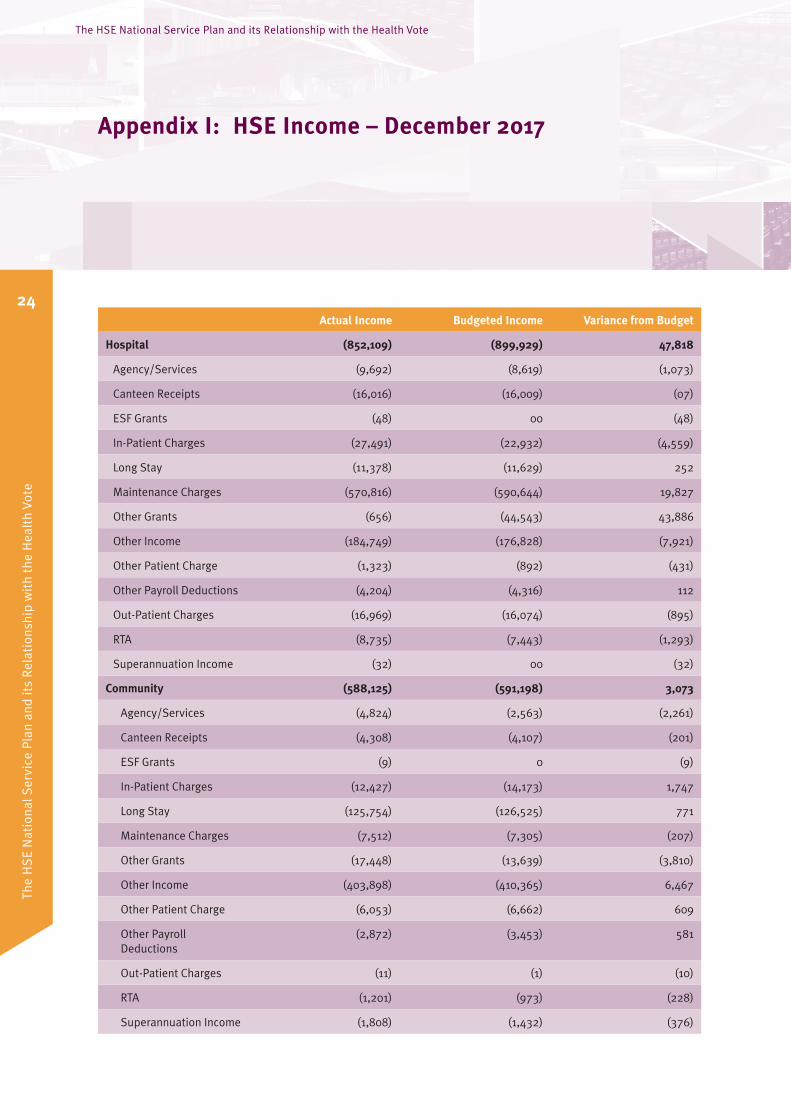
Hospital (852,109) (899,929) 47,818
Agency/Services (9,692) (8,619) (1,073)
Canteen Receipts (16,016) (16,009) (07)
ESF Grants (48) 00 (48)
In-Patient Charges (27,491) (22,932) (4,559)
Long Stay (11,378) (11,629) 252
Maintenance Charges (570,816) (590,644) 19,827
Other Grants (656) (44,543) 43,886
Other Income (184,749) (176,828) (7,921)
Other Patient Charge (1,323) (892) (431)
Other Payroll Deductions (4,204) (4,316) 112
Out-Patient Charges (16,969) (16,074) (895)
RTA (8,735) (7,443) (1,293)
Superannuation Income (32) 00 (32)
Community (588,125) (591,198) 3,073
Agency/Services (4,824) (2,563) (2,261)
Canteen Receipts (4,308) (4,107) (201)
ESF Grants (9) 0 (9)
In-Patient Charges (12,427) (14,173) 1,747
Long Stay (125,754) (126,525) 771
Maintenance Charges (7,512) (7,305) (207)
Other Grants (17,448) (13,639) (3,810)
Other Income (403,898) (410,365) 6,467
Other Patient Charge (6,053) (6,662) 609
Other Payroll Deductions
(2,872) (3,453) 581
Out-Patient Charges (11) (1) (10)
RTA (1,201) (973) (228)
Superannuation Income (1,808) (1,432) (376)
The
HS
E N
atio
nal S
ervi
ce P
lan
and
its
Rel
atio
nshi
p w
ith
the
Hea
lth
Vote
24
The HSE National Service Plan and its Relationship with the Health Vote
Appendix I: HSE Income – December 2017

Actual Income Budgeted Income Variance from Budget
Corporate (517,640) (480,271) (37,371)
Agency/Services (3,380) (3,589) 209
Canteen Receipts (55) (47) (08)
ESF Grants (178) (148) (30)
In-Patient Charges (753) 00 (753)
Long Stay (05) 00 (05)
Maintenance Charges (3,145) (01) (3,145)
Other Grants (1,814) (71) (1,743)
Other Income (25,962) (14,764) (11,198)
Other Patient Charge (3,079) (1,451) (1,628)
Other Payroll Deductions
(909) (398) (511)
Out-Patient Charges 00 00 00
RTA (01) 00 (01)
Superannuation Income (478,359) (459,802) (18,558)
Grand Total (1,957,874) (1,971,398) 13,520
The
HS
E N
atio
nal S
ervi
ce P
lan
and
its
Rel
atio
nshi
p w
ith
the
Hea
lth
Vote
The HSE National Service Plan and its Relationship with the Health Vote
25

€millions 2011 2012 2013 2014 2015 2016 2017 2018
Operational Services 9,901 9,596 9,719 9,605 9,211 9,810 10,490 11,048
Primary Care
Primary Care 335 372 400 726 726 765 808 857
Social Inclusion 119 115 114 126 127 133 145
Palliative Care 81 78 72 72 73 76 78
Primary Care Total 535 565 586 726 924 965 1,017 1,080
Acute Hospitals 4,207 4,022 4,117 4,304 4,000 4,054 4,367 4,601
Disability Services 1,576 1,541 1,535 1,429 1,459 1,558 1,689 1,772
Mental Health Services 712 707 733 766 757 792 853 918
Services for Older People 407 390 392 610 655 683 765 811
Nursing Homes Support Scheme
1,026 1,046 998 857 874 940 940 962
National ServicesL 266 264 414 200 122 308 314 322
Health and Wellbeing 152 150 146 234 201 222 233 241
National Ambulance Service
139 144 151 157 166
National Cancer Control Programme
11 15 72 78 85
Clinical Strategy and Programmes
30 54 64 74
Quality Improvement 8 9 8
Quality Assurance and Verification
8 3 4 6
Emergency Management 2
Drugs Task Force 22
Quality and Clinical Care 25 25
Other 79 60 77 3
Corporate 430 375 244 204
Multi-care groupF 486 451 477 122
The
HS
E N
atio
nal S
ervi
ce P
lan
and
its
Rel
atio
nshi
p w
ith
the
Hea
lth
Vote
26
The HSE National Service Plan and its Relationship with the Health Vote
Appendix II: HSE National Service Plan Net Allocations 2011-2018

€millions 2011 2012 2013 2014 2015 2016 2017 2018
Demand-Led 2,465 2,519 2,571 2,441 2,486 2,797 3,048 3,107
Primary Care Reimbursement Service*
2,453 2,518 2,562 2,433 2,486 2,417 2,561 2,568
State Claims Agency 128 224 274
Local Demand-Led Schemes
243 250 252
Overseas Treatment 9 14 14
Repayment Scheme 12 1 9 8
Pensions
Pensions** 606 737 678 573 435 322 409 403
Grand Total 12,972 12,852 12,968 12,617 12,131 12,929 13,928 14,556
* 2012 PCRS and Primary Care figure is taken from National Service Plan 2013. National Service Plan 2012 did not differentiate between Primary Care and PCRS.
** The drop in Pensions expenditure from 2015 onwards is a result of the remittance of income from pension levies into the National Service Plan.L Between 2011 and 2014 there was a re-categorisation between National Services and Corporate.F After 2014, the multi-care group was distributed among specific divisions.
Note: Figures exclude Children and Families division from 2011-2014, for like-to-like comparison.
The
HS
E N
atio
nal S
ervi
ce P
lan
and
its
Rel
atio
nshi
p w
ith
the
Hea
lth
Vote
The HSE National Service Plan and its Relationship with the Health Vote
27

€millions 2011* 2012* 2013* 2014* 2015 2016 2017 2018
Operational Services 10,327 10,119 10,273 10,094 10,935 11,399 12,072 12,438
Primary Care
Primary Care 335 372 400 726 757 793 828 874
Social Inclusion 119 115 114 127 128 134 145
Palliative Care 81 78 72 82 82 86 86
Primary Care Total 535 565 586 726 966 1,003 1,048 1,106
Acute Hospitals 4,633 4,545 4,671 4,794 4,880 5,032 5,352 5,505
Disability Services 1,576 1,541 1,535 1,429 1,563 1,665 1,782 1,822
Mental Health Services 712 707 733 766 781 812 872 937
Services for Older People
407 390 392 610 1,042 1,051 1,148 1,126
Nursing Homes Support Scheme
1,026 1,046 998 857 874 1,005 1,002 1,030
National Services** 266 264 414 200 397 312 316 325
Health and Wellbeing 152 150 146 234 213 229 239 247
National Ambulance Service
139 144 152 157 166
National Cancer Control Programme
11 15 72 78 86
Clinical Strategy and Programmes
30 55 64 74
Quality Improvement 8 9 8
Quality Assurance and Verification
8 3 4 6
Emergency Management 2
Drugs Task Force 22
Quality and Clinical Care 25 25
Other 79 60 77 3
Corporate 430 375 244 204
Multi-care group 486 451 477 122
The
HS
E N
atio
nal S
ervi
ce P
lan
and
its
Rel
atio
nshi
p w
ith
the
Hea
lth
Vote
28
The HSE National Service Plan and its Relationship with the Health Vote
Appendix III: HSE National Service Plan Gross Allocation 2011-2018

€millions 2011* 2012* 2013* 2014* 2015 2016 2017 2018
Demand-Led 2,465 2,519 2,571 2,441 2,613 2,920 3,162 3,221
Primary Care Reimbursement Service
2,453 2,518 2,562 2,433 2,613 2,540 2,674 2,681
State Claims Agency 128 224 274
Local Demand-Led Schemes***
243 250 252
Overseas Treatment 9 14 14
Repayment Scheme 12 1 9 8
Pensions
Pensions 606 737 678 573 611 665 729 868
Grand Total 13,398 13,375 13,522 13,107 14,158 14,983 15,962 16,527
* Before 2015, the HSE reported income against Care Programmes instead of Divisions. The Gross Expenditure for 2011 to 2014 only includes income accrued to the Acute Hospitals Division. For reference, the remainder of the income ranged from €99m to €103.8m each year.
** After 2015, Primary Care Leases moved from National Services to Primary Care.
*** Included in PCRS until 2016.
Note: Figures exclude Children and Families division from 2011-2014, for like-to-like comparison.
The
HS
E N
atio
nal S
ervi
ce P
lan
and
its
Rel
atio
nshi
p w
ith
the
Hea
lth
Vote
The HSE National Service Plan and its Relationship with the Health Vote
29

Notes
The
HS
E N
atio
nal S
ervi
ce P
lan
and
its
Rel
atio
nshi
p w
ith
the
Hea
lth
Vote
The HSE National Service Plan and its Relationship with the Health Vote
30
Notes
The
HS
E N
atio
nal S
ervi
ce P
lan
and
its
Rel
atio
nshi
p w
ith
the
Hea
lth
Vote
The HSE National Service Plan and its Relationship with the Health Vote
31

Notes
The
HS
E N
atio
nal S
ervi
ce P
lan
and
its
Rel
atio
nshi
p w
ith
the
Hea
lth
Vote
The HSE National Service Plan and its Relationship with the Health Vote
32

Contact: [email protected] Go to our webpage: www.Oireachtas.ie/PBO Publication date: 24 September 2018
Houses of the Oireachtas Leinster House Kildare Street Dublin 2 D02 XR20
www.oireachtas.ie Tel: +353 (0)1 6183000 or 076 1001700 Twitter: @OireachtasNews
Connect with us
Download our App