patterns of practice: current research on k-12 interpreting
TRANSCRIPT
Leilani J. Johnson
Marty M. Taylor
Brenda Schick
Susan E. Brown
Laurie Bolster
Patterns of Practice: Current Research on
K-12 Interpreting
2010-2014 US Department of Education, Office of Special Education Programs, Grant H325K100234
RID National Conference August 8, 2015 PPT available at: unco.edu/doit
Overview
Introduction of the OSEP Project Investigation
National Results on Educational Interpreting
• State Standards Investigation
• Educational Interpreter
Performance Assessment (EIPA Analyses)
• Survey of Educational Interpreters
Summit on Educational Interpreting
• Implications for Practitioners
• Questions & Answers

IRB Approved
Overarching study questions
• What are the national demographics of educational interpreters
currently working in K-12 settings and the deaf and hard of hearing
students they serve?
• What are the working conditions of educational interpreters, including
hiring criteria, level and experience of their work, and their academic
and professional credentials?
• What are educational interpreters’ primary roles and responsibilities,
and what other assignments are part of their daily work?
• What are the current patterns of practice between educational
interpreters as related service providers and their interface with the K-
12 educational system?

State
Standards
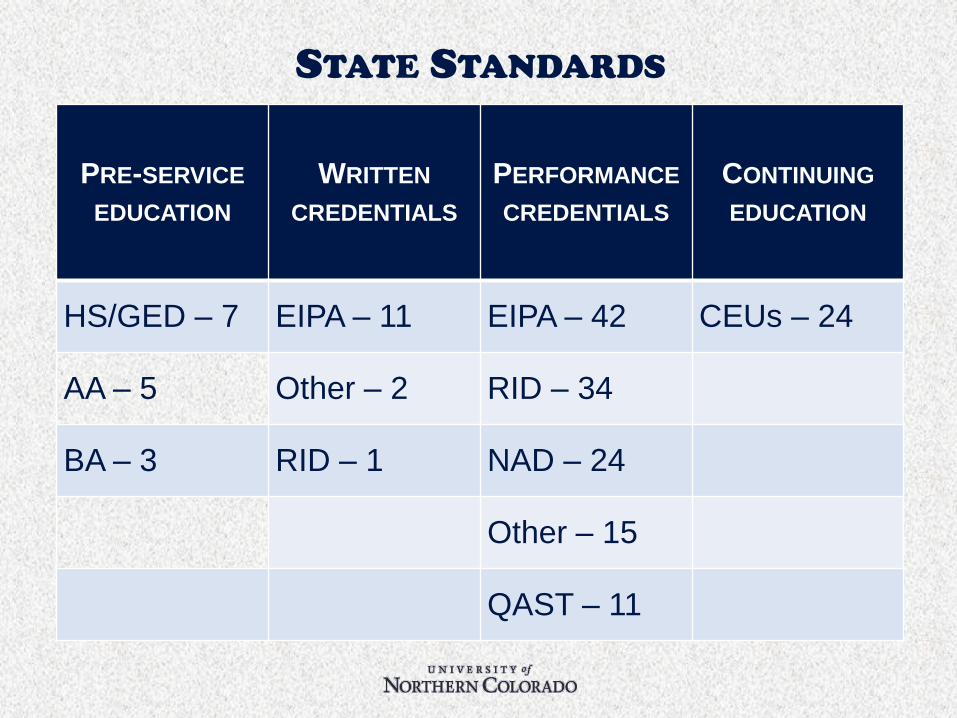
PRE-SERVICE
EDUCATION
WRITTEN
CREDENTIALS
PERFORMANCE
CREDENTIALS
CONTINUING
EDUCATION
HS/GED – 7 EIPA – 11 EIPA – 42 CEUs – 24
AA – 5 Other – 2 RID – 34
BA – 3 RID – 1 NAD – 24
Other – 15
QAST – 11
STATE STANDARDS

2014 EIPA State Standards Including EIPA Written Test (W)
EIPA 3.0 EIPA 3.5 EIPA 4.0
AL AZ ND AK + written
LA CO + written NE CA
MS GA NH + written DE
NJ HI OK KS
NC ID OR KY + written
TN IL + written PA MN
WI IN + written SC + written NM + written
IA SD NV
MA VA RI + written
ME WA + written TX + written
MI + written WV + written UT + written
MT + written WY + written
7 24 11
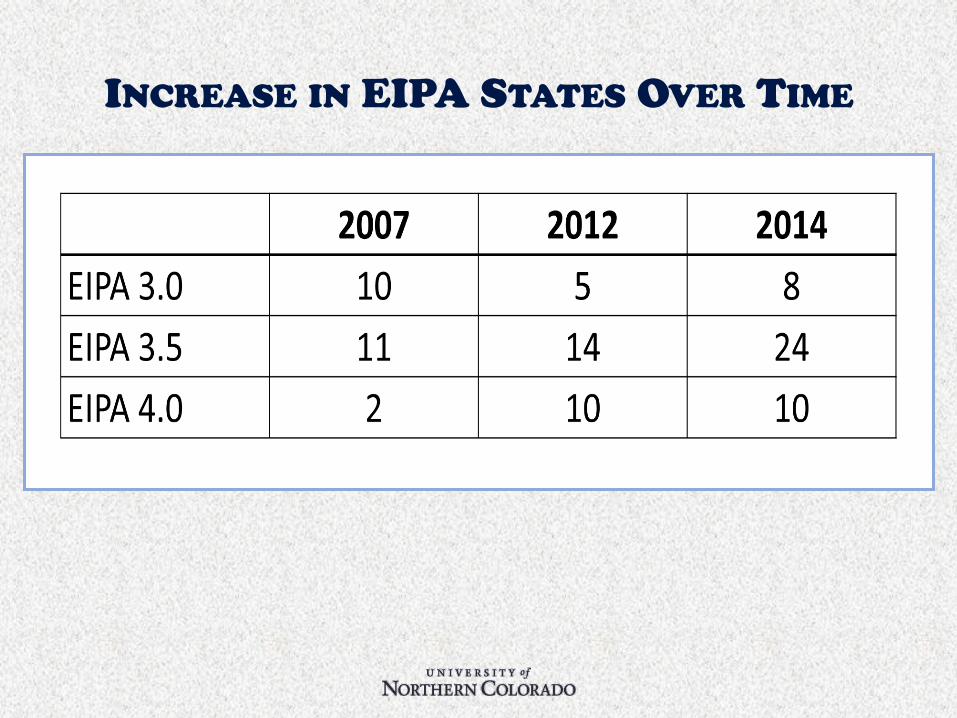
INCREASE IN EIPA STATES OVER TIME
EIPA Analyses
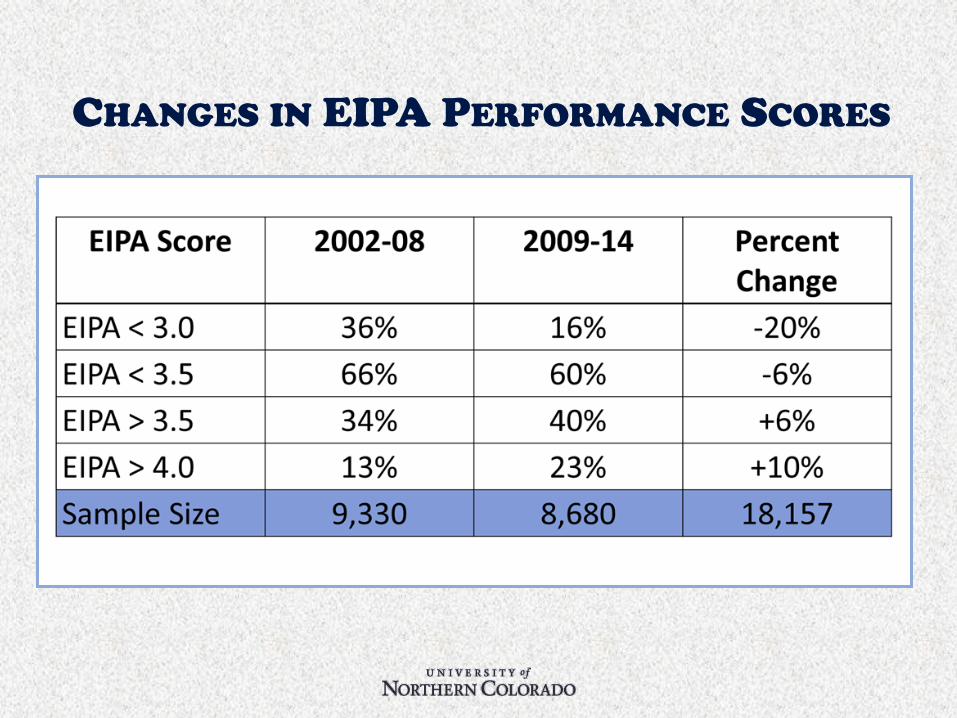
CHANGES IN EIPA PERFORMANCE SCORES

EIPA PERFORMANCE TEST RESULTS
0
0.5
1
1.5
2
2.5
3
3.5
4
4.5
5
ASL PSE MCE
EIP
A R
atin
g S
co
re
Elementary
Secondary
Percent of Evaluations
PSE = 83.7%
ASL= 11.1%
MCE= 5.2%
Thanks to Dr. Cathy Carotta and Ms. Frances Beaurivage at Boystown National Research Hospital and the Center for Childhood Deafness for allowing access to data from the EIPA and EIPA Written Test.

EIPA PERFORMANCE TEST DOMAINS
Roman I VOICE TO SIGN
Prosody, Space, & Grammar
10 – 12 Rated skills
Roman II
SIGN TO VOICE
Interpreting for a student
10 Rated skills
Roman III
VOCABULARY &
FINGERSPELLING
9 Rated skills
Roman IV
OVERALL FACTORS
Cohesion, Discourse
7 Rated skills
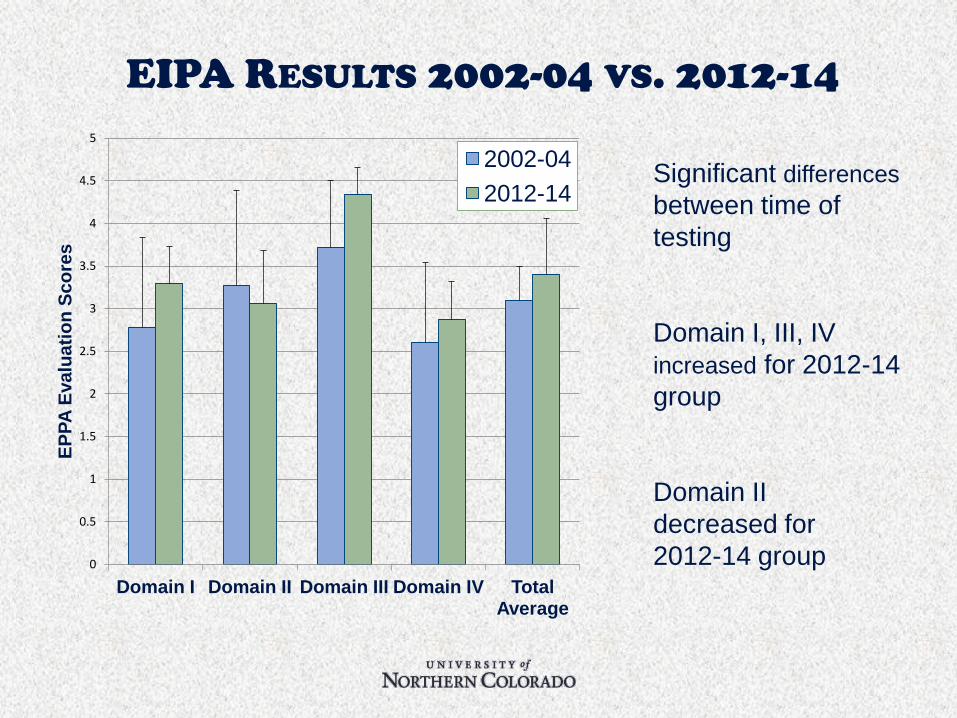
EIPA RESULTS 2002-04 VS. 2012-14
Significant differences
between time of
testing
Domain I, III, IV
increased for 2012-14
group
Domain II
decreased for
2012-14 group 0
0.5
1
1.5
2
2.5
3
3.5
4
4.5
5
Domain I Domain II Domain III Domain IV Total Average
EP
PA
Eva
lua
tio
n S
co
res
2002-04
2012-14

WHAT PREDICTS THE OVERALL EIPA SCORE
** = p < .001
Space
Amount
Vocabulary
Key
Vocabulary Numbers Overall
Prosody .931** 726** .601** .601** .940**
Use of
Space .714** .838** .612** .944**
Amount
Vocabulary .736** .722** .713**
Key
Vocabulary .605** .861**
Numbers .579**
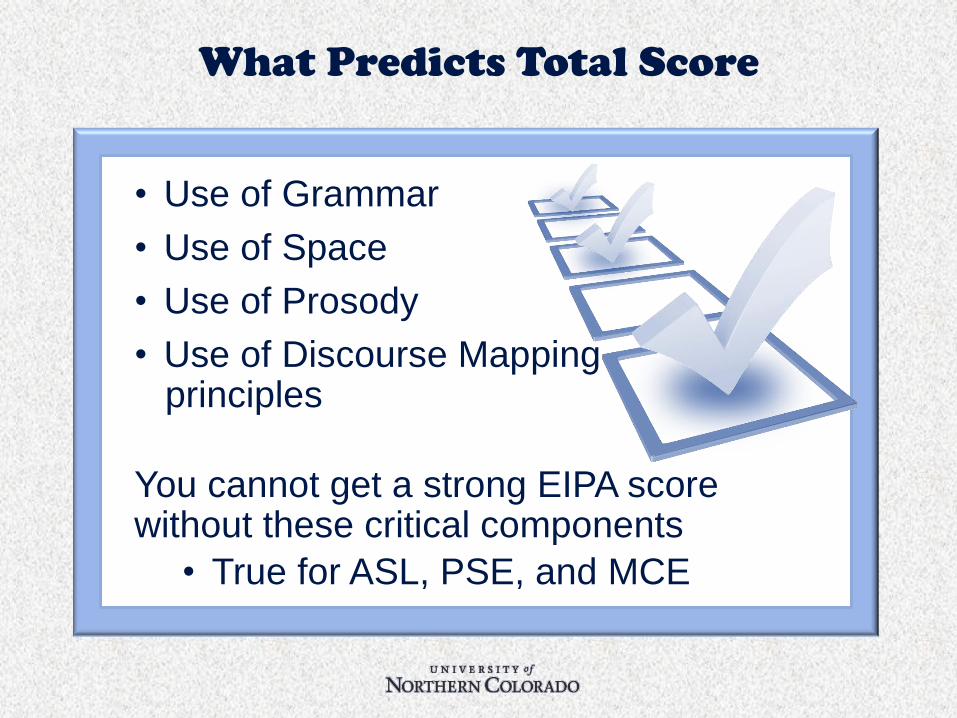
What Predicts Total Score
• Use of Grammar
• Use of Space
• Use of Prosody
• Use of Discourse Mapping principles
You cannot get a strong EIPA score without these critical components
• True for ASL, PSE, and MCE
Analysis of EIPA Written
Test Results Test of Content Knowledge Related to Working with K-12 Students in a
School Environment
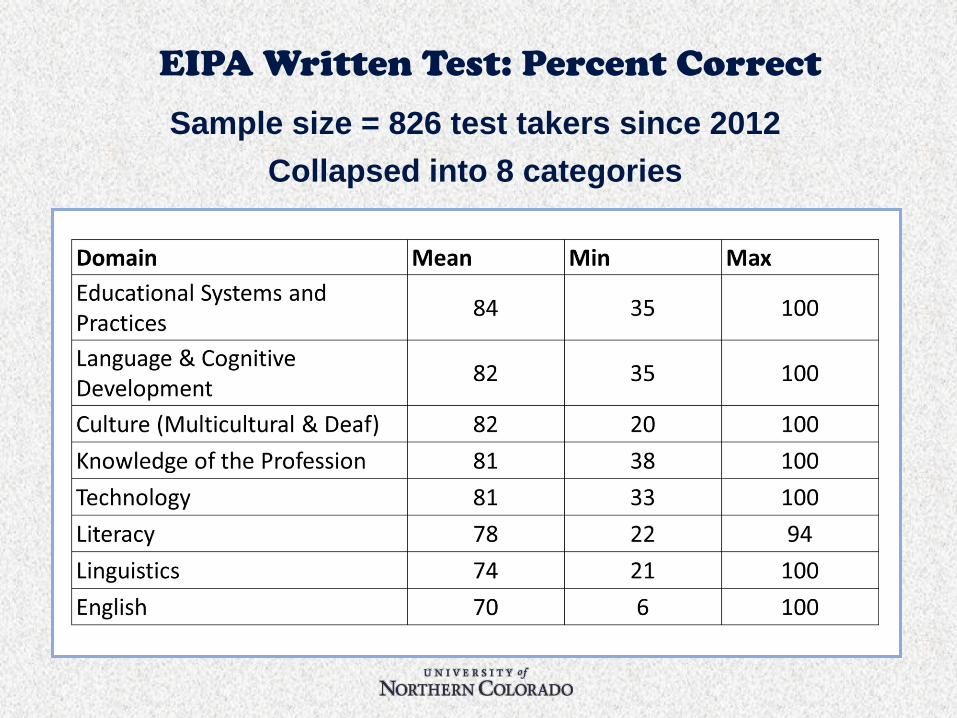
EIPA Written Test: Percent Correct
Sample size = 826 test takers since 2012
Collapsed into 8 categories
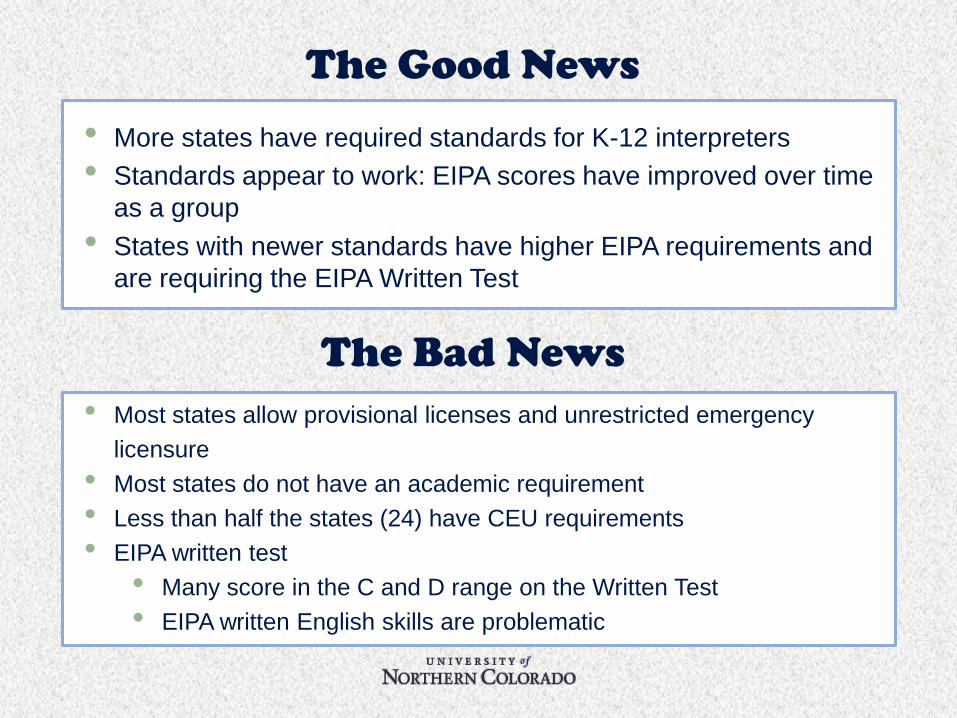
• More states have required standards for K-12 interpreters
• Standards appear to work: EIPA scores have improved over time
as a group
• States with newer standards have higher EIPA requirements and
are requiring the EIPA Written Test
The Good News
• Most states allow provisional licenses and unrestricted emergency
licensure
• Most states do not have an academic requirement
• Less than half the states (24) have CEU requirements
• EIPA written test
• Many score in the C and D range on the Written Test
• EIPA written English skills are problematic
The Bad News

NATIONAL
SURVEY OF
EDUCATIONAL
INTERPRETERS
Survey Overview
• 98 primary questions
• Primarily quantitative questions
• 20-30 minutes to complete
• No forced responses
• Pilot run: Canadian educational interpreters
• Launched April 7, 2014/Closed April 25, 2014
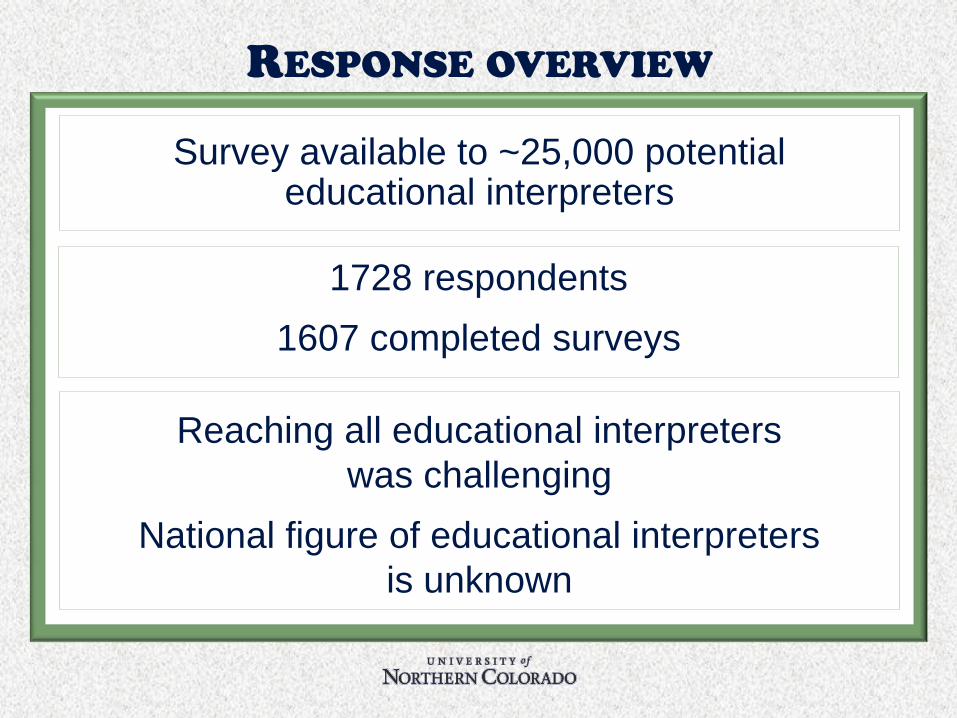
RESPONSE OVERVIEW
Survey available to ~25,000 potential educational interpreters
Reaching all educational interpreters
was challenging
National figure of educational interpreters
is unknown
1728 respondents
1607 completed surveys

SURVEY TOPICS
Demographics
Roles & Responsibilities
D/HH Student Demographics
Working Conditions
Salary & Benefits

DEMOGRAPHICS
Female
Male
Prefer not to respond
1459
9
13
GENDER
ETHNICITY


DEMOGRAPHICS
0 100 200 300 400 500 600 700
High school diploma or GED
Some college course work
College-level certificate program
Associate's Degree
Bachelor's Degree
Graduate Degree
195
56
141
617
484
116
EDUCATION
8%
39%
31%
7%
12%
3%

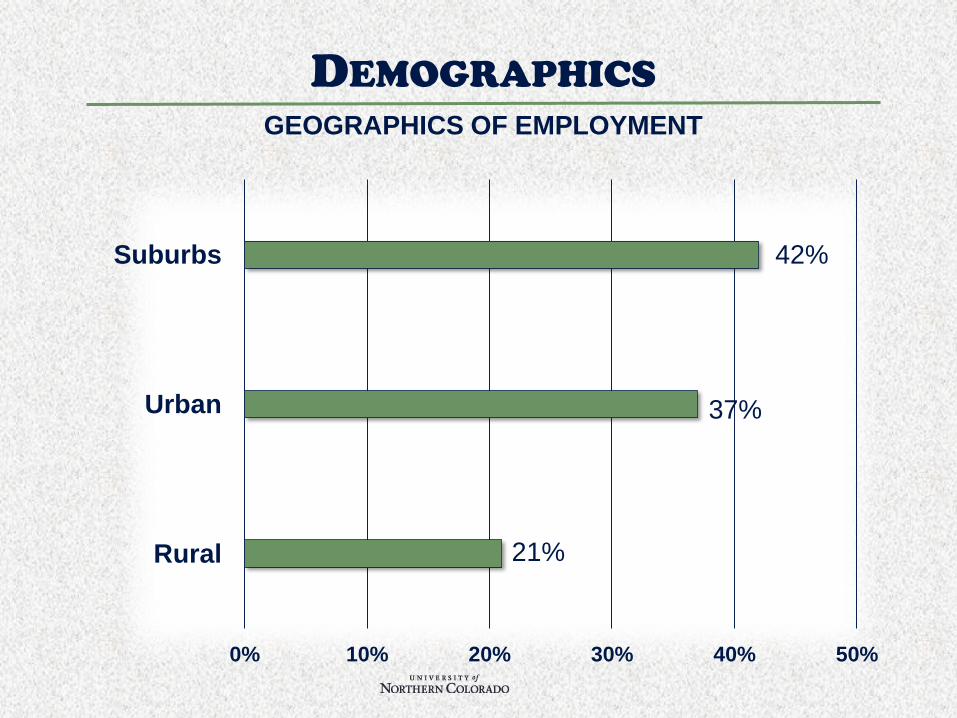
Rural
Urban
Suburbs
0% 10% 20% 30% 40% 50%
42%
37%
21%
DEMOGRAPHICS GEOGRAPHICS OF EMPLOYMENT

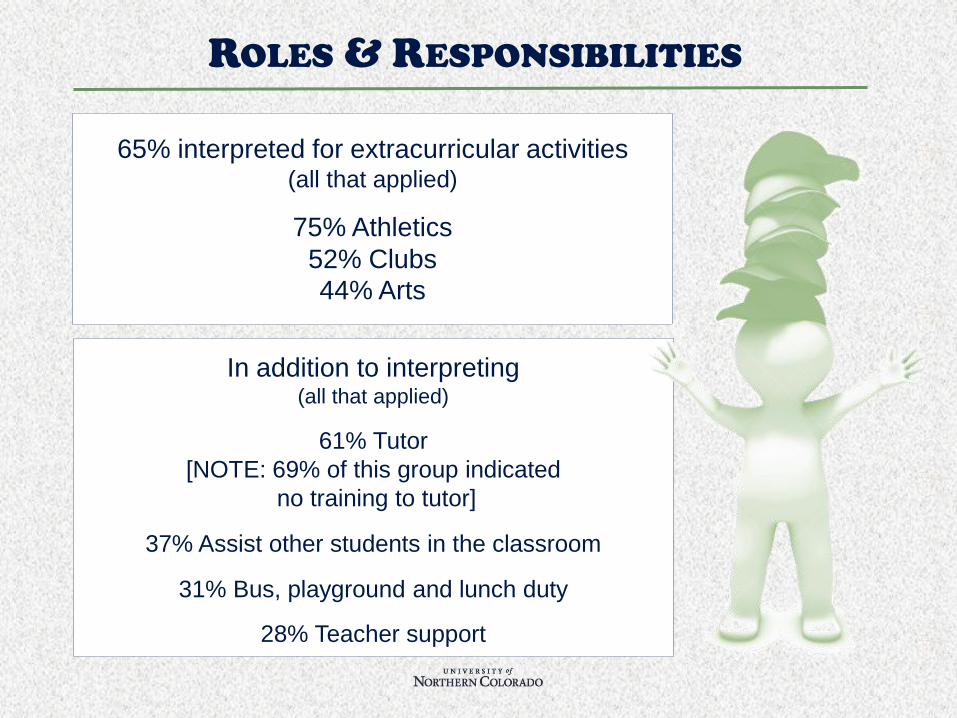
65% interpreted for extracurricular activities (all that applied)
75% Athletics
52% Clubs 44% Arts
In addition to interpreting (all that applied)
61% Tutor
[NOTE: 69% of this group indicated
no training to tutor]
37% Assist other students in the classroom
31% Bus, playground and lunch duty
28% Teacher support
ROLES & RESPONSIBILITIES
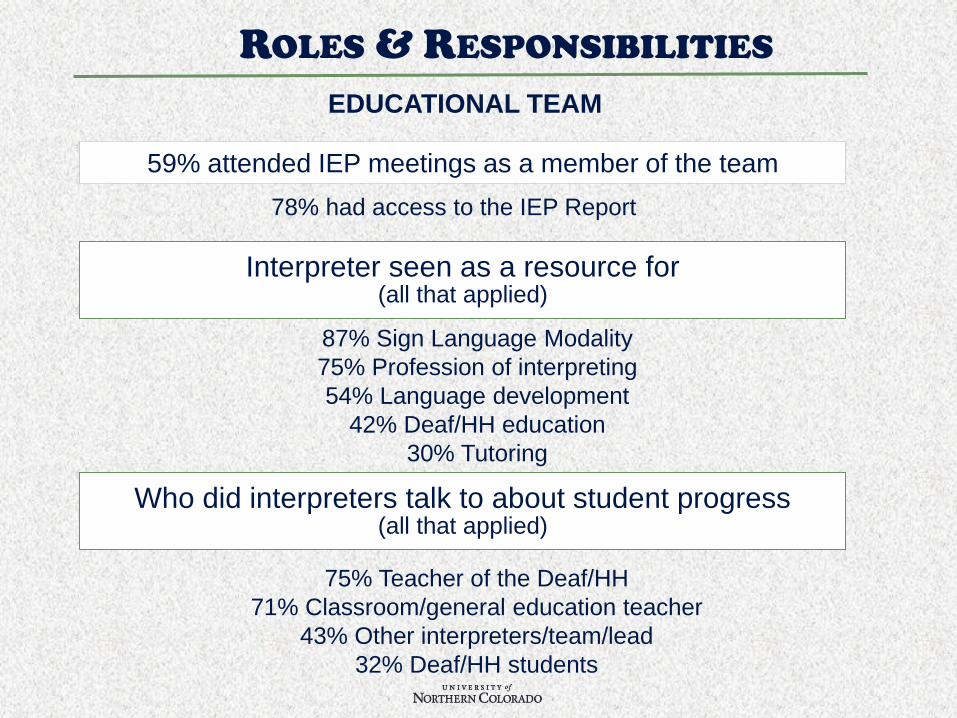
Interpreter seen as a resource for (all that applied)
Who did interpreters talk to about student progress (all that applied)
EDUCATIONAL TEAM
59% attended IEP meetings as a member of the team
78% had access to the IEP Report
87% Sign Language Modality
75% Profession of interpreting
54% Language development
42% Deaf/HH education
30% Tutoring
75% Teacher of the Deaf/HH
71% Classroom/general education teacher
43% Other interpreters/team/lead
32% Deaf/HH students
ROLES & RESPONSIBILITIES

KNOWLEDGE
89% received specialized training to work in a K-12 setting (all that applied)
55% Language development
54% Child development
45% Tutoring
45% Literacy
38% Educational theory
42% Content specific coursework
Child development
Cognitive development
Language development
52% indicated no training in
(check all that apply
average for all three areas)

WORKING CONDITIONS
• 75% had an official job title of “Interpreter”
• 61% worked primarily with one student
42% worked in pre-k/elementary
38% worked in high school
20% worked in middle school
66% Deaf
34% Hard of Hearing
37% of students
spoke for themselves
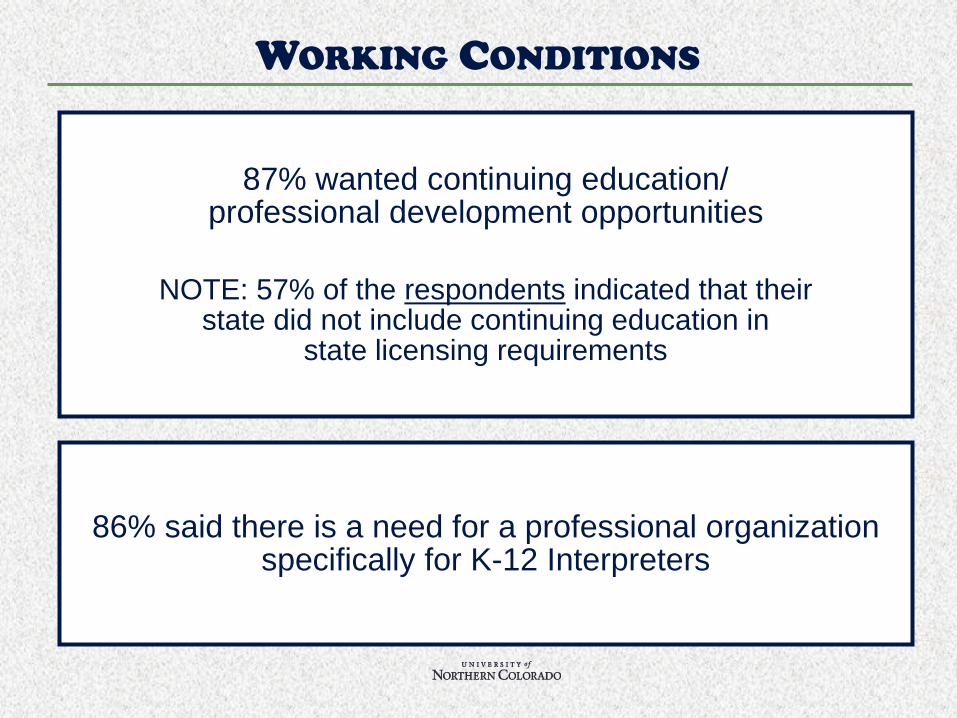
87% wanted continuing education/ professional development opportunities
NOTE: 57% of the respondents indicated that their state did not include continuing education in
state licensing requirements
86% said there is a need for a professional organization specifically for K-12 Interpreters
WORKING CONDITIONS

36%
Salaried
$20,000-$49,999
83% receive benefits
COMPENSATION
64%
Hourly
$15.00-$27.49
National Summit on
Educational Interpreting

Continue discovering patterns of practice
Validate survey findings – or not
Gather qualitative data in addition to the quantitative data from the survey
PURPOSE OF THE SUMMIT
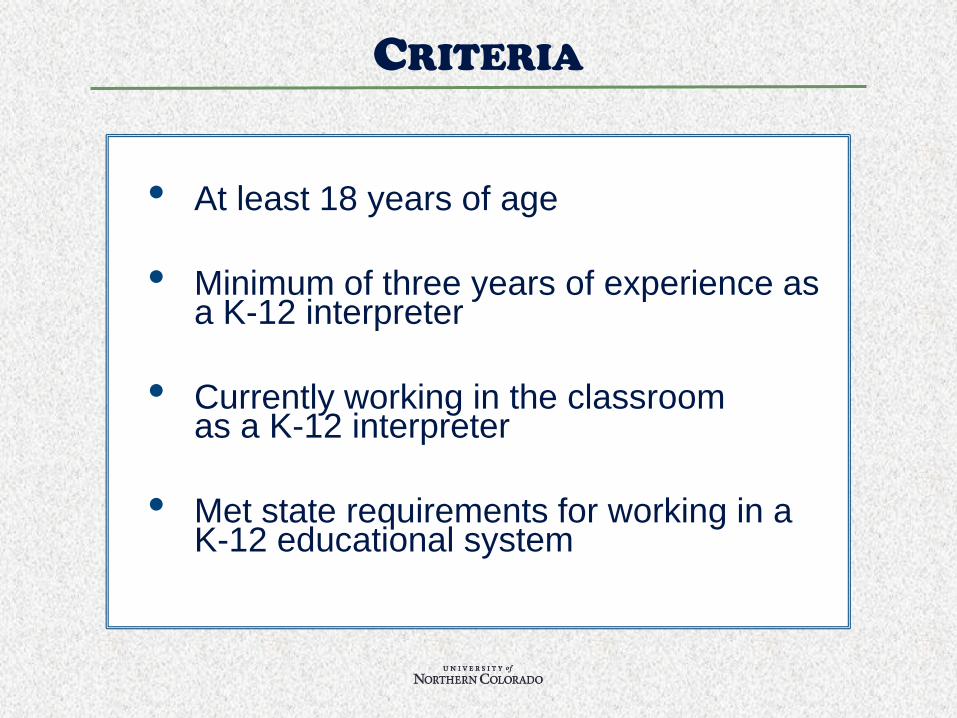
• At least 18 years of age
• Minimum of three years of experience as a K-12 interpreter
• Currently working in the classroom as a K-12 interpreter
• Met state requirements for working in a K-12 educational system
CRITERIA
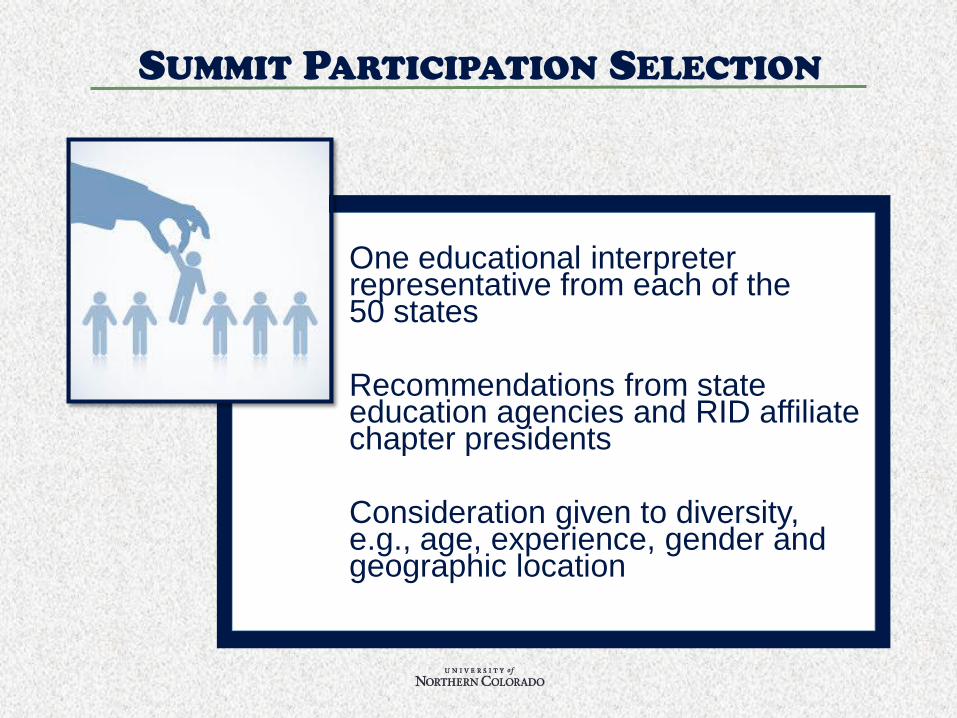
One educational interpreter representative from each of the 50 states
Recommendations from state education agencies and RID affiliate chapter presidents
Consideration given to diversity, e.g., age, experience, gender and geographic location
SUMMIT PARTICIPATION SELECTION
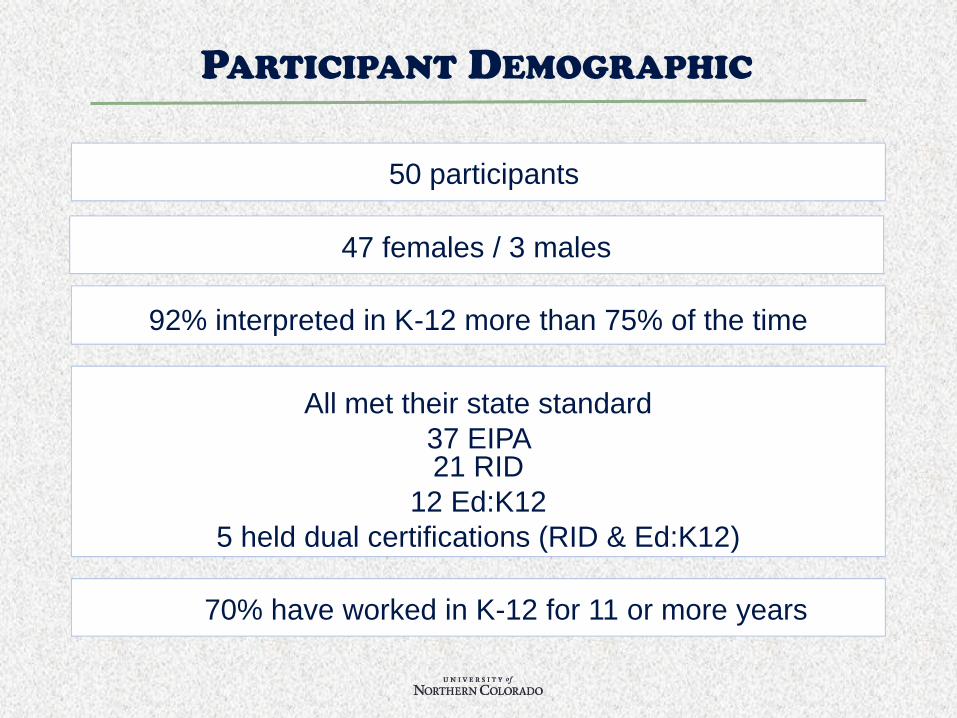
47 females / 3 males
50 participants
92% interpreted in K-12 more than 75% of the time
All met their state standard
37 EIPA 21 RID
12 Ed:K12
5 held dual certifications (RID & Ed:K12)
70% have worked in K-12 for 11 or more years
PARTICIPANT DEMOGRAPHIC

Deaf/HH students from other countries, and with low language skills,
constituted large majority of students.
Understanding the educational system and on how Deaf/ HH children learn
was a stated as a training need.
Qualified supervisors was identified as essential.
A national organization, specifically focused on
educational interpreting was endorsed by the majority
A national standard, higher than current state standards,
was recommended.
SUMMIT RESULTS
Only a small number of participants knew about the
EIPA Guidelines for Professional Conduct
The overarching goal was to identify
current practices in
K-12 interpreting
and to better prepare interpreters for
educational settings.
The contents of this publication were developed under a grant from the
U.S. Department of Education, #H325K100234. However, this content
does not necessarily represent the policy of the U.S. Department of
Education, and you should not assume endorsement by the Federal
Government or the Project Officer, Maryann McDermott.
PPT available at: unco.edu/doit

unco.edu/doit
QUESTIONS

OTHER RESOURCES
• Clerc Center: http://www.gallaudet.edu/clerc-center/information-and- resources/products-and-publications/classroom-interpreting-guides.html
• Classroom interpreting: http:www.classroominterpreting.org
• Hands and voices: http://www.handsandvoices.org/
• RID Standard Practice Paper: https://drive.google.com/file/d/0B3DKvZMflFLdcFE2N25NM1NkaGs/view
• Pepnet 2: http://www.pepnet.org/
Contacts
• Leilani Johnson - University of Northern Colorado: [email protected] • Marty Taylor – Interpreting Consolidated: [email protected] • Brenda Schick – University of Colorado Boulder: [email protected] • Susan Brown – University of Northern Colorado – [email protected] • Laurie Bolster - University of Northern Colorado – [email protected]