perturbed angular correlation method in materials science · 2018-07-18 · 1.1. the perturbed...
TRANSCRIPT
Habilitation Thesis
The Henryk Niewodniczański
INSTITUTE OF NUCLEAR PHYSICS
Polish Academy of Sciences
ul. Radzikowskiego 152, 31–342 Kraków, Poland
www.ifj.edu.pl/publ/hab
Kraków, June 2013
Perturbed Angular Correlation method in materials science
Agnieszka Kulińska

Published by Institute of Nuclear Physics
Polish Academy of Sciences
Kraków, 2013
Recenzent: dr hab. Marta Wolny-Marszałek, prof. IFJ PAN
ISBN 978-83-63542-08-5

Contents 3
Contents
Preface 5
1. Introduction 7
1.1. The Perturbed Angular Correlation method 7
1.2. Experimental details 10
1.3. Application of the PAC technique 12
2. Fundamental research with PAC 13
2.1. Electric field gradient in the intermetallic compounds 13
Aluminides (Hf-Al and Zr-Al systems) 13
Correlation between the experimental and calculated EFG 18
2.2. Lattice location of impurities in the intermetallic compounds 19
Probe site occupation in the lattice 20
Site preference of the impurity atoms 21
Switching of the probe site in the lattice 23
Probe segregation into the minority phase 25
2.3 Temperature dependence of the EFG in the intermetallic compounds 26
Regular – T3/2
and linear dependencies 27
Anomalous dependencies 29
3. Application of PAC in condensed matter and materials physics 31
3.1. Impurities in solids 31

4 Contents
Impurity influence on the EFG in TiPd 32
EFG dependence on the impurity concentration 33
Impurity influence on MHF 34
3.2. Magnitude and texture of the MHF 36
Ni films irradiated with heavy ions 37
Magnetic texture of the Ni thin film 39
3.3. Nanomaterials 41
Mechanical alloying of Fe-Mn 42
Mechanical alloying of Hf-Al 43
Ball milling of Hf-Al compounds 44
3.4. Oxidation of the intermetallic compounds 47
EFG at 181
Ta probe in Hf-, Zr- and Al- oxides 48
Oxidation of zirconium aluminides 50
3.5. Phase transformations 52
Martensitic transformation in TiPd 53
Composition influence on the martensitic transformation 54
4. Summary 56
5. References 61

5
Preface
The investigation of the properties of condensed matter using experimental
nuclear methods is becoming increasingly important. An extremely broad
range of techniques is used, including the use of particles, such as positrons
and neutrons, ion beams, and the detection of radiation from nuclear decays or
nuclear reactions. The hyperfine methods based on the interaction of the
nuclear electromagnetic moments of the probe nuclei with the hyperfine fields
arising from the electronic charges and spin distributions, can characterize
materials at the smallest possible atomic scale. In this work, I will demonstrate
the potential of Perturbed Angular Correlation (PAC) method in the
fundamental research, as well as its application in the solid state and material
physics.
Chapter 2 presents a detailed picture of the application of the PAC method
to fundamental research of intermetallic compounds performed in the last
decade. I selected the Hf-Al and Zr-Al systems as a model example to
illustrate the comprehensive measurements of the electric field gradients
(EFG) and their temperature dependencies, and to demonstrate the precision
and efficiency of the PAC technique. The comparison of the experimental data
with the calculated ones confirmed the high quality of the obtained results. In
this Chapter, I discussed the problems of (i) the impurity location in a lattice,
(ii) site and phase preference of the probes in selected cases of: HfAl3, ZrAl3,
ZrAl and ZrAg, (iii) temperature dependencies of the EFG.
Chapter 3 describes the selected examples of the PAC application in
condensed matter and material physics study. From among the numerous
possibilities I selected a few cases to illustrate the sensitivity and advantages
of this hyperfine method. I discussed the following topics: (i) the impurity
influence on the electric field gradient and the magnetic hyperfine field, (ii)
the application of the PAC method in the nanocrystalline materials study (Hf-
Al and Fe-Mn powders), (iii) oxidation of intermetallic compounds (Zr-Al

6 Preface
compounds annealed in air), (iv) the impurity influence on martensitic phase
transformation (TiPd shape memory alloys).
This monograph is based on the published papers, as well as the results
that have not been published yet.
7
1. Introduction
The nuclear solid state methods involve inter alia the detection of the
particles or radiation from the nuclear decays or nuclear reactions to
investigate the properties of condensed matter. This extremely broad range of
methods can be divided into two main groups: ion beam analysis (IBA) and
hyperfine interaction (HFI) techniques. The various methods from the first
group are very important for determination of the elemental composition of
materials, and for atomic arrangement. The widely used and most well-known
technique is the Rutherford Backscattering Spectroscopy (RBS), which is
based on the elastic backscattering of charged particles by nuclei in solids.
Hyperfine techniques such as the Mössbauer spectroscopy (MS), the Nuclear
Magnetic Resonance (NMR), and the Perturbed Angular Correlation (PAC)
have been extensively employed to investigate the structural, magnetic and
electronic properties at atomic scale in the condensed matter [Sch96].
In this work, I present the use of the PAC method in fundamental research
of the condensed matter as well as its application in the solid state and material
physics. I give the results of the intensive studies on the intermetallic
compounds, oxides, magnetic materials; thin films and nanocrystalline
materials. I summarize the EFG parameters for Hf-Al and Zr-Al intermetallic
systems.
1.1. Perturbed Angular Correlation method (PAC)
The time-differential perturbed angular correlation (TDPAC) method uses
nuclei, which decay by emitting a sequence of the rays. The intermediate
nuclear state has a sufficiently long lifetime for nuclear spin precession to be
observed [Fra65]. The full abbreviation TDPAC is used to emphasize that the
method is time-differential PAC; however, in this work the shorter PAC
abbreviation will be used for brevity. The observation of the first quanta of

8 Perturbed Angular Correlation method (PAC)
a cascade in a fixed direction selects an aligned sub-ensemble of nuclear
spins. The basic requirement of PAC is the anisotropic angular distribution of
the second quanta. In solids, the nuclear moments of the intermediate state
interact with the hyperfine field causing a time dependent redistribution of the
population of the m-substates, which perturbs the angular distribution of the
second quantum. Hence, the PAC method can provide useful information
on the hyperfine field acting on the probe nuclei.
The probability distribution of finding at the certain angle with respect
to the direction of is given by W(), which can be expanded into a series of
Legendre polynomials Pk(cos)
k
W (cos(2)P(1)AA)( kkk , (1.1)
where Ak (1) and Ak(2) are the anisotropy coefficients determined by the
nuclear properties of the first and second transition, respectively [Fra65].
The summation index k takes non-negative even integers with the upper limit
determined by spins of the nuclear states involved and the multipolarities of
the two rays. If the direction of the nuclear spin in the intermediate state
varies with time, the angular correlation function becomes time dependent
(W(,t)). In a polycrystalline sample the distribution function can be described
with
k
kkkkk (cos(t)PGA)t,(W . (1.2)
The perturbation factor Gkk(t) includes information about the magnetic
dipole and/or the electric quadrupole interaction causing the change of the
nuclear spin direction. The higher order terms are usually neglected, and the
Equation 1.2 in lowest order can be written as
W(,t) = 1+A22G22(t)P2(cos). (1.3)
As long as the hyperfine interaction is constant during the observation
time, the probe nuclei are exposed to the static pure electric interaction, and
the perturbation factor G22(t) is given by
,t)(gcos)(s)t(Gn
Qnn
3
0
2222 (1.4)
where the hyperfine interaction (hfi) parameters are described by the
quadrupole coupling constant
Q = eQVzz/h (1.5)
Introduction 9
and the asymmetry parameter = (Vxx–Vyy)/Vzz.
The electric field gradient (EFG) acting on a nucleus in the lattice position
of the non-cubic arrangement of the nearby atomic cores and electrons causes
a splitting of the nuclear levels due to the electric quadrupole interaction
between the nuclear quadrupole moment Q and this field gradient. The g2n()
coefficients describe the quadrupole splitting of the intermediate state of the
probe nuclei. Vii are the components of the EFG tensor in the principal axes
frame. Determination of the hfi parameters gives the information about the
strength (Vzz) and symmetry () of the observed electric field gradient. The
approximate values for s2n() and g2n() given in the form of polynomials of
calculated using the coefficients for the polycrystalline samples, are
tabulated in [Kaj73].
Considering that the probe nuclei situated at the different lattice sites can
experience different local EFGs, the experimental data can be least square
fitted with
RQiiniin
n
Qiinin
i
i
el ,)(gt)(gexpt)(gcos)(sfG 22
3
0
2222
. (1.6)
The fraction fi reflects the occupation of nonequivalent probe sites in the
structure of the investigated sample. The imperfections of the crystal lattice
structure (defects, impurities, etc.) which occur in the experiment very often
lead to damping of the measured perturbation factor, i.e. the distribution of the
EFG. This is described by the width of the quadrupole frequency distribution
of the Lorentzian shape.
In the case of the static magnetic field acting on the probe nuclei, the
perturbation factor is fitted with
RLi
n
Ln
i
i
magn ,tnexptncossfG
2
0
222. (1.7)
The precession frequency of the magnetic moment around the field is
given by
L = Bhf/ħ, (1.8)
known as the Larmor frequency. The Bhf is the hyperfine magnetic field;
is the magnetic moment of the intermediate state.
The parameter in Equations 1.6 and 1.7 takes into account the finite time
resolution of the apparatus R [Ber69]. The coefficients s2n depend on the
single– or polycrystalline form of the sample. In the case of textured samples,
the s2n amplitudes in Equations 1.6 and 1.7 are treated as free parameters in the
fitting procedure.
10 Experimental details
1.2. Experimental details
The time developments of the angular correlation can be visualized
qualitatively as a rotation of the radiation emission pattern. Usually, four
detectors based on BaF2 and/or NaI scintillators at fixed angle (90° and
180°) are used for recording the coincident count rates as a function of time
between emission of 1 and 2. The intensity ratio R(t) of the combination of
the coincidence time spectra
( ) ( ) ( )
( ) ( ) (1.9)
directly related to the perturbation factor G22(t) by
tGfAtR i
i
i
eff
2222)( (1.10)
and corrected for the background is obtained in the PAC experiments.
The most important requirement for an application of the PAC technique is
the use of radioactive sources that possess an isomeric level with a lifetime of
a few nanoseconds up to several microseconds. The time limits are set by the
time resolution of the experimental apparatus and by the signal-to-noise
considerations (the real coincidence – to accidental coincidence count rate
decreases as 1/N). In the presented experiments, two most commonly used
PAC probes were: i) 181
Ta being a product of - decay of
181Hf, and ii)
111Cd
being a product of electron capture decay of 111
In. The intermediate levels of
these probe nuclei have the quadrupole moment Q and magnetic dipole
moment large enough for the electric field gradient and the magnetic field
investigations, respectively. The local electronic changes that occur because of
the mother isotope’s decay have in metals the time scale of 10-12
–10-13
s– the
time scale of electronic relaxation. The PAC measurement is performing
during 10-8
– 10-7
s, so the daughter nucleus can be considered as being in
unperturbed electronic environment. The probe mobility, the position in a
lattice, the site occupation, etc. are determined by the properties of each
mother isotope, but the hyperfine fields are measured for the daughter
isotope’s excited level.
The typical radioactive source I used had the activity of 0.5-1 MBq,
sufficient for the proper counting rate in the PAC measurements. The 181
Hf/181
Ta probes were produced via neutron irradiation of the natural
hafnium in the Maria reactor in Świerk (180
Hf(n,)181
Hf nuclear reaction),
whereas the 111
In/111
Cd were commercially available as a carrier-free 111
InCl3

Introduction 11
solution. Then, the probes were introduced into the investigated samples by
various methods (melting, implantation) according both to the type of the
sample – bulk, nanopowder, or layer – and to the isotope used. Since the half-
life of the 181
Hf and 111
In isotopes amounts to 42.4 days and 2.83 days,
respectively, the sample retains sufficient activity to perform the experiments
for 3-4 months or 2-3 weeks, respectively.
The following procedures were applied to prepare different types of
sample:
bulks: a proper amount of the high purity components were arc-melted a
few times under argon atmosphere, followed by the annealing at
appropriate temperature;
nanopowders: mechanically grounding under Ar atmosphere of the
previously prepared bulk samples using the high-energy ball milling
SPEX2000 equipped with the acrylic vial and two tungsten carbide balls;
layers: e-gun or thermal deposition of a given thickness of the materials on
the crystalline Si or the amorphous SiO2 substrate using the high vacuum
evaporation chamber Univex300.
The PAC probes were introduced into the investigated samples via the
following methods:
neutron irradiation of the prepared compounds containing hafnium as one
of the components or as an admixture,
melting of the radioactive source together with the compounds’
constituents,
ion implantation using an ion implanter (only in the case of 111
In/111
Cd).
Usually, before the PAC experiments, the X-ray diffraction analysis –
sensitive to long-range order –was applied to check the crystal structure of the
prepared samples. An additional detailed description of the experimental
procedure will be presented at the beginning of each section, where necessary.
PAC measurements below room temperature were performed using a closed
cycle helium refrigerator, while above 300 K a small resistance heater or
vacuum oven was applied. The spectra were collected with a standard slow-
fast coincidence set-up with four BaF2 or NaI(Tl) detectors having the time
resolution of about 1 ns and 3 ns, respectively, for 133 keV – 482 keV
cascade in 181
Ta.

12 Application of PAC technique
1.3. Application of the PAC technique
When applying the HFI methods, one measures the hyperfine interaction,
i.e. the interaction between the nucleus magnetic dipole or the electric
quadrupole moment and the magnetic or electric hyperfine field produced at
the nucleus. Because the hyperfine interaction is short-range, it provides
information on the local surroundings of particular atoms. The Perturbed
Angular Correlation method is one of the HFI methods supplying information
about the local electric and chemical environment of the probe nuclei. The
PAC technique, very sensitive to changes at the vicinity of the probe atoms,
offers unique possibilities for investigation of the structure and dynamics of
the nearest neighborhood of the probes, hence it is a perfect tool to study the
polymorphic transformation even in its very early stage.
The intermetallic compounds and the solid-state transformations taking
place in the binary metallic systems are of a great technical and metallurgical
importance, since almost all industrial alloys are heat-treated after the
preparation to improve their properties. Because information included in the
PAC spectra is derived from the whole specimen volume, it is possible to
perform measurements for the alloys of a different stoichiometry and at
different temperatures, and the results enable determination of the
homogeneity and temperature region of the phase under study.
For a long time a quantitative computation of the electric field gradient has
been a very difficult problem. In recent years, this has changed due to the
application of all-electron ab initio band structure theories, especially by using
the full-potential linearized augmented plane wave method (FLAWP) [Bla88,
Bla01] within the framework of the Density Functional Theory (DFT) [Hoh64,
Koh65]. For a reliable prediction of the EFG, most commonly a supercell
approach is used. In this approach a probe atom is located at the center of a
supercell large enough to accommodate significant relaxation. The
combination of the ab initio calculation and PAC experiments can shed light
on the impurity localization in the lattice, and the preferential site occupation
of the probe atoms.
13
2. Fundamental research
with PAC1
2.1. Electric field gradient in the intermetallic compounds
Intermetallic compounds are being considered as an important class of
materials for a variety of applications. A special attention has been given to
the alloys based on aluminides due to their high melting points, good oxidation
resistance and desired mechanical properties. The intermetallic compounds in
equilibrium have a well-defined and unique crystal structure. PAC
experiments on those compounds contribute to the understanding of the
hyperfine field behavior in different metallic systems. Because this method is
very sensitive to the microstructure around the probe atoms, it can be used to
follow changes on a nanometer scale. Each position of the probe atom relative
to the neighboring atoms usually gives its own characteristic and
distinguishable signal, providing information about the EFG values at the
substitutional lattice sites. In recent years, it has become possible to obtain the
EFG from first-principles electronic structure calculations in the framework of
the Density Functional Theory (DFT) [Hoh64, Koh65].
Aluminides (Hf-Al and Zr-Al systems)
In the last decade comprehensive studies of Hf and Zr aluminides were
performed. Their phase diagrams contain numerous stoichiometric
intermetallic phases of very narrow concentration ranges and various
hexagonal, orthorhombic, tetragonal and cubic structures. This study is a
perfect illustration of the application of the Perturbed Angular Correlation
method to investigate intermetallic compounds, and especially to study the
1 This chapter includes data published in [Kul06, Wod07, Err10, Wod03, Wod04, Wod09] as well as
results that have not been published yet. The author contributed in a great deal in all these works.

14 Electric field gradient in the intermetallic compounds
lattice location of impurity atoms in the polycrystalline materials. PAC
experiments were performed using both most common hyperfine probes 181
Hf/181
Ta and 111
In/111
Cd. The 181
Hf/181
Ta probes are constituent atoms in Hf
aluminides and can be considered as such in Zr aluminides due to the chemical
similarities of Hf and Zr. On the contrary, the 111
In/111
Cd probe has to be
treated as an impurity in those compounds. Since Hf and Zr are isoelectronic,
their aluminides show pronounced similarities in their structure, hyperfine
interactions, and other properties.
The quadrupole interaction parameters, i.e. the quadrupole frequency Q,
Fig. 2.1 Correlation between Vzz values and parameter measured in Hf- and Zr- aluminides doped with 181Hf/181Ta (black squares) and 111In/111Cd (red circles) probes at room temperature. Numbers indicate the Hf:Al and Zr:Al atomic ratio in the compounds.

Fundamental research with PAC 15
the corresponding electric field gradient (values at room temperature and
extrapolated to 0 K), the asymmetry parameter of 181
Hf/181
Ta and 111
In/111
Cd
probes in Hf-Al and Zr-Al compounds, which we determined in experiments,
are collected in Table 2.1 and Table 2.2. The values of the main EFG tensor
component Vzz were deduced from the measured Q according to Equation
1.5 and adopting the quadrupole moment Q of the intermediate level in 181
Ta
and 111
Cd equal to 2.36(5)b [Her80] and 0.83(13)b [But83], respectively. The
uncertainties of the quadrupole moments were not taken into consideration.
Hence, the quoted errors are only the instrumental and statistical ones. Values
of the EFGs calculated by the other are also included in these Tables. A
comparison of the experimental Vzzexp
and values obtained at room
temperature for both probes at the nonequivalent lattice sites in the
corresponding hafnium and zirconium aluminides is shown in Figure 2.1.
The quadruple frequency reaches values from a few tens MHz to above
1 GHz when measured at 181
Hf/181
Ta and up to ca. 150 MHz when 111
In/111
Cd
probes are used. The PAC spectra for all Hf-Al and Zr-Al compounds exhibit
the well-defined axially or non-axially symmetric EFGs corresponding to the
particular crystallographic sites occupied by the probes. The Vzz values
obtained at 181
Hf/181
Ta in Zr-Al phases are quite similar to those in
corresponding Hf-Al phases (Figure 2.1 black square).
The hfi parameters obtained for Hf and Zr aluminides doped with 111
In/111
Cd probes, collected in Table 2.2, are presented in Figure 2.1 (red
circles). The Vzz values determined for Hf-Al compounds are very close to
those of Zr-Al compounds. The relative difference between the VzzHf-Al
(RT)
and VzzZr-Al
(RT) measured at 111
In/111
Cd is much smaller than that measured at 181
Hf/181
Ta.
The asymmetry parameters determined for both probes are quite similar
for most compounds. If the site occupied by the probe atoms has no axial
symmetry some discrepancies are observed; the largest in the Hf3Al2 and
Zr3Al2 compounds. Very close Vzz and values obtained for the most Hf- and
Zr- aluminides reflect the chemical and structural similarities of these
compounds.

16 Electric field gradient in the intermetallic compounds
Table 2.1. The experimental and calculated hfi parameters of 181Ta in Hf-Al and Zr-Al compounds; Vzz in units of 1021 V/m2.
compound lattice site Q (RT)
[MHz] Vzz
exp (RT)
exp(RT) Vzz
exp (T=0K) Vzz
calc
calc
Ref. exp
Ref. calc
Zr3Al Zr 3c 627(3) 10.99 0 11.72 10.7 0 Wod04 unp
Al 1a
Zr2Al Zr 2a 1107(4) 19.35 0 19.95 Wod04
Zr 2d 43(2) 0.75 0
Al 2c
Hf3Al2 Hf 4d 822(1) 14.4 0.22 15.01 Wod05
Hf 4f 185(2) 3.24 0 4.27
Hf 4g 117(1) 2.05 1 1.90
Al 8j
Zr3Al2 Zr 4d 928(3) 16.26 0.01 17.29 Wod05
Zr 4f 65(1) 1.13 0.31 0.54
Zr 4g 362(2) 6.34 0.63 7.07
Al 8j
Hf4Al3 Hf 2d 1193(4) 20.91 0 21.27 20.5 0 Wod07 Wod07
Hf 2e 479(3) 8.39 0 8.46 9.1 0
Al 3f
Zr4Al3 Zr 2d 989(5) 17.33 0 17.8 17.6 0 Wod07 Wod07
Zr 2e 1012(15) 17.73 0 18.0 18.6 0
Al 3f
HfAl Hf 4c 1155(3) 20.24 0.41 21.24 Wod03
Al 4c
ZrAl Zr 4c 1066(1) 18.68 0.46 19.68 Wod03
Al 4c
Hf2Al3 Hf 16b 465(1) 8.15 0.61 8.52 Wod00
Al 16b Wod01
Al 8a
Zr2Al3 Zr 16b 392(1) 6.87 0.73 7.20 Wod01
Al 16b
Al 8a
HfAl2 Hf 4f
96(1)
1.68
0.17
1.57
-1.7 -2.3
0 0
Wod02 unp Bel07
Al 2a
Al 6h
ZrAl2 Zr 4f
90(1)
1.58
0.15
1.50
-1.6 -3.2
0 0
Wod02 unp Bel07
Al 2a
Al 6h
HfAl3 ht Hf 2a 735(7) 12.9 0.17 12.90* -12.2 0 Kul10 Kul12
Al 2b 16.0 0
Al 4d -17.9 0
HfAl3 lt Hf 4e 355(2) 6.22 0 6.31 -7.0 0 Wod00 Kul12
Al 4c 13.3 0,66 Wod01
Al 4d -14.0 0
Al 4e 14.6 0
ZrAl3 Zr 4e 277(1) 4.85 0 5.28 -5.9 0 Wod01 Kul12
Al 4c 11.3 0
Al 4d -13.2 0
Al 4e 14.0 0

Fundamental research with PAC 17
Table 2.2. The experimental and calculated hfi parameters of 111Cd in Hf-Al and Zr-Al compounds; Vzz in units of 1021 V/m2.
compound lattice site Q (RT) [MHz]
Vzzexp
(RT) exp
(RT) Vzzexp
(T=0K) Vzzcalc
calc
Ref. exp
Ref. calc
Zr3Al Zr 3c 29(2) 1.44 0 1.32 Wod04
Al 1a 0 0
Zr2Al Zr 2a
Zr 2d
Al 2c 137(2) 6.83 0 7.52 Wod04
Hf3Al2 Hf 4d 78(2) 3.89 0 4.10 -4.2 0 Wod05 Unp
Hf 4f 42(1) 2.09 0.08 2.2 1.2 0.37
Hf 4g 96.3(5) 4.8 0.72 4.97 3.8 0.97
Al 8j 128(1) 6.38 0.44 6.5 3.9 0.08
Zr3Al2 Zr 4d 93.6(5) 4.66 0 5.04 -4.4 0 Wod05 unp
Zr 4f 33(1) 1.64 0.23 1.72 2.2 0.76
Zr 4g 97.3(5) 4.85 0.99 5.15 -4.0 0.80
Al 8j 127(1) 6.33 0.22 6.67 5.1 0.08
Hf4Al3 Hf 2d 8.78 0 Wod07 Err10
Hf 2e -2.46 0
Al 3f 5.63 0.91
Hf3Al2 Hf 4d 88(5) 4.4(3) 0 4.3(4) -3.9 0 Err10 Err10
Hf 4f 39(2) 1.9(1) 0.12(5) 2.0(2) 1.1 0.17
Hf 4g 96.4 4.8 0.74 5.0(1) 4.6 0.62
Al 8j 128 6.4 0.44 6.7(1) 6.7 0.1
Zr4Al3 Zr 2d 8.6 0 Wod07 Err10
Zr 2e -0.03 0
Al 3f 115(2) 5.73(5) 0.21(5) 5.9(1) 5.32 0.82
Zr3Al2 Zr 4d 84(3) 4.2(1) 0.08(5) 4.5(2) -3.7 0 Err10 Err10
Zr 4f 34(2) 1.69(5) 0.30(3) 1.7(1) 1.5 0.34
Zr 4g 97.7(7) 4.87(3) 0.92(4) 5.1(1) -4.6 0.85
Al 8j 130(1) 6.48(5) 0.30(4) 6.9(1) 6.9 0.26
HfAl Hf 4c 128.3(5) 6.38 0.42 6.61 Wod03
Al 4c
ZrAl Zr 4c
Al 4c
Hf2Al3 Hf 16b Wod00
Al 16b 155.3(5) 7.74 0.45 8.02 Wod01
Al 8a 135(1) 6.73 0.63 6.99
Zr2Al3 Zr 16b
Al 16b 151.9(5) 7.57 0.47 7.88 Wod01
Al 8a 117(1) 5.85 0.51 6.06
HfAl2 Hf 4f 156.5(5) 7.77 0 7.46 -1.7 0 Wod01a Bel07
Al 2a 110.9(5)* 5.53 0 5.41 7.2 0 Wod02
Al 6h 54.4(5)* 2.71 0.41 2.67 3.7 0.35
ZrAl2 Zr 4f
Al 2a 120.6(5) 6.01 0 5.88 7.1 0 Wod02 Bel07
Al 6h 58.7(5) 2.93 0.39 2.88 3.9 0.29
HfAl3 ht Hf 2a -2.7 0 Kul12
Al 2b 10.4 0
Al 4d -6.8 0
HfAl3 lt Hf 4e -1.0 0 Wod00 Kul12
Al 4c 9.7 0,01 Wod01
Al 4d 85.0(5) 4.24 0 4.34 -5.0 0
Al 4e 9.7 0
ZrAl3 Zr 4e -1.1 0 Wod01 Kul12
Al 4c 9.7 0,05
Al 4d 86.4(5) 4.31 0 4.45 -5.2 0
Al 4e 9.3 0

18 Electric field gradient in the intermetallic compounds
Correlation between the experimental and calculated EFG
A significant difference between the corresponding EFGs was observed
only for the isostructural compounds with 4:3 atomic ratio (42.85 at.% Al). In
the Hf4Al3 phase two quite distinct EFGs were found in comparison to the
very similar EFGs in Zr4Al3 phase. Room temperature Vzz values (in units of
1021
V/m2) at the corresponding 2d site amount to 20.1(1) and 8.4(1), and at 2e
site to 17.3(1) and 17.7(3) for hafnium and zirconium aluminides, respectively
[Wod07].
In order to better understand the differences in EFGs in these two
compounds, the calculations based on the DFT using the full potential
augmented plane–wave + local–orbitals (APW+lo) [And75, Mad01, Sjö00]
formalism as implemented in the WIEN2k package [Bla01] were done by S.
Cottenier and H.M. Petrilli and their coworkers. The calculations were
performed with and without the substitutional Ta impurities included in the
isostructural Hf4Al3 and Zr4Al3 compounds [Wod07]. The calculated Vzz
values at the Zr and Hf replaced by Ta are in a good agreement with the
experimental ones shown in Table 2.1. However, in the pure compounds the
calculated EFGs values at the Zr and Hf sites turn out to differ a lot from the
experimental data. Consequently, the very different EFGs in pure Zr4Al3 at the
two Zr sites become similar only when dilute Ta impurities replace the Zr
atoms. Large changes caused when replacing the Zr lattice atoms by Ta
impurity can also be a reason for the difference in the temperature dependence
parameters obtained for these two compounds. In the other isostructural Hf
and Zr aluminides similar parameters were obtained. In the Hf4Al3 and
Zr4Al3compounds another interesting question of probe segregation into
minority phase Hf3Al2 and Zr3Al2, respectively, occurred when 111
In/111
Cd
probes were applied. This topic will be discussed in the Chapter 2.2.
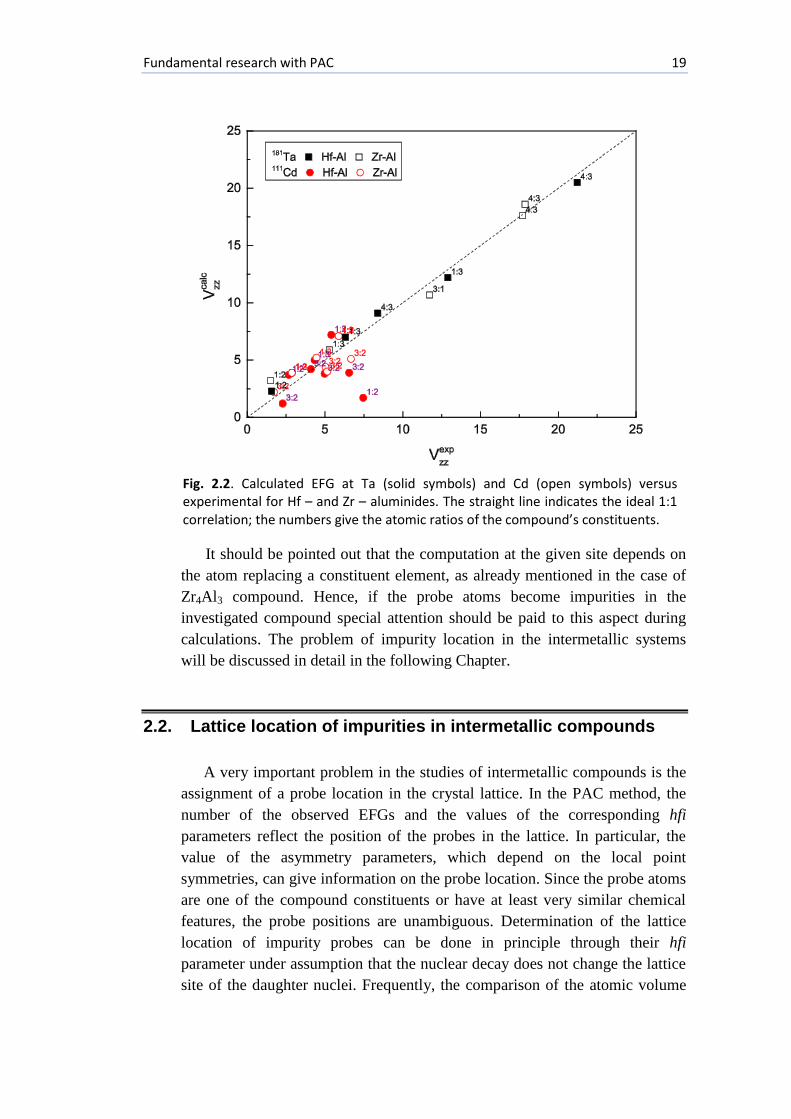
The results of the ab initio calculations for the Hf – and Zr – aluminides,
performed in corroboration with theory groups mentioned above [Wod07,
Err10] and found in the literature [Bel07], reproduce the measured EFGs very
well (Figure 2.2). All calculations were done for 0 K, thus the comparison was
only possible due to the very precise determination of temperature dependence
parameters which allowed to extrapolate the experimental (Vzzexp
) values to 0
K. (It should be mentioned that the results for some of the compounds have
not been published yet). A good agreement between experimental and
calculated values is achieved for the 181
Ta probe, for which the largest
deviation in |Vzz| reaches almost 10%. A slightly worse (10-17%), but still
acceptable, reproduction of the measured EFGs is obtained for 111
Cd probes in
the most of aluminides. Only for a few compounds (HfAl2, ZrAl2, Hf3Al2,
Zr3Al2) the largest deviation in |Vzz| reaches above 30%.
Fundamental research with PAC 19
It should be pointed out that the computation at the given site depends on
the atom replacing a constituent element, as already mentioned in the case of
Zr4Al3 compound. Hence, if the probe atoms become impurities in the
investigated compound special attention should be paid to this aspect during
calculations. The problem of impurity location in the intermetallic systems
will be discussed in detail in the following Chapter.
2.2. Lattice location of impurities in intermetallic compounds
A very important problem in the studies of intermetallic compounds is the
assignment of a probe location in the crystal lattice. In the PAC method, the
number of the observed EFGs and the values of the corresponding hfi
parameters reflect the position of the probes in the lattice. In particular, the
value of the asymmetry parameters, which depend on the local point
symmetries, can give information on the probe location. Since the probe atoms
are one of the compound constituents or have at least very similar chemical
features, the probe positions are unambiguous. Determination of the lattice
location of impurity probes can be done in principle through their hfi
parameter under assumption that the nuclear decay does not change the lattice
site of the daughter nuclei. Frequently, the comparison of the atomic volume
Fig. 2.2. Calculated EFG at Ta (solid symbols) and Cd (open symbols) versus experimental for Hf – and Zr – aluminides. The straight line indicates the ideal 1:1 correlation; the numbers give the atomic ratios of the compound’s constituents.

20 Lattice location of impurities in intermetallic compounds
and the electronegativity of solute and host atoms can help to attribute the
PAC signals to a particular site. On the other hand, the study of Hf and Zr
aluminides show that the predictions based only on such arguments are very
simplistic and often fail. It has been observed that the site preference can
change with composition (especially near compound stoichiometry) [Col01] or
temperature [Wod01].
According to the crystallographic data for each structure a certain number
of nonequivalent atom positions in the unit cell is available. Each position with
certain symmetry could be substituted by the probe atoms and the observed
fraction indicates the population of the nonequivalent sites in the matrix.
Sometimes the question of probe localization cannot be solved based only on
the PAC results, i.e. more than one site have the same symmetry. Thus, in
many cases the site of the diluted impurity atoms is hard to predict.
Probe site occupation in the lattice
The Durken-Gurry diagram [Dar57] shown in Figure 2.3 presents a
common rule of the possibility to substitute the host atoms in a metal matrix
by impurity atoms in a defect-free manner, whenever the electro-negativities
and atomic sizes match each other. According to this diagram the comparison
of the atomic volume and Pauling electronegativity can give the first
suggestion of the possible probe site occupation in the intermetallic systems.
Location of the impurity and one of the constituents in the same group of the
periodic table, a small difference in the electronegativity and available space at
lattice site could clearly favor substitution of certain atoms by the probe atoms.
Fig. 2.3. Comparison of atomic volumes and Pauling electronegativities of probe and constituent atoms for different intermetallic compounds.
Fundamental research with PAC 21
Hence, the 181
Hf/181
Ta probes substitute always the Hf, Zr and usually the Ti
atoms in different compounds containing one of these elements. It is more
difficult to predict the substitution by probe being an impurity in the
compound. In the discussed systems, the 111
In/111
Cd probe was such an
impurity and additionally it is larger than all other elements as can be seen in
Figure 2.3. In such cases, the probe was found to substitute one or both
constituent atoms.
A comprehensive study of the Hf- and Zr- aluminides provided the
evidence that 111
In/111
Cd probe replaced preferably Al atoms. Such behavior
was observed e.g. in the Hf2Al3, Zr2Al3, Zr2Al, ZrAl2, HfAl3, ZrAl3 and TiAl3
(see Table 2.2. and references therein). Furthermore, in the HfAl3, ZrAl3,
TiAl3 compounds, a strong preference for one of the possible Al sites was
observed. An identification of the substituted lattice sites was possible thanks
to the ab initio calculation of the electric field gradient and substitution energy
of 111
In/111
Cd and 181
Hf/181
Ta at a particular site. Therefore a clear answer of
the probe location in the intermetallic compounds cannot be given based only
on the measured hfi parameters. Additional information such as
crystallographic data or the detailed all-electron calculations is necessary.
Site preferences of the impurity atoms
An example of the preferential site occupation by impurity was observed
in some Hf- and Zr- aluminides. A combined experimental and theoretical
study of the quadrupole hyperfine interactions of 181
Ta and 111
Cd probes in
TiAl3, ZrAl3 and HfAl3 intermetallics allowed to identify the observed
hyperfine interactions and to assign them to the particular lattice sites [Wod09,
Kul12]. The PAC spectra taken for 181
Ta probe in these compounds evidenced
a single EFG with a relative width of ca. 1%. This reflected a well-defined
crystallographic site in the single phase sample. Since Hf and Zr both are
isoelectronic and chemically very similar, the 181
Hf/ 181
Ta probe atoms
occupied the substitutional lattice sites. The 111
In/111
Cd probes are impurities
in all investigated compounds. All three non-equivalent crystallographic
positions (Hf – 2a 4/mmm and Al – 2b 4/mmm and 4d -4m2) in tetragonal D022
structure are axially symmetric. In the D023 structure two of three Al sites (4d -
4m2 and 4e 4mm) as well as the Hf/Zr – 4d -4m2 site are axially symmetric,
while only one Al – 4c site has a lower symmetry (mmm.). Since in the PAC
experiments only one well–defined EFG with ~1% was observed [Wod01]
the probe site was tentatively assigned to Hf/Zr – 4d. But the definitive
location could not be determined based only on these considerations.
The subsequent ab initio calculation performed for the Hf-Al and Zr-Al
systems by H.M. Petrilli and coworkers shed light on the question of the probe

22 Lattice location of impurities in intermetallic compounds
localization in the investigated compounds. In order to estimate the preferred
site occupation, the substitution energies were calculated using the expression
[Err10]:
Esubst = Etot
subst – Eimp + EX – Epure (2.1)
Etot
subst is the total energy of the supercell containing a single substitutional
Cd atom, Eimp denote the energy of the Cd impurity and EX the energy of the
Hf, Zr or Al atom. Epure is the energy of the considered supercell without
impurities. EX and Eimp were obtained from metallic Hf, Zr, Al and Cd. A
relative difference between the calculated substitution energies indicates that
the 111
In/111
Cd probe prefers to substitute the Al sites in HfAl3 and ZrAl3.
The obtained defect formation energies, i.e. the substitution energies, and
the calculated and measured EFG (extrapolated to T = 0 K) in the discussed
compounds are collected in Table 2.4. A comparison of the calculated and
experimental results achieved for the TiAl3 phase shows the substitution of Ti
by 181
Ta probe, and preferential occupation of Al – 4d site by 111
Cd [Wod09].
The interpretation of the experimental hfi parameters obtained for 111
Cd
probes in HfAl3 and ZrAl3 phases, reported in Ref. [Wod01], was refined
Table 2.4. The calculated (Vzzcalc) values and experimental (Vzz
exp ) extrapolated to T= 0 K
– both in the units of 1021V/m2 – for 181Ta and 111Cd probe substituting Hf, Zr or Al lattice sites in the XAl3 compounds (X = Hf, Zr, Ti).
Compound Lattice site
181Hf→181Ta 111In→111Cd
Vzzcal
[Kul12] Vzz
calc [Wod09]
Vzzexp Esubst [eV]
[Kul12] Vzz
calc
[Kul12]
Vzzcalc
[Wod09] Vzz
exp
TiAl3 Ti 2a 4/mmm
Al 2b 4/mmm
Al 4d -4m2
-15.1
+12.3
-12.9
14.4(2)
7.2
2.9
2.5
-4.3
+8.1
-5.7
-3.5
+7.5
-5.7
5.0
HfAl3 ht Hf 2a 4/mmm
Al 2b 4/mmm
Al 4d -4m2
-12.2
+16.0
-17.9
12.5(1) 5.5
4.6
4.3
-2.7
+10.4
-6.8
HfAl3 lt Hf 4e 4mm
Al 4d -4m2
Al 4c mmm.
Al 4e 4mm
-7.0
-14.0
+13.3
+14.6
6.31(1)
10.2
5.5
5.5
5.7
-1.0
-5.0
+9.7
+9.7
4.34(1)
ZrAl3 Hf 4e 4mm
Al 4d -4m2
Al 4c mmm.
Al 4e 4mm
-5.9
-13.2
+11.3
+14.0
5.28(1)
10.3
5.3
5.3
5.6
-1.1
-5.2
+9.7
+9.3
4.45(1)

Fundamental research with PAC 23
according to the new information obtained from the calculations. The main
fraction of a well-defined quadrupole frequency Q = 85.0(5) MHz and
Q= 86.4(5) MHz in HfAl3 and ZrAl3, respectively, has been attributed now to
the Al - site (Table 2.2), instead of the Hf-site, as was suggested in Ref.
[Wod01]. Moreover, the comparison of the Vzz and Esubst values obtained for
both compounds indicated the preferential substitution of Al – 4d sites by 111
In/111
Cd probes.
Switching of the probe site in the lattice
In many investigated binary phases, the probes (being an impurity)
substituted both constituent atoms sometimes with the preference of one of the
available lattice sites. A very surprising temperature behavior of the impurity
probe atoms was observed in the ZrAg compound, where changes in solute
location between the substitutional sites of the different elements were
observed at rising temperature [Kul06].
The PAC spectra taken for the 111
Cd probe in the ZrAg sample at the room
temperature and 1103 K are shown in Figure 2.4 together with the
corresponding Fourier transforms. The room temperature spectrum
demonstrated a unique axially symmetric EFG (=0) with the quadrupole
frequency Q1= 94.8(5) MHz [Kul06]. The shape of the spectrum indicates a
texture of the sample, similarly as was observed in former PAC measurements
performed with 181
Ta probes [Wod03b]. The measurements at the increasing
temperature showed the decrease of a fraction of this EFG and the appearance
Fig. 2.4. PAC spectra with Fourier transforms taken for 111Cd probe in the ZrAg compound at the indicated temperatures [Kul06].

24 Lattice location of impurities in intermetallic compounds
of the second axially symmetric EFG characterized by Q2= 56.5(5) MHz at
873 K. The low values of both distribution widths (1-2%) demonstrated the
well-defined probe locations [Kul06].
This fully reversible change in the site occupation occurred above 773 K in
a rather narrow temperature range as illustrated in Figure 2.5. A ratio of both
fractions reached approximately 50% and was then conserved through to the
highest measured temperature. Hence, the 111
In/111
Cd probes can substitute
both Ag and Zr. However, it is difficult to correlate the measured quadrupole
frequencies with the definite lattice sites relying only on the experimental data,
since both the Ag – 2c 4mm and the Zr –2c 4mm sites in the tetragonal B11
structure have the same axial symmetry. According to the Durken-Gurry
diagram (Figure 2.3), the difference between the atomic size of indium and the
constituent atoms favors the Zr site to be substituted. On the other hand, the
thermally expanded lattice enables In to replace Ag – more favorable solution
considering the electrochemical factor. Taking into account this
argumentation, the attribution of Q1 to the Zr site and Q2 to the Ag site is
quite reasonable [Kul06].
The confirmation of the site assignment based on the experimental data
was possible due to theoretical computation. The ab-initio calculations
performed by Belošević et al. [Bel08] supported the conclusion that the Ag
site is populated only at high temperature, while the Zr site in the whole
temperature range. The experimental Vzz value obtained for the Zr 2c and Ag
2c sites and the calculated one match each other very well as presented in
Table 2.3.
Fig. 2.5. Temperature variation of the probe fractions at the two lattice sites in ZrAg [Kul06].

Fundamental research with PAC 25
Probe segregation into the minority phase
The other interesting problem of my study, beside the lattice site location,
was the preferential location of the probe atoms in the minority phase of the
sample being a mixture of two phases. It was not possible to estimate the
content of the minority phase in some samples, e.g. ZrAl, Zr2Ag, by XRD
measurements alone. However, the PAC measurements showed the main
fraction of the probes located in that small admixture of the minority phase.
Two examples of such phase segregation behavior will be presented in the
following section.
The ZrAl samples of Al concentration 49.9 at.% and 51.9at.% were
prepared by the standard arc melting procedure. The XRD analysis showed
formation of the orthorhombic ZrAl compound with the Bf structure and a
small admixture of Zr2Al3 phase – its content could not exceed a few percent.
The Zr-Al phase diagram in the region around 50 at.% Al shows how difficult
it was to achieve a single-phase sample. In the case of ZrAl sample even the
long-lasting annealing at 1273 K did not improve its purity.
The PAC spectra taken for 111
In/111
Cd probes in the temperature range 10-
1000 K showed that about 50 % of probes exhibited two EFGs characteristic
for the Zr2Al3 phase (see Table 2.1). The remaining fraction of probe atoms
experienced a broad EFG distribution around 100 MHz (a value close to that
observed in the isostructural compound HfAl). The measurements were
repeated several times with different samples, different heat treatments, and
each time very similar spectra were obtained as presented in Figure 2.6. On the
other hand, the PAC pattern for 181
Hf/181
Ta probes in the ZrAl sample exhibits
only one well defined nonaxially symmetric EFG (=0.46(1)) with the
quadrupole frequency Q=1065(3) MHz. No evidence of any quadrupole
frequency characteristic for 181
Ta probe in the tracer phase Zr2Al3 was found.
Hence, the PAC experiments showed the strong preference of In impurity to
locate in the minority Zr2Al3 phase in a ZrAl sample [Wod03].
Table 2.3 Comparison of the calculated EFGs (Vzzcalc) for 181Ta and 111Cd probes
[Bel08] with the experimental values Vzzexp extrapolated to 0 K [Wod03b, Kul06];
Vzz in units of 1021 V/m2.
Compound Lattice site
181Hf/181Ta 111In/111Cd
Vzzcalc Vzz
exp Vzzcalc Vzz
exp
ZrAg Zr 2c 4mm
Ag 2c 4mm
13.6 13.98(9)
5.1
-3.1
4.90(2)
2.94(2)

26 Lattice location of impurities in intermetallic compounds
A more complex example of segregation of In solutes in two-phase
mixture was observed in the Hf4Al3 + Hf3Al2 and Zr4Al3 + Zr3Al2 samples
[Err10]. The phase diagrams around 43 at.% Al concentration are rather
complicated for both Hf-Al and Zr-Al systems. After different annealing
procedures, the XRD spectra obtained for the Hf and Zr aluminides
established the existence of two phases: the dominant (Hf/Zr)4Al3 phase and
the minority (Hf/Zr)3Al2 phase. It should be noted that the PAC measurements
done with 181
Ta probe in Hf4Al3 and Zr4Al3 samples did not show any of the
quadrupole frequencies characteristic for the Hf3Al2 and Zr3Al2 phases.
Considering the occurrence of the phase mixture and the large number of
possible lattice sites in each phase, the analysis of the PAC spectra for the
diluted In impurity was very complicated. The fitted results showed evidence
for up to five fractions each with different hfi parameters. The assignment of
the measured EFG to the available crystallographic sites was possible only by
performing ab initio calculations in all relevant compounds and in the mixed
phases. The Vzz and values obtained from the detailed APW+lo calculation
for the solute In atoms in the (Hf/Zr)4Al3 and (Hf/Zr)3Al2 intermetallics,
compared with the PAC results indicated that In prefer to locate in the
minority (Hf/Zr)3Al2 phases (see Table 2.2).
2.3. Temperature dependence of the EFG in the intermetallic
compounds
One of the advantages of the PAC method is the possibility to perform a
series of in situ measurements over a very wide temperature range and for a
long time. The quadrupole frequency value measured in most metals and many
intermetallic systems decreases with an increasing temperature. It is
Fig. 2.6. Room temperature PAC spectrum and Fourier transform taken for 111Cd probes in ZrAl sample of 51.9 at% Al. The shaded area denotes the Fourier transform of PAC spectrum taken for Zr2Al3 compound [Wod03].

Fundamental research with PAC 27
experimentally well established that in most of these systems the dependence
follows an empirical T3/2
law [Chr76]
Q(T) = Q (0)(1 – bT3/2
) . (2.2)
For rare earth and different intermetallic compounds a linear temperature
dependence was observed, and the quadrupole frequency values could be fitted
with
Q (T) = Q (0)(1 – aT). (2.3)
This indicated that in some cases the mechanism responsible for the EFG
temperature behavior may be different.
Both equations could be combined into one simple relation
Q(T) = Q (0)(1 – BT) . (2.4)
B is a constant in the range 10-4
to 10-5
K and in most of cases positive (i.e.
EFG value decreases with increasing T). A special attention was paid to
experimental results where the Q(T) was established to follow Equation 2.4.
Theoretical investigations [Jen76, Nis78] following the experimental
observation of this relation pointed out that temperature dependence of the
lattice constant cannot only be responsible for the EFG changes [Rag75,
Rag76]. Consequently, it was attempted to combine the phonon models with
the lattice and local electron contribution to the main component (Vzz) of the
electric field tensor to understand this behavior. Using a simple Debye model
to describe the phonons, the temperature dependence of the EFG tensor can be
well approximated by T3/2
law as described in Equation 2.2. Nowadays, the
EFG as well as phonons can be calculated with a high precision from the first
principles (see Chapter 2.1); therefore, some attempts to explain the
temperature dependence of the EFG in solids based on the ab initio calculation
were made [Tor06]. The calculations done for the prototype case of hcp-Cd
reproduced quite well the experimental trend. Unfortunately, the results were
too rough to make statements about the origin of the T3/2
dependence and it is
still an open question for the theory to explain quantitatively this strong
dependence.
Regular – T3/2
and linear dependencies
PAC studies over a wide range of the intermetallic compounds show that
various types of the temperature behavior are observed. The measurements
performed for the Hf-Al and Zr-Al systems provide interesting information

28 Temperature dependence of the EFG in intermetallic compounds
about this problem. For most of the Hf–Al and Zr–Al compounds, the
temperature behavior of the EFGs show very similar slope parameters for
quadrupole frequencies attributed to the same lattice location of the probes
(Figure 2.7). However, the determined a and b parameters are slightly larger
for the most of Zr-Al compounds in comparison with Hf-Al.
A typical decrease of the quadrupole frequency with temperature
according to the T3/2
law (Equation 2.2) was observed in the HfAl3 ZrAl3
Hf4Al3, Zr4Al3 Zr2Al, Zr3Al compounds measured at the 181
Ta probes and in
HfAl2, ZrAl2 measured at 111
Cd. However for most of the Hf-Al and Zr-Al
phases a linear temperature dependence was observed regardless of the probe
used. Equation 2.3 was applied to describe the temperature dependence of the
quadrupole frequency observed in Hf2Al3, Zr2Al3, HfAl, Hf3Al2, Zr3Al2 for
both type of probes. In HfAl and ZrAl only with 181
Ta and in HfAl3, ZrAl3,
Zr2Al with the 111
Cd probes. The representatives of these two typical
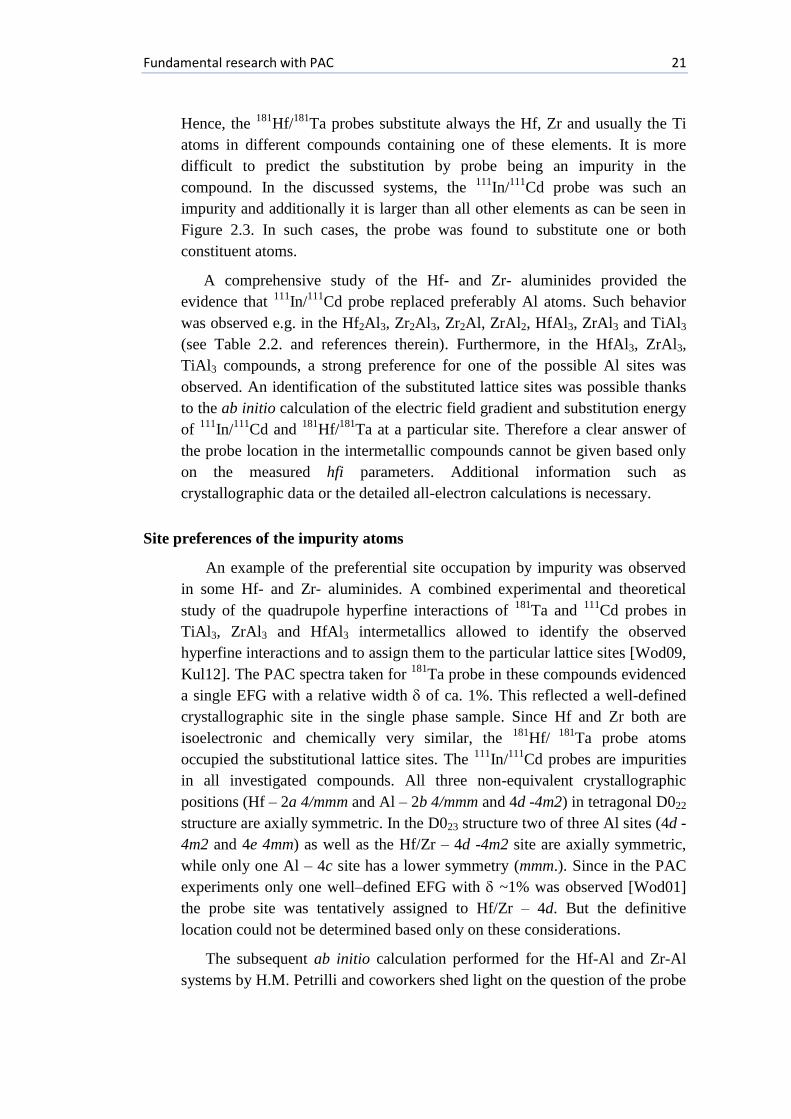
decreasing relationships related to Equation 2.4 are presented in Figure 2.8.
For some cases, the EFG changed with temperature very weakly or even
remained constant in the wide temperature range such as at site 2e in Hf4Al3
measured at the 181
Ta probe [Wod07] (Figure 2.8a). Sometimes fits of the data
using both the linear and T3/2
functions were equally correct, and it was
impossible to distinguish between these two relations, e.g. in the case of the
Fig. 2.7. Temperature dependence parameters a and b for the Hf-Al and Zr-Al compounds deduced from Equations 2.2 and 2.3.
Fundamental research with PAC 29
temperature variation Q(T) of the 111
Cd probe at Zr – site measured in the
ZrAg sample [Kul06].
Well-defined slope parameters a and b allowed to extrapolate the
measured EFG values to T = 0 K and then to compare them to the calculated
ones. This helped in the interpretation of the experimental results: the impurity
lattice location, site preference etc., as mentioned in previous Chapters.
Anomalous dependencies
The PAC experiments showed that even for compounds with the same
crystallographic structure, different temperature behavior of the EFG could be
demonstrated, depending on the probe used. Furthermore, the Zr3Al sample
measured with different probes exhibited different temperature dependencies
of the EFG at the same 3c lattice site as it is presented in Figure 2.9a. Thus,
the belonging of alloys to the same type of structure could not help in
prediction of the Q(T) function. The negative value for constant B from
Equation 2.4, i.e. an increase of the EFG with decreasing temperature, was
observed in a few aluminides such as HfAl2, ZrAl2, and Zr3Al (Figure 2.9a).
The rising of the quadrupole frequency noticed in these compounds followed
the linear function. However, in some cases, the observed temperature
behavior of the EFG was rather unusual, following neither the T3/2
nor the
linear dependency. Figure 2.9b illustrates the EFG at 2a site decreasing with
the temperature as the T3/2
function (solid symbol), whereas at 2d site the EFG
changes in a different way. Initially, it decreases down to approximately
a) b)
Fig. 2.8. The temperature dependences of quadrupole frequencies following the T3/2 a) and linear b) laws [Wod07, Wod03].

30 Temperature dependence of the EFG in intermetallic compounds
500 K, and then shows an increase above this temperature (open symbol)
[Wod04]. Additionally, in the compounds where more than one nonequivalent
probe site is possible, different dependencies of the EFG corresponding to the
different sites have been encountered.
The detailed measurements done for the Hf-Al and Zr-Al systems
confirmed that the problem of the EFG temperature dependence in
intermetallic system is very complex. This also illustrates the difficulty to find
a satisfying theory explaining temperature dependence and allowing the
prediction of the EFG value acting on the probe nuclei.
a) b)
Fig. 2.9. The unusual temperature behaviors of the quadrupole frequency for 111Cd in Zr3Al and 181Ta in Zr2Al compounds [Wod04].

31
3. Application of PAC
in condensed matter
and materials physics2
Among the numerous experimental techniques available to study solids,
the PAC method is widely applied in condensed matter and materials physics.
The PAC measurements are unrestricted by temperature or pressure, the
concentration of the probe atoms is very low – these properties make PAC
favorable tool in the spectroscopic studies. On the other hand, the number of
isotopes with nuclear properties suitable for experiments is limited. There are
many widely versatile applications of PAC: study of the structural and
magnetic phase transitions; phase analysis; surface, interface and grain
boundary measurements; study of thin films and nanomaterials; measurements
of the diffusion and thermodynamic properties, and many others. Here, I
present a few selected cases which illustrate the sensitivity and advantages of
this hyperfine method in condensed matter and material physics studies.
3.1. Impurities in solids
The EFG at impurity nuclei in the simple noncubic metals plays a central
role in the quantitative understanding of the hyperfine interaction parameters
in solids. The interpretation of the PAC measurements requires the
understanding of the chemical differences between the probe atom and the
constituents of the solids.
2 This chapter includes data published in [Kul07, Kul10, Kul10a, Kul04, Uhr02, Wod03a], as well as
results that have not been published yet. The author contributed substantially to all these works.
32 Impurities in solids
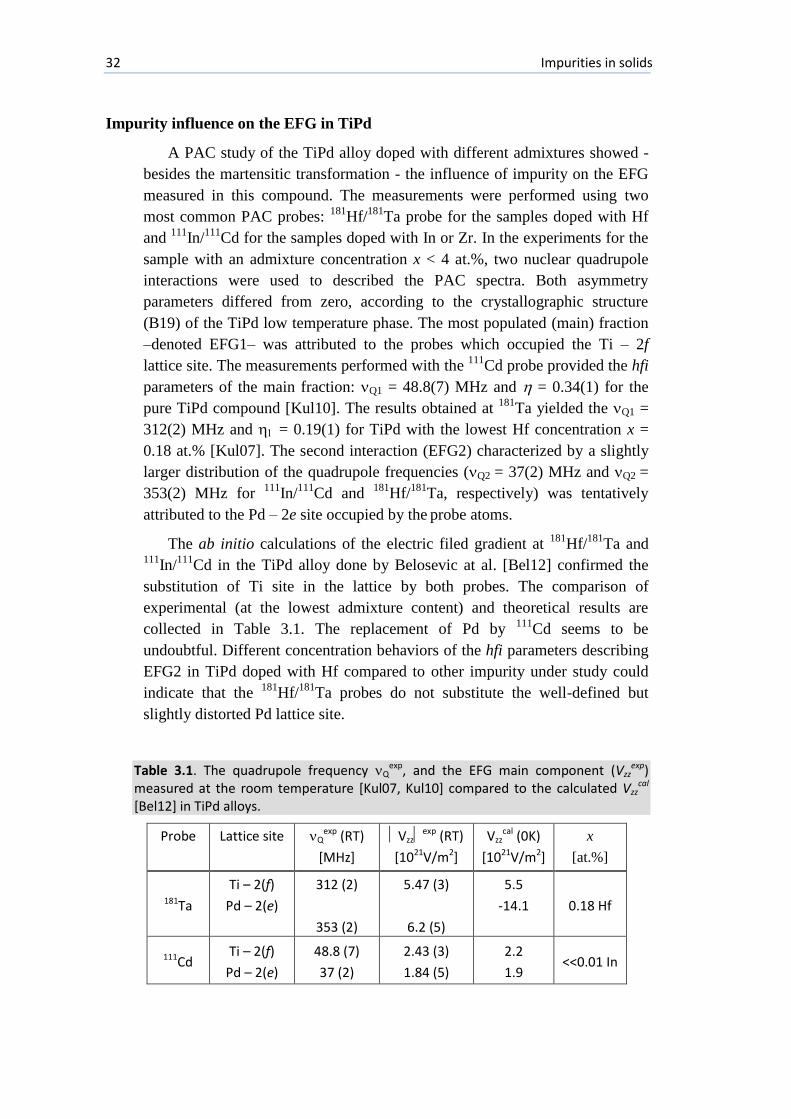
Impurity influence on the EFG in TiPd
A PAC study of the TiPd alloy doped with different admixtures showed -
besides the martensitic transformation - the influence of impurity on the EFG
measured in this compound. The measurements were performed using two
most common PAC probes: 181
Hf/181
Ta probe for the samples doped with Hf
and 111
In/111
Cd for the samples doped with In or Zr. In the experiments for the
sample with an admixture concentration x < 4 at.%, two nuclear quadrupole
interactions were used to described the PAC spectra. Both asymmetry
parameters differed from zero, according to the crystallographic structure
(B19) of the TiPd low temperature phase. The most populated (main) fraction
–denoted EFG1– was attributed to the probes which occupied the Ti – 2f
lattice site. The measurements performed with the 111
Cd probe provided the hfi
parameters of the main fraction: Q1 = 48.8(7) MHz and = 0.34(1) for the
pure TiPd compound [Kul10]. The results obtained at 181
Ta yielded the Q1 =
312(2) MHz and = 0.19(1) for TiPd with the lowest Hf concentration x =
0.18 at.% [Kul07]. The second interaction (EFG2) characterized by a slightly
larger distribution of the quadrupole frequencies (Q2 = 37(2) MHz and Q2 =
353(2) MHz for 111
In/111
Cd and 181
Hf/181
Ta, respectively) was tentatively
attributed to the Pd – 2e site occupied by the probe atoms.
The ab initio calculations of the electric filed gradient at 181
Hf/181
Ta and 111
In/111
Cd in the TiPd alloy done by Belosevic at al. [Bel12] confirmed the
substitution of Ti site in the lattice by both probes. The comparison of
experimental (at the lowest admixture content) and theoretical results are
collected in Table 3.1. The replacement of Pd by 111
Cd seems to be
undoubtful. Different concentration behaviors of the hfi parameters describing
EFG2 in TiPd doped with Hf compared to other impurity under study could
indicate that the 181
Hf/181
Ta probes do not substitute the well-defined but
slightly distorted Pd lattice site.
Table 3.1. The quadrupole frequency Qexp, and the EFG main component (Vzz
exp) measured at the room temperature [Kul07, Kul10] compared to the calculated Vzz
cal [Bel12] in TiPd alloys.
Probe Lattice site Qexp (RT)
[MHz]
Vzzexp (RT)
[1021V/m2]
Vzzcal (0K)
[1021V/m2]
x
[at.%]
181Ta
Ti – 2(f)
Pd – 2(e)
312 (2)
353 (2)
5.47 (3)
6.2 (5)
5.5
-14.1
0.18 Hf
111Cd Ti – 2(f)
Pd – 2(e)
48.8 (7)
37 (2)
2.43 (3)
1.84 (5)
2.2
1.9 <<0.01 In
Application of PAC in condensed matter and materials physics 33
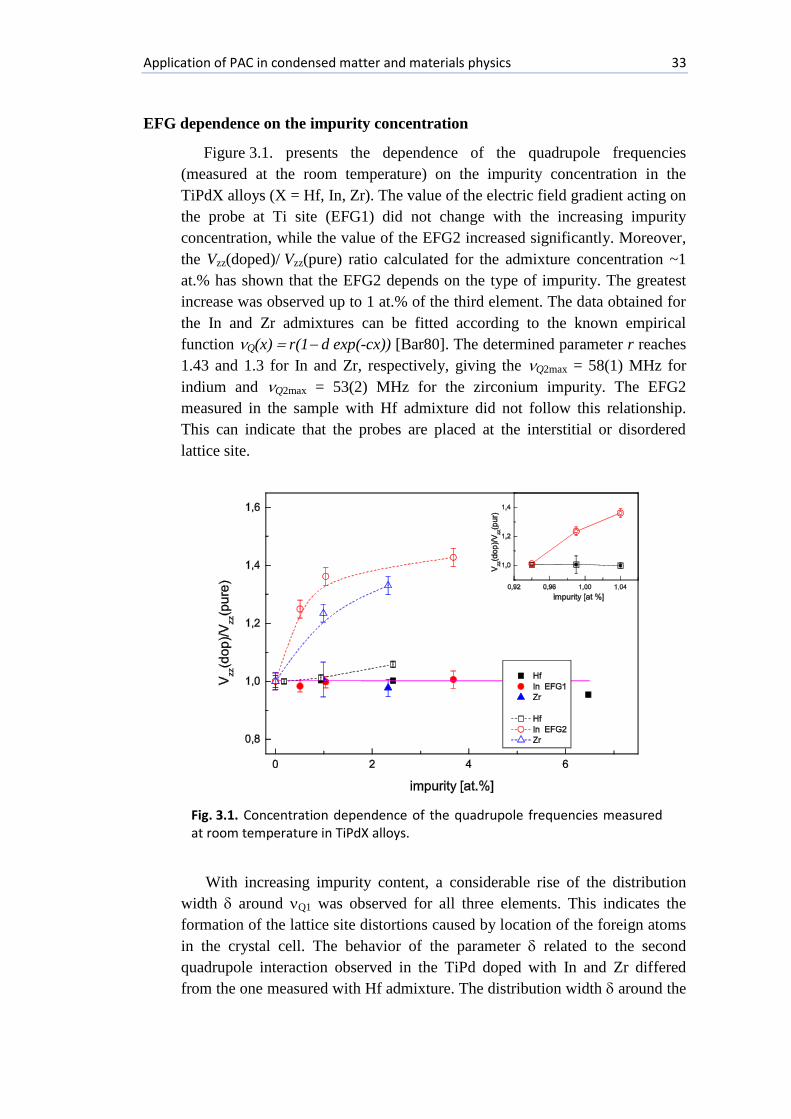
EFG dependence on the impurity concentration
Figure 3.1. presents the dependence of the quadrupole frequencies
(measured at the room temperature) on the impurity concentration in the
TiPdX alloys (X = Hf, In, Zr). The value of the electric field gradient acting on
the probe at Ti site (EFG1) did not change with the increasing impurity
concentration, while the value of the EFG2 increased significantly. Moreover,
the Vzz(doped)/Vzz(pure) ratio calculated for the admixture concentration ~1
at.% has shown that the EFG2 depends on the type of impurity. The greatest
increase was observed up to 1 at.% of the third element. The data obtained for
the In and Zr admixtures can be fitted according to the known empirical
function Q(x)r(1d exp(-cx)) [Bar80]. The determined parameter r reaches
1.43 and 1.3 for In and Zr, respectively, giving the Q2max = 58(1) MHz for
indium and Q2max = 53(2) MHz for the zirconium impurity. The EFG2
measured in the sample with Hf admixture did not follow this relationship.
This can indicate that the probes are placed at the interstitial or disordered
lattice site.
With increasing impurity content, a considerable rise of the distribution
width around Q1 was observed for all three elements. This indicates the
formation of the lattice site distortions caused by location of the foreign atoms
in the crystal cell. The behavior of the parameter related to the second
quadrupole interaction observed in the TiPd doped with In and Zr differed
from the one measured with Hf admixture. The distribution width around the
Fig. 3.1. Concentration dependence of the quadrupole frequencies measured at room temperature in TiPdX alloys.

34 Impurities in solids
EFG1 decreased with the increasing In and Zr concentrations, but increased
with increasing Hf concentration. This observation suggests that the 181
Hf/181
Ta probes can be located at slightly distorted Pd lattice site.
Impurity influence on the MHF
The PAC method is highly sensitive to the magnetic hyperfine fields
(MHF), which in turn reflect the local arrangements of the atoms. Therefore,
PAC allows the analysis of the probe’s nearest neighborhood. The strength of
MHF depends on the chemical character of the probe atom and the number of
foreign atoms next to the probes.
Increasing amount of the impurity atoms in the magnetic matrix on the
nearest neighbor sites causes the rise of the lower satellite magnetic fields
[Neu98, Uhr01, Uhr02]. The fraction of these fields can be estimated by a
statistical procedure. If the foreign atoms are isotropically distributed, the
probability P(n) of finding n-atoms in the neighborhood of the probes can be
calculated by the binominal distribution function. Thus, the probability P(n)
can be determined by
)()1()( nNn xxn
NnP
, (3.1)
where x is the concentration of impurity atoms and N is the co-ordination
number. The nearest and next nearest neighbors of the probe atoms may be
taken into account, if the distance between their co-ordination spheres is very
short.
The Fe-Mn alloys obtained by mechanical alloying of the elemental
powder were studied with two hyperfine methods: the Mössbauer
spectroscopy (MS) and the Perturbed Angular Correlation (PAC). The milled
pure Fe sample measured with 111
Cd showed the main fraction of the probes in
substitutional defect free site in bcc Fe, described by the Larmor frequency L
= 560(2) MHz [Uhr01, Uhr02]. This frequency corresponds to the well-known
magnetic hyperfine field B0(PAC) = 38.2(2) T [Lin81]. A smaller fraction of the
lower magnetic field Bdef(PAC) = 35.6(5) T was already observed in other
experiments [Neu94] and was attributed to the defects in the nearest
neighborhood of the probe atoms. The difference between the strength of the
hyperfine field measured with a different hyperfine method is caused by the
chemical character of the probe atoms. This problem is known [Kan84] and a
factor fac = B0(PAC)/B0(MS) can be introduced to compare the PAC and MS
results as done in Table 3.2. It was observed by [Ste66, Vin73], and recently
confirmed by ab initio calculations [Bła09], that the change of the lattice
constant caused by an increasing amount of the impurity atoms in the iron cell
Application of PAC in condensed matter and materials physics 35
results in the decrease of the hyperfine field compared to the defect free lattice
site. Hence, the fac is not constant, but changes with an increasing Mn
concentration x with the rate of-0.150 T/at.%.
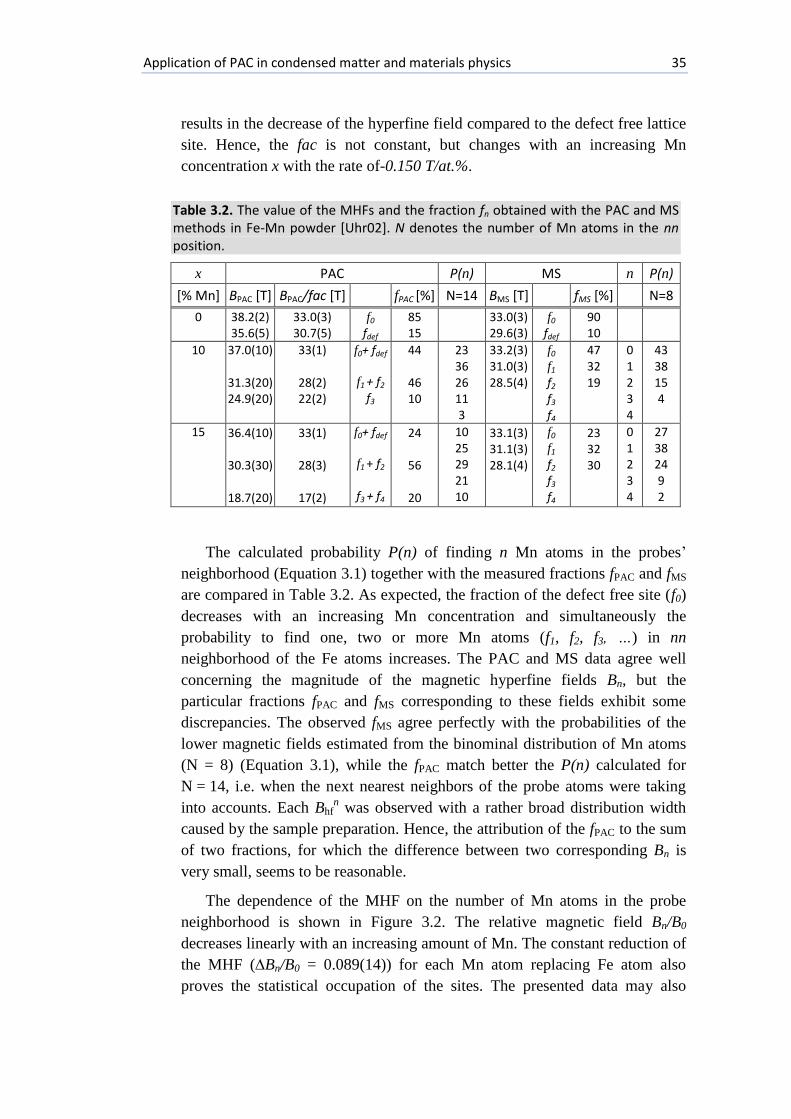
The calculated probability P(n) of finding n Mn atoms in the probes’
neighborhood (Equation 3.1) together with the measured fractions fPAC and fMS
are compared in Table 3.2. As expected, the fraction of the defect free site (f0)
decreases with an increasing Mn concentration and simultaneously the
probability to find one, two or more Mn atoms (f1, f2, f3, …) in nn
neighborhood of the Fe atoms increases. The PAC and MS data agree well
concerning the magnitude of the magnetic hyperfine fields Bn, but the
particular fractions fPAC and fMS corresponding to these fields exhibit some
discrepancies. The observed fMS agree perfectly with the probabilities of the
lower magnetic fields estimated from the binominal distribution of Mn atoms
(N = 8) (Equation 3.1), while the fPAC match better the P(n) calculated for
N = 14, i.e. when the next nearest neighbors of the probe atoms were taking
into accounts. Each Bhfn was observed with a rather broad distribution width
caused by the sample preparation. Hence, the attribution of the fPAC to the sum
of two fractions, for which the difference between two corresponding Bn is
very small, seems to be reasonable.
The dependence of the MHF on the number of Mn atoms in the probe
neighborhood is shown in Figure 3.2. The relative magnetic field Bn/B0
decreases linearly with an increasing amount of Mn. The constant reduction of
the MHF (Bn/B0 = 0.089(14)) for each Mn atom replacing Fe atom also
proves the statistical occupation of the sites. The presented data may also
Table 3.2. The value of the MHFs and the fraction fn obtained with the PAC and MS methods in Fe-Mn powder [Uhr02]. N denotes the number of Mn atoms in the nn position.
x PAC P(n) MS n P(n)
[% Mn] BPAC [T] BPAC/fac [T] fPAC [%] N=14 BMS [T] fMS [%] N=8
0 38.2(2) 35.6(5)
33.0(3) 30.7(5)
f0 fdef
85 15
33.0(3) 29.6(3)
f0 fdef
90 10
10 37.0(10)
31.3(20) 24.9(20)
33(1)
28(2) 22(2)
f0+ fdef
f1 + f2
f3
44
46 10
23 36 26 11 3
33.2(3) 31.0(3) 28.5(4)
f0 f1
f2 f3
f4
47 32 19
0 1 2 3 4
43 38 15 4
15 36.4(10)
30.3(30)
18.7(20)
33(1)
28(3)
17(2)
f0+ fdef
f1 + f2
f3 + f4
24
56
20
10 25 29 21 10
33.1(3) 31.1(3) 28.1(4)
f0 f1
f2 f3
f4
23 32 30
0 1 2 3 4
27 38 24 9 2
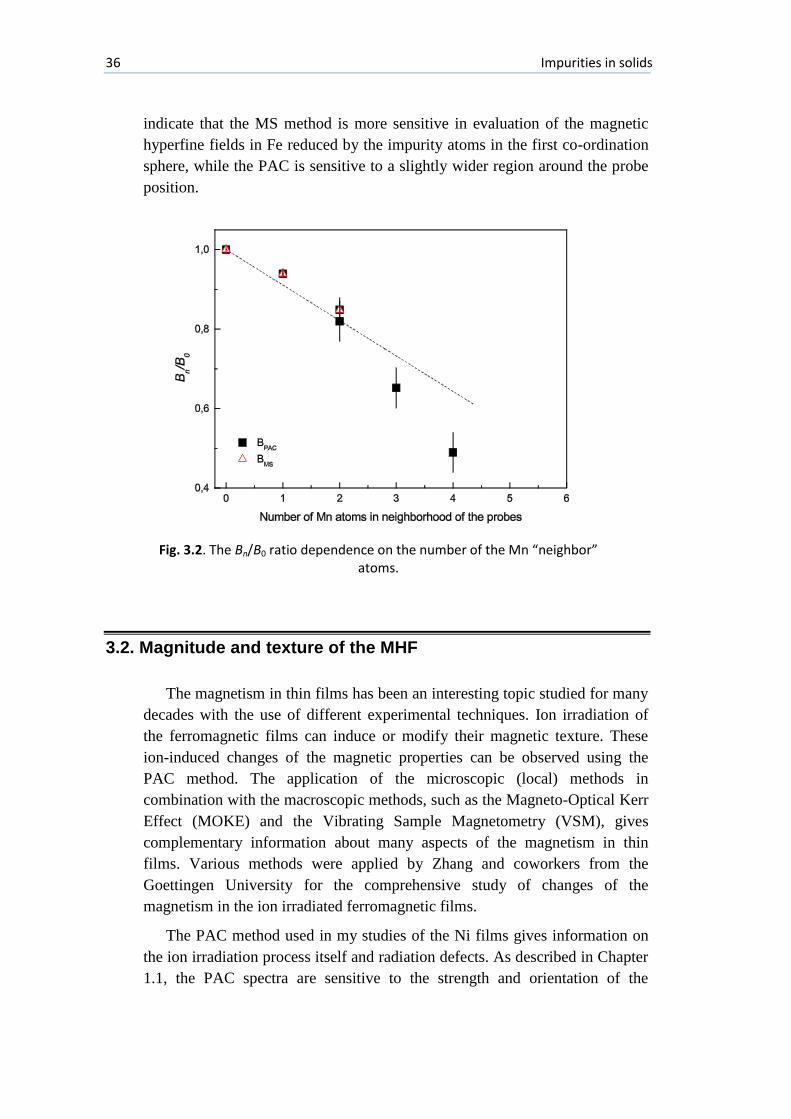
36 Impurities in solids
indicate that the MS method is more sensitive in evaluation of the magnetic
hyperfine fields in Fe reduced by the impurity atoms in the first co-ordination
sphere, while the PAC is sensitive to a slightly wider region around the probe
position.
3.2. Magnitude and texture of the MHF
The magnetism in thin films has been an interesting topic studied for many
decades with the use of different experimental techniques. Ion irradiation of
the ferromagnetic films can induce or modify their magnetic texture. These
ion-induced changes of the magnetic properties can be observed using the
PAC method. The application of the microscopic (local) methods in
combination with the macroscopic methods, such as the Magneto-Optical Kerr
Effect (MOKE) and the Vibrating Sample Magnetometry (VSM), gives
complementary information about many aspects of the magnetism in thin
films. Various methods were applied by Zhang and coworkers from the
Goettingen University for the comprehensive study of changes of the
magnetism in the ion irradiated ferromagnetic films.
The PAC method used in my studies of the Ni films gives information on
the ion irradiation process itself and radiation defects. As described in Chapter
1.1, the PAC spectra are sensitive to the strength and orientation of the
Fig. 3.2. The Bn/B0 ratio dependence on the number of the Mn “neighbor”
atoms.

Application of PAC in condensed matter and materials physics 37
magnetic hyperfine field (Bhf) at the probe position. If the magnetization of all
domains is oriented perpendicular to the detector plane, only the term with
2L appears; if it is parallel, only the term with L occurs. The following
examples illustrate the influence of ion irradiation on the magnetic texture of
the thin Ni films. Furthermore, these cases intend to highlight the most striking
experimental results obtained with the PAC method compared with those
obtained via MOKE.
Ni films irradiated with heavy ions
The thin (75 nm) Ni films of the size 7x110 mm2 were deposited via the
electron gun evaporation onto the center of a 15x35 mm2 big Si(100) substrate.
The PAC measurements were done with the 111
In/111
Cd probes implanted with
the energy of 170 keV into the samples at the room temperature. Then the Ni
thin films were homogeneously irradiated with 200 keV Xe+ ions at 300 K and
the dose of 4x10¹⁴
ions/cm2. The energy of the
111In and Xe
+ ions was chosen
to overlap the projected ion range for both ion species and to exclude any ion
beam mixing at the film/substrate interface. During irradiation the samples
were mounted onto a special holder enabling to keep them either in a flat or
bent position. All PAC measurements were performed at the room temperature
before and after each Xe irradiation for the different sample positions and
orientations to the detector plane: perpendicular or parallel II [Kul04].
After 111
In implantation all spectra were fitted with the PAC parameters
typical for 111
Cd in the substitutional, defect-free sites in Ni (LNi
= 96(2)
MHz, corresponding to the magnetic hyperfine field Bhf = 6.7(1) T) and with
Fig. 3.3. Typical PAC spectra and corresponding Fourier transforms of Ni films measured directly after 111In implantation for two orientations: sample
perpendicular (, =90°) and parallel (II, =0°) to the detector plane.

38 Magnitude and texture of the MHF
L = 43(10) MHz [Kul04] characteristic for the probe atoms situated in a
trivacancy cluster [Hoh77]. After Xe irradiation another lower MHF occurred
and was attributed to the radiation induced defects. The typical PAC spectra
with corresponding Fourier transforms taken directly after 111
In implantation
into the Ni film are shown in Figure 3.3.
To find the direction of the Bhf in the Ni thin film without using the
external magnetic field, the following experimental set-up was built as
sketched in Figure 3.4. The sample was placed perpendicular or parallel to the
detector plane and then subsequently rotated by the angle relative to the long
axis l.
If the magnetic field is aligned within the film plane, its orientation 0
(relative to the long axis) can be obtained from the variation of the
perturbation function with the tilt angle . The intensity ratio of the Fourier
components can be expressed as
S() I2L()/[IL() + I2L()] = s22/(s21 + s22), (3.2)
where amplitudes s21 and s22 are taken from the fitting procedure of
Equation 1.7. The simplest case of a superposition of probe nuclei with an
isotropically oriented hyperfine field with a fraction S0 and nuclei with field
oriented at the angle 0 with a fraction (1 – S0) follows the relationship
[Kul04]
S() = S0 + (1 – S0)cos2(0). (3.3)
Fig. 3.4. Geometry of the PAC set-up. ns – normal to the film, nd – normal to the
detector plane, A-D detectors. Here ns nd, at 45 relative to the detector direction.
The sample was rotated around ns by the angle relative to the long axis l.

Application of PAC in condensed matter and materials physics 39
The influence of the external stress on the magnetic texture was observed
in a series of the PAC measurements for different sample conditions before Xe
irradiation a): flat (series I), bent (to the well-defined curvatures 1/R= 1.0m-1
)
(series II), relaxed (series III); after Xe irradiation b): flat (series IV); after Xe
irradiation of the bent sample c): bent (V), relaxed (VI). Moreover the PAC
spectra were collected with a rotation step 15°-20° to ensure the precise
determination of the angle 0 [Kul04].
Magnetic texture of the Ni thin film
The measurements with the focused and defocused 111
In beam show that
already the radioactivity implantation condition can have a direct influence on
the magnetic hyperfine field orientation in the thin Ni film. In the standard
implantation procedure the focused 111
In beam is used, so the PAC spectra
exhibit the magnetic texture of the samples shown in Figure 3.3.
Figure 3.5 presents the S() function received for the different sample
conditions described above. The orientation of the magnetic hyperfine field
Bhf was obtained by fitting the experimental points to Equation 3.3. The
relative orientation of the MHF and the long axis of the sample observed after
the indicated sets PAC measurements are shown on the left side of Figure 3.5.
No changes of the Bhf direction between the series I (flat), II (bent) and III
(relaxed) were observed in the sample before Xe bombardment.
Furthermore, the application of the external stress only does not influence
the magnetic hyperfine field orientation within the film plane – 0 = 0
(Figure 3.5a). When Xe irradiation was done for the flat sample (series IV),
the magnetic texture rotated only by 0 = 25(4) (Figure 3.5b). The PAC
measurements taken after Xe irradiation of the Ni layer in bent condition
(series V) followed by the sample relaxation (series VI) show the drastic
change of the magnetic texture orientation (Figure 3.5c). This indicates that
the compressive stress built up in the Ni film during the relaxation is
responsible for the rotation of the Bhf direction by 0 = 86(2) [Kul04].
In order to compare the results obtained by the PAC method with the data
collected with the macroscopic one, the Magneto-Optical Kerr Effect (MOKE)
method was applied to investigate the Ni thin film irradiated with Xe ions. The
MOKE measurements were performed for as-implanted and for irradiated
samples with in-plane polarization field of HMOKE = 1.5 kOe [Kul04, Mül03].
The polar diagram of the relative remanence Re() = Mr()/Ms() measured
for the relaxed sample is shown in Figure 3.6. The Mr denotes the remanence,
Ms – the saturation magnetization, and - the angle between the long axis of
the sample and the polarizing field HMOKE. The easy axis of the magnetization
was found to point into the direction (0 = 22(2)), the same as observed by

40 Magnitude and texture of the MHF
a) before Xe irradiation: series I and II
b) before – series I– and after – series IV– Xe irradiation
c) after Xe irradiation: series V and VI
Fig. 3.5. The function S() measured for Ni films a) implanted with defocused and focused 111In beam, flat and bent conditions b) before and after Xe irradiation of the flat sample , c) after Xe irradiation in the bent condition followed by the sample relaxation.
flat, bent
irradiated, flat
irradiated relaxed

Application of PAC in condensed matter and materials physics 41
PAC. Therefore, it was concluded that the hyperfine field in the Ni film was
parallel to the magnetization. The PAC method gave the same information as
MOKE, but without applying an external magnetic field. This is the main
advantage of this hyperfine method.
3. 3. Nanomaterials
In recent years, an interest in the nano-sized particles, nanotubes and the
nanocrystalline materials has been exploding. This class of materials offers a
very wide field of new applications due to their mechanical, magnetic, optical
and other properties, which differ from those of the polycrystals or single
crystals. The mechanical alloying (MA) and mechanical milling (MM)
processes are the powerful tools for synthesis and fabrication of the advanced
materials including equilibrium and non-equilibrium phases, such as
amorphous phases or supersaturated solid solutions. They can be used to
produce the alloys and compounds that are difficult or impossible to obtain by
the conventional melting techniques. Moreover, during milling of the initially
crystalline compound a polymorphic or order-disorder phase transitions can
occur. After sufficient milling time the phase evolution to amorphous state or
decomposition of the intermetallic phase can be achieved. The mechanical
alloying process, where a solid state reaction takes place between the fresh
powder surfaces of the reactant materials at the room temperature, can be used
for the formation of the nanostructured materials.
Fig. 3.6. Polar diagram of the relative remanence in a Ni film relaxed after Xe irradiation (series VI).

42 Nanomaterials
Nanocrystalline materials are intensively studied using a broad arsenal of
techniques, among which the PAC method has a great local sensitivity.
Application of the PAC technique should enable the observation of the
formation of equilibrium phases, the nanostructure and amorphous phases
from the very beginning stage of the milling process.
Mechanical alloying of Fe – Mn
The Fe-Mn alloys are of technological interest, mainly related to the weak
shape memory effect arising from the -Fe(Mn) fcc – -Fe(Mn) hcp
martensitic transformation [Ena75], and to the multilayer spin-valve devices.
The equilibrium phase diagram of the Fe-Mn system shows existence of three
phases: bcc -Fe, fcc -Fe(Mn) and bcc -Mn at the room temperature. The
concentration of these phases (at RT) can be changed by the mechanical
alloying procedure, as demonstrated by the X-ray diffraction experiments
[Tch99] (Figure 3.7).
In order to study the formation of the Fe-Mn alloys in an extended
composition region, the Fe-Mn samples were prepared by 1 hour milling of the
high purity iron and manganese elemental powders using a planetary ball mill
AGO-2U type equipped with a steel drum and steel balls. The PAC
measurement (using 111
In/111
Cd probe) were performed for the Fe-Mn alloys
with the Mn concentration 10-90 at.% and compared with the results obtained
by the Mössbauer spectroscopy [Uhr01, Uhr02]. The magnetic hyperfine field
for the 111
Cd probes on substitutional defect-free sites in bcc Fe is well known
(Bhf = 38.2 T) [Lin81] and in the PAC spectra it is observed as the large
Larmor frequency of 560(1) MHz.
Fig. 3.7. Existence ranges at RT for alloy phases in the Fe–Mn system: (1) alloy formation in equilibrium, (2) alloy formation after high-energy ball milling [Tch99].

Application of PAC in condensed matter and materials physics 43
The PAC spectrum taken at the room temperature for the ball milled pure
Fe showed mainly the Larmor frequency (L=560(1) MHz), which
corresponds to the magnetic hyperfine field on the defect-free site in bcc -Fe.
The rest of the probes (about 15%) exhibited a lower MHF (Ldef
=522(6)
MHz, Bhfdef
= 35.6(5) T) caused by a defected neighborhood [Uhr02]. These
results are similar to those obtained for the thick Fe matrix. With an increasing
amount of Mn (up to 15%), the probe atoms with one, two or more Mn atoms
as the nearest neighbors were detected, which caused a constant reduction of
the MHF. The probabilities for those lower fields could be estimated from the
binominal distribution of the Mn atoms, similar to the case of Ni film
irradiated with Sb discussed in detail in Chapter 3.1. In the case of pure Mn,
the spectra taken for the ball milled and a thick metallic sample were
significantly different. Two broad electric field gradient distributions around
72 MHz and 126 MHz, and one quite well defined EFG (Q=102(4) MHz,
=0.65(5)) were required to fit the data of ball milled Mn sample. For the Fe
samples with the highest Mn concentrations (80-100 at.%) the same set of
parameters was used [Uhr02].
For the samples with the Mn concentration in the range 20-70 at. %, the
XRD analysis proved the fcc structure of the -Fe(Mn) phase [Tch99].
Nevertheless, the PAC spectra changed between 30 and 40 at.% Mn. The fcc
-Fe(Mn) phase ordered antiferromagnetically; the possible explanation for
this behavior is the change of the Néel-temperature. The PAC measurements
indicated that the Néel-temperature for the sample with 30 at.% Mn is below,
and for the sample with 40 at.% Mn, above 300 K [Uhr02].
The PAC experiments (and the MS measurements) confirmed that the
high-energy ball milling of the Fe-Mn powders results in the alloy formation
in the whole concentration range. The phase composition corresponds to the
equilibrium phase diagram but with the extended concentration ranges of a
single-phase. The Mn atoms were found to be almost randomly distributed in
the solid solutions obtained with the milling procedure.
Mechanical alloying of Hf – Al
The powder sample of the HfAl2 compound was synthesized from the
powder elements in a planetary mill and then analyzed using the scanning
electron microscope, the X-ray diffractometer and the PAC method. The
average grain size was determined using the Debye-Sherer formula based on
the broadening of the X-ray diffraction peaks [Sur98] that correspond to a
certain phase. The grain size of the HfAl2 powder reached the mean value of
approximately 65 nm [Kul10a].
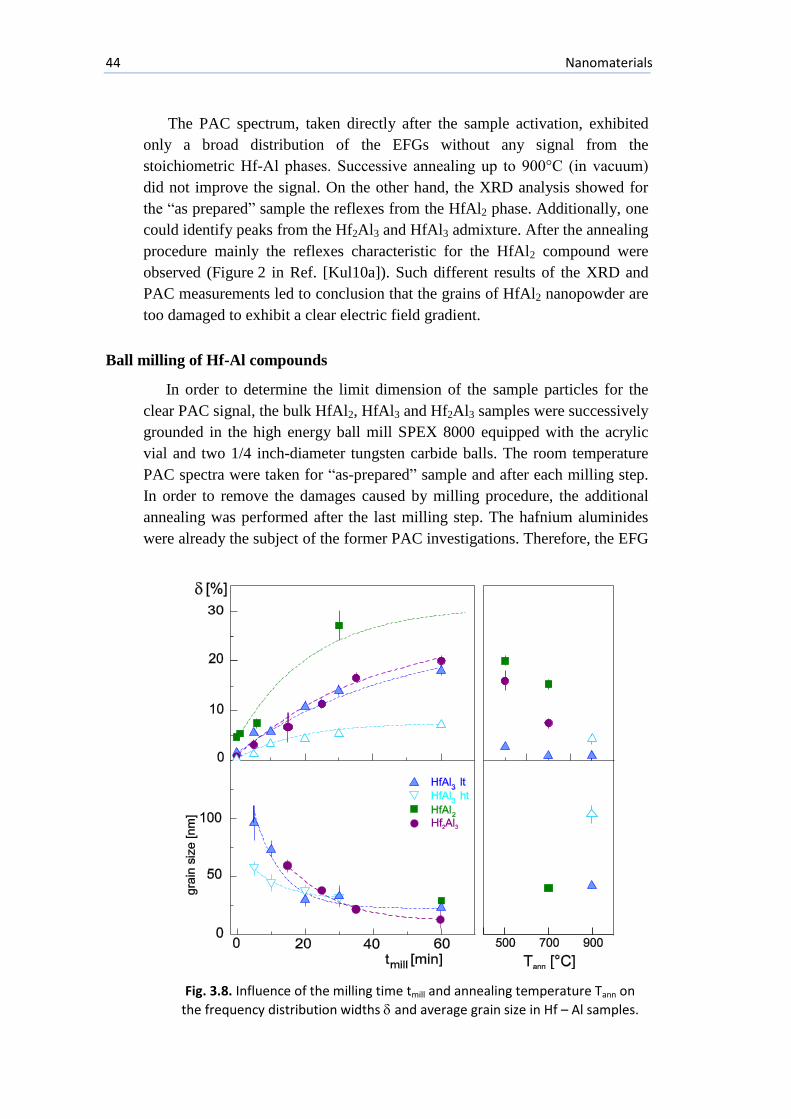
44 Nanomaterials
The PAC spectrum, taken directly after the sample activation, exhibited
only a broad distribution of the EFGs without any signal from the
stoichiometric Hf-Al phases. Successive annealing up to 900°C (in vacuum)
did not improve the signal. On the other hand, the XRD analysis showed for
the “as prepared” sample the reflexes from the HfAl2 phase. Additionally, one
could identify peaks from the Hf2Al3 and HfAl3 admixture. After the annealing
procedure mainly the reflexes characteristic for the HfAl2 compound were
observed (Figure 2 in Ref. [Kul10a]). Such different results of the XRD and
PAC measurements led to conclusion that the grains of HfAl2 nanopowder are
too damaged to exhibit a clear electric field gradient.
Ball milling of Hf-Al compounds
In order to determine the limit dimension of the sample particles for the
clear PAC signal, the bulk HfAl2, HfAl3 and Hf2Al3 samples were successively
grounded in the high energy ball mill SPEX 8000 equipped with the acrylic
vial and two 1/4 inch-diameter tungsten carbide balls. The room temperature
PAC spectra were taken for “as-prepared” sample and after each milling step.
In order to remove the damages caused by milling procedure, the additional
annealing was performed after the last milling step. The hafnium aluminides
were already the subject of the former PAC investigations. Therefore, the EFG
Fig. 3.8. Influence of the milling time tmill and annealing temperature Tann on
the frequency distribution widths and average grain size in Hf – Al samples.
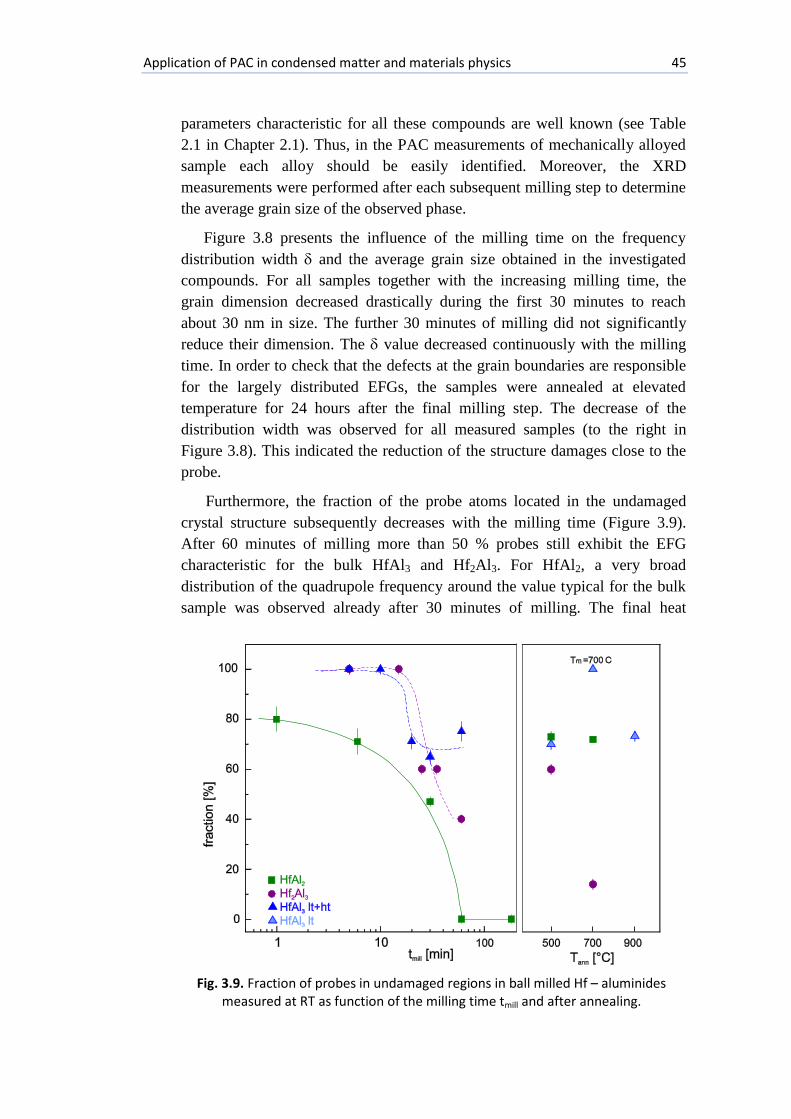
Application of PAC in condensed matter and materials physics 45
parameters characteristic for all these compounds are well known (see Table
2.1 in Chapter 2.1). Thus, in the PAC measurements of mechanically alloyed
sample each alloy should be easily identified. Moreover, the XRD
measurements were performed after each subsequent milling step to determine
the average grain size of the observed phase.
Figure 3.8 presents the influence of the milling time on the frequency
distribution width and the average grain size obtained in the investigated
compounds. For all samples together with the increasing milling time, the
grain dimension decreased drastically during the first 30 minutes to reach
about 30 nm in size. The further 30 minutes of milling did not significantly
reduce their dimension. The value decreased continuously with the milling
time. In order to check that the defects at the grain boundaries are responsible
for the largely distributed EFGs, the samples were annealed at elevated
temperature for 24 hours after the final milling step. The decrease of the
distribution width was observed for all measured samples (to the right in
Figure 3.8). This indicated the reduction of the structure damages close to the
probe.
Furthermore, the fraction of the probe atoms located in the undamaged
crystal structure subsequently decreases with the milling time (Figure 3.9).
After 60 minutes of milling more than 50 % probes still exhibit the EFG
characteristic for the bulk HfAl3 and Hf2Al3. For HfAl2, a very broad
distribution of the quadrupole frequency around the value typical for the bulk
sample was observed already after 30 minutes of milling. The final heat
Fig. 3.9. Fraction of probes in undamaged regions in ball milled Hf – aluminides
measured at RT as function of the milling time tmill and after annealing.

46 Nanomaterials
treatment applied after milling procedure caused a different process observed
in each samples: a removal of defects, recrystallization or phase
decomposition.
The HfAl2 powder formerly milled for 180 minutes was heated at 700°C.
The PAC measurements showed that the thermal treatment partially removed
the defects in the crystal structure and the frequency distribution became close
to that for the not milled sample. The fact that the annealing procedure did not
“repair” the HfAl2 structure in the whole volume fraction indicates a
significant structural disorder in the outer part of grains [Kul10a].
For the bulk HfAl3 sample two EFGs were observed – the main fraction of
probes exhibited an EFG corresponding to the low temperature D023 phase, the
remaining fraction to the high temperature D022 phase. Both phases were
observed in the PAC measurements as well as in the XRD spectra for the
whole milling program. But only the annealing at 500°C after 60 minutes of
milling led to the PAC spectrum with the well-defined quadrupole frequency
typical for the low temperature HfAl3 phase. Lack of the high temperature
phase proves that the defects in the crystal structure created during milling
facilitated the recrystallization of the sample in the D023 phase. Additional
annealing at 900◦C followed by a fast cooling down again caused the
formation of a small fraction (ca. 20%) of the D022 phase. It should be
mentioned, that the heating treatment alone (500°C 47h) without any ball
Fig. 3.10. XRD spectra for Hf2Al3 sample measured after subsequent milling steps, and final annealing of the powder after 60 minutes milling time. Peaks corresponding to the initial Hf2Al3 and the final HfAl and HfAl2 phases are indicated.

Application of PAC in condensed matter and materials physics 47
milling procedure did not remove the high temperature fraction from the bulk
sample [Kul10a]. The XRD measurements confirmed the presence of both
phases in the milled HfAl3 sample.
The ball milling of the Hf2Al3 bulk sample caused the fraction reduction of
the well-defined quadrupole frequency already after 25 minutes of the total
milling time. This fraction increased again in the sample milled for 60 minutes
and annealed at 500°C. Surprisingly, after additional heating at 700°C the
PAC spectrum changed drastically. The main fraction (~60%) was described
by the hfi parameters well known for the HfAl2 compound. About 26% of
probes exhibited the EFG similar to that observed in the HfAl compound, and
only 14% of probes still were placed in the Hf2Al3 phase. These measurements
showed that the milling process followed by an additional thermal treatment
caused the decomposition of the initial Hf2Al3 phase into HfAl2 and HfAl. The
possible explanation of the observed phenomena is the increase of the local
temperature above the melting point and high stress built during milling. In the
XRD spectra the change of the sample structure was identified and the lines
characteristic for the HfAl2 phase were seen, in agreement with the PAC
results (Figure 3.10).
3.4. Oxidation of the intermetallic compounds
Oxidation is generally described as the most commonly encountered form
of the high-temperature corrosion. However, the oxidation process itself is not
always detrimental. Corrosion studies of the intermetallic compounds are
motivated by two needs for (i) high melting, hard materials which form
protective films to operate at high temperatures in the corrosive environments;
(ii) the surface examination of the semiconductor compounds to fabricate the
electronic materials. The oxidation process is usually selective; preferentially
forming the oxide of the less noble constituent and for the refractory
intermetallic compounds shows a tendency to form more than one type of the
oxide at low temperatures.
The PAC technique is very suitable in the investigation of the oxidation
processes since it enables observation at a very early stage. The measured EFG
is mainly determined by the positions and charges of the neighbor atoms. New
microsurroundings arising around the probe site cause changes in the EFG
value and symmetry and can be identified by their characteristic hyperfine
interactions parameters.

48 Oxidation of the intermetallic compounds
EFG at 181
Ta probe in Hf-, Zr- and Al- oxides
Intermetallic compounds are being considered as an important class of
materials for a variety of applications. The alloys based on the aluminides
have gained a special attention due to their high oxidation resistance. The
ZrAl, Zr4Al3, Zr3Al2 and Zr3Al samples were subsequently annealed for 3
hours in air at the increasing temperatures from 973 K to 1373 K. At the end,
they were additionally heated in air for 24 hours at 1373 K. After each
annealing step, the PAC spectra were recorded at the room temperature using a
conventional fast-slow coincidence setup with four BaF2 detectors. The known
quadrupole interaction parameters of the 181
Ta probes in the ZrAl, Zr4Al3,
Zr3Al2 and Zr3Al compounds listed in Table 2.1, Chapter 2, and their
constituents oxides (Table 3.3) were used for the identification of the probe
surroundings created in the investigated samples.
Figure 3.11 illustrates the evolution of the Fourier transform of the PAC
spectra taken at the room temperature with the 181
Ta probes in the ZrAl3
sample after annealing in air at the increasing temperature. For the oxidation at
Toxid = 973 K one can observe a single frequency triplet indicating a unique
EFG whose parameters are known for the non-oxidized Zr3Al. This indicates
that the 181
Hf/181
Ta probes occupy the defect-free substitutional Zr lattice sites
in the Zr3Al lattices. For higher heating temperatures, the fraction of the
probes in pure Zr3Al decreases and two new fractions appear. One fraction of
Fig. 3.11. The Fourier transforms of PAC spectra for 181Ta probe in Zr3Al sample oxidized
in air at the indicated temperatures. The quadrupole frequencies Q characteristic for Zr3Al, ZrO2 and Al2O3 are indicated by the color bars [Wod03a].

Application of PAC in condensed matter and materials physics 49
the probes experiences the EFG characterized by Q1 = 777(3) MHz, 1 = 0.39
and the second one by Q2 1250(3) MHz, 2 = 0 [Wod03a].
In order to assign these EFGs to the specific probe surroundings, the
known results of the measurements at 181
Ta in the HfO2, ZrO2 and Al2O3
phases were considered, see Table 3.3. This table collects also theoretical
results for the EFG tensor (Vzz and at the Ta site in the investigated oxides
obtained by the all-electron ab initio electronic structure calculation, published
elsewhere. The literature on the subject reports that the charge state of
impurity can modify the electronic structure around the impurity.
Consequently, this change can strongly affect the structural distortion and the
EFG [Alo08, Dar12, Err02, Err03]. Considering that the replacement of Hf+4
,
Zr+4
or Al+3
by Ta+5
can lead to the different charge states, calculations were
performed assuming that neutral Ta remains in the valence state when
replacing a host atom (“neutral state”) and removing one or two electrons
from the unit cell (“charged state”). For the computation details see Refs.
[Ren05, Alo08, Tay10, Tay12].
The measurements at 181
Ta in HfO2 gave a large fraction of the probes
having an asymmetric EFG with the quadrupole frequency Q = 707-802 MHz
[Aya94, For08] which has been attributed to a substitutional defect-free
cationic site in the monoclinic oxide structure. The PAC experiments on 181
Ta
in ZrO2 showed a very similar EFG, Q = 783(6) MHz, = 0.34(1) [Sci85,
Jae86], which was also attributed to the substitutional 4e cation site (Table
3.2) basing on the chemical and structural similarities between both
compounds. Considering the experimental and calculated results, the first
Table 3.3. Experimental and calculated VZZ value, in units of 1021 V/m2, and the
asymmetry parameter at the 181Ta site in in the m-HfO2, m-ZrO2 and -Al2O3 oxides.
Oxide Exp. Calc.
Ref. exp. Ref. calc. Q[MHz] Vzz
exp (RT) (RT) Vzzcalc (0K) calc
m-ZrO2
783(6) 802(2)
1200(100) 777(3)
13.7(1) 14.1(1) 21(2)
13.6(1)
0.337(7) 0.335(5) 0.3-0.4 0.39(3)
13.49 char 19.93 neut
0.3(1) 0.4(5)
[Sci85,Jae86] [For08] [For08]
[Wod03a]
[Tay12] [Tay12]
-Al2O3 1250(3) 628(5)
21.9(1) 11.0(2)
0 0
19.85 char
10.61 neut 0 0
[Wod03a] [Ren05]
[Ren05] [Ren05]
m-HfO2
793(2)
1300(100)
12.4(1) 13.9(1) 23(1)
0.340(3) 0.345(5) 0.3-0.4
13.6 char 21.2 neut
0.40 0.29
[Aya94] [For08] [For08]
[Alo08] [Alo08]

50 Oxidation of the intermetallic compounds
EFG1 (Vzz = 13.6x10²¹
V/m2) was connected with the formation of monoclinic
ZrO2 and attributed to Ta in a regular cationic site with the probe in the
charged state.
In the Al2O3 corundum structure, each cation is surrounded by a nearly
regular oxygen octahedron with a rather small bond length between the
cationic and the oxygen ion. The combined experimental and ab initio
approaches were used to characterize the EFG for the 181
Ta probe in the -
Al2O3 single crystal [Rent05]. The calculated value of the symmetry and
orientation of the largest EFG component Vzz for the neutral cell agree
excellent with the experimental results obtained for the -Al2O3 single crystal
[Ren05], see Table 3.2. The calculated values of Vzz and for the charged cell
(Vzzcal
= +19.851021
V/m2, cal
= 0) indicate that the ionization of the deep
double-donor level duplicates the magnitude of the EFG but does not change
its symmetry.
The second EFG2 observed in the oxidized compound corresponds neither
to the experimental results obtained for 181
Hf/181
Ta in the -Al2O3 single
crystal nor to the calculated Vzz value considered for the neutral cell. On the
other hand, it meets very well the case of the Vzz value calculated for a charged
cell [Rent05]. Taking into account all these experimental and calculated
results, the attribution of the measured Vzz = 21.9(3) x1021
V/m2 to
181Ta
replacing an Al atom in the Al2O3 charged cell is the most probable
configuration.
Oxidation of the zirconium aluminides
The influence of the oxidation process on the zirconium aluminides was
observed during heating in air at temperatures above 1000 K. The hfi
parameters assigned to Ta in the regular cationic sites of the monoclinic m-
ZrO2 and the corundum -Al2O3 phases with the probe in the charged state
discussed earlier were obtained in all oxidized compounds under study. Figure
3.12 shows the probe fractions f (left) and the widths of the EFG
distributions (right) in the ZrAl, Zr4Al3, Zr3Al2 and Zr3Al samples after
annealing in air for 3 hours at the indicated temperatures. The additional points
at 1373 K in the Figure 3.12 correspond to the final oxidation time of 24
hours.
The results show that the limiting temperature for the oxidation resistance
of the investigated Zr–aluminides is about 1073 K. The complete oxidation
temperature depends not only on the aluminum content in the alloys but also
on the c/a ratio of the crystal lattice (Figure 3.13). The obtained values of the
probe fractions, however, have to be considered with caution, since the 181
Hf/181
Ta probes are impurities in both oxides. This fact implies a possible
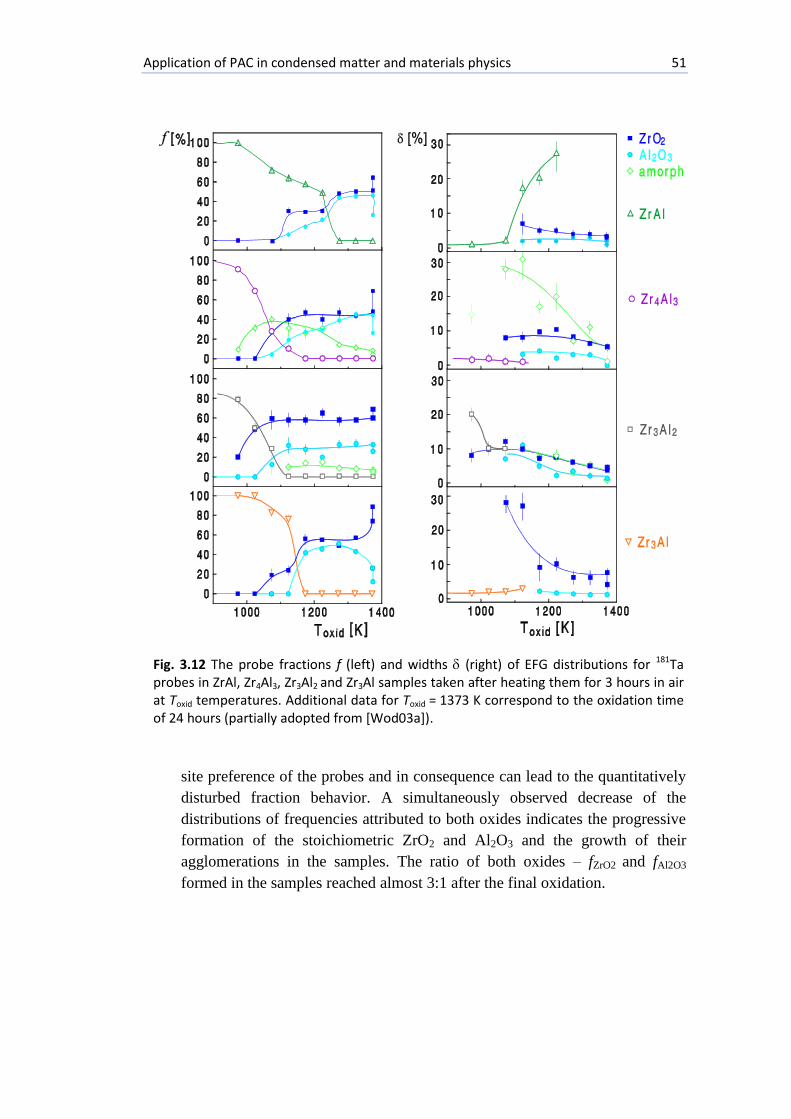
Application of PAC in condensed matter and materials physics 51
site preference of the probes and in consequence can lead to the quantitatively
disturbed fraction behavior. A simultaneously observed decrease of the
distributions of frequencies attributed to both oxides indicates the progressive
formation of the stoichiometric ZrO2 and Al2O3 and the growth of their
agglomerations in the samples. The ratio of both oxides – fZrO2 and fAl2O3
formed in the samples reached almost 3:1 after the final oxidation.
Fig. 3.12 The probe fractions f (left) and widths (right) of EFG distributions for 181Ta probes in ZrAl, Zr4Al3, Zr3Al2 and Zr3Al samples taken after heating them for 3 hours in air at Toxid temperatures. Additional data for Toxid = 1373 K correspond to the oxidation time of 24 hours (partially adopted from [Wod03a]).
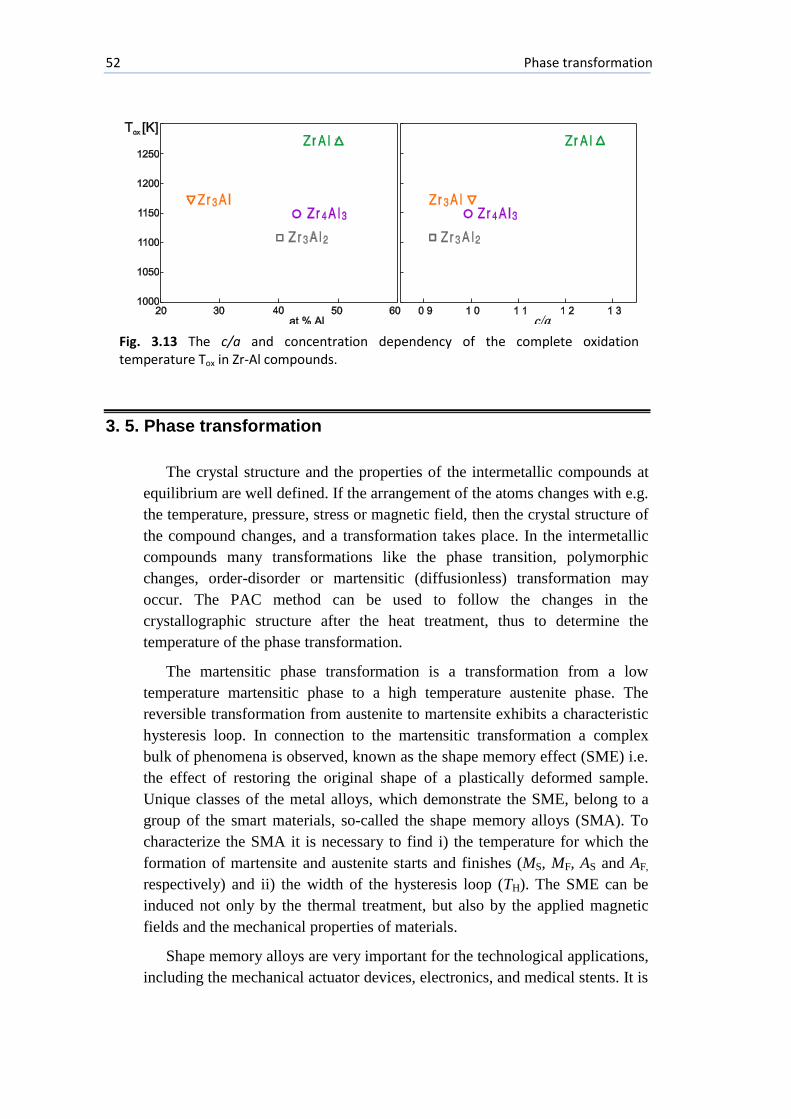
52 Phase transformation
3. 5. Phase transformation
The crystal structure and the properties of the intermetallic compounds at
equilibrium are well defined. If the arrangement of the atoms changes with e.g.
the temperature, pressure, stress or magnetic field, then the crystal structure of
the compound changes, and a transformation takes place. In the intermetallic
compounds many transformations like the phase transition, polymorphic
changes, order-disorder or martensitic (diffusionless) transformation may
occur. The PAC method can be used to follow the changes in the
crystallographic structure after the heat treatment, thus to determine the
temperature of the phase transformation.
The martensitic phase transformation is a transformation from a low
temperature martensitic phase to a high temperature austenite phase. The
reversible transformation from austenite to martensite exhibits a characteristic
hysteresis loop. In connection to the martensitic transformation a complex
bulk of phenomena is observed, known as the shape memory effect (SME) i.e.
the effect of restoring the original shape of a plastically deformed sample.
Unique classes of the metal alloys, which demonstrate the SME, belong to a
group of the smart materials, so-called the shape memory alloys (SMA). To
characterize the SMA it is necessary to find i) the temperature for which the
formation of martensite and austenite starts and finishes (MS, MF, AS and AF,
respectively) and ii) the width of the hysteresis loop (TH). The SME can be
induced not only by the thermal treatment, but also by the applied magnetic
fields and the mechanical properties of materials.
Shape memory alloys are very important for the technological applications,
including the mechanical actuator devices, electronics, and medical stents. It is
Fig. 3.13 The c/a and concentration dependency of the complete oxidation temperature Tox in Zr-Al compounds.
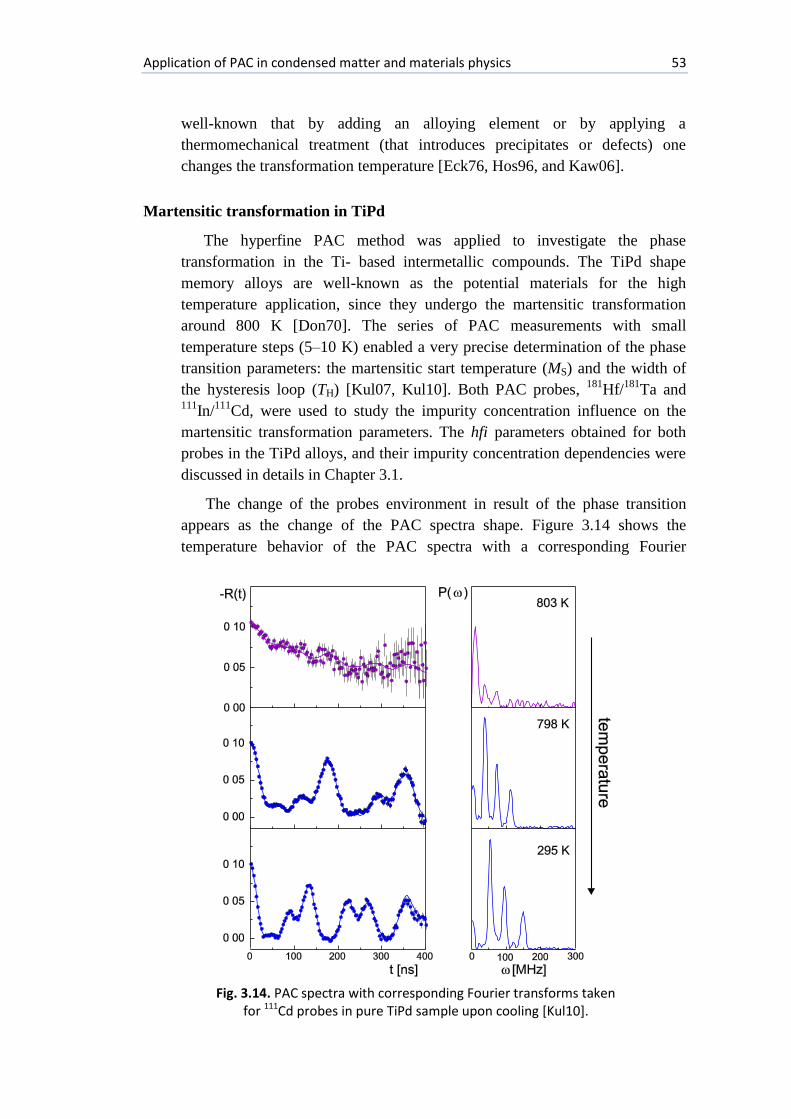
Application of PAC in condensed matter and materials physics 53
well-known that by adding an alloying element or by applying a
thermomechanical treatment (that introduces precipitates or defects) one
changes the transformation temperature [Eck76, Hos96, and Kaw06].
Martensitic transformation in TiPd
The hyperfine PAC method was applied to investigate the phase
transformation in the Ti- based intermetallic compounds. The TiPd shape
memory alloys are well-known as the potential materials for the high
temperature application, since they undergo the martensitic transformation
around 800 K [Don70]. The series of PAC measurements with small
temperature steps (5–10 K) enabled a very precise determination of the phase
transition parameters: the martensitic start temperature (MS) and the width of
the hysteresis loop (TH) [Kul07, Kul10]. Both PAC probes, 181
Hf/181
Ta and 111
In/111
Cd, were used to study the impurity concentration influence on the
martensitic transformation parameters. The hfi parameters obtained for both
probes in the TiPd alloys, and their impurity concentration dependencies were
discussed in details in Chapter 3.1.
The change of the probes environment in result of the phase transition
appears as the change of the PAC spectra shape. Figure 3.14 shows the
temperature behavior of the PAC spectra with a corresponding Fourier
Fig. 3.14. PAC spectra with corresponding Fourier transforms taken
for 111Cd probes in pure TiPd sample upon cooling [Kul10].

54 Phase transformation
transforms obtained with the 111
Cd probe in the pure TiPd sample [Kul10].
The phase transformation is very well illustrated by the drastic change of the
PAC pattern between 803 K and 798 K. Above the MS temperature the
spectrum shape can be described by the frequency distribution around
Q = 0 MHz characteristic for the probe in the cubic environment of B2
structure. The low temperature martensitic phase has the B19 structure of the
lower symmetry. The hfi parameters determined at the room temperature
showed that about 70% of the probe atoms exhibit the EFG described by the
well-defined quadrupole frequency Q = 48.8(7) MHz and asymmetry
parameter = 0.34(1), and the remaining probes have lower Q = 37(2) MHz
( = 0.83(3)) with a slightly broader distribution width [Kul10]. These EFGs
were attributed to the probe atoms substituting the Ti-2f and Pd-2e sites in the
tetragonal B19 structure. Detailed information about the probe site occupation
and the composition dependence on the observed EFGs was discussed in
Chapter 3.1.
A similar temperature behavior of the PAC spectra, characteristic for the
phase transition, was observed with the 181
Hf/181
Ta probe in TiPd doped with
hafnium or zirconium. The evident transformation region allowed to determine
the martensitic start temperature with a high accuracy. The MS determined for
pure TiPd implanted with 111
In and melted with 0.18 at.% 181
Hf reached
810(2) K and 778(2) K, respectively [Kul07,].
Composition influence on the martensitic transformation
In order to investigate the influence of impurities on the martensitic
transformation in the TiPd alloy, a series of the PAC experiments were
performed for the different concentrations of Hf, In and Zr. The samples were
prepared with the different highest content of Hf, In and Zr admixtures
However, no clear phase transformation was observed in the alloy doped with
the maximum concentration of indium.
As can be seen in Figure 3.14, at 803 K a small fraction of sharp frequency
characteristic for the martensite was already visible, where at 798 K still some
fraction of the austenite remained. It means that the phase transformation takes
place in a narrow temperature interval. The value of this interval increases
with increasing amount of the third element. For the highest Hf concentration
it reaches 20 K, and 40 K for only ~1 at.% Zr or In.
The martensitic start temperature MS and the hysteresis loop width TH
established by PAC as a function of admixture content x are presented in
Figure 3.15. The decrease of the starting temperature MS with increasing
impurity concentration was observed simultaneously with an increase of the
hysteresis width TH for all impurities used. It is worth noting that only for the
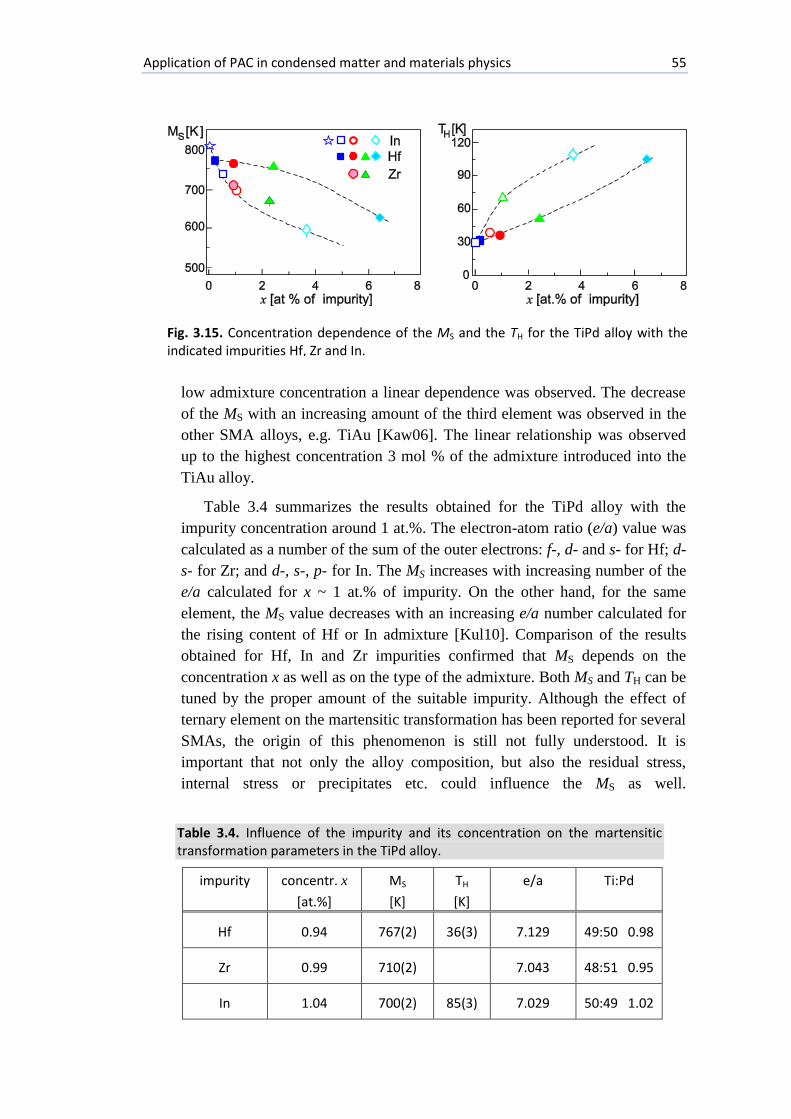
Application of PAC in condensed matter and materials physics 55
low admixture concentration a linear dependence was observed. The decrease
of the MS with an increasing amount of the third element was observed in the
other SMA alloys, e.g. TiAu [Kaw06]. The linear relationship was observed
up to the highest concentration 3 mol % of the admixture introduced into the
TiAu alloy.
Table 3.4 summarizes the results obtained for the TiPd alloy with the
impurity concentration around 1 at.%. The electron-atom ratio (e/a) value was
calculated as a number of the sum of the outer electrons: f-, d- and s- for Hf; d-
s- for Zr; and d-, s-, p- for In. The MS increases with increasing number of the
e/a calculated for x ~ 1 at.% of impurity. On the other hand, for the same
element, the MS value decreases with an increasing e/a number calculated for
the rising content of Hf or In admixture [Kul10]. Comparison of the results
obtained for Hf, In and Zr impurities confirmed that MS depends on the
concentration x as well as on the type of the admixture. Both MS and TH can be
tuned by the proper amount of the suitable impurity. Although the effect of
ternary element on the martensitic transformation has been reported for several
SMAs, the origin of this phenomenon is still not fully understood. It is
important that not only the alloy composition, but also the residual stress,
internal stress or precipitates etc. could influence the MS as well.
Fig. 3.15. Concentration dependence of the MS and the TH for the TiPd alloy with the indicated impurities Hf, Zr and In.
Table 3.4. Influence of the impurity and its concentration on the martensitic transformation parameters in the TiPd alloy.
impurity concentr. x
[at.%]
MS
[K]
TH
[K]
e/a Ti:Pd
Hf 0.94 767(2) 36(3) 7.129 49:50 0.98
Zr 0.99 710(2) 7.043 48:51 0.95
In 1.04 700(2) 85(3) 7.029 50:49 1.02
56 Summary
Summary
This monograph presents the results of the selected experiments
demonstrating the PAC as an important method to study fundamental topics of
the hyperfine interaction in the condensed matter, as well as the advantages of
its application in material sciences.
A comprehensive study of the Hf-Al and Zr-Al systems performed by our
group has provided the important data about the quadrupole interaction in the
intermetallic compounds. The detailed PAC measurements executed for the
Hf-Al and Zr-Al phases, present in the phase diagrams, showed similarities
between corresponding isostructural compounds. The series of experiments
performed using two most common probes, 181
Ta and 111
Cd, gave the
information about the localization of impurities in the host lattice. A high
precision in the determination of the hfi parameters and their temperature
dependencies allowed comparison with the theoretical values obtained by the
DFT-based ab initio calculation. An interesting behavior of the probe in the
intermetallic compounds have been discussed in details: the site preference
(111
Cd or 181
Ta in (Hf/Zr/Ti)Al3 compounds); the temperature-driven
reversible switching between substitutional sites (111
Cd in ZrAg); the
segregation into the phase admixture (111
Cd in ZrAl with minority Zr2Al3).
The hfi parameters experimentally obtained by our group for different
intermetallic systems such as Zr-Ag and Ti-Pd, as well as compounds with the
MoSi2 or C16 –type of structure built a very wide data-base used by many
theoretical research groups for the EFG calculations. These results showed
how important it is to understand the role of impurities in a compound at an
atomic level.
The similarities between the Hf- and Zr- aluminides reflected the similar
temperature dependence parameters. The quadrupole frequency followed
mostly the linear or T3/2
function. However, unusual relationships, such as an
increase of the EFG with the temperature or an irregular dependence, were

Summary 57
also observed – e.g. Zr3Al and Zr2Al, which illustrated the very complicated
problem of the EFG dependence on temperature.
To illustrate the sensitivity of the PAC method to the strength and
orientation of the magnetic hyperfine field, I discussed the investigation of the
texture and its changes in the thin Ni films upon heavy ion irradiation. I found
that the compressive stress built up in the Ni layer during relaxation of the Xe-
irradiated sample is responsible for the rotation of the Bhf direction by
. The changes of Bhf orientation observed via PAC are consistent
with the results obtained by MOKE.
The PAC experiments performed by me for the mechanically alloyed Fe-
Mn powders provide the information about the extended composition region
of the -Fe(Mn) phase. Moreover, the influence of the impurity concentration
on the magnetic hyperfine field was proven. The number of foreign atoms in
the nearest neighborhood of the probe atoms leads to the formation of the
lower satellite Bhf.
A series of the PAC measurements with the ball milled HfAl2, HfAl3 and
Hf2Al3 compounds were performed to study the influence of the grain
boundaries on the EFG parameters. The distribution the width increases,
while the fraction of the quadrupole frequency characteristic for the pure phase
decreases with a decreasing grain size. The defects created in the crystal
structure during the milling facilitated the recrystallization of the HfAl3
sample to the low temperature phase. Moreover, the milling procedure
followed by the annealing caused the decomposition of the initial Hf2Al3 phase
into HfAl2 and HfAl. The XRD analysis complemented the characteristic of
the investigated nanopowders.
The sensitivity on the local environment of the PAC method was also
illustrated by the case of the oxidation process observed in the zirconium
aluminides. The results provided the oxidation resistance temperature of the
measured compounds to be approximately 1073 K. The progressive formation
of the stoichiometric ZrO2 and Al2O3 and the growth of their agglomerations
with increasing annealing temperature were observed. The assignment of the
observed quadrupole frequencies to these oxides was confirmed by the
calculations (computer code WIEN). Moreover, the experimentally obtained
EFGs agreed with the calculated ones under assumption that the Ta probe is in
a charged state.
The possibility to perform the PAC measurements in a very wide
temperature region (from a few to several hundreds of K) makes it well-suited
to follow phenomena as a function of temperature. The use of PAC in the
phase transformation or phase analysis studies is one of its main application
areas. As an example, I present study of the martensitic transformation in the
58 Summary
TiPd alloy doped with different impurities. The PAC measurements proved
that the martensitic transformation parameters, MS and TH, can be tuned by the
addition of a third element and the variation of its concentration. I found that
the MS temperature increased, while the TH decreased with the increasing In,
Hf or Zr content in TiPd, but the linear relationship was observed only for the
low impurity concentration. Moreover, the slope of these relationships
depends on the type of impurity used.
The presented applications of PAC in the condensed matter and material
physics, showed one very important, but not the only possible, use of this
hyperfine method. Many other applications not discussed here show the
versatility of the problems that can be addressed with PAC. This method can
be used to study the diffusion and other atomic movement in solids, surface,
interface and grain boundaries, point defects identification and production, and
exchange and dynamical interactions. The new digital spectrometers recently
built by a few PAC groups, improved its functionality. A new class of
scintillators based on the LYSO, LaBr3 crystals strongly improved its
sensitivity. The additional isotopes besides the most common 111
In/Cd and 181
Hf/Ta can be also adopted. This allows measurements of a new wide class
of materials, including biological samples; something that was not possible
until now.

59
Acknowledgements
This monograph is the result of many years of work and I could not have
completed it without the support of many people. Let me devote this page to all
who helped me.
First and foremost, I would like to thank Dr. hab. Paweł Wodniecki and
Dr Barbara Wodniecka for all the years of our common work, support and the
friendly atmosphere and stimulating discussions. I will always owe them debts
of gratitude for all that they have done for me.
I would like to express my gratitude to Prof. K. P. Lieb and Dr M.
Uhrmacher from the II Institute of Physics, University of Göttingen, for a
fruitful collaboration and hospitality during my visits in Göttingen.
I wish to thank Prof. J. Styczeń and the heads of Department:
Prof. U. Woźnicka and Assoc Prof. M. Marszałek, who have encouraged and
motivated me to write this monograph.
Last but not least, great thanks to my colleagues from the IFJ PAN for
vibrant discussions at the morning coffee meetings and for creating a friendly
and motivating workplace.

60

References 61
References:
Ada94 J. M. Adams and G. L. Catchen, Phys. Rev. B 50 (1994) 1264.
Alo08 R. E. Alonso, L. A. Errico, E. L. Peltzer y Blancá, A. López-García, A. Svane, and N. E. Christensen, Phys. Rev. B 78 (2008) 165206.
And75 K. Andersen, Phys. Rev. B 12 (1975) 3060.
Aya94 A. Ayala, R. E. Alonso, and A. López-García, Phys. Rev. B 50 (1994) 3547.
Bar80 H. Barfuß, G. Böhnlein, H. Hohenstein, W. Kreische, M. Meinhold, H. Niedrig, Phys. Lett. A 79 (1980) 252.
Bel07 J. Beloševic-Čavor, V. Koteski, B. Cekič, A, Umicevič, Comp. Mater. Sci. 41 (2007) 164.
Bel08 J. Beloševic-Čavor, V. Koteski, B. Cekič, A, Umicevič, Comp. Mater. Sci. 43 (2008) 867.
Bel12 J. Beloševic-Čavor, V. Koteski, J. Radkovič, Solid State Commun. 152 (2012) 1072.
Ber69 R. Bèraud, I. Berkes, J. Danière, G. Marest, R. Rougny, Nucl. Instr. and Meth.69 (1969) 41.
Bla88 P. Blaha, K. Schwarz and P. H. Dederichs, Phys. Rev. B 37 (1988) 2790.
Bla01 P. Blaha, K. Schwarz, G. Madsen, D. Kvasnicka, and J. Luitz, “WIEN2k, an Aug- Plane Wave +Local Orbitals Program for Calculating Crystal Properties”, K. Schwarz, Techn. Uni. Wien, 2001, (ISBN 3-9501031-1-2).
Bła09 A. Błachowski, U. D. Wdowik, K. Ruebenbauer, J. Alloy Compd. 485 (2009) 36.
But83 T. Butz, A. Lerf, Phys. Lett. A 97 (1983) 217.
Chr76 J. Christiansen, P Heubrs, R. Keitel, W Klinger, W. Loeffler, W. Sandner, and W. Witthuhn, Z. Phys. B 24 (1976) 177.
Col01 G. Collins and M. Zacate, Hyperfine Interact. 136/137 (2001) 641 and 647
Dar57 L. S. Darken and R. W. Gurry, “Physical Chemistry of Metals” New York: Mc Graw-Hill, 1957.
Dar12 G. N. Darriba, M. Renteria, H. M. Petrilli, and L. V. C. Assali, Phys. Rev. B86 (2012) 075203.
Don70 H. C. Donkersloot and J. H. N. van Vucht, J. Less-Common Met. 20 (1970) 83.
Eck76 K. H. Eckelmeyer, Scripta Metall. 10 (1976) 667.
Ena75 K. Enami, A. Nagasawa and S. Nenno, Scripta Metall. 9 (1975) 941.
Err02 L. A. Errico, G. Fabricius, M. Renteria, P. de la Presa, M. Forker, Phys. Rev. Lett. 89 (2002) 055503.
Err03 L. A. Errico, G. Fabricius, M. Renteria, Phys. Rev. B 67 (2003) 144104.
Err10 L. A. Errico, H. M. Petrilli, L. A. Terrazos, A. Kulińska, P. Wodniecki, K. P. Lieb, M. Uhrmacher, J. Belosevic-Cavor, and V. Koteski, “Electric field gradients in 111In-doped (Hf/Zr)3Al2 and (Hf/Zr)4Al3 mixed compounds: ab initio calculations, perturbed angular correlation measurements ad site preference”, J. Phys: Condens. Mat. 22 (2010) 215501.

62 References
For08 M. Forker, P. de la Presa, W. Hoffbauer, S. Schlabach, M. Bruns, and D. V. Szabó, Phys. Rev. B 77 (2008) 054108.
Fra65 H. Fraunenfelder and R. M. Steffen, in Karlsson, E. Mathias and K. Siegbahn (eds.) Alfa-, Beta- and Gamma- Ray Spectroscopy, vol.2, North-Holland, Amsterdam, 1963, p.1118.
Her80 P. Herzog, K. Freitag, M. Reuschenbach, H. Walitzki, Z. Phys. A 294 (1980) 13.
Hoh64 P. Hohenberg, W. Kohn, Phys. Rev. B 136 (1964) 864.
Hoh77 H. Hohenemeser, A.R. Arends, H. de Waard, H.G. Devare, F. Pleiter and S. A. Drentje, Hyperfine Interact. 3 (1977) 297.
Hos96 H. Hosoda, K. Enami, A. Kamio, K. Inoue, J. Intel. Mat. Syst. Str. 7 (1996) 312.
Jae86 H. Jaeger, J. A. Gardner, J. C. Haygarth, and R. L. Rasera, J. Am. Ceram. Soc. 69 (1986) 458.
Jen76 P. Jena, Phys. Rev. Lett. 36 (1976) 418.
Kaj73 J. Kajfosz, Institute of Nuclear Physics (Cracow) Report No 858/PM, 1973.
Kan84 J. Kanamori, H. Akai, M. Akai, Hyperfine Interact. 17-19 (1984) 287.
Kaw06 T. Kawamura, R.Tachi, T. Inamura, H. Hosoda, K. Wakashima, K. Hamada, S. Miyazaki, Mat. Sci. Eng. A 438-440 (2006) 383.
Kes89 J. Kesten , Hyperfine Interact. 52 (1989) 17.
Koh65 W. Kohn, I.J. Sham, Phys. Rev. A 140 (1965) 1133.
Kul04 A. Kulińska, K. P. Lieb, G. A. Müller, M. Uhrmacher, and K. Zhang, “Magnetic texture in Ni films after Xe ion implantations measured with Perturbed Angular Correlation Spectroscopy”, J. Magn. Magn. Mater. 272-276 (2004) 1149.
Kul06 A. Kulińska, B. Wodniecka, P. Wodniecki, “The perturbed angular correlation studies of Ag-Zr compounds with 111Cd probes“, J. Alloy. Compd. 426 (2006) 76.
Kul07 A. Kulińska, P.Wodniecki, “Martensitic transformation in TiPd shape memory alloys studied by PAC method with 181Ta probes”, Intermetallics 15 (2007) 1196.
Kul10 A. Kulińska, P.Wodniecki, M. Uhrmacher, “Martensitic transformation in TiPd shape memory alloys studied by PAC method with 111Cd probes”, J. Alloy. Compd. 494 (2010) 17.
Kul10a A. Kulińska, P. Wodniecki, “Electric field gradients in nanoparticles of HfAl2 and HfAl3 intermetallic compounds”, Hyperfine Interact. 198 (2010) 47.
Kul12 A. Kulińska, H. M. Petrilli, L. Errico, V. Fernández, “TDPAC and ab initio study of pure and 111Cd- and 181Ta-doped XAl3 (X: Hf, Zr, Ti) intermetallics”, Book of Abstract HFI/NQI Conference 2012, Pekin, China
Lin81 B. Lindgren, Y. K. Vijay, Hyperfine Interact. 9 (1981) 379.
Mad01 G.K.H. Madsen, P. Blaha, K. Schwarz, E. Sjöstedt, and L. Nordström, Phys. Rev. B 64 (2001) 195134.
Mül03 G. A. Müller, A. Kulińska, K. Zhang, R. Gupta, P. Schaaf, M. Uhrmacher and K. P. Lieb, “MOMS and PAC studies of ion-irradiated ferromagnetic films”, Hyperfine Interact. 151/152 (2003) 223.
Neu98 M. Neubauer, N. Reinecke, A. Kulińska, K. P. Lieb, M. Uhrmacher, P. Wodniecki,

References 63
M. Strömer, H. U. Krebs “ PAC measurements in laser deposited Ag/Fe and In/Fe alloys”, J. Magn. Magn. Mater. 189 (1998) 8.
Nis78 K. Nishiyama, F. Dimmling and D. Riegel, Phys. Rev. Lett. 37 (1978) 357.
Rag75 R. S. Raghavan, E. N. Kaufmann and P. Raghavan, Phys. Rev. Lett. 34 (1975) 1280.
Rag76 P. Raghavan, E.N. Kaufmann, R. S. Raghavan, E. J. Ansaldo and R. A. Naumann, Phys. Rev. B 13 (1976) 2835.
Ren05 M. Rentería, G. N. Darriba, L. A. Errico, E. L. Muñoz, P. D. Eversheim, phys. status solidi b 242 (2005) 1928.
Sch96 G. Schatz and A. Weidinger, “Nuclear Condensed Matter Physics: Nuclear Methods and Application”, Wiley, New York, 1996.
Sci85 A. Scian, E. Aglietti, M. C. Caracoche, P. C. Rivas, A. F. Pasquevich and A. López-García, J. Am. Ceram. Soc. 68 C (1985) 285.
Sjö00 E. Sjöstedt, L. Nordström, and D. J. Singh, Solid State Commun. 114 (2000) 15 see also S. Cottenier, ” Density Functional Theory and the Family of (L)APW-Methods: A Step-by-Step Introduction” KU Leuven, Belgium, 2002 (http://www.wien2k.at/reg_user/textbooks).
Ste66 M. B. Stearns, Phys. Rev. 147 (1966) 439.
Ste72 R. M. Sternheimer, Phys. Rev. A 6 (1972) 1702.
Sur98 C. Suryanarayana, M. Grant Norton, “X-Ray Diffraction, A Practical Approach”, Plenum, New York (1998).
Tay10 M.A. Taylor, R.E. Alonso, L.A. Errico, A. Lopez-Garcıa, P. de la Presa, A. Svane, and N.E. Christensen, Phys. Rev. B 82 (2010) 165203.
Tay12 M. A. Taylor, R. E. Alonso, L. A. Errico, A. Lopez-Garcıa, P. de la Presa, A. Svane, and N. E. Christensen, Phys. Rev. B 85 (2012) 155202.
Tch99 V. Tcherdyntsev, S. D. Kaloshkin, I. A. Tomilin, E. V. Shelekhov, and Y. V. Baldokhin, Z. Metallkd. 90 (1999) 747.
Tor06 D. Torumba, K. Parliński, M. Rots, and S. Cottenier, Phys. Rev. B 74 (2006) 144304.
Uhr01 M. Uhrmacher, A. Kulińska, Y. V. Baldokhin, V. V. Tcherdyntsev, S. D. Kaloshkin, A. Ponza, “Hyperfine Study of Mechanically Alloyed Fe-Mn system”, Hyperfine Interact. 136/137 (2001) 327.
Uhr02 M. Uhrmacher, A. Kulińska, Yu.V. Baldokhin, V. V. Tcherdyntsev, S.D. Kaloshkin, A. Maddalena, G. Principi, “Fe-Mn Mechanically Alloyed powders characterized by local probes”, Intermetallics 10 (2002) 571.
Vin73 I. Vincze, and I. A. Campbell, J. Phys. F 3 (1973) 647.
Wod01 P. Wodniecki, B. Wodniecka, A. Kulińska, M. Uhrmacher, K. P. Lieb, “The Electric Field Gradients in (Zr/Hf)Al3 and (Zr/Hf)2Al3 Intermetallic Compounds Studied by 181Ta and 111Cd-PAC spectroscopy”, Hyperfine Interact. 136/137 (2001) 535.
Wod02 P. Wodniecki, B. Wodniecka, A. Kulińska, M. Uhrmacher, K. P. Lieb, “The HfAl2 and ZrAl2 Laves phases studied by 181Ta and 111Cd perturbed angular correlation spectroscopy”, J. Alloy. Compd. 335 (2002) 20.
Wod03 P. Wodniecki, B. Wodniecka, A. Kulińska, M. Uhrmacher, K. P. Lieb, “Hf and Zr
64 References
aluminides with Bf structure studied by PAC with 181Ta and 111Cd probes”, J. Alloy. Compd. 351 (2003) 1.
Wod03a P. Wodniecki, B. Wodniecka, A. Kulińska, and A. Z. Hrynkiewicz, “Oxidation of ZrAl and Zr3Al compounds studied by 181Ta PAC spectroscopy”, Hyperfine Interact. 151/152 (2003) 291.
Wod03b P. Wodniecki, B. Wodniecka, A. Kulińska, “ZrAg and Zr2Ag phases studied by Perturbed angular correlation with 181Ta probes”, phys. status solidi b 236 (2003) 565.
Wod04 P. Wodniecki, B. Wodniecka, A. Kulińska, M. Uhrmacher, K.-P. Lieb, “Zr2Al and Zr3Al compound studied by PAC with 181Ta and 111Cd probes”, J. Alloy. Compd. 365 (2004) 52.
Wod05 P. Wodniecki, A. Kulińska, B. Wodniecka, M. Uhrmacher, K. P. Lieb, “Hf3Al2 and Zr3Al2 isostructural aluminides studied by PAC with 181Ta and 111Cd probes”, Hyperfine Interact. 158 (2005) 429.
Wod07 P. Wodniecki, A. Kulińska, B. Wodniecka, S. Cottenier, H. M. Petrilli, M. Uhrmacher and K. P. Lieb, “Structural characterization of Zr4Al3 and Hf4Al3 compound by means of hyperfine interaction studies”, Europhys. Lett. 77 (2007) 43001.
Wod09 P. Wodniecki, A. Kulińska, B. Wodnieck, J. Beloševic-Čavor, V. Koteski, ”Experimental and ab initio study of the electric field gradients at Ta and Cd impurities in TiAl3”, J. Alloy Compd. 479 (2009) 56.
