power monitoring in the data centre - bicsi · power monitoring in the data centre fixed or...
TRANSCRIPT
Power Monitoring in the Data Centre
Fixed or Wireless
Steve Strange RCDDSteve Strange RCDD
ANIXTER INTERNATIONAL
Agenda
• Energy ConsumptionEnergy Consumption– Case Study
• Reasons to Monitor• Reasons to Monitor– Power Monitoring
– Environmental Monitoring
• Asset Tags
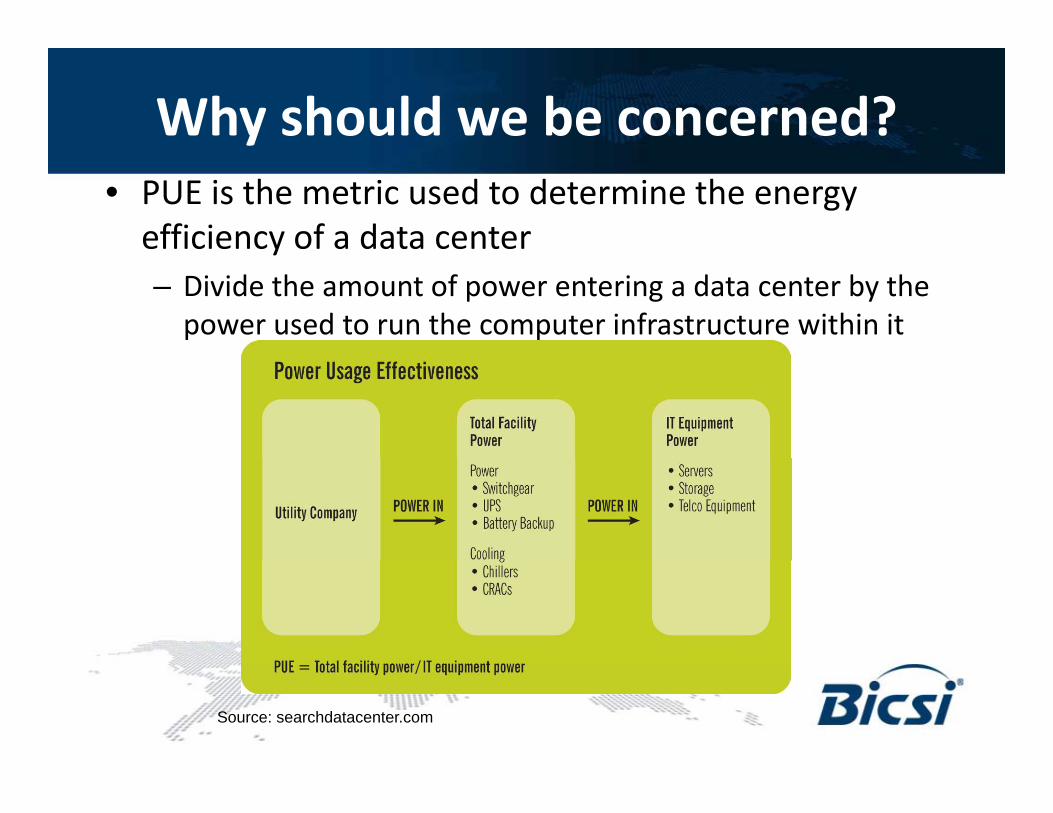
Why should we be concerned?• PUE is the metric used to determine the energy efficiency of a data centery– Divide the amount of power entering a data center by the power used to run the computer infrastructure within it
Source: searchdatacenter.com
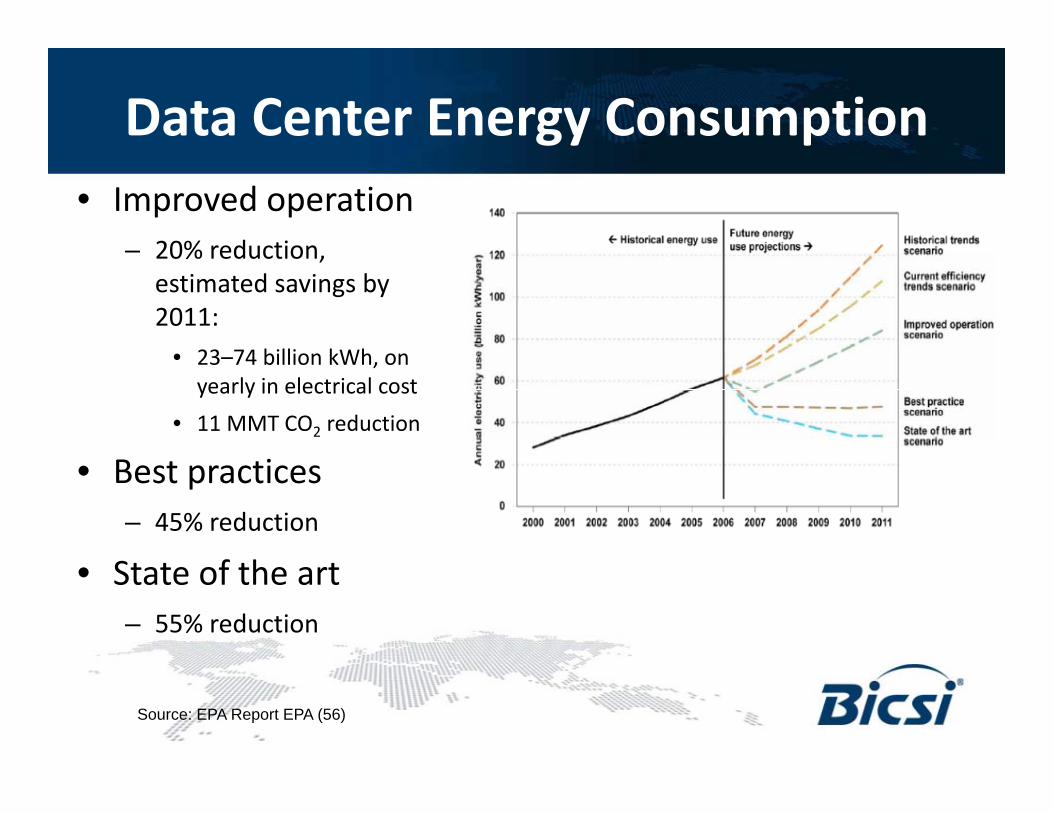
Data Center Energy Consumption• Improved operation
– 20% reduction20% reduction, estimated savings by 2011:
• 23 74 billion kWh on• 23–74 billion kWh, on yearly in electrical cost
• 11 MMT CO2 reduction
• Best practices– 45% reduction
f h• State of the art– 55% reduction
Source: EPA Report EPA (56)
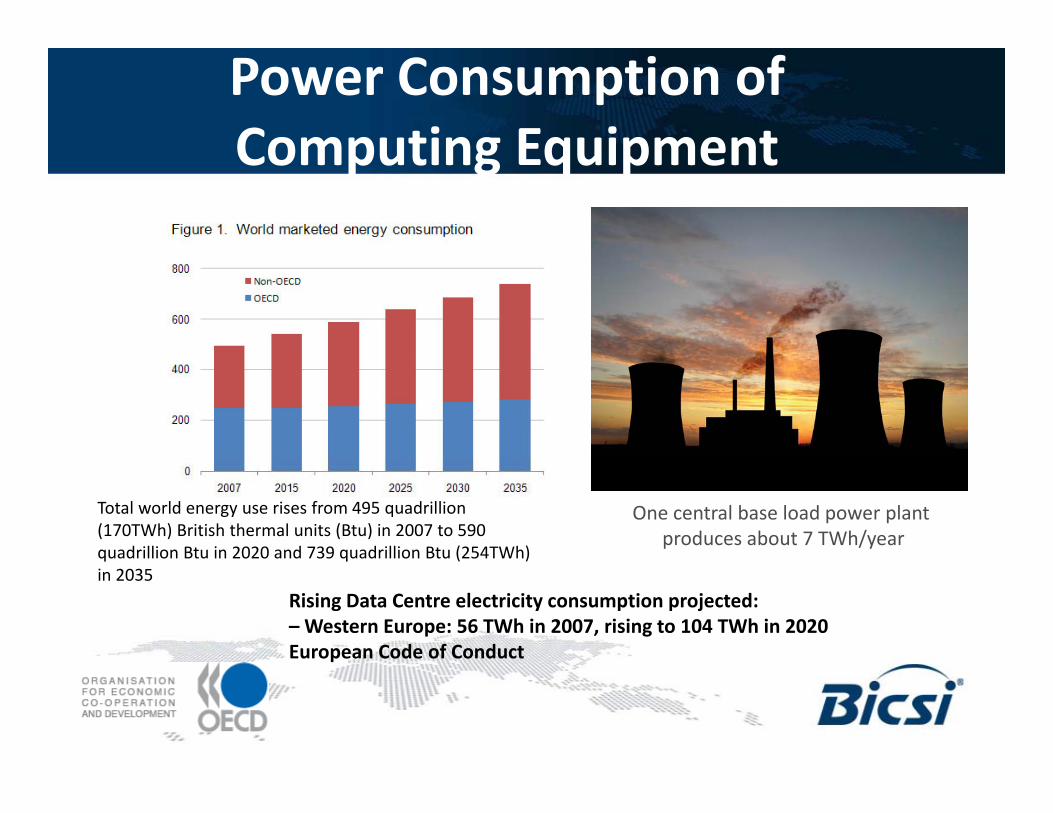
Power Consumption of Computing EquipmentComputing Equipment
One central base load power plant produces about 7 TWh/year
Total world energy use rises from 495 quadrillion (170TWh) British thermal units (Btu) in 2007 to 590 quadrillion Btu in 2020 and 739 quadrillion Btu (254TWh) q q ( )in 2035
Rising Data Centre electricity consumption projected:– Western Europe: 56 TWh in 2007, rising to 104 TWh in 2020European Code of Conduct
Source: IEEE
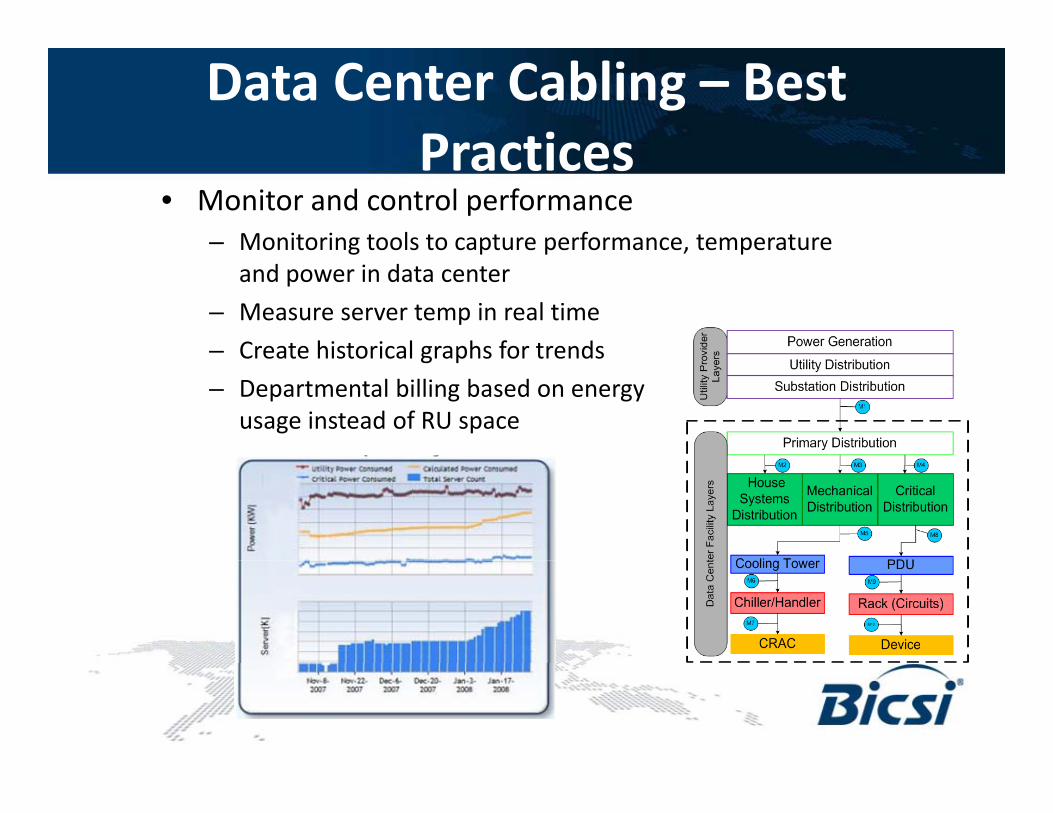
Data Center Cabling – Best PracticesPractices
• Monitor and control performance– Monitoring tools to capture performance, temperature g p p , p
and power in data center
– Measure server temp in real time
– Create historical graphs for trendsCreate historical graphs for trends
– Departmental billing based on energy usage instead of RU space
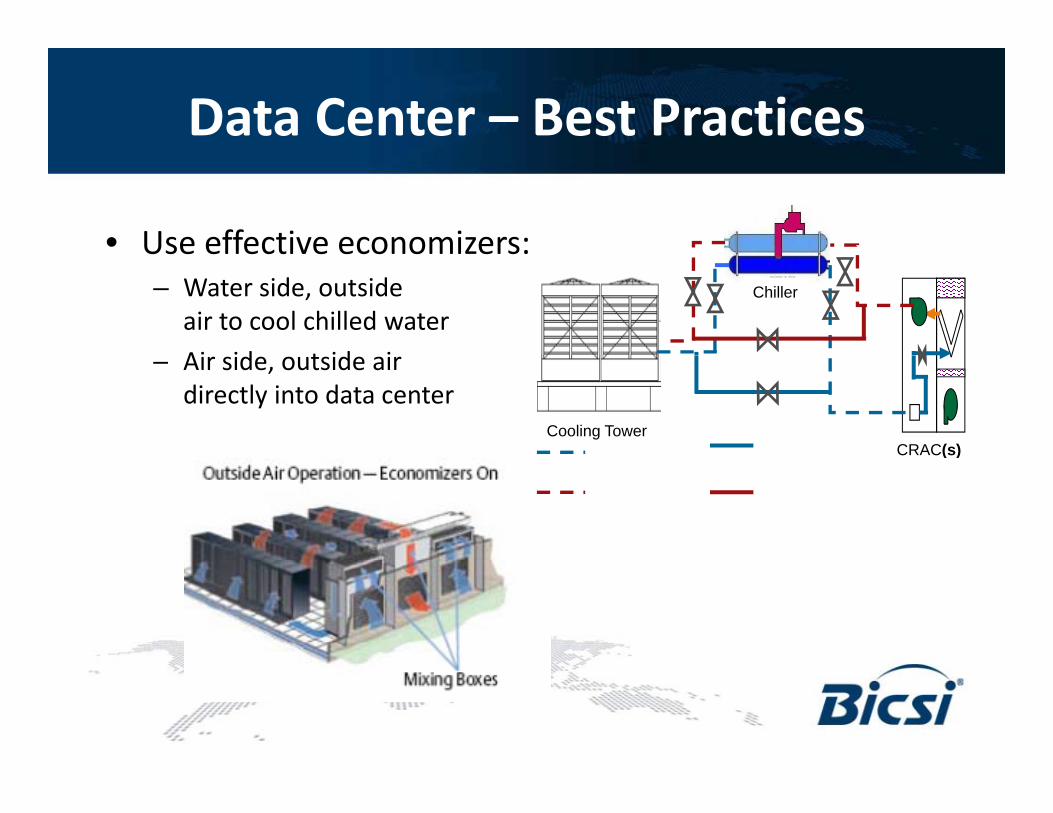
Data Center – Best Practices
• Use effective economizers:Chiller
Use effective economizers:– Water side, outside
air to cool chilled water
Ai id t id i
Cooling TowerCRAC(s)
– Air side, outside air directly into data center
( )
Data Center – Efficiency Tactics• Virtual servers, consolidation and storage:
– Server virtualization • For example, VMware and Microsoft
– Consolidate equipment – use blade instead of rack servers (shared fans and p/s)
• Utilize CPU management feature:–Optimize power consumption based on CPU utilization– Lowers processor power states when peak performance is not needed
– Reduces power consumption without compromising processing capability
St• Storage:– Tiered – only use high‐speed drives where applications need immediate responseC lid t d l di k d i l d ffi i t– Consolidated – large disk drives, slow speed more efficient warrant use with volume
Green Data Centers
• Products:High efficiency UPS systems and distribution– High‐efficiency UPS systems and distribution
– High‐voltage rack PDUs and power strips– IT equipment – power cords
l– Precision in‐row air cooling options– Augmented air and water delivery systems and ducting systems
– Monitoring and measurement tools:• Thermal cameras• Modeling software
D t ti t• Detection systems
– Rack accessories:• Blanking panels• Cable managementCable management • Rear door exhaust systems
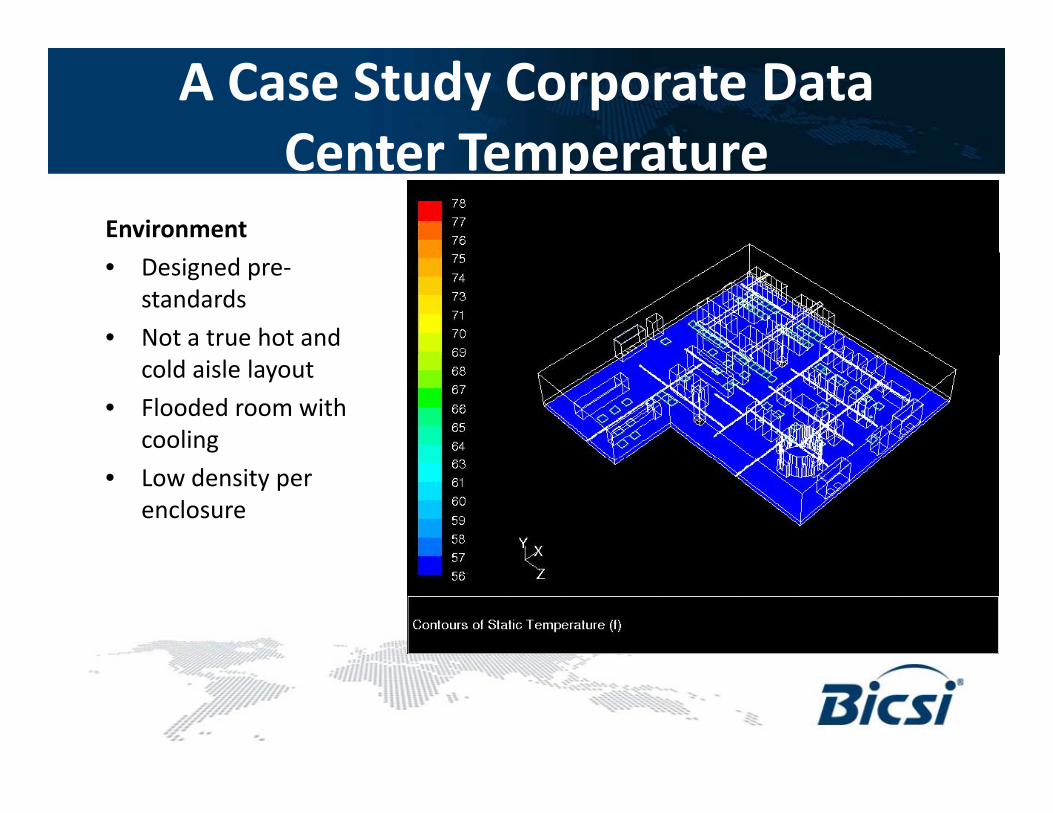
A Case Study Corporate Data Center TemperatureCenter Temperature
Environment
• Designed pre‐standards
• Not a true hot and cold aisle layout
• Flooded room with cooling
• Low density per enclosure
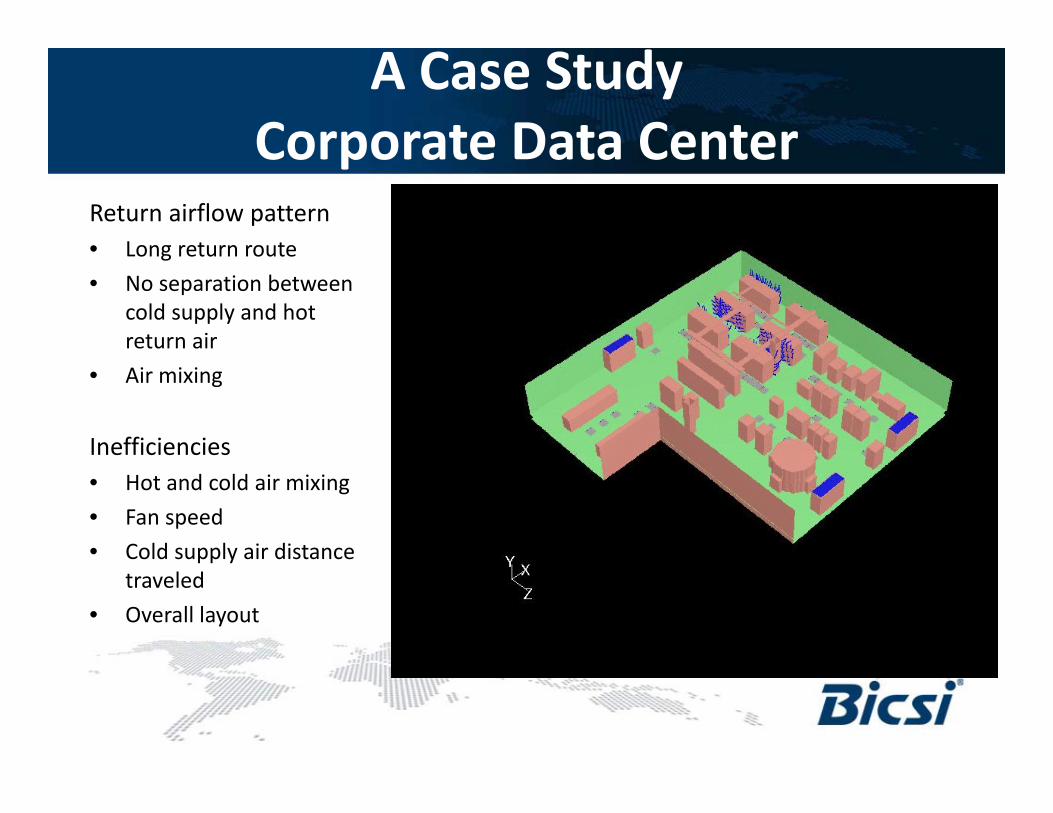
A Case StudyCorporate Data CenterCorporate Data Center
Return airflow pattern• Long return routeLong return route
• No separation between cold supply and hot return air
• Air mixing
Inefficiencies• Hot and cold air mixing
• Fan speed
• Cold supply air distance pp ytraveled
• Overall layout
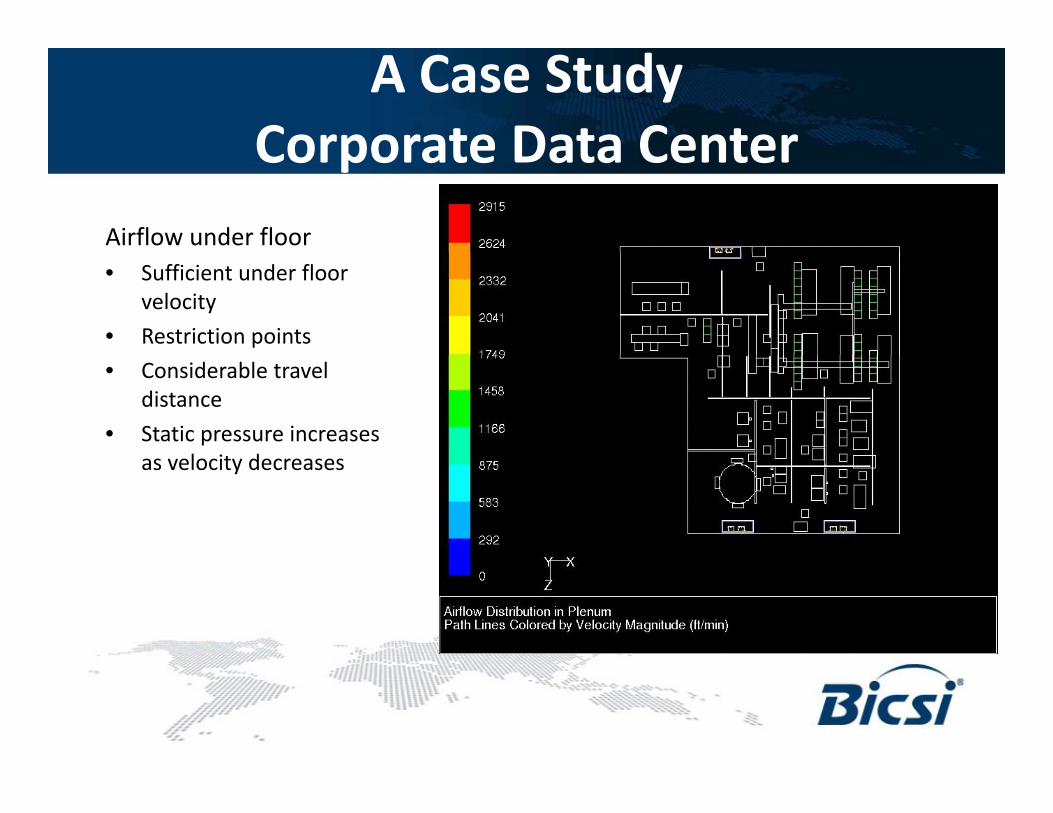
A Case Study Corporate Data CenterCorporate Data Center
Airflow under floor• Sufficient under floor
velocity
• Restriction points
• Considerable travel distance
• Static pressure increases l it das velocity decreases
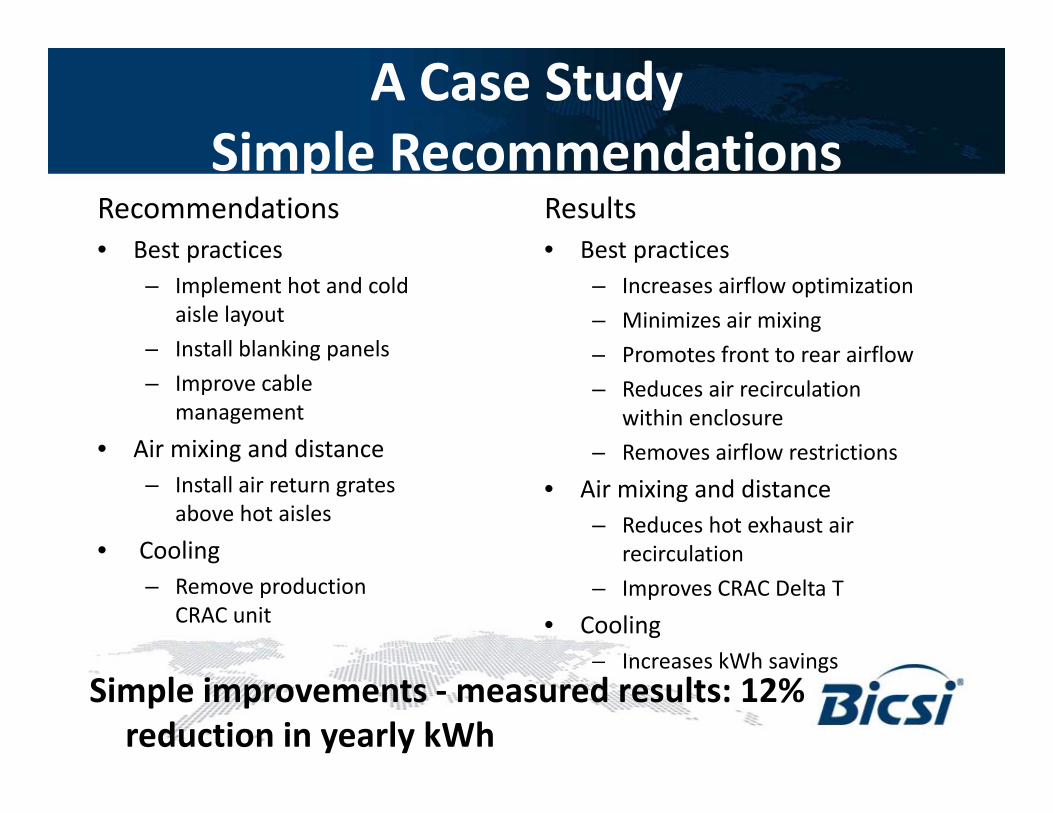
A Case StudySimple RecommendationsSimple Recommendations
Recommendations• Best practices
Results• Best practicesBest practices
– Implement hot and cold aisle layout
– Install blanking panels
Best practices– Increases airflow optimization
– Minimizes air mixing
– Promotes front to rear airflowInstall blanking panels
– Improve cable management
• Air mixing and distance
– Promotes front to rear airflow
– Reduces air recirculation within enclosure
– Removes airflow restrictionsg– Install air return grates
above hot aisles
• Cooling
Removes airflow restrictions
• Air mixing and distance– Reduces hot exhaust air
recirculationg– Remove production
CRAC unit
recirculation
– Improves CRAC Delta T
• Cooling– Increases kWh savingsIncreases kWh savings
Simple improvements ‐measured results: 12% reduction in yearly kWh
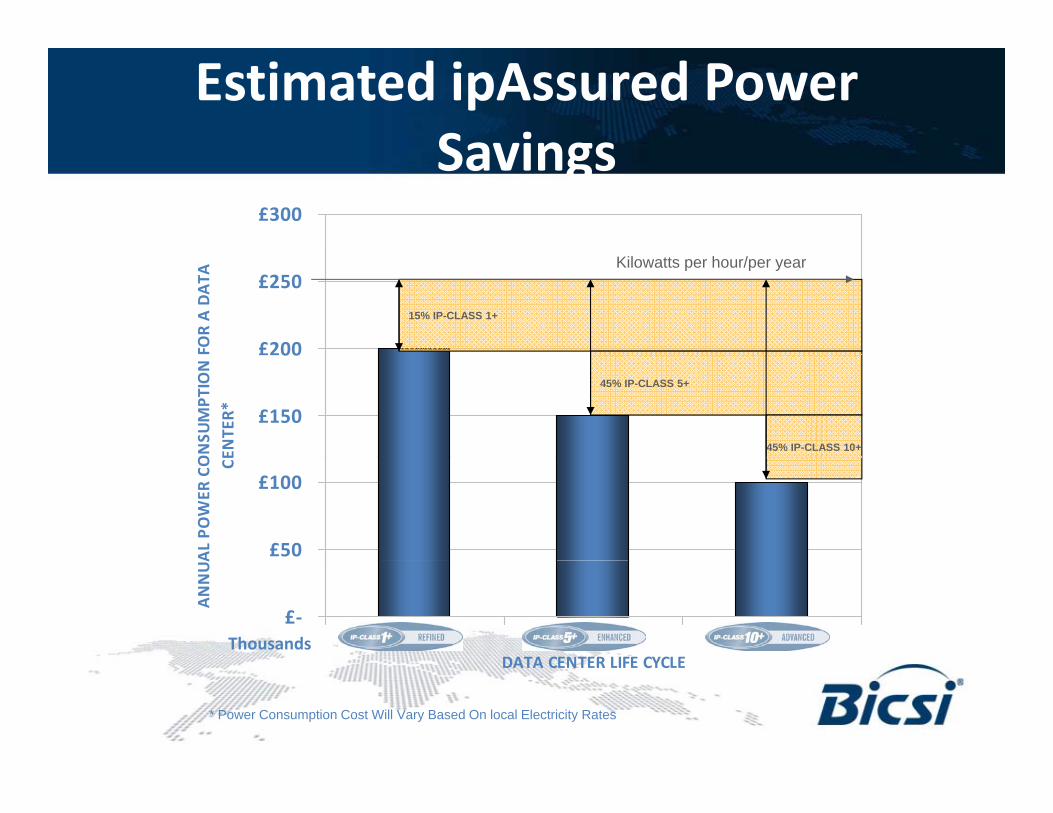
Estimated ipAssured Power SavingsSavings
£300
£200
£250
FOR A DATA
15% IP-CLASS 1+
Kilowatts per hour/per year
£150
00
ONSU
MPT
ION
ENTER*
45% IP-CLASS 5+
45% IP-CLASS 10+
£50
£100
AL PO
WER
CO C
£‐
DATA CENTER LIFE CYCLE
ANNUA
ThousandsDATA CENTER LIFE CYCLE
* Power Consumption Cost Will Vary Based On local Electricity Rates
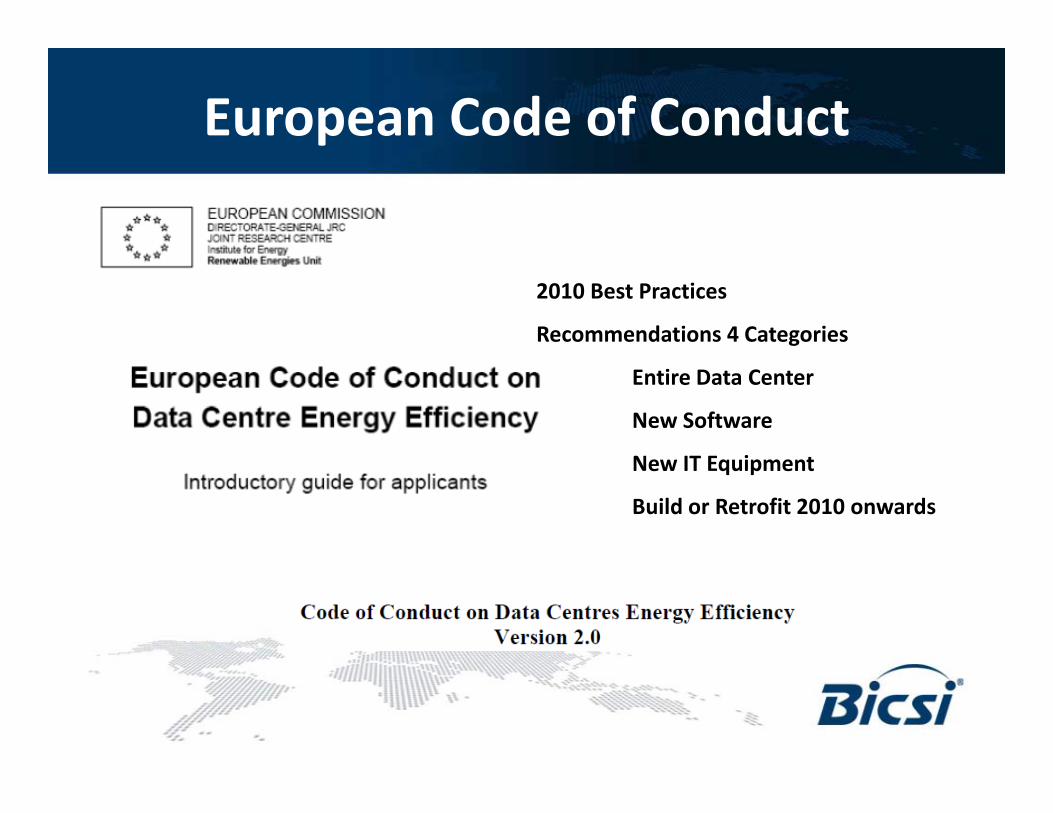
European Code of Conduct
2010 Best Practices
Recommendations 4 Categories
Entire Data Center
New Software
N IT E i tNew IT Equipment
Build or Retrofit 2010 onwards
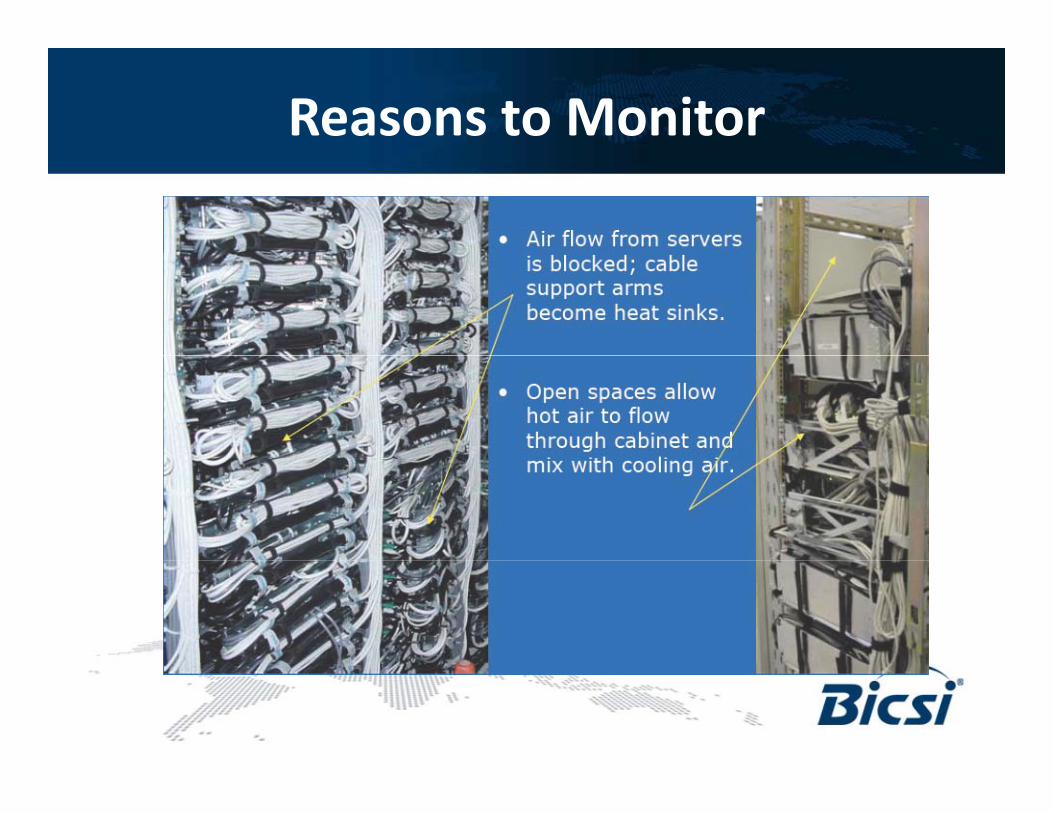
Reasons to Monitor

The Data Centre Environment• Amps
• Volts
• KW/h ‐ KVA
• Temperature
• Humidity
• Smoke
• Water
• CCTV
• Door contacts
• Door locks
• Dry contacts
• UPS
• HVAC
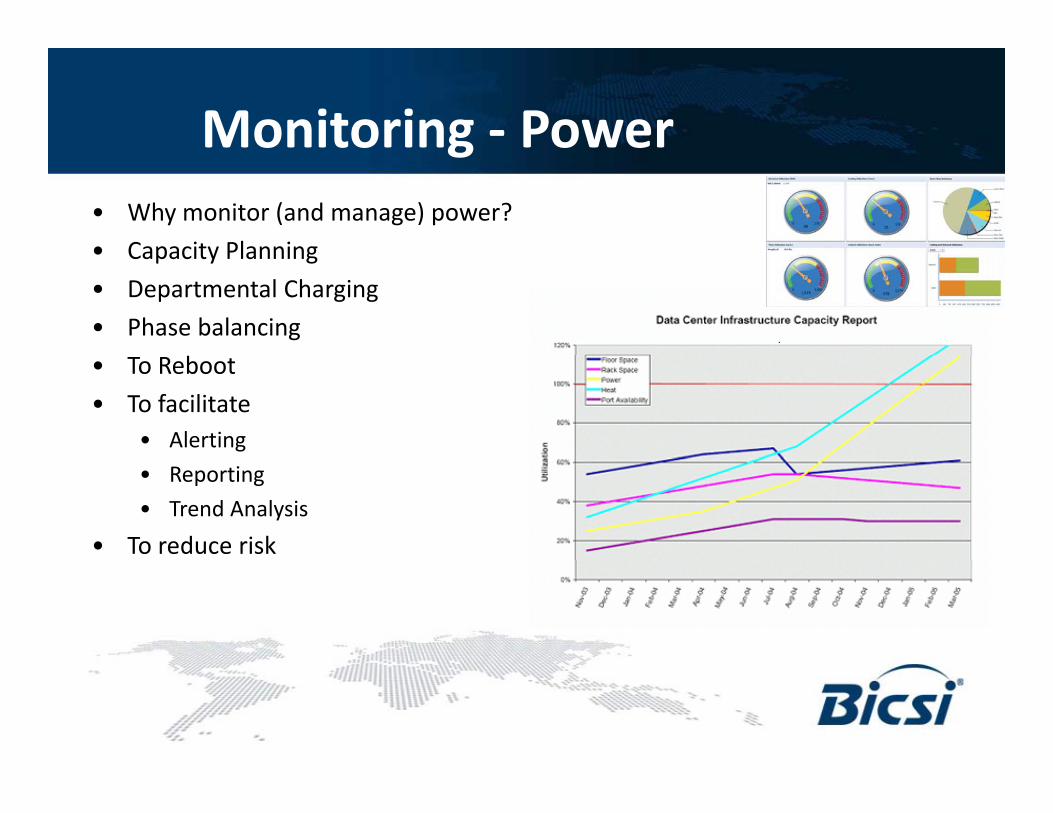
Monitoring ‐ Powerg• Why monitor (and manage) power?
• Capacity Planning• Capacity Planning
• Departmental Charging
• Phase balancing
• To Reboot
• To facilitate• Alerting
• Reporting
• Trend Analysis
• To reduce risk
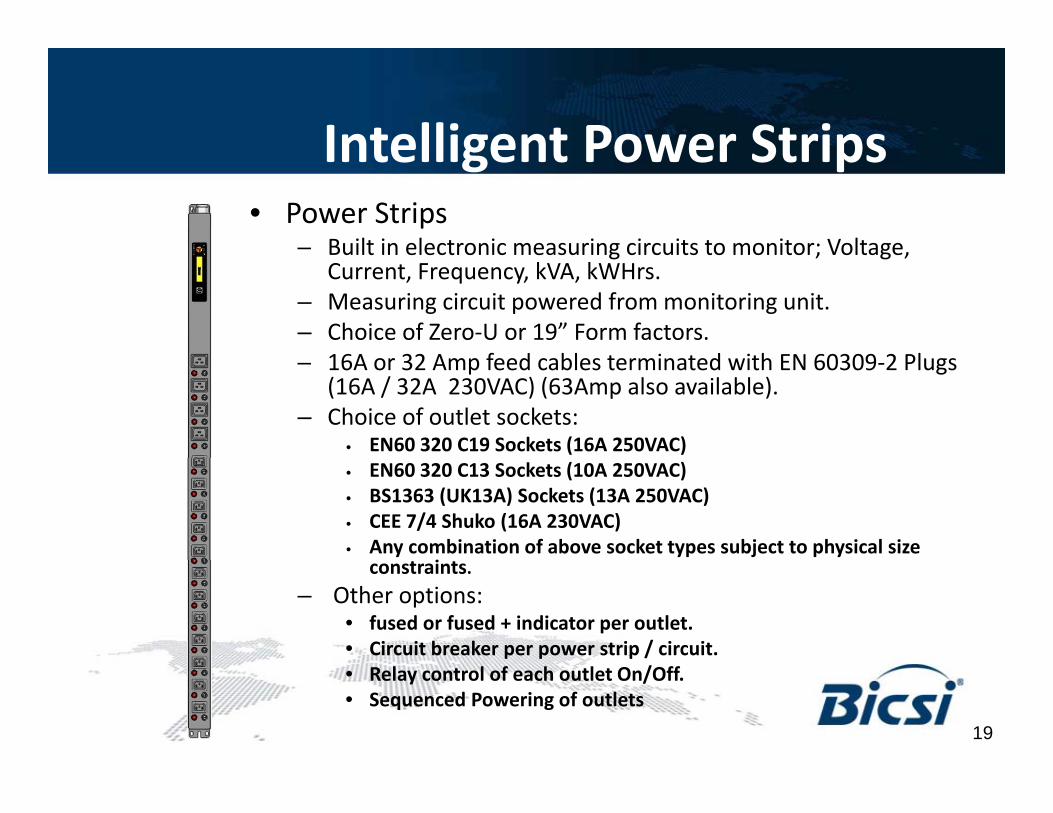
Intelligent Power StripsIntelligent Power Strips• Power Strips
– Built in electronic measuring circuits to monitor; Voltage,Built in electronic measuring circuits to monitor; Voltage, Current, Frequency, kVA, kWHrs.
– Measuring circuit powered from monitoring unit.– Choice of Zero‐U or 19” Form factors.
16A 32 A f d bl t i t d ith EN 60309 2 Pl– 16A or 32 Amp feed cables terminated with EN 60309‐2 Plugs (16A / 32A 230VAC) (63Amp also available).
– Choice of outlet sockets:• EN60 320 C19 Sockets (16A 250VAC)• EN60 320 C13 Sockets (10A 250VAC)• BS1363 (UK13A) Sockets (13A 250VAC)• CEE 7/4 Shuko (16A 230VAC)• Any combination of above socket types subject to physical size
iconstraints.– Other options:
• fused or fused + indicator per outlet.• Circuit breaker per power strip / circuit.
19
• Relay control of each outlet On/Off.• Sequenced Powering of outlets
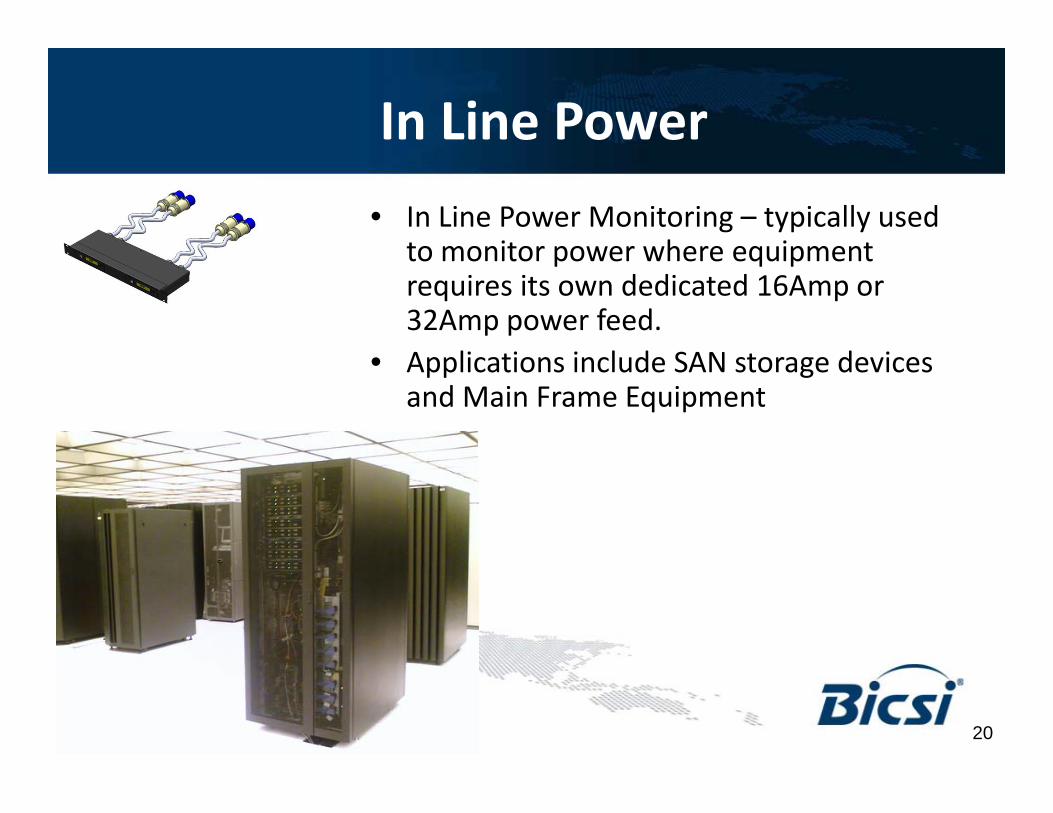
In Line Power
• In Line Power Monitoring – typically used to monitor power where equipmentto monitor power where equipment requires its own dedicated 16Amp or 32Amp power feed.A li ti i l d SAN t d i• Applications include SAN storage devices and Main Frame Equipment
20
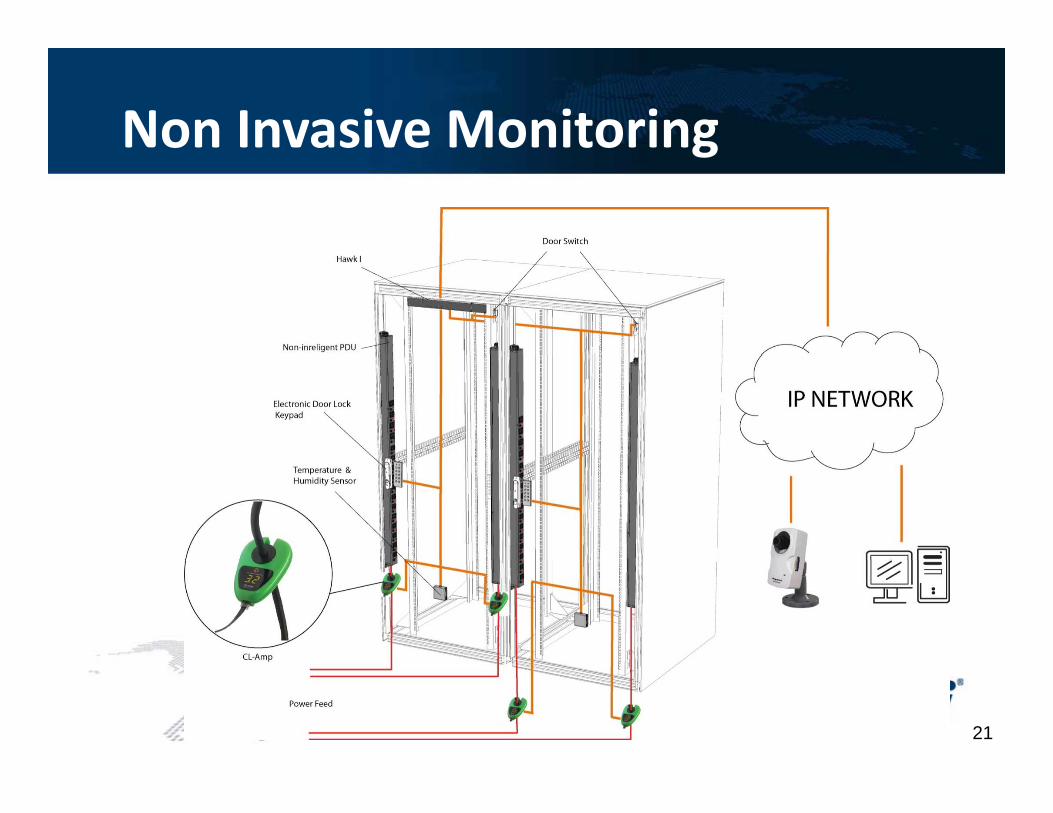
Non Invasive Monitoringg
21
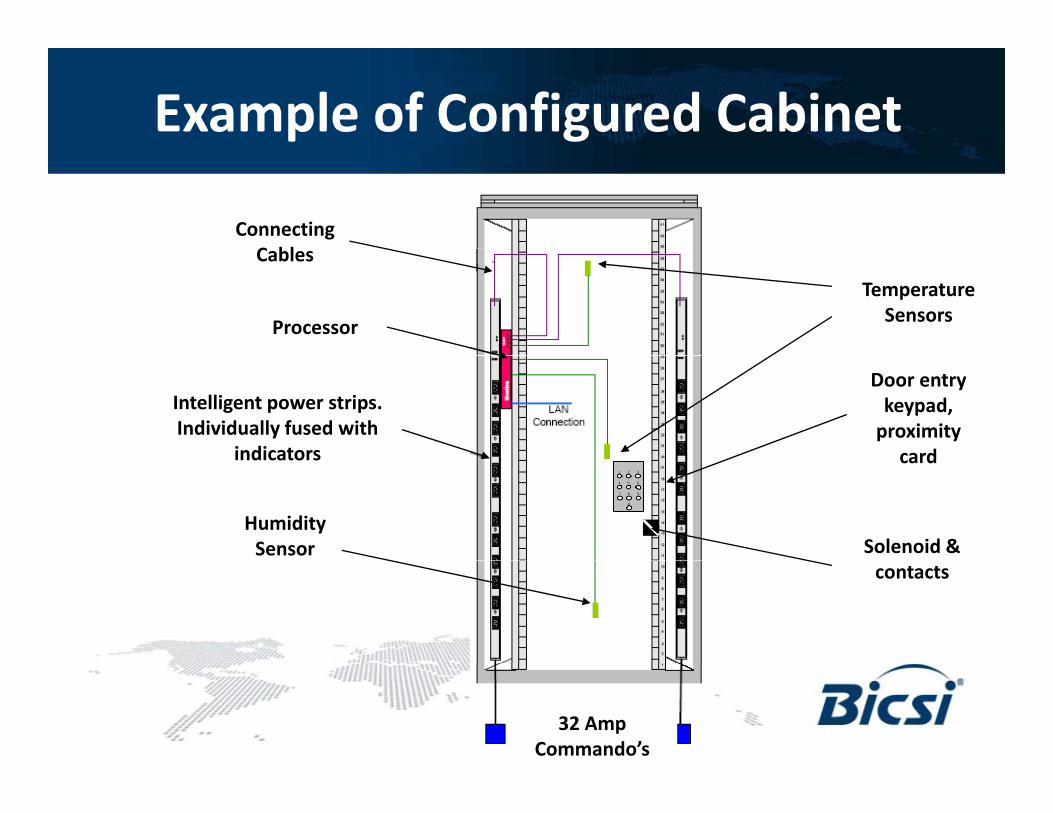
Example of Configured Cabinet
Connecting Cables
Processor
Cables
Temperature Sensors
Intelligent power strips. Individually fused with
indicators
Door entry keypad, proximity
cardindicators
Humidity Sensor
card1 2 3
4 5 6
7 8 9
0
Solenoid & contacts
32 Amp Commando’s
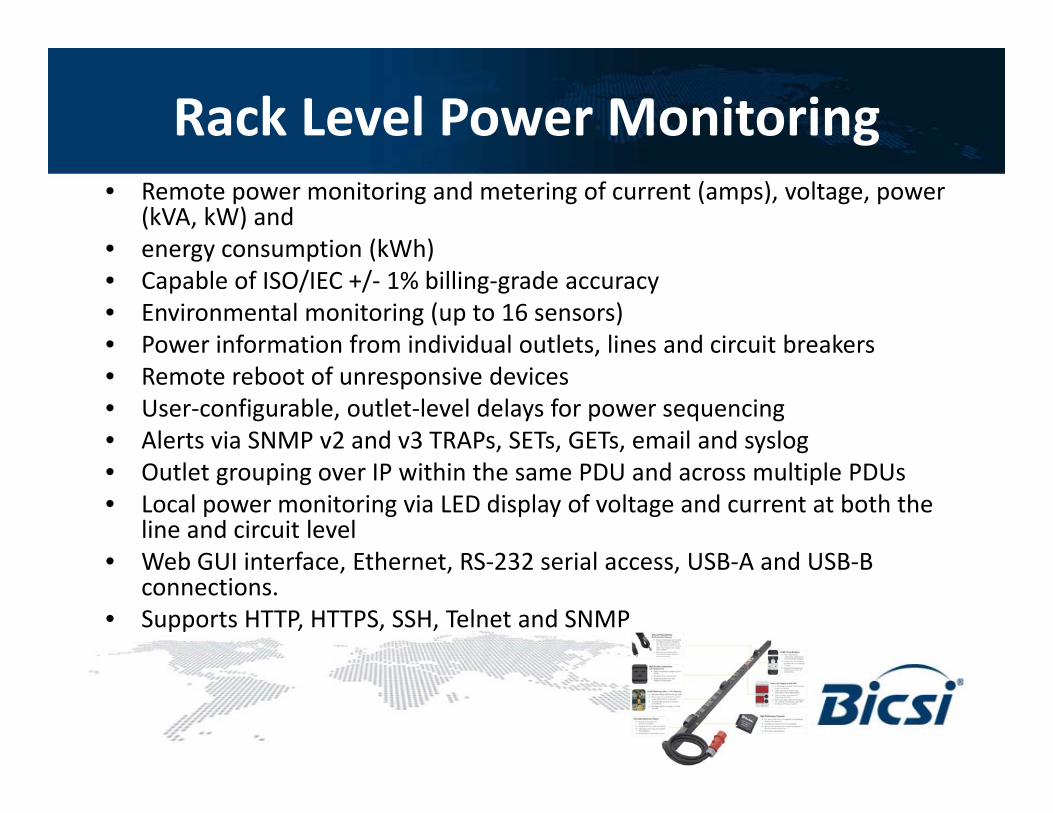
Rack Level Power Monitoring• Remote power monitoring and metering of current (amps), voltage, power
(kVA, kW) and• energy consumption (kWh)energy consumption (kWh)• Capable of ISO/IEC +/‐ 1% billing‐grade accuracy• Environmental monitoring (up to 16 sensors)• Power information from individual outlets, lines and circuit breakers,• Remote reboot of unresponsive devices• User‐configurable, outlet‐level delays for power sequencing• Alerts via SNMP v2 and v3 TRAPs, SETs, GETs, email and syslog• Outlet grouping over IP within the same PDU and across multiple PDUs• Local power monitoring via LED display of voltage and current at both the
line and circuit level• Web GUI interface Ethernet RS 232 serial access USB A and USB B• Web GUI interface, Ethernet, RS‐232 serial access, USB‐A and USB‐B
connections.• Supports HTTP, HTTPS, SSH, Telnet and SNMP
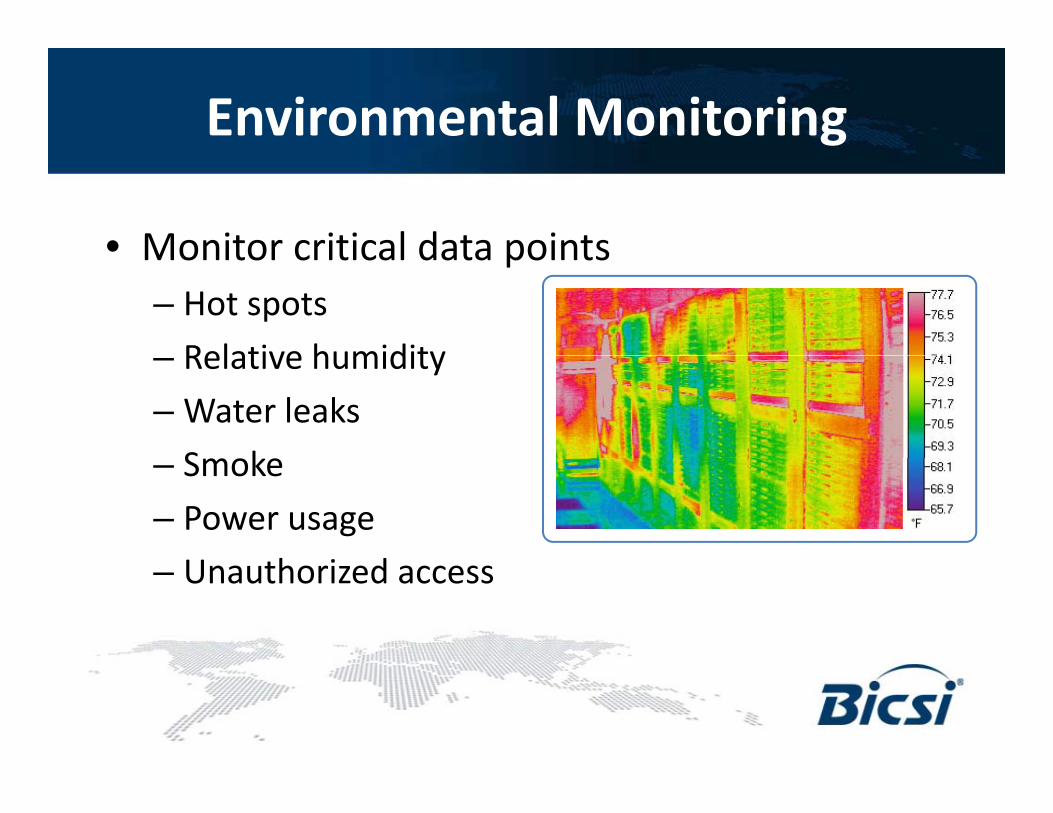
Environmental Monitoring
• Monitor critical data pointsMonitor critical data points– Hot spots
Relative humidity– Relative humidity
– Water leaks
S k– Smoke
– Power usage
U h i d– Unauthorized access
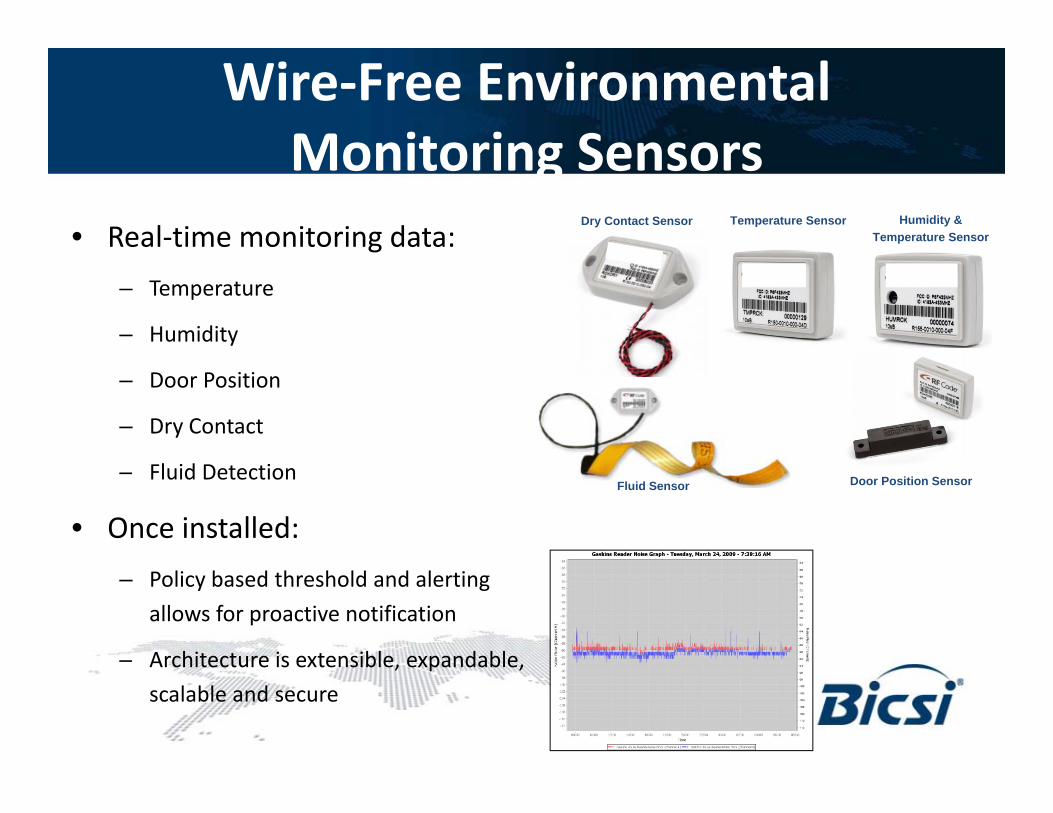
Wire‐Free Environmental Monitoring SensorsMonitoring Sensors
• Real‐time monitoring data:Dry Contact Sensor Temperature Sensor Humidity &
Temperature Sensor
– Temperature
– Humidity
– Door Position
– Dry Contact
– Fluid Detection
• Once installed:
Fluid Sensor Door Position Sensor
– Policy based threshold and alerting
allows for proactive notification
– Architecture is extensible expandableArchitecture is extensible, expandable,
scalable and secure
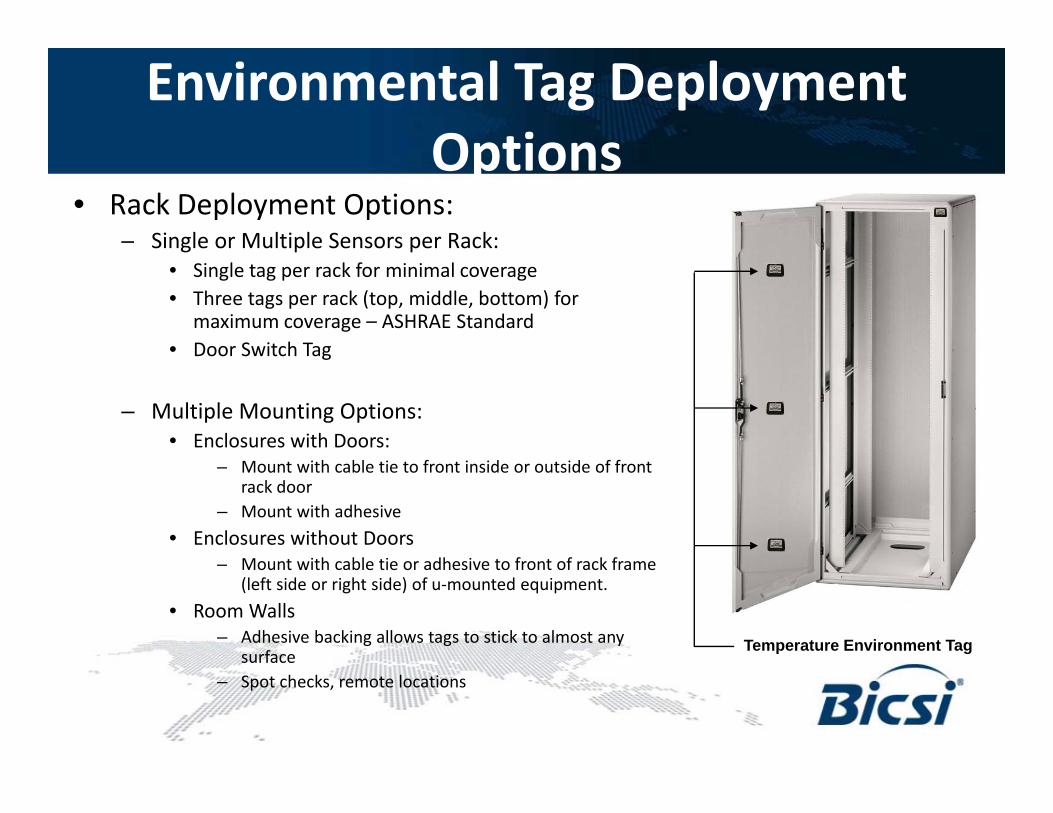
Environmental Tag Deployment OptionsOptions
• Rack Deployment Options:– Single or Multiple Sensors per Rack:
• Single tag per rack for minimal coverage• Three tags per rack (top, middle, bottom) for
maximum coverage – ASHRAE Standard• Door Switch TagDoor Switch Tag
– Multiple Mounting Options:• Enclosures with Doors:
– Mount with cable tie to front inside or outside of front rack door
– Mount with adhesive
• Enclosures without DoorsM t ith bl ti dh i t f t f k f– Mount with cable tie or adhesive to front of rack frame (left side or right side) of u‐mounted equipment.
• Room Walls– Adhesive backing allows tags to stick to almost any
surfaceTemperature Environment Tag
– Spot checks, remote locations
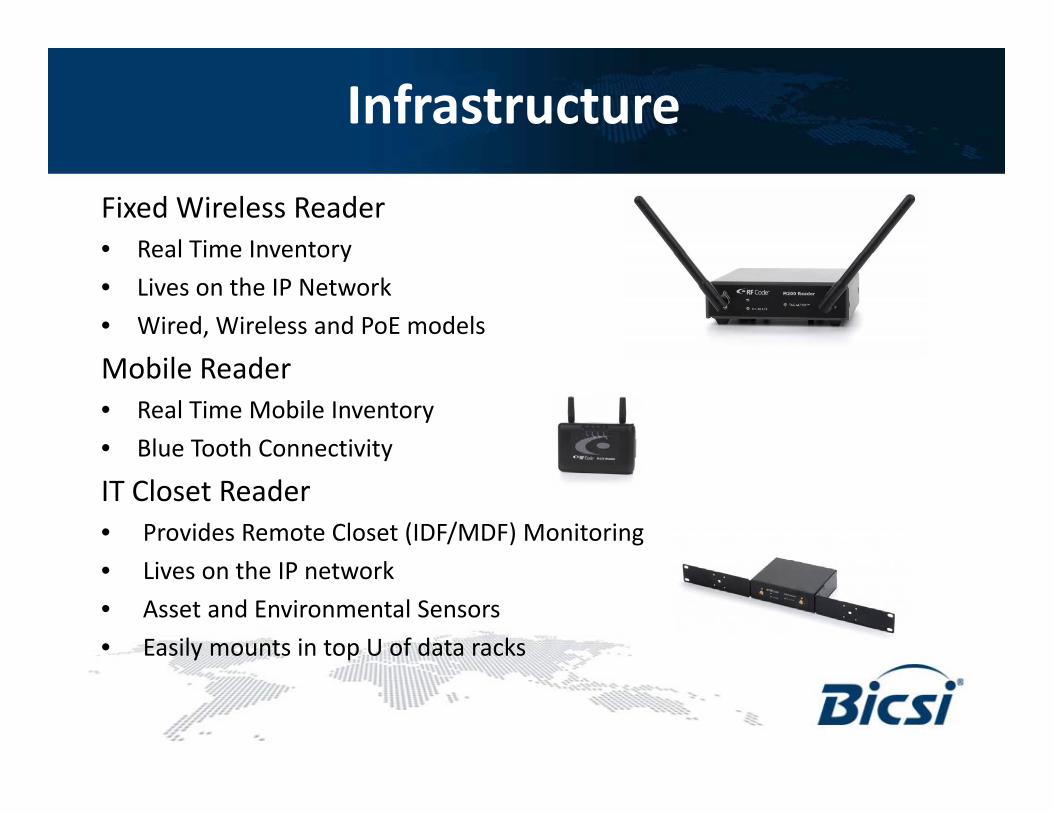
Infrastructure
Fixed Wireless Reader• Real Time InventoryReal Time Inventory
• Lives on the IP Network
• Wired, Wireless and PoE models
Mobile Reader• Real Time Mobile Inventory
• Blue Tooth Connectivityy
IT Closet Reader• Provides Remote Closet (IDF/MDF) Monitoring
• Lives on the IP network
• Asset and Environmental Sensors
• Easily mounts in top U of data racks
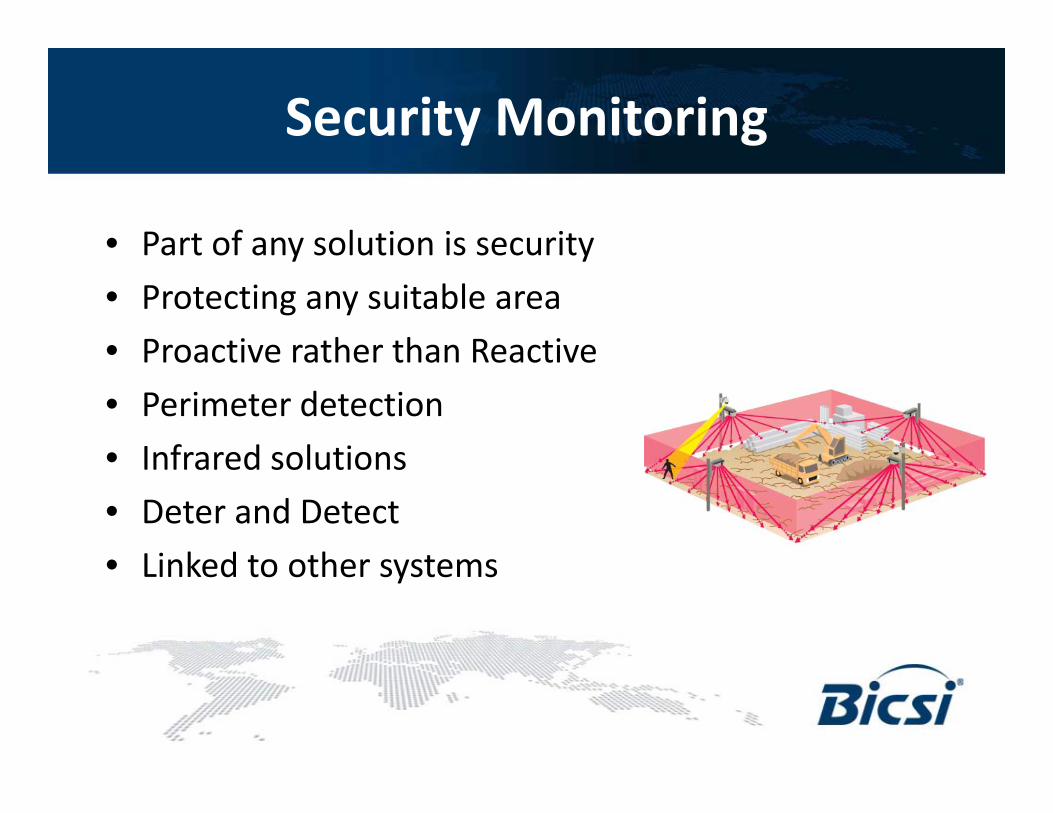
Security Monitoring
• Part of any solution is securityPart of any solution is security
• Protecting any suitable area
• Proactive rather than ReactiveProactive rather than Reactive
• Perimeter detection
• Infrared solutions• Infrared solutions
• Deter and Detect
• Linked to other systems• Linked to other systems
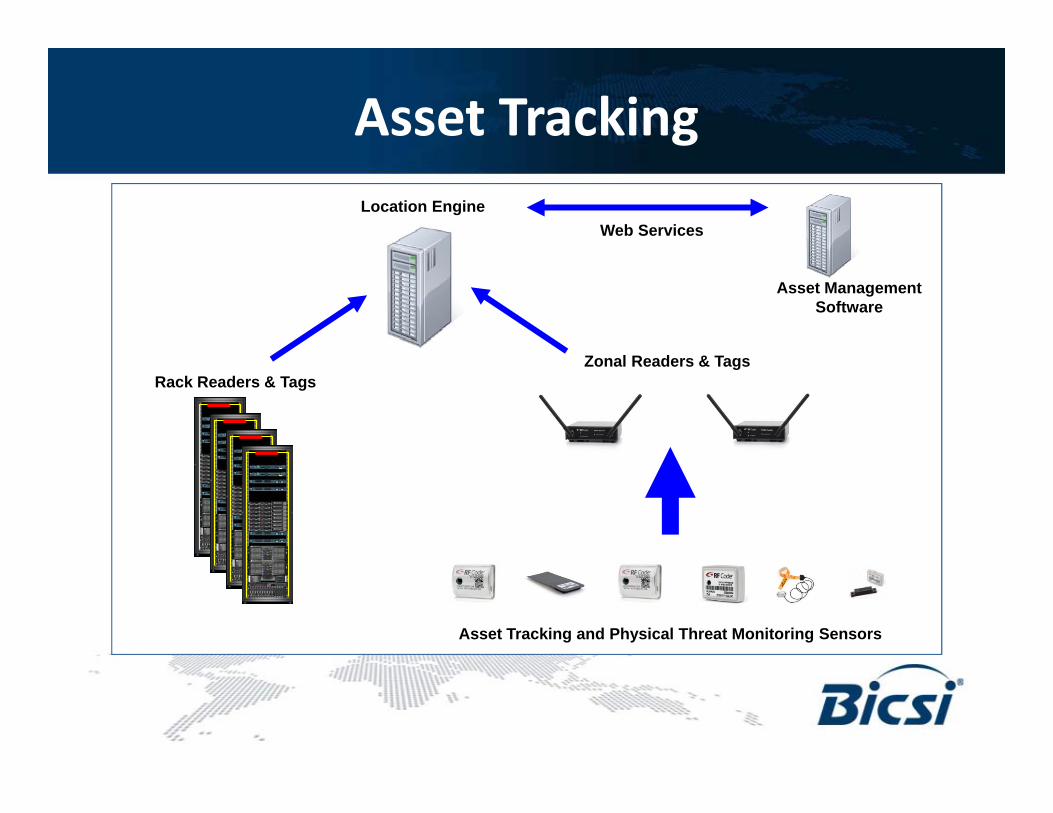
Asset TrackingLocation Engine
Web Services
Asset Management Software
Z l R d & TRack Readers & Tags
Zonal Readers & Tags
Asset Tracking and Physical Threat Monitoring Sensors
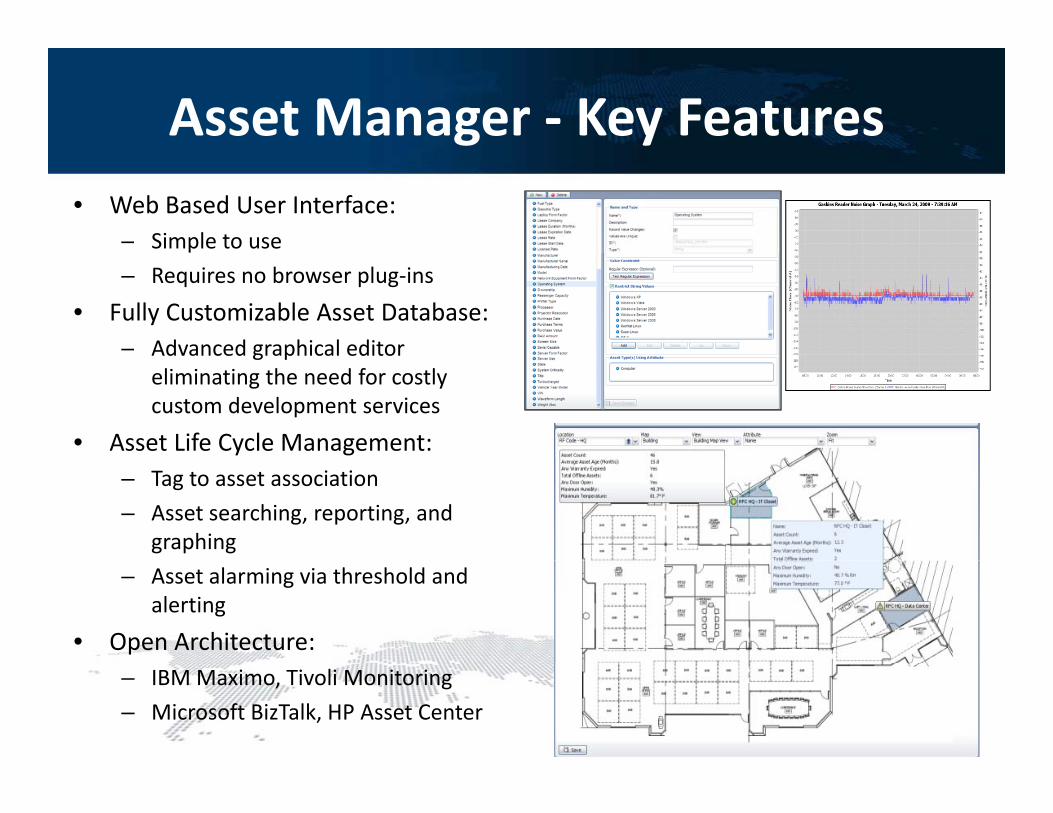
Asset Manager ‐ Key Features• Web Based User Interface:
– Simple to use
– Requires no browser plug‐ins
• Fully Customizable Asset Database:– Advanced graphical editorAdvanced graphical editor
eliminating the need for costly custom development services
• Asset Life Cycle Management:– Tag to asset association
– Asset searching, reporting, and graphing
– Asset alarming via threshold and alerting
• Open Architecture:– IBM Maximo, Tivoli Monitoring
– Microsoft BizTalk, HP Asset Center
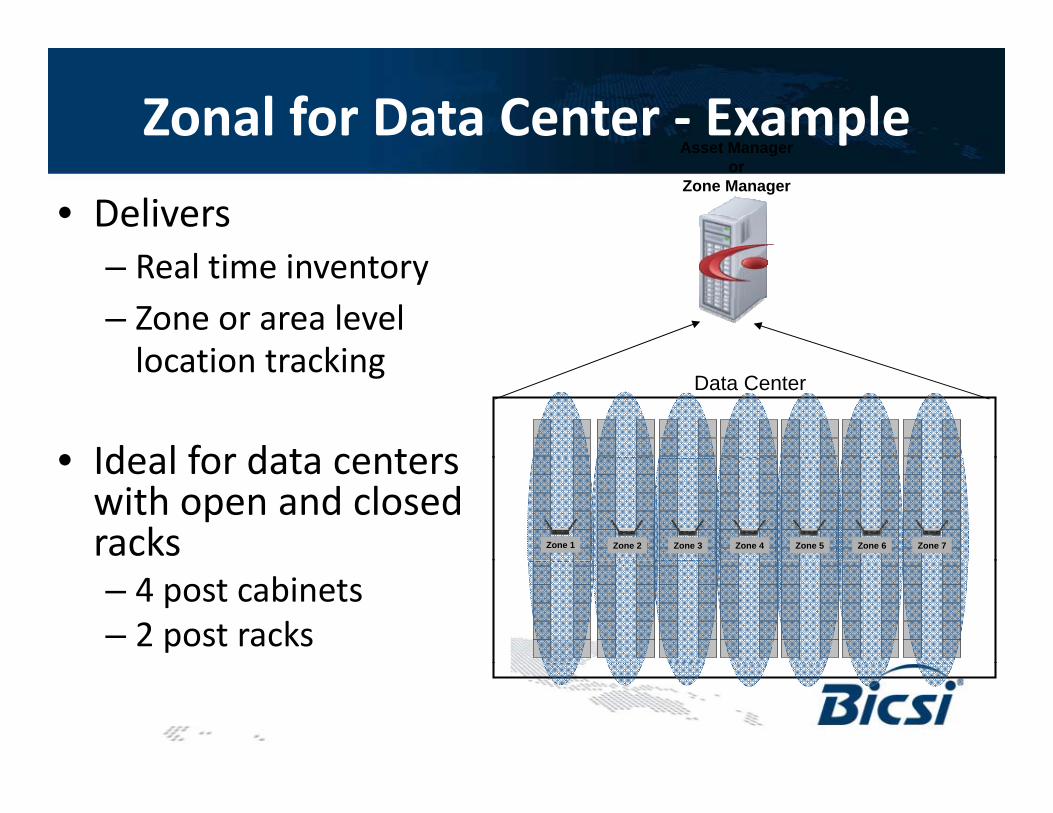
Zonal for Data Center ‐ ExampleAsset Manager
• Deliversl
Asset Manageror
Zone Manager
– Real time inventory– Zone or area level location trackinglocation tracking
• Ideal for data centers
Data Center
• Ideal for data centers with open and closed racks Zone 1 Zone 2 Zone 3 Zone 4 Zone 5 Zone 6 Zone 7
– 4 post cabinets– 2 post racks
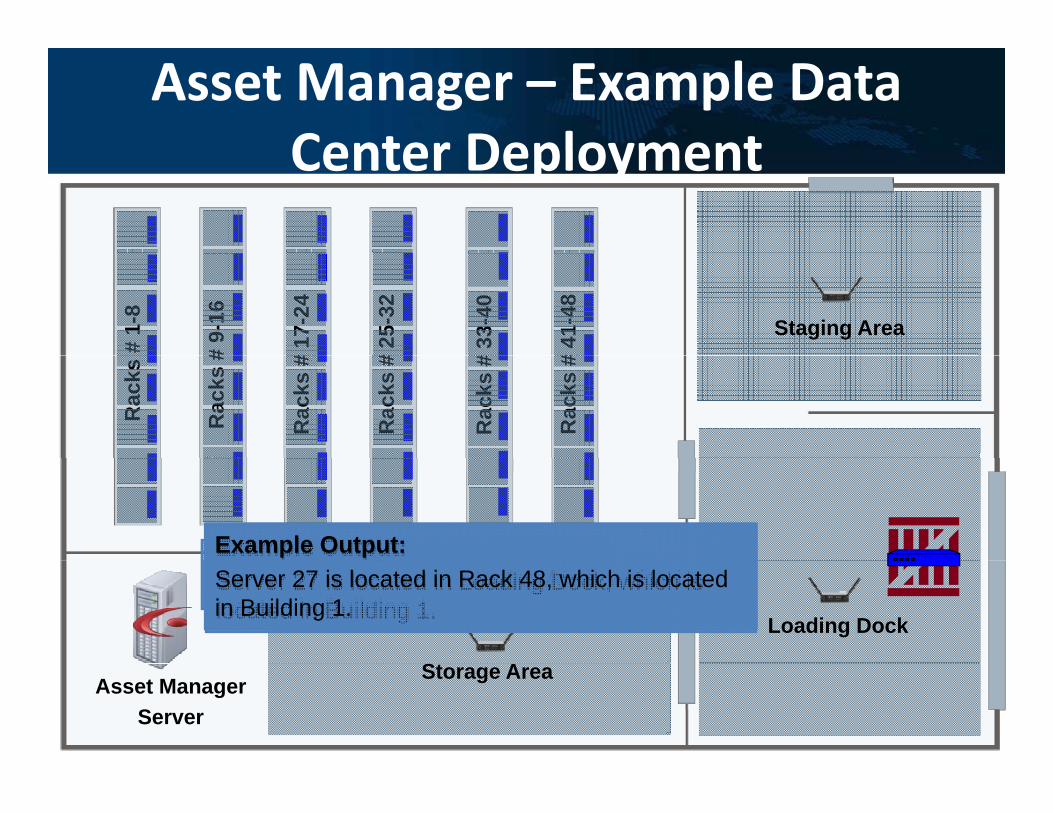
Asset Manager – Example Data Center DeploymentCenter Deployment
Staging Area
# 1-
8
# 9-
16
# 17
-24
# 25
-32
# 33
-40
# 41
-48
Rac
ks
Rac
ks #
Rac
ks #
Rac
ks #
Rac
ks #
Rac
ks #
• Connected to each reader in each zoneExample Output:Example Output:Example Output:Example Output:
Loading Dock
• Connected to each reader in each zone• Determines precise zone level locationServer 27 is located in Storage Area, which is located in Building 1.Server 27 is located in Staging Area, which is located in Building 1.Server 27 is located in Loading Dock, which is located in Building 1.Server 27 is located in Rack 48, which is located in Building 1.
Asset Manager Server
Storage Area
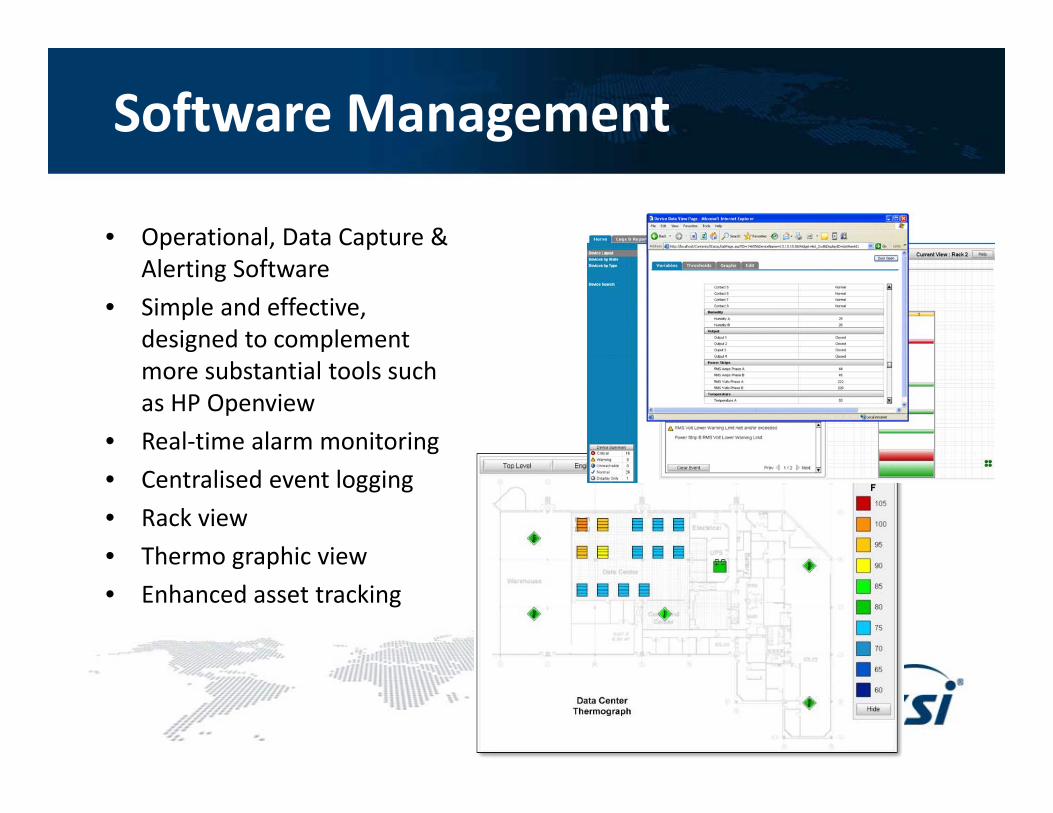
Software Management
• Operational, Data Capture & Alerting Software
• Simple and effective, designed to complement more substantial tools such as HP Openview
• Real‐time alarm monitoring
• Centralised event logging
• Rack view
• Thermo graphic viewThermo graphic view
• Enhanced asset tracking
Monitoring Recommendations
• Locate sensors in appropriate locationsLocate sensors in appropriate locations (ASHRAE & The Uptime Institute)
• Integrated battery backup• Integrated battery backup
• Alert notification capability that delivers l i l diacross multiple media
– E‐mail
– Pager
– Voice message on phone line
– SNMP traps
Management and Monitoring Solutions SummarySolutions Summary
• The need to effectively manage and monitor theThe need to effectively manage and monitor the network from Layer 1 to Layer 7 will continue to increase– Regulatory Compliance
– Additional Security
– Maintenance
– Asset management
O i ti l ti d d d i t• Organizational uptime and redundancy requirements will dictate the level of management and monitoring requiredrequired
Summary
• Data Center owners need more information– Temperature and Asset management– Power consumption per rack or outlet
• Why?– Control the environment within the Data CenterReduce power consumption through virtualisation– Reduce power consumption through virtualisation
– Improve the Power Usage Efficiency (PUE)
• Sources of Information– The Green Grid– Code of Conduct on Data Center Efficiency