public safety program area summary - fairfax county · public safety program area summary overview...
TRANSCRIPT

Public Safety Program Area Summary
Overview Residents of Fairfax County benefit from a high level of public
safety that enhances the quality of life and makes the County a
desirable place in which to live and work. The agencies that
compose this program area include: the Police Department, Fire
and Rescue Department, Office of the Sheriff, Juvenile and
Domestic Relations District Court, Office of Emergency
Management, Department of Cable and Consumer Services,
Land Development Services, Department of Code Compliance,
and Department of Animal Sheltering. Public safety is
enhanced by the active and timely response of the agencies in
this area, as well as, their development of a strong capacity to
respond using agency assets, volunteers, and in collaboration
with other local and regional responders. In addition, though
not part of the Public Safety Program Area, the positions in
Fund 40090, E‐911, serve an integral role in the public safety system as they provide and maintain highly
professional and responsive 9‐1‐1 emergency and non‐emergency communication services.
In large part due to the Police Department’s performance, the County’s crime rate is among the lowest in
the country for urban areas. One main reason for this is the establishment of focused and collaborative
partnerships between the police and the community. The department is focused on, and committed to,
aligning available resources to maintain operational capacity in performance of the core mission, which is
to protect people and property. The most basic service provided by the department is to respond to calls
for service. A priority is placed on assuring that patrol areas have adequate coverage to manage the number
of calls for service at all times. In addition, the department maintains a number of highly‐specialized units,
such as SWAT, Motors, Helicopter, K9, and Explosive Ordinance Disposal (EOD), which are critical to
respond quickly and mitigate serious threats to public safety.
Likewise, the Fire and Rescue Department (FRD) is dedicated to ensuring a safe and secure environment
for County residents. FRD currently operates 38 fire stations, which are staffed full time by County
personnel with supplemental services provided by volunteers. The department operates from an “all‐
hazards” platform and serves Fairfax County and its residents by suppressing fires; providing advanced
life support; pre‐hospital emergency medical care; rescue operations (i.e. searching for and rescuing
persons who become trapped in fires, and extrication from vehicle accidents); and special operations,
including the release or spill of hazardous materials, technical rescue (i.e. swift water rescue, building or
trench collapse, high angle or rope rescue), marine operations (i.e. water rescue, boat fires, fuel spills), and
performing emergency planning. FRD has one of the few urban search and rescue teams in the country
that partner with the U.S. Federal Emergency Management Agency (FEMA) and the U.S. State Department
to provide emergency response support in national and international disasters. The County is fully
reimbursed for such activations and its residents benefit from a highly trained and experienced team whose
capital equipment needs are supplemented by the federal government.
The Office of the Sheriff is responsible for managing the Fairfax County Adult Detention Center (ADC) and
Pre‐Release Center, providing security in all courthouses and in the judicial complex, and serving civil
process and executions. For two decades, the ADC has earned accreditation by both the American
Correctional Association (ACA) and the National Commission on Correctional Health Care. Both
accreditations play a vital role in protecting the County’s assets by minimizing potential lawsuits, as well
as ensuring accountability to the public. The ACA accreditation marks the longest‐running certification
for adult jails in the United States.
FY 2018 Fairfax County Advertised Budget Plan (Vol. 1) - 169

Public Safety Program Area Summary The Fairfax County Juvenile and Domestic Relations District Court (JDRC) is responsible for adjudicating
juvenile matters, offenses committed by adults against juveniles, and family matters except divorce. The
Court offers comprehensive probation and residential services for delinquent youth under the legal age of
18 who live in Fairfax County, the City of Fairfax and the towns of Herndon, Vienna and Clifton. In
addition, the Court provides services to adults in these jurisdictions who are experiencing domestic and/or
familial difficulties that are amenable to unofficial arbitration, counseling or legal intervention. The Court
also provides probation services required in addressing adult criminal complaints for offenses committed
against juveniles unrelated to them.
The Office of Emergency Management (OEM) provides emergency management services with major areas
of focus including: emergency management planning and policy; the countywide emergency training and
exercise program; public preparedness and education; and enhancement of response and recovery
capabilities. OEM is committed to preparing for, responding to, recovering from, and mitigating new and
challenging threats, particularly from identified hazards which could have an adverse impact to Fairfax
County and the surrounding areas. OEM coordinates the emergency management activities of all Fairfax
County agencies, as well as the Metropolitan Washington Council of Governments, the Northern Virginia
Regional Commission, private organizations, and other local, state and federal agencies. OEM provides
vision, direction and subject matter expertise in the field of emergency management in order to heighten
the County’s state of emergency readiness.
Land Development Services (LDS) provides regulatory services to protect the health, safety, welfare, and
the environment for those who live, work, and visit Fairfax County. This is accomplished through
effectively regulating land development and building construction. LDS enforces environmental
protection standards set forth in applicable codes for land development and building construction such as
the Virginia Uniform Statewide Building Code, the International Code Council’s family of construction
codes, state laws and regulations, Fairfax County ordinances, and the Public Facilities Manual. LDS is
composed of three cost centers: Building Code Services (BCS), included in the County’s Public Safety
Program Area, Site Development Services (SDS) and Business Support Services, included in the County’s
Community Development Program Area. The Public Safety Program Area is responsible for the plan
review, permitting and inspection of new and existing structures.
The Department of Code Compliance (DCC) was created as part of FY 2011 Adopted Budget Plan by
combining the functions of the Code Enforcement Strike Team, the majority of the Zoning Enforcement
function in the Department of Planning and Zoning (DPZ), and a small portion of the Environmental
Health Division of the Health Department. DCC serves as an adaptable, accountable, multi‐code
enforcement organization within a unified leadership/management structure that responds effectively and
efficiently toward building and sustaining neighborhoods and communities. One of the main drivers of
creating a single code compliance agency was to allow the County to take coordinated action on new or
emerging code enforcement problems instead of having multiple agencies enforce the various codes,
making it difficult to coordinate a countywide response. DCC is able to enforce multiple codes, including
Zoning, Property Maintenance, Building, Fire and Health and more effectively resolve complaints. The Department of Animal Sheltering was established as part of the FY 2016 Carryover Review following an
independent organizational review of the Police Department’s Animal Services Division as directed by the
Board of Supervisors during the April 28, 2015 meeting. The department serves as both an animal shelter
and an animal resource center for the citizens of Fairfax County. The shelter has robust volunteer, foster
and community outreach programs and a strong social media presence. The vision for the animal shelter
is to ensure that no adoptable, treatable or rehabilitatable companion animal is euthanized for lack of space
or lack of other resources.
FY 2018 Fairfax County Advertised Budget Plan (Vol. 1) - 170

Public Safety Program Area Summary
Strategic Direction As part of the countywide focus on developing strategic plans,
each of the agencies in this program area developed mission,
vision and values statements; performed environmental scans;
and defined strategies for achieving their missions. These
strategic plans are linked to the overall County Core Purpose and
Vision Elements. Common themes in the agencies in the Public
Safety program area include:
Language and cultural diversity
Recruitment and retention of quality staff
Capacity to address growth
Public education and outreach
Leveraging technology
Partnerships and community involvement
Stewardship of resources
In recent years, new kinds of public safety priorities such as regional homeland security efforts, inmate
population growth, increased criminal gang activity, increases in identity theft and other nontraditional
crimes, and the need for new facilities, have required the attention of public safety agencies. Addressing
these types of threats presents a significant challenge to these agencies. Changing demographics further
impact the situation. Population increases result in higher workloads, which the Board of Supervisors seeks
to address through allocating resources to this priority area. However, recent fiscal pressures have made
it necessary for these agencies to continue to find ways to provide high quality services within available
resources.
COUNTY CORE PURPOSE
To protect and enrich the quality of life for the people, neighborhoods, and diverse communities of Fairfax County by:
Maintaining Safe and Caring Communities
Building Livable Spaces
Practicing Environmental Stewardship
Connecting People and Places
Creating a Culture of Engagement
Maintaining Healthy Economies
Exercising Corporate Stewardship
FY 2018 Fairfax County Advertised Budget Plan (Vol. 1) - 171

Public Safety Program Area Summary
Program Area Summary by Category
CategoryFY 2016Actual
FY 2017Adopted
FY 2017Revised
FY 2018Advertised
FUNDINGExpenditures:
Personnel Services $386,933,106 $410,924,271 $407,846,513 $422,046,658
Operating Expenses 65,574,807 63,405,273 75,474,254 66,942,934
Capital Equipment 1,223,962 786,822 1,619,582 116,058
Subtotal $453,731,875 $475,116,366 $484,940,349 $489,105,650
Less:
Recovered Costs ($723,921) ($697,406) ($697,406) ($697,406)
Total Expenditures $453,007,954 $474,418,960 $484,242,943 $488,408,244
Income $106,178,198 $102,171,387 $106,715,320 $107,582,277
NET COST TO THE COUNTY $346,829,756 $372,247,573 $377,527,623 $380,825,967
AUTHORIZED POSITIONS/FULL-TIME EQUIVALENT (FTE)Regular 4215 / 4213 4254 / 4252 4263 / 4261.5 4290 / 4288.5State 43 / 43 43 / 43 43 / 43 43 / 43
Program Area Summary by Agency1
CategoryFY 2016Actual
FY 2017Adopted
FY 2017Revised
FY 2018Advertised
Department of Cable and Consumer Services $648,798 $808,305 $808,531 $831,288Land Development Services 10,581,485 10,353,488 10,480,477 10,585,413Juvenile and Domestic Relations District Court 22,285,861 22,802,735 23,272,135 23,185,328Police Department 182,499,532 189,745,479 191,557,651 192,636,648Office of the Sheriff 42,983,012 47,842,043 49,016,718 49,004,885Fire and Rescue Department 188,123,919 196,655,196 201,183,966 203,361,036Office of Emergency Management 1,734,965 1,872,473 2,455,949 1,853,283Department of Animal Sheltering 0 0 1,128,275 2,478,434Department of Code Compliance 4,150,382 4,339,241 4,339,241 4,471,929Total Expenditures $453,007,954 $474,418,960 $484,242,943 $488,408,244
1 The FY 2017 Revised budget for the Department of Animal Sheltering reflects partial‐year funding as the agency was formally
established in calendar year 2017.
FY 2018 Fairfax County Advertised Budget Plan (Vol. 1) - 172

Public Safety Program Area Summary
Budget Trends For FY 2018, the funding level of $488,408,244 for the Public Safety program area comprises 32.3 percent of
the total General Fund direct expenditures of $1,512,272,694. This total reflects an increase of $13,989,284,
or 2.9 percent, over the FY 2017 Adopted Budget Plan total of $474,418,960. This increase is due to several
factors, including increases associated with position increases noted below, performance‐based and
longevity increases for non‐uniformed merit employees, both effective July 2017, as well as FY 2018 merit
and longevity increases (including the full‐year impact of FY 2017 increases) for uniformed employees
awarded on the employees’ anniversary dates, funding for specific job classes identified in the County’s
benchmark class survey of comparator jurisdictions, and the full‐year impact of the increase in the County’s
living wage (from $13.13 to $14.50 per hour). Other increases include: adjustments associated with a review
of the Police Department’s organizational structure and the Police Department’s and Office of the Sheriff’s
pay plans, and increases in the Fire and Rescue Department (FRD) required to cover the remaining costs
associated with previously approved positions associated with Staffing for Adequate Fire and Emergency
Response (SAFER) grants which expire in FY 2018, as well as a Fourth Circuit Court of Appeals ruling
which states FRD uniformed employees at the rank of Captain I and Captain II do not fall within the
executive or administrative exemptions for the FLSA overtime requirement because management is not
their primary duty. These increases were partially offset by decreases associated with lower price per
gallon estimates for fuel and targeted budget reductions.
The Public Safety Program Area includes 4,290 positions (not including state positions), an increase of
27/27.0 FTE positions over the FY 2017 Revised Budget Plan level. Of this total, 26/26.0 FTE positions are in
the Police Department, including 18/18.0 FTE to create additional relief Sergeant positions to provide a
regular resource to fill operational vacancies, 5/5.0 FTE to continue the process of staffing the South County
Police Station, 2/2.0 FTE due to increased workload associated with the establishment of an Office of
Independent Police Auditor, and 1/1.0 FTE transferred to the Police Department from the Department of
Human Resources to properly align duties as a result of workload requirements. In addition, 1/1.0 FTE in
the Department of Code Compliance is required to support growing workload associated with the Illegal
Signs and Advertising in the Right‐of‐Way Program. It should be noted that an FY 2017 reallocation within
the Public Safety program area of 31/31.0 FTE positions from the Police Department to the Department of
Animal Sheltering occurred based on the establishment of the Department of Animal Sheltering as an
independent agency. Further, the total of 4,290 positions does not include 205/205.0 FTE positions in Fund
40090, E‐911. Though not part of the Public Safety Program Area, the positions in Fund 40090 serve an
integral role in the public safety system as they provide and maintain highly professional and responsive
9‐1‐1 emergency and non‐emergency communication services.
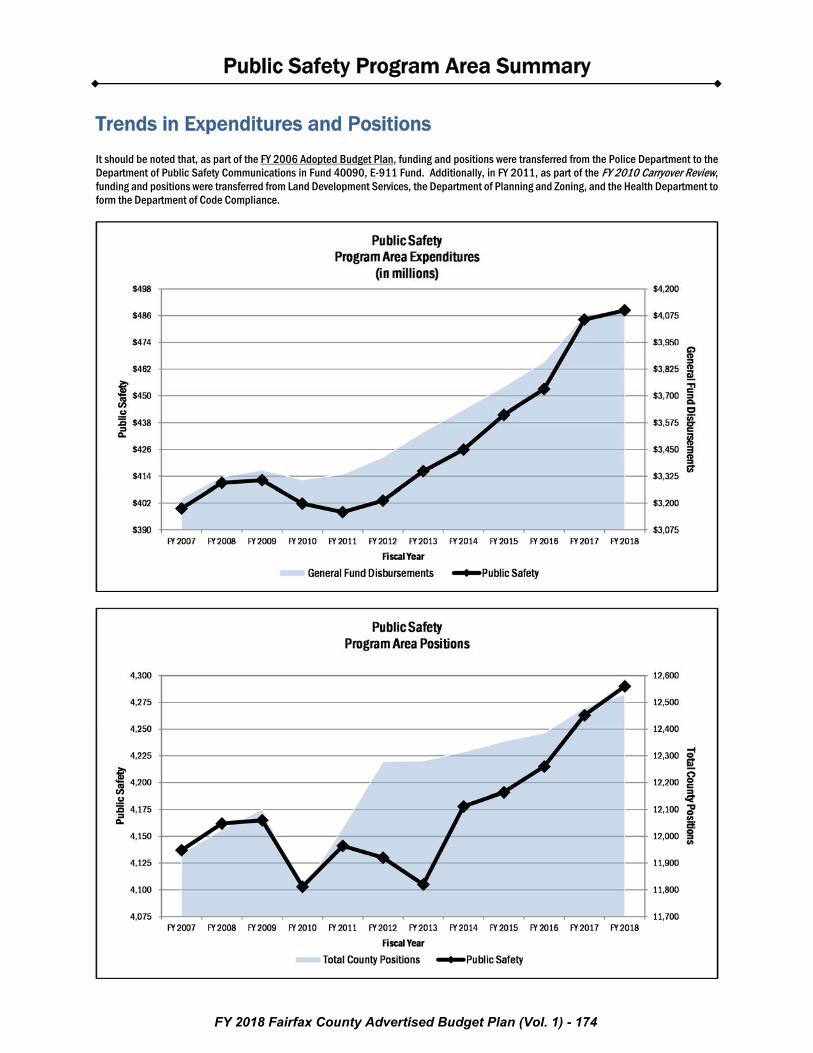
The charts on the following page illustrate funding and position trends for the agencies in this program
area compared to countywide expenditure and position trends.
FY 2018 Fairfax County Advertised Budget Plan (Vol. 1) - 173
Public Safety Program Area Summary
Trends in Expenditures and Positions It should be noted that, as part of the FY 2006 Adopted Budget Plan, funding and positions were transferred from the Police Department to the Department of Public Safety Communications in Fund 40090, E-911 Fund. Additionally, in FY 2011, as part of the FY 2010 Carryover Review, funding and positions were transferred from Land Development Services, the Department of Planning and Zoning, and the Health Department to form the Department of Code Compliance.
FY 2018 Fairfax County Advertised Budget Plan (Vol. 1) - 174

Public Safety Program Area Summary
FY 2018 Expenditures and Positions by Agency
FY 2018 Fairfax County Advertised Budget Plan (Vol. 1) - 175

Public Safety Program Area Summary
Benchmarking In order to obtain a wide range of comparative performance data, Fairfax County has participated in the
International City/County Management Association’s (ICMA) benchmarking effort since 2000. More than
180 cities and counties provided comparable data in a number of service areas for the last reporting cycle.
Not all jurisdictions provide data for every service area, however. Police and Fire/EMS are two of the
benchmarked service areas for which Fairfax County provides data. Participating local governments
(cities, counties and towns) provide data on standard templates provided by ICMA in order to ensure
consistency. ICMA then performs extensive data cleaning to ensure the greatest possible accuracy and
comparability of data. As a result of the time for data collection and ICMA’s rigorous data cleaning
processes, information is always available with a one‐year delay. FY 2015 data represent the latest available
information. The jurisdictions presented in the graphs on the next few pages generally show how Fairfax
County compares to other large jurisdictions (population over 400,000). In cases where other Virginia
localities provided data, they are shown as well.
An important point to note in an effort such as this is that since participation is voluntary, the jurisdictions
that provide data have shown they are committed to becoming/remaining high performance organizations.
Therefore, comparisons made through this program should be considered in the context that the
participants have self‐selected and are inclined to be among the higher performers rather than a random
sample among local governments nationwide. Not all jurisdictions respond to all questions. In some cases,
the question or process is not applicable to a particular locality or data is not available. For those reasons,
the universe of jurisdictions with which Fairfax County is compared is not always the same for each
benchmark. However, whenever a jurisdiction of over 500,000 residents or another Virginia locality
responded to a particular question for which Fairfax County also provided data, those comparisons have
been included. It is also important to note that performance is also affected by a number of variables
including funding levels, weather, the economy, local preferences, cuts in federal and state aid,
unionization and demographic characteristics such as income, age and ethnicity.
As can be seen from the graphs on the following pages, Fairfax County ranks favorably compared to other
large jurisdictions and other Virginia localities with regard to performance in the public safety area.
Compared to other large cities and counties within the Commonwealth of Virginia, as well as the other
Northern Virginia localities, Fairfax County’s cost per capita for public safety expenditures is in the mid‐
range. For the investment that Fairfax County makes, there is a very high return in terms of public safety.
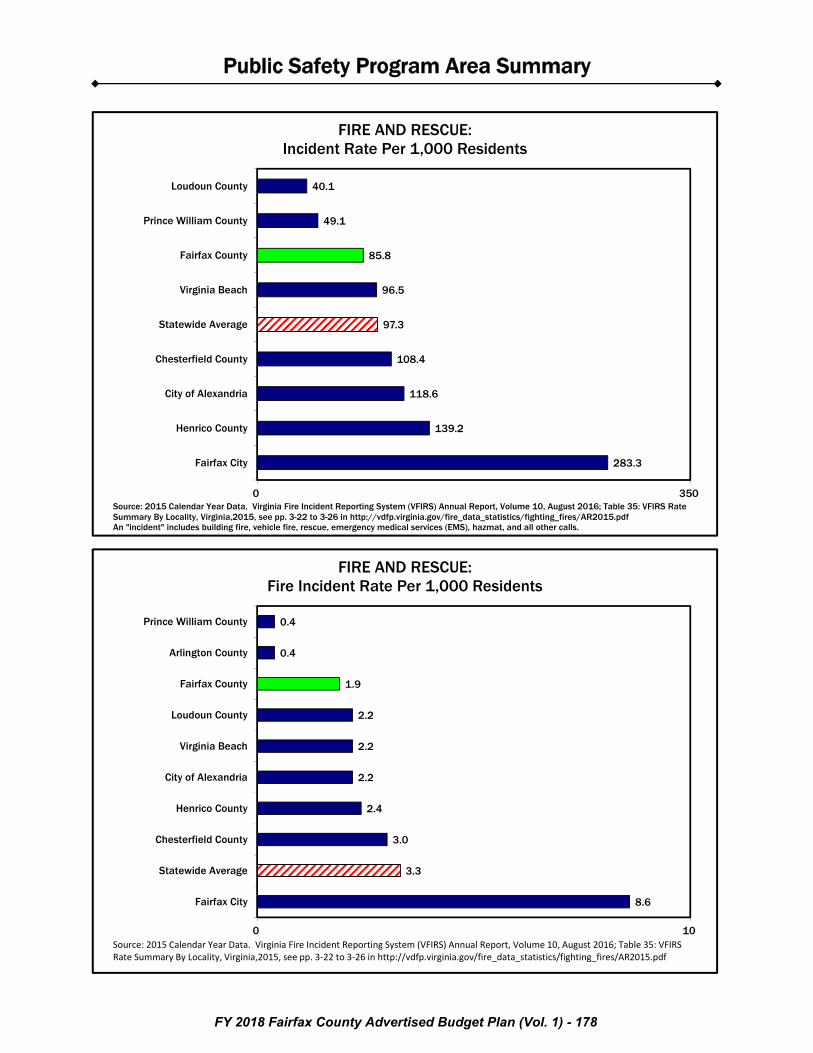
For example, with only 1.9 Total Fire Incidents per 1,000 Population Served (structure and non‐structure
incidents), Fairfax County has one of the lowest rates in comparison to other large and Virginia jurisdictions
responding. This attests to a highly effective fire prevention program that places emphasis on avoidance
rather than the more costly and dangerous requirements associated with extinguishment. With regard to
the crime rate, Fairfax County continues to experience one of the lowest rates of crime per 1,000 population,
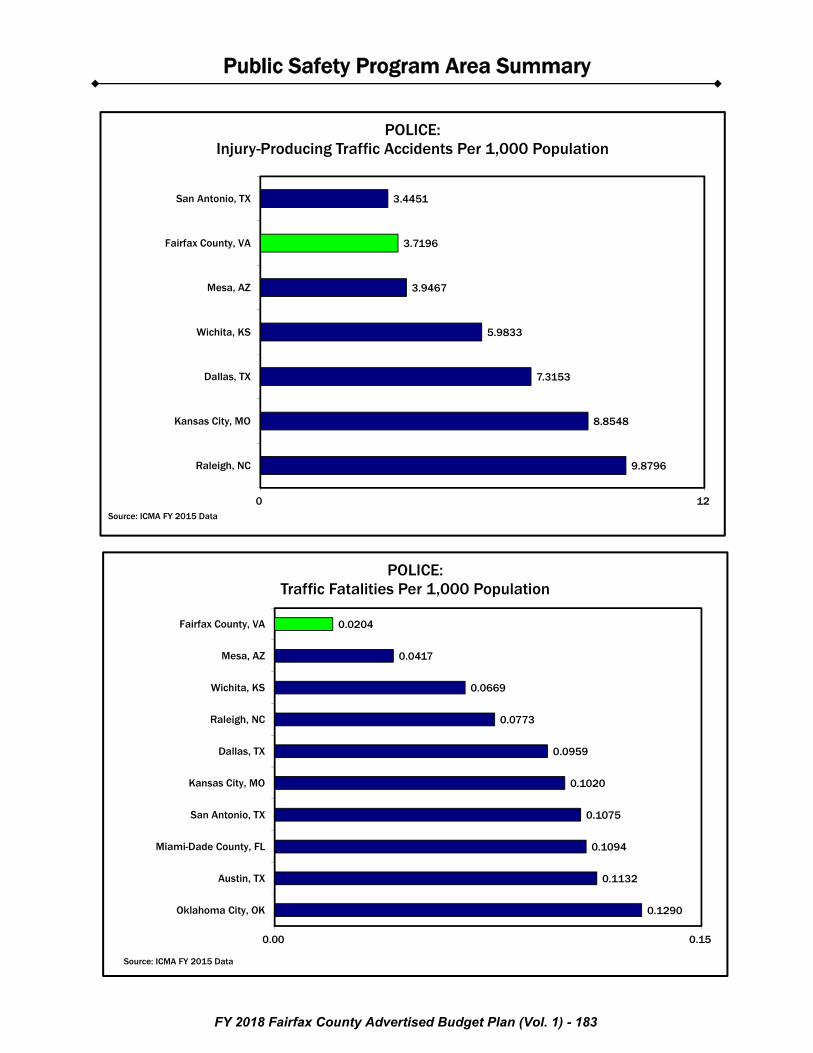
further validating the County’s reputation as a safe place to live and work. The traffic fatalities per 1,000
population was extremely low at 0.0204. A number of other public safety benchmarks are shown on the
following pages.
FY 2018 Fairfax County Advertised Budget Plan (Vol. 1) - 176

Public Safety Program Area Summary
$1,135.17
$1,124.59
$929.60
$868.40
$693.27
$671.65
$617.48
$580.38
$575.15
$547.58
$542.44
$483.70
$458.51
$430.82
$413.06
$0 $1,400
Falls Church
Fairfax City
Arlington County
Alexandria
Newport News
Norfolk
Fairfax County
Prince William County
Chesapeake
Chesterfield County
Henrico County
Loudoun County
Virginia Beach
Stafford County
Spotsylvania County
PUBLIC SAFETY:Public Safety Cost Per Capita
Source: Commonwealth of Virginia Auditor of Public Accounts; FY 2015 Comparative Report of Local Government Revenues and Expenditures,Exhibit C: see http://www.apa.virginia.gov/APA_Reports/LG_ComparativeReports.aspx. Data for the City of Richmond was not available.
$249
$227
$202
$181
$123
$109
$0 $300
Austin, TX
Fairfax County, VA
San Antonio, TX
Dallas, TX
Raleigh, NC
Wichita, KS
FIRE-EMS:Per Capita Fire-EMS Personnel and Operating Costs
Source: ICMA FY 2015 Data
FY 2018 Fairfax County Advertised Budget Plan (Vol. 1) - 177
Public Safety Program Area Summary
8.6
3.3
3.0
2.4
2.2
2.2
2.2
1.9
0.4
0.4
0 10
Fairfax City
Statewide Average
Chesterfield County
Henrico County
City of Alexandria
Virginia Beach
Loudoun County
Fairfax County
Arlington County
Prince William County
FIRE AND RESCUE:Fire Incident Rate Per 1,000 Residents
Source: 2015 Calendar Year Data. Virginia Fire Incident Reporting System (VFIRS) Annual Report, Volume 10, August 2016; Table 35: VFIRS Rate Summary By Locality, Virginia,2015, see pp. 3‐22 to 3‐26 in http://vdfp.virginia.gov/fire_data_statistics/fighting_fires/AR2015.pdf
283.3
139.2
118.6
108.4
97.3
96.5
85.8
49.1
40.1
0 350
Fairfax City
Henrico County
City of Alexandria
Chesterfield County
Statewide Average
Virginia Beach
Fairfax County
Prince William County
Loudoun County
FIRE AND RESCUE:Incident Rate Per 1,000 Residents
Source: 2015 Calendar Year Data. Virginia Fire Incident Reporting System (VFIRS) Annual Report, Volume 10, August 2016; Table 35: VFIRS Rate Summary By Locality, Virginia,2015, see pp. 3-22 to 3-26 in http://vdfp.virginia.gov/fire_data_statistics/fighting_fires/AR2015.pdfAn "incident" includes building fire, vehicle fire, rescue, emergency medical services (EMS), hazmat, and all other calls.
FY 2018 Fairfax County Advertised Budget Plan (Vol. 1) - 178

Public Safety Program Area Summary
$21,783
$11,903
$11,091
$9,052
$8,816
$7,547
$2,176
$637
$313
$0 $25,000
Virginia Beach
Henrico County
Chesterfield County
Fairfax County
Statewide Average
Loudoun County
Arlington County
City of Alexandria
Fairfax City
FIRE AND RESCUE:Average Dollar Loss Per Fire Incident
Source: 2015 Calendar Year Data. Virginia Fire Incident Reporting System (VFIRS) Annual Report, Volume 10, August 2016; Table 35: VFIRS Rate Summary By Locality, Virginia,2015, see pp. 3‐22 to 3‐26 in http://vdfp.virginia.gov/fire_data_statistics/fighting_fires/AR2015.pdf
8.70%
12.19%
20.47%
20.86%
27.52%
59.18%
100.00%
0% 120%
Raleigh, NC
San Antonio, TX
Kansas City, MO
Dallas, TX
Wichita, KS
Fairfax County, VA
Oklahoma City, OK
FIRE AND RESCUE:Arson Clearance Rate (All Structures)
Source: ICMA FY 2015 Data
100%
FY 2018 Fairfax County Advertised Budget Plan (Vol. 1) - 179

Public Safety Program Area Summary
80.0%
82.9%
90.0%
92.0%
93.8%
94.4%
0% 100%
San Antonio, TX
Dallas, TX
Fairfax County, VA
Oklahoma City, OK
Austin, TX
Wichita, KS
FIRE AND RESCUE:Percent of EMS Reponse from Dispatch Call
to Arrival on Scene Within 8 Minutes
Source: ICMA FY 2015 Data
100%
33.0%
39.8%
46.2%
51.9%
60.0%
63.8%
68.3%
0% 80%
San Antonio, TX
Austin, TX
Raleigh, NC
Fairfax County, VA
Oklahoma City, OK
Dallas, TX
Wichita, KS
FIRE AND RESCUE:Percent of Fire Reponse from Dispatch Call
to Arrival on Scene Within 4 Minutes
Source: ICMA FY 2015 Data
FY 2018 Fairfax County Advertised Budget Plan (Vol. 1) - 180

Public Safety Program Area Summary
560
464
337
327
0 100 200 300 400 500 600 700
Dallas, TX
Fairfax County, VA
Wichita, KS
Mesa, AZ
FIRE AND RESCUE:Average Time for Fire and Rescue Department to Assemble Total Effective
Response Force for 1-2 Family Residential Structure Fire Incidents (in seconds)
Seconds
Source: ICMA FY 2015 Data
19%
26%
28%
33%
62%
76%
80%
81%
0% 100%
Raleigh, NC
Fairfax County, VA
Mesa, AZ
Dallas, TX
San Antonio, TX
Wichita, KS
Austin, TX
Oklahoma City, OK
FIRE: Incidents Where Flamespread Was Confined to Object
or Room of Origin: 1-2 Family Residential Structure
Source: ICMA FY 2015 Data
FY 2018 Fairfax County Advertised Budget Plan (Vol. 1) - 181

Public Safety Program Area Summary
13.1%
19.0%
20.2%
39.8%
84.1%
84.7%
86.7%
90.4%
0% 100%
Mesa, AZ
Raleigh, NC
Fairfax County, VA
Dallas, TX
Wichita, KS
San Antonio, TX
Oklahoma City, OK
Austin, TX
FIRE: Incidents Where Flamespread Was Confined to Object or Room of Origin: Multi-Family Residential Structure
Source: ICMA FY 2015 Data
22.22
21.64
20.44
19.41
17.04
16.76
14.61
14.12
7.51
0 25
City of Alexandria
Prince George's County, MD
Falls Church
Fairfax City
Montgomery County, MD
Arlington County
Prince William County
Fairfax County
Loudoun County
POLICE:Part 1 Crime Offenses Per 1,000 Population
Source: Calendar Year 2015 data. Metropolitan Washington Council of Governments: 2015 Annual Report on Crime and Crime Control - see page 2; https://www.mwcog.org/documents/2015/7/8/report-on-crime-and-crime-control-crime-public-safety--/
FY 2018 Fairfax County Advertised Budget Plan (Vol. 1) - 182
Public Safety Program Area Summary
9.8796
8.8548
7.3153
5.9833
3.9467
3.7196
3.4451
0 12
Raleigh, NC
Kansas City, MO
Dallas, TX
Wichita, KS
Mesa, AZ
Fairfax County, VA
San Antonio, TX
POLICE: Injury-Producing Traffic Accidents Per 1,000 Population
Source: ICMA FY 2015 Data
0.1290
0.1132
0.1094
0.1075
0.1020
0.0959
0.0773
0.0669
0.0417
0.0204
0.00 0.15
Oklahoma City, OK
Austin, TX
Miami-Dade County, FL
San Antonio, TX
Kansas City, MO
Dallas, TX
Raleigh, NC
Wichita, KS
Mesa, AZ
Fairfax County, VA
POLICE: Traffic Fatalities Per 1,000 Population
Source: ICMA FY 2015 Data
FY 2018 Fairfax County Advertised Budget Plan (Vol. 1) - 183
Public Safety Program Area Summary
7.1711
5.6081
3.9844
3.9482
3.9237
3.3650
2.0348
1.6812
1.6697
1.2370
0 8
Austin, TX
Raleigh, NC
Oklahoma City, OK
San Antonio, TX
Wichita, KS
Mesa, AZ
Kansas City, MO
Miami-Dade County, FL
Fairfax County, VA
Dallas, TX
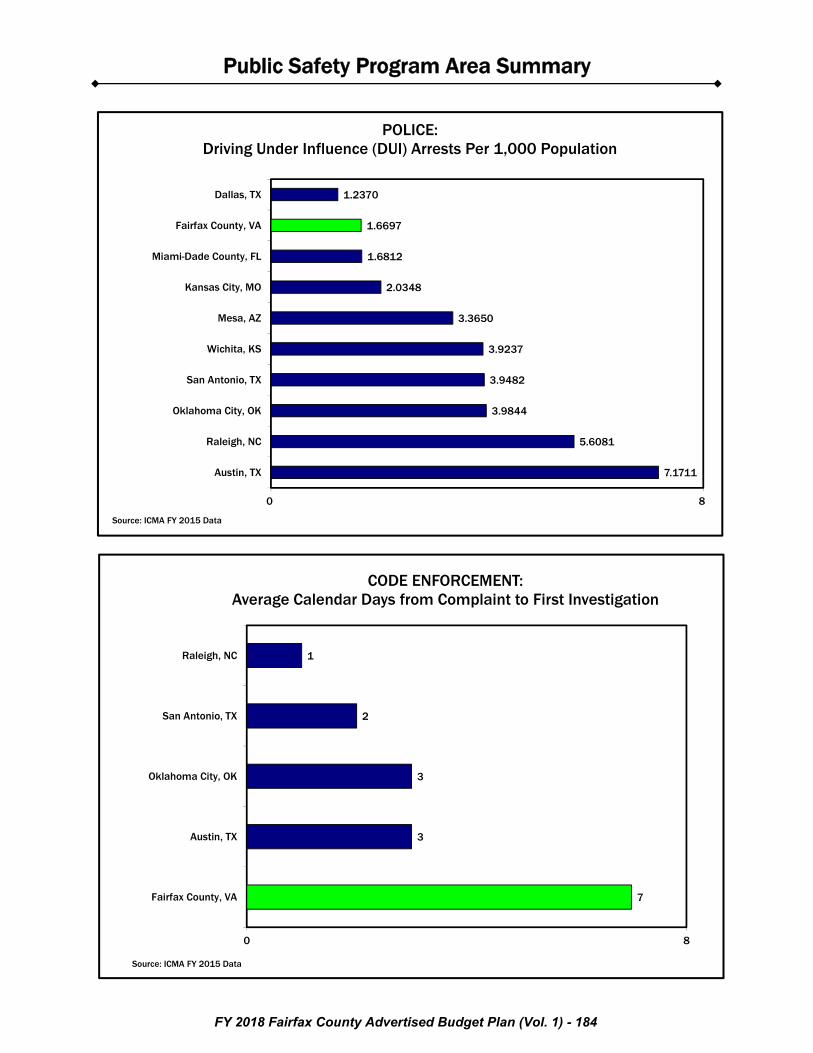
POLICE: Driving Under Influence (DUI) Arrests Per 1,000 Population
Source: ICMA FY 2015 Data
7
3
3
2
1
0 8
Fairfax County, VA
Austin, TX
Oklahoma City, OK
San Antonio, TX
Raleigh, NC
CODE ENFORCEMENT:Average Calendar Days from Complaint to First Investigation
Source: ICMA FY 2015 Data
FY 2018 Fairfax County Advertised Budget Plan (Vol. 1) - 184
Public Safety Program Area Summary
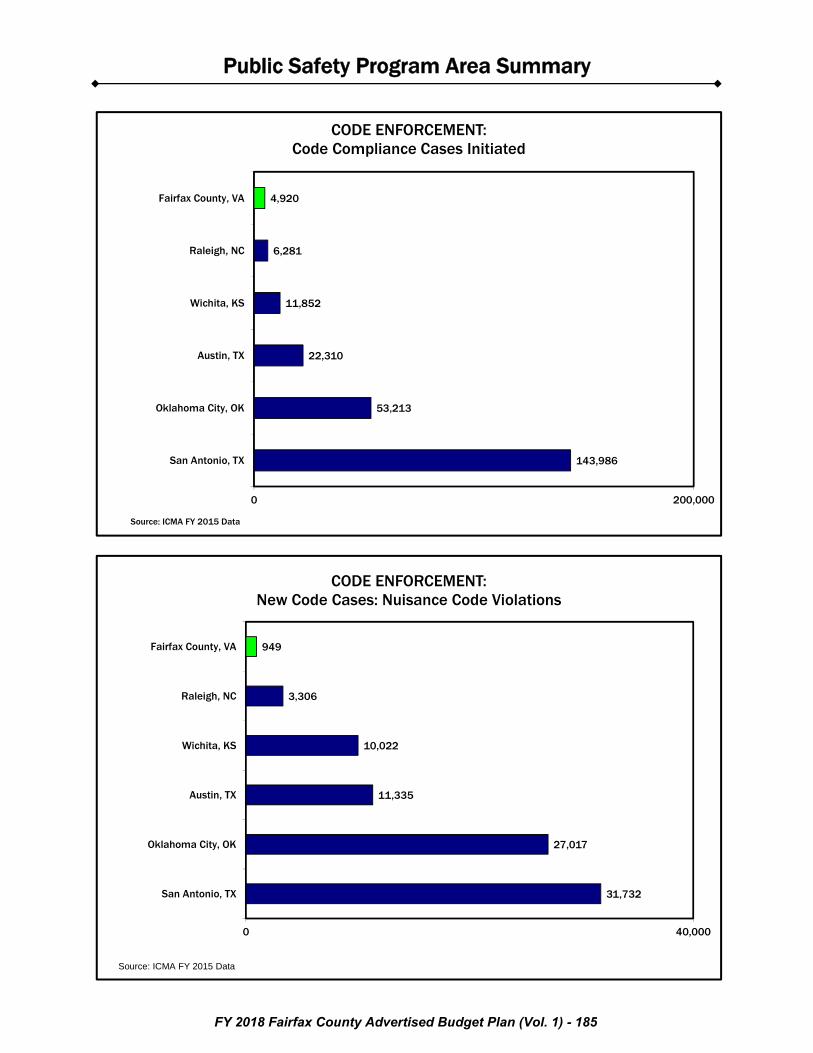
143,986
53,213
22,310
11,852
6,281
4,920
0 200,000
San Antonio, TX
Oklahoma City, OK
Austin, TX
Wichita, KS
Raleigh, NC
Fairfax County, VA
CODE ENFORCEMENT:Code Compliance Cases Initiated
Source: ICMA FY 2015 Data
31,732
27,017
11,335
10,022
3,306
949
0 40,000
San Antonio, TX
Oklahoma City, OK
Austin, TX
Wichita, KS
Raleigh, NC
Fairfax County, VA
CODE ENFORCEMENT:New Code Cases: Nuisance Code Violations
Source: ICMA FY 2015 Data
FY 2018 Fairfax County Advertised Budget Plan (Vol. 1) - 185

Public Safety Program Area Summary
$18.68
$8.75
$6.54
$5.77
$3.52
$0.00 $25.00
Austin, TX
San Antonio, TX
Wichita, KS
Raleigh, NC
Fairfax County, VA
CODE ENFORCEMENT:Code Enforcement Expenditures Per Capita
Source: ICMA FY 2015 Data
61%
63%
68%
77%
85%
0% 100%
Oklahoma City, OK
Fairfax County, VA
Raleigh, NC
Wichita, KS
San Antonio, TX
CODE ENFORCEMENT:Code Enforcement Cases Resolved -Percentage Resolved by Any Means
Source: ICMA FY 2015 Data
FY 2018 Fairfax County Advertised Budget Plan (Vol. 1) - 186