research proposal
TRANSCRIPT

Ben-Gurion University of the Negev
Research Proposal for Ph.D.
Thesis proposal
‘DESIGN STRATEGIES TOWARDS MORE ENERGY EFFICIENT SKYSCRAPERS’
אסטרטגיות תכנוניות לקראת גורדי שחקים יעילים יותר אנרגטית
By: Tanya Saroglou Student number: 850210840
Under the Supervision of:
Prof. Isaac A Meir Prof. Emeritus Baruch Givoni
8th of March 2016
Department of Man in the Desert
Advisor's name and signature: Head of Departmental Committee's name and signature:
2
ABSTRACT
Considering the fact that since 2007 more than half of the world’s population is living in urban areas (this figure is expected to rise to 60% by 2030) the livability of high-density city is gradually becoming a central point of focus. The skyscraper as a successful model of urban planning provides the possibility to increase city-space vertically as opposed to a continuous expansion outwards that has environmental consequences. Today, population migration towards the cities and the typology of the skyscraper characterize many of the big cities around the world.
However, current high-rise examples do not present a sustainable solution to an increasing population or as models of economical prosperity, as they are linked to high-energy demands, environmental and social imbalances. These statements describe most of 20th century’s architecture that portrays a deviation from climatic considerations and reliance on mechanical means for the building’s operations. However, skyscrapers are very large buildings and their impact in the urban fabric is much greater.
The design of the skyscraper as a positive addition within the urban fabric needs further research and experimentation. Currently there are a number of green-skyscrapers that celebrate a high status of environmental strategies, combined with a high rank in green certification, but there is no transparency in their energy performance. In addition, there seems to be a gap between green certification and operation energy, meaning that a highly certified building may still be consuming high amounts of energy and producing greenhouse gas emissions.
This thesis will study the energy efficiency of the skyscraper by forming a climatically responsive design. The focus is on three parameters: first, a design strategy according to the building’s immediate environment (meso and micro-climate); second, the thermal properties of the building envelope; third, the effect of height in energy performance. In this process, the building envelope is considered the most important mediator between the indoor and outdoor climate. It is anticipated that the relationships formed between these three variables will provide answers in the skyscraper’s energy performance.
EnergyPlus is used as the more widely accepted simulation engine to quantify the
energy consumption of a skyscraper model at 100m - 400m high. Energy efficiency will be calculated in line with indoor thermal comfort conditions according to ASHRAE Standard 55 and the local weather file. Tel Aviv, Municipality's Planning and Construction Committee has issued the 2025 city master plan supporting the construction of new sky-rise development, thus will serve as the case study.
This research considers the skyscraper as an urban phenomenon closely related to city living and investigates its environmental impact by quantifying its energy performance. It is anticipated that climatically responsive skyscraper design principles will promote its energy efficiency and, by so doing, reduce emissions and in effect, global warming.

3
אנרגטית יותר יעילים שחקים גורדי לקראת וניותתכנ אסטרטגיות
תקציר
אחוז הצפוי לגדול (יותר ממחצית מאוכלוסיית העולם חייה באזורים עירוניים 2007בהתחשב בעובדה שמשנת
גורד השחקים כאב . מרכזית ביותר נעשיתהפיכת העיר הצפופה לנוחה למחייה ), 2030עד שנת 60%לכדי
אופקית אשר הבניגוד להתפתחות , שטח העירשל אנכית המספק פתרון להגדל טיפוס לפיתוח העירוני
וכן , כיום ערים גדולות רבות בעולם מאופיינות על ידי נהירת אוכלוסיות אליהן. השפעותיה הסביבתיות ידועות
.על ידי אימוץ טיפולוגית גורד השחקים
ותיכול ןואינ, בר קיימא לאוכלוסייה הגדלההדוגמאות הקיימות של גורדי שחקים אינן מציגות פתרון , ברם
פגיעה באיזון הסביבתי בו קשורים בצריכת אנרגיה גבוהה בניינים אלהמאחר ש, להוות דגם של סגסוג כללי
רוב האדריכלות של המאה הל רלוונטיותאמירות אלה אמנם . והחברתי המתאפיינת בסטייה משיקולים 20-
גורדי השחקים הנם בניינים גדולים , ובכל זאת. ם לתפעול הבנייןהסתמכות על אמצעים מכנייבאקלימיים ו
.והשפעתם על המרקם העירוני גדולה באופן משמעותי
כיום ישנם מספר גורדי שחקים . תכנון גורד השחקים כמרכיב חיובי במרקם העירוני מצריך מחקר וניסוי
דירוג גבוה של הסמכה ל זכוו, תיותאסטרטגיות סביב על סמךמי שבנויים כירוקים המתהדרים במעמד גבוה
נדמה כי יש פער בין הסמכה ירוקה , יתר על כן. אך חסרה שקיפות בנוגע לתפקודם האנרגטי בפועל, ירוקה
כלומר יתכן כי בניין בעל דירוג גבוה של הסמכה ירוקה עלול בכל , לבין השימוש בפועל באנרגיה אופרטיבית
לייצר כמויות גדולות של דוזאת לצרוך כמויות גדולות של אנרגיה ו .תחמוצת הפחמן-
המיקוד יהיה על . תזה זו תחקור את פוטנציאל היעילות האנרגטית של גורד השחקים על ידי תכנון מוטה אקלים
מסו( אסטרטגיה תכנונית הכפופה לסביבת הבניין המידית , ראשית: שלושה משתנים ומיקרו - ); אקלים-
, בתהליך זה. השפעת הגובה על התפקוד האנרגטי, שלישיתו; הבנייןהתכונות התרמיות של מעטפת , שנית
מצופה כי היחסים בין . מעטפת הבניין נחשבת כמתווך החשוב ביותר בין אקלים פנים הבניין לבין זה שבחוץ
.שלושת המשתנים האלה יספקו תשובות אודות תפקודו האנרגטי של גורד השחקים
ש ככלי העיקרי לכימות צריכת האנרגיה של אב טיפוס של גורד תשמ EnergyPlusתכנת ההדמיה התרמית
100שחקים בגובה בין היעילות האנרגטית תחושב בהתייחס בתנאי הנוחות התרמית בפנים המבנה '. מ 400-
הועדה המקומית ש מאחר, תשמש אירוע חקר תל אביב . ובכפוף לאקלים המקומי ASHRAE 55לפי תקן
.המעודדת את הקמת גורדי שחקים 2025מתאר לשנת לתכנון ובנייה השיקה תכנית
וחוקר את השפעתו , מחקר זה מתייחס לגורד השחקים כתופעה עירונית הקשורה קשר הדוק לחיים העירוניים
מצופה כי יישום של עקרונות . כמת את התפקוד התרמי של הבנייןילשם כך המחקר . מנקודת מבט סביבתית
ועל ידי כך , הגדול של נפח גורד השחקים יאפשר לקדם יעילות אנרגטיתתכנון מוטה אקלים בקנה המידה
.לצמצם את ההשפעה הסביבתית השלילית של טיפוס בניין זה

4
TABLE OF CONTENTS
A. INTRODUCTION............................................................................................................2
B. ENERGYCONSUMPTION&BUILDINGS..........................................................................7
C. THETYPOLOGYOFTHESKYSCRAPER...........................................................................11
D. RESEARCHQUESTION:................................................................................................23
D. METHODOLOGY.........................................................................................................24
E. DESIGNRESEARCHTOOLS...........................................................................................27
F. TIMESCALE.................................................................................................................30
REFERENCES.......................................................................................................................31
LIST OF FIGURESFigure1:Populationgrowthfrom1800stotodaywithprojectionsto2100
(UnitedNationsDepartmentofEconomicandSocialAffairs/PopulationDivision)p.2
Figure2:Distributionofskyscrapersof200m.<High(CTBUHResearchReport2014) p.3Figure3:BankofAmericasiteenergyusedFeb.2013-Jan.2014.
(HPBHighPerformingBuildings2014:VentilationinWonderland),p.52p.5
Figure4:Impactofspirallingenergycostsoverthenextdecade,asstatedbyprivateorganizations (Gensler,2006.FaultyTowers:istheBritishOfficeSustainable?,London),p.6
p.7
Figure5:ASHRAE’sEnergyUseTargetsforNZEBs(ASHRAE,2008.ASHRAEVision2020:ProducingNetZeroEnergyBuildings,Atlanta,GA)p.13
p.8
Figure6.BankofAmerica,BryantPark1,NewYork,streetleveldesign(http://inhabitat.com) p.11
Figure7:Decreasesinefficiencybetweenofficelow-riseandhigh-riseconstruction (Barton,J.&Watts,S.,2013.Officevs.residential:Theeconomicsofbuildingtall.CTBUHJournal,(2),pp.38–43.),p.43
p.14
Figure8.HongKongskyscraperbeachfrontconstruction,viewofskyscraper‘walleffect’(Source:HongKong,Aug.2007,http://www.globalphotos.org)
p.15
Figure9.(a)2Dstreamlineanddistributionofverticalvelocityiny=B(b)Turbulentkineticenergy(TKE)iny=B.(Hang,J.&Li,Y.,2010.Ventilationstrategyandairchangeratesinidealizedhigh-risecompacturbanareas.BuildingandEnvironment,45(12),pp.2754–2767),p.2762
p.15
Figure10:TotalEEconsumedbytheentirestructurefordifferentframesandfloortypesinrelationtotheheightofthebuilding.(Foraboschi,P.,Mercanzin,M.&Trabucco,D.,2014.Sustainablestructuraldesignoftallbuildingsbasedonembodiedenergy.EnergyandBuildings,68(PARTA),pp.254–269.),p.259
p.18
Figure11.AnanalysisoftheEmbodiedEnergyofOfficeBuildingsbyHeight,inMelbourne(Treloar,G.J.etal.,2001.Ananalysisoftheembodiedenergyofofficebuildingsbyheight.Facilities,19(5/6),pp.204–214),p.210
p.19
Figure12.AverageEUIinkBtu/ft2/yrofallNewYorkofficebuildings.(Leung,L.&Ray,S.D.,2013.NewYorkCityEnergyBenchmarkingDataPaperType :Low-energyTallBuildings ?RoomforImprovementbyNewYorkCityEnergyBenchmarkingData.InternationalJournalofHigh-RiseBuildings,Volume2,,pp.285–291),p.287
p.20
LIST OF TABLESTable1:WindSpeedProfileCoefficients(ASHRAEFundamentals2005),p.3 p.17

2
A. INTRODUCTION
World population is
not spread evenly across the
globe, with Europe and Asia
having the highest
population density: 300 -
1000< people/km2. World
population is growing at a
very fast pace. Statistics
show (Fig.1) that population
rose from 1 billion at the
peak of the industrial
revolution in the mid-1800’s,
to 2 billion by 1930, 3 billion
in 1959, 4 billion in 1974, 5
billion in 1987 and that more
than 7 billion people are living in the world today (UN DESA 2014a). The rapid increase
in world population affected the growth and density of the urban environments with
cities like Hong Kong and Mumbai having very high densities of 20,000 people/km2,
London 5,100 and New York 1,750 (Ng 2010).
Considering the fact that since 2007 more than half of the world’s population is
living in urban areas, this figure is expected to rise to 60% by 2030 (UN DESA 2014b), the
livability of high density city is gradually becoming a central point of focus. Thus, it is
possible to predict that high-density urban environments will soon be the norm and will
dictate an increase in building demand. Rapid urbanization has given rise to the
phenomenon of megacities, cities whose population exceeds 10 million people. Today
there are 21 megacities that consume 80% of the worlds’ energy use and produce 80% of
greenhouse gas emissions (FIG 2010). In addition, according to UN data, a new city with
1.3 million inhabitants will be built every week for the next four decades (Wei et al. 2016).
Figure 1. Population growth from 1800s to today with projections to 2100 (Source: United Nations Department of Economic and Social
Affairs/Population Division)
3
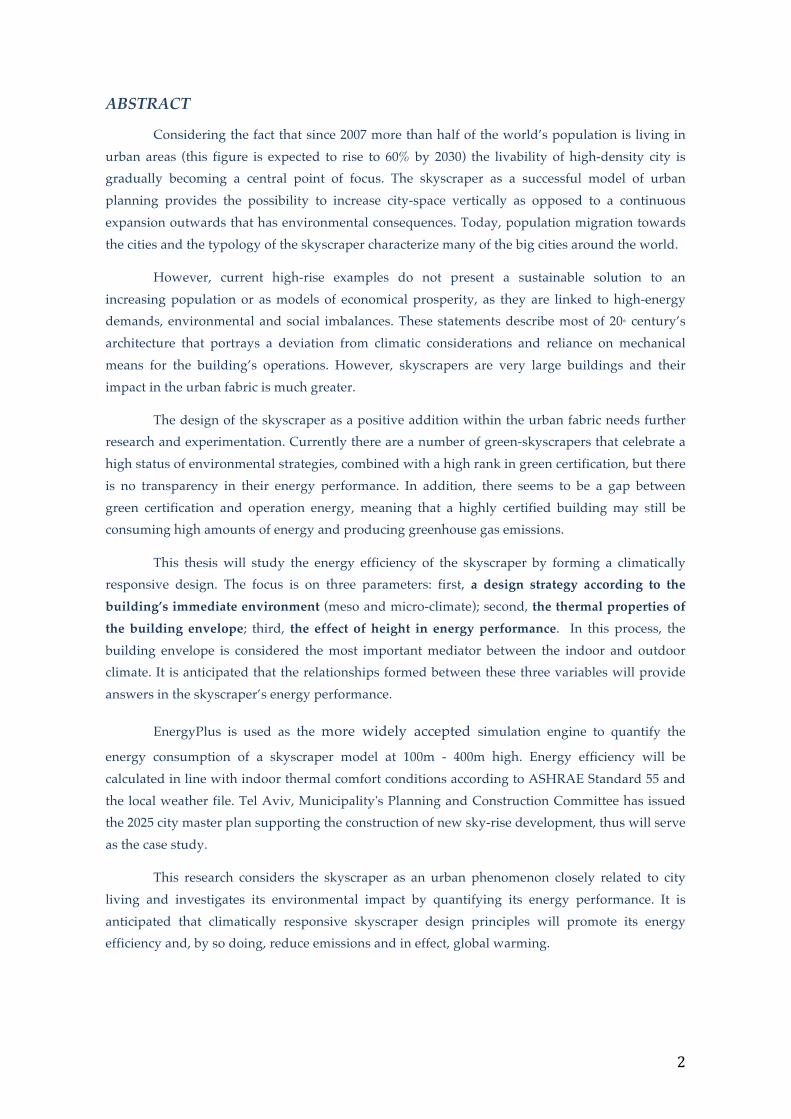
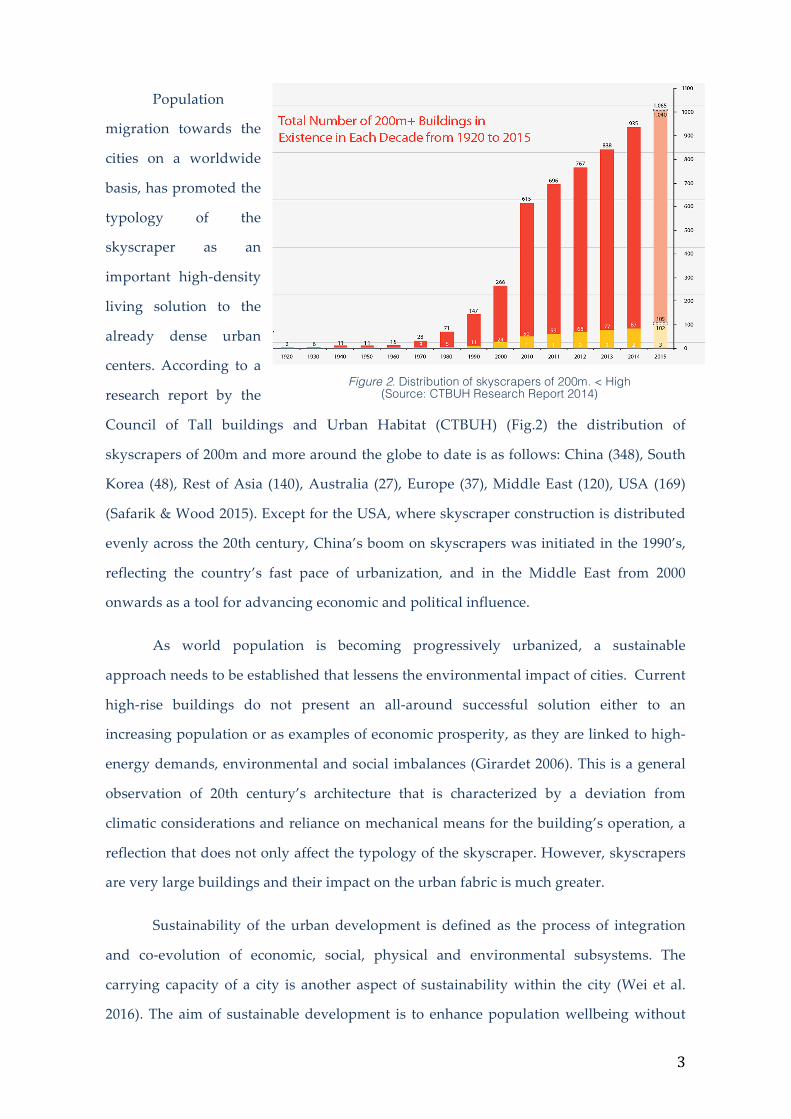
Population
migration towards the
cities on a worldwide
basis, has promoted the
typology of the
skyscraper as an
important high-density
living solution to the
already dense urban
centers. According to a
research report by the
Council of Tall buildings and Urban Habitat (CTBUH) (Fig.2) the distribution of
skyscrapers of 200m and more around the globe to date is as follows: China (348), South
Korea (48), Rest of Asia (140), Australia (27), Europe (37), Middle East (120), USA (169)
(Safarik & Wood 2015). Except for the USA, where skyscraper construction is distributed
evenly across the 20th century, China’s boom on skyscrapers was initiated in the 1990’s,
reflecting the country’s fast pace of urbanization, and in the Middle East from 2000
onwards as a tool for advancing economic and political influence.
As world population is becoming progressively urbanized, a sustainable
approach needs to be established that lessens the environmental impact of cities. Current
high-rise buildings do not present an all-around successful solution either to an
increasing population or as examples of economic prosperity, as they are linked to high-
energy demands, environmental and social imbalances (Girardet 2006). This is a general
observation of 20th century’s architecture that is characterized by a deviation from
climatic considerations and reliance on mechanical means for the building’s operation, a
reflection that does not only affect the typology of the skyscraper. However, skyscrapers
are very large buildings and their impact on the urban fabric is much greater.
Sustainability of the urban development is defined as the process of integration
and co-evolution of economic, social, physical and environmental subsystems. The
carrying capacity of a city is another aspect of sustainability within the city (Wei et al.
2016). The aim of sustainable development is to enhance population wellbeing without
Figure 2. Distribution of skyscrapers of 200m. < High (Source: CTBUH Research Report 2014)
4
compromising development possibilities. In terms of city infrastructure and building
technology, these need to display technological progress and environmental design
principles in order to successfully sustain the growing population.
Currently, the building industry is regarded as the most energy intensive sector
with buildings accounting for close to 50% of carbon dioxide (CO2) emissions, created
through the combustion of fossil fuels for the extraction of raw materials, the production
of building materials and components, their transportation and the construction of
buildings (Embodied Energy – EE), and for heating, cooling, lighting and other building
operations (Operational Energy – OE). Sustainable development and green building
design strategies have been gradually introduced into National Planning Policies, i.e.,
green building certification procedures, with special attention given to the estimation of
energy consumption. Consequently, in the process towards sustainable urban
environments the gradual independence from fossil fuels becomes vital.
The skyscraper as a successful model of urban planning provides the possibility to
grow city-space vertically as opposed to a continuous expansion outwards that has
environmental consequences, e.g., increase in air pollution due to higher vehicle traffic,
loss of agricultural land, natural habitats and land reserves. Also, the energy and
environmental demands for growing infrastructure can be huge. Skyscrapers, on the
other hand, also affect the environment by putting stress on the local infrastructure
mainly with the consumption of high-energy levels per city area unit; however, achieving
energy efficiency in high-rise structures is a challenging demand. The design of the
skyscraper as a positive addition within the urban fabric needs further research and
experimentation. This thesis considers the skyscraper as an urban phenomenon closely
related to city living and will investigate design strategies towards reducing its energy
consumption levels.
In recent years there have been a number of built skyscrapers aiming at achieving
energy efficiency. A good example of a skyscraper that demonstrates the efforts and
complexities of sustainable high-rise construction is ‘The Bank of America’ by Cook +
Fox Architects in New York, at 366 m height to architectural top, completed in 2010. The
tower has approximately 47,000 m2 of trading floors and nearly 10,000 occupants a day.

5
Figure 3. Bank of America site energy used Feb.2013-Jan.2014.
(Source: Donnolo et al. 2014)
Bank of America received ‘Core and Shell’ LEED Platinum certification from the US
Green Building Council (USGBC n.d.), which is the highest level of LEED certification,
and was awarded the 2010 ‘Best Tall Building Award - Americas’ by the Council of Tall
Buildings and Urban Habitat (CTBUH 2014).
The skyscraper was designed to set new standards on high-performance of high-
rise buildings, both for the people occupying the spaces and for the city a whole. The
tower reduces CO2 transport related emissions by providing no car parking spaces, while
including in its design bicycle parking facilities. It is also worth mentioning that its total
budget incorporated a number of public facilities with the aim of giving something back
to community through its presence. The most notable of them is the reconstruction of
Henry Miller’s Theatre to become the first “green” Broadway Theater, the LEED Gold
certified Stephen Sondheim Theater. Moreover, with its transparent façade and corner
entrance that overlooks Bryant Park opposite, it enhances a visual and physical
connection with its surroundings at street level.
Examples of the advanced technologies used in the tower are a 5.0 MW gas
turbine cogeneration plant in the basement that provides 65% of the annual electricity
required as well as lowering daytime peak demand by
30%. In terms of materials used, the tower incorporated
75% recycled steel and concrete made from cement
containing 45% blast furnace slag, and low-VOC
emitting interior finish materials. High indoor air
quality (IAQ) was achieved with a zone-by-zone
ventilation system, while the curtain wall of the
envelope provides abundant natural light and with the
use of low-E glass, heat-reflecting ceramic frit that
reduce energy consumption by 10% (Donnolo et al.
2014; CTBUH 2014).
Bank of America specifications make the building a highly sophisticated, top-
quality structure in terms of design and technologies used. However, in 2013 New York
City released a public report (Fig.3) on the building operations revealing that in 2012 the

6
tower had a site energy use intensity of 665 kWh/m2/yr, higher than any comparably
sized office building in Manhattan (Donnolo et al. 2014). Scot Horst, the senior vice
president of LEED at the USGBC supported the building’s design by drawing attention
on the fact that the structure produces most of its required electricity, and by so doing
reduces its impact on infrastructure. It took more than a year for the architects and
engineers of the project to start pin-pointing the “faults” and come up with the
conclusion that a big part of the high energy consumed was due to the over-sized
ventilation system used. The combined intentions of meeting sustainable rating system
requirements, dealing with local jurisdictional interpretation, and using design industry
standard practice resulted in the over-performing of the system (Donnolo et al. 2014).
However, in the example of the Bank of America the total energy consumption is not
only governed by the design strategies and specifications used, but also by the building’s
use (trading floors with high computing energy requirements) and the occupants’
behavior, which were not taken into consideration (Calhoun & Torbert 2013).
The high-energy rates of the building also made obvious the gap between what
LEED as a certification procedure is able to achieve regarding the environmental
performance of the structure as a whole, and what the building’s actual energy
performance is. Unfortunately, the level of information that New York City released on
Bank of America is missing for all other skyscrapers. Even the most recent ones that
celebrate a high status of environmental strategies, combined with a high ranking in
green certification, do not provide transparency in their energy data. This lack of
information hinders the understanding of how a skyscraper operates, towards
quantifying its energy performance and forming a body of successful green-design
guidelines in high-rise construction.
The process of minimizing the impact of the skyscraper both in regards to energy
consumption and carbon emissions is of high importance, considering the number of
skyscrapers that are being built across the world annually (Safarik & Wood 2015) and are
in planning for the near future. China is leading with the highest number of new
skyscrapers built every year. Other places like Tel Aviv, in Israel, changed their planning
policies to allow for future skyscraper construction. More specifically, Tel Aviv’s
Planning and Construction Committee issued the 2025 city master plan that has set new
7
guidelines on skyrise development. With Israel advancing its green building standards it
is expected that the new skyscraper development will also be an opportunity to put green
building guidelines into practice (Fox 2011). The impact of a skyscraper on infrastructure
and its popularity on a worldwide basis dictate the need for a new insight on its design
and operation. In order to advance the energy efficiency of the structure it is important to
study the skyscraper’s form from a climatically responsive perspective and focus on
quantifying its energy requirements.
B. ENERGY CONSUMPTION & BUILDINGS
Energy consumption is divided in three sectors: Industry, Transportation and
Building Construction. The building industry has become the most energy intensive
sector that consequently produces the highest amounts of greenhouse gas (GHG)
emissions. These are produced throughout the building process, i.e., extraction,
transportation and use of materials, the building’s construction and operation, and the
dismantling or demolition at end of the building’s life (EE). However, emissions
produced from the energy used to operate the building (OE), form the largest source of
building-related GHG emissions that is approximately 80-90% of the whole building
process, according to UNEP SBCI (La Roche 2012).
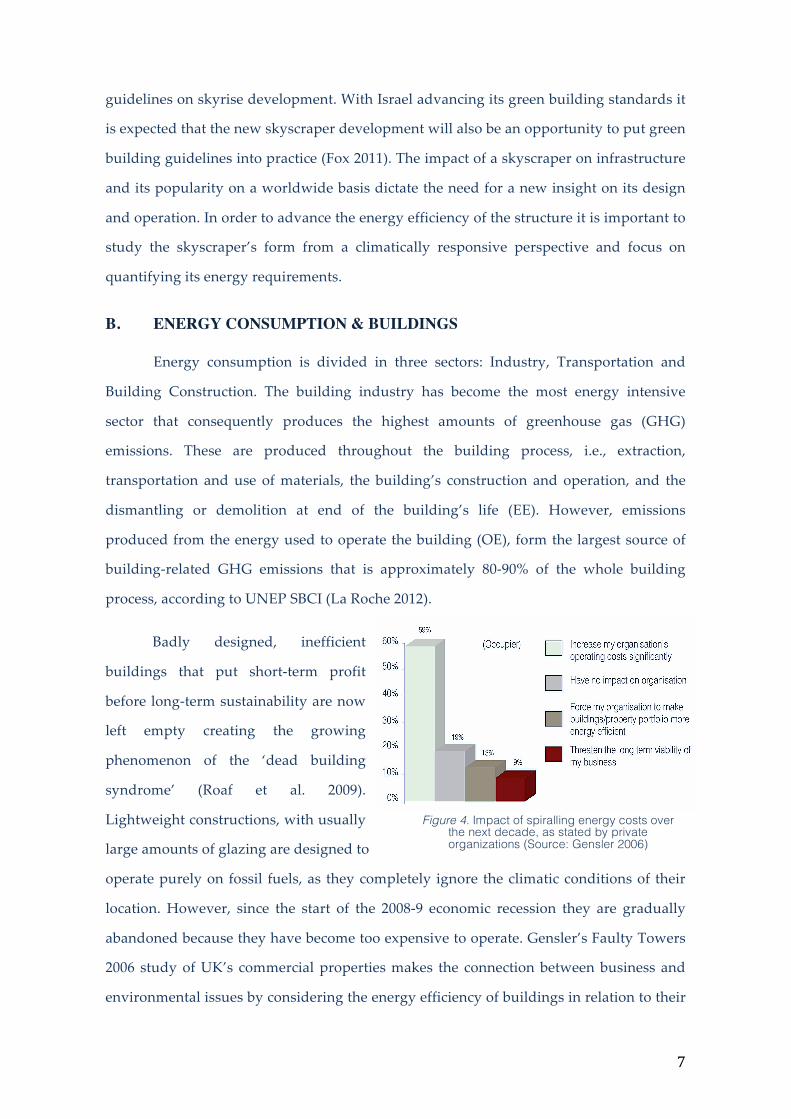
Badly designed, inefficient
buildings that put short-term profit
before long-term sustainability are now
left empty creating the growing
phenomenon of the ‘dead building
syndrome’ (Roaf et al. 2009).
Lightweight constructions, with usually
large amounts of glazing are designed to
operate purely on fossil fuels, as they completely ignore the climatic conditions of their
location. However, since the start of the 2008-9 economic recession they are gradually
abandoned because they have become too expensive to operate. Gensler’s Faulty Towers
2006 study of UK’s commercial properties makes the connection between business and
environmental issues by considering the energy efficiency of buildings in relation to their
Figure 4. Impact of spiralling energy costs over the next decade, as stated by private organizations (Source: Gensler 2006)

8
operational costs. The study revealed that both property developers and tenants believe
that the escalating operating energy costs over the following decades will be a major
factor in tenants’ choice of property and that this will force developers to make more
energy efficient structures that will reduce operation costs to more than a quarter. The
above statements clearly indicate that both property developers and managers are
looking for a more sustainable future with reduced operational (cost efficient) and
environmental (carbon emissions) rates on construction (Gensler 2006).
Faulty Towers study also revealed the developers’ belief that change will happen
through government legislation, regulation and penalties. EU legislation, the Energy
Performance of Buildings Directive (EPBD), first published in 2002, required all countries
to develop their building regulations in line with energy certification schemes for
buildings (Concerted Action (CA) EPBD 2014). The implementation of the legislation was
mainly based on the introduction of energy performance certificates (EPCs). EPCs are set
to become an essential performance initiative towards raising the building standards in
the coming years. This implies that the capital value of the poorly graded stock will fall
dramatically affecting greatly property managers. As a result, property market choices
will be either disposal of the existing stock, the least preferable solution in terms of EE
waste, an upgrade where possible, and a demand for higher energy efficiency of new
buildings (Gensler 2006).
In addition, the political and
economic uncertainties of the oil and gas
markets (U.S. Energy Information
Administration 2015; Profit Confidential
2015) in tandem with the catastrophic
consequences on climate that a reliance on
these types of energy will bring, as well as
the difficulties relating to nuclear power
production(WNA 2015), have paved the road for the development of sustainable
technologies for the production of energy. We are at a critical point where we have to
start designing our way out of fossil fuel dependence and aim towards a more
sustainable way of living. In order to achieve this, our resources supply levels have to be
Figure 5. ASHRAE’s Energy Use Targets in kbtu/square foot/year towards NZEBs
(Source: ASHRAE 2008)
9
re-calculated to a critical supply-and-demand model, as well as investigate strategies for
reducing GHG emissions. An important aspect of this process is to advance the energy
efficiency of buildings.
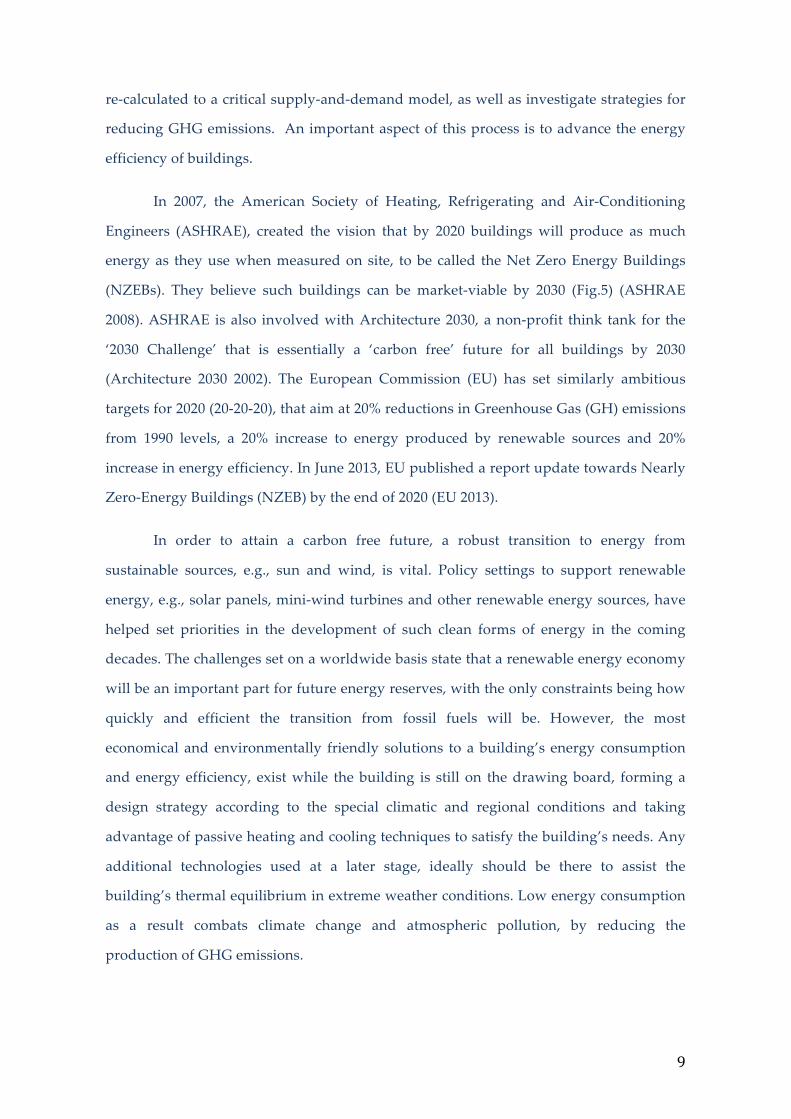
In 2007, the American Society of Heating, Refrigerating and Air-Conditioning
Engineers (ASHRAE), created the vision that by 2020 buildings will produce as much
energy as they use when measured on site, to be called the Net Zero Energy Buildings
(NZEBs). They believe such buildings can be market-viable by 2030 (Fig.5) (ASHRAE
2008). ASHRAE is also involved with Architecture 2030, a non-profit think tank for the
‘2030 Challenge’ that is essentially a ‘carbon free’ future for all buildings by 2030
(Architecture 2030 2002). The European Commission (EU) has set similarly ambitious
targets for 2020 (20-20-20), that aim at 20% reductions in Greenhouse Gas (GH) emissions
from 1990 levels, a 20% increase to energy produced by renewable sources and 20%
increase in energy efficiency. In June 2013, EU published a report update towards Nearly
Zero-Energy Buildings (NZEB) by the end of 2020 (EU 2013).
In order to attain a carbon free future, a robust transition to energy from
sustainable sources, e.g., sun and wind, is vital. Policy settings to support renewable
energy, e.g., solar panels, mini-wind turbines and other renewable energy sources, have
helped set priorities in the development of such clean forms of energy in the coming
decades. The challenges set on a worldwide basis state that a renewable energy economy
will be an important part for future energy reserves, with the only constraints being how
quickly and efficient the transition from fossil fuels will be. However, the most
economical and environmentally friendly solutions to a building’s energy consumption
and energy efficiency, exist while the building is still on the drawing board, forming a
design strategy according to the special climatic and regional conditions and taking
advantage of passive heating and cooling techniques to satisfy the building’s needs. Any
additional technologies used at a later stage, ideally should be there to assist the
building’s thermal equilibrium in extreme weather conditions. Low energy consumption
as a result combats climate change and atmospheric pollution, by reducing the
production of GHG emissions.
10
Climatically responsive architecture analyzes each location’s specific data, e.g., air
temperature, humidity, wind speed and intensity of solar radiation, and develops
strategies providing solutions towards more energy efficient, healthier and comfortable
environments. So, building design should be relevant to the area’s macro- meso- and
microclimate characteristics. Latitude, solar azimuth and altitude (time of year and time
of day) play a very important role in the climatic conditions of a location. In addition,
landscape heterogeneity, e.g., presence of significant water bodies, topography,
vegetation or a forest, can influence greatly the local climate by affecting wind patterns,
changes in temperature and humidity (Givoni 1981) and in the intensity of solar radiation
on a surface (Mazria 1979). The building envelope also becomes important in relation to
the building’s thermal behavior according to the climate and microclimate around it
(Trefil 2003). Its special physical properties, i.e., the thermal resistance and heat capacity
of the materials used, must interact appropriately with the ambient climatic conditions to
reach healthy, comfortable indoors (Givoni 1969). The morphology of the “proposed”
building site is also significant as the environmental conditions differ between a low
density (countryside, villages), a medium density (towns, city outskirts) and a high
density built environment (city center). Within a dense city fabric, the average height of
the surrounding buildings affects the specific climatic conditions of the urban section as
height impacts on solar exposure (daylight levels, solar heating), as well as wind patterns
(ventilation) and the Sky View Factor (SVF), which determines the potential of urban
cooling by long wave outgoing radiation that is restricted in urban canyons.
Undesirable climatic modifications brought about by urbanization need to be
mitigated through the implementation of sustainable development and building design
strategies. ‘Sustainable building’s’ aims are to increase energy efficiency and, by doing so,
reduce air and noise pollution, waste, and use of toxics, integrate vegetation and green
open spaces within design area, while enhancing healthy social relationships (Samiei
2013). Climatically responsive architecture works with the particular features of its
location and adapts the building to its surroundings. This means that OE used in
buildings is minimized by taking advantage of passive cooling and heating techniques.
11
C. THE TYPOLOGY OF THE SKYSCRAPER
Reaching great heights changed the aesthetics of the city. Fascination with
skyscraper design is very common, and cities are rated on how impressive their skyline
is. The skyscraper is seen as symbol of the city’s power and wealth. A list of the world’s
most impressive skylines sees Hong Kong first with 380 skyscrapers. Third on the list is
New York, even though skyscraper construction there started much earlier, with a total
of 250 skyscrapers. The list includes Shanghai, Chicago, Singapore and many more
(Kaushik 2012). Edward Glaeser, an urban economist at Harvard University, in his book
‘Triumph of the City’ talks about the history of the skyscraper and its importance in the
fast evolving cities towards the beginning of the twentieth century. He argues that high
rise Manhattan is not just a commercial center, but also a successful neighborhood with a
very vibrant street action with stores and restaurants. Commenting on the diversity of
people’s preferences he points out that such high-density levels may not be the majority’s
preferable living arrangements, but many people do like tall buildings (Glaeser 2011).
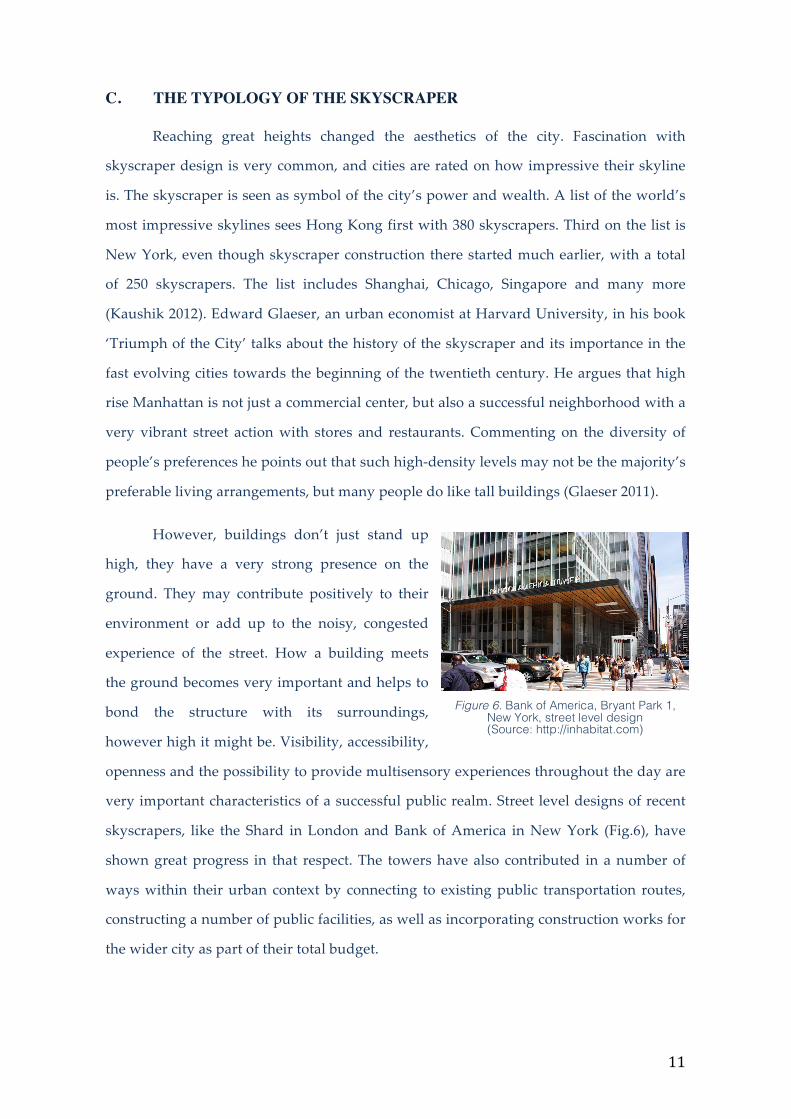
However, buildings don’t just stand up
high, they have a very strong presence on the
ground. They may contribute positively to their
environment or add up to the noisy, congested
experience of the street. How a building meets
the ground becomes very important and helps to
bond the structure with its surroundings,
however high it might be. Visibility, accessibility,
openness and the possibility to provide multisensory experiences throughout the day are
very important characteristics of a successful public realm. Street level designs of recent
skyscrapers, like the Shard in London and Bank of America in New York (Fig.6), have
shown great progress in that respect. The towers have also contributed in a number of
ways within their urban context by connecting to existing public transportation routes,
constructing a number of public facilities, as well as incorporating construction works for
the wider city as part of their total budget.
Figure 6. Bank of America, Bryant Park 1, New York, street level design (Source: http://inhabitat.com)

12
There is a difference between high-rise design and skyscrapers. Skyscrapers are
very tall buildings. What used to be a very tall building some years ago today is not as
impressive. In addition, the way skyscrapers look and are designed today is completely
different from the early skyscrapers of the 20th century, and will most probably be so, too,
in comparison to the future ones. The changing fashion is reflected in the continuous
evolution in building materials and construction methods. In the beginning of 20th
century tall building construction was characterized by excessive use of building
materials due to the absence of advanced structural analysis techniques (Milana et al.
2006). In 1965, the structural engineer Fazlur Khan created a whole new range of
structural systems, like framed tubes, braced tubes and super-frames that created a new
architectural vocabulary and advanced the structural possibilities for DeWitt-Chestnut
Apartments in Chicago ( Ali 2006). Super tall buildings, like the Petronas Towers and
Taipei 101, use the method of outrigger-and-core systems, where belt trusses or mega-
columns are employed at the perimeter, creating big openings for windows on the
facades. The use of diagrid node connections or megabrace can be seen as the next step to
tall building construction that allows for complete elimination of vertical columns and
the design of even taller structures (Milana et al. 2014). Freeing parts of the façade from
structural burdens has given rise to a new set of possibilities of innovative façade
technology that, combined with HVAC systems, may aim for energy efficiency and
indoor thermal comfort. Their combined design properties may reduce both initial and
operating costs, as well as opt for higher system performance altogether ( Ali 2006). This
is a step forward in the design of the skyscraper as a more climatically responsive
building where the façade and the mechanical systems can be designed to complement
each other.
Quantifying the energy requirements of the skyscraper becomes very important in
todays’ energy troublesome era. Its design and construction is at a critical point where it
needs to catch up with regulations on sustainable design and energy efficiency that apply
to all other new development. According to an article published by High Performing
Buildings (HPB) in 2009 (Hinge & Winston 2009), calculating a building’s energy use
intensity (EUI) is an easy task: sum up all the energy used and divide it by the floor area
to obtain the building’s EUI (usually expressed in kBtu/ft2/yr or kWh/m2/yr). The figure

13
can then be compared to the estimated EUI through the design process. However, the
HPB article also states that although modeling seems to be improving, there are
substantial inconsistencies between the EUI estimated through design and the actual EUI
when the building is occupied, meaning that even high performance buildings are using
much more energy than predicted, as in the example of Bank of America, New York. So,
even though green certification is able to provide significant environmental benefits, e.g.,
environmentally friendly products into the marketplace, the issue of energy efficiency is
still problematic. Only by rating buildings according to their energy consumption,
estimated by utility bills, a building can be said to have achieved energy efficiency – or
not. Having an effective energy rating system, like one based on utility bills, may start to
produce concrete results on the building’s energy efficiency that relate to carbon
emissions and these, in turn, to climate change (Gifford 2008). Ashraevision 2020
(ASHRAE 2008) proposes two energy performance indicators: one is the ‘design rating’,
and the other is the ‘operations rating’. One way to present this information would be
with the production of Green Building Energy Consumption Surveys (GBECS).
In regards to the energy efficiency of the skyscraper, the building industry’s
concerns have advanced relative to the number of built and proposed skyscrapers built
today. CTBUH conducted the ‘Roadmap on the Future Research Needs of Tall Buildings’
(Oldfield et al. 2014), at the Illinois Institute of Technology, Chicago. The research is put
together from responses of practicing professionals and academicians in the building
industry all over the world, and identifies 11 different fields to be investigated for
advancing skyscraper design in the following years. The section ‘Research on the
integration of passive design strategies and technologies into tall buildings to reduce
energy requirements and improve occupant comfort’ scored the second highest rating of
7.6 out of 10 points. CTBUH’s 11 research fields revealed that there is little knowledge so
far on skyscraper design and that there is a growing concern to advance the industry’s
expertise on this building type.
Given the difficulties discussed above to accurately estimate building energy
performance, especially after being occupied, a focus on energy efficiency should be
given to the reductions produced through design alone, more specifically, to improve the
form and fabric of the building to such an extent that minimizes considerably the impact
14
of energy consumption on heating and cooling. For the example of the skyscraper, in
order to achieve such results a holistic understanding of its pros and cons is vital. This
means a detailed understanding of the issues that this building type instigates, as well as
what makes it exceptional. This process in effect creates the basis upon which changes
towards the sustainable future of the skyscraper can occur.
A skyscraper is the product of a fruitful cooperation between a number of parties
involved. Complex forms of coordination are formed between the clients and the
architects of the project, in collaboration with the engineers and the developers, in line
with the building regulations by the City Council, and numerous consultations with the
important neighboring developments. Further issues that need to be taken into
consideration, when designing such a building type, are its connection with the local
transportation systems, as well as its impact on infrastructure and the ecology of the site
(Yeang 2008).
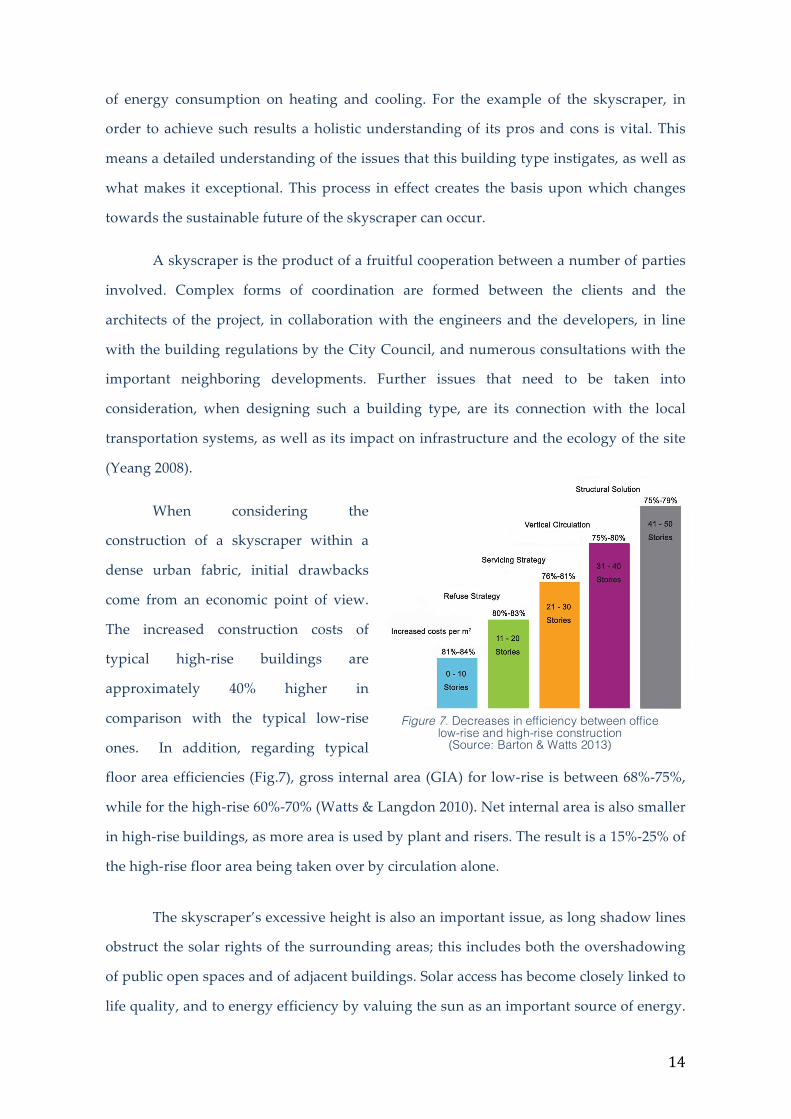
When considering the
construction of a skyscraper within a
dense urban fabric, initial drawbacks
come from an economic point of view.
The increased construction costs of
typical high-rise buildings are
approximately 40% higher in
comparison with the typical low-rise
ones. In addition, regarding typical
floor area efficiencies (Fig.7), gross internal area (GIA) for low-rise is between 68%-75%,
while for the high-rise 60%-70% (Watts & Langdon 2010). Net internal area is also smaller
in high-rise buildings, as more area is used by plant and risers. The result is a 15%-25% of
the high-rise floor area being taken over by circulation alone.
The skyscraper’s excessive height is also an important issue, as long shadow lines
obstruct the solar rights of the surrounding areas; this includes both the overshadowing
of public open spaces and of adjacent buildings. Solar access has become closely linked to
life quality, and to energy efficiency by valuing the sun as an important source of energy.
Figure 7. Decreases in efficiency between office low-rise and high-rise construction
(Source: Barton & Watts 2013)
15
The incorporation of a solar envelope in building design as a zoning device, is a way to
assure urban solar access for both energy and life quality standards (Knowles 1999). For
example, solar envelope regulations between two or more adjacent buildings, is that the
volume of one compliments the design and volume of the other, meaning that shadows
are cast in a way that all buildings enjoy ‘adequate sunlight’ for the design of passive and
low-energy architecture; the characteristics of the solar envelope are relevant to land size,
shape as well as the climate and microclimate of the location, for example, the minimum
recommended requirement for solar access in a ‘Mediterranean’ climate is four hours
(Knowles 2000).
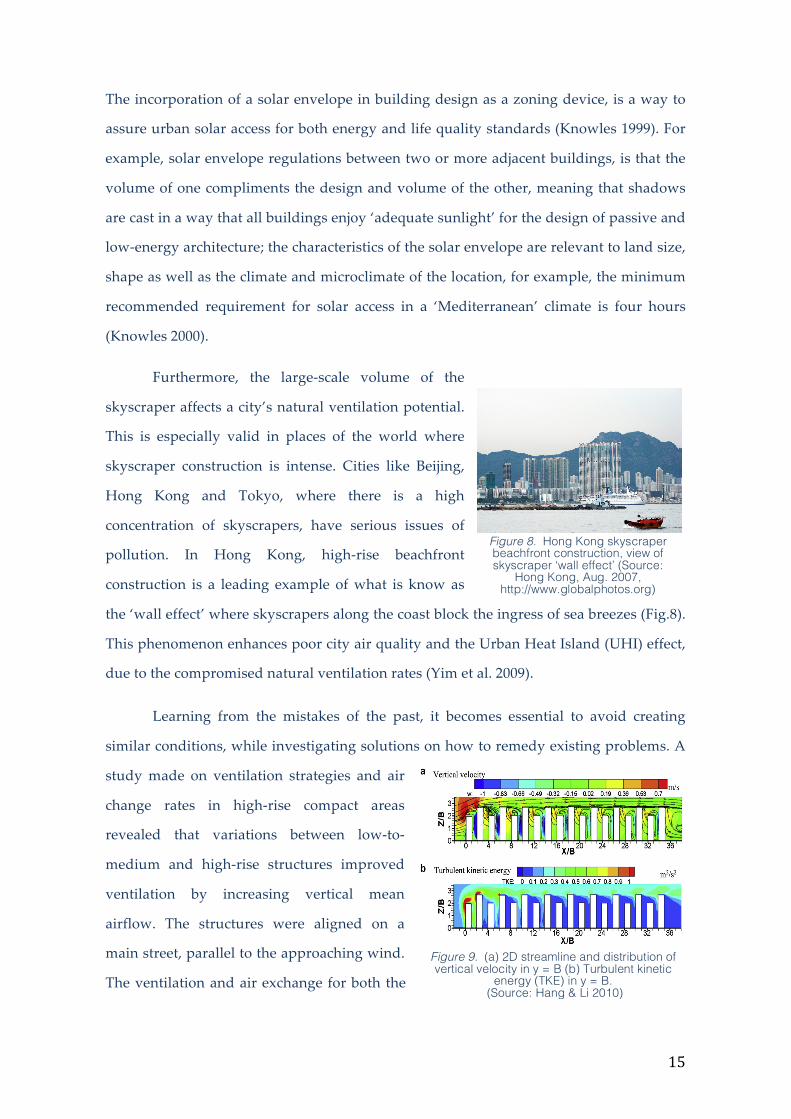
Furthermore, the large-scale volume of the
skyscraper affects a city’s natural ventilation potential.
This is especially valid in places of the world where
skyscraper construction is intense. Cities like Beijing,
Hong Kong and Tokyo, where there is a high
concentration of skyscrapers, have serious issues of
pollution. In Hong Kong, high-rise beachfront
construction is a leading example of what is know as
the ‘wall effect’ where skyscrapers along the coast block the ingress of sea breezes (Fig.8).
This phenomenon enhances poor city air quality and the Urban Heat Island (UHI) effect,
due to the compromised natural ventilation rates (Yim et al. 2009).
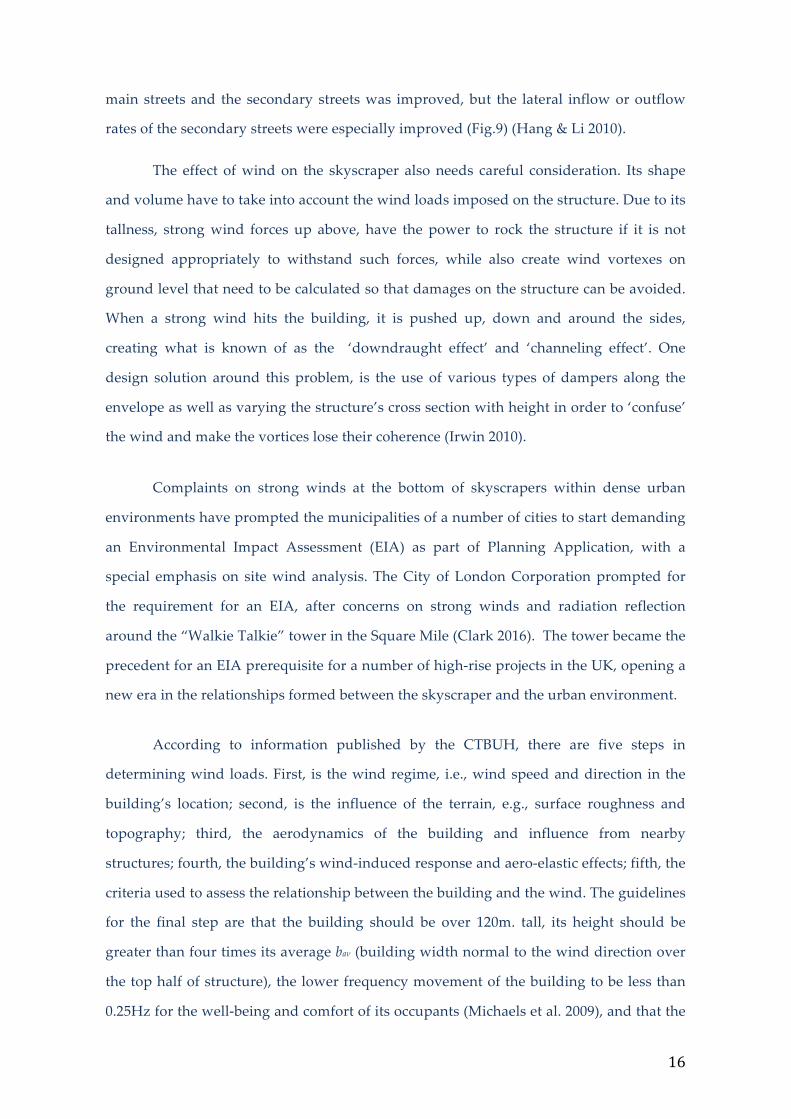
Learning from the mistakes of the past, it becomes essential to avoid creating
similar conditions, while investigating solutions on how to remedy existing problems. A
study made on ventilation strategies and air
change rates in high-rise compact areas
revealed that variations between low-to-
medium and high-rise structures improved
ventilation by increasing vertical mean
airflow. The structures were aligned on a
main street, parallel to the approaching wind.
The ventilation and air exchange for both the
Figure 8. Hong Kong skyscraper beachfront construction, view of skyscraper ‘wall effect’ (Source:
Hong Kong, Aug. 2007, http://www.globalphotos.org)
Figure 9. (a) 2D streamline and distribution of vertical velocity in y = B (b) Turbulent kinetic
energy (TKE) in y = B. (Source: Hang & Li 2010)
16
main streets and the secondary streets was improved, but the lateral inflow or outflow
rates of the secondary streets were especially improved (Fig.9) (Hang & Li 2010).
The effect of wind on the skyscraper also needs careful consideration. Its shape
and volume have to take into account the wind loads imposed on the structure. Due to its
tallness, strong wind forces up above, have the power to rock the structure if it is not
designed appropriately to withstand such forces, while also create wind vortexes on
ground level that need to be calculated so that damages on the structure can be avoided.
When a strong wind hits the building, it is pushed up, down and around the sides,
creating what is known of as the ‘downdraught effect’ and ‘channeling effect’. One
design solution around this problem, is the use of various types of dampers along the
envelope as well as varying the structure’s cross section with height in order to ‘confuse’
the wind and make the vortices lose their coherence (Irwin 2010).
Complaints on strong winds at the bottom of skyscrapers within dense urban
environments have prompted the municipalities of a number of cities to start demanding
an Environmental Impact Assessment (EIA) as part of Planning Application, with a
special emphasis on site wind analysis. The City of London Corporation prompted for
the requirement for an EIA, after concerns on strong winds and radiation reflection
around the “Walkie Talkie” tower in the Square Mile (Clark 2016). The tower became the
precedent for an EIA prerequisite for a number of high-rise projects in the UK, opening a
new era in the relationships formed between the skyscraper and the urban environment.
According to information published by the CTBUH, there are five steps in
determining wind loads. First, is the wind regime, i.e., wind speed and direction in the
building’s location; second, is the influence of the terrain, e.g., surface roughness and
topography; third, the aerodynamics of the building and influence from nearby
structures; fourth, the building’s wind-induced response and aero-elastic effects; fifth, the
criteria used to assess the relationship between the building and the wind. The guidelines
for the final step are that the building should be over 120m. tall, its height should be
greater than four times its average baν (building width normal to the wind direction over
the top half of structure), the lower frequency movement of the building to be less than
0.25Hz for the well-being and comfort of its occupants (Michaels et al. 2009), and that the
17
reduced velocity at extreme conditions be greater than 5 (Irwin et al. 2013), calculated
with the following relationship:
𝑈/(𝑓!𝑏!")
Where:
U, is the mean hourly wind velocity at the top of the building
f1, is the lowest natural frequency of the building
bαν, is the average width of building
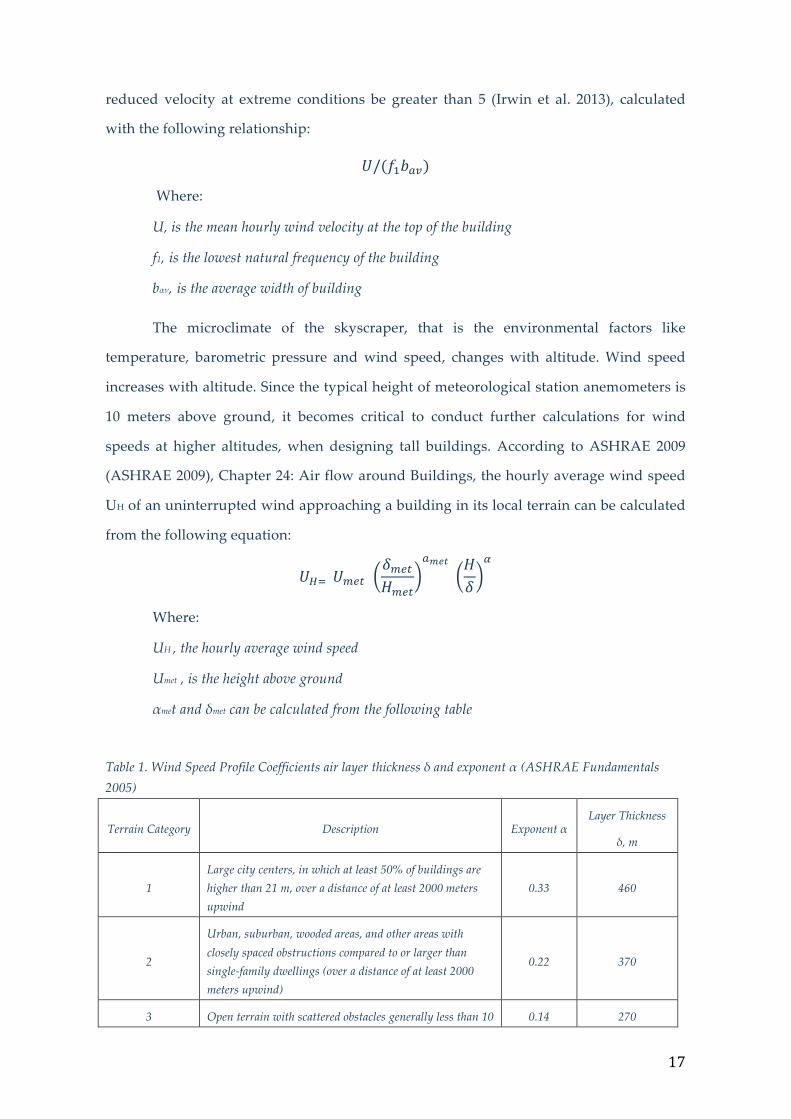
The microclimate of the skyscraper, that is the environmental factors like
temperature, barometric pressure and wind speed, changes with altitude. Wind speed
increases with altitude. Since the typical height of meteorological station anemometers is
10 meters above ground, it becomes critical to conduct further calculations for wind
speeds at higher altitudes, when designing tall buildings. According to ASHRAE 2009
(ASHRAE 2009), Chapter 24: Air flow around Buildings, the hourly average wind speed
UH of an uninterrupted wind approaching a building in its local terrain can be calculated
from the following equation:
𝑈!! 𝑈!"# 𝛿!"#𝐻!"#
!!"#
𝐻𝛿
!
Where:
UH , the hourly average wind speed
Umet , is the height above ground
αmet and δmet can be calculated from the following table
Table 1. Wind Speed Profile Coefficients air layer thickness δ and exponent α (ASHRAE Fundamentals 2005)
Terrain Category Description Exponent α Layer Thickness
δ, m
1 Large city centers, in which at least 50% of buildings are higher than 21 m, over a distance of at least 2000 meters upwind
0.33 460
2
Urban, suburban, wooded areas, and other areas with closely spaced obstructions compared to or larger than single-family dwellings (over a distance of at least 2000 meters upwind)
0.22 370
3 Open terrain with scattered obstacles generally less than 10 0.14 270
18
meters height, including flat open country typical of meteorological station surroundings
4 Flat, unobstructed areas exposed to wind flowing over a large water body (no more than 500 meters inland)
0.10 210
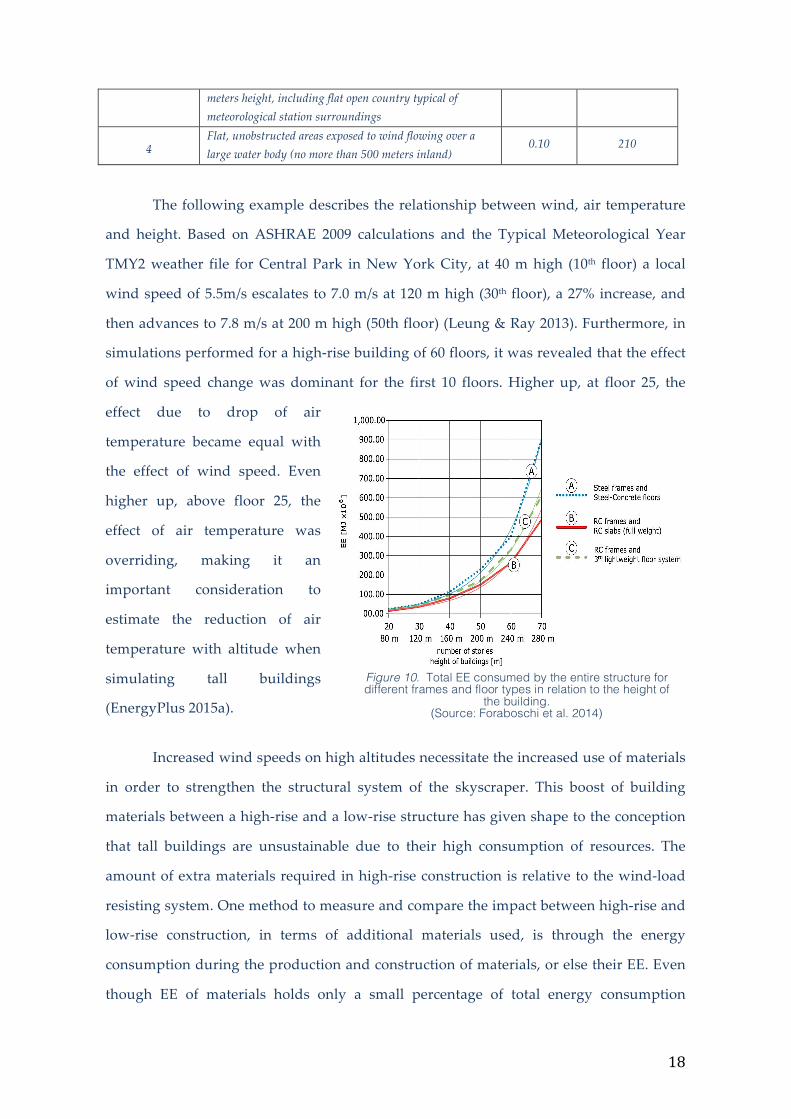
The following example describes the relationship between wind, air temperature
and height. Based on ASHRAE 2009 calculations and the Typical Meteorological Year
TMY2 weather file for Central Park in New York City, at 40 m high (10th floor) a local
wind speed of 5.5m/s escalates to 7.0 m/s at 120 m high (30th floor), a 27% increase, and
then advances to 7.8 m/s at 200 m high (50th floor) (Leung & Ray 2013). Furthermore, in
simulations performed for a high-rise building of 60 floors, it was revealed that the effect
of wind speed change was dominant for the first 10 floors. Higher up, at floor 25, the
effect due to drop of air
temperature became equal with
the effect of wind speed. Even
higher up, above floor 25, the
effect of air temperature was
overriding, making it an
important consideration to
estimate the reduction of air
temperature with altitude when
simulating tall buildings
(EnergyPlus 2015a).
Increased wind speeds on high altitudes necessitate the increased use of materials
in order to strengthen the structural system of the skyscraper. This boost of building
materials between a high-rise and a low-rise structure has given shape to the conception
that tall buildings are unsustainable due to their high consumption of resources. The
amount of extra materials required in high-rise construction is relative to the wind-load
resisting system. One method to measure and compare the impact between high-rise and
low-rise construction, in terms of additional materials used, is through the energy
consumption during the production and construction of materials, or else their EE. Even
though EE of materials holds only a small percentage of total energy consumption
Figure 10. Total EE consumed by the entire structure for different frames and floor types in relation to the height of
the building. (Source: Foraboschi et al. 2014)

19
throughout a building’s life cycle (approximately 15%) in comparison with the
operational energy (at about 85%), opportunities to reduce EE should be taken into
consideration.
A study of the “Inventory of Carbon and Energy” (ICE), which is the cradle-to-
gate database including all activities from materials extraction, manufacturing,
assembling and transportation to fabrication processes, of reference structures
dimensioned between twenty (80m high) to seventy stories high (280m high), provided
an insight on the relative EE increases with height. The upper limit of seventy stories
high is considered a threshold in this study, after which the wind-load structural
resisting system necessitates greater
use of materials, especially for the
core, implying a greater consumption
of EE (Foraboschi et al. 2014), due to
the greater wind loads and increased
needs for an anti-seismic design
requirements (belt trusses, super
columns, mega brace etc.).
The report assesses the
increases of the Embodied Energy
(EE) of the different height structures
with the use of a Reinforced Concrete
(RC) central core, and either RC or steel rigid frames. For the floors three different
structural combinations were used; reinforced concrete, steel and a lightweight flooring
system. It was revealed that the floors almost always consume most of the EE, whatever
combination is adopted, but with an emphasis on the increased EE of the lightweight
materials. The results showed that considering the relationship of EE with height, the
consumptions of EE were within reason for the RC frames, while the EE of steel frames is
higher (Fig.10). The report concludes that it is possible to construct sustainable tall
buildings with the EE of materials as an indicator, by studying the relationships between
the unitary EE and the building height (Foraboschi et al. 2014).
Figure 11. An analysis of the Embodied Energy of Office Buildings by Height, in Melbourne
(Source: Treloar et al. 2001)

20
Another study conducted on data possessed from five case studies of office
buildings of the following heights: 3, 7, 15, 42 and 52 stories high, gave a different insight
into the relationship of EE with height (Treloar et al. 2001). An important characteristic of
this study is the difference of geometry and construction systems between the buildings
in question. The analysis of and comparison between the buildings showed that the EE in
the columns and internal walls of the high-rise buildings was significantly higher than in
the low-rise, due to the increased use of materials related to the structural requirements
of wind and vertical loads. In total, the EE results showed a 60% increase in the EE/m2
between the 3 stories and 52 stories buildings (Fig.11). The results of the above studies
form an understanding on the use of building elements and their variations in a
building’s embodied energy as height increases.
Higher wind speeds on upper levels may also create variations in the EE of other
building components, like windows and insulation, but the effect of these was not
included in the above examples. However, the use of materials with low EE and high
thermal properties, like for example materials with high thermal insulation capabilities
and low EE, result in reductions in both embodied and operational energies (Kua &
Wong 2012). In addition, a skyscraper consumes higher amounts of OE due to its large-
scale volume compared to low-rise development. A main reason for the higher energy
consumption is the energy used by elevators, which is often negligible in low-rise
construction. It is estimated that depending
on height and program, elevators can
consume from 5-15% of the total energy
consumed in tall buildings. This is due to the
higher travel distances and the faster speeds
used (Leung & Ray 2013).
Since 2009 the New York City requests
from all buildings with gross areas greater
than 50,000 ft2 (4,645 m2) to publicly release
their energy consumption data. The height of
the buildings is not included in the reports,
Figure 12. Average EUI in kBtu/ft2/yr of all New York office buildings reported by The City of
New York as a function of total number of floors. (Source: Leung & Ray 2013)
21
but the number of floors is, which provides a good indication of height. Leung and Ray
in their study on the energy consumption of tall buildings, collected energy
benchmarking data of office buildings, with at least 80% of their total area used as office
space. This eliminated possible discrepancies created with different building uses. 706
buildings were studied. Results show the difference in energy consumption between
buildings of 9 to 50+ floors, measured in energy usage intensity (kBtu/m2 /yr). The
analysis revealed that lower buildings consume less energy on average than taller
buildings (Fig.12). Results show a steady increase in EUI between 1-29 floors, with a
rapid escalation at 30-39 floors, after which a plateau is reached for tall building
construction. An important consideration in the EUI escalation between the 30th and 39th
floor and the EUI balance that followed, is that buildings of that height to date are mostly
exposed to the sky and don’t experience wind or sun shading from other structures
(Leung & Ray 2013).
The tall structure of the skyscraper also affects energy consumption for heating
and cooling, in relation to altitude. The built environment is located within the
troposphere, which extends from sea level to sixteen kilometers high. However, the
typical height of skyscrapers is within the range of 300-400m high. Within the
troposphere, dry bulb temperature decreases with height at an almost linear rate, of
approximately 1 °C per 150m (EnergyPlus 2015b; U.S. Government Printing Office 1976).
Lotfabadi studied the decrease in temperature with altitude and its effects on energy
consumption for Tehran’s International Tower, in Iran, the highest residential tower in
the country up to 2012, with a height of approximately 164m. EnergyPlus simulation
program was used to estimate the reduction in cooling, while maintaining thermal
control setpoints, and it was revealed that 2.4% reduction was achieved just by changing
the variable of altitude that as a result decreased temperature in relation to height. The
study also revealed that 1.5% of the energy savings for ventilation were achieved by
lower air density alone at higher altitudes, as thinner outdoor-air requires less energy to
cool (Lotfabadi 2014), as well as to heat in that respect.
In regards to energy conserved all year round, the large-scale windows used
throughout the tower, sized: 1.4m x 3.0m with overhang shading devices of 1.2m deep,
22
result in energy efficiency in both cooling and heating, due to the different angles of the
sun between summer and winter, e.g. Mediterranean climate, where shading devices
prevent high-angle summer sun penetration, while allowing for low-angle winter sun
access. Passive heating is also enhanced by the location of the tower: a flat, unobstructed
site that receives both diffuse and direct beam radiation, and the fact that Tehran enjoys
approximately 300 days of sunshine per year. The large scale of the windows also allows
for increased natural day lighting, reducing energy consumed for artificial lighting.
In the example of the Freedom Tower in New York City (Ellis & Torcellini 2005), a
reduction of approximately 1.85°C was observed between the elevations of 1.5m to 284m
high. This decreased the energy consumption for cooling (summer) of the upper floors by
2.4%. Regarding annual variations for both cooling and heating energy consumption
according to height, a 9% net increase was found for both due to the decreased shading at
upper levels from other buildings. However, an analysis showed that the building
requires all-year cooling and minimum heating, which means that the annual energy
demand is essentially for cooling (Ellis & Torcellini 2005; Leung & Ray 2013). It is
important to note that that there is no provision for shading devices in the design of the
tower, and that the Freedom Tower is an office building with a number of other public
amenities, e.g. restaurants, and its internal heat gains are great, increasing thus the need
for cooling.
From the two examples above, Tehran’s International Tower and Freedom Tower
in Manhattan, we see that the considerations for estimating and reducing the energy
consumption in high-rise construction are based on a number of variables. So, the
reduction of ambient temperature with altitude can be a plus during the summer in a
warm climate, but it may create liabilities during winter, unless other design parameters
are considered, e.g., passive heating. In summary, design strategies like appropriate
orientation of the structure for blocking strong winds, while enhancing ventilation, as
well as the introduction of natural light through big glazed openings with the design of
shading devices for taking advantage of solar radiation without causing overheating,
become important elements in the final performance and appearance of the structure.
The wider impact of these ‘vertical cities’ has social, environmental, cultural and
23
economic consequences. Skyscrapers can accommodate diverse building services, a
combination of commercial and residential, and therefore advance the efficiency of the
land usage vertically. A good urban design strategy is able to deal with the above issues
and provide positive, vibrant places without compromising the need for development
and economic growth. The need to build high is growing as population is rising and
available land becomes scarce. The challenge is how this can be done in the most
sustainable way possible.
D. RESEARCH QUESTION:
This research intends to investigate what are the appropriate design strategies that can
promote more energy efficient skyscrapers
The typology of the skyscraper is gradually moving from the domain of the
special few cities to a widely recognized type of city development. A skyscraper located
within a dense urban fabric cannot avoid having a significant impact, but the effects of
this impact (positive or negative) are seen as important challenges towards 21st century’s
sustainable compact city. So, city density through high-rise architecture may be one
solution to sustainable development as long as these tall structures are also sustainable
and are able to reduce the burden of their resource demands in the wider infrastructure.
Malaysian architect Ken Yeang, has worked intensely on bridging the gap
between the skyscraper’s design and operation, through his ‘bioclimatic skyscraper’. By
combining his passion for tall buildings with vernacular architecture and environmental
strategies, he has created several tropical skyscrapers. His built projects are in the range
of 100-150m tall, while his conceptual designs can be over 300m. The projects show an
evolving process of bioclimatic design based on ecological principles: extensive
vegetation, sunshade, rainwater collection, natural ventilation, daylight etc. (Yeang &
Richards 2007). Yeang states that when designing tall buildings, the typology is very
different from traditional architecture, even though the climatic considerations remain
the same. He accepts that, in some respects, a skyscraper can never be truly ‘green’ due to
its size, but nevertheless he acknowledges the requirement for such a building type and
comments that green designers instead of negating it, should try to mitigate its negative
24
environmental impact and make it a good place for its habitants. He was the first to
address the issue of low energy in high-rise construction. This research focuses on the
energy consumption of the skyscraper and investigates design strategies towards its
energy efficiency by studying closely the skyscraper’s design in relation to its meso and
microclimate.
D. METHODOLOGY
DESING RESEARCH THEORY
The building envelope acts as a mediator between the indoor conditions and the
local climate. In climatically responsive architecture the envelope is designed in
accordance with the local environmental constraints and the building needs. In this
design process, it may be that differently oriented surfaces demand different design
approach. Ideas about spatial interior arrangement, location, size and depth of windows
as well as of shading devices also come to play. Analyzing the solar-climatic performance
of each façade will result in façade-design variations that relate to the specific energy
performance of each orientation.
Two important considerations in this process are the window-to-wall-ratio WWR
value (WWR = [window area/(outside wall area + window area)] × 100) and the design of
shading devices. A number of studies have focused on the relationship between WWR
and building energy consumption (Yang et al. 2015; Inanici & Demirbilek 2000). Depth,
size, shape and angle of the shading devices should ideally correspond to the building’s
location (latitude, altitude, elevation) and the orientation of the façade (Palmero-Marrero
& Oliveira 2010). The optimum length and height of the shading devices for advanced
energy efficiency of each orientation can be best calculated with the use of thermal
simulation programs (Ahmed & El Monteleb 2012). Similarly, the WWR value is also
relevant to the specific climatic conditions of the building’s location. In cold climates
where solar heat gain is needed, increased window sizes with S, SE and SW orientations
(in the Northern hemisphere) minimize heating requirements. In warm climates,
increased solar radiation advances the cooling energy requirements, so smaller WWR
values present better results (Yang et al. 2015). However, low WWR may compromise eye
25
contact with the outside and natural light. Highly sophisticated modern technology of
windows with low solar heat gain coefficient (SHGC), is able to reduce the intense
differences between window sizes and energy consumption (Kim et al. 2014). SHGC is
the degree of solar heat radiation through the window with values 0-1.
Energy consumption is calculated in relation to indoors thermal comfort
standards (Givoni 1981). Within this comfort zone the acceptable temperature range
according to the Predicted Mean Vote (PMV) model by Fanger, for winter, lies between
20-23°C, and between 23-26°C for the summer (ASHRAE 2004). Clothes control heat
exchange between the body and the exterior environment, by forming a barrier. Also, the
metabolic rate, that is the chemical energy a person frees from their body per unit of time,
or else the amount of heat produced according to activities conducted, influences the
requirements for thermal comfort. Moreover, the effect of weather conditions (climate),
both on a physical and psychological level of the individual, seems to be very important
even though it is not included in the PMV variables (Humphreys & Nicol 2002). De
Dear’s analysis of the ASHRAE database found that people were much more tolerant to
the thermal variations of naturally ventilated buildings (NV) than those of centrally
conditioned ones (AC) (Humphreys et al. 2013). Nevertheless, a building could be
operating in both modes during a year. It is worth noting that changes of climate have a
time lag before affecting indoor comfort temperatures and that this depends on the
thermal inertia of the building. The role of mechanical heating and cooling is to balance
out heat losses from the building. Achieving thermal comfort with minimum energy
consumption is an important principle of green architecture. The structure operates at a
higher-efficiency by consuming less energy without compromising interior comfort
conditions. In this process, the building envelope mediates between the interior
environment and the exterior climatic conditions in order to regulate the indoor
temperature.
Thermal conductivity or U-value is a material property vital in the assessment of
the thermal performance of building elements. In ASHRAE Standard 90.1 1989, ‘Energy
Standard for Buildings Except Low-Rise Residential Buildings’ HRAE 2013), the U-value
is described as the time rate or heat flow per unit area under steady conditions from the
fluid on the warm side of the barrier to the fluid on the cold side, per unit temperature
26
difference between the two fluids [W/(m²·°C)]. The U-value of a composite wall-section is
calculated from the sum of the thermal properties of the single layers. A low U-value
implies lower conductivity and higher insulation, and vise-versa. Thus, the choice of
materials and their combinations provide information on their thermal behavior. The
thermal properties of the building elements, as well as other characteristics like WWR,
type of windows and shading devices, and their variations according to orientation,
latitude and microclimate, could provide valuable insights on the optimum envelope
design for energy efficiency. Moreover, internal heat gains resulting from electrical
appliances, lighting fixtures and people occupying the space, alter considerably the
thermal requirements of a building, and they depend on the building type (residential,
office, public building etc.).
DESIGN RESEARCH METHODS
The above theoretical background will be tested with the use of thermal
simulations of reference models. Then energy consumption will be compared with data
on energy consumption of built skyscrapers. More specifically, the methods used in this
research are divided in four sections:
1. Establishing a ‘typical energy consumption per floor area kWh/m2
(residential and office buildings) by investigating existing case studies
2. Aiming to obtain data on the energy consumption of already built
skyscrapers (e.g. by placing monitoring equipment within the premises,
collecting energy bills etc.)
3. Simulating high-rise reference structures with the intention to form design
strategies towards energy efficiency
4. In the final step, the results of method 2 will be compared with the results
of the method 3, for certain typologies.
The above methods are sub-divided in further three categories:
• Residential
• Office
• Mixed use
27
E. DESIGN RESEARCH TOOLS
Energy use monitoring and benchmarking are becoming common worldwide
practices towards energy efficiency. Aiming at the reduction of carbon emissions related
to buildings, countries such as the US and Singapore have set up policies to track and
improve the energy efficiency of the built environment by monitoring the energy
performance of the building stock. As a first step, my target will be to retrieve such
information to use as reference on energy consumption in different building uses, in a
variety of climatic conditions. The tools used in the above countries, include an online
annual building energy submission system that records utility bills by the building
owners.
The second step aims at identifying real life examples of built skyscrapers located
in the greater Tel Aviv area, and undertaking interviews with their architects, contactors
and city planning officers. Data on completed and proposed skyscrapers will be collected
and specific examples will be chosen to analyze in more detail. The parameters for the
selection, in addition to the above three categories, are: the construction completion date
(ensuring that the construction methods are up to date and that the final design complies
with Green Building Standards, in Israel), the tower height is over 100m, and that its
energy performance data are accessible. A good source of information in this process is
CTBUH homepage, and their website and offices in Tel Aviv.
An additional analytical tool comprises of thermal simulations. These will allow
to test scenarios in relation to energy consumption, during the cooling and heating
seasons, in order to ensure indoor thermal comfort (as per ASHRAE 55) The results will
be quantitatively analyzed and inform design decisions on the best possible scenarios
that combine energy efficiency and thermal comfort. However, the level of sophistication
a program has in terms of data and details input for getting close-to-reality predictions,
varies, and so may the results. The accuracy of the calculations depends on the data
input, but one also needs to keep in mind that what is more important are the trends
rather than the exact figures, which can be affected even by marginal mistakes or changes
of input data. Weather data are also an essential variable of the simulation process. They
interrelate the structure with the climate of the proposed location. By operating complex
28
thermodynamic equations the simulation program estimates the building’s behavior in
relation to the local weather. The real-life data of the weather file work with the data
input of the simulated building. So, the more detailed and analytical the building input
data, the closer to reality the results can be. This method of analysis provides the
flexibility to evaluate different design alternatives of a building’s final form, in an
economical and quick fashion (Nimlyat et al. 2014).
Highly sophisticated thermal simulation programs, like EnergyPlus, evaluate the
thermal transmittance of a building component by the following characteristics: thickness
(m), density (kg/m3), heat conduction (W/m K) and specific heat (J/ kg K),. EnergyPlus
also includes a variable in its calculations that estimates wind acceleration with height,
according to ASHRAE (2009) equation in Chapter 24: Air flow around Buildings, and air
temperature drop by elevation (EnergyPlus 2015c), which is an important aspect of this
research, making EnergyPlus the more widely accepted simulation engine.
Models of skyscrapers of different heights, e.g., 100m/200m/300m/400m tall (400m
high is considered a threshold in today’s urban environments), will be simulated and
energy consumption will be tested according to the three main variables: first, a design
strategy according to the building’s immediate environment (orientation, prevailing
winds); second, the thermal properties of the building envelope; and third, the effect of
height in energy performance.
The climatic characteristics of Tel Aviv, Israel, will be selected as the main location
for the simulations. Tel Aviv Municipality's Planning and Construction Committee
issued the 2025 city master plan that supports the construction of new sky-rise
development. Studying skyscraper construction in the Mediterranean climate of Tel Aviv
will provide information for many other Mediterranean as well as other Middle Eastern
cities, undergoing a similar process.
Finally, the simulation results will be compared against data of real life buildings
obtained through on-site monitoring and/or energy bills. These comparisons will be
possible for buildings that share similar data, e.g. building use, building height,
(possibly) location etc. This process will help to link the design of the skyscraper with its

29
energy consumption and will assist in the process of forming design strategies that relate
to its energy efficiency.
The further sub-division between the different building uses relates to the effect
that internal heat gains have on energy consumption, a topic mentioned above, e.g.
example of Bank of America tower, in New York. More specifically, the increased internal
heat gains of an office building, stemming from considerably higher numbers of users,
lighting and electrical appliances, needs a different envelope design for energy efficiency,
when compared to a residential one. In addition, the envelope design of a typical office
building has a much higher WWR than a residential one. The higher window area, as a
result, reduces the thermal mass of the structure and affects negatively energy
consumption by limiting the temperature damping effect thermal mass usually has.
The study of the above building uses, residential and office, and their
comparisons, will be very important in forming design strategies for the skyscraper’s
energy efficiency. An increasing number of skyscrapers today have a mix of residential
and offices. How this distinction may affect the structures envelope design for energy
efficiency will be an important section in this thesis.

30
F. TIMESCALE
Table 2. Diagrammatic four Year Plan of Work for PHD studies
31
REFERENCES
Ahmed, M.A. & El Monteleb, A.A. 2012,. Using simulation for studying the influence of vertical shading devices on the thermal performance of residential buildings (Case study: New Assiut City). Ain Shams Engineering Journal, 3(2), pp.163–174.
Ali, M.M., 2006. Strategies for Integrated Design of Sustainable Tall Buildings. University of Illinois at Urbana-Champaign School of Architecture, pp.1–22.
Architecture 2030, 2002. non-profit think tank. Available at: http://architecture2030.org/ ASHRAE 2004 - ANSI/ASHRAE Standard 55-2004, 2004. Thermal Environmental Conditions for
Human Occupancy, American Society of Heating, Refrigeration, and Air Conditioning Engineers. Altanta, GA.
ASHRAE, 2008. ASHRAE Vision 2020: Producing Net Zero Energy Buildings, Atlanta, GA. ASHRAE, 2009. Airflow around buildings. In ASHRAE, ed. ASHARE Fundamentals. American
Society of Heating, Refrigeration, and Air Conditioning Engineers. Altanta, GA. ASHRAE, 2013. Standard 90.1-2013. Energy Standard for Buildings Except Low-Rise Residential
Buildings. American Society of Heating, Refrigerating and Air-Conditioning Engineers, Inc., p.278. Barton, J. & Watts, S., 2013. Office vs. residential: The economics of building tall. CTBUH Journal,
(2), pp.38–43. Calhoun, K. & Torbert, R., 2013. The Bank of America Tower – What Is and What Could Have
Been. RMI OUTLET : plug into new ideas. Available at: http://blog.rmi.org/blog_2013_09_05_the_bank_of_america_tower [Accessed October 28, 2015].
Clark, T., 2016. Walkie Talkie wind complaints prompt City clampdown. , (January), pp.8–11. Concerted Action (CA) EPBD, 2014. Concerted Action | Energy Performance of Buildings
Directive. EPBD. Available at: http://www.epbd-ca.eu/ [Accessed January 28, 2016]. CTBUH, 2014. Best Tall Building Americas Winner: The Bank of America Tower, New York, USA.
Available at: http://www.ctbuh.org/LinkClick.aspx?fileticket=rLnhX4ylKRo=&tabid=2212&language=en-US.
Donnolo, M., Galatro, V. & Janes, L., 2014. Bank of America Tower at One Bryant Park: New York City, NY: Ventilation in Wonderland. High Performing Buildings, pp.51–58. Available at: http://www.hpbmagazine.org/attachments/article/11791/14Su-Bank-of-America-Tower-at-One-Bryant-Park-New-York-City-NY.pdf.
Ellis, P.G. & Torcellini, P.A., 2005. Simulating tall buildings using EnergyPlus. Ninth International Building Performance Simulation Association (IBPSA) Conference and Exhibition (Building Simulation 2005), (May).
EnergyPlus 8.4 : Input Output Reference, 2015. Outside Surface Heat Balance: Engineering Reference. bigladder Software. Available at: http://bigladdersoftware.com/epx/docs/8-4/engineering-reference/outside-surface-heat-balance.html#atmospheric-variation [Accessed January 18, 2016].
EU, 2013. REPORT FROM THE COMMISSION TO THE EUROPEAN PARLIAMENT AND THE COUNCIL. European Commission In COM(2013) 483 final/2. Brussels, p. 17.
FIG,2010. Rapid Urbanization and Mega Cities: The Need for Spatial Information Management. International Federation of Surveyors, C. 3.
Foraboschi, P., Mercanzin, M. & Trabucco, D., 2014. Sustainable structural design of tall buildings based on embodied energy. Energy and Buildings, 68(PARTA), pp.254–269.
Fox, J., 2011. Tel Aviv’s skyline in 2025. Sustainable City Blog. Available at: http://www.sustainablecityblog.com/2011/03/tel-avivs-skyline-in-2025/ [Accessed September 28, 2015].
Gensler, 2006. Faulty Towers: is the British Office Sustainable?, London. Available at: http://www.gensler.com/uploads/document/59/file/da3c78ba84e3e6abe1d04470c8c615b1.pdf [Accessed December 28, 2015].
Gifford, H., 2008. A Better Way to Rate Green Buildings. , pp.1–12. Available at: www.henrygifford.coom.
Girardet, H., 2006. Which way China? | Herbert Girardet - China Dialogue. Arup and SIIC. Givoni, B., 1969. Man Climate Architecture, New York: Van Nostrand Reinhold. Givoni, B., 1981. Man, Climate And Architecture, New York: Van Nostrand Reinhold. Glaeser, E., 2011. What’s so great about skyscrapers? In Triumph of the City: How Our Greatest
Invention Makes Us Richer, Smarter, Greener, Healthier, and Happier. New York: The Penguin Press, pp. 135–163.
Hang, J. & Li, Y., 2010. Ventilation strategy and air change rates in idealized high-rise compact urban areas. Building and Environment, 45(12), pp.2754–2767.
Hinge, A.W. & Winston, D.J., 2009. Documenting Performance: does it need to be so hard? HIGH
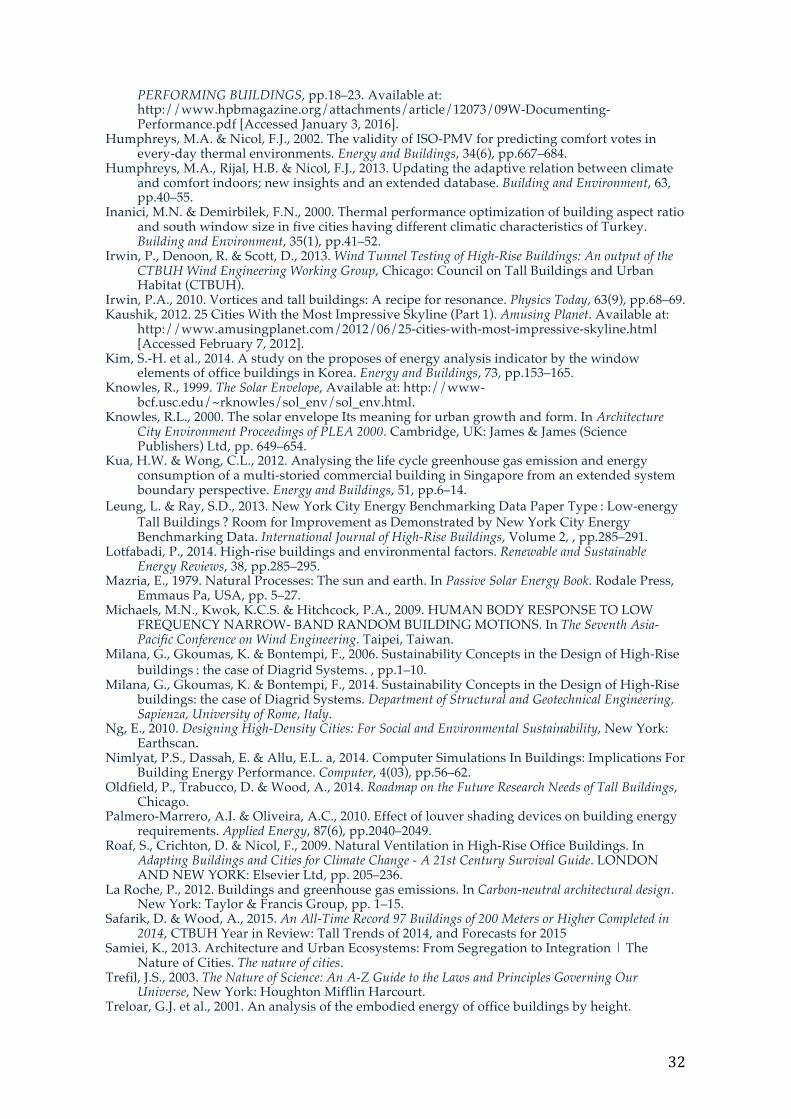
32
PERFORMING BUILDINGS, pp.18–23. Available at: http://www.hpbmagazine.org/attachments/article/12073/09W-Documenting-Performance.pdf [Accessed January 3, 2016].
Humphreys, M.A. & Nicol, F.J., 2002. The validity of ISO-PMV for predicting comfort votes in every-day thermal environments. Energy and Buildings, 34(6), pp.667–684.
Humphreys, M.A., Rijal, H.B. & Nicol, F.J., 2013. Updating the adaptive relation between climate and comfort indoors; new insights and an extended database. Building and Environment, 63, pp.40–55.
Inanici, M.N. & Demirbilek, F.N., 2000. Thermal performance optimization of building aspect ratio and south window size in five cities having different climatic characteristics of Turkey. Building and Environment, 35(1), pp.41–52.
Irwin, P., Denoon, R. & Scott, D., 2013. Wind Tunnel Testing of High-Rise Buildings: An output of the CTBUH Wind Engineering Working Group, Chicago: Council on Tall Buildings and Urban Habitat (CTBUH).
Irwin, P.A., 2010. Vortices and tall buildings: A recipe for resonance. Physics Today, 63(9), pp.68–69. Kaushik, 2012. 25 Cities With the Most Impressive Skyline (Part 1). Amusing Planet. Available at:
http://www.amusingplanet.com/2012/06/25-cities-with-most-impressive-skyline.html [Accessed February 7, 2012].
Kim, S.-H. et al., 2014. A study on the proposes of energy analysis indicator by the window elements of office buildings in Korea. Energy and Buildings, 73, pp.153–165.
Knowles, R., 1999. The Solar Envelope, Available at: http://www-bcf.usc.edu/~rknowles/sol_env/sol_env.html.
Knowles, R.L., 2000. The solar envelope Its meaning for urban growth and form. In Architecture City Environment Proceedings of PLEA 2000. Cambridge, UK: James & James (Science Publishers) Ltd, pp. 649–654.
Kua, H.W. & Wong, C.L., 2012. Analysing the life cycle greenhouse gas emission and energy consumption of a multi-storied commercial building in Singapore from an extended system boundary perspective. Energy and Buildings, 51, pp.6–14.
Leung, L. & Ray, S.D., 2013. New York City Energy Benchmarking Data Paper Type : Low-energy Tall Buildings ? Room for Improvement as Demonstrated by New York City Energy Benchmarking Data. International Journal of High-Rise Buildings, Volume 2, , pp.285–291.
Lotfabadi, P., 2014. High-rise buildings and environmental factors. Renewable and Sustainable Energy Reviews, 38, pp.285–295.
Mazria, E., 1979. Natural Processes: The sun and earth. In Passive Solar Energy Book. Rodale Press, Emmaus Pa, USA, pp. 5–27.
Michaels, M.N., Kwok, K.C.S. & Hitchcock, P.A., 2009. HUMAN BODY RESPONSE TO LOW FREQUENCY NARROW- BAND RANDOM BUILDING MOTIONS. In The Seventh Asia-Pacific Conference on Wind Engineering. Taipei, Taiwan.
Milana, G., Gkoumas, K. & Bontempi, F., 2006. Sustainability Concepts in the Design of High-Rise buildings : the case of Diagrid Systems. , pp.1–10.
Milana, G., Gkoumas, K. & Bontempi, F., 2014. Sustainability Concepts in the Design of High-Rise buildings: the case of Diagrid Systems. Department of Structural and Geotechnical Engineering, Sapienza, University of Rome, Italy.
Ng, E., 2010. Designing High-Density Cities: For Social and Environmental Sustainability, New York: Earthscan.
Nimlyat, P.S., Dassah, E. & Allu, E.L. a, 2014. Computer Simulations In Buildings: Implications For Building Energy Performance. Computer, 4(03), pp.56–62.
Oldfield, P., Trabucco, D. & Wood, A., 2014. Roadmap on the Future Research Needs of Tall Buildings, Chicago.
Palmero-Marrero, A.I. & Oliveira, A.C., 2010. Effect of louver shading devices on building energy requirements. Applied Energy, 87(6), pp.2040–2049.
Roaf, S., Crichton, D. & Nicol, F., 2009. Natural Ventilation in High-Rise Office Buildings. In Adapting Buildings and Cities for Climate Change - A 21st Century Survival Guide. LONDON AND NEW YORK: Elsevier Ltd, pp. 205–236.
La Roche, P., 2012. Buildings and greenhouse gas emissions. In Carbon-neutral architectural design. New York: Taylor & Francis Group, pp. 1–15.
Safarik, D. & Wood, A., 2015. An All-Time Record 97 Buildings of 200 Meters or Higher Completed in 2014, CTBUH Year in Review: Tall Trends of 2014, and Forecasts for 2015
Samiei, K., 2013. Architecture and Urban Ecosystems: From Segregation to Integration | The Nature of Cities. The nature of cities.
Trefil, J.S., 2003. The Nature of Science: An A-Z Guide to the Laws and Principles Governing Our Universe, New York: Houghton Mifflin Harcourt.
Treloar, G.J. et al., 2001. An analysis of the embodied energy of office buildings by height.

33
Facilities, 19(5/6), pp.204–214. U.S. Government Printing Office, 1976. U.S. Standard Atmosphere 1976, Washington, D.C.: National
Oceanic and Atmospheric Administration, National Aeronautics and Space Administration, United States Air Force.
UN DESA 2014. World’s population increasingly urban with more than half living in urban areas .United Nations Department of Economic and Social Affairs.
UN DESA, P.D., 2014. World Population Prospects The 2012 Revision Methodology of the United Nations Population Estimates and Projections, United Nations Department of Economic and Social Affairs. ESA/P/WP.235.
USGBC, LEED BD+C: Core and Shell v1 - LEED 1.0 pilot One Bryant Park. USGBU Directory. Available at: http://www.usgbc.org/projects/one-bryant-park [Accessed January 27, 2016].
Watts, S. & Langdon, D., 2010. Tall Buildings in Numbers: The Economics of High-rise (as per 2nd Quarter 2010). CTBUH Journal 2010, (Issue III).
Wei, Y. et al., 2016. An evaluation model for urban carrying capacity: A case study of China’s mega-cities. Habitat International, 53, pp.87–96.
WNA, 2015. Fukushima Accident. World Nuclear Association. Available at: http://www.world-nuclear.org/info/safety-and-security/safety-of-plants/fukushima-accident/ [Accessed December 2, 2015].
Yang, Q. et al., 2015. Impact Analysis of Window-Wall Ratio on Heating and Cooling Energy Consumption of Residential Buildings in Hot Summer and Cold Winter Zone in China. Journal of Engineering, 2015, p.17.
Yeang, K., 2008. Ecoskyscrapers and Ecomimesis : New Tall Building Typologies. CTBUH 8th World Congress, p.12.
Yeang, K. & Richards, I., 2007. Eco Skyscrapers I 3rd editio., Victoria: Images Publishing. Available at: https://books.google.com/books?id=QitFFq7Ybg0C&pgis=1 [Accessed January 3, 2016].
Yim, S.H.L. et al., 2009. Air ventilation impacts of the “wall effect” resulting from the alignment of high-rise buildings. Atmospheric Environment, 43(32), pp.4982–4994.