scaringi gianvito - phd thesis
TRANSCRIPT

Università degli Studi della Basilicata
Dottorato di Ricerca in
Rischio Sismico, Ingegneria Strutturale e Geotecnica
INFLUENCE OF PORE FLUID COMPOSITION
ON CLAY BEHAVIOUR AND CHEMO-MECHANICAL
STUDY OF A CLAYEY LANDSLIDE
Settore Scientifico-Disciplinare
ICAR/07
Coordinatrice del Dottorato
Prof.ssa Caterina Di Maio
Tutor
Prof.ssa Caterina Di Maio
Dottorando
Dott. Gianvito Scaringi
A.A. 2014/2015, Ciclo XXVIII

To my family

ACKNOWLEDGEMENTS
I would like to thank first and foremost my advisor, Prof. Caterina Di Maio. Her
advice, guidance, support and inspiration were fundamental throughout my
undergraduate and graduate studies and in each achievement of this research.
Thanks are also due to Prof. Roberto Vassallo for his precious advices, his critical
point of view and his constant support.
I would also like to thank Dr. Angela Perrone and Dr. Enzo Rizzo of the CNR-IMAA
Institute for kindly lending their testing equipment and for helping me in the
interpretation of the test results. Thanks are also due to Prof. Paolo Simonini and Prof.
Simonetta Cola of the University of Padova for the X-ray tomography on laboratory
specimens, to Prof. Salvatore Masi and Mr. Domenico Molfese for the ICP-AES
analyses of fluid samples and to Mr. Alessandro Laurita for the ESEM micrographs.
Special thanks are due to the technical staff, to the undergraduate and graduate
temporary members of the geotechnical research unit and to my doctoral colleagues,
with whom I had the pleasure to collaborate and with whom I shared a piece of my
scientific and personal growth. Last, but not least, I wish to thank my better half, my
family and my friends for their continuous support and encouragement.

SUMMARY
Abstract .................................................................................................................................. 1
1 Introduction .................................................................................................................... 2
2 Influence of pore fluid composition on clay behaviour ................................................. 5
2.1 State of the Art ........................................................................................................ 6
2.2 Experimental results relative to the Costa della Gaveta soil ............................... 23
2.2.1 Residual shear strength .................................................................................. 23
2.2.2 Observation of the shear surface .................................................................... 36
3 Influence of pore fluid composition on creep behaviour ............................................. 42
3.1 Shear creep: a brief overview of the phenomenon ............................................... 43
3.2 Experimental results relative to the Costa della Gaveta soil ............................... 49
3.2.1 Stress-controlled shear tests on the Costa della Gaveta soil ......................... 49
3.3 Experimental results relative to other clays ......................................................... 58
3.3.1 Stress-controlled shear tests on bentonite ...................................................... 58
3.3.2 Water content and pore ion concentration at the end of the tests .................. 77
3.4 Modelization of ion diffusion and strength reduction .......................................... 80
3.5 Discussion ............................................................................................................. 89
4 Pore fluid composition in clays of marine origin ........................................................ 91
4.1 Data from Literature .............................................................................................. 92
4.2 Pore fluid composition at Costa della Gaveta ................................................... 103
4.3 Electrical resistivity of the system solid skeleton – pore fluid ........................... 113
5 Conclusion ................................................................................................................. 120
References .......................................................................................................................... 122

1
ABSTRACT
This work reports on experimental results aimed at evaluating the influence of pore
solution composition on some aspects of clay behaviour. Besides some pure clays, the soil
of Costa della Gaveta hill (Potenza, Italy) has been analysed trying to understand the
implications of test results on the behaviour of the landslides there occurring.
Several shear tests have been carried out, both under controlled rate of displacement, to
evaluate the influence of pore fluid composition on the residual shear strength, and under
constant shear stresses, to evaluate the rheological behaviour of the soil along a slip surface
in residual condition when subjected to changes in pore fluid composition. The
composition of the pore fluid is shown to affect the residual shear strength of the tested soil
noticeably. The tests carried out under constant shear stresses showed that a pore solution
concentration decrease can produce an increase in displacement rate on a pre-existing slip
surface with a pattern typical of tertiary creep.
The natural pore fluid composition of the Costa della Gaveta soil was evaluated on a large
number of samples, both by chemical and by electrical analyses. Some preliminary
evaluations of the electrical resistivity of the system solid skeleton – pore fluid were made
as well. The natural pore fluid is shown to be a composite ion solution, in which Na+ is the
most abundant cation. Its concentration decreases noticeably from the depth towards the
ground surface, from values close to that of seawater to negligible values. The
concentration range evaluated in situ corresponds to the range in which the greatest
gradients in the residual friction angle have been evaluated.

2
1 INTRODUCTION
The composition of the pore fluid affects the mechanical behaviour of clays significantly
(e.g. Bolt, 1956; Kenney, 1967; Mesri and Olson, 1971; Mitchell et al., 1973; Sridharan
and Ventakappa Rao, 1973; Di Maio, 1996a, 1998). Several studies, in particular, showed
the great influence that the pore fluid composition exerts on the residual shear strength
(among others: Kenney, 1967; Chattopadhyay, 1972; Sridharan and Ventakappa Rao,
1979; Sridharan, 1991; Di Maio and Fenelli, 1994; Di Maio, 1996b; Anson and Hawkins,
1998).
The residual shear strength is the minimum strength that a soil can exhibit, under a definite
normal stress, after large displacements along a regular slip surface (e.g. Skempton, 1985).
Its evaluation is thus very important in engineering problems concerning slope stability and
in predicting landslide movements. Changes in the available strength due to pore pressure
variations induced by changing hydraulic boundary conditions are generally accounted for
in such problems, while the influence of pore fluid composition is often neglected,
although its effects can be dramatic.
The composition of the pore fluid of clays in nature can vary, in space and in time, due to
different natural and anthropic processes (e.g. Bjerrum, 1954; Rosenqvist, 1955; Quigley et
al., 1983; Pearson et al., 2003; Torres et al., 2011). The mechanical properties can thus
change and, consequently, affect soil stability and landslide movements, as shown, for
instance, by Gregersen (1981), Moore and Brundsen (1996), Geertsema and Torrance
(2005), Zhang et al. (2009) and Zhang et al. (2013).
This work reports on experimental results aimed at characterising the natural pore fluid
composition in a clayey slope affected by landslides, and at evaluating the influence of
pore fluid composition on the residual shear strength and on the rheological behaviour of

1. Introduction
3
the soil along the slip surface. To this aim, the case study of the Costa della Gaveta slope
(Di Maio et al., 2010, 2011, 2012, 2013), located in the Southern Italian Apennines, was
considered. Costa della Gaveta hill is formed by a marine origin clay formation, locally
known as the Varicoloured Clays. The hill is affected by several different landslides.
The homonymous Costa della Gaveta landslide, a very slow earthflow in steady state
motion (Hungr et al., 2014) involves a volume of 6 million cubic metres soil, with
displacements concentrated in a narrow shear zone in the residual condition, which reaches
a depth of about 40 m (Di Maio et al., 2010). Several aspects of the landslide behaviour
have been studied, such as: the response of pore pressures to rainfall and their effects on
landslide displacements, the time trend of displacements on the shear surface and of
deformations in the landslide body, and the possible triggering factors (Di Maio et al.
2010; Vassallo et al. 2012; Di Maio et al. 2013; Vassallo et al., 2015a). More recently, the
research has also been focused on the characterisation of the natural pore fluid composition
and on its role in the mechanical behaviour of the soil (Di Maio et al., 2015a, 2015b; Di
Maio and Scaringi, 2015).
The Varco d’Izzo landslide, located a few hundred metres East of the Costa della Gaveta
landslide, is a wider – more than 1 km large – and complex landslide system whose
movements cause severe damage to houses and infrastructures, with very different rates of
displacement from site to site (Di Maio et al., 2012). An earthflow within the landslide
system also affects a 200 m long railway tunnel. The interaction between this latter and the
landslide body is currently under study (Vassallo et al., 2015b). The area is being
monitored through several inclinometers, GPS stations and piezometers (Di Maio et al.,
2011, 2012; Calcaterra et al., 2012).
The results of laboratory tests, for the evaluation of the residual shear strength of the Costa
della Gaveta material with different pore solutions, are reported in Chapter 2. Several
direct and ring shear tests were carried out on reconstituted specimens in absence of
chemical gradients between the pore fluid and the cell fluid. Some other tests were carried
out in order to evaluate the behaviour of the soil when subjected to a decrease or to an
increase in pore fluid ion concentration. Some first observations by means of X-ray
tomography and ESEM microscopy have been performed after the shear tests to
characterise the soil along the slip surface.

1. Introduction
4
In Chapter 3 the influence of pore fluid composition on creep behaviour is studied by
means of stress-controlled tests on pre-sheared specimens of the Costa della Gaveta soil.
Tests results relative to a sodium bentonite are also reported in order to attempt a
generalisation of the results. During the course of the tests, the specimens were exposed to
distilled water in order to simulate a process of pore ion concentration decrease. Often, the
specimens were analysed after the tests in order to determine water content and ion
concentration profiles along the specimen’s height.
In Chapter 4, the results relative to the experimental evaluation of the natural pore fluid
composition of the Costa della Gaveta soil are reported. Both chemical and electrical
analyses have been carried out on the pore fluid and some first electrical resistivity
measurements were performed on many undisturbed specimens, reconstituted specimens
and slurries. In situ electrical resistivity tomographies were also carried out.

5
2 INFLUENCE OF PORE FLUID
COMPOSITION ON CLAY BEHAVIOUR
The residual shear strength is the minimum strength that a soil can exhibit under a given
normal stress. It is generally the available shear strength on the slip surface of active
landslides which have experienced large displacements along a regular slip surface
(Skempton, 1985). A reliable evaluation of the residual shear strength is thus essential in
stability analyses and for predicting landslide displacements.
The first part of this Chapter is a review of some of the main studies on the influence of
pore fluid composition on the residual shear strength. Then, the Chapter reports on the
results of a number of laboratory tests carried out in this work to investigate the influence
of pore fluid composition on the residual shear strength of the Costa della Gaveta soil. To
this aim, several direct and ring shear tests were performed.
The residual shear strength of a soil is greatly influenced by the mineralogy of its clay
components. Such influence is here analysed by comparing the results of tests carried out
on different clays.
The Chapter also reports on the results of ESEM and X-ray observations of sheared
specimens, carried out in order to observe the soil fabric in the shear zone and on the slip
surface.

2. Influence of pore fluid composition on clay behaviour
6
2.1 STATE OF THE ART
The chemical composition of the pore fluid influences several aspects of the mechanical
behaviour of clays, such as volume change, hydraulic conductivity, swelling pressure,
osmotic efficiency and shear strength.
Experimental results regarding, in particular, the residual shear strength were reported,
among others, by Kenney (1967), Ventakappa Rao (1972), Balasubramonian (1972),
Chattopadhyay (1972). In the following years, different Authors (e.g. Sridharan and
Ventakappa Rao, 1979; Moore, 1991; Di Maio and Fenelli, 1994; Di Maio, 1996a,b;
Anson and Hawkins, 1998; Tiwari et al., 2005) pointed out the influence of pore fluid
composition and ion concentration on the residual shear strength of different clays. The
Authors also gave interpretations of their results, attempting to consider them in a unique
framework which could be suitable for different clays and/or be able to explain also the
influence on other mechanical aspects comprehensively.
Sridharan and Ventakappa Rao (1979) investigated the drained shear strength of kaolinitic
and montmorillonitic clays prepared with different pore fluids (i.e. distilled water and
various organic fluids). Figure 2.1, for example, shows the results relative to specimens of
compacted kaolinite: the influence of the used fluid is evident. The Authors interpreted the
results as a function of the dielectric constant of the pore fluid and observed that both for
kaolinitic and for montmorillonitic clays the shear strength seemed to decrease when the
dielectric constant increased, as shown by Figure 2.2. Furthermore, the results were found
consistent with a modified effective stress concept accounting for electrical attractive and
repulsive interparticle forces (among others: Bolt, 1956; Lambe, 1960; Sridharan, 1968;
Sridharan and Ventakappa Rao, 1973).
In order to evaluate the influence of pore fluid composition on the residual shear strength,
Chatterji and Morgestern (1989) performed shear tests on specimens of Na-
montmorillonite prepared with a concentrated (33.6 g/l) NaCl solution and subsequently
leached with distilled water. Similarly to Sridharan and Ventakappa Rao (1979), they
interpreted the results in terms of a modified effective stress concept accounting, in

2. Influence of pore fluid composition on clay behaviour
7
particular, for the repulsion force in the diffuse double layer (DDL; Gouy, 1910; Chapman,
1913). The Authors showed that, by this concept, it is possible to find a unique value of
residual friction angle which is independent of pore fluid salinity, as shown by Figure 2.3.
The Authors also reported that, for clays such as kaolinite, being the DDL repulsion forces
lower, the residual shear strength does not appear to be influenced by pore fluid
composition significantly.
Figure 2.1 Drained shear strength of statically compacted kaolinite prepared with different
fluids (Sridharan and Ventakappa Rao, 1979).

2. Influence of pore fluid composition on clay behaviour
8
Figure 2.2 Shear strength normalised with respect to the normal pressure against the
dielectric constant of the used pore fluid for specimens of kaolinite (left) and
montmorillonite (right) (Sridharan and Ventakappa Rao, 1979).
Figure 2.3 Residual shear strength against true effective stress in the formulation by
Chatterji and Morgernstern (1989) for specimens of sodium montmorillonite prepared with
a concentrated NaCl solution, before and after leaching with distilled water.
Some decades earlier, the DDL concept had been used by Bolt (1956) to predict the
volume change behaviour of clays. The Author interpreted the compression behaviour of
montmorillonite and illite in salt solutions at different concentrations and provided a
relation between the void ratio, e, and the swelling pressure, p. The two quantities were
related to the specific surface of the clay, the interparticle distance, the ion concentration at
mid-plane between two particles and the ion concentration in the bulk solution.
Subsequently, Mitchell (1960) investigated the volume change behaviour of Na-kaolinite,
Na-illite and Na-montmorillonite. He concluded that the DDL theory is not applicable to

2. Influence of pore fluid composition on clay behaviour
9
all clays, but only to those containing clay particles of diameter smaller than 0.2-1.0 µm. A
detailed study on the applicability of the DDL theory was also conducted by Sridharan and
Jayadeva (1982), who showed that the e – log p relation is primarily controlled by the
specific surface of the clay. Furthermore, they evaluated that the contribution of the Van
der Waals attractive forces is negligible if compared to the repulsion forces caused by the
interacting diffuse double layers in the range of pressures in engineering practice. The
DDL concept was also used by Olson and Mesri (1970) and Mesri and Olson (1971), and
proved to work satisfactorily in interpreting the consolidation curves of artificially
sedimented Na-montmorillonite, consolidated in water or in solutions of NaCl at different
concentrations (Figure 2.4). They showed the remarkable difference of void ratio against
the normal effective stress for specimens saturated with different fluids and also noticed
that the clay, when prepared with some organic fluids, exhibited much lower void ratios
and much higher hydraulic conductivities (4-6 orders of magnitude!) than when prepared
with water.
Figure 2.4 Void ratio against normal applied stress for specimens of Na-montmorillonite
saturated with NaCl solutions at different concentrations (Mesri and Olson, 1971).

2. Influence of pore fluid composition on clay behaviour
10
The link between the DDL concept and the dielectric constant of the pore fluid in
explaining the mechanical behaviour of clays was shown with respect to the volume
change behaviour by Sridharan and Ventakappa Rao (1973). The Authors recognised two
mechanisms related to the clays’ microstructure, i.e. the shearing resistance at the contact
points, on which shear displacements and/or sliding between particles depend, and the
long-range electrical repulsive forces, on which the DDL behaviour depends. The former
mechanism was found to prevail in kaolinite, while the latter in montmorillonite. Chen et
al. (2000) observed that the compression index of kaolinite changes with the dielectric
constant of the organic fluids in a way similar to the Hamaker constant, on which the
attractive van der Waals forces depend and shows a minimum at D = 24. Similar results
were found by Moore and Mitchell (1974). Calvello et al. (2005) reported evidence of the
dependence of the compression index, coefficient of consolidation and hydraulic
conductivity on the pore fluid dielectric constant also for smectitic clays (Figure 2.5).
However, the relations between clay properties and dielectric constant appeared different
than those found for kaolinite, thus possibly highlighting the different mechanisms
controlling the compressibility of the two clays.
Di Maio (2004a) and Calvello et al. (2005) analysed the residual shear strength of different
smectitic soils prepared with water, salt solutions or organic fluid in terms of the dielectric
constant of the pore fluid. They found that residual strength decreases with the dielectric
constant increasing up to D = 80 (Figure 2.6). It is worth noting that a non-polar organic
fluids, such as cyclohexane, with very low dielectric constant, produced the same
behaviour as that of dry specimens.

2. Influence of pore fluid composition on clay behaviour
11
Figure 2.5 Compression index, Cc, normalized with respect to that of materials
reconstituted with distilled water, against pore fluid static dielectric constant, D, for Na-
montmorillonite (Calvello et al., 2005).
Figure 2.6 Residual friction coefficient τr/σ’n against the pore fluid static dielectric
constant D for different smectitic soils (Calvello et al., 2005).

2. Influence of pore fluid composition on clay behaviour
12
Furthermore, Di Maio et al. (2004) performed a large number of oedometer tests on
different natural soils containing smectite, illite and kaolinite and on some of their
mixtures. The materials were reconstituted with – and submerged in – water, salt solutions
or organic fluids. The Authors found a good agreement between the intrinsic compression
index against the void ratio at the liquid limit and the regression line found by Burland
(1990), both for soils prepared with water and for soils prepared with salt solutions (Figure
2.7). According to the Authors, this suggests that the liquid limit (which is a measure of the
soil strength under standardised conditions) can be a reference state to predict the
compression behaviour, in the range of validity of the relation, also with pore fluids
different from water.
Figure 2.7 Intrinsic compression index Cc* against void ratio eL at liquid limit. For each
materials the values of Cc* obtained with different pore solutions are reported (Di Maio et
al., 2004).
Di Maio and Fenelli (1994) published the result of direct shear tests carried out on a
sodium bentonite reconstituted with distilled water and sheared to the residual condition
while in a bath of distilled water. The specimen was subsequently exposed to a
concentrated NaCl solution. This caused a progressive and noticeable increase in the shear
strength (Figure 2.8). Subsequent re-exposure to water produced a progressive shear
strength decrease down to the value attained before exposure to the salt solution. The
effects on the residual sear strength of the exposure to NaCl solutions of sodium bentonite

2. Influence of pore fluid composition on clay behaviour
13
are thus reversible. The test was repeated on a specimen of kaolin, which did not exhibit
any strength variations. Tests conducted on mixtures of bentonite and kaolin showed that
the strength variation due to the exposure to salt solution is remarkable for bentonite
contents as low as 25% in dry weight, under the investigated normal stress, meaning that
such a percentage is able to control the residual shear strength of the mixture.
Di Maio and Fenelli (1997), performing several compression tests with exposure to
different fluids on specimens of natural soils containing different clay minerals, showed
that the influence of pore fluid composition is very significant for soils containing smectite.
The Authors thus stressed the importance of using the appropriate pore fluid when
evaluating the possible mechanical behaviour in situ. In fact, if a specimen of a soil whose
natural pore fluid is a salt solution is tested in a bath of distilled water, it can exhibit a
behaviour which can differ significantly from that in situ, due to possible transient
phenomena (e.g. ion diffusion, osmotic water flow) occurring in the course of the test.
Di Maio (1996a) showed the remarkable effects of the exposure of a sodium bentonite to a
fluid different from its pore fluid and Di Maio (1996b) showed similar effects for several
natural soils containing montmorillonite. Among the results of the direct shear tests, Di
Maio (1996a) reported those relative to two specimens (see Figure 2.9), one reconstituted
with a concentrated NaCl solution and sheared to the residual condition while submerged
in the same solution (specimen 1a) and another reconstituted with water and sheared to the
residual condition while submerged in water (specimen 1b). Their residual shear strength
resulted very different: τr/σ’n ≈ 0.1 in water and τr/σ’n ≈ 0.3 in salt solution. Specimen 1b,
initially in water, was then exposed to the salt solution, showing a progressive strength
increase. Conversely, specimen 1a, initially in salt solution, was exposed to water, showing
a progressive strength decrease. At the end of the process, the specimen exposed to water
had reached the same strength as that reconstituted with – and submerged in – water, while
the specimen exposed to the salt solution had reached the same strength as that
reconstituted with – and submerged in – the salt solution. This was considered a further
confirmation of the reversibility of the effects of NaCl solutions on sodium bentonite, this
time proved also on a specimen reconstituted with the salt solution.

2. Influence of pore fluid composition on clay behaviour
14
Figure 2.8 Shear trends of bentonite, sheared in water and then exposed to NaCl solution
and finally to water again (Di Maio and Fenelli, 1994).

2. Influence of pore fluid composition on clay behaviour
15
τ/ σa
sh
ea
r dis
pla
cem
en
ts (m
m)
Figure 2.9 Shear trends of bentonite specimens first mixed or exposed to saturated NaCl
solution, and then to water (Di Maio, 1996a).

2. Influence of pore fluid composition on clay behaviour
16
A different behaviour was observed with the exposure of water saturated Na-bentonite to
CaCl2 and KCl solutions. Both solutions produced a progressive residual shear strength
increase, but the subsequent re-exposure to water did not cause but a negligible shear
strength decrease. Di Maio (1996a) showed that the irreversibility is exhibited also in terms
of volume changes. During the course of oedometer tests, the Author showed in fact that if
a specimen of sodium bentonite reconstituted with water is exposed to a NaCl solution, it
exhibits a volume decrease under constant Terzaghi’s effective stresses. If, afterwards, the
specimen is re-exposed to water, it undergoes a volume increase (Figure 2.10), the
magnitude of volume changes depending on Terzaghi’s effective stresses. On the contrary,
the effect of the exposure to CaCl2 solutions were non-reversible upon re-exposure to
distilled water (Figure 2.11). Similarly, irreversibility was observed after exposure to KCl
solutions. This was attributed to ion-exchange which probably transformed the Na-
montmorillonite into K-montmorillonite or Ca-montmorillonite, which are characterised by
smaller double layers. Di Maio (1998) showed the possibility of reversing the exchange
reaction by re-exposing the specimens to concentrated NaCl solutions and then to water
(Figure 2.11), but discussed that such process is unlikely to occur in nature, thus
introducing a possible long lasting chemical treatment to improve the mechanical
characteristics of the clay.
Regarding the influence of pore fluid ion concentration, Di Maio (1996a) showed that most
of variations in the residual shear strength of sodium bentonite with respect to NaCl
solutions occur in the range 0-1 mol/l, while the residual shear strength does not change
significantly for concentrations from 1 mol/l to saturation. The same trend was observed on
the liquid limit against NaCl concentration, i.e. wL decreases noticeably from water to 1
mol/l NaCl solution, while does not vary much for higher concentrations. Such dependence
of the residual shear strength on the solution concentration was confirmed by Di Maio
(2004a) on several natural soils containing montmorillonite (Figure 2.12).

2. Influence of pore fluid composition on clay behaviour
17
Figure 2.10 Consolidation produced by exposure to NaCl solution and swelling caused by
exposure to water under two different normal stresses (Di Maio, 1996a).
Figure 2.11 Volume change due to mechanical consolidation and exposure to NaCl
solution, CaCl2 solution and water (Di Maio, 1998).

2. Influence of pore fluid composition on clay behaviour
18
Figure 2.12 Residual shear strength against NaCl solution molarity for different clay soils
under σ’n = 200 kPa (Di Maio, 2004a).
Xu et al. (2014) have recently proposed a new definition for the effective stress which, in
particular, was used to interpret the volume change behaviour of smectitic clays. They
assumed that the clay surface has a fractal dimension, D. A modified effective stress pe was
defined, which takes into account this fractal dimension. By means of this concept, they
found a unique relation between the void ratio e and pe which is insensitive to pore fluid
composition and applied such relation to different smectitic soils. Figure 2.13 shows the
void ratio against such modified effective stress for two soils: the Bisaccia clay (data from
Calvello et al., 2005) and the Ponza bentonite (data from Di Maio et al., 2004) with water
and different NaCl solutions. The e-pe relation predicted by the model, represented by the
solid lines in the figure, seems to agree with the experimental data for concentrations up to
saturation. However, this relation does not prove satisfactory in predicting the residual
shear strength at NaCl concentrations higher than 1 mol/l, as shown by Figure 2.14. This
suggests that, at high concentrations, the shear resistance is limited by other phenomena
rather than electrostatic forces of the DDL.

2. Influence of pore fluid composition on clay behaviour
19
Figure 2.13 Void ratio against modified effective stress for two smectite rich clays with
different pore fluids (Xu et al., 2014).
0 1000 2000 3000pe (kPa)
water0.1 M NaCl0.6 M NaClsaturated NaCl
Bisaccia clay
0
20
40
60
80
100
120
0 1000 2000 3000
τr(k
Pa)
pe (kPa)
water0.2 M NaCl0.5 M NaCl1M NaClsaturated NaCl
Ponza bentonite
Figure 2.14 Residual shear strength against the modified effective stress defined by Xu et
al. (2014) for the Ponza bentonite and the Bisaccia clay (data from: Di Maio, 2004a; Di
Maio et al., 2004; Calvello et al., 2005).
Di Maio and Onorati (2000) showed that the pore fluid composition has a remarkable
influence also on the shear strength determined by means of triaxial tests. The Authors
performed CiU triaxial tests on normally consolidated (see Figure 2.15) and
overconsolidated specimens of the montmorillonitic Bisaccia clay. Important effects of
pore fluid composition were noticed, more recently, by Zhang et al. (2013) on the
undrained shear strength, by Siddiqua et al. (2014) on the stress-strain behaviour during
triaxial tests and by Gratchev and Sassa (2013) on the cyclic shear behaviour. The latter
Authors performed also some tests by using pore fluids characterised by different values of
pH.

2. Influence of pore fluid composition on clay behaviour
20
0
100
200
300
400
0 200 400 600p' (kPa)
q (k
Pa)
distilledwater
1 M NaClsolution
0 200 400 600
0
σ' (kPa)
τ (k
Pa)
70
140
210
350280 1 M NaCl
solutiondistilledwater
420
Figure 2.15 CU triaxial tests on normally consolidated specimens of the Bisaccia clay (Di
Maio and Onorati, 2000).
As for the influence of pH on the mechanical behaviour of clays, Suarez et al. (1984)
showed the effects on hydraulic conductivity and clay structure. The effect of pH is
particularly important in practice when contaminated soils, e.g. by acid leachate, are
considered. Also Palomino and Santamarina (2005) investigated the effect of pH on clay
structure. They produced a fabric map for kaolinite as a function of pore solution
concentration and pH, highlighting the changes in particle arrangement and surface charge.
Gajo and Maines (2007) showed that acid solutions influence both the volume change
behaviour and the residual shear strength of sodium bentonite. In particular, the residual
shear strength evaluated in acid solutions is higher than that in water (Figure 2.16). The
effects of exposure to an acid solution (i.e. to H+ cation) are similar to those of other
cations different from Na+. They do not appear reversible by re-exposing the specimens to
water, like those of calcium and potassium chloride, but can be reversed by exposing the
clay to a basic solution. The results of the shear tests, as well as those relative to
compression tests, were interpreted by the Authors with the concepts of cation exchange on
permanently charged surface sites and of acid-base reactions on variably charged sites.
According to the Authors, some aspects of the chemo-mechanical interaction of active
clays subjected to pH variations of the pore fluid can actually be roughly described without
considering the acid–base reactions, whereas the effects of exposure first to an inorganic
acid and then to bases or salts cannot be understood without taking the role of acid–base
reactions at the clay edges into account.

2. Influence of pore fluid composition on clay behaviour
21
Figure 2.16 Residual shear strength as a function of normal effective stress on shear plane
raised to power of -1/3 (Gajo and Maines, 2007).
Wahid et al. (2011a,b) showed that the mechanical behaviour of kaolin is influenced by pH
much more than by pore fluid salinity. This was attributed to the major role played by the
variably charged sites, which affects edge-to-face particle interaction and can thus produce
irreversible strains. Additional examples of the influence of pH, with respect to the
compressibility of natural clays are reported, for example, by Gratchev and Towhata
(2011, 2015) for different clay formations in Japan containing different amounts of
smectite, illite, chlorite and kaolinite. Finally Zhao et al. (2011) reported that, in addition,
acid solutions could influence the residual shear strength of clays by changing the clay type
(from illite to smectite to kaolinite).
The influence of pore fluid composition on the residual shear strength has a practical
importance in slope stability, since can play a major role in the reactivation and
movements of landslides in clay soils. Furthermore, as pointed out by Di Maio et al.
(2015a) and similarly to what already suggested by Di Maio and Fenelli (1997), the
evaluation of the available residual shear strength along slip surfaces in clay soils should
be done taking into account also the natural pore fluid composition, i.e. by considering the

2. Influence of pore fluid composition on clay behaviour
22
soil as a solid skeleton – pore fluid system governed by a chemo-mechanical coupling. As
a matter of fact, the Authors showed that the use of distilled water as pore fluid and cell
fluid during the tests can lead to an estimation of a value of residual shear strength which is
different from that available in situ. Furthermore, the use of a unique value of residual
friction angle in stability analyses may be misleading even in soils which are
“homogeneous”, if the pore fluid composition is not homogeneous.

2. Influence of pore fluid composition on clay behaviour
23
2.2 EXPERIMENTAL RESULTS RELATIVE
TO THE COSTA DELLA GAVETA SOIL
2.2.1 Residual shear strength
The residual shear strength was evaluated in the course of displacement-controlled shear
tests by means of different apparatuses: the Casagrande and the reversal direct shear, and
the Bishop and the Bromhead ring shear. The tests were usually performed at v = 0.005
mm/min in the Casagrande, reversal and Bishop apparatuses and at v = 0.018 mm/min in
the Bromhead apparatus, which is the lowest displacement rate that the machine in use
allows.
Since the object of the study is the residual state, which is independent of initial conditions
and stress history, the specimens were prepared by hydrating the powdered, oven-dried,
material (fraction finer than 0.425 mm) at water contents generally lower than the liquid
limit relative to the material hydrated with the used fluid. This was done in order to reduce
the volume decrease due to consolidation and the consolidation time as well.
In some cases, the specimens tested in the Casagrande, reversal and Bishop devices were
cut manually, both before and during the course of the tests, to ensure the flatness of the
shear surface and to reduce the time required to achieve the residual state.
In order to investigate the effect of the pore fluid composition, two groups of tests were
conducted: 1. some specimens were reconstituted with salt solutions at different
concentration and tested in a bath of the same solution, that is, in absence of chemical
gradients; 2. some specimens, pre-sheared to the residual condition, were exposed to a
fluid different from the pore fluid by replacing the cell fluid, i.e. the tests were carried out
in presence of chemical gradients.
The tests were performed on several specimens of the Costa della Gaveta soil. The
material was extracted from different boreholes, whose locations are indicated in Figure
2.17. For comparison, some tests were conducted also on specimens of a sodium bentonite
and of a kaolin.

2. Influence of pore fluid composition on clay behaviour
24
N
Potenza
Costa della Gaveta
landslide
Varco d’Izzo
landslide
Ii: inclinometer casings
Pi, Si, TP, CP: boreholes with piezometers
TM, TV: boreholes with tensiometers
Ki: boreholes
centre of ERT2
0 250 500 m
I11
S11
S9
S5
I5
S4
I4I3
S3
I2
S2
S1
I1
S8I8 I7
S7
I10
I9
I12
P12 S10
I6
S6
Figure 2.17 Portion of the Costa della Gaveta slope with location of the boreholes.

2. Influence of pore fluid composition on clay behaviour
25
Some properties of the tested materials are reported in Table 2.1. The Costa della Gaveta
soil is characterised, in general, by high clay fraction. The clay minerals are abundant and,
among them, illite-muscovite, kaolinite and smectite were found (Summa, 2006). The
chosen bentonite, provided by Laviosa Minerals SpA, Livorno, Italy, is mainly composed
of sodium montmorillonite and exhibits characteristics very similar to those of the Ponza
bentonite, which was used in past experimentations extensively (e.g. Di Maio, 1996a;
Calvello et al., 2005) and was the reference soil for constitutive modelling (e.g. Gajo and
Loret, 2003). The used kaolin is mainly composed of kaolinite and is sold by Imerys Ltd,
UK, under the trademark Speswhite.
Material
Borehole-
Sample Depth (m)
c.f.
(%)
γγγγs
(g/cm3)
wL
(%)
wP
(%)
IP
(%)
A
Costa della
Gaveta soil
S7-CD2 28.0 - 29.6 52 2.67 65.2 26.2 39.2 0.75
S9-MIX 23.5 – 24.8 45 - 55.9 - - -
S9-A 24.0 – 24.8 48 2.66 64.3 - - -
S9-CD18 24.8 – 25.0 46 - 51.8 - - 0.52
S9-B 25.2 - 27.2 36 2.65 53.9 - - -
I9b-CD9bis 8.3 - 8.6 35 2.58 55.6 - - -
I9b-CD12 11.5- 11.7 - - 61.0 - - -
I9b-A 11.7 - 12.4 - - 64.9 - - -
I9b-CD12 11.5 - 11.7 - - 60.9 - - -
I9c-CD18 4.00 - 4.35 33 2.67 77.8 28.6 49.2 1.49
S10-CD20 9.3 – 9.5 47 - 65.4 - - 0.52
I15-CD6 18.3 60 2.52 123 46.9 76.1 1.27
Bentonite - - 82 2.75 324 44.8 279.2 3.4
Kaolin - - 75 2.60 66.8 32.9 33.9 0.45
Table 2.1 Physical properties and Atterberg limits of the tested soils.
In order to get some preliminary information on the influence of pore fluid composition on
the behaviour of the tested soils, their liquid and plastic limits were evaluated by hydrating
the materials both with distilled water and with various salt solutions at different
concentrations. The results are shown in Figure 2.18 against the molarity of the used
solution. It can be seen that the liquid limit of the Costa della Gaveta soil does not vary
with the pore solution concentration significantly. Only one sample (I15-CD6),

2. Influence of pore fluid composition on clay behaviour
26
characterised by a liquid limit in water sensibly higher than that of the others, shows to be
significantly influenced by the used fluid, probably because of a different clay mineralogy.
The liquid limits in NaCl and in KCl solutions seem consistent to one another. The liquid
limit of the tested bentonite is influenced by the used fluid noticeably. The values decrease
noticeably in the range 0-1 mol/l, independently of the used solution, while much smaller
variations are seen at higher concentrations. Only small effects of pore solution
concentration are evaluated for the tested kaolin.
0
50
100
150
200
250
300
350
0 1 2 3 4 5 6
wL
(%)
solution molarity (M)
NaCl
KCl
CaCl2.6H2O
MgCl2.6H2O
NaClKClCaCl2⋅6H2OMgCl2⋅6H2O
wP NaCl
Bentonite
0
50
100
150
200
250
300
350
0 1 2 3 4 5 6
wL
(%)
solution molarity (M)
S9-A I9b-AI9b-CD12I15-CD6
Costa della GavetaNaCl solutions
0 1 2 3 4 5 6solution molarity (M)
S9-A I9b-AI9b-CD9bisI9c-CD18S7-CD2
Costa della GavetaKCl solutions
0 1 2 3 4 5 6solution molarity (M)
NaCl
KCl
wP
Kaolin
Figure 2.18 Liquid limit, wL, of the tested materials in water and salt solutions at different
concentrations. Some determinations of the plastic limit, wP are indicated as well.
While the influence of pore solution concentration on the liquid limit seems small, the
influence on the residual shear strength is noticeable. Figure 2.19, for instance, shows the
results of shear tests carried out, in the Bromhead apparatus, on the same material prepared
with water, with 0.2 M NaCl solution and with 2 M NaCl solution. The residual friction
coefficient τr/σ’n of the material varies between less than 0.2 in water and about 0.3 in the

2. Influence of pore fluid composition on clay behaviour
27
concentrated salt solution, which corresponds to a variation in the residual friction angle
ϕ’r from about 10° to about 16°. The use of a relatively less concentrated solution (0.2 M
NaCl) produces a strength increase, with respect to the strength obtained in water, which is
already significant.
0
0.1
0.2
0.3
0.4
0.5
0.6
0.7
0 20 40 60 80
τ/σ
' n
horizontal displacement (mm)
Costa della Gaveta (S9, 24-25 m, σ'n = 150-200 kPa)Bromhead apparatus (v = 0.018 mm/min)
2 M NaCl0.2 M NaCl
water
Figure 2.19 Friction coefficient against the horizontal displacement for specimens of the
Costa della Gaveta soil tested in water and in NaCl solutions.
Several other shear tests were carried out on many specimens of the Costa della Gaveta
soil. Figure 2.20 shows the results comprehensively in terms of the residual shear strength
against the normal applied stress. In particular, Figure 2.20a refers to specimens
reconstituted with distilled water and tested in a bath of distilled water as well. The results
are compared to those previously obtained on other specimens of the Costa della Gaveta
soil (Di Maio et al., 2010, 2013). The results, which seem consistent to one another, lie
between two lines through the origin corresponding to ϕ’r = 8° and ϕ’r = 10°. The effect of
the testing apparatus seems negligible, as well as that of the normal stress for σ’n > 100
kPa.
In Figure 2.20b the results relative to specimens reconstituted with – and submerged in –
solutions of NaCl at different concentrations (tests without chemical gradients) are added
to those shown in Figure 2.20a. It can be seen that the residual shear strength of all
specimens in salt solutions is significantly higher than that of specimens in water. The

2. Influence of pore fluid composition on clay behaviour
28
experimental points can be interpreted in terms of residual friction angles ranging between
13° and 20°, that is up to twice those evaluated in water.
other specimens
S9-A (Bishop)
S9-A (Bromhead)
S9-B (Bromhead)
S9-B (Casagrande)
S9-MIX (Bromhead)
S9-MIX (Casagrande)
S7-CD2 (Casagrande)
0
20
40
60
80
100
0 100 200 300 400 500
τ r(k
Pa)
σ'n (kPa)
Tests in distilled water
ϕ'r = 8°
ϕ'r = 10°
0
20
40
60
80
100
0 100 200 300 400 500
τ r(k
Pa)
σ'n (kPa)
ϕ'r = 8.5°
ϕ'r = 13°ϕ'r = 20°Tests in salt
solutions
a)
b)tests in water
0.2 M NaCl
0.5 M NaCl
1 M NaCl
2 M NaCl
5 M NaCl
Saturated Solution NaCl
Figure 2.20 Residual shear strength against normal effective stress of specimens of Costa
della Gaveta soil: a) specimens tested in distilled water; the results are compared to those
of other specimens from different samples (data from Di Maio et al., 2010; 2013); b) tests
in NaCl solutions at various concentrations, compared to those obtained in water.
In Figure 2.21 the values of residual shear strength relative to specimens of kaolin (a) and
bentonite (b) reconstituted with – and submerged in – water or 1 M NaCl solution are
plotted against the normal applied stress. These specimens were tested in different
apparatuses, without observing significant influence of the testing device on the results. A
noticeable difference between the residual shear strength in water and in solution can be

2. Influence of pore fluid composition on clay behaviour
29
seen for the used bentonite: a residual friction angle ϕ’r = 5° can be evaluated in water,
while ϕ’r = 17° can be evaluated in the 1 M NaCl solution. For the tested kaolin, the same
value of residual friction angle, ϕ’r = 13°, was evaluated in different apparatuses, under
different normal stresses, both on specimens in water and in 1 M NaCl solution.
0
20
40
60
80
100
0 100 200 300 400 500
τ r(k
Pa)
σ'n (kPa)
Casagrande Reversal Bromhead
Kaolin
1M NaClCasagrande distilled water
ϕ'r ≈ 13°
0
20
40
60
80
100
0 100 200 300 400 500
τ r(k
Pa)
σ'n (kPa)
Casagrande Bishop Bromhead
ϕ'r = 17°
ϕ'r = 5°
1M NaCl
distilled water
Bentonite
a)
b)
Figure 2.21 Residual shear strength of kaolin (a) and bentonite (b) in water and 1M NaCl
solution evaluated by means of different apparatuses.
Figure 2.22 shows the residual friction angle ϕ’r against the NaCl concentration in the pore
fluid of several specimens of the Costa della Gaveta soil, tested under similar normal
stresses. The residual shear strength of two undisturbed specimens taken close to the shear
surface in borehole K1bis (8.3 and 8.4 m) is also shown. A residual friction angle of 12°
was evaluated on both specimens. The pore ion concentration was evaluated on the

2. Influence of pore fluid composition on clay behaviour
30
material from the same undisturbed sample. Subsequently, the specimens were sheared
further and exposed to distilled water, allowing ion diffusion outward from the pores. This
caused a decrease in the residual friction angle from 12° to 9.8°, suggesting that the
available residual strength on the slip surface of the landslide can decrease further as an
effect of ion concentration decrease.
The figure shows that the Costa della Gaveta soil exhibits a noticeable shear strength
increase with increasing NaCl concentration. The experimental points relative to the
undisturbed specimens lie on the same curve as that of the reconstituted specimens. The
relation between ϕ’r and pore solution molarity is not linear, with higher gradients at lower
concentrations. In particular, most of the strength variations are achieved within the range
0 – 1 mol/l.
5
10
15
20
0 1 2 3 4 5 6
resi
dual
fric
tion
ang
le,
ϕ' r
NaCl molarity, M
K1bis undisturbed 100 kPa
S9-A reconstituted 150-175 kPa
S9B reconstituted 150-225 kPa
S9-MIX reconstituted 204 kPa
undisturbed K1bis specimensclose to the slip surface
K1bis after exposure to water
Figure 2.22 Residual friction angle against NaCl concentration in the pore solution for
reconstituted and undisturbed specimens of the Costa della Gaveta soil (mod. from Di
Maio et al., 2015c).
The results relative to the Costa della Gaveta soil, those relative to bentonite and those
obtained by Di Maio (2004a) on several soils are compared in Figure 2.23 in terms of
residual friction angle against NaCl concentration. The experimentation carried out by Di
Maio (2004a) was conducted under σ’n = 200 kPa, a value comparable to the normal
stresses applied during the tests shown in this section. The trend of residual shear strength

2. Influence of pore fluid composition on clay behaviour
31
increase with concentration has practically the same shape for all materials, although the
magnitude of the effect of pore solution molarity is different. The highest dependence on
NaCl concentration is shown by the bentonite, whose ϕ’r ranges from 5° in water to more
than 20° in the 3 mol/l NaCl solution. The Ponza bentonite is mainly smectitic, Bisaccia
and Gela clays also contain relevant percentages of smectite (Di Maio, 2004a), which
probably control their behaviour.
0
5
10
15
20
0 1 2 3 4 5 6
ϕ' r
(°)
NaCl concentration (mol/l)
Costa della Gaveta soilBisaccia clay (Di Maio, 2004a)Gela clay (Di Maio, 2004a)Ponza bentonite (Di Maio, 2004a)Commercial bentonite
Figure 2.23 Residual friction angle against NaCl concentration in the pore fluid of
specimens of different clays.
Some of the specimens pre-sheared to the residual condition were subsequently exposed to
a different fluid and sheared further. In particular, some specimens initially in distilled
water were exposed to a concentrated salt solution.
Figure 2.24 shows the case of a specimen of Costa della Gaveta material which was
exposed to 1 mol/l solution of KCl. The exposure produced a gradual but noticeable shear
strength increase up to a value of residual shear strength triple than that attained in water.
On the subsequent re-exposure to distilled water, the shear strength exhibited only a
negligible decrease, thus suggesting that ion exchange had taken place. No effects were
seen on the volume change of the specimen.

2. Influence of pore fluid composition on clay behaviour
32
0
20
40
60
80
100
τ r(k
Pa)
S7CD2 - σ'n = 155 kPaexposure to 1M KCl exposure to distilled water
manual cutmanual cut
-0.05
0.00
0.05
0 50 100 150 200 250
heig
ht v
aria
tion
(mm
)
horizontal displacement (mm) Figure 2.24 Shear strength and height variation of a specimen, reconstituted with – and
submerged in – distilled water, pre-sheared to the residual condition and then exposed to 1
M KCl solution and, subsequently, to distilled water.
Some other specimens were exposed to 1 M NaCl solution, which caused a significant
shear strength increase, although of lower magnitude than with KCl, to values consistent
with those obtained on specimens reconstituted with – and submerged in – 1 M NaCl
solution.
One specimen was prepared with the soil extracted from borehole S9 at a depth of about 26
m (close to the slip surface), reconstituted with distilled water and pre-sheared to the
residual condition in a bath of distilled water. During the course of the test, the specimen
was exposed to a composite “natural” solution, i.e. a solution prepared using NaCl, KCl,
MgCl2 and CaCl2 in proportions such that the cations Na+, K+, Mg2+ and Ca2+ would have
the same concentrations as those evaluated in the natural pore solution of the same sample:
0.372 M Na+, 0.017 M K+, 0.092 M Ca2+, 0.045 M Mg2+. The exposure caused a gradual
but significant shear strength increase (Figure 2.25), corresponding to a residual friction

2. Influence of pore fluid composition on clay behaviour
33
angle increase from 7° to 13°, without significant volume changes. Figure 2.26 shows the
residual shear strength evaluated on the specimen, against the normal stress, during
different phases of the test. Since the beginning of the test, the cell water was frequently
replaced with distilled water. The values of the residual shear strength in this phase are
indicated in the figure by points 1-4. It can be seen that, probably as an effect of the
continuous exposure to water, the ions already in the pores diffused away, thus the residual
friction angle decreased. At point 4 the specimen was exposed to the “natural” solution
which caused the strength increase (to point 5) shown in Figure 2.25. The specimen was
then loaded (point 6), confirming the same value of the residual friction angle..
0
10
20
30
40
50
τ r(k
Pa)
S9B - σ'n = 151 kPa
exposure to "natural solution"
-0.05
0.00
0.05
0 10 20 30 40 50 60 70 80 90 100
heig
ht v
aria
tion
(mm
)
horizontal displacement (mm)
Figure 2.25 Shear strength of a specimen, reconstituted with – and exposed to – distilled
water, pre-sheared to the residual state and then exposed to the “natural solution”.

2. Influence of pore fluid composition on clay behaviour
34
0
10
20
30
40
50
60
0 50 100 150 200 250
ττ ττr(k
Pa
)
σσσσ'n (kPa)
S9B, Casagrande apparatus
exposure to natural solution
esposure to water
1
2
3
4
5
6
Figure 2.26 Residual shear strength history against normal effective stress of the specimen
of S9B material.
The effects of exposure of pre-sheared specimens to fluids different from the pore fluid
were evaluated also on some specimens of bentonite for comparison.
A specimen was prepared by mixing the material with 1 mol/l NaCl solution. The
specimen was first sheared to the residual state while immersed in the same solution. The
residual shear strength was found consistent with the values reported in Figure 2.21b. The
cell fluid was then replaced by distilled water, which was renewed frequently to keep the
chemical gradient between the pore fluid and the cell fluid as high as possible, and the
specimen was sheared further. The shear strength, shown in Figure 2.27a against time,
gradually decreased and became finally equal to that of specimens prepared with water and
sheared while immersed in water (corresponding to ϕ’r ≈ 5°, as in Figure 2.21b). Figure
2.27b shows the height variations undergone by the specimen. Although the shear box is
not suitable to evaluate the volume change behaviour, it can be seen that significant
swelling started to occur after about 40 days of continuous exposure to water, that is when
the strength had already decreased noticeably.

2. Influence of pore fluid composition on clay behaviour
35
0
10
20
30
40
50
60sh
ear s
tren
gth
, τ(k
Pa)
v = 0.0025 mm/min
manual cut
manual cut
manual cut
commercial bentoniteCasagrandeapparatus
σ'n = 150 kPa
τr in 1 M NaCl
τr in water
-10
1
2
3
45
6
7
hei
ght
var
iati
ons
(mm
)
0.0
0.2
0.4
0.6
0.8
1.0
0 10 20 30 40 50 60 70 80
NaC
l in
the
por
e fl
uid
(m
ol/l
)
time since exposure to water (days)
average concentration in the specimen evaluated after the test
0.00
0.01
0.02
NaC
l in
the
cell
flu
id
(mo
l/l)
a)
b)
c)
d)
Figure 2.27 Exposure to distilled water of a specimen of bentonite reconstituted with 1 M
NaCl solution and sheared until the residual state while immersed in 1 M NaCl solution:
shear strength (a), height variations (b), NaCl concentration in the cell fluid before each
water renewal (c), and estimated average concentration in the pore fluid (d).

2. Influence of pore fluid composition on clay behaviour
36
Before each water renewal, the Na+ concentration of the cell water was measured by means
of an ion-selective electrode to evaluate the possible ion diffusion. The values are plotted
in Figure 2.27c. Being the cell water and the pore water volumes known, it is possible to
estimate how the average NaCl concentration in the pores decreased during the process of
exposure to water (Figure 2.27d). In order to check whether the obtained curve of
concentration versus time was reliable, at the end of the test the specimen was oven-dried
to determine its water content and subsequently powdered and mixed with a known
amount of distilled water. Settlement of the suspension was allowed and the sodium
concentration of the supernatant fluid was measured. Under the hypothesis that all the ions
in the pore fluid were dispersed in the solution, the sodium concentration of the former
could be estimated. The result is represented by the red hollow marker in Figure 2.27d. The
value is consistent with the final concentration evaluated by means of measurements of
Na+ in the cell fluid.
2.2.2 Observation of the shear surface
In order to estimate soil parameters such as viscosity, it is important to evaluate the
thickness of the soil portion affected by shearing deformations. To this aim, and to
understand if the shear zone is characterised by different properties, some analyses have
been carried out by different techniques.
A specimen of Costa della Gaveta soil (S9B), reconstituted with distilled water, was
sheared in a bath of distilled water in the Bromhead apparatus. After the test, the specimen
was analysed by means of an environmental scanning electron microscope (ESEM) in
order to examine the material along the slip surface.
Figure 2.28 shows a ESEM micrograph of the investigated specimen. The figure refers to a
vertical cross section, in which the shear surface is located at the bottom. Close to the
surface, a zone in which the particle aggregates appear well aligned can be seen. The
thickness of this zone can be estimated in about 200 µm. However, a particle alignment in
the direction of shearing can be seen also on the top of the image, while on the left side a
band of particles with similar inclination can be seen. This suggests that all the area shown
in the micrograph, which has a thickness of about 1 mm, can be part of the shear band

2. Influence of pore fluid composition on clay behaviour
37
whose thickness has been estimated to be about 1.5 mm for each half of a specimen tested
in the Casagrande apparatus (Di Maio et al., 2013).
Some additional micrographs, taken with different magnifications, are shown in Figure
2.29. It can be seen that the material is mostly constituted by platy particles arranged in
stacks with a preferential direction. The thickness of the stacks is in the order of several
microns, while the thickness of the single foils seems much lower than 1 µm.
aligned aggregates
shear surface
Figure 2.28 ESEM micrograph of the shear zone of a specimen of Costa della Gaveta soil
tested in the Bromhead apparatus.

2. Influence of pore fluid composition on clay behaviour
38
Figure 2.29 ESEM micrographs with increasing magnification of the shear zone of a
specimen of Costa della Gaveta soil tested in the Bromhead apparatus
A second specimen of the same material, tested in the Casagrande apparatus, was
submitted to three dimensional X-ray tomography at the University of Padova, Italy.
The technique allows for the investigation of the whole specimen’s volume, overcoming
the limitation of the microscopy, by means of which only the surface can be studied. The
technique is similar to the X-ray analyses for medical purposes, it is non-invasive and does
not cause sample disturbance.
The instrument provides a 3D image made of “voxels” (i.e. 3D pixels) whose values can be
interpreted as a mean local density when the voxels are significantly larger than the grain
size. Alternatively, the single grains can be delineated when the voxels are significantly
smaller than them (Viggiani et al., 2015).

2. Influence of pore fluid composition on clay behaviour
39
Some promising results regarding the use of this technique for geotechnical purposes have
been published, for instance, by Lenoir et al. (2007), Andò et al. (2011) and Viggiani et al.
(2015), who used the 3D X-ray tomography to reveal processes in soils such as strain
localisation, deformations due to volume removal, ice formation and desiccation cracks.
The tomography shown in this work was carried out by means of the Skyscan1172
instrument (Bruker microCT), equipped with a 11 Mp camera. The resulting voxel size
was 4.77 µm. The investigated specimen is a small portion of the shear specimen of about
6 mm side, sampled close to the slip surface. Since the observations were made some days
after the specimen was extracted, some drying of the material took place.
Figure 2.30 shows an example of 3D view of the shear surface and vertical cross sections
of the investigated specimen (the slip surface is located on the top). The shades of grey
show the different relative density of the material, which can possibly depend both on non-
homogeneity of the soil composition and of the water content. Lighter (i.e. relatively
denser) zones are possibly constituted by coarse grains or clay aggregates with relatively
lower water content. It can be seen that in the zone close to the slip surface the denser
zones are less abundant. About 1 mm below the slip surface, a zone characterised by lower
density, or even a void, can be seen. It is possible that this discontinuity was caused by
different shrinkage, due to drying, of the material close to the slip surface with respect to
the rest of the specimen, possibly because of different water contents resulting after
shearing.
Some statistical analyses have been carried out on the results of the X-ray tomography.
Figure 2.31a shows how the mean value of the relative density (in arbitrary units) varies in
the vertical direction. It can be seen that in most of the specimen’s volume the density
remains quite constant. However, it decreases towards the top, that is close to the shear
surface. Most of the decrease occurs in a zone about 1 mm thick., which corresponds to the
zone above the discontinuity seen in Figure 2.30. In Figure 2.31b the density distribution in
two horizontal sections of the specimen is plotted. The difference between the curves
relative to the shear zone and to the rest of the specimen is evident.

2. Influence of pore fluid composition on clay behaviour
40
1 mm
1 mm
1 mm
Figure 2.30 3D view of the shear surface and vertical sections of the specimen of the Costa
della Gaveta soil seen by X-ray tomography.

2. Influence of pore fluid composition on clay behaviour
41
0
20000
40000
60000
80000
100000
120000
20 30 40 50 60 70 80 90 100 110fr
eque
ncy
class of density
lower density
higherdensity
h = 4.5 mmh = 0.2 mm
0.0
0.5
1.0
1.5
2.0
2.5
3.0
3.5
4.0
4.5
5.0
45 46 47 48 49 50 51
heig
ht (m
m)
class of density
top
bottom
mean density
position of the discontinuity
b)
a)
Figure 2.31 Variation of the mean relative density (arbitrary units) in the vertical direction
(a) and relative density distribution against frequency for two horizontal cross section of
the specimen.

42
3 INFLUENCE OF PORE FLUID
COMPOSITION ON CREEP BEHAVIOUR
This Chapter reports on the results of laboratory tests aimed at evaluating the mechanical
behaviour of the material along a pre-existing slip surface in the residual condition when
the specimen is subjected to changes in the pore fluid composition. The shear creep
behaviour and the chemically-induced displacement evolution were investigated by means
of shear tests under constant applied shear stresses in modified Casagrande and Bishop
apparatuses.
In the first paragraph, interpretations and modelization of creep phenomena reported in the
technical literature are reviewed and commented. Subsequently, the results of stress-
controlled shear tests on the Costa della Gaveta soil and on specimens of bentonite are
reported. Finally, the description of a simplified modelization of ion diffusion and shear
strength variation, which was helpful in the test interpretation, is presented. The main
results contained in this Chapter have been published by Di Maio and Scaringi (2015) and
Di Maio et al. (2015a).

3. Influence of pore fluid composition on creep behaviour
43
3.1 SHEAR CREEP: A BRIEF OVERVIEW OF THE
PHENOMENON
Creep is defined as the progressive, irrecoverable deformation of a soil element under a
state of constant effective stress (Kwok and Bolton, 2010). An increase in the deviatoric
stress level can result in a deformation response characterised by three successive phases
which are named primary, secondary and tertiary creep, characterised by decreasing,
constant and increasing strain rate respectively (Figure 3.1). The actual strain pattern is
hypothesised to depend on the type of soil, stress level and stress history (Singh and
Mitchell, 1968; Tavenas et al., 1978; Augustesen et al., 2004; Le et al., 2012).
Figure 3.1 Definition of creep stages according: strain versus time (a) and log(strain rate)
versus log(time) (b) (Augustesen et al., 2004).
Failure of cemented bonds or increase in the ratio of tangential to normal forces at the
interparticle contacts are among the processes which can lead to creep rupture for loss of
strength, in drained conditions and in the absence of chemical changes (Kuhn, 1987; Kuhn
and Mitchell, 1993; Mitchell and Soga, 2005; Kwok and Bolton, 2010).
The magnitude of creep strains increases with increasing plasticity, activity and water
content of the soil. The most active clays usually exhibit the greatest time-dependent
response because the smaller the particle size, the greater is the specific surface, and the
greater the water adsorption (Mitchell and Soga, 2005).

3. Influence of pore fluid composition on creep behaviour
44
Most soils have a characteristic relationship between strain rate and time. This was shown,
for instance, by Bishop (1966) for drained triaxial compression creep of London clay and
by Murayama and Shibata (1958) for undrained triaxial compression creep of soft Osaka
clay.
Pore pressures may change during creep according to the volume change tendency of the
soil and to the possibility of drainage during the deformation process (Mitchell and Soga,
2005).
The theoretical shape of the curve of creep strain against time (Figure 3.1) may not exist at
all, as discussed by Ter-Stepanian (1992) who observed that a “jump-like structure
reorganization” may occur, reflecting a stochastic character for the deformation. This
behaviour was observed during a shear creep test on an undisturbed specimen of
overconsolidated clay.
Ter-Stepanian (1992) suggests the existence of four levels of deformation, two of them
concerning the deformation of matter and two of them the deformation of
particles/aggregates. In particular, regarding the matter, the Author focuses on (1) a
molecular level, which consists of displacement of particles by surmounting energy
barriers, and (2) on mutual displacement of particles as a result of bond failures, but
without rearrangement. With respect to the particle/aggregate deformation, the Author
points out (3) a structural level of soil deformation involving mutual rearrangement of
particles, and (4) deformations at the aggregate level.
Deformations at levels (3) and (4) should not be uniform due to the particulate nature of
soils and should proceed through a series of structural readjustments corresponding to the
relative movement of particles with respect to each other, thus leading to an irregular
sequence of deformations. Regarding the effects of particle rearrangement, Kuhn (1987)
developed a discrete element model that considers “visco-frictional” sliding at interparticle
contacts. Subsequently, Kuhn and Mitchell (1993) performed numerical analyses using a
discrete element model, obtaining a discontinuous creep behaviour comparable to that
observed on several soils.
In order to investigate deformations at levels (1) and (2), creep phenomena can be studied
as a rate process by means of the theory of absolute reaction rates (Eyring, 1936; Glasstone

3. Influence of pore fluid composition on creep behaviour
45
et al., 1941), which is based on statistical mechanics. An adaptation of the theory to the
study of soil behaviour can be found, among others, in Feda (1989, 1992) and in Kuhn and
Mitchell (1993). The concept is that atoms, molecules and/or particles involved in a
deformation process (termed “flow units”) are constrained from relative movement by
energy barriers which separate adjacent equilibrium positions. In order to produce a
displacement, the flow unit must overcome the barrier by acquiring a surplus of potential
energy, termed the “activation energy”, ∆F. The potential energy of the flow unit after the
displacement may be lower than, equal to, or higher than the potential energy before the
displacement, thus defining conditions of increased stability, steady-state or decreased
stability respectively.
The activation energy may be provided by thermal energy or by an applied potential. If this
latter is not directional, flow units can surmount the energy barrier with equal probability
in all directions, therefore no macroscopic deformation is produced. On the contrary, if a
directional potential, such as gravity or a shear stress, is applied, than the barrier heights
are not equal in all directions, but lower in the direction of shearing and higher in the
opposite direction. Consequently, the barriers are most probably crossed in the direction of
shearing, thus producing a macroscopic deformation. A schematic representation of the
effect of a shear force on the activation energy required for deformation is shown by
Figure 3.2 (Mitchell and Soga, 2005).
Figure 3.2 Schematic representation of energy barriers in rate process theory in absence
and in presence of a directional potential (Mitchell and Soga, 2005).

3. Influence of pore fluid composition on creep behaviour
46
Mitchell et al. (1968) showed that the rate of macroscopic deformation resulting from the
application of a directional potential, such as a shear force, can be expressed as a function
of the applied potential and of thermodynamic parameters, as in Figure 3.3. However, the
equation obtained by the Authors, since it is referred to deformations at levels (1) and (2)
only, does not account for structural changes. Therefore, if shear stress and thermodynamic
parameters (e.g. temperature) do not vary, than the strain rate remains constant, i.e. a
secondary creep is produced. In order to generalise their result, the Authors introduced a
parameter (termed X in Figure 3.3, and further defined by Ter-Stepanian, 1975) which can
be both structure and time dependent, so that primary and tertiary creep due to
deformations at level (3) and (4) could be included in the model.
Figure 3.3 Strain rate as a function of an applied directional potential according to the
rate process theory (Mitchell and Soga, 2005).
Notwithstanding this limitation, the equation was used by Kuhn and Mitchell (1993) as
part of the particle contact law in their discrete element modelling, and by Puzrin and
Houlsby (2003) as an internal function of a thermo-mechanically based model, deriving a
rate-dependent constitutive model for soil. Mitchell and Soga (2005) reported that the real
behaviour of many systems is substantially consistent with the statistical mechanics
formulation of the rate process theory. Different parts of the formulation have been tested
separately by Mitchell et al. (1968), giving results according to predictions.
Different Authors, among whom Mitchell et al. (1968), provided some ranges of activation
energy for soil creep. Mitchell and Soga (2005), following Andersland and Douglas
(1970), concluded that variations in water content (including complete drying), adsorbed
cation type, consolidation pressure, void ratio, and pore fluid have no significant effect on
the required activation energy. As a consequence, variations in strain rate in the absence of
structural rearrangements would not be due to changes in the activation energy but only to
changes in the number of bonds. However, this does not seem reasonable in phyllosilicates
with face-to-face orientation, which are kept together by electrostatic forces. In order to
preserve electroneutrality, the total charge of the adsorbed cations cannot change and,

3. Influence of pore fluid composition on creep behaviour
47
therefore, the number of interparticle weak bonds will remain constant. On the contrary, it
must be considered that an increase in the double layer thickness, due to a decrease in ion
concentration or to an increase in the dielectric constant of the pore fluid, could weaken the
bonds and reduce the activation energy required to break them.
Additional considerations by Mitchell and Soga (2005) are the following: 1. the number of
bonds is directly proportional to effective consolidation pressure for normally consolidated
clays; 2. overconsolidation leads to more bonds than in normally consolidated clay at the
same effective consolidation pressure.
In fact, the validity of the conclusions drawn by Andersland and Douglas (1970) relies
upon the existence of solid-to-solid contacts between clay particles. Evidence of this have
been provided for some cases, for instance, by Matsui et al. (1977, 1980) by means of
photomicrographs, and by Koerner et al. (1977) by means of acoustic emissions. However,
this may not be valid in the case of smectites, especially in the residual condition. Normal
effective stresses and shear stresses can be transmitted only at interparticle contacts in most
soils. Pure sodium montmorillonite may be an exception (Mitchell and Soga, 2005) since a
relevant part of the normal stress can be carried by physicochemical forces of interaction.
Deformation at large strain can approach a steady-state condition in which there is little
further structural change with time (this is the case of residual state). This means that,
following Ter-Stepanian (1992), creep strains are due only to level 1 and level 2
deformations (rearrangement of matter). The governing equations of the rate process
theory may be rewritten in a form which is similar to the Coulomb equation for strength
(see Mitchell and Soga, 2005) which states that both cohesion and friction depend on the
number of bonds times the bond strength, and that the values of c and ϕ should depend on
the rate of deformation and the temperature. As a consequence, in the absence of structural
rearrangements, the shearing resistance should increase linearly with the logarithm of the
strain rate. Karlsson (1963) gave experimental evidence of this by means of vane tests on
different remoulded clays subjected to shear at different rates. The rate effect on the
residual shear strength may follow the same law provided that no changes in the shearing
mode occur (see Lupini et al., 1981, and Tika et al., 1996). Conversely, transition from
laminar to turbulent shearing mode, which involves particle rearrangement, should result in
a different strength – rate relationship.

3. Influence of pore fluid composition on creep behaviour
48
A possible volumetric-deviatoric creep coupling may occur, as highlighted by Mitchell and
Soga (2005). This implies that a rapid application of a stress or a strain can result in rapid
change of pore water pressure in a saturated soil under undrained conditions. The rapid
application of a shear stress on clay specimens, i.e. characterised by very low hydraulic
conductivity, may result in pore fluid pressure excess. The dissipation of pore pressure
excess produces an increase in the effective normal stress, which may result in a creep
phase characterised by a decreasing strain rate, i.e. can appear as primary creep.
Furthermore, when a shear creep test is performed, the necessary time for primary
consolidation of the specimen is waited before applying the shear force but, for the entire
duration of the test, volumetric creep takes place. Consequently, the shear strength of the
material may increase due to the formation of additional bonds and/or to the strengthening
of existing bonds, as proved by Nakagawa et al. (1995).
Mitchell and Soga (2005) reported four possible causes of strength loss which lead to
failure under shear creep: (1) failure of cementation bonds, if a significant portion of the
strength of a soil is due to cementation; (2) in the absence of chemical or mineralogical
changes the strength depends on effective stresses: if creep causes changes in effective
stresses, then strength changes will also occur; (3) in almost all soils, shear causes changes
in pore pressure during undrained deformation and changes in water content during drained
deformation); (4) water content changes cause strength changes.
Besides these reasons, also chemical changes, such as pore fluid composition variation in
certain types of soil, can cause shear strength changes and, consequently, it can be
reasonable to expect that they can produce creep failure.

3. Influence of pore fluid composition on creep behaviour
49
3.2 EXPERIMENTAL RESULTS
RELATIVE TO THE COSTA DELLA GAVETA SOIL
The chemical composition of the pore fluid affects the mechanical behaviour of clays
noticeably. The influence of pore fluid composition on the residual shear strength of the
Costa della Gaveta soil, determined by displacement-controlled tests, was shown in
section 2.2.1. The following paragraph shows the results relative to stress-controlled tests.
3.2.1 Stress-controlled shear tests on the Costa della Gaveta soil
In order to investigate the rheological behaviour of the soil along a pre-existing shear
surface, direct and ring shear tests were carried out under constant shear forces or stresses
(“force-controlled” or “stress-controlled” tests).
To perform such type of tests, the Casagrande and the Bishop apparatuses were modified
(Figure 3.4) in order to convert vertical forces, applied by means of dead loads, into
horizontal forces acting on the upper box or upper ring respectively (Di Maio et al., 2013,
2015a; Di Maio and Scaringi, 2015). During shearing in the ring shear device the contact
area does not change, thus constant forces correspond to constant average shear stresses,
i.e. the test is properly a “stress-controlled” test. On the contrary, small area variations
occur in the Casagrande direct shear and the test can be considered only “force-controlled”.
However, the small area variations during the test (< 2%) have been accounted for in the
interpretation of the results.

3. Influence of pore fluid composition on creep behaviour
50
a) b)
load cell load cell
Figure 3.4 Schematic representation of the direct shear apparatus modified to perform
force-controlled tests (a). Picture of the Bishop ring shear modified to perform stress-
controlled tests (b).
The tests reported in this section were carried out on specimens of the Costa della Gaveta
soil. Subsequently, further tests were performed on specimens of sodium bentonite in order
to compare the obtained results to those relative to a pure clay and to see whether they
have more general validity. The results of these latter tests are reported in section 3.3.
The adopted test procedure was the following:
1. the specimens were prepared by mixing the powdered material with a concentrated salt
solution (1 M NaCl) and were sheared until the residual state was attained while immersed
in the same solution (displacement-controlled phase without chemical gradients);
2. the apparatuses were modified as in Figure 3.4 to perform the force/stress-controlled
tests (force/stress-controlled phase, or creep phase);
3. at the end of this phase, the original configuration of the apparatuses was restored to
perform additional displacement-controlled shearing to verify the available shear strength.
For sake of simplicity the test phases will be referred to as first, second, and third test
phases respectively. Table 3.1 summarises the test phases, the parameters which were
monitored and the used instruments. The table also reports the fluid in which the
specimens were submerged during each phase.

3. Influence of pore fluid composition on creep behaviour
51
Phase Test mode Cell fluid Measured quantities and instruments
1 displacement-
controlled shear
test
water or salt solutions
at different
concentrations
horizontal displacements (LVDT),
shear strength (load cell), height
variations (LVDT)
2a force-controlled
or stress-
controlled shear
test
same as in phase 1 horizontal displacements (LVDT),
shear strength (load cell), height
variations (LVDT)
2b force-controlled
or stress-
controlled shear
test
distilled water
(frequently renewed)
horizontal displacements, height
variations, cell fluid electrical
conductivity (4-electrode conductivity
probe) and/or Na+ concentration (ion-
selective electrode)
3 displacement-
controlled shear
test
distilled water
(frequently renewed)
horizontal displacements (LVDT),
shear strength (load cell), height
variations (LVDT), cell fluid electrical
conductivity (4-electrode conductivity
probe) and/or Na+ concentration (ion-
selective electrode)
Table 3.1 Test phases, measured parameters and devices.
The first phase is similar to those described in Chapter 2. Each tested material was sheared
to the residual under displacement rate condition and the residual strength was determined
both with distilled water and 1 M NaCl solution as pore and cell fluid, in absence of
chemical gradients and in drained conditions.
In the second phase all the specimens prepared with and immersed in 1 M NaCl solution,
were subjected to an average horizontal shear stress lower than the residual strength
obtained, under the same normal stress, with the salt solution and higher than the residual
strength obtained for the same material with distilled water (Figure 3.5, Table 3.2).
The application of the horizontal force caused very small horizontal displacements with
decreasing rate (Figure 3.6a). This process occurred under constant effective stresses, i.e. it

3. Influence of pore fluid composition on creep behaviour
52
is a primary creep (Augustesen et al., 2004). Subsequently (time = 0 in Figure 3.6) the cell
solution was replaced by distilled water, which was frequently renewed (usually twice a
day) to keep the chemical gradient between the pore fluid and the cell fluid as high as
possible.
0
10
20
30
40
50
60
70τ r
(kP
a)
τr in 1M NaCl
τr in dist. water
τ applied
S9A
Costa della Gaveta
0
10
20
30
40
50
60
70
0 100 200 300 400
τ r(k
Pa)
σ'n (kPa)
τr in 1M NaCl
τr in dist. water
τ applied B2P1
Costa della Gaveta
a)
b)
Figure 3.5 Test conditions of the specimens of the Costa della Gaveta soil submitted to
stress/force-controlled shear tests.
Spec.
Borehole
- Sample
Shear
apparatus
σσσσ’n
(kPa)
ττττr in 1 M NaCl
solution (kPa)
Applied ττττ
(kPa)
ττττr in water
(kPa)
P1 S9-MIX Casagrande 204 55 45.0 35
S9A S9-A Casagrande 253 50 44.3 36
B2 S9-MIX Bishop 205 55 49.8 35
Table 3.2 Test conditions of the specimens of Costa della Gaveta soil submitted to
stress/force-controlled shear tests.

3. Influence of pore fluid composition on creep behaviour
53
0.0
0.5
1.0
1.5
2.0
2.5
3.0
-20 0 20 40 60 80
hori
zont
al d
ispl
acem
ent
(mm
)
1M NaCl solution
distilled water
S9A
B2
P1
0
50
100
150
-20 0 20 40 60 80
dis
plac
emen
t rat
e (µ
m/d
ay)
S9AB2P1
-0.1
0.0
0.1
-20 0 20 40 60 80
heig
ht v
aria
tion
(m
m)
time (days)
S9A
B2
P1
a)
b)
c)
exposure to water
exposure to water
Figure 3.6 Effect of exposure to distilled water of specimens Costa della Gaveta soil
reconstituted with 1 M NaCl solution, previously immersed in the same solution and then
(time=0) exposed to distilled water: horizontal displacement, displacement rate and height
variation against time.

3. Influence of pore fluid composition on creep behaviour
54
As a consequence of exposure to distilled water, the displacement rate increased (Figure
3.6b) with a non linear trend, with a pattern similar to that of secondary and then tertiary
creep, until “failure”. This term seems inaccurate since the specimens are subjected to
shearing along a pre-existing shear surface in residual condition. The term “failure” is used
here to indicate a dramatic increase in the displacement rate.
More in detail, the displacement rate of the specimens of the Costa della Gaveta soil
remained in the order of 1-10 µm/day for some weeks (Figure 3.6b) Afterwards, specimens
S9A and P1 experienced a sudden rate increase, while B2, tested in the Bishop apparatus,
underwent a progressive and more regular displacement rate increase. The causes of such
different patterns probably depend on the different machines as well as sub-experimental
differences. Figure 3.6c shows that all the specimens, when exposed to water, exhibited
some tendency to swell. Specimen B2 underwent a noticeable height decrease due to soil
loss from the gap between the box halves, possibly due to the loss of strength of the
material in contact with water.
In order to understand better the volume change behaviour of the Costa della Gaveta soil
with different pore fluids, several specimens were submitted to oedometer tests. For
instance, Figure 3.7 shows that a specimen reconstituted with 1 M NaCl solution - and
exposed to water in the course of the test - exhibits a noticeable tendency to swell.
0.0
0.1
0.2
0.3
0.4
0.1 1 10 100
heig
ht v
aria
tion
(mm
)
time (days)
S9B (σ'n = 150 kPa)
Figure 3.7 Effect of the exposure to distilled water during the course of an oedometer test,
on a specimen of Costa della Gaveta soil, initially in equilibrium with 1 M NaCl solution.

3. Influence of pore fluid composition on creep behaviour
55
Soon after failure, in order to evaluate the available shear strength at the end of the stress-
controlled phase, the apparatuses were turned to the displacement-controlled mode and the
specimens were sheared further (third test phase).
Figure 3.8, Figure 3.9 and Figure 3.10 plot the shear strength available after failure for
specimens S9A, P1 and B2 respectively. The curves are compared to the applied shear
stress during the second phase and to the shear strength exhibited by the specimens during
the first test phase, while immersed in 1 M NaCl solution. It can be seen that the available
shear strength in the third phase is much lower than that of the material in the NaCl
solution and close to the shear stress applied during the second test phase.
The height variations undergone by the specimens are shown as well. It can be seen that
S9A and P1, after the creep phase, continued to swell, while the height of specimen B2
continued to decrease due to soil extrusion. On the contrary, before the creep phase, that is
while the specimens were submerged in the NaCl solution, the height variations had
become practically negligible.
0
20
40
60
80
τ(k
Pa)
τ in 1M NaClapplied shear stress
τafter failure
S9A
-0.10
-0.05
0.00
0.05
0.10
0 2 4 6 8 10
heig
ht v
aria
tion
(m
m)
horizontal displacement (mm)
Figure 3.8 Shear strength and height variation against the horizontal displacement in 1M
NaCl solution (before the creep test), applied shear stress during the creep phase with
exposure to distilled water, shear strength and height variation after creep failure for
specimen S9A.

3. Influence of pore fluid composition on creep behaviour
56
0
20
40
60
80
τ(k
Pa)
τ in 1M NaCl
applied shear stressτ after failure
P1
-0.02
-0.01
0.00
0.01
0.02
0 5 10 15 20 25 30 35 40
heig
ht v
aria
tion
(m
m)
horizontal displacement (mm)
Figure 3.9 Shear strength and height variation against the horizontal displacement in 1M
NaCl solution (before the creep test), applied shear stress during the creep phase with
exposure to distilled water, shear strength and height variation after creep failure for
specimen P1.
0
20
40
60
80
τ(k
Pa)
τ in 1M NaCl
applied shear stress
τ after failure
B2
-1.5
-1.0
-0.5
0.0
0 5 10 15 20 25 30 35 40
heig
ht v
aria
tion
(m
m)
horizontal displacement (mm)
Figure 3.10 Shear strength and height variation against the horizontal displacement in 1M
NaCl solution (before the creep test), applied shear stress during the creep phase with
exposure to distilled water, shear strength and height variation after creep failure for
specimen B2.

3. Influence of pore fluid composition on creep behaviour
57
During exposure to distilled water of specimens P1 and B2, both in the second and in the
third test phases, the electrical conductivity of the cell fluid was often measured before
water renewal because its values allow an estimation of the amount of salt diffused
outward from the specimen’s pores in the time period between consecutive fluid renewals.
The values of conductivity are plotted in Figure 3.11 against the time since the beginning
of exposure to water. Unfortunately, the conductivity was not measured during the first
days, therefore an estimation of the cumulative amount of salt diffused, and thus of the
average NaCl concentration in the pore fluid could not be made. However, it can be
noticed that the values of electrical conductivity generally decreased with time for both
specimens. Significantly higher values were recorded for P1 when the water renewal were
not performed twice a day but less frequently.
0
500
1000
1500
2000
0 10 20 30 40 50 60 70 80 90
elec
tric
al c
ondu
ctiv
ity
(µS
/cm
)
time (days)
P1
B2
Figure 3.11 Electrical conductivity - since first exposure to distilled water - of the cell fluid
of specimens P1 and B2 measured before water renewal

3. Influence of pore fluid composition on creep behaviour
58
3.3 EXPERIMENTAL RESULTS
RELATIVE TO OTHER CLAYS
The experimentation carried out on the Costa della Gaveta soil was repeated for other
materials. The following paragraph reports on the results relative to a sodium bentonite.
The testing procedure was the same as that used for the Costa della Gaveta soil.
3.3.1 Stress-controlled shear tests on bentonite
The specimens were reconstituted with 1 M NaCl solution and first sheared to the residual
state under constant rate of displacement (v = 0.005 mm/min) and under different normal
stresses in the range 75 kPa < σ’n < 300 kPa. The attained values of residual shear strength,
as well as those evaluated on the same material reconstituted with – and submerged in –
distilled water, are plotted in Figure 3.12 and reported in Table 3.3 together with the
indication of the used apparatus and the test conditions. Specimens B1, C1 and L13, and
specimens C2 and C4, were submitted to the same stress conditions in different
apparatuses in order to check data reproducibility. Specimens L8 and L9, sheared to the
residual condition under the same vertical stress (σ’n = 150 kPa) as specimen C1, were
submitted to different shear stresses during the creep phase. Specimen L11 was prepared
with a 0.6 M NaCl solution instead of a 1 M NaCl solution.

3. Influence of pore fluid composition on creep behaviour
59
0
20
40
60
80
100
0 100 200 300 400
τ r(k
Pa)
σ'n (kPa)
τr in 1M NaCl
τr in dist. water
τ applied C3
C2, C4
L9C1, B1, L11, L13
L8
bentonite
L5
Figure 3.12 Test conditions of the specimens of bentonite submitted to stress/force-
controlled shear tests.
Spec. Material
Shear
apparatus
σσσσ’n
(kPa)
ττττr in 1 M NaCl
solution (kPa)
Applied ττττ
(kPa)
ττττr in water
(kPa)
B1 bentonite Bishop 150 46 29.3 12.4
C1 bentonite Casagrande 150 46 29.3 12.4
C2 bentonite Casagrande 205 60 39.8 16.9
C3 bentonite Casagrande 287 88 55.7 23.6
C4 bentonite Casagrande 205 63 39.8 16.9
L5 bentonite Casagrande 75 23 14.7 6.2
L8 bentonite Casagrande 150 46 21.2 12.4
L9 bentonite Casagrande 150 46 37.5 12.4
L11 bentonite Bishop 150 40 (0.6 M NaCl) 29.3 12.4
L13 bentonite Casagrande 150 46 29.3 12.4
Table 3.3 Test conditions of the specimens of bentonite submitted to stress/force-controlled
shear tests.

3. Influence of pore fluid composition on creep behaviour
60
Figure 3.13a shows the results, in terms of horizontal displacements against time, relative
to the specimens which underwent all the three test phases without technical problems.
These curves, therefore, are of easier interpretation and will be discussed in more detail.
The results relative to all the performed tests are shown in Figure 3.14.
Similar to the specimens of the Costa della Gaveta soil, in the second phase (see Figure
3.6) the application of a shear stress lower than the residual shear strength attained in the
solution cause only small displacements with decreasing rate, which became negligible or
even null within a couple of weeks. Subsequently, in the third phase (time t=0 in Figure
3.13), the cell fluid was replaced by distilled water, which was renewed frequently –
usually twice a day – to remove the ions diffusing outward from the specimens’ pores and
to keep the concentration gradient between the pore fluid and the cell fluid as high as
possible.
The displacement rate (Figure 3.13b) increased significantly soon after the exposure to
water. Within a few days the displacement rate reached values of about 50 µm/day.
Subsequently, it remained roughly constant for some time, resembling secondary creep.
This phase had a longer duration for specimen C3, sheared under a normal stress higher
than that of specimens C2 and C1. Furthermore, the higher the displacement rate in this
phase, the lower the normal stress. Finally, after 15-25 days of continuous exposure to
water, the displacement rate increased more rapidly to values typical of failure.
The specimens of the Costa della Gaveta soil tested in the Casagrande apparatus
experienced sudden failure, while the displacement rate increased progressively in the
Bishop apparatus. On the contrary, all specimens of bentonite experienced a progressive
increase of the displacement rate, until failure, independently of the used apparatus.
Figure 3.13a shows that the two specimens submitted to the same stress conditions in
different apparatuses (B1 and C1) exhibited a very similar behaviour in terms of
displacements against time. This can be considered a validation of the tests carried out by
means of the Casagrande apparatus, which are inevitably less accurate than those in the
Bishop apparatus.

3. Influence of pore fluid composition on creep behaviour
61
0.0
0.5
1.0
1.5
2.0
2.5
3.0
-20 -10 0 10 20 30
hori
zont
al d
ispl
acem
ent (
mm
) 1M NaCl solution
distilled water
C3
C2
B1C1
0
100
200
300
400
500
-20 -10 0 10 20 30
disp
lace
men
t rat
e (µ
m/d
ay) C3B1
C2C1
-0.1
0.0
0.1
0.2
0.3
0.4
0.5
0.6
0.7
0.8
-20 -10 0 10 20 30
heig
ht v
aria
tion
(mm
)
time (days)
C3
B1
C2
C1
a)
b)
c)
exposure to water
exposure to water
exposure to water
Figure 3.13 Effects of exposure to distilled water of bentonite reconstituted with 1 M NaCl
solution and subjected to stress-controlled tests: horizontal displacement, displacement
rate and height variations against time.

3. Influence of pore fluid composition on creep behaviour
62
Due to the exposure to water, all specimens exhibited swelling (Figure 3.13c), of
increasing magnitude with normal stress decreasing. Furthermore, the specimen tested in
the Bishop apparatus (B1) underwent more significant swelling than the specimen tested in
the Casagrande shear box (C1) under the same normal stress.
Besides the tests shown in Figure 3.13, additional tests were performed, during which
different technical difficulties arose. Typically, significant oxidation of the metallic
components in contact with the salt solution for long periods of time. Although the cell and
the components, where possible, were periodically cleaned, in some cases these
phenomena were found anyway responsible of additional friction between the two half-
boxes or within them, thus slowing down the displacements, impeding the correct
application of the normal loads and preventing free volume changes. The results of such
tests, however, are reported in Figure 3.14 in terms of horizontal displacements,
displacement rate and height variation against time during the force/stress-controlled
phase.
Notwithstanding the technical difficulties, all specimens reached failure, although with
displacement patterns that do not seem easily correlated to the stress state. For example,
specimens C2 and C4, which were tested under the same conditions, did not exhibit the
same displacement pattern. Specimens L8, sheared by a lower force than that applied on
C1, reached failure after a longer time than that needed for C1. This is consistent with the
fact that more time was needed to produce a larger decrease in the available strength.
However, specimen L9, sheared by a force which was higher than that on C1, did not reach
failure in a time shorter than that needed for this latter. The test on specimen L5 was not
considered for further interpretation because at the normal applied stress σ’n = 75 kPa
significant swelling took place before creep failure (Figure 3.14c), increasing the gap
between the box halves noticeably and thus possibly modifying the stress state of the
material along the slip surface.

3. Influence of pore fluid composition on creep behaviour
63
0.0
0.5
1.0
1.5
2.0
2.5
3.0
-20 -10 0 10 20 30 40 50 60
hori
zont
al d
ispl
acem
ent (
mm
) 1M NaCl solution
distilled water
C3
C2
B1C1
C4
L8L9
L13
L11
L5
pore pressure transducer removed, load piston changed
0
100
200
300
400
500
-20 -10 0 10 20 30 40 50 60
disp
lace
men
t rat
e (µ
m/d
ay)
time (days)
C3B1C2
C1 C4
L8
L9
L13
L11
L5
-0.5
0.0
0.5
1.0
1.5
2.0
2.5
3.0
-20 -10 0 10 20 30 40 50 60
heig
ht v
aria
tion
(m
m)
time (days)
C2B1
L5
C1
L13
C3
L8
C4
L11L9
a)
b)
c)
Figure 3.14 Horizontal displacements (a), displacement rate (b) and height variation (c)
against time for specimens of bentonite in the course of force/stress-controlled tests (all
tests).

3. Influence of pore fluid composition on creep behaviour
64
The displacement pattern of specimen L13 is significantly different from that of the other
specimen. In this case, a miniature pore pressure transducer which was installed inside the
specimen, close to the shear surface, may have slowed down the displacements noticeably.
In fact, after the removal of the transducer, the displacement rate increased noticeably, the
specimen exhibited swelling and it eventually reached failure within a few days.
After failure, the shear apparatuses were turned back to the displacement-controlled mode
(third test phase) and the specimens were sheared further in order to evaluate the available
shear strength. Figure 3.15, Figure 3.16, Figure 3.17 and Figure 3.18 show the results in
terms of shear strength and height variations undergone by specimens B1, C1, C2 and C3
respectively, against the cumulative horizontal displacement. The shear strength measured
during the first and the third test phases was plotted. For the second phase, the applied
shear stress is indicated.
Similarly to the specimens of the Costa della Gaveta soil, also the specimens of bentonite
exhibited, after failure, a shear strength not higher than the applied shear stress during the
creep phase, and much smaller than that exhibited while they were immersed in the 1 M
NaCl solution.
To observe the effect on shear strength of exposure to distilled water directly, the
specimens were sheared further, renewing the cell water frequently. All specimens
exhibited a continuous decrease in strength, until a minimum value, very close to that
obtained for the water-saturated specimens tested in a bath of distilled water. Furthermore,
all specimens continued to swell and, often, significant soil loss was seen from the gap
between the box halves. The test on specimen C2 (Figure 3.17) was interrupted before
reaching the minimum value of shear strength because the load piston was significantly
tilted, thus preventing the correct application of the normal load and the height variation.
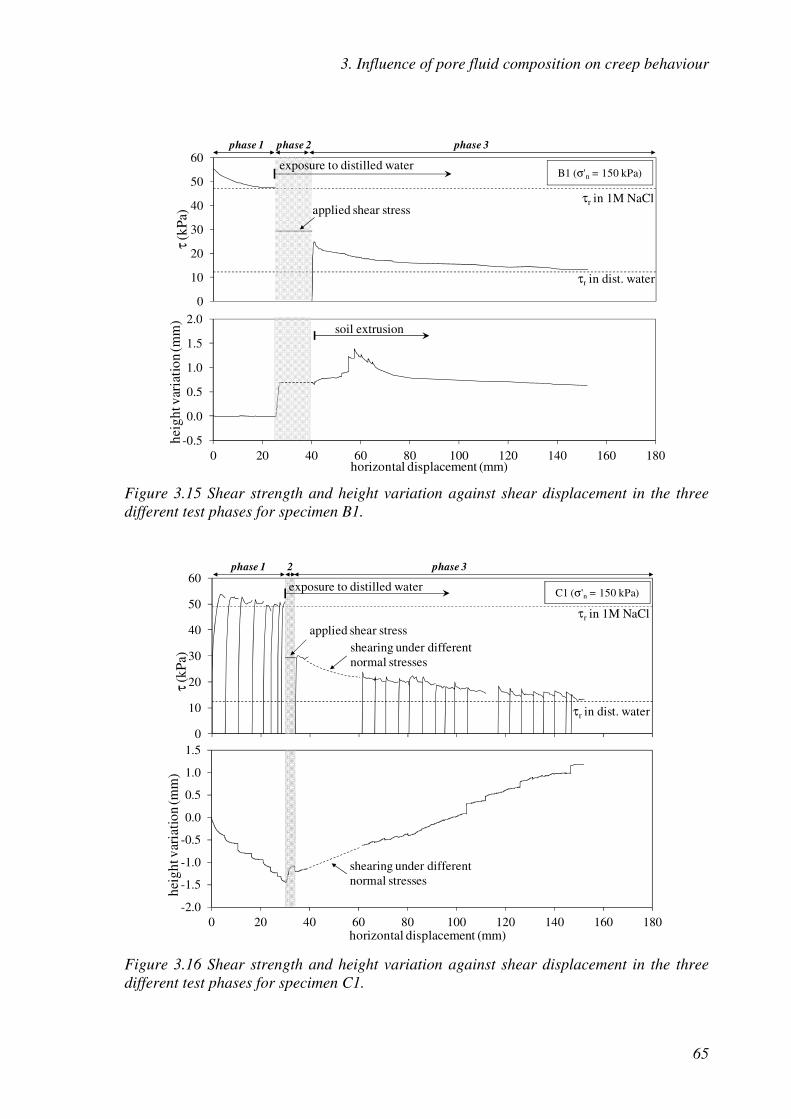
3. Influence of pore fluid composition on creep behaviour
65
0
10
20
30
40
50
60
τ(k
Pa)
τr in dist. water
B1 (σ'n = 150 kPa)
τr in 1M NaClapplied shear stress
phase 1 phase 2 phase 3
exposure to distilled water
-0.5
0.0
0.5
1.0
1.5
2.0
0 20 40 60 80 100 120 140 160 180
heig
ht v
aria
tion
(mm
)
horizontal displacement (mm)
soil extrusion
Figure 3.15 Shear strength and height variation against shear displacement in the three
different test phases for specimen B1.
0
10
20
30
40
50
60
τ(k
Pa)
τr in dist. water
C1 (σ'n = 150 kPa)
τr in 1M NaClapplied shear stress
phase 1 2 phase 3
shearing under different normal stresses
exposure to distilled water
-2.0
-1.5
-1.0
-0.5
0.0
0.5
1.0
1.5
0 20 40 60 80 100 120 140 160 180
heig
ht v
aria
tion
(mm
)
horizontal displacement (mm)
shearing under different normal stresses
Figure 3.16 Shear strength and height variation against shear displacement in the three
different test phases for specimen C1.

3. Influence of pore fluid composition on creep behaviour
66
0
20
40
60
80
100
τ(k
Pa)
τr in dist. water
τr in 1M NaCl
C2 (σ'n = 205 kPa)
phase 1 2 phase 3
applied shear stress
exposure to distilled water
-2.0
-1.5
-1.0
-0.5
0.0
0 20 40 60 80 100 120 140 160 180
heig
ht v
aria
tion
(mm
)
horizontal displacement (mm)
soil extrusion
Figure 3.17 Shear strength and height variation against shear displacement in the three
different test phases for specimen C2.
0
20
40
60
80
100
τ(k
Pa)
τr in dist. water
τr in 1M NaCl
C3 (σ'n = 287 kPa)
phase 1 2 phase 3
applied shear stress
exposure to distilled water
-2.5
-2.0
-1.5
-1.0
-0.5
0.0
0 20 40 60 80 100 120 140 160 180
heig
ht v
aria
tion
(mm
)
horizontal displacement (mm)
soil extrusion
Figure 3.18 Shear strength and height variation against shear displacement in the three
different test phases for specimen C3.

3. Influence of pore fluid composition on creep behaviour
67
At the base of the observed strength decrease, two time dependent processes can be
hypothesised: ion diffusion from the pore fluid (initially a concentrated salt solution) to the
cell fluid (distilled water), and osmotic water flow from the cell fluid toward the pores. The
processes can take place simultaneously, and both contribute to pore fluid concentration
decrease. Given the time dependence of the processes, the shear test results, already shown
in terms of horizontal displacements, should conveniently be analysed against time.
Figure 3.19a, Figure 3.20a, Figure 3.21a and Figure 3.22a, relative to specimens B1, C1,
C2 and C3 respectively, show the shear strength measured in the first and third test phases
(left axis) and the horizontal displacements measured in the second phase (right axis). The
figures also show the height variations undergone by the specimens during the three test
phases. For specimens B1 and C2 the cumulative amount of salt diffused outward from the
pores is also plotted (Figure 3.19c and Figure 3.21c respectively). This amount was
estimated by measuring the electrical conductivity in the cell fluid before each water
renewal.
After exposure to water, the shear strength decreased from point A to B to C. The way by
which it decreased from B to C has been directly evaluated and is shown by the figures. To
have an idea of how the strength decreased from A to B during exposure to water, it is
useful to compare the displacement and strength history of one of the specimens (e.g. C3,
Figure 3.22) to that of a similar material, Ponza bentonite (P in Figure 3.23), which, in
analogous test conditions, was sheared at constant displacement rate soon after exposure to
distilled water. Figure 3.23 shows that in A the two materials exhibited very similar values
of strength. From B to C, the observed strength patterns of the two specimens are very
similar too. It is reasonable to hypothesise that also from A to B the shear strength of C3
decreased similarly to that of P.
In order to evaluate whether and how ion and water diffusion occurred in the different test
phases, both the electrical conductivity of the cell solution and the specimens’ height were
monitored. In a saturated material, considering water incompressible, water diffusion
toward the specimens’ pores can actually happen only with a volume increase of the
specimen, therefore height variations are useful for its evaluation. However, a tendency of
water to diffuse can exist anyway also in absence of volume changes (e.g. in case they are
not allowed), producing pore pressure increase (i.e. osmotic pressure). This, in turn, would
3. Influence of pore fluid composition on creep behaviour
68
result in a decrease in the effective stresses and, consequently, in a decrease in the
available strength.
To convert electrical conductivity into concentrations, the conductivity of NaCl solution at
various concentrations in the range 0.001 M ≤ c ≤ 0.5 M was evaluated by means of a 4-
electrode conductivity cell, finding the following empirical relation: c = 4⋅10-6⋅κ1.1, in
which the salt concentration c is expressed in molarity M and the unit of electrical
conductivity, κ, is µS/cm. The values of κ are referred to 20°C. The relation provides
values consistent with those of the technical literature (e.g. Christian, 1994; Dominijanni et
al., 2013; Haynes, 2014).
By using the empirical relation, and under the hypothesis that NaCl is the only diffusing
salt, the cell solution concentration and the amount of NaCl diffused from the pores of the
specimen into the cell solution were evaluated (Figure 3.19c and Figure 3.21c).
The reliability of the interpretation has been verified on specimen O11, exposed to distilled
water in the course of an oedometer test. The comparison between the concentrations
derived from the empirical relation and those determined by a Na+ selective electrode is
reported in Figure 3.24. The figure compares the electrical conductivity of the cell fluid,
the amount of salt diffused from the pores and the height variation undergone by
specimens B1 and C2 against time. The maximum amount of salt expected to diffuse in the
cell, which is equal to the initial salt content of the pore solution is reported as well. The
figure shows that the process of ion diffusion began soon after exposure to water and that,
at the time of failure, the diffused NaCl was beyond 50% of the total.
Figure 3.24c reports the height variations undergone by the specimens after exposure to
water. The tendency to swell of the specimens some days after exposure to water can be
observed, although swelling became significant only when most of salt had diffused
outward from the pores. This is a process to investigate further.

3. Influence of pore fluid composition on creep behaviour
69
0
1
2
3
4
0
10
20
30
40
50
60
τ(k
Pa)
shear strength τr in dist. water
B1 (σσσσ'n = 150 kPa)
shear strength τr in 1M NaCl
shear stress τ applied in phase 2
shear displacement under constant shear stress
exposure to distilled water
A
B
C
shea
r dis
plac
emen
t (m
m)
curve obtained by the model with D* = 6 ⋅ 10-10 m2/s
ph.1 phase 2 phase 3
-0.5
0.0
0.5
1.0
1.5
2.0
heig
ht v
aria
tion
(mm
)
soil extrusion
0
50
100
150
200
0 10 20 30 40 50 60 70 80 90 100
NaC
l rem
oved
(mm
ol)
time (days)
a)
b)
c)
Figure 3.19 a) shear strength (left axis) and horizontal shear displacements (right axis); b)
height variation; and c) cumulative NaCl removed against time in the three test phases for
specimen B1.

3. Influence of pore fluid composition on creep behaviour
70
0
1
2
3
4
0
10
20
30
40
50
60
τ(k
Pa)
τ applied in phase 2
τr in water
C1 (σσσσ'n = 150 kPa)
τr in 1M NaCl
shear displacement under constant shear stress
exposure to distilled water
B
ph.1 phase 2 phase 3
A
C
shea
r dis
plac
emen
t (m
m)
D* = 6·10-10 m2/s
-2.0-1.5-1.0-0.50.00.51.01.5
0 10 20 30 40 50 60 70 80 90 100
heig
ht v
aria
tion
(mm
)
time (days)
a)
b)
Figure 3.20 a) shear strength (left axis) and horizontal shear displacements (right
axis);and b) height variation against time in the three test phases for specimen C1.

3. Influence of pore fluid composition on creep behaviour
71
0
1
2
0
20
40
60
80τ
(kP
a)
τ applied in phase 2
τr in water
C2 (σσσσ'n = 205 kPa)
τr in 1M NaCl
exposure to distilled water
shear displacement under constant shear stress
ph.1 phase 2 phase 3
A
B
shea
r dis
plac
emen
t (m
m)
D* = 6·10-10 m2/s
-2.0
-1.5
-1.0
-0.5
0.0
heig
ht v
aria
tion
(mm
)
soil extrusion
0
0.2
0.4
0.6
0.8
1
0
10
20
30
40
50
0 10 20 30 40 50 60 70 80 90 100 NaC
l con
cent
ratio
n (m
ol/l
)
NaC
l rem
oved
(mm
ol)
time (days)
average concentration (deduced from NaCl removed)
concentration on the shear surface (model)
average concentration (experimental)
a)
b)
c)
Figure 3.21 a) shear strength (left axis) and horizontal shear displacements (right axis); b)
height variation; and c) cumulative NaCl removed (left axis) and concentration (right axis)
against time in the three test phases for specimen C2.

3. Influence of pore fluid composition on creep behaviour
72
0
1
2
3
0
20
40
60
80
100τ
(kPa
)
τ applied in phase 2
τr in water
C3 (σσσσ'n = 287 kPa)
τr in 1M NaClexposure to distilled water
shear displacement under constant shear stress
ph.1 phase 2 phase 3
A
B
C
shea
r dis
plac
emen
t (m
m)
D* = 6·10-10 m2/s
-2.5
-2.0
-1.5
-1.0
-0.5
0.0
0 10 20 30 40 50 60 70 80 90 100
heig
ht v
aria
tion
(mm
)
time (days)
soil extrusion
a)
b)
Figure 3.22 a) shear strength (left axis) and horizontal shear displacements (right axis);
and b) height variation against time in the three test phases for specimen C3.
0
1
2
3
0.0
0.1
0.2
0.3
0.4
0 10 20 30 40 50 60 70
τ/ σ
' n
time (days)
Ponza bentonite, Di Maio 1996a (shear strength) C3 (shear strength) C3 (displacements)
τr in 1M NaCl
τr in water
shear stressapplied in phase 2
A
shea
r dis
plac
emen
t (m
m)
B
C
manual cut
D* = 6·10-10 m2/s
exposure to distilled water
Figure 3.23 Horizontal shear displacements (right axis) and shear strength (left axis) of
specimen C3 compared to the shear strength of the Ponza bentonite (Di Maio, 1996a)
during exposure to distilled water (Di Maio and Scaringi, 2015).

3. Influence of pore fluid composition on creep behaviour
73
0
1000
2000
3000B1
C2
elec
tric
al c
ondu
ctiv
ity, κ
(µS/
cm)
1
10
100
1000
NaC
l dif
fuse
d (m
mol
)
B1 - estimd from κ
C2 - emated from κ
O11 est
O11 (Na+)
model B1
B1C2O11O11 (measured Na+)calculated with D* = 6⋅10-10 m2/s
initial NaCl in B1
initial NaCl in C2
initial NaCl in O11
= failure
-0.5
0.0
0.5
1.0
1.5
2.0
2.5
3.0
0 15 30 45 60 75
B1
C3
C1
C2 = failure
∆h
(mm
)
a)
b)
c)
time (days)
Figure 3.24 Electrical conductivity, κ, of the cell water of some specimens before each
water renewal (a), cumulative amount of NaCl diffused from the pores in the cell solution
(b), swelling of all the specimens after exposure to distilled water (c) (Di Maio and
Scaringi, 2015).

3. Influence of pore fluid composition on creep behaviour
74
Figure 3.25 reports the estimated average NaCl concentration in the pore fluid against time
for several specimens of bentonite. It can be noticed, with the exception of specimen L13,
that the curves do not show sudden slope changes. As a matter of fact, the specimens were
exposed to water both in the force/stress-controlled phase and in the subsequent
displacement-controlled phase. The regularity of the curves can be considered a proof of
the independence of ion diffusion of the shearing mode. On the contrary, the non regular
shape of the curve can be a symptom of an incorrect course of the test. In the case of
specimen L13, it can be seen that ion diffusion was, initially, much slower than other
specimens in the same stress conditions (e.g. L8). This probably happened because of the
used load piston (built specially to allow the insertion of the pore pressure transducer) and
the absence of the upper porous plate, which did not allow free drainage and diffusion. In
fact, after its removal and substitution with standard piston and plate, ion diffusion
accelerated. If to look to Figure 3.25, it is also possible to see that specimen L11, initially
in equilibrium with 0.6 M NaCl solution, experienced a slower concentration decrease than
expected on the basis of other tests and for this reason, probably, reached failure in a
longer time.
0.0
0.1
0.2
0.3
0.4
0.5
0.6
0.7
0.8
0.9
1.0
0 10 20 30 40 50 60 70
aver
age
NaC
l con
cent
ratio
n in
the
pore
flui
d (m
ol/l)
time since the exposure to water (days)
B1 - estimated from κC2 - estimated from κL5 - estimated from κL8 - estimated from κL9 - estimated from κL11 - estimated from κL13 - measuredcreep failure
Figure 3.25 Estimated average NaCl concentration in the pore fluid for several specimens
of bentonite, during the creep phase and the subsequent displacement-controlled phase.

3. Influence of pore fluid composition on creep behaviour
75
Figure 3.26 shows the estimated average NaCl concentration in the pore fluid of the
specimens shown in Figure 3.25 against the displacement rate during the creep test. It can
be seen that most of the specimens submitted to an average shear stress intermediate
between the strength in water and that in 1M NaCl solution (B1, C2, L11) exhibited
noticeable acceleration, and thus “failure”, when the estimated concentration was around
0.4 mol/l. Actually, for such concentration, a residual friction angle of about 11° is
estimated for bentonite (Figure 2.22). As a matter of fact, the points representing the shear
stress applied to these specimens, in a σ’-τ plot, lie on a line through the origin having ϕ’ =
11°. The shear stress applied on specimen L8 was lower than that applied on B1. In fact,
the specimen reached failure when the average concentration in the pore fluid was lower.
On the contrary, probably because of technical problems, the specimen L9, submitted to a
shear stress higher than that on B1, did not experience failure while the NaCl concentration
in the pore fluid was still higher. Finally, possibly because of the noticeable swelling and
the increasing gap between the box halves, as discussed, specimen L5 reached failure only
when the NaCl concentration in the pores was significantly lower than expected.
0.0
0.1
0.2
0.3
0.4
0.5
0.6
0.7
0.8
0.9
1.0
0.1 1 10 100 1000 10000
aver
age
conc
entr
atio
n in
the
por
e fl
uid
(mol
/l)
displacement rate (µm/day)
L5
L8
L9
L11
B1
C2
Figure 3.26 Estimated average NaCl concentration in the pore fluid against displacement
rate during force/stress-controlled tests on several specimens of bentonite.

3. Influence of pore fluid composition on creep behaviour
76
Regarding the possibility of pore pressure changes, an attempt was also made to measure
pore water pressures during exposure to distilled water of specimen L13 by means of a
miniature pore pressure transducer installed in a Casagrande device very close to the shear
surface. Figure 3.27 shows that during the monitoring period, while salt was diffusing into
the cell fluid, no significant pore pressures variations occurred, thus suggesting that the
process is drained.
0
6
12
18
24
30
-12
-6
0
6
12
18
24
30
0 5 10 15 20 25 30
cum
ulat
ive r
emov
ed sa
lt (m
mol
)
pore
pre
ssur
es (k
Pa)
time (days)
pore pressures cumulative removed salt
L13 - Bentonite, σ'n =150 kPa, Casagrande apparatus
Figure 3.27 Pore pressures on the shear surface and cumulative removed salt against time
for a specimen of bentonite, pre-sheared to the residual condition in 1 M NaCl solution,
exposed to distilled water and then submitted to a force-controlled test in the Casagrande
apparatus.
The transducer was removed because it was disturbing the course of the test, probably
because it was placed too close to the shear surface and because the load piston was not
free to slide in the vertical direction and was not allowing ion diffusion and drainage from
the top of the specimen. Figure 3.14 shows, in fact, that after the transducer was removed
and the piston changed the displacement rate increased noticeably, reaching failure in a
few days.

3. Influence of pore fluid composition on creep behaviour
77
3.3.2 Water content and pore ion concentration at the end of the tests
At the end of the tests, the specimens were removed from the shear box and some of them
were oven-dried to determine the final pore fluid concentration. The measurement was
carried out following the test procedure already described in section 4.2. Table 3.4 reports
the estimated average concentrations in the specimens at the end of the tests. The results
are in good agreement with the estimation made from the measurements of the salt diffused
in the cell fluid before each cell water renewal.
Specimen Concentration estimated from the ions diffused in the cell fluid (M)
Concentration estimated from the ions left in the pores (M)
B1 0.00 0.11
C2 0.34 0.30
L5 0.15 0.11
L8 0.28 0.31
L9 0.41 0.53
L11 0.42 0.41
L13 0.24 0.25
Table 3.4 Estimated NaCl concentrations in several specimens at the end of the tests.
In some cases, the specimens were cut in slices and submitted to chemical analyses
separately in order to evaluate possible variations along the height. Figure 3.28 shows the
water content and the Na+ concentration evaluated on horizontal slices of specimens B1,
C2, L5, L8, L9 and L11. The position of the shear surface and the initial water content of
the specimens before the exposure to water are also shown.
All specimens exhibited a water content higher than the initial one, as a consequence of
swelling. In specimen B1, tested in the Bishop apparatus, the water content close to the
shear surface is significantly higher than that above and below it. The result was obtained
along two opposite verticals of the specimen. On the contrary, the Na+ concentration does
not seem to vary significantly. In specimen L11, instead, the Na+ concentration close to the
shear surface seems lower than elsewhere, possibly because of the direct contact with the
cell water. In this specimen, the material submitted to the analyses was taken close to the
outer ring, in the core and close to the inner ring.

3. Influence of pore fluid composition on creep behaviour
78
0
2
4
6
8
10
12
14
16
0.3 0.6 0.9 1.2 1.5
z (m
m)
w0.00 0.25 0.50
Na+ (mol/l)
vertical 1
vertical 2
specimen B1, σ'n = 150 kPa (Bishop)
shear surface
0
3
6
9
12
15
18
21
24
27
0.3 0.6 0.9 1.2 1.5
z (m
m)
w0.00 0.25 0.50
Na+ (mol/l)
specimen C2, σ'n = 205 kPa (Casagrande)
shear surface
0
4
8
12
16
20
24
0.3 0.6 0.9 1.2 1.5
z (m
m)
w0.00 0.25 0.50
Na+ (mol/l)
specimen L5, σ'n = 75 kPa (Casagrande)
shear surface
0
5
10
15
20
25
0.3 0.6 0.9 1.2 1.5
z (m
m)
w
vertical 1 (outer)vertical 2 (inner)vertical 3 (outer)
0.00 0.25 0.50Na+ (mol/l)
specimen L8, σ'n = 150 kPa (Casagrande)
shear surface
0
5
10
15
20
25
0.3 0.6 0.9 1.2 1.5
z (m
m)
w
vertical 1 (outer)vertical 2 (inner)vertical 3 (outer)
0.20 0.45 0.70Na+ (mol/l)
specimen L9, σ'n = 150 kPa (Casagrande)
shear surface
0
5
10
15
20
0.3 0.6 0.9 1.2 1.5
z (m
m)
w
vertical 1 (external)vertical 2 (core)vertical 3 (internal)
0.20 0.45 0.70Na+ (mol/l)
specimen L11, σ'n = 150 kPa (Bishop)
shear surface
initi
al w
initi
al w
initi
al w
initi
al w
initi
al w
initi
al w
Figure 3.28 Water content and sodium concentration evaluated in several specimens of
bentonite after the end of the shear tests.

3. Influence of pore fluid composition on creep behaviour
79
The specimens tested in the Casagrande apparatus, with the exception of L5, compressed
under a low normal stress (75 kPa), showed a lower water content increase from the initial
one than the specimen B1, tested in the Bishop apparatus. The water content does not seem
to vary significantly in the vertical direction; the sodium concentration in the pore fluid
seem to increase towards the top of the specimen, where it is in contact with the upper
porous stone. It is possible that the top drainage is not as effective as the bottom one,
possibly also because the top plate can be sometimes not submerged by water during the
test. Furthermore, in specimens L8 and L9, in which the concentrations were evaluated
along few verticals, it can be seen that they are higher in the core of the specimens than
towards their borders.

3. Influence of pore fluid composition on creep behaviour
80
3.4 MODELIZATION OF ION DIFFUSION
AND STRENGTH REDUCTION
The results of the stress-controlled tests, as a whole, suggest that the observed “creep
behaviour” was due to a decrease in pore ion concentration.
To a first approximated evaluation of the transient process of ion concentration decrease on
the shear surface and to understand the spatial variability within the specimen, a simplified
model was formulated using the commercial software CTRAN/W (Krahn, 2008).
The code solves the diffusion problem by the Fick law along with the continuity equations,
under the hypothesis of absence of other coupled flows. In particular, the code does not
consider volume changes due to variations in pore solution concentration. Thus, in the
present case, in the absence of hydraulic gradients, the water velocity is zero and the soil
hydraulic conductivity does not influence the process. This simplification can be accepted
because, for the tested clay, for which k < 10-10 m/s, a diffusive dominated process is
hypothesised (Shackelford, 2014).
The code was used in axisymmetric configuration, thus simulating the ring shear geometry
rigorously and with an acceptable approximation the direct shear box which has a square
horizontal section.
The scheme (Figure 3.29) considers the specimens connected to the cell water laterally, in
correspondence with the interface between the two halves of the shear box, and at the
contact with the porous stone and the porous plate. These latter are simulated as porous
media with porosities: n = 0.32 and n = 0.15 respectively.
The initial conditions are set by imposing c0 = 1 M in any point of the specimen, stones
and plates, as in the experimental conditions, and c0r = 0 in any point of the water reservoir.
The difference in concentration triggers the outward ion diffusion. Thus ion concentration
in the reservoir increases with time, and it is turned to zero to simulate the cell water
renewals of the experimentation.

3. Influence of pore fluid composition on creep behaviour
81
The parameters of the transport differential equations used by the code (Freeze and Cherry,
1979) are the hydrodynamic dispersion coefficient D and the average linear velocity of the
pore fluid v. In our simulation, the latter parameter is null and thus the hydrodynamic
dispersion coefficient D is equal to the diffusion coefficient D*. The values of D* in the
pore solution, in the cell water and in the porous stone/plate water must be assigned
(Figure 3.29).
The effective diffusion coefficient D* = 6·10-10 m2/s was assumed for the pore solution.
Such value is very close to those reported in the literature for similar cases (Gajo and
Loret, 2004; Dominijanni et al., 2013; Shackelford, 2014). With such value, the calculated
amount of salt diffused in the cell solution compares satisfactory with the experimental
results (Figure 3.24b for specimens B1 and C2), particularly during the stress-controlled
phase. Figure 3.30 shows the influence of the choice of D* on the cumulated amount of
salt diffused outwards from the pores for the case of specimen B1.
In the cell water and in the pores of stones/plates, D* = 1.5·10-9 m2/s was assumed. The
value refers to dissolved NaCl at a temperature of about 20°C, in free water at infinite
dilution (Li and Gregory, 1974). Such hypothesis has been considered acceptable because
the concentration never exceeded 0.06 M in the cell water, and was equal to 1 M in the
pores of stones/plates only at the beginning of the test. For 1 M, a maximum variation of
D* of 8% is expected (Robinson and Stokes, 2002).
The inner and the outer radii of the ring shear specimen (Figure 3.29b) correspond to the
real one. The radius used to simulate the direct shear specimen, r = 3.39 cm (Figure 3.29a),
is such that the resulting horizontal section is equal to 36 cm2, as the real one. However,
this results in a smaller perimeter in direct contact with the cell water: 21.3 cm instead of
24 cm. The choice of maintaining the actual section instead of the actual perimeter was
made in order to simulate the total contaminant mass correctly.

3. Influence of pore fluid composition on creep behaviour
82
r2 = 7.62 cmr1 = 5.08 cm,
specimenc0 = 1 M
D* = 1.5 ·10-9 m2/s
b) ring shear model
r = 3.39 cm
water reservoir: c
0r = 0
D* =
1.5 ·10-9m
2/s
specimenc0 = 1 M
D* = 6 ·10-10 m2/s
porous plate c0 = 1 MD* = 1.5 ·10-9 m2/s
a) direct shear model
porous platec0 = 1 M
D* = 1.5 ·10-9 m2/s
porous stonec0 = 1 M
D* = 1.5 ·10-9 m2/s
water reservoir: c
0r = 0, D
* = 1.5 ·10
-9m
2/swat
er re
serv
oir:
c0r
= 0
, D*
= 1
.5 ·
10-9
m2 /
s
c0 = 1 MD* = 6 ·10-10 m2/s
Figure 3.29 Model of ion diffusion in the direct shear and in the Bishop ring shear
apparatuses with the indication of initial concentrations and diffusion coefficients D*.

3. Influence of pore fluid composition on creep behaviour
83
0
50
100
150
200
0 10 20 30 40 50 60 70
NaC
l dif
fuse
d (m
mol
)
time (days)
initial NaCl in B1
model:D = 8 ⋅ 10-10 m2/sD = 6 ⋅ 10-10 m2/sD = 4 ⋅ 10-10 m2/s
Figure 3.30 Comparison between the cumulative amount of NaCl diffused from the pores
of specimen B1 in the cell solution, evaluated experimentally and by the numerical model
using different diffusion coefficients.
The height of the specimen was set equal to its real one at the time of exposure to distilled
water. Due to the software limitations, the height had to be assumed constant in the
simulation. For the porous stones and plates the actual height was used as well. Similarly,
the actual box thickness was used. The spacing between the two halves of the shear box
was estimated, for the ring shear box, from the vertical movements of the upper box, which
can be directly measured. The cell water domain was shaped so that its volume would be
equal to the actual one (i.e. 500 cm3 in the ring shear and 160 cm3 in the direct shear box).
The model provides the concentration distribution of the ions in each point of the domain
at any time. Figure 3.31 reports the concentration distribution in the ring shear specimen
(B1) and in the porous stones and plates at given times. It can be seen that the shear surface
is generally characterised by lower concentrations than in the rest of the specimen due to
the direct, lateral contact with the water reservoir. In fact, outward diffusion from the
specimen’s pores occurs through the direct contact with the cell first and then also through
the porous plates and stones, which are saturated with the 1M NaCl solution at the
beginning of the exposure. Only after some days, the concentration decrease in the porous
stones and plates triggers significant diffusion also between them and the specimen.

3. Influence of pore fluid composition on creep behaviour
84
1 day 2 days
5 days 10 days
15 days 20 days
Figure 3.31 Concentration distribution within the specimen, the porous plates and stones
in the Bishop ring shear at different times. Red colour corresponds to 1 M, blue colour to
distilled water. The simulation refers to specimen B1 assuming D* = 6⋅10-10
m2/s.
3. Influence of pore fluid composition on creep behaviour
85
The distribution of ion concentration on the shear surface corresponding to D* = 6·10-10
m2/s is shown in Figure 3.32a for the case of specimen B1. The figure shows the negligible
difference with the isochrones of concentration calculated at 50 days taking into account
also the inward water flow during swelling.
Using the relation between the residual friction angle and pore solution concentration of
Figure 2.22, interpolated as in Figure 3.33 for bentonite, obtained in the absence of
chemical gradients, it is possible to hypothesise a strength distribution on the shear surface
(Figure 3.32b) and hence an average shear strength as a function of time, under the
hypothesis of a drained process. Figure 3.34 shows a good agreement between the
calculated average shear strength and the shear strength measured in the third shearing
phase for specimen B1. For comparison, the curve of the average NaCl concentration on
the shear surface is also reported. Figure 3.35 shows the average concentration profiles
along the height of specimens B1 and C2 calculated by the model at the end of the tests.
The model compares satisfactory with the experimental data.
The results of the modelization are also reported in Figure 3.19-Figure 3.23 which show
that the curves obtained for the different specimens interpret satisfactory the experimental
data during the shear test from B to C for the used commercial bentonite and from A to C
for the Ponza bentonite. It seems reasonable to assume that they also interpret the strength
decrease during the transient phase from A to B under constant shear stresses. This phase
thus appears as a fundamentally drained process in which the relation between shear
strength and average pore ion concentration on the slip surface is similar to that reported in
Figure 3.33, evaluated in the absence of chemical gradients for specimens reconstituted
with and immersed in the same solution.

3. Influence of pore fluid composition on creep behaviour
86
0
0.2
0.4
0.6
0.8
1
conc
entr
atio
n (M
)
t = 0
10
30
5 days
20
5040
t = tfailure
average concentration at t = tfailure
t = 50 days considering
swelling
0
10
20
30
40
50
50 60 70 80
τ r(k
Pa)
r (mm)
5 days
10
20
304050
applied shearstress
τr in distilled water
t = 0
t = 50 days considering swelling
t = tfailure
a)
b)
Figure 3.32 Calculated ion concentration isochrones (a) and available shear strength (b)
on the shear surface along the radius of the specimen B1 during the diffusion process,
assuming D* = 6·10-10
m2/s (Di Maio and Scaringi, 2015.

3. Influence of pore fluid composition on creep behaviour
87
0
5
10
15
20
0 1 2 3 4
ϕ' r
(°)
Molarity, M
Casagrande
Bishop
Bromhead
σ'n = 150 kPa
ϕ'r = ϕ'r(M=1) ⋅ M0.3
Figure 3.33 Residual friction angle of bentonite against molarity of the pore NaCl solution
and interpolating curve between 0.01 M and 1 M (Di Maio and Scaringi, 2015).
0
10
20
30
40
50
0.0
0.2
0.4
0.6
0.8
1.0
0 20 40 60
NaC
l con
cent
rati
on (M
)
τ (
kPa)
time (days)
NaCl cmeasured
(model)
B1 (σ'n = 150 kPa)
NaCl concentrationτ (measured)τ (model)
Figure 3.34 Calculated and measured shear strength during exposure to water of specimen
B1, and average NaCl concentration on the shear surface (Di Maio and Scaringi, 2015).

3. Influence of pore fluid composition on creep behaviour
88
0
2
4
6
8
10
12
14
16
0.00 0.25 0.50
heig
ht (m
m)
Na+ (mol/l)
vertical 1
vertical 2
model
0
3
6
9
12
15
18
21
24
27
0.00 0.25 0.50he
ight
(mm
)
Na+ (mol/l)
vertical 1
model
specimen B1σ'n = 150 kPa
(Bishop)
shear surface
shear surface
specimen C2σ'n = 205 kPa (Casagrande)
Figure 3.35 Na+ concentration profiles along the height of two specimens of bentonite at
the end of the test: comparison between measured values and result of modelization (D* =
6·10-10
m2/s).

3. Influence of pore fluid composition on creep behaviour
89
3.5 DISCUSSION
Different studies on soil creep consider that a threshold stress equal to the residual shear
strength exists for shear creep (among others: Yen, 1969; Suhaydu and Prior, 1978;
Iverson, 1985). For intact materials, some Authors (e.g. Ter-Stepanian, 1963; 1992)
assume that the creep threshold can be even higher than the residual strength. On the other
hand, all agree on the absence of tertiary creep for applied stresses lower than the residual
strength. Recently, Bhat et al. (2011) and Di Maio et al. (2013) reported experimental
results showing that, for τ < τr, only primary creep with decreasing displacement rate
occurs.
However, the residual strength can vary even under constant effective normal stress. In this
section, in particular, the case in which the variation is caused by exposure to distilled
water of a specimen reconstituted with a concentrated salt solution was shown. If the
applied stress is lower than the initial strength in the solution and higher than that in
distilled water, the difference τ-τr can decrease, leading the material to failure.
The process of pore solution concentration decrease during the creep tests described in
section 3 occurs under constant total stresses and hydraulic boundary conditions, that is
under presumed constant effective stresses. If it is so, the observed effects of such process
can meet the description of a creep phenomenon. However, different Authors discussed the
possibility that pore water pressures may change during the process of exposure to a fluid
different from the pore fluid, as an effect of osmotic processes at the scale of the specimen
(Mitchell et al., 1973; Barbour and Fredlund, 1989, Gajo and Loret, 2004; Musso et al.,
2013), as well as an effect of the diffusion of high concentration ionic front (Santamarina
and Fam, 1995).
In the case of the exposure to a concentrated salt solution of a clay initially saturated with
distilled water, which is the most studied case in the literature, several Authors (Kemper
and Rollins, 1966; Farrar and Coleman, 1967; Barbour and Fredlund, 1989; Mitchell,
1991; Malusis et al., 2003) showed that the outward osmotic water flow may be significant
only in very dense clays, characterised by low porosity, and in dilute electrolytes. On the

3. Influence of pore fluid composition on creep behaviour
90
contrary, with increasing void ratio and electrolyte concentration, ion diffusion prevails.
Dominijanni et al. (2013), while testing a sodium montmorillonite with characteristics
similar to those of the bentonite whose results are reported in this work, showed that the
osmotic efficiency ω, a measure of the extent to which the theoretical osmotic pressure
develops (Mitchell and Soga, 2005), is practically null for concentration higher than 0.1
mol/l.
The case of a clay saturated with a salt solution and exposed to distilled water was
analysed by Gajo and Loret (2003) who modelled the behaviour of the Ponza bentonite in
oedometer and compared the theoretical results in terms of volume change against time
with those obtained by Di Maio (1996a) in the laboratory. According to their model,
significant pore pressure variations associated to osmotic processes should arise. In the
case shown in this section, the direct contact of the slip surface with the cell solution
probably allowed for a quick dissipation of possible pore pressure gradients. As a matter of
fact, the trends of shear strength or displacement do not seem to reveal pore pressure
variations on the shear surface. In particular, the shear strength decrease during exposure to
distilled water could be interpreted by the relation between ion concentration and residual
shear strength found for specimens exposed to the same solution as the pore solution and
sheared in drained conditions. A first attempt to measure pore pressures by means of a
miniature transducer installed in the specimen close to the slip surface did not reveal any
pore pressure increments in the course of a stress controlled shear test on a bentonite
specimen (Figure 3.27).
At the field scale, the decrease in pore solution concentration in the material along the slip
surface of a landslide in clay soils, such as the Costa della Gaveta landslide, could result in
a decrease in the available strength, under conditions which are similar to those reproduced
in the laboratory, i.e. in the residual state and under constant normal effective stress and
applied shear stress. A process of pore solution concentration decrease could thus be a
“hidden” cause of the landslide viscous displacements, which is neglected if a merely
mechanical approach is used for the study of the landslide behaviour.

91
4 PORE FLUID COMPOSITION IN CLAYS
OF MARINE ORIGIN
This section consists of two parts. In the first one, some data on pore fluid composition
available in the technical literature are reviewed. They refer to different clay formations in
different sites of the world. The possible causes of spatial and temporal variability of the
pore fluid composition, when analysed, are reported. In the second part, the results relative
to the Costa della Gaveta soil are shown. Both chemical and electrical analyses have been
carried out for the evaluation of pore fluid composition. In addition, some preliminary
electrical analyses were performed to evaluate the electrical resistivity of soil specimens.

4. Pore fluid composition in clays of marine origin
92
4.1 DATA FROM LITERATURE
In order to get a first idea of pore fluid composition of marine origin clays, it is interesting
to analyse both data relative to clay formations which are submerged under the sea and
data relative to emerged clay formations.
Different Authors reported that the pore fluid composition of clay sediments under the
seafloor can differ from that of the overlying seawater due to several processes. The
concentration profiles determined by Comas et al. (1996) in Quaternary clay and silty clay
sediments under the seafloor of the Central Tyrrhenian Sea, show that (Figure 4.1) the
values of Na+ and Ca2+ concentrations are everywhere higher than in seawater and
increasing with depth. On the contrary, they measured concentrations of K+ decreasing
with depth, from values higher than those in seawater to lower values. While the increase
of sodium and calcium concentrations was correlated to upward ion diffusion from an
underlying Messinian brine layer, the decrease in potassium concentration was attributed to
the adsorption of potassium by clays. The pore fluid salinity of submerged clay formations
can reach saturation, as reported by Van Paassen and Gareau (2004) for the Quaternary
sediments under the Caspian Sea (Figure 4.2). The Authors attributed the high salinity to a
possible upward water flow from a deep halite deposit.
Concentrations which are significantly lower than those in seawater are possible as well. In
Quaternary silty clay sediments under the Strait of Sicily, Emeis et al. (1996) found a
decreasing total salinity with depth from 38 g/kg at the seafloor to 34 g/kg at 50 m depth
(Figure 4.3). A decrease of the same magnitude was not observed in chloride but in
sulphate concentration. This was attributed to bacterial activity and to diagenetically-
induced calcium and magnesium depletion.

4. Pore fluid composition in clays of marine origin
93
Figure 4.1 Salinity, concentrations of the main ions and pH profiles against depth below
seafloor in borehole 974B, Central Tyrrhenian Sea (Comas et al., 1996).
Figure 4.2 Pore fluid salinity against depth below seafloor for a borehole in the Caspian
Sea (Van Paassen and Gareau, 2004).

4. Pore fluid composition in clays of marine origin
94
Figure 4.3 Salinity, Cl-, K
+ and SO4
2- concentrations against depth below seafloor in
borehole 963A, Strait of Sicily (Emeis et al., 1996b).
As a consequence of the tectonic uplift, a marine-origin clay formation can be exposed to
rainwater and freshwater from confining formations. A process of salt leaching due to the
exposure to water is well known for the Quick Clays (e.g. Bjerrum, 1954, Rosenqvist,
1955). Figure 4.4 (from Helle et al., 2009) shows an example of geotechnical profile in
Quick Clays in Norway. Figure 4.5 (from Andersson-Sköld et al., 2005) shows the Na+
concentration and the electrical conductivity against depth for the pore fluid squeezed out
from the soil samples cored in a Quick Clay site in Sweden. Ion concentrations were
determined by means of ICP-AES and ICP-SMS spectrometers. Figure 4.4 shows the
noticeable salinity decrease from the depth towards the ground surface, which was
attributed to a downward freshwater flow. On the contrary, Figure 4.5 shows an increase of
sodium concentration towards the surface, which was found consistent with an upward and
lateral freshwater flow from the adjacent and underlying bedrock.

4. Pore fluid composition in clays of marine origin
95
Figure 4.4 Geotechnical profile of a borehole in the Quick Clay deposit in Smorgrav,
Norway (Helle et al., 2009).
Figure 4.5 Na+ concentration, electrical conductivity and sensitivity against depth in a
Quick Clay at Surte, Sweden (Andersson-Sköld et al., 2005).

4. Pore fluid composition in clays of marine origin
96
Similar profiles, due to the contact with more permeable formations, were found by
Aylsworth and Hunter (2004), while investigating a sensitive marine clay formation near
Ottawa (Canada) by means of in situ measurements of electrical conductivity. Pearson et
al. (2003) and Turrero et al. (2006) also reported significant concentration gradients (from
12 g/l to 2 g/l of Cl- in 150 m) within the Opalinus clay formation in Switzerland, which
were attributed to the lateral contact with a more permeable formation (Figure 4.6). In their
study, chloride concentration was measured in undisturbed samples of pore water squeezed
out by means of a downhole equipment. Quigley et al. (1983) determined the pore fluid
salinity profiles against depth from the ground surface in several boreholes in the Leda clay
formation in Canada. They found a significant salinity increase with depth in some cases,
while in other cases a decrease down to very low values (as in Figure 4.7). Rather than to
leaching, the Authors attributed such profiles to salt diffusion towards the ground surface
and towards an underlying formation characterised by low ion concentration.
Figure 4.6 Chloride concentration profile in the Opalinus clay formation (Pearson et al.,
2003).

4. Pore fluid composition in clays of marine origin
97
Figure 4.7 Geotechnical profile in the Leda clay formation (Quigley et al., 1983).
Figure 4.5 shows that sodium concentration and electrical conductivity of the pore fluid are
strongly correlated, since NaCl is the prevailing solute. In addition, pore fluid salinity can
be also correlated to the electrical resistivity of the system soil-pore fluid, as shown by
Figure 4.8 for various Quick Clay sites. This is of practical interest for pore fluid and
mechanical characterisation of the clay.
Salt leaching through the clay formation towards an aquifer can lead to a significant
salinity increase in this latter. Walraevens et al. (2007) reported the groundwater
composition of a large aquifer in the Flandres, Belgium. Field data show how, along its
flow path, the freshwater in the sands is gradually enriched of ions coming from the clay
layer (Figure 4.9). The Authors also showed that a simple transport-reaction model can
reproduce field data satisfactory.

4. Pore fluid composition in clays of marine origin
98
Figure 4.8 Electrical resistivity against salt content in Quick Clay sites (Long et al., 2012).
The study of hydrogen and oxygen isotopes can be helpful for pore fluid dating and reveal,
perhaps surprisingly, that after million years a clay formation can still preserve part of the
original pore fluid. In fact, on the basis of measurements of deuterium and oxygen-18 in
the pore water, and by means of a diffusion model, Rubel et al. (2002) inferred that the
core of the Opalinus clay formation still contains part of the original pore fluid,
notwithstanding a 10 million years long lateral exposure to fresh water (Figure 4.10). Cervi
et al. (2012), by means of isotopic analyses, could assess the presence of a deep source of
water with higher ion concentration in the Ca’ Lita landslide in Italy, in which the pore
fluid has a salinity of about 1 g/l upslope and 6 g/l downslope. De Craen et al. (2006)
reported the concentration profiles of the pore fluid squeezed out from the cored samples
of the Boom Clay in the Essen-1 borehole, Belgium. As shown in Figure 4.11, Na+ is the
main dissolved cation and its concentration increases significantly with depth, where the
formation is in contact with a salt-rich aquifer. De Craen et al. (2006) also reported the
deuterium and oxygen-18 concentration profiles and inferred that pore fluid in Essen-1 is a
mix of meteoric water and seawater (92% and 8% respectively). A further insight on the
potential of isoopic analysis in landslide studies can be found in Bogaard et al. (2007).

4. Pore fluid composition in clays of marine origin
99
Figure 4.9 Sodium concentration in the groundwater in the aquifer underlying the
Bartonian Clay formation (Belgium). The lines represent the results of the model
implemented by Walraevens et al. (2007). Figure from Walraevens et al. (2007).
Figure 4.10 Deuterium δD and Oxygen δ18O profiles in the Opalinus Clay, Switzerland
compared to concentration profiles obtained by a diffusion model (Rubel et al., 2002).

4. Pore fluid composition in clays of marine origin
100
Figure 4.11 Concentration of the main cations against depth in Essen-1 borehole, Belgium
(De Craen et al., 2006).
The composition of the pore fluid, which can change due to natural but also to anthropic
processes, can affect the mechanical behaviour of the soil and, in some cases, also slope
stability and landslide behaviour.
Deng et al. (2014) studied the behaviour of the Lianyungang clay, a Quaternary soft
marine-origin clay, mainly illitic, outcropping in the Jiangsu province, China. They
analysed the pore fluid extracted from boreholes in two sites by means of spectrometers,
finding significant concentration differences (e.g. 14 g/l and 2.81 g/l of Na+). They
observed that the site characterised by higher salinity is located in an area which emerged
more recently than that of the site which has lower salinity. The Authors performed in situ
and laboratory tests, showing the influence of pore fluid salinity on index properties, shear
strength and compressibility of the investigated clay. A similar study was conducted by
Deng et al. (2011) for two sites in the Boom Clay formation.
An example of the noticeable difference between the shear strengths of the intact Quick
Clay and of the remoulded one was shown in Figure 4.4. In fact, remoulding of a Quick
Clay can result in a complete liquefaction of the soil, with dramatic effects. A well known
case is the 5-6 million m3 large landslide in Rissa, Norway (e.g. Gregersen, 1981). Among
the others, another example of noticeable variation of pore solution concentration with

4. Pore fluid composition in clays of marine origin
101
depth in such type of clay, and its effect on the remoulded strength, was provided by
Geertsema and Torrance (2005) for the case of a landslide at the Mink Creek site in British
Columbia, Canada.
Among the anthropic processes, the pore fluid concentration decrease due to irrigation was
found to be a possible cause of soil instability by Zhang et al. (2009, 2013). The Authors
reported evidences that the desalinization caused by irrigation influenced the initiation and
movements of a number of landslides in the Chinese Loess Plateau. Wen and He (2012),
while studying the weathered illitic-smectitic red mudstone outcropping in the Lanzhou
site, China, also attributed to irrigation the pore fluid Na+ concentration decrease (from 7.5
g/l of the groundwater to 0.2-0.3 g/l of the landslide site) and correlated such decrease to a
reduction in the residual shear strength which may have caused reactivation of several
landslides, as reported also by Derbyshire (2001) and Xu et al. (2011) for different sites.
In some cases, the seasonal variability of pore fluid composition can affect slope stability
significantly. Moore and Brundsen (1996) observed seasonal fluctuation in pore fluid
concentration due to the seasonal deposition of sea-spray and salt at a mudslide toe in the
Dorset coast, England, and observed low pore solution concentrations before seasonal
reactivation or periods of high activity of the landslide. Recently, Tiwari and Ajmera
(2015) observed a decrease in fully softened shear strength due to NaCl leaching in several
landslides of coastal areas in Japan.
Finally, it is worth noting that pore fluid composition gradients can influence pore pressure
distribution and thus the effective stress state and the shear resistance of a soil. For
example, Gueutin et al. (2007) observed from 200 kPa to 600 kPa pore pressure excess
(Figure 4.12) within a low-permeability illitic-smectitic clay formation known as the
Callovo-Oxfordian formation (France). Lower pore fluid salinities were evaluated at the
top and bottom contact with more permeable formations (5 g/l, < 1 g/l respectively) with
respect to those within the formation. A regional-scale study of the pore fluid composition
of such formation is reported in Gaugher et al. (2006), who reported the Cl- concentration
profiles of the pore fluid squeezed out from several samples extracted from different
boreholes to highlight its lateral variability (Figure 4.13). Gueutin et al. (2007), by means
of a numerical model, simulated the pore pressure excess as due to osmotic pressures
generated by the concentration gradient and a non-zero osmotic efficiency. Neuzil (2000)

4. Pore fluid composition in clays of marine origin
102
and Neuzil and Provost (2009) discussed the importance and the occurrence of such
osmotic pressure in natural clay formations.
Figure 4.12 Excess head against depth from the ground surface in the Callovo-Oxfordian
formation (Gueutin et al., 2007).
Figure 4.13 Chloride concentration against depth in the pore fluid of material extracted
from different boreholes in the Callovo-Oxfordian formation (Gaucher et al., 2007).

4. Pore fluid composition in clays of marine origin
103
4.2 PORE FLUID COMPOSITION
AT COSTA DELLA GAVETA
The “water” content and the natural pore fluid composition were evaluated on several soil
samples extracted from different boreholes drilled in the Costa della Gaveta slope. The
evaluation of pore fluid composition was also carried out on the subsoil of the Varco d’Izzo
landslide (Di Maio et al., 2012), located a few hundred metres East of the Costa della
Gaveta landslide. The locations of the landslides and of the boreholes are shown in Figure
2.17 in section 2.
The water content was determined both on undisturbed samples and on partially disturbed
samples which could be considered extracted in undrained conditions. Due to the presence
of rock fragments in boreholes Ki, the material extracted from the first 5-6 m cannot be
considered adapt to such analysis.
Figure 4.14 shows the water content profiles against the depth from the ground surface
relative to boreholes I9b, I9c, I12 and Ki. The inclinometer profiles evaluated at the same
locations of I9b, I9c and I12 suggest that the landslide body is there characterised by water
contents higher than those of the stable soil. In particular, the water content decreases with
depth: in the landslide material it is about 25%, whereas it is w ≈ 15-20% in the underlying
stable soil.
In boreholes Ki, as said, the water content data are not convincing in the first 5 metres.
From 5 to 8 m depth, a layer characterised by w ≈ 30% can be identified, while in the
deeper soil the water content ranges between 15% and 20%. Actually, first inclinometer
measurements in I12b, very close to Ki boreholes, show a slip surface at about 8 m depth,
where the transition to the deeper, more consistent soil was found.

4. Pore fluid composition in clays of marine origin
104
0 0.2 0.40 0.2 0.40 0.2 0.40 0.2 0.40 0.2 0.40
5
10
15
0 0.2 0.4
dept
h (m
)
0 3 6
0
5
10
15
20
25
30
0 0.2 0.4
dept
h (m
)
0 3 6
0 0.2 0.4
0 3 6
0 0.2 0.4
0 0.2 0.40 0.2 0.40 0.2 0.40 0.2 0.40
5
10
15
0 0.2 0.4
dept
h (m
)
I12 I9b I9c
water content
cumulative horizontal displacement (cm)
water content
water content
K1 K2 K3 K4 K5 K6
K1bis K2bis K3bis K4bis K5bis
water content evaluated soon after coring
water content of specimens submitted to electrical and chemical analysesdisplacement profile
slipsurface
slipsurf.
slipsurface
slipsurface
slipsurface
slipsurface
slipsurf.
slipsurface
slipsurface
slipsurface
slipsurf.
Figure 4.14 Water content against depth from the ground surface in several boreholes and
cumulative displacement profiles (or indication of the possible slip surface) at the same
locations at Costa della Gaveta.

4. Pore fluid composition in clays of marine origin
105
The composition of the pore fluid was evaluated by means of the following procedure (Di
Maio et al., 2015a): 30 g of oven-dried and powdered soil were mixed thoroughly with
distilled water to get 500 cm3 suspensions. After sedimentation of the solids, the
supernatant solution was analysed by means of different instruments:
- an inductively coupled plasma (ICP) spectrometer for the measurement of Na+, K+,
Ca2+, Mg2+ and several other cations (I9b, I9c and I12);
- ion-selective electrodes for the measurements of Na+, K+ and Ca2+ (Ki, S3, S8, S9
and S11).
Under the assumption that all the ions found in the supernatant solution were dispersed in
the natural pore fluid, the ion concentrations in this latter can be evaluated from the
concentrations measured in the supernatant solution, being the soil’s natural water content
known.
The concentrations estimated in the pore fluid, taking into account the water content
profiles shown in Figure 4.14, are plotted against the depth from the ground surface in
Figure 4.15 for I9b, I9c, I12, and Ki boreholes.
Besides Na+, other ions such as Ca2+, Mg2+ and K+ were clearly detected, while other
cations were found only in traces.
In borehole I9b (Figure 4.15), after the first 8 m characterised by very low values, the
sodium concentration increases with depth quite regularly. The materials above and below
the slip surface, identified in this location at about 13 m depth (Figure 4.14), do not seem
characterised by significantly different concentrations. On the contrary, a noticeable
increase of Na+ concentration within the shallow 5 m is seen in I9c, followed by a drop to
very low values at 7-8 m depth, close to the slip surface, and then to an increase again. The
sodium concentrations in I12 are very low in the first 13 m, that is in the landslide soil, and
much higher in the stable soil underneath.

4. Pore fluid composition in clays of marine origin
106
0
5
10
15
20
25
30
0 0.25 0.5
dept
h (m
)
0 0.25 0.5 0 0.25 0.5Ion concentration in the pore fluid (mol/l)
I9b I12I9c Na+
K+
Ca2+
Mg2+
0 0.25 0.5
K6
0 0.25 0.5
K5bis
0 0.25 0.5
K50
5
10
15
0 0.25 0.5
dept
h (m
)
K4
0 0.25 0.5
K3
0 0.25 0.5
K2
0 0.25 0.5
K1bis0
5
10
15
0 0.25 0.5
dept
h (m
)
K1
Measuring technique:- I9b, I9c, I12: ICP spectrometer- Ki: ion-selective electrodes
slipsurface
slipsurface
slipsurf.
slipsurface
slipsurface
slipsurface
slipsurface
slipsurface
slipsurface
slipsurface
slipsurface
Figure 4.15 Concentration of Na+, K
+, Ca
2+, Mg
2+ estimated in the pore fluid against
depth from the ground surface in boreholes I9b, I9c and I12 (Di Maio et al., 2015a) and in
boreholes Ki. The depth of the slip surface at corresponding locations is also indicated.

4. Pore fluid composition in clays of marine origin
107
The concentrations of K+, Ca2+ and Mg2+ remain generally negligible with respect to that
of sodium in I9b, I9c and I12. A trend of increasing concentration with depth of K+ and
Mg2+, however, can be seen at high depths, especially in I9b. On the contrary, the calcium
concentration is sometimes significant in the shallow 5 metres.
It is worth noting that the molar concentrations of the main cations in I9b at the maximum
investigated depth, about 28 m, are the following: c(Na+) = 0.44 mol/l, c(K+) = 0.007
mol/l, c(Ca2+) = 0.02 mol/l, c(Mg2+) = 0.017 mol/l. They are quite close, in values and
proportions, to the those of seawater: c(Na+) = 0.47 mol/l, c(K+) = 0.01 mol/l, c(Ca2+) =
0.01 mol/l, c(Mg2+) = 0.053 mol/l, considering a salinity of 35 g/l.
The concentrations of Na+, K+ and Ca2+ in the pore fluid of the soil extracted from
boreholes Ki (Figure 4.15) are very similar. The values of Na+ are very low in the first 8 m,
in the landslide body, and then increase with depth in the stable soil underneath (Figure
4.14). Potassium is practically absent. On the contrary, calcium concentrations are
sometimes significant in the shallow material and decrease noticeably to 8 m depth,
becoming practically negligible in the stable soil.
Chemical analyses were carried out also on soil samples extracted from boreholes S3, S8,
S9 and S11, whose locations are shown in Figure 2.17. The natural water content profile in
these boreholes was not determined. Therefore, the test results are shown in Figure 4.16 in
terms of the sodium concentration in the supernatant solution. The values thus refer to a
constant mass of solids in a certain amount of water, independently of the natural water
content. The concentration profile in the supernatant solution of samples from I9b is also
reported for comparison

4. Pore fluid composition in clays of marine origin
108
0 5 10 15 20 25 30 35 40
00.
005
0.01
depth (m)
S3
00.
005
0.01
S1
1
00.
005
0.01
S9
I9b
Na+
conc
entr
atio
n in
the
supe
rnat
ants
olut
ion
(mol
/l)
00.
005
0.01
S8
00.
005
0.01
K1
K1b
isK
2K
3K
4K
5K
5bis
K6K
i
slip
su
rfac
e
slip
su
rfac
e
slip
su
rfac
e
slip
su
rfac
e
Figure 4.16 Na+ concentration in the supernatant solution and of soil samples from
boreholes S8, S9, S11, Ki (Costa della Gaveta landslide) and S3 (Varco d’Izzo landslide).
The depth of the shear surface, as found by inclinometer measurements, is also indicated.

109
The figure shows that the concentrations in I9b and S9, located along the same cross
section of the landslide, are similar. The concentration increase with depth is quite regular
and at the transition from the landslide material to the stable soil (at 25 m depth in S9, at 13
m in I9b) the concentration does show sudden variations. In S8, in which the slip surface
was found at 37 m depth, the concentrations seem lower than in S9, while they are much
higher in S11, located outside the landslide body, and in S3 (Varco d’Izzo landslide), in
which the slip surface was found at about 11 m depth.
In Figure 4.16 Na+ concentration measured in the supernatant solution of the material
extracted from boreholes Ki is also shown. Being these results independent of the natural
water content, also the measurements carried out on the shallow material are reported. The
values of concentration in Ki boreholes seem consistent to each other and to those of
boreholes I9b, S9 and S8. However, they must be considered carefully, since the presence
of lapideous fragment could make the samples not representative of the in situ condition.
The concentrations of Na+, K+ and Ca2+ evaluated in the pore fluid of the soil extracted
from boreholes I12, I9b and I9c, and on specimens from boreholes Ki whose water content
was considered reliable, are plotted against the depth from the ground surface in Figure
4.17. The figure confirms that the concentration profiles in Ki boreholes are consistent to
one another and that, notwithstanding the different measurement technique, they appear
consistent to those relative to I12, I9b and I9c. The values estimated in boreholes S8 and
S9, assuming two values of water content, w = 15% and w = 20%, are plotted in the figure
as well. The shaded area highlights the possible field of variation of the sodium
concentration in these latter boreholes with the water content ranging between 15% and
20%. From the depth of 15 m on, the concentrations in S8 and S9 seem anyway lower than
those evaluated in the other boreholes.

4. Pore fluid composition in clays of marine origin
110
0
5
10
15
20
25
30
0 0.1 0.2 0.3 0.4 0.5
dept
h (m
)Na+ (mol/l)
0 0.05 0.1
Ca2+ (mol/l)
0 0.05 0.1
K+ (mol/l)
0 100Ca2+ (mmol/l)
K1 K1bis K2 K3 K4K5 K5bis K6 I12 I9bI9c S8 (w=15%) S8 (w=20%) S9 (w=15%) S9 (w=20%)
Figure 4.17 Concentration of Na+, K
+ and Ca
2+ in the pore fluid against depth from the
ground surface, evaluated on the material extracted from boreholes Ki, I12, I9b and
I9c.The values relative to S8 and S9 considering w=0.15 and w=0.2 are also reported. The
shadowed area indicates the range of concentration for S8 and S9 for 0.15<w<0.2.
The supernatant solution was also analysed by electrical conductivity measurements
carried out by means of a 4-electrode conductivity probe, equipped with a temperature
sensor to account for the dependence of the conductivity on temperature.
As an example, Figure 4.18 shows the values of electrical conductivity of the supernatant
fluid of the soil extracted in I9b as a function of depth. The values are compared to the
sodium concentration and to the ionic strength I, evaluated as:

4. Pore fluid composition in clays of marine origin
111
∑=i
ii zcI 2
2
1
where c is the concentration of the i-th ion and z is its valence.
The ionic strength was estimated considering the cation concentrations evaluated by the
spectrometer and assuming, to preserve electroneutrality, that the negative charge is
counterbalanced by monovalent anions, such as Cl-. As a matter of fact, the figure shows a
good agreement between the trends of ionic strength and of electrical conductivity. It also
shows a qualitative agreement between these latter and the concentration of Na+, the
largely prevailing cation. The measurement of the electrical conductivity of the supernatant
solution can thus be a tool for a quick estimation of the ion concentration trend.
0
5
10
15
20
25
30
0 250 500 750 1000
dept
h (m
)
electrical conductivity (µS/cm)
Electric conductivity
Na+
I9b - Ionic Force
Na+ concentration and ionic strength (mmol/l)
Electrical conductivity
Na+
Ionic strength
I9b
Figure 4.18 Sodium concentration, electrical conductivity (normalised at 25°C) and ionic
strength of the supernatant solutions of samples from borehole I9b (Di Maio et al., 2015a).

4. Pore fluid composition in clays of marine origin
112
Summing up, the pore fluid composition of the Costa della Gaveta soil varies in space
greatly, both from one borehole to another and in a single borehole with depth from the
ground surface. Sodium is the main dissolved cation and its concentration increases
noticeably with depth, reaching values similar to those of seawater also in terms of relative
proportions among the most abundant cations. In some boreholes, such as I12, located
upslope, close to the landslide’s source area, pore ion concentrations in the landslide
material are significantly lower than those in the stable underlying soil. Conversely, in
boreholes such as S9 and I9b, located in the landslide channel, the pore ion concentration
increase is gradual and the concentration profile does not show discontinuities at the
transition from the landslide material to the stable soil.
The evaluated differences in pore fluid composition can determine significant differences
in the mechanical behaviour of the material and, in particular, in the residual shear
strength, as shown in section 2. Furthermore, the current ion concentration profiles,
characterised by significant gradients, show a non-equilibrium condition, in which the ion
concentrations are still changing in time, reasonably decreasing, thus possibly leading to
further variations in the material properties and strength.
As a consequence of the observed spatial variations of ion concentration, the assumption of
a unique value of residual shear strength along the entire slip surface of the Costa della
Gaveta landslide, at any depth, can be misleading even under the hypothesis of
homogeneous subsoil. Additionally, the use of distilled water to reconstitute the material to
submit to laboratory mechanical tests, and/or the use of distilled water as cell fluid, can
lead to an underestimation of the residual friction angle with respect to that actually
available in situ.

4. Pore fluid composition in clays of marine origin
113
4.3 ELECTRICAL RESISTIVITY OF THE SYSTEM
SOLID SKELETON – PORE FLUID
The composition of the pore fluid was shown to vary noticeably in the Costa della Gaveta
slope and significant variations in the residual shear strength due to variations in pore fluid
composition have been evaluated. However, the pore fluid composition can be determined
directly only on soil samples of small size. The possibility of extending the results to a
large volume is of practical interest. To this aim, first studies have been carried out in order
to investigate possible correlations between the pore ion concentration and the electrical
resistivity of the soil determined on specimens and slurries in laboratory. The possibility of
extending the results to large volumes by means of the electrical resistivity tomography
(ERT) technique is currently under study.
In soils which do not contain significant amounts of clay minerals, the electric current
flows mostly through the fluid in the pores. Thus, higher values of resistivity are expected
for soils with low porosity, low degree of saturation and/or low ion concentration in the
pore fluid. A simplified formula for the resistivity is the following (Archie, 1942):
ρ = a·ρw·n-m
in which n is the porosity of the soil, a and m depend on the type of soil and ρw is the
electrical resistivity of the fluid in the pores.
By means of ERT carried out in situ and electrical laboratory tests on soil specimens,
Cosentini et al. (2013) showed that, for a pyroclastic soil, the relation can provide reliable
information on the degree of saturation of the material. In clay soils, however, the
electrical conduction along the surfaces of the electrically charged clay minerals is
significant, and the Archie’s law was proven not to be applicable (e.g. Frohlich and Parke,
1989). Alternative models to study the electrical conduction in clays have been described
by Santamarina et al. (2001).
Typical ranges of variation of the electrical resistivity for different materials are shown in
Figure 4.19. The resistivity of clays and shales is in the order of a few Ωm to 100 Ωm,

4. Pore fluid composition in clays of marine origin
114
while sand and gravels exhibit values which are 2 to 3 orders of magnitude higher. Values
in the range 2-100 Ωm are evaluated for fresh water, while salt water can exhibit values
lower than 1 Ωm. Depending on pore fluid composition, is therefore reasonable to expect
that the electrical resistivity of clay soils can increase or decrease with the fluid content.
Figure 4.19 Typical ranges of electrical resistivity of some soils, rocks and fluids (Palacky,
1987).
The electrical resistivity of a clay soil depends on the compositions of both the solid
skeleton and the pore fluid. The type of dependence has been investigated by tests carried
out by means of a 4-electrode conductivity probe on clay slurries. The results (Figure 4.20)
show that, if the used fluid is distilled water, the electrical resistivity increases with the
fluid content and the clay mineralogy influences the resistivity significantly. In fact, at the
same fluid content, kaolin slurries exhibit an electrical resistivity one order of magnitude
higher than that of bentonite slurries, while intermediate values are determined on slurries
of the Costa della Gaveta material (mainly illitic and kaolinitic). It is worth noting that the
electrical resistivity of the slurries is about 100 times lower than that of the used fluid,
notwithstanding the very high water content. This suggests that most of the electrical
conduction occurs through the system solid skeleton – adsorbed water. Conversely, if the
pore fluid is a concentrated salt solution, the electrical resistivity of the slurry is controlled
by that of the fluid, it does not depend on clay mineralogy significantly and exhibits only
small variations with the fluid content.

4. Pore fluid composition in clays of marine origin
115
0.1
1
10
100
1000
10000
0 200 400 600 800
ρ (Ω
m)
w (%)sol. 1M NaCl
kaolin - water
bentonite - water
distilled water
CdG - water
all the materials - 1 M NaCl solution
1 M NaCl solution
Figure 4.20 Electrical resistivity of clay slurries prepared with water or 1 M NaCl solution
against the fluid content, w (Di Maio et al., 2015c).
Some preliminary tests were carried out on specimens of the Costa della Gaveta soil
trimmed from the material cored in boreholes Ki. The specimens were not properly
undisturbed, as an effect of the presence of hard fragments. However, they reasonably
maintained their natural pore fluid.
The specimens were put into Plexiglas cylindrical tubes (3 cm diameter, 6 cm length)
which have two small openings for the insertion of two electrodes, at a mutual distance of
2 cm. The bases of the specimens were regularised and two metallic plates were applied on
them. The contact between the soil surface and the plates was improved by moistening
these latter with a tiny amount of a water-based gel prior to the application.
The specimens were tested by means of a ad hoc sample system, made as 4-electrode
measurements in order to avoid electrode impedance effects. The geometrical scheme is
shown in Figure 4.21. In this system, a georesistivimeter (Syscal Pro, Iris company) injects
a direct current through the metal plates at the bases and measures the potential drop by
means of the electrodes driven into the specimen.
The device provides the values of potential drop V, current intensity I and electrical
resistivity ρ calculated according to a semi-space geometry as in the field. In the laboratory
scheme, the resistivity is corrected by considering the actual specimen’s geometry,

4. Pore fluid composition in clays of marine origin
116
assuming one-dimensional conditions for the current flow, i.e. ρ = V/I·A2/l, where A is the
specimen’s section and l is its length.
ADC
V
Figure 4.21 Geometrical scheme for the measurement of the electrical resistivity of soil
specimens. The picture on the right shows the Syscal Pro device.
Figure 4.22 shows, against the depth from the ground surface, the electrical resistivity
measured on several specimens extracted from different boreholes. Some decrease of
electrical resistivity with depth can be seen. However, data scattering is high and the
observed variations, in the order of a few Ωm, are in the same magnitude of the
experimental error.
Figure 4.23 compares the results obtained on the “undisturbed” specimens to those
obtained by means of the same testing technique on specimens reconstituted with distilled
water or with 1 M NaCl solution. The results obtained on slurries of the same soil prepared
with water or NaCl solutions at various concentrations, and tested by means of the 4-
electrode conductivity probe, are also shown.
The figure highlights that the values obtained with different devices are consistent as a
whole, but they are not comparable directly, mostly because of the different electrical
fields. The results relative to the “undisturbed” specimens lie between those of the
specimens reconstituted with distilled water and with 1 M NaCl solution. However, as seen
also in figure Figure 4.22, the variations of resistivity are practically negligible, between 3
and 6 Ωm, and without a clear dependence on pore ion concentration or on depth. The
possible trends are probably masked by the high error magnitude.

4. Pore fluid composition in clays of marine origin
117
0
3
6
9
12
15
0 3 6 9
dept
h (m
)
electrical resistivity - ρ (Ωm)
K1
K1bis
K2
K3
K4
K5
K5bis
K6
Figure 4.22 Electrical resistivity of specimens of Costa della Gaveta soil against the depth
from the ground surface.
0.1
1
10
100
0 100 200 300 400w (%)
ρ (
Ωm
)
distilled water
1 M NaCl
0.1 M NaCl
0.3 M NaCl
reconst. with water water
reconst. 1 M NaCl sol.
undist.
slurriessoils
Figure 4.23 Electrical resistivity of Costa della Gaveta soil (I12 and K5bis boreholes):
slurries prepared with distilled water and with 1M NaCl solutions at various
concentrations, reconstituted specimens and partially undisturbed specimens (Di Maio et
al., 2015c).

4. Pore fluid composition in clays of marine origin
118
The electrical resistivity has been also evaluated in situ by means of electrical resistivity
tomography (ERT) with 1.5 m resolution. Two measurements were carried out: one along
a cross section through boreholes I12 and P12 (ERT1) and one very close to boreholes Ki
(ERT2).
The electrical resistivity distribution of the ERT2 (Figure 4.24) shows the presence of two
electrical layers: a shallow one, about 8 m thick, characterised by values of resistivity
higher than 40 Ωm, and a deeper one with values lower than 20 Ωm. Differently, the ERT1
shows generally lower and much more uniform values, in the range 10-20 Ωm.
SW NE
K1 K2 K3
K4 (15 m)
I12b (20 m)
K5 K6
Unit Electrode spacing 3 m
P12I12Canale
SW bore
hole
sK
i
I12
I12b
I12
bore
hole
sK
i
I12
I12b
I12
unit electrode spacing = 3 m
slip surface
slip surface
ERT2
ERT1
ERT2
ERT1
Figure 4.24 Electrical resistivity distribution obtained by ERT (Di Maio et al., 2015c).
Figure 4.25 compares the values of resistivity evaluated on “undisturbed” specimens to
those evaluated by the ERT in situ at the same location (ERT2, borehole K6). The field
values are higher than those obtained in laboratory. However, the values of ERT1 are
closer to those of laboratory specimens than those of ERT2.

4. Pore fluid composition in clays of marine origin
119
0
3
6
9
12
15
0 20 40 60
dep
th (m
)
electrical resistivity (Ωm)
Specimens
ERT2
K6
range of ERT1
Figure 4.25 Electrical resistivity evaluated on “undisturbed” specimens and in situ by
ERT2 at a corresponding location. The resistivity range found in ERT1 is also indicated.
The values of electrical resistivity evaluated in situ are generally higher than those of
laboratory specimens (Jones, 1995; Straface and Rizzo, 2013). The difference is generally
attributed to scale effects, including the much higher heterogeneity in composition and
structure of the material in situ.
In order to understand whether the ERT investigation can be used to evaluate variations in
pore fluid composition, an improvement of the test procedure, for instance by the use of
the cross hole method with a higher resolution, is currently under examination. The
possibility to perform measurements on larger specimens, in order to increase the
representativeness of the soil volume in laboratory tests, is also being considered.

120
5 CONCLUSION
In this work the results of several laboratory tests have been presented. The aim of the
work was twofold: 1. to study the influence of pore fluid composition on the residual shear
strength and on creep behaviour and 2. to analyse the natural pore fluid composition of a
clayey slope affected by landslides, trying to understand how the processes observed in
laboratory can influence the landslide behaviour.
The residual shear strength of the Costa della Gaveta soil is influenced by the composition
of the pore fluid significantly. The residual friction angle of specimens reconstituted with
distilled water falls in the range 8°-10°, while the material reconstituted with concentrated
NaCl solutions exhibits values which can reach 20°. Even higher values are found for the
material prepared with KCl solutions. The relation between pore solution concentration
and residual friction angle is not linear, with higher gradients in the range 0-1 mol/l, that is
in the range in which the evaluated values of natural pore fluid concentration fall.
Therefore, significant variations of the residual friction angle in situ due to different pore
fluid compositions are expected, even under the hypothesis of homogeneous soil. As a
corollary, both the assumption of a unique friction angle along the slip surface of the Costa
della Gaveta landslide (up to 40 m deep) and the evaluation of the residual friction angle in
laboratory on specimens reconstituted with distilled water can be misleading.
In order to evaluate the creep behaviour of the material along a slip surface in residual
condition, several shear tests under controlled shear stresses were carried out on pre-
sheared specimens of the Costa della Gaveta soil and of a sodium bentonite. The
specimens were prepared with a concentrated NaCl solution and sheared under constant
displacement rate in a bath of the same solution until the residual strength was achieved.
Subsequently, the apparatuses were modified so that the specimens could be subjected to

5. Conclusion
121
an average applied stress, along the slip surface, lower than the residual strength obtained
in the solution but higher than that obtained on the same material reconstituted with – and
submerged in – distilled water. The applied stress caused only negligible displacements
with a primary creep pattern. The subsequent exposure to distilled water, which was
frequently replaced in order to keep the concentration gradient between the cell fluid and
the pore fluid as high as possible, caused displacements with increasing rate with a tertiary
creep pattern, until the specimens re-experienced “failure”. This was attributed to the loss
of strength caused by the ion concentration decrease in the pore fluid due to ion diffusion.
In fact, the available strength evaluated soon after “failure” was found to be very close to
the driving shear stress.
On the basis of the experimental results, it is reasonable to hypothesise that the pore
solution concentration decrease in situ can be a “hidden” cause of the viscous movements
of the landslide.
The pore fluid composition of the soil at Costa della Gaveta was found to vary
significantly with depth from the ground surface. In particular, sodium was found to be the
most abundant cation, with concentrations ranging from negligible values at the surface to
values close to those representative of seawater at different depths, depending on the
location. Furthermore, the relative proportions of the main cations were found in
agreement with those in seawater as well, consistently with the marine origin of the
investigated clay formation.
In some boreholes located close to the head of the landslide, pore ion concentrations in the
landslide material are significantly lower than those in the stable underlying soil. This is
the zone in which the colluvial material of the source area accumulates. Conversely, in
boreholes located in the landslide channel, the pore ion concentration increase is gradual
and the concentration profiles do not show discontinuities at the transition from the
landslide material to the stable soil.
The quantitative evaluation of how the processes observed in laboratory – and in particular
the decrease in strength and the increase in shear displacements associated to the reduction
in pore solution concentration – influence the behaviour of the Costa della Gaveta
landslides is currently under examination and represents the aim of the future study.

122
REFERENCES
Andersson-Sköld, Y., Torrance, J. K., Lind, B., et al. (2005). Quick Clay – A case study of chemical perspective in Southwest Sweden. Engineering Geology, Vol. 82, pp. 107-118.
Andò, E., Hall, S. A., Viggiani, G., et al. (2012). Grain-scale experimental investigation of localised deformation in sand: a discrete particle tracking approach. Acta Geotechnica, Vol. 7, No. 1, pp. 1-13.
Anson, R. W. W., Hawkins, A. B. (1998). The effect of calcium ions in pore water on the residual shear strength of kaolinite and sodium montmorillonite. Géotechnique, Vol. 48, No. 6, pp. 787-800.
Archie, G. E. (1942). The electrical resistivity log as an aid to determining some reservoir characteristics. Transactions American Institute of Mining, Metallurgical and Petroleum Engineers, Vol. 146, pp. 54-62.
Augustesen, A, Liingaard, M., Lade, P. V. (2004). Evaluation of time-dependent behaviour of soils. International Journal of Geomechanics 4, No. 3, pp. 137-156.
Aylsworth, J. M., Hunter, J. A. (2004). A geophysical investigation of the geological controls on landsliding and soft sediment deformation in sensitive marine clay near Ottawa. Proceedings of the 57th Canadian
geotechnical conference, Session 1C, pp. 30-37.
Balasubramonian, B. I. (1972). Swelling of compaction shales. PhD thesis, University of Alberta, Edmonton.
Barbour, S. L., Fredlund, D. G. (1989). Mechanisms of osmotic flow and volume change in clay soils. Can.
Geotech. J., Vol. 26, pp. 551-562.
Bhat, D. R., Bhandary, N. P., Yatabe, R., Tiwari, R. C. (2011). Residual-state creep test in modified torsional ring shear machine: methods and implications. Int. J. Geomat., Vol. 1, No. 1, 39–43.
Bishop, A. W. (1966). The strength of soils as engineering materials. Géotechnique, Vol. 16, No. 2, pp. 89-130.
Bjerrum, L. (1954). Geotechnical properties of Norwegian marine clays. Géotechnique, Vol. 4, No. 2, pp. 49-69.
Bogaard, T., Guglielmi, Y., Marc, V., et al. (2007). Hydrogeochemistry in landslide research: a review. Bulletin de la Société Géologique de France, Vol. 178, No. 2, pp. 113-126.
Bolt, G. H. (1956). Physico-chemical analysis of the compressibility of pure clays. Géotechnique, Vol. 6, No. 2, pp. 86-93.
Burland, J. B. (1990). On the compressibility and shear strength of natural clays. Géotechnique, Vol. 40, No. 3, pp. 329-378.
Calcaterra S., Di Maio C., Gambino P., Vallario M., Vassallo R. (2012). Surface displacements of two landslides evaluated by GPS and inclinometer systems: a case study in Southern Apennines, Italy. Natural
Hazards. Vol. 61, pp. 257–266. DOI 10.1007/s11069-010-9633-3.
Calvello, M., Lasco, M., Vassallo, R., Di Maio, C. (2005a). Compressibility and residual shear strength of smectitic clays: influence of pore aqueous solutions and organic solvents. Italian Geotechnical Journal 39, No. 1, pp. 34-46.

References
123
Cervi, F., Ronchetti, F., Martinelli, G., et al. (2012). Origin and assessment of deep groundwater inflow in the Ca’ Lita landslide using hydrochemistry and in situ monitoring. Hydrology and Earth Science System
Sciences. Vol. 16, pp. 4205-4221.
Chambers, J., Gunn, D., Wilkinson, P., et al. (2014). 4D electrical resistivity tomography monitoring of soil moisture dynamics in an operational railway embankment. Near Surface Geophysics, Vol. 12, pp. 61-72.
Chapman, D. L. (1913). A contribution to the theory of electrocapillarity. Philos. Mag., Vol. 25, No. 6, pp. 475-481.
Chatterji, P. K., Morgenstern, N. R. (1989). A modified shear strength formulation for swelling clay soils. Proc. Symp. Physico-chemical aspects of soils, rocks and related materials. St. Louis.
Chattopadhyay, P. K. (1972). Residual shear strength of some pure clay minerals. PhD thesis, University of Alberta, Edmonton.
Chen, J., Anandarajah, A., Inyang, H. (2000). Pore Fluid Properties and Compressibility of Kaolinite. ASCE
J. Geotechnical and Geo-Environmental Engineering, Vol. 126, No. 9, pp. 798-807.
Christian, G. D. (1994). Analytical chemistry. 6th edn. Wiley, New York.
Comas, M. C., Zahn, R., Klaus, A., et al. (1996). Site 974. Proceedings of the Ocean Drilling Program,
Initial Reports, Vol. 161, pp. 55-111. College Station, TX (Ocean Drilling Program).
Cosentini, R. M., Foti, S., Sorbino, G. (2013). Combined use of geophysical tests for the characterization of a pyroclastic slope. In: Geotechnical and Geophysical Site Characterization, Vol. 4, Coutinho and Mayne (eds). Taylor & Francis Group, London, ISBN 978-0-415-62136-6.
Cruden, D. M., Varnes, D. J. (1996). Landslide types and processes. In: Turner, A. K., Schuster, R. L. (eds).
Landslides investigation and mitigation. Transportation research board, US National Research Council. Special Report 247, Washington, DC, Ch. 3, pp. 36–75.
De Craen, M., Wemaere, I., Labat, S., Van Geet, M. (2006). Geochemical analyses of Boom Clay pore water and underlying aquifers in the Essen-1 borehole. SCK-CEN external report (REPORT SCK-CEN-ER-19), Belgium.
Deng, Y. F., Cui, Y. J., Tang, A. M., et al. (2011). Investigating the pore-water chemistry effects on the volume change behaviour of Boom Clay. Physics and Chemistry of the Earth, Vol. 36, pp. 1905-1912.
Deng, Y. F., Yue, X. B., Cui, Y. J., et al. (2014). Effect of pore water chemistry on the hydro-mechanical behaviour of Lianyungang soft marine clay. Applied Clay Science, Vol. 95, pp. 167-175.
Derbyshire, E. (2001). Geological hazards in loess terrain, with particular reference to the loess regions of China. Earth-Science Reviews, Vol. 54, pp. 231-260.
Di Maio, C. (1996a). Exposure of bentonite to salt solution: osmotic and mechanical effects. Géotechnique, Vol. 46, No. 4, pp. 695–707.
Di Maio, C. (1996b). The influence of pore fluid composition on the residual shear strength of some natural clayey soils. VII International Symposium on Landslides, vol. II, pp. 1189-1194.
Di Maio, C. (1998). Exposure of bentonite to salt solution: osmotic and mechanical effects. Discussion. Géotechnique, Vol. 48, No. 3, pp. 433-436.
Di Maio, C. (2004a). Shear Strength of Clays and Clayey Soils: the Influence of Pore Fluid Composition. Chemo-mechanical couplings in porous media Geomechanics and Biomechanics. Springer-Verlag, pp. 45-55.
Di Maio, C. (2004b). Consolidation, Swelling and Swelling Pressure Induced by Exposure of Clay Soils to Fluids Different from the Pore Fluid. Chemo-mechanical couplings in porous media Geomechanics and
Biomechanics. Springer-Verlag, pp 19–43.
Di Maio, C., Fenelli, G. B. (1994). Residual strength of kaolin and bentonite: the influence of their constituent pore fluid. Géotechnique, Vol. 44, No. 2, pp. 217-226.

References
124
Di Maio, C., Fenelli, G. B. (1997). Influenza delle interazioni chimico-fisiche sulla deformabilità di alcuni terreni argillosi. Rivista Italiana di Geotecnica, Vol. 1/97, pp. 695-707.
Di Maio, C., Onorati, R. (2000). Influence of pore liquid composition on the shear strength of an active clay. Proceedings of the International Conference on Geotechnical and Geological Engineering, Melbourne, Australia.
Di Maio, C., Scaringi, G. (2015). Shear displacements of a clay in the residual condition induced by decrease in pore solution concentration. Engineering Geology, DOI: 10.1016/j.enggeo.2015.11.007.
Di Maio, C., Santoli, L., Schiavone, P. (2004). Volume change behaviour of clays: the influence of mineral composition, pore fluid composition and stress state. Mechanics of materials, Vol. 36, pp. 435-451.
Di Maio, C., Vassallo, R., Vallario, M., Pascale, S., Sdao, F. (2010). Structure and kinematics of a landslide in a complex clayey formation of the Italian Southern Apennines. Engineering Geology, Vol. 116, pp. 311-322.
Di Maio C., Vassallo R., Vallario M., Calcaterra S., Gambino P. (2011). Surface and deep displacements evaluated by GPS and inclinometers in a clayey slope. Proceedings of the 2
nd World Landslide Forum,
Rome, Italy, 2011, Vol. 2, pp. 265-271.
Di Maio, C., Vallario, M., Vassallo, R., Bianca, M. (2012). Displacements of a large landslide in structurally complex clays. In Eberhardt et al. (eds), Landslides and Engineered Slopes: Protecting Society through
Improved Understanding, pp. 607-613, Taylor & Francis Group, London.
Di Maio, C., Vassallo, R., Vallario, M. (2013). Plastic and viscous shear displacements of a deep and very slow landslide in stiff clay formation. Engineering Geology, Vol. 162, pp. 53-66.
Di Maio, C., Scaringi, G., Vassallo, R. (2015a). Residual strength and creep behaviour on the slip surface of specimens of a landslide in marine origin clay shales: influence of pore fluid composition. Landslides, Vol. 12, No. 4, pp. 657-667.
Di Maio, C., Scaringi, G., Vassallo, R. (2015b). Influence of pore fluid composition on the residual strength of a clayey landslide. In: G. Lollino et al. (eds.), Engineering Geology for Society and Territory, Vol.2, Ch. 383, DOI: 10.1007/978-3-319-09057-3_383.
Di Maio, C., Scaringi, G., Vassallo, R., Rizzo, E., Perrone, A. (2015c). Pore fluid composition in a clayey landslide of marine origin and its influence on shear strength along the slip surface. 12
th International
Symposium on Landslides, 12-19 June 2016, Naples, Italy (submitted).
Dominijanni, A., Manassero, M., Puma, S. (2013). Coupled chemical-hydraulic-mechanical behaviour of bentonites. Géotechnique 63, No. 3, pp. 191-205.
Eggestad, A., Sem, H. (1974). Haslelinjen: Markforsterkning ved saltdiffusjon i krysset Haslelinjen – Store Ringvei. Report No. R-894 part 7, Oslo municipality, Norway.
Eggestad, A., Sem, H. (1976). Stability of excavations improved by salt diffusion from deep wells. In
Proceedings of the 6th European conference on soil mechanics and foundation engineering, Vienna, March 1976. International Society for Soil Mechanics and Geotechnical Engineering, pp. 211-216.
Emeis, K.-C., Robertson, A. H. F, Righter, C., et al. (1996). Site 965. Proceedings of the Ocean Drilling
Program, Initial Reports, Vol. 160, pp. 55-84. College Station, TX (Ocean Drilling Program).
Eyring, H. (1936). Viscosity, plasticity and diffusion as examples of absolute reaction rates. J. Chem. Phys., Vol. 4, No. 4, pp. 283-291.
Farrar, D. M. & Coleman, J. D. (1967). The correlation of surface area with other properties of nineteen British clay soils. J. Soil Sci., Vol. 18, No. 1, pp. 118-124.
Feda, J. (1989). Interpretation of creep of soils by rate process theory. Géotechnique, Vol. 39, No. 4, pp. 667-677.
Feda, J. (1992). Creep of soils and related phenomena. Elsevier, Amsterdam.
Freeze, R. A., Cherry, J. A. (1979). Groundwater. Prentice Hall (604 pp.).

References
125
Frohlich, R. K., Parke, C. D. (1989). The electrical resistivity of the Vadose Zone – Field Survey. Ground
Water, Vol. 27, pp. 524–530.
Gajo, A., Loret, B. (2003). Finite element simulations of chemo-mechanical coupling in elastic–plastic homoionic expansive clays. Comput. Methods Appl. Mech. Engrg., Vol. 192, pp. 3489–3530.
Gajo, A., Loret, B. (2004). Transient analysis of ionic replacements in elastic–plastic expansive clays. International Journal of Solids and Structures, Vo. 41, pp. 7493-7531.
Gajo, A., Maines, M. (2007). Mechanical effects of aqueous solutions of inorganic acids and bases on a natural active clay. Géotechnique, Vol. 57, No. 8, pp. 687-699.
Gaucher, É. C, Blanc, P., Bardot, F., et al. (2006). Modelling the porewater chemistry of the Callovian–Oxfordian formation at a regional scale. C. R. Geoscience, Vol. 338, pp. 917-930.
Geertsema, M., Torrance, J. K. (2005). Quick clay from the Mink Creek landslide near Terrace, British Columbia: geotechnical properties, mineralogy, and geochemistry. Canadian Geotechnical Journal, Vol. 42, pp. 907–918.
Glasstone, S., Laidler, K. J. & Evring, H. (1941). The theory of rate processes. New York: McGraw-Hill.
Gouy, G. (1910). Charge électrique à la surface d'un electrolyte. J. Phys. (Paris), Vol. IV, No. 9, pp. 457-468.
Gratchev, I. B., Sassa, K. (2013). Cyclic shear strength of soil with different pore fluids. J. Geotech.
Geoenviron. Eng., Vol. 139, pp. 1817-1821.
Gratchev, I., Towhata, I. (2011). Compressibility of natural soils subjected to long-term acidic contamination. Environ. Earth Sci., Vol. 64, pp. 193-200.
Gratchev, I., Towhata, I. (2015). Compressibility of soils containing kaolinite in acidic environments. KSCE
Journal of Civil Engineering, DOI 10.1007/s12205-015-0141-6.
Gregersen O. (1981). The quick clay landslide in Rissa, Norway. Proc. 10th Int. Conf. on Soil Mechanics and
Foundation Engineering, Stockholm, Vol. 3, pp. 421-426.
Gueutin, P., Altmann, S., Gonçalvès, J., et al. (2007). Osmotic interpretation of overpressures from monovalent based triple layer model, in the Callovo-Oxfordian at the Bure site. Physics and Chemistry of the
Earth, Vol. 32, pp. 434-440.
Haynes, W. M. (2014). CRC Handbook of Chemistry and Physics, 95th edn. Boca Raton: CRC Press.
Helle, T. E., Gjengedal, I., Emdal, A., et al. (2014). Potassium Chloride as Ground Improvement in Quick Clay Areas – A Preliminary Study. In: L’Heureux, J.-S. et al. (eds.): Landslides in Sensitive Clays – from
Geosciences to Risk Management, Springer, Dordrecht, pp. 63-74.
Helle, T. E., Nordal, S., Aagaard, P., Lied, O. K. (2015). Long-term-effect of potassium chloride treatment on improving the soil behaviour of highly sensitive clay – Ulvensplitten, Norway. Canadian Geotechnical
Journal, doi: 10.1139/cgj-2015-0077.
Helle, T. E., Pfaffhuber, A. A., Rømoen, M. and Forsberg, C. F. (2009). SIP12 – Correlation between horizontal and vertical resistivity measurements. NGI Report 20081135-1.
Hungr, O., Leroueil, S., Picarelli, L. (2014). The Varnes classification of landslide types, an update. Landslides, Vol. 11, No. 2, pp. 167-194.
Iverson, R. M. (1985). A constitutive equation for mass-movement behaviour. Journal of Geology, Vol. 93, No. 2, pp. 143-160.
Jones J., Scale-dependent granite resistivity measurements of Oracle. (1995) Geophys. Res. Lett., Vol. 22, No. 11, pp. 1944-8007.
Kemper, W. D., Rollins, J. B. (1966). Osmotic efficiency coefficients across compacted clays. Proc. Soil
Science Society of America, Vol. 30, pp. 529-534.
Kenney, T. C. (1967). The influence of mineralogical composition on the residual strength of natural soils. Proc. Geotech. Conf Shear Properties of Natural Soils and Rocks, Oslo, Vol. 1, pp. 123-129.

References
126
Krahn, J. (2008). Transport Modeling with CTRAN/W: An Engineering Methodology, 3rd edn. Calgary: Geo-Slope International Ltd.
Kuhn, M. R. (1987). Micromechanical aspects of soil creep. PhD dissertation, Department of Civil Engineering, University of California, Berkeley.
Kuhn, M. R., Mitchell, J. K. (1993). New perspectives on soil creep. Journal of Geotechnical Engineering, ASCE, Vol. 119, No. 3, pp. 507-524.
Lambe, T. W. (1960). Discussion on factors controlling the strength of partly saturated cohesive soils. Conf.
shear strength soils, Colorado, pp. 1094-1095.
Le, T. M., Fatahi, B., Khabbaz, H. (2012). Viscous Behaviour of Soft Clay and Inducing Factors. Geotech.
Geol. Eng., Vol. 30, No. 5, pp. 1069-1083.
Lenoir, N., Bornert, M., Desrues, J, Bésuelle, P., Viggiani, G. (2007). Volumetric Digital Image Correlation Applied to X-ray Microtomography Images from Triaxial Compression Tests on Argillaceous Rock. Strain, Vol. 43, No. 3, pp. 193-205. DOI: 10.1111/j.1475-1305.2007.00348.x
Li, Y-H., Gregory, S. (1974). Diffusion of ions in sea water and in deep-sea sediments, Geochimica et
Cosmochimica Acta, Vol. 38, No. 5, pp. 703-714.
Long M., Donohue S., L’Heureux J.S., et al. (2012). Relationship between electrical resistivity and basic geotechnical parameters for marine clays. Canadian Geotechnical Journal, Vol. 49, No. 10, pp. 1158-1168.
Lupini, J. F., Skinner, A. E., Vaughan, P. R. (1981). The drained residual strength of cohesive soils. Géotechnique, Vol. 31, No. 2, pp. 181-213.
Malusis, M. A., Shackelford, C. D., Olsen, H. W. (2003). Flow and transport through clay membrane barriers. Eng. Geol., Vol. 70, pp. 235–248.
Mesri, G., Olson, R. E. (1971). Consolidation characteristics of montmorillonite. Géotechnique, Vol. 21, No. 4, pp. 341-352.
Mitchell, J. K. (1960). The application of colloidal theory to compressibility of clays. Proceedings of seminar
on interparticle forces in clay-water-electrolyte systems. 2.92-2.97. Melbourne: Commonwealth Scientific and Industrial Research Organisation.
Mitchell, J. K. (1964). Shearing resistance of soils as a rate process. J. Soil Mech. Fdn Engng Div., Am. Soc.
Civ. Engrs, Vol. 90, No. 1, pp. 29-61.
Mitchell, J. K. (1991). Conduction phenomena: from theory to geotechnical practice. Géotechnique, Vol. 41, No. 3, pp. 299-340.
Mitchell, J. K., Soga, K. (2005). Fundamentals of soil behavior. 3rd edn., Wiley, New York.
Mitchell, J. K., Campanella, R. G., Singh, A. (1968). Soil creep as a rate process. Journal of the Soil
Mechanics and Foundations Division, ASCE, Vol. 94, No. SM1, pp. 231-253.
Mitchell, J. K., Greenberg, J. A., Witherspoon, P. A. (1973). Chemico-osmotic effects in fine-grained soils. J.
Soil Mech. Fdn Div. Am. Soc. Civ. Engrs., Vol. 99, No. 4, pp. 307-322.
Moore, R. (1991). The chemical and mineralogical controls upon the residual strength of pure and natural clays. Géotechnique, Vol. 41, No. 1, pp. 35-47.
Moore, R., Brunsden, D. (1996). A physico-chemical mechanism of seasonal mudsliding. Géotechnique, Vol. 46, No. 2, pp. 259–278.
Moore, C. A., Mitchell, J. K. (1974). Electromagnetic forces and soil strength. Géotechnique, Vol. 24, No. 4, pp. 627-640.
Murayama, S., Shibata, T. (1958). On the rheological characteristics of clays, Part I, Bulletin No. 26, Disaster Prevention Research Institute, Kyoto, Japan.
Musso, G., Romero, E., Della Vecchia, G. (2013). Double-structure effects on the chemo-hydro-mechanical behaviour of a compacted active clay. Géotechnique, Vol. 63, No. 3, pp. 206-220.

References
127
Neuzil, C. E. (2000). Osmotic generation of ‘anomalous’ fluid pressures in geological environments. Nature, Vol. 403, pp. 182-184.
Neuzil, C. E., Provost, A. M. (2009). Recent experimental data may point to a greater role for osmotic pressures in the subsurface. Water Resources Research, Vol. 45, W03410, pp. 1-14.
Olson, R. E., Mesri, G. (1970). Mechanisms controlling the compressibility of clay. J. Soil Mech. Fdns Div.
Am. Soc. Civ. Engrs, Vol. 96, SM 6, pp. 1863-1878.
Palacky, G. J. (1987). Clay mapping using electromagnetic methods. First Break, Vol. 5, pp. 295–306.
Palomino, A. M., Santamarina, J. C. (2005). Fabric map for kaolinite: effects of pH and ionic concentration on behavior. Clays and Clay Minerals, Vol. 53, No. 3, pp. 209-222.
Pearson, F. J., Arcos, D., Bath, A., et al. (2003). Mont Terri Project – Geochemistry of Water in the Opalinus Clay Formation at the Mont Terri Rock Laboratory. Reports of the FOWG, Geology Series, Vol. 5.
Puzrin, A. M., Houlsby, G. T. (2003). Rate dependent hyperplasticity with internal functions, Journal of
Engineering Mechanics, ASCE, Vol. 129, No. 3, pp. 252-263.
Quigley, R. M., Gwyn, Q. H. J., White, O. L., et al. (1983). Leda Clay from deep boreholes at Hawkesbury, Ontario. Part I: Geology and geotechnique. Canadian Geotechnical Journal, Vol. 20, pp. 288-298.
Robinson, R. A., Stokes, R. H. (2002). Electrolyte solutions, 2nd edn. Mineola, NY: Dover.
Rosenqvist, I. Th. (1955). Investigations in the clay-electrolyte-water system. Norwegian Geotechnical
Institute Pub., Vol. 9, pp. 3-120.
Rubel, A. P., Sonntag, C., Lippmann, J., et al. (2002). Solute transport in formations of very low permeability: Profiles of stable isotope and dissolved noble gas contents of pore water in the Opalinus Clay, Mont Terri, Switzerland. Geochimica and Cosmochimica acta, Vol. 66, No. 8, pp. 1311-1321.
Santamarina, J. C., Fam, M. (1995). Changes in Dielectric Permittivity and Shear Wave Velocity During Concentration Diffusion, Canadian Geotechnical Journal 32, No.4, pp. 647-659.
Santamarina, J. C., Klein, K. A., Fam, M. A. (2001). Soils and Waves - Particulate Materials Behavior, Wiley, New York.
Scaringi, G., Di Maio, C., Vassallo, R. (2015). Influence of displacement rate on residual shear strength of clays. The 4th Italian Workshop on Landslides, 23-25 November 2015, Naples, Italy (in preparation).
Shackelford, C. D. (2014). The role of diffusion in environmental geotechnics (Rowe Lecture). Proceedings
of the 18th International Conference on Soil Mechanics and Geotechnical Engineering, Paris 2013, pp. 127-150.
Siddiqua, S., Siemens, G., Blatz, J., et al. (2014). Influence of pore fluid chemistry on the mechanical properties of clay materials. Geotech. Geol. Eng., Vol. 32, pp. 1029-1042.
Singh, A., Mitchell, J. K. (1968). General stress-strain-time function for soils. J. Soil Mech. Found. Div. Am.
Soc. Civil Engrs, Vol. 94, No. SMI, pp. 21-46.
Skempton, A. W. (1985). Residual strength of clays in landslides, folded strata and the laboratory. Géotechnique, Vol. 35, No. 1, pp. 3-18.
Sridharan, A. (1968). Some studies on the strength of partly saturated clays. PhD thesis, Purdue University, Indiana.
Sridharan, A. (1991). Engineering behaviour of fine grained soils. Indian Geotech. J., Vol. 21, No. 1, pp. 1-136.
Sridharan, A. (2001). Engineering behaviour of clays: influence of mineralogy. In: Chemo-mechanical
coupling in clays: from nano-scale to engineering applications, Swets & Zeitlinger, Maratea, Italy.
Sridharan, A., Jayadeva, M. S. (1982). Double layer theory and compressibility of clays. Géotechnique, Vol. 32, No. 2, pp. 133-144.

References
128
Sridharan, A., Ventakappa Rao, G. (1973). Mechanisms controlling volume change of saturated clays and the role of the effective stress concept. Géotechnique, Vol. 23, No. 3, pp. 359-382.
Sridharan, A., Ventakappa Rao, G. (1979). Shear strength behaviour of saturated clays and the role of the effective stress concept. Géotechnique, Vol. 29, No. 2, pp. 177-193.
Straface S. and Rizzo E. (2013). The Importance of Reduced-Scale Experiments for the Characterization of Porous Me-dia", Handbook in Environmental Chemistry. Threats to the Quality of Groundwater Resources:
Prevention and Control. A. Scozzari and E. Dotsika eds. DOI 10.1007/ 698_2013_231, Springer-Verlag Berlin Heidelberg.
Suarez, D. L., Rhoades, J. D., Lavado, R., Grieve, C. M. (1984). Effect of pH on saturated hydraulic conductivity and soil dispersion. Soil Sci. Soc. Am. J., Vol. 48, pp. 50-55.
Suer, P., Lofroth, H. Andersson-Skold, Y. (2014). Ion Exchange as a Cause of Natural Restabilisation of Quick Clay – A model study. In: L’Heureux, J.-S. et al. (eds.): Landslides in Sensitive Clays – from
Geosciences to Risk Management, Springer, Dordrecht, pp. 51-62.
Suhaydu, J. N., Prior, D. B. (1978). Explanation of submarine landslide morphology by stability analysis and rheological models. Proc. Offshore Technology Conference, Houston, Vol. 1, pp. 1075-1079.
Summa, V. (2006). Final report of the project “Monitoraggio della Frana di Costa della Gaveta del Comune di Potenza” (Monitoring of Costa della Gaveta Landslide in Potenza), in Italian, CNR-IMAA (National Research Council of Italy), Tito (PZ), Italy.
Tavenas, F., Leroueil, S., La Rochelle, P., Roy, M. (1978). Creep behaviour of an undisturbed lightly overconsolidated clay. Canadian Geotechnical Journal, Vol. 15, No. 3, pp. 402-423.
Ter-Stepanian, G. (1963). On the long-term stability of slopes. Norwegian Geotechnical Institute Pub., Vol. 52, pp. 1-13.
Ter-Stepanian, G. (1975). Creep of a clay during shear and its rheologicval model. Géotechnique, Vol. 25, No. 2, pp. 299-320.
Ter-Stepanian, G. (1992). Mechanics of soil creep during shear. In: Geomechanics and Water Engineering in
Environmental Management, Chowdhury (ed.), Rotterdam: Balkema, 529-557.
Tika, T. E., Vaughan, P. R., Lemos, L. J. L. (1996) Fast shearing of pre-existing shear zones in soil. Géotechnique, Vol. 46, No. 2, pp. 197-233.
Tiwari, B., Ajmera, B. (2015). Reduction in Fully Softened Shear Strength of Natural Clays with NaCl Leaching and Its Effect on Slope Stability. Journal of Geotechnical and Geoenvironmental Engineering, Vol. 141, No. 1, 04014086.
Tiwari, B., Tuladhar, G., Marui, H. (2005). Variation in residual shear strength of the soil with the salinity of pore fluid. J. Geotech. Geoenviron. Eng., Vol. 131, No. 12, pp. 1445–1456.
Torrance, J. K. (2014). Chemistry, Sensitivity and Quick-Clay Landslide Amelioration. In: L’Heureux, J.-S.
et al. (eds.): Landslides in Sensitive Clays – from Geosciences to Risk Management, Springer, Dordrecht, pp. 15-24.
Torres, M. E., Collett, T. S., Rose, K. K., et al. (2011). Pore fluid geochemistry from the Mount Elbert Gas Hydrate Stratigraphic Test Well, Alaska North Slope. Marine and Petroleum Geology, Vol. 28, pp. 332-342.
Turrero, M. J., Fernandez, A. M., Pena, J., et al. (2006). Pore water chemistry of a Paleogene continental mudrock in Spain and a Jurassic marine mudrock in Switzerland: Sampling methods and geochemical interpretation. Journal of Iberian Geology, Vol. 32, No. 2, pp. 233-258.
Uhlemann, S. S., Chambers, J. E., Hagedorn, S., et al. (2015). Structurally constrained 4D ERT monitoring to image hydrological processes leading to landslide reactivation. In: Near Surface Geoscience 2015 - 21st
European Meeting of Environmental and Engineering Geophysics.
Van Paassen, L.A., Gareau, L.F. (2004). Effect of pore fluid salinity on compressibility and shear strength development of clayey soils. Engineering Geology for Infrastructure Planning in Europe, Vol. 104, pp. 327-340.

References
129
Vassallo, R., Di Maio, C., Comegna, L., Picarelli, L. (2012). Some considerations on the mechanics of a large earthslide in stiff clays. In Eberhardt et al. (eds), Landslides and Engineered Slopes: Protecting Society
through Improved Understanding, pp. 963-968, Taylor & Francis Group, London.
Vassallo, R., Grimaldi, G. M., Di Maio, C. (2015a). Pore water pressures induced by historical rain series in a clayey landslide: 3D modeling. Landslides, Vol. 12, pp. 731-744.
Vassallo, R., Mishra, M., Di Maio, C., Santarsiero, G., Masi, A., Scaringi, G. (2015). Interaction of a railway tunnel with a deep slow landslide in clay shales. The Fourth Italian Workshop on Landslides, 23-25 November 2015, Naples, Italy (in preparation).
Ventakappa Rao, G. (1972). Physico-chemical mechanisms controlling volume change and shear behaviour of clays. PhD thesis, Indian Institute of Science, Bangalore.
Viggiani, G., Andò, E., Takano, D., Santamarina, J. C. (2015). Laboratory X-ray tomography: a valuable experimental tool for revealing processes in soils. Geotechnical Testing Journal, Vol. 38, No. 1, pp. 61-71.
Wahid, A. S., Gajo, A., Di Maggio, R. (2011a). Chemo-mechanical effects in kaolinite. Part I: prepared samples. Géotechnique, Vol. 61, No. 6, pp. 439-447.
Wahid, A. S., Gajo, A., Di Maggio, R. (2011b). Chemo-mechanical effects in kaolinite. Part II: exposed samples and chemical and phase analyses. Géotechnique, Vol. 61, No. 6, pp. 449-457.
Walraevens, K., Cardenal-Escarcena, J., Van Camp, M. (2007). Reaction transport modelling of a freshening aquifer (Tertiary Ledo-Paniselian Aquifer, Flanders-Belgium). Applied Geochemistry, Vol. 22, pp. 289-305.
Wen, B.-P., He, L. (2012). Influence of lixiviation by irrigation water on residual shear strength of weathered red mudstone in Northwest China: Implication for its role in landslides' reactivation. Engineering Geology, Vol. 151, pp. 56-63.
Xu, L., Dai, F.C., Tham, L.G., et al. (2011). Field testing of irrigation effects on the stability of a cliff edge in loess, North-west China. Engineering Geology, Vol. 120, pp. 10-17.
Xu, Y., Xiang, G., Jiang, H., et al. (2014). Role of osmotic suction in volume change of clays in salt solution. Applied Clay Science, Vol. 101, pp. 354-361.
Yen, B. C. (1969). Stability of slopes undergoing creep deformation. J. Soil Mech. Found. Eng., ASCE 95, No. 4, 1075-1096.
Zhang, D., Wang, G., Luo, et al. (2009). A rapid loess flow slide triggered by irrigation in China. Landslides, Vol. 6, pp. 55-60.
Zhang, F., Wang, G., Kamai, T., et al. (2013). Undrained shear behavior of loess saturated with different concentrations of sodium chloride solution. Engineering Geology, Vol. 155, pp. 69-79.
Zhao, Y., Cui, P., Hu, L., Hueckel, T. (2011). Multi-scale chemo-mechanical analysis of the slip surface of landslides in the Three Gorges, China. Science China Technological Sciences, Vol. 54, No. 7, pp. 1757-1765.