singleplatform / darden monthly report
TRANSCRIPT

Monthly Report – November 2014

Company | Monthly Report | Date | 2
Report Overview
MONTHLY and/or QUARTERLY UPDATE
1. Olive Garden Across Our
Network……………………………………………………………………………………………………………………
………
3
2. Engagement Per
Publisher……………………………………………………………………………………………………………………
…………………..
4
3. Time Spent Viewing
Menus………………………………………………………………………………………………………………………
………………
5
4. Geographic Breakdown………………………………………………………..……………………………….
……………………………………….…………
6
5. In Depth Look at Most Popular
Regions……………………………………………………………………………………………………….…………
7
6. Most Popular Time of Day………………………………………………………………………………..
………………………………………………………
8
7. Most Popular Time of Week………………………………………………………………………………..
…………………………………………………..
9
8. New vs. Returning Visitors………………………………………………………………………………..
………………………………………………………
10
9. Engagement by
Devise………………………………………………………………………………………………………………………
…………….……..
11
10.Engagement by OS and
Browser……………………………………………………………………………………………………………………
……..
12
11.Increase in
Engagement………………………………………………………………………………………………………………
…..……………………..
13
12.Report
Summary…………………………………………………………………………………………………………………
…………….……………………..
14
All data in slides 7-22 covers first 3 months of service

Company | Monthly Report | Date | 3
1.0 | Olive Garden Across our Network
SinglePlatform partners with the top online listing sites, search engines, mobile applications, and review sites. The most important sites are always changing, and SinglePlatform makes sure that all Darden locations have updated and accurate content across all of them. Click on the below links to check out your listings provided by SinglePlatform :
BUSINESSLISTINGS
Yelp
Foursquare
Urbanspoon
TripAdvisor
Superpages
Yellowpages
Mapquest
Tupalo
Hubbiz
Citysearch
Trayt
UScity.net
Mojopages
JustDial
Topix
Yasabe
Gayot
Yellowbook
Creative Loafing
Service Area
Greenbaynightlife
SEARCHENGINES
Yahoo!
MOBILEAPPS
Yelp – Mobile App
Foursquare – Mobile App
Urbanspoon – Mobile App
TripAdvisor – Mobile App
Whitepages – Mobile App
AroundMe – Mobile App
RESTAURANTSPECIFIC
Menupix
AllergyEats
Foodspotting
AllMenus
Menuism
Foodio54
OrganicRestaurants

Company | Monthly Report | Date | 4
2.0 | Engagement Per Publisher
Below you’ll see where potential customers are engaging with your listings the most. As you can see, the top tier publishers capture most of the traffic, but there are many other publishers where people are finding your information as well.
35.31%
Urbanspoon
11.25%
Gayot
9.37%
Menuism
7.94%
Yahoo!
7.09%TripAdvisor
6.20%Foursquare
4.05%
Other18.80%
NEXT TOP PUBLISHERS• Yellowpages• Yelp• Superpages

Company | Monthly Report | Date | 5
3.0 | Time Spent Viewing OG Menus
May June July0
1,000
2,000
3,000
4,000
5,000
6,000
TOTAL TIMEIN HOURS
13,748
hours!

Company | Monthly Report | Date | 6
4.0 | Geographic Breakdown
TOTAL TIMESPENT ACROSS NETWORK
Texas 11.66%Florida 9.11%New York 7.35%California 6.95%Georgia 4.81%

Company | Monthly Report | Date | 7
5.0 | In Depth Look at Olive Garden’s Most Popular Regions
TEXAS
CITY TOTAL TIMEHouston 25.04%
San Antonio 12.97%
Plano 9.08%
Fort Worth 4.99%
Austin 3.51%
FLORIDA CALIFORNIA
CITY TOTAL TIMESky Lake 11.89%
Hialeah 9.40%
Wauchula 7.16%
Pine Hills 3.50%
Melbourne 3.30%
CITY TOTAL TIMELos Angeles 1 3.06%
San Diego 8.40%
Ventura 7.20%
Oceanside 4.75%
San Francisco 5.25%
Company | Monthly Report | Date | 8
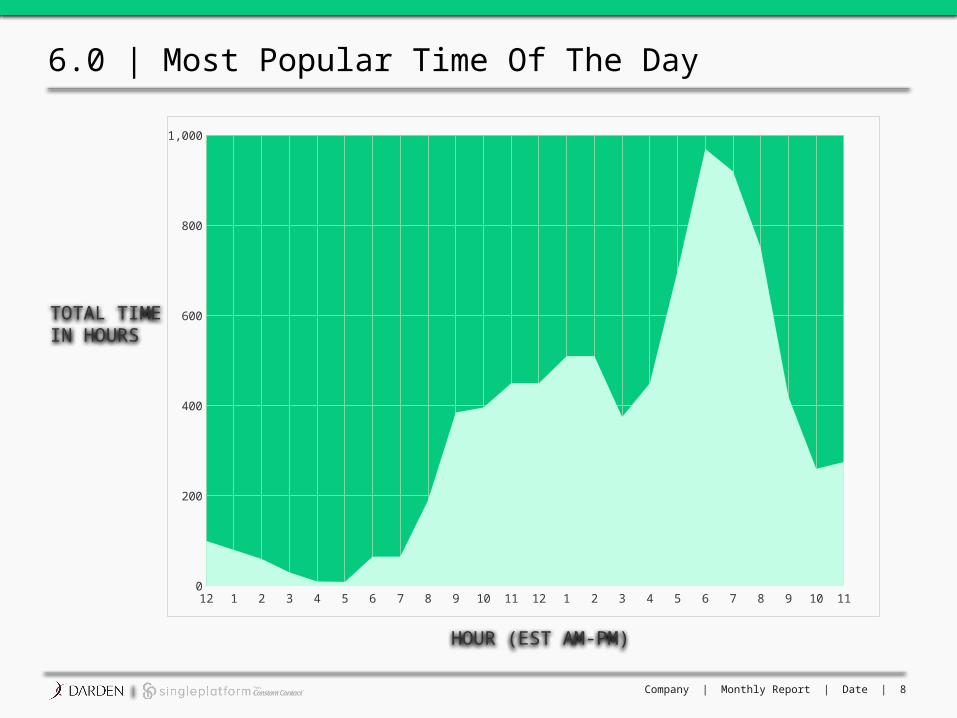
6.0 | Most Popular Time Of The Day
12 1 2 3 4 5 6 7 8 9 10 11 12 1 2 3 4 5 6 7 8 9 10 110
200
400
600
800
1,000
TOTAL TIMEIN HOURS
HOUR (EST AM-PM)

Company | Monthly Report | Date | 9
7.0 | Most Popular Day Of The Week
Sunday Monday Tuesday Wednesday Thursday Friday Saturday0
500
1,000
1,500
2,000
2,500
TIME SPENTIN HOURS

Company | Monthly Report | Date | 10
8.0 | New vs. Returning Visitors
May June July0
1,000
2,000
3,000
4,000
5,000
6,000
77.98%74.16% 77.03%
22.02%
25.84%22.97%TOTAL TIME
ACROSS NETWORK
New
Returning

Company | Monthly Report | Date | 11
9.0 | Engagement by Device
Mobile55.90%
Desktop30.71%
Tablet
13.39%
BY DEVICE
An-droi
d55.28%
IOS43.72%
Windows1.01%
BY MOBILE DEVICE
Company | Monthly Report | Date | 12
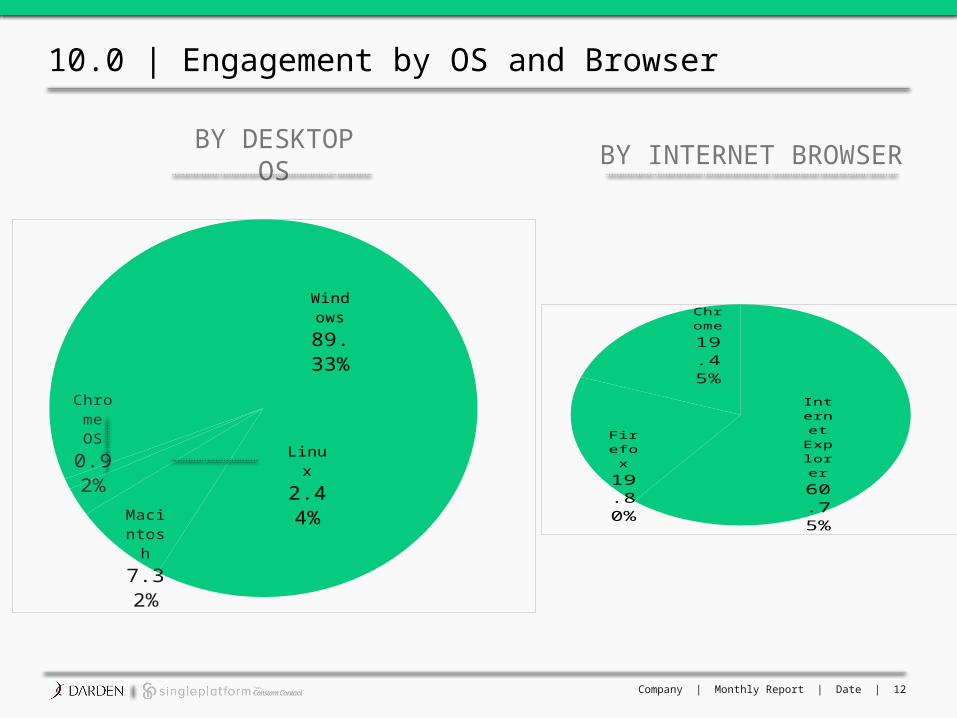
10.0 | Engagement by OS and Browser
Window
s89.33%
Linux
2.44%
Macintos
h7.32%
Chrome OS0.92%
BY DESKTOP OS
BY INTERNET BROWSER
In-ternet Ex-plorer60.75%
Firefox19.80%
Chrome
19.45%

Company | Monthly Report | Date | 13
11.0 | 301% Increase in Engagement
When determining if we have successfully provided ROI to a restaurant group, we look at how we have increased engagement on your listings. You’ll see by creating enhanced content, SinglePlatform has been able to increase the amount of views and time spent on your listings by an incredible amount.
0
200
400
600
800
1,000
1,200
1,400
1,600
1,800
HOURS
September 2013 June 2014
MONTHS

Company | Monthly Report | Date | 14
12.0 | Olive Garden Summary
01. Accurate Information: Darden listings are now 96.6% accurate across our top publishers
02. Enhanced Listings: All Olive Garden listings now have accurate, enhanced data, controlled by Olive Garden through SinglePlatform
03. 13,748 Hours spent viewing Olive Garden’s menus on our network over the past three months
04. Searchers are finding Olive Garden on a wide variety of publishers including Business Listings, Search Engines, Mobile Applications, and Restaurant Specific websites
05. Most Important Publishers: Google and Urbanspoon
06. Most Popular Geographic Regions: Texas, Florida, California, New York and Georgia
07. Over 55.1% of Traffic from Mobile Phones
08. 76.4% of Visitors are New to Olive Garden’s Listings